UNITED STATES
SECURITIES AND EXCHANGE COMMISSION
Washington, DC 20549
FORM 6-K
REPORT OF FOREIGN PRIVATE ISSUER
PURSUANT TO RULE 13a-16 OR 15d-16 OF
THE SECURITIES EXCHANGE ACT OF 1934
For the month of August, 2012.
Commission File Number 1-14728
LATAM Airlines Group S.A.
(Translation of registrant’s name into English)
Presidente Riesco 5711, 20th floor
Las Condes
Santiago, Chile
(Address of principal executive offices)
Indicate by check mark whether the registrant files or will file annual reports under cover of Form 20-F or Form 40-F.
Form 20-F x Form 40-F ¨
Indicate by check mark if the registrant is submitting the Form 6-K in paper as permitted by Regulation S-T Rule 101(b)(1): ¨
Indicate by check mark if the registrant is submitting the Form 6-K in paper as permitted by Regulation S-T Rule 101(b)(7): ¨
![]()
LATAM AIRLINES GROUP REPORTS FIRST CONSOLIDATED FINANCIAL STATEMENTS AS OF JUNE 30, 2012
Santiago, Chile, August 10, 2012 – LATAM Airlines Group S.A. (NYSE: LFL; IPSA: LAN; BOVESPA: LATM11), the leading airline in Latin America, announced today its consolidated financial results for the second quarter and for the six months ended June 30, 2012. “LATAM” or “the Company” makes reference to the consolidated entity, which includes passenger and cargo airlines in Latin America. All figures were prepared in accordance with International Financial Reporting Standards (IFRS) and are expressed in U.S Dollars, except for TAM S.A. (“TAM”) second quarter 2012 Income Statement figures, which are expressed in Brazilian reais.
HIGHLIGHTS
| • | LATAM Airlines Group S.A. today reported its first consolidated financial results for the second quarter and first half of 2012, following the successful completion of the exchange offer and mergers that combined the businesses of LAN Airlines S.A. and TAM S.A. (“TAM”). Because the transaction was completed on June 22, 2012, results for the period ended June 30, 2012 include the last eight days of TAM results, from June 23 to June 30, 2012. |
| • | Net income of LATAM Airlines Group reached US$49.7 million in the second quarter 2012. Operating income reached US$23.2 million, resulting in a 1.5% operating margin for the second quarter 2012. Consolidated LATAM results include net income of US$46.3 million and an operating loss of US$13.9 million corresponding to the eight days of consolidation of TAM between June 23 and June 30, 2012. Non-operating results for this eight day period reflect a foreign exchange gain of US$57,4 million and a positive mark-to-market of fuel hedging derivatives in the amount of US$ 26,7 million, as a result of the appreciation of the Brazilian real and an increase in the price of fuel, respectively, during the last eight days of the quarter. |
| • | The second quarter 2012 presented a challenging environment due to reduced cargo demand and the depreciation of local currencies, especially the Brazilian real. However, passenger demand in most of Latin America remains solid and the successful completion of the business combination between LAN and TAM provides the Company with a more diversified revenue base and significant growth and synergy opportunities. Furthermore, the domestic Brazil market has shown sustained capacity discipline, providing the basis for improved profitability. |
| • | LATAM Airlines Group is advancing in the process of achieving the expected synergies from the business combination with TAM. Regarding its international passenger operations, the Company has established fare combinability between LAN and TAM, cross selling of LAN and TAM flights, and code shares on various international routes, such as Santiago – Orlando, Santiago – Madrid, and Santiago – London. Cross selling will assist the Company in capturing connectivity synergies by offering our customers a single network in a one-stop shop. |
LATAM Airlines Group S.A. 2Q12
![]()
| • | In July 2012, the cargo divisions of LAN and TAM were integrated, taking advantage of the highly complementary nature of their operations. |
| • | On September 4, 2012, LATAM Airlines Group will hold an Extraordinary Shareholders’ Meeting in order to reelect the Board of Directors of the Company, as well as to approve the placement, through a preemptive rights offering to LATAM shareholders, of the remaining 7,436,816 shares of the Company that were authorized for the TAM exchange offer, and that were not exchanged. |
| • | During the remainder of 2012, LATAM expects to receive 12 Airbus A320 family aircraft to operate domestic and regional routes, as well as 8 Boeing 767-300, 4 Boeing 777-300 and the first 3 Boeing 787-8 Dreamliners for long-haul routes. The Company will also take delivery of 2 Boeing 777 freighter aircraft. |
| • | LAN Airlines S.A. (renamed LATAM Airlines Group S.A.) – excluding the consolidation of TAM – reported net income of US$5.2 million for the second quarter of 2012, a decrease of 67.5% compared to the US$15.9 million reported in second quarter 2011. Operating income reached US$37.1 million, a 33.5% decrease compared to the US$55.8 million in second quarter 2011. Operating margin reached 2.6%, a decrease of 1.6 points compared to 4.2% in 2011. The Company continued to show strong passenger revenue growth, despite a seasonally low quarter, partially offsetting the impact of a more challenging environment in the cargo business, as well as the ongoing development of LAN Colombia’s operations. In addition, operating results include a one-time cost of US$7.1 million related to the successful completion of the collective bargaining process with certain unions, as well as US$9.2 million in transaction costs related to the business combination with TAM. |
| • | TAM reported a net loss of R$928.1 million, compared to net income of R$60.3 million reported in second quarter 2011. For the second quarter 2012, TAM reported an operating loss of R$284.2 million, compared to the R$8.8 million gain in second quarter 2011. Operating results were mainly impacted by a 23.0% depreciation of the Brazilian real and decreased revenues from Multiplus, resulting from accounting changes in the recognition of such revenues implemented in the first quarter 2012. Non-operating results reflect a foreign exchange loss of R$845.9 million, and the negative mark-to-market of fuel hedging derivatives in the amount of R$93.6 million, resulting from the depreciation of the Brazilian real and the decrease in fuel prices, respectively, as compared to March 31, 2012. |
RECENT EVENTS
Business Combination of LAN Airlines S.A. and TAM S.A.
On June 22, 2012, LAN Airlines S.A. and TAM successfully completed the exchange offer and mergers through which they combined their businesses and created the LATAM Airlines Group, the leading Latin American airline group with the largest fleet of
LATAM Airlines Group S.A. 2Q12
![]()
aircraft in the region. As a result, LAN Airlines S.A. has been renamed LATAM Airlines Group S.A. LATAM Airlines Group will offer passengers more flights to more destinations than any other affiliated group of airlines in South America, initially reaching about 150 destinations in 22 countries and transporting cargo to 169 destinations in 27 countries. The transaction was carried out through an exchange offer in which TAM’s shareholders could elect to exchange their TAM shares or ADRs (American Depositary Receipts) for LAN shares or ADRs at a ratio of 0.9 LAN shares/ADRs for each TAM share/ADR. The offered LAN shares were delivered in the form of BDRs (Brazilian Depositary Receipts) in Brazil. The exchange offer, which culminated in the auction that took place on BM&FBOVESPA on June 22, 2012, was subject to the minimum tender and delisting conditions that were satisfied when 99.9% of the TAM shares/ADRs held by participants in the exchange offer agreed with TAM’s deregistration as a public company in Brazil and the tendered shares/ADRs, together with the TAM shares committed by the TAM Controlling Shareholders, represented 95.9% of the total outstanding shares of TAM.
On July 18, 2012, CVM cancelled the registration of TAM as a publicly listed company and TAM was delisted from BM&FBOVESPA. Subsequently, the remaining shares of TAM that did not participate in the exchange offer were redeemed by TAM.
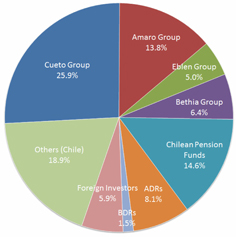
As of July 31, 2012, LATAM Airlines Group has 476,118,975 shares outstanding, with the following ownership structure:
Election of the Board of Directors of LATAM Airlines Group
On June 28, 2012, Jose Cox Donoso and Dario Calderon Gonzalez resigned their positions as board members of LATAM Airlines Group, and were replaced by Mr. Mauricio Rolim Amaro (previously Vice Chairman of the Board of Directors of TAM) and Ms. Maria Cláudia Amaro (Chairman of the Board of Directors of TAM). Furthermore, on August 3, 2012, Mr. Jorge Awad Mehech resigned as Chairman of the Board of LATAM Airlines Group and the Board elected Mr. Mauricio Rolim Amaro as Chairman. The entire Board of Directors of LATAM Airlines Group is subject to reelection at an Extraordinary Shareholders’ Meeting to be held on September 4, 2012.
LATAM Airlines Group S.A. 2Q12
![]()
Rights Offering
The Board of LATAM Airlines Group approved the placement, through a preemptive rights offering to LATAM shareholders, of the remaining 7,436,816 shares of the Company that were authorized for the TAM exchange offer, and that were not exchanged as a result of the number of TAM shares that participated in the offer. Any shares not subscribed in the rights offering will be offered and placed in the securities markets. The rights offering and the subscription price of the shares are subject to approval at the Extraordinary Shareholders’ Meeting to be held on September 4, 2012.
Synergies from the business combination of LAN Airlines S.A. and TAM
As has been previously announced, the Company projects pre-tax synergies of approximately US$170 million to US$200 million for the first 12 months after combination, gradually increasing to annual pre-tax synergies of between US$600 million and US$700 million, beginning four years after the completion of the combination. Approximately 40% of the total estimated potential synergies are expected to derive from revenue increases in the international passenger business, 20% from revenue increases in the cargo business, and the remaining 40% from cost savings.
LATAM Airlines Group is advancing in the process of achieving the expected synergies. Regarding its international passenger operations, the Company has established fare combinability between LAN and TAM, cross selling of LAN and TAM flights, and code shares on various international routes, such as Santiago – Orlando, Santiago – Madrid, and Santiago – London. Cross selling will assist the Company in capturing connectivity synergies by offering our customers a single network in a one-stop shop. In addition, passengers of both airlines have access to the benefits of each other’s frequent flyer programs, TAM Fidelidade and Lanpass.
LAN Cargo is also advancing in the process of the expected synergies with the cargo division of TAM Linhas Areas S.A., taking advantage of the highly complementary nature of their operations. The extensive network of TAM Linhas Aereas S.A.’s passenger aircraft allows for broad coverage, with over 40 domestic destinations, while LAN’s Brazilian cargo affiliate ABSA operates freighters that can provide increased capacity for denser routes. ABSA has obtained the required approval for the use of the brand name “TAM Cargo” and pursuant to a capacities agreement between ABSA and TAM Linhas Aereas S.A., all domestic and international cargo operations in Brazil, including belly capacity and freighter aircraft, will be commercialized under the TAM Cargo brand, which is well positioned in the Brazilian market. Furthermore, ABSA is receiving a fourth Boeing 767 freighter for the Brazilian market and this freighter will be painted with the TAM Cargo livery. In addition, the Company is investing in a new warehouse at Guarulhos Airport and enhancing the cargo installations at Congonhas Airport. Cargo operations outside Brazil will continue to be commercialized under the LAN Cargo brand, which has strong brand recognition in the markets where it operates. Pursuant to the cargo block-space agreements that are already in place, the belly capacity of TAM Linhas
LATAM Airlines Group S.A. 2Q12
![]()
Aereas S.A.’s international passenger operations to and from Brazil, previously commercialized mainly through third parties, is being commercialized by LAN and ABSA, respectively
LATAM Airlines Group estimates one-time costs associated with the closing of the transaction and the realization of synergies of approximately US$200 million, most of which are expected to be incurred in the first 12 months after the completion of the combination. These costs do not include the transaction costs that have been incurred by LATAM and TAM separately until the end of the second quarter 2012.
| 1. | LATAM AIRLINES GROUP CONSOLIDATED FINANCIAL RESULTS AND BALANCE SHEET FOR THE SECOND QUARTER 2012 |
Following is LATAM Airlines Group’s Consolidated Income Statement for second quarter 2012, in thousands of US dollars. Because the business combination with TAM was completed on June 22, results for the period ended June 30, 2012 include the last eight days of TAM results, from June 23 to June 30, 2012. We show separately LATAM Airlines Group’s (previously LAN Airlines’) results for the second quarter and the eight days of TAM’s results that were consolidated as a result of the business combination.
LATAM Airlines Group S.A. 2Q12
![]()
| For the three month period ended June 30 | ||||||||||||
| LATAM | LAN | TAM (8 days) | ||||||||||
REVENUE | ||||||||||||
Passenger | 1,158,576 | 1,026,768 | 131,808 | |||||||||
Cargo | 389,718 | 382,203 | 7,515 | |||||||||
Other | 36,063 | 35,626 | 437 | |||||||||
|
|
|
|
|
| |||||||
TOTAL OPERATING REVENUE | 1,584,357 | 1,444,597 | 139,760 | |||||||||
EXPENSES | ||||||||||||
Wages and Benefits | -320,583 | -290,452 | -30,130 | |||||||||
Aircraft Fuel | -528,016 | -470,207 | -57,809 | |||||||||
Commissions to Agents | -59,749 | -55,161 | -4,588 | |||||||||
Depreciation and Amortization | -117,093 | -108,179 | -8,914 | |||||||||
Other Rental and Landing Fees | -192,357 | -177,875 | -14,482 | |||||||||
Passenger Services | -35,547 | -32,144 | -3,403 | |||||||||
Aircraft Rentals | -48,032 | -42,616 | -5,416 | |||||||||
Aircraft Maintenance | -56,620 | -45,714 | -10,905 | |||||||||
Other Operating Expenses | -203,193 | -185,190 | -18,006 | |||||||||
|
|
|
|
|
| |||||||
TOTAL OPERATING EXPENSES | -1,561,190 | -1,407,538 | -153,652 | |||||||||
OPERATING INCOME | 23,167 | 37,059 | -13,892 | |||||||||
|
|
|
|
|
| |||||||
Operating Margin | 1.5 | % | 2.6 | % | -9.9 | % | ||||||
Interest Income | 34,227 | 4,560 | 29,667 | |||||||||
Interest Expense | -43,779 | -34,521 | -9,258 | |||||||||
Other Income (Expense) | 54,761 | -4,302 | 59,062 | |||||||||
INCOME BEFORE TAXES AND MINORITY INTEREST | 68,376 | 2,796 | 65,580 | |||||||||
Income Taxes | -19,650 | -988 | -18,662 | |||||||||
INCOME BEFORE MINORITY INTEREST | 48,726 | 1,808 | 46,918 | |||||||||
Attributable to: | ||||||||||||
Shareholders | 49,725 | 5,186 | 46,339 | |||||||||
Minority Interest | -999 | -3,378 | 577 | |||||||||
NET INCOME | 49,725 | 5,186 | 46,339 | |||||||||
|
|
|
|
|
| |||||||
Net Margin | 3.1 | % | 0.4 | % | 33.2 | % | ||||||
Effective Tax Rate | 28.3 | % | 16.0 | % | 28.7 | % | ||||||
Weighted average number of shares outstanding | 352,878,508 | n.a. | n.a. | |||||||||
Earnings per Share (US$) | 0.14 | n.a. | n.a. | |||||||||
|
|
|
|
|
| |||||||
EBITDA | 140,260 | 145,238 | -4,978 | |||||||||
EBITDA Margin | 8.9 | % | 10.1 | % | -3.6 | % | ||||||
|
|
|
|
|
| |||||||
EBITDAR | 188,292 | 187,854 | 438 | |||||||||
EBITDAR Margin | 11.9 | % | 13.0 | % | 0.3 | % | ||||||
|
|
|
|
|
| |||||||
Following is LATAM Airlines Group’s Consolidated Balance Sheet for the period ended June 30, 2012, in thousands of US dollars. We show separately the balance sheet accounts for LATAM Airlines Group (previously LAN Airlines), and the fair value of the balance sheet accounts for TAM, as they were consolidated.
LATAM Airlines Group S.A. 2Q12
![]()
| As of June 30, 2012 LATAM | As of June 30, 2012 LAN | As of June 30, 2012 TAM * | Business combination adjustments | |||||||||||||
Assets: | ||||||||||||||||
Cash, and cash equivalents | 457,547 | 245,974 | 211,573 | — | ||||||||||||
Other financial assets | 892,617 | 136,450 | 756,167 | — | ||||||||||||
Other non-financial assets | 64,183 | 36,340 | 27,843 | — | ||||||||||||
Trade and other accounts receivable | 1,744,483 | 556,823 | 1,187,660 | — | ||||||||||||
Accounts receivable from related entities | 648 | 622 | 26 | — | ||||||||||||
Inventories | 147,556 | 76,247 | 71,309 | — | ||||||||||||
Tax assets | 270,782 | 93,106 | 177,676 | — | ||||||||||||
Non-current assets and disposal groups held for sale | 33,509 | 24,495 | 9,014 | — | ||||||||||||
Total current assets | 3,611,325 | 1,170,057 | 2,441,268 | — | ||||||||||||
Property and equipment | 11,151,929 | 6,190,433 | 4,961,496 | — | ||||||||||||
Goodwill | 2,229,299 | 172,617 | 0 | 2,056,682 | ||||||||||||
Intangible assets other than goodwill | 1,849,340 | 80,179 | 1,769,161 | — | ||||||||||||
Other non-current assets | 800,131 | 198,558 | 601,573 | — | ||||||||||||
Total non-current assets | 16,030,699 | 6,641,787 | 7,332,230 | — | ||||||||||||
|
|
|
|
|
|
|
| |||||||||
Total assets | 19,642,024 | 7,811,844 | 9,773,498 | 2,056,682 | ||||||||||||
|
|
|
|
|
|
|
| |||||||||
Liabilities and shareholders’ equity: | ||||||||||||||||
Other financial liabilities | 1,758,071 | 682,085 | 1,075,986 | — | ||||||||||||
Trade and other accounts payables | 1,401,946 | 626,961 | 774,985 | — | ||||||||||||
Tax liabilities | 92,617 | 28,308 | 64,309 | — | ||||||||||||
Other non-financial liabilities | 2,055,140 | 1,054,559 | 1,000,581 | — | ||||||||||||
Total current liabilities | 5,307,774 | 2,391,913 | 2,915,861 | — | ||||||||||||
Other financial liabilities | 6,905,351 | 3,134,382 | 3,770,969 | — | ||||||||||||
Accounts payable | 763,047 | 324,558 | 438,489 | — | ||||||||||||
Other provisions | 290,271 | 23,583 | 266,688 | — | ||||||||||||
Deferred tax liabilities | 999,711 | 419,745 | 579,966 | — | ||||||||||||
Employee benefits | 17,209 | 17,209 | 0 | — | ||||||||||||
Other non-financial liabilities | 96,128 | 0 | 96,128 | — | ||||||||||||
Total non-current liabilities | 9,071,717 | 3,919,477 | 5,152,240 | — | ||||||||||||
|
|
|
|
|
|
|
| |||||||||
Total liabilities | 14,379,491 | 6,311,390 | 8,068,101 | |||||||||||||
|
|
|
|
|
|
|
| |||||||||
Share capital | 1,435,542 | 484,133 | — | 951,409 | ||||||||||||
Retained earnings | 1,186,217 | 1,186,217 | — | 0 | ||||||||||||
Treasury Shares | -203 | -203 | — | 0 | ||||||||||||
Other reserves | 2,539,810 | -176,099 | — | 2,715,909 | ||||||||||||
Equity attributable to the parent company’s equity holders | 5,161,366 | 1,494,048 | — | 3,667,318 | ||||||||||||
Minority interest | 101,167 | 6,406 | — | 94,761 | ||||||||||||
|
|
|
|
|
|
|
| |||||||||
Total net equity | 5,262,533 | 1,500,454 | — | 3,762,079 | ||||||||||||
|
|
|
|
|
|
|
| |||||||||
Total liabilities and equity | 19,642,024 | 7,811,844 | 8,068,101 | 3,762,079 | ||||||||||||
|
|
|
|
|
|
|
| |||||||||
| * | Fair value of TAM’s consolidated assets and liabilities |
ACCOUNTING IMPACT OF THE BUSINESS COMBINATION
Both LATAM Airlines Group and TAM report their financial results under International Financial Reporting Standards (IFRS). Therefore, there are no substantial
LATAM Airlines Group S.A. 2Q12
![]()
differences in accounting criteria between both companies. Certain differences in the accounting for heavy maintenance of aircraft were standardized as a result of the consolidation.
Regarding balance sheet accounts, as a result of the consolidation, certain TAM assets and liabilities which were accounted for at historical values were incorporated into the consolidated balance sheet at their fair value, as required by applicable accounting principles.
The main adjustments to the balance sheet accounts of TAM as a result of the consolidation with LATAM Airlines Group are the following:
| • | Intangible assets other than goodwillincorporate the fair value of certain TAM takeoff and landing slots (London, JFK and Congonhas airports). These adjustments amount to an increase of US$1,458.1 million. |
| • | Property, plant and equipment incorporate the change in the value of TAM’s fleet to reflect their fair value, and to reflect the change in accounting for maintenance. The adjustments amount to an increase of US$ 235.4 million. |
| • | Trade and other accounts payable (current and non-current) reflect a reduction of US$104.8 million related to a change in the accounting of certain maintenance provisions. |
| • | Deferred tax liabilities (current and non-current) reflect the adjustments in the above mentioned values, which amount to an increase of US$427.3 million. |
The purchase price allocation has not been completed at June 30, 2012. Applicable accountings standards permit a one year measurement period, requiring fair value adjustments completed during that period to be adjusted against previously reported goodwill. The consolidated balance sheet of LATAM Airlines Group as of June 30, 2012, includesgoodwill in the amount of US$2,056.6 million generated as a result of the business combination. Furthermore, shareholders’ equity increased by US$3,762.1 million, which reflects the market value of the shares issued in the exchange offer.
One of the objectives of Latam Airlines Group is to reduce the volatility in the financial results of TAM caused by external factors such as foreign exchange rate and fuel price fluctuations. In order to mitigate the impact of exchange rate variations as a result of the imbalance of TAM’s balance sheet accounts between assets denominated in reais and liabilities denominated in US dollars, LATAM is evaluating alternatives to move the TAM aircraft to the LATAM balance sheet, which has the US dollar as its functional currency. In addition, all aircrafts delivered after June 22, 2012 are to be financed mostly by LATAM Airlines Group, even if the aircraft is to be operated by TAM. The volatility caused by exchange rate variations on the cash flows of TAM are expected to be partially mitigated over time as a result of the natural hedge provided by the diversified nature of the cash flows of LATAM Airlines Group. In order to mitigate the impact of the mark-to-market of fuel hedging contracts that were not subject to hedge accounting at TAM, LATAM will now account for these derivative contracts, where they will be subject to hedge
LATAM Airlines Group S.A. 2Q12
![]()
accounting, and therefore their mark-to-market values will not be reflected on the consolidated income statement. This change will be implemented as of the third quarter 2012. In additional, all future hedging will be done by LATAM Airlines Group.
FINANCING AND LIQUIDITY
Following the completion of the business combination, Fitch Ratings downgraded LATAM Airlines Group’s international credit rating from BBB to BB+ with stable outlook. At the same time, Fitch Ratings upgraded TAM’s international credit rating from B+ to BB with stable outlook, and Standard and Poor’s upgraded TAM’s international credit rating from B+ to BB with positive outlook.
At the end of the second quarter 2012, LATAM reported US$1,183.0 million in cash and cash equivalents, including certain highly liquid investments accounted for as other current financial assets. In addition, as of June 30, 2012, the Company reported deposits with aircraft manufacturers (pre-delivery payments) of US$1.968.9 million, US$978.2 million of which were funded directly by LATAM. On July 18, TAM disbursed approximately US$ 163.3 million (R$ 339,5 million) for the squeeze out of TAM shares which did not participate in the exchange offer. At the Extraordinary Shareholders’ Meeting to be held on September 4, 2012, LATAM shareholders will vote on a rights offering for the remaining 7,436,816 shares that were not issued in the exchange offer.
During the second quarter 2012, LATAM successfully secured financing for its 2012 aircraft deliveries, involving an amount of approximately US$2.7 billion for a total of 40 aircraft. As a result of the successful completion of the business combination with TAM, almost all of these fleet deliveries are to be incorporated at LATAM Airlines Group. Financing was done through a combination of Export Credit Agency support including capital markets issuances, sale & leaseback transactions and commercial financing including senior and junior debt. The typical tenor for these financings is twelve years.
LATAM Airlines Group S.A. 2Q12
![]()
| 2. | LAN AIRLINES CONSOLIDATED FINANCIAL RESULTS FOR SECOND QUARTER 2012 |
The following is LAN’s consolidated Income Statement for second quarter 2012 in thousands of US dollars.
| For the three month period ended | ||||||||||||
| June 30 | ||||||||||||
| 2012 | 2011 | % Change | ||||||||||
REVENUE | ||||||||||||
Passenger | 1,026,768 | 897,313 | 14.4 | % | ||||||||
Cargo | 382,203 | 406,448 | -6.0 | % | ||||||||
Other | 35,626 | 27,780 | 28.2 | % | ||||||||
|
|
|
|
|
| |||||||
TOTAL OPERATING REVENUE | 1,444,597 | 1,331,541 | 8.5 | % | ||||||||
EXPENSES | ||||||||||||
Wages and Benefits | -290,452 | -255,295 | 13.8 | % | ||||||||
Aircraft Fuel | -470,207 | -430,877 | 9.1 | % | ||||||||
Comissions to Agents | -55,161 | -45,665 | 20.8 | % | ||||||||
Depreciation and Amortization | -108,179 | -100,417 | 7.7 | % | ||||||||
Other Rental and Landing Fees | -177,875 | -168,919 | 5.3 | % | ||||||||
Passenger Services | -32,144 | -30,982 | 3.8 | % | ||||||||
Aircraft Rentals | -42,616 | -44,112 | -3.4 | % | ||||||||
Aircraft Maintenance | -45,714 | -45,373 | 0.8 | % | ||||||||
Other Operating Expenses | -185,190 | -154,145 | 20.1 | % | ||||||||
|
|
|
|
|
| |||||||
TOTAL OPERATING EXPENSES | -1,407,538 | -1,275,785 | 10.3 | % | ||||||||
OPERATING INCOME | 37,059 | 55,756 | -33.5 | % | ||||||||
|
|
|
|
|
| |||||||
Operating Margin | 2.6 | % | 4.2 | % | -1.6 pp | |||||||
Interest Income | 4,560 | 3,017 | 51.1 | % | ||||||||
Interest Expense | -34,521 | -34,299 | 0.6 | % | ||||||||
Other Income (Expense) | -4,302 | -11,869 | -63.8 | % | ||||||||
INCOME BEFORE TAXES AND MINORITY INTEREST | 2,796 | 12,605 | -77.8 | % | ||||||||
Income Taxes | -988 | -3,049 | -67.6 | % | ||||||||
INCOME BEFORE MINORITY INTEREST | 1,808 | 9,556 | -81.1 | % | ||||||||
Attributable to: | ||||||||||||
Shareholders | 5,186 | 15,949 | -67.5 | % | ||||||||
Minority Interest | -3,378 | -6,393 | -47.2 | % | ||||||||
NET INCOME | 5,186 | 15,949 | -67.5 | % | ||||||||
|
|
|
|
|
| |||||||
Net Margin | 0.4 | % | 1.2 | % | -0.8 pp | |||||||
Effective Tax Rate | 16.0 | % | 16.0 | % | ||||||||
|
|
|
|
|
| |||||||
EBITDA | 145,238 | 156,173 | -7.0 | % | ||||||||
EBITDA Margin | 10.1 | % | 11.7 | % | -1.7pp. | |||||||
|
|
|
|
|
| |||||||
EBITDAR | 187,854 | 200,285 | -6.2 | % | ||||||||
EBITDAR Margin | 13.0 | % | 15.0 | % | -2.0 pp. | |||||||
|
|
|
|
|
| |||||||
LATAM Airlines Group S.A. 2Q12
![]()
MANAGEMENT COMMENTS ON LAN’S SECOND QUARTER 2012 RESULTS
LAN reportednet income of US$5.2 million in second quarter 2012, a decrease of 67.5% compared to second quarter 2011.Operating income in the quarter decreased 33.5%, reaching US$37.1 million, with a 2.6% operating margin. The company continued to show strong passenger revenue growth, despite a seasonally low quarter, partially offsetting the impact of a more challenging environment in the cargo business, as well as the ongoing development of LAN Colombia’s operations. In addition, operating results include a one-time cost of US$7.1 million related to the successful completion of the collective bargaining process with certain unions. LAN also recognized US$9.2 million in costs related to the business combination with TAM.
During the second quarter 2012, total operating revenues increased 8.5% compared to second quarter 2011, reaching US$1,444.6 million. Passenger and cargo revenues accounted for 71.1% and 26.5% of total revenues for the quarter, respectively.
Passenger revenues increased 14.4% during the quarter, mainly driven by 16.0% traffic growth. Load factors increased from 77.6% to 82.1%, as traffic growth outpaced the 9.6% increase in capacity. Passenger capacity increases focused mainly on domestic routes within Chile and regional routes within South America, partially offset by decreased capacity on long haul routes to Europe. Yields decreased 1.4% during the quarter due to lower fuel surcharges and lower fares as a result of price promotions implemented on certain routes. Overall, revenues per ASK increased 4.4%. Traffic grew as a result of a 19.2% increase in domestic traffic (including domestic operations of LAN and its affiliates in Chile, Argentina, Peru, Ecuador and Colombia), and a 14.6% increase in international traffic. International traffic accounted for 69.0% of total passenger traffic during the quarter.
Cargo revenuesdecreased 6.0% in the quarter, driven by a 2.2% decrease in cargo traffic and a 3.9% decrease in yields, reflecting a more challenging scenario in Latin American cargo markets due to a slowdown in world trade momentum, and a decline in demand on routes to Latin America, especially in Brazil. Capacity decreased 3.2% during the quarter partially due to a decreased availability in the bellies of passenger aircraft as well as capacity adjustments in the freighter fleet. As a consequence, load factors increased from 68.9% to 69.6%. Revenues per ATK decreased 2.9% compared to second quarter 2011.
Other revenuesincreased 28.2% mainly driven by an increase in revenues from aircraft leases, and tour and travel services. This was partially offset by a decrease in revenues from maintenance to third parties.
Total operating expenses increased 10.3% during the quarter, while unit costs per ATK (including net financial expenses) increased 8.0% compared to second quarter 2011. Despite lower jet fuel prices during the quarter, results were impacted by fuel hedging losses of US$3.0 million in the second quarter 2012 compared to a fuel hedging gain of US$20.7 million in the second quarter 2011. Excluding fuel, unit costs increased 7.8% mainly due to higher costs related to wages and benefits as a
LATAM Airlines Group S.A. 2Q12
![]()
result of the US$7.1 million payment made to certain unions as part of the successful completion of their collective bargaining process and the costs related to the business combination with TAM. Operating costs were also impacted by ongoing expenses related to the development of LAN Colombia’s operations. Changes in operating expenses were mainly due to the following:
| • | Wages and benefits increased 13.8% driven by a higher average headcount, in line with the Company’s planned operational expansion, as well as increased average compensations including a US$7.1 million payment made to certain unions as part of the successful completion of their collective bargaining process. This was partially offset by the positive impact of the average depreciation of Latin American currencies during the quarter on wages denominated in these currencies. |
| • | Fuel costs increased 9.1% mainly driven by a 5.3% increase in consumption, in line with the expansion of LAN’s operations during the quarter. In addition, the Company recognized a US$3.0 million fuel hedge loss, compared to a US$20.7 million fuel hedge gain in the second quarter of 2011. |
| • | Commissions to agents increased 20.8% due to an 8.1% increase in traffic revenues (passenger and cargo) and a 0.4 point increase in average commissions. This increase was mainly due to higher commissions in the passenger business. |
| • | Depreciation and amortization increased 7.7% mainly due to the incorporation of 3 new Airbus A319s, 5 new Airbus A320s and 4 Boeing 767-300s between July 2011 and June 2012, partially offset by the sale of 2 Airbus A318s during the third quarter 2011. |
| • | Other rental and landing fees increased 5.3% mainly due to increased aeronautical rates, partially offset by lower costs related to aircraft insurance. |
| • | Passenger serviceexpenses increased 3.8% driven by a 17.3% increase in the number of passengers transported. |
| • | Aircraft rentalsdecreased 3.4% due to the return of 3 leased Boeing 737-700s during this quarter, belonging to LAN Colombia’s operations. |
| • | Maintenance expensesincreased 0.8% mainly as a result of a larger fleet, in line with the expansion in the Company’s operations during the quarter. |
| • | Other operating expensesincreased 20.1% due to higher advertising and marketing costs as well as higher sales costs, and transaction costs of US$9.2 million related to the business combination with TAM. |
Non-operating results
| • | Interest incomeincreased from US$3.0 million in second quarter 2011 to US$4.6 million in second quarter 2012 mainly due to a slight recovery of average interest rates, partially offset by a lower cash balance during the quarter. |
| • | Interest expenseincreased marginally by 0.6% due to higher debt related to fleet financing. |
| • | UnderOther income (expense), the Company recorded a US$4.3 million loss, mainly due to foreign exchange losses related to the average depreciation of local currencies, compared to a US$11.9 loss in the second quarter 2011. |
LATAM Airlines Group S.A. 2Q12
![]()
| 3. | TAM CONSOLIDATED FINANCIAL RESULTS FOR SECOND QUARTER 2012 |
The following is TAM’s consolidated Income Statement for second quarter 2012 in thousands of R$.
| For the three month period ended | ||||||||||||
| June 30 | ||||||||||||
| 2012 | 2011 | % Change | ||||||||||
REVENUE | ||||||||||||
Passenger | 2,837,991 | 2,505,648 | 13.3 | % | ||||||||
Cargo | 188,632 | 282,135 | -33.1 | % | ||||||||
Other | 204,205 | 265,110 | -23.0 | % | ||||||||
|
|
|
|
|
| |||||||
TOTAL OPERATING REVENUE | 3,230,828 | 3,052,893 | 5.8 | % | ||||||||
EXPENSES | ||||||||||||
Wages and Benefits | -683,262 | -624,240 | 9.5 | % | ||||||||
Aircraft Fuel | -1,351,277 | -1,085,392 | 24.5 | % | ||||||||
Commissions to Agents | -108,248 | -159,278 | -32.0 | % | ||||||||
Depreciation and Amortization | -190,523 | -186,655 | 2.1 | % | ||||||||
Other Rental and Landing Fees | -325,093 | -284,814 | 14.1 | % | ||||||||
Passenger Services | -67,268 | -87,179 | -22.8 | % | ||||||||
Aircraft Rentals | -123,324 | -91,032 | 35.5 | % | ||||||||
Aircraft Maintenance | -227,155 | -135,578 | 67.5 | % | ||||||||
Other Operating Expenses | -438,833 | -389,892 | 12.6 | % | ||||||||
|
|
|
|
|
| |||||||
TOTAL OPERATING EXPENSES | -3,514,983 | -3,044,060 | 15.5 | % | ||||||||
OPERATING INCOME | -284,155 | 8,833 | -3317.0 | % | ||||||||
|
|
|
|
|
| |||||||
Operating Margin | -8.8 | % | 0.3 | % | -9.1 pp | |||||||
Interest Income | 11,917 | 74,326 | -84.0 | % | ||||||||
Interest Expense | -212,022 | -143,248 | 48.0 | % | ||||||||
Other Income (Expense) | -832,119 | 235,436 | -453.4 | % | ||||||||
INCOME BEFORE TAXES AND MINORITY INTEREST | -1,316,379 | 175,347 | -850.7 | % | ||||||||
Income Taxes | 399,729 | -93,658 | -526.8 | % | ||||||||
INCOME BEFORE MINORITY INTEREST | -916,650 | 81,689 | -1222.1 | % | ||||||||
Attributable to: | ||||||||||||
Shareholders | -928,124 | 60,264 | -1640.1 | % | ||||||||
Minority Interest | 11,474 | 21,425 | -46.4 | % | ||||||||
NET INCOME | -928,124 | 60,264 | -1640.1 | % | ||||||||
|
|
|
|
|
| |||||||
Net Margin | -28.7 | % | 2.0 | % | -30.7 pp | |||||||
Effective Tax Rate | 30.1 | % | 60.8 | % | ||||||||
|
|
|
|
|
| |||||||
EBITDA | -93,632 | 195,488 | -147.9 | % | ||||||||
EBITDA Margin | -2.9 | % | 6.4 | % | -9.3 pp. | |||||||
|
|
|
|
|
| |||||||
EBITDAR | 29,692 | 286,520 | -89.6 | % | ||||||||
EBITDAR Margin | 0.9 | % | 9.4 | % | -8.5 pp. | |||||||
|
|
|
|
|
| |||||||
LATAM Airlines Group S.A. 2Q12
![]()
MANAGEMENT COMMENTS ON TAM’S SECOND QUARTER 2012 RESULTS
Net results in second quarter 2012 amounted to a loss of R$928.1 million compared to a R$60.2 million gain in the same period 2011. TAM’soperating loss amounted to R$284.2 million in the second quarter 2012 compared to an operating income of R$8.8 million in the same period of 2011.Operating margin in the quarter decreased from 0.3% in 2011 to negative 8.8% in 2012.
Total operating revenues increased 5.8% compared to second quarter 2011. Passenger and cargo revenues accounted for 87.8% and 5.8% of total revenues for the quarter, respectively.
Passenger revenues increased 13.3%, including both domestic and international operations. Brazilian domestic passenger revenues amounted to R$1,755 million, a 13.6% increase compared to the second quarter of 2011. Domestic passenger capacity decreased 1.2%, while traffic decreased 0.7%. As a result, load factors in the Brazilian domestic market increased 0.4 points, reaching 69.6%. Domestic passenger yields increased 14.3%, resulting in a 15.0% increase in revenues per ASK.
International passenger revenues amounted to R$1,082 million, a 12.8% increase compared to the second quarter of 2011. International passenger capacity decreased 0.3%, while traffic decreased 0.9%. As a result, load factors on TAM’s international routes decreased 0.4 points, reaching 81.0%. International passenger yields increased 13.8%, resulting in a 13.2% increase in revenues per ASK.
Cargo revenues decreased 33.1% in the quarter, mainly due to changes in the accounting of cargo revenues, which are now shown net of commissions. Excluding this impact, cargo revenues decreased 10.9% in the quarter.
Other revenues decreased 23.0%, amounting to R$204 million during the second quarter 2012. Revenues from Multiplus reached R$218 million, decreasing 18.0% as compared to the second quarter 2011, mainly as a result of the change in the accounting of revenues from the redemption of Multiplus points implemented by TAM during the first quarter 2012. As a result of this accounting change, TAM recognizes the revenue from the sale of seats to Multiplus once the ticket is flown instead of when the redemption occurs.
Total operating expenses increased 15.5% during the quarter, primarily due to the impact of the 23.0% average depreciation of the Brazilian real (as compared to the second quarter 2011) on costs denominated in US dollars. Unit costs per ASK increased 16.5% while CASK ex fuel increased 11.5%.
| • | Wages and benefits increased 9.5%, driven by a higher average headcount, as well as an increase of 6.5% in wages applied in December of 2011 in line with inflation. |
| • | Fuel costs increased 24.5%, primarily due to a 25.9% increase in the average fuel price per gallon in reais, partially offset by a 1.1% reduction in fuel gallons |
LATAM Airlines Group S.A. 2Q12
![]()
consumed, in line with the reduction in TAM’s domestic and international passenger operations during the quarter. The increase in fuel prices denominated in reais is a result of a 23.0% depreciation of the Brazilian real against the US dollar, partially offset by the decrease in the average price of jet fuel. |
| • | Commissions to agents decreased 32.0% mainly due to changes in the accounting for commissions to agents in the cargo business, as from 2012 these commissions are deducted in calculating revenues. |
| • | Depreciation and amortization increased 2.1%, mainly due to the net addition of 5 new aircraft to our fleet between July 2011 and June 2012, classified as financial leases. |
| • | Other rental and landing feesincreased 14.1%, mainly due to increased costs of domestic aeronautical rates implemented since March 2012. |
| • | Passenger service expenses decreased 22.8%, driven by a 5.6% decrease in the number of passengers transported as well as a reduction in catering expenses and passenger compensations. |
| • | Aircraft rentals increased by 35.5% mainly due to the 23.0% average depreciation of the Brazilian real against the US dollar as compared to the second quarter 2011, partially offset by the net decrease of 4 aircraft classified as operating leases. |
| • | Maintenance expensesincreased 67.5% due to the 23.0% average depreciation of the Brazilian real against the US dollar during the period, and the increase in the number of engine checks and redeliveries in this quarter compared to 2Q11, as well as a net increase of 1 aircraft in our fleet between July 2011 and June 2012, |
| • | Other operating expenses increased 12.6% mainly due to higher sales and marketing costs. |
Non-operating results
| • | Interest income decreased 84.0% due to a decrease in the Company’s cash position and the decline in the interest rate in Brazil (CDI), which caused a 12% decline in the interest income of Multiplus. This line also reflects a R$54.0 million loss related to the mark to market of certain fuel hedge positions. |
| • | Interest expenseincreased to R$212.0 million in the second quarter 2012, mainly due to a higher debt related to fleet financing and the depreciation of the real as well as a R$39.7 million loss related to the mark to market of certain fuel hedge positions, compared to a R$12 million loss in the same period of 2011. |
| • | Other income (expense) amounted R$831.1 million for the quarter mainly due the 11% average depreciation of the Brazilian real against the US dollar since March 31, 2012, which impacted our U.S. dollar-denominated debt, mainly related to financial leases, in the amount of R$845.9 million. |
LATAM Airlines Group S.A. 2Q12
![]()
LATAM’S Fleet Plan
During the second quarter 2012, LAN received 3 Airbus A320 and 1 Boeing 767-300 passenger aircraft, while TAM received 4 Airbus A320. LAN also returned 3 Boeing 737-700, while TAM returned 3 leased Airbus A320-200, as contemplated by each company’s respective fleet plan.
During the remainder of 2012, LATAM expects to receive 12 additional Airbus A320 family aircraft to operate domestic and regional routes, as well as 8 Boeing 767-300, 4 Boeing 777-300 and the first 3 Boeing 787-8 Dreamliners for long-haul routes. Regarding the cargo fleet, during 2012, the Company expects the delivery of 2 Boeing 777 freighter aircraft. LATAM’s fleet plan also contemplates the return of 21 aircraft.
LATAM Airlines Group S.A. 2Q12
![]()
LATAM’s estimated fleet plan and associated capital expenditures are shown in the table below.
| 2012 | 2013 | 2014 | ||||||||||
Passenger Aircraft | ||||||||||||
Dash 8-200 | 10 | 9 | 9 | |||||||||
Dash 8-Q400 | 0 | 0 | 0 | |||||||||
Boeing 737-700 | 6 | 6 | 2 | |||||||||
Airbus A318-100 | 5 | 0 | 0 | |||||||||
Airbus A319-100 | 55 | 55 | 60 | |||||||||
Airbus A320-200 | 139 | 159 | 169 | |||||||||
Airbus A321-200 | 9 | 10 | 20 | |||||||||
Airbus A330-200 | 20 | 20 | 20 | |||||||||
Boeing 767-300 | 41 | 43 | 39 | |||||||||
Airbus A340-300/500 | 7 | 2 | 0 | |||||||||
Boeing 777-300 ER | 8 | 10 | 12 | |||||||||
Boeing 787-800 | 3 | 5 | 12 | |||||||||
|
|
|
|
|
| |||||||
TOTAL | 303 | 319 | 343 | |||||||||
Cargo Aircraft | ||||||||||||
Boeing 777-200F | 4 | 4 | 4 | |||||||||
Boeing 767-300F | 12 | 12 | 12 | |||||||||
|
|
|
|
|
| |||||||
TOTAL | 16 | 16 | 16 | |||||||||
TOTAL FLEET | 319 | 335 | 359 | |||||||||
|
|
|
|
|
| |||||||
Total Fleet Capex(US$ millions) | 2,979 | 2,297 | 2,594 | |||||||||
OUTLOOK
Overall, we are optimistic about the opportunities we see for LATAM Airlines Group. Passenger demand continues to be strong in most of South America and on international routes, as reflected in LAN’s strong traffic growth and high load factors for the second quarter 2012. The Brazilian domestic market is operating with capacity discipline, providing the basis for improved profitability in that market. In the cargo business, although we continue to face reduced demand on import routes into South America, demand on northbound routes remains strong. In addition, LAN Cargo will take delivery of 2 B777 freighters during the second half of 2012, allowing for increased efficiency on long haul freighter routes. The integration with TAM is proceeding smoothly, with important advances during the first weeks of joint operations. We remain confident that the announced US$600 million to US$700 million in synergies are achievable, and that we will begin to see the positive results of the business combination in the third quarter 2012.
Considering current market conditions, the Company expects passenger ASK growth in 2012 for LATAM Airlines Group to be approximately 3% to 4%, including both LAN and TAM operations. TAM’s domestic passenger ASKs in the Brazilian market are expected to decrease by between 2% and 3% in 2012. LAN Cargo’s expected cargo ATK growth for 2012 is between 3% and 5% (excluding TAM belly capacity), mainly driven by the delivery of 2 Boeing 777 freighters in the second half of 2012.
LATAM Airlines Group S.A. 2Q12
![]()
*****
About LATAM Airlines Group S.A
LATAM Airlines Group S.A. is the new name given to LATAM Airlines S.A. as a result of its association with TAM S.A. LATAM Airlines Group S.A. now includes LATAM Airlines and its affiliates in Peru, Argentina, Colombia and Ecuador, and LATAM Cargo and its affiliates, as well as TAM S.A. and its subsidiaries TAM LinhasAereas S.A., including its business units TAM TransportesAereos del Mercosur S.A., TAM Airlines (Paraguay) and Multiplus S.A. This association creates one of the largest airline groups in the world in terms of network connections, providing passenger transport services to about 150 destinations in 22 countries and cargo services to about 169 destinations in 27 countries, with a fleet of 312 aircraft. In total, LATAM Airlines Group S.A. has more than 52,000 employees and its shares are traded in Santiago, as well as on the New York Stock Exchange, in the form of ADRs, and Sao Paulo Stock Exchange, in the form of BDRs.
Each airline will continue to operate under their current brands and identities. For any inquiry of LATAM or TAM, please visit www.LATAM.com or www.tam.com.br, respectively. Further information at www.latamairlinesgroup.net
******
Note on Forward-Looking Statements
This report contains forward-looking statements. Such statements may include words such as “anticipate,” “estimate,” “expect,” “project,” “intend,” “LATAM,” “believe” or other similar expressions. Forward-looking statements are statements that are not historical facts, including statements about our beliefs and expectations. These statements are based on current LATAMs, estimates and projections, and, therefore, you should not place undue reliance on them. Forward-looking statements involve inherent risks and uncertainties. We caution you that a number of important factors could cause actual results to differ materially from those contained in any forward-looking statement. These factors and uncertainties include in particular those described in the documents we have filed with the U.S. Securities and Exchange Commission. Forward-looking statements speak only as of the date they are made, and we undertake no obligation to update publicly any of them, whether in light of new information, future events or otherwise.
LATAM Airlines Group S.A. 2Q12
![]()
LATAM Airlines Group S.A.
Consolidated Income Statement(in thousands of US Dollars)
| For the three month period ended | For the six month period ended | |||||||||||||||||||||||
| June 30 | June 30 | |||||||||||||||||||||||
| 2012 | 2011 | % Change | 2012 | 2011 | % Change | |||||||||||||||||||
REVENUE | ||||||||||||||||||||||||
Passenger | 1,158,576 | 897,313 | 29.1 | % | 2,296,787 | 1,875,136 | 22.5 | % | ||||||||||||||||
Cargo | 389,718 | 406,448 | -4.1 | % | 757,624 | 752,883 | 0.6 | % | ||||||||||||||||
Other | 36,063 | 27,780 | 29.8 | % | 66,628 | 68,396 | -2.6 | % | ||||||||||||||||
|
|
|
|
|
|
|
|
|
|
|
| |||||||||||||
TOTAL OPERATING REVENUE | 1,584,357 | 1,331,541 | 19.0 | % | 3,121,039 | 2,696,415 | 15.7 | % | ||||||||||||||||
EXPENSES | ||||||||||||||||||||||||
Wages and Benefits | -320,583 | -255,295 | 25.6 | % | -619,179 | -493,536 | 25.5 | % | ||||||||||||||||
Aircraft Fuel | -528,016 | -430,877 | 22.5 | % | -1,021,786 | -820,781 | 24.5 | % | ||||||||||||||||
Commissions to Agents | -59,749 | -45,665 | 30.8 | % | -117,368 | -98,280 | 19.4 | % | ||||||||||||||||
Depreciation and Amortization | -117,093 | -100,417 | 16.6 | % | -223,579 | -197,777 | 13.0 | % | ||||||||||||||||
Other Rental and Landing Fees | -192,357 | -168,919 | 13.9 | % | -357,505 | -329,882 | 8.4 | % | ||||||||||||||||
Passenger Services | -35,547 | -30,982 | 14.7 | % | -73,481 | -67,942 | 8.2 | % | ||||||||||||||||
Aircraft Rentals | -48,032 | -44,112 | 8.9 | % | -92,325 | -86,597 | 6.6 | % | ||||||||||||||||
Aircraft Maintenance | -56,620 | -45,373 | 24.8 | % | -106,406 | -88,805 | 19.8 | % | ||||||||||||||||
Other Operating Expenses | -203,193 | -154,145 | 31.8 | % | -375,020 | -303,769 | 23.5 | % | ||||||||||||||||
|
|
|
|
|
|
|
|
|
|
|
| |||||||||||||
TOTAL OPERATING EXPENSES | -1,561,190 | -1,275,785 | 22.4 | % | -2,986,649 | -2,487,369 | 20.1 | % | ||||||||||||||||
OPERATING INCOME | 23,167 | 55,756 | -58.4 | % | 134,390 | 209,046 | -35.7 | % | ||||||||||||||||
|
|
|
|
|
|
|
|
|
|
|
| |||||||||||||
Operating Margin | 1.5 | % | 4.2 | % | -2.7pp | 4.3 | % | 7.8 | % | -3.4pp | ||||||||||||||
Interest Income | 34,227 | 3,017 | 1034.5 | % | 37,738 | 8,624 | 337.6 | % | ||||||||||||||||
Interest Expense | -43,779 | -34,299 | 27.6 | % | -80,479 | -70,212 | 14.6 | % | ||||||||||||||||
Other Income (Expense) | 54,761 | -11,869 | -561.4 | % | 64,613 | -17,261 | -474.3 | % | ||||||||||||||||
INCOME BEFORE TAXES AND MINORITY INTEREST | 68,376 | 12,605 | 442.5 | % | 156,262 | 130,197 | 20.0 | % | ||||||||||||||||
Income Taxes | -19,650 | -3,049 | 544.5 | % | -34,133 | -23,280 | 46.6 | % | ||||||||||||||||
INCOME BEFORE MINORITY INTEREST | 48,726 | 9,556 | 409.9 | % | 122,129 | 106,917 | 14.2 | % | ||||||||||||||||
Attributable to: | ||||||||||||||||||||||||
Shareholders | 49,725 | 15,949 | 211.8 | % | 125,792 | 113,184 | 11.1 | % | ||||||||||||||||
Minority Interest | -999 | -6,393 | -84.4 | % | -3,663 | -6,267 | -41.6 | % | ||||||||||||||||
NET INCOME | 49,725 | 15,949 | 211.8 | % | 125,792 | 113,184 | 11.1 | % | ||||||||||||||||
|
|
|
|
|
|
|
|
|
|
|
| |||||||||||||
Net Margin | 3.1 | % | 1.2 | % | 1.9pp | 4.0 | % | 4.2 | % | -0.2pp | ||||||||||||||
Effective Tax Rate | 28.3 | % | 16.0 | % | 21.3 | % | 17.1 | % | ||||||||||||||||
Weighted average number of shares outstanding | 352,878,508 | 339,322,359 | 352,878,508 | 339,062,559 | ||||||||||||||||||||
Earnings per Share (US$) | 0.14 | 0.05 | 199.8 | % | 0.36 | 0.33 | 6.8 | % | ||||||||||||||||
|
|
|
|
|
|
|
|
|
|
|
| |||||||||||||
EBITDA | 140,260 | 156,173 | -10.2 | % | 357,969 | 406,823 | -12.0 | % | ||||||||||||||||
EBITDA Margin | 8.9 | % | 11.7 | % | -2.9pp. | 11.5 | % | 15.1 | % | -3.6pp. | ||||||||||||||
|
|
|
|
|
|
|
|
|
|
|
| |||||||||||||
EBITDAR | 188,292 | 200,285 | -6.0 | % | 450,294 | 406,823 | 10.7 | % | ||||||||||||||||
EBITDAR Margin | 11.9 | % | 15.0 | % | -3.2pp. | 14.4 | % | 15.1 | % | -0.7pp. | ||||||||||||||
|
|
|
|
|
|
|
|
|
|
|
| |||||||||||||
LATAM Airlines Group S.A. 2Q12
![]()
LATAM Airlines Group S.A.
Consolidated Balance Sheet(in thousands of US Dollars)
| As of June 30, 2012 LATAM | As of December 31, 2011 LAN | |||||||
Assets: | ||||||||
Cash, and cash equivalents | 457,547 | 374,407 | ||||||
Other financial assets | 892,617 | 227,803 | ||||||
Other non-financial assets | 64,183 | 26,660 | ||||||
Trade and other accounts receivable | 1,744,483 | 537,406 | ||||||
Accounts receivable from related entities | 648 | 838 | ||||||
Inventories | 147,556 | 72,787 | ||||||
Tax assets | 270,782 | 98,789 | ||||||
Non-current assets and disposal groups held for sale | 33,509 | 4,661 | ||||||
Total current assets | 3,611,325 | 1,343,351 | ||||||
Property and equipment | 11,151,929 | 5,927,982 | ||||||
Goodwill | 2,229,299 | 163,777 | ||||||
Intangible assets other than goodwill | 1,849,340 | 64,923 | ||||||
Other non-current assets | 800,131 | 148,626 | ||||||
Total non-current assets | 16,030,699 | 6,305,308 | ||||||
|
|
|
| |||||
Total assets | 19,642,024 | 7,648,659 | ||||||
|
|
|
| |||||
Liabilities and shareholders’ equity: | ||||||||
Other financial liabilities | 1,758,071 | 582,257 | ||||||
Trade and other accounts payables | 1,401,946 | 645,086 | ||||||
Tax liabilities | 92,617 | 29,369 | ||||||
Other non-financial liabilities | 2,055,140 | 1,065,367 | ||||||
Total current liabilities | 5,307,774 | 2,322,079 | ||||||
Other financial liabilities | 6,905,351 | 3,109,136 | ||||||
Accounts payable | 763,047 | 354,930 | ||||||
Other provisions | 290,271 | 22,385 | ||||||
Deferred tax liabilities | 999,711 | 369,625 | ||||||
Employee benefits | 17,209 | 13,132 | ||||||
Other non-financial liabilities | 96,128 | — | ||||||
Total non-current liabilities | 9,071,717 | 3,869,208 | ||||||
|
|
|
| |||||
Total liabilities | 14,379,491 | 6,191,287 | ||||||
|
|
|
| |||||
Share capital | 1,435,542 | 473,907 | ||||||
Retained earnings | 1,186,217 | 1,116,798 | ||||||
Treasury Shares | -203 | 8,492 | ||||||
Other reserves | 2,539,810 | -153,873 | ||||||
Equity attributable to the parent company’s equity holders | 5,161,366 | 1,445,324 | ||||||
Minority interest | 101,167 | 12,048 | ||||||
|
|
|
| |||||
Total net equity | 5,262,533 | 1,457,372 | ||||||
|
|
|
| |||||
Total liabilities and equity | 19,642,024 | 7,648,659 | ||||||
|
|
|
| |||||
LATAM Airlines Group S.A. 2Q12
![]()
LAN Airlines S.A.
Consolidated Operational Statistics
| For the three month period ended | For the six month period ended | |||||||||||||||||||||||
| June 30 | June 30 | |||||||||||||||||||||||
| 2012 | 2011 | % Change | 2012 | 2011 | % Change | |||||||||||||||||||
System | ||||||||||||||||||||||||
ATKs (millions) | 2,484 | 2,440 | 1.8 | % | 5,124 | 4,925 | 4.0 | % | ||||||||||||||||
ASKs (millions) | 12,318 | 11,236 | 9.6 | % | 25,775 | 23,330 | 10.5 | % | ||||||||||||||||
RTKs (millions) | 1,784 | 1,685 | 5.9 | % | 3,651 | 3,415 | 6.9 | % | ||||||||||||||||
RPKs (millions) | 10,117 | 8,722 | 16.0 | % | 21,268 | 18,508 | 14.9 | % | ||||||||||||||||
Overall Load Factor (based on ATKs) % | 71.8 | % | 69.1 | % | 2.7 pp | 71.2 | % | 69.4 | % | 1.9 pp | ||||||||||||||
Break-Even Load Factor (based on ATK) % | 71.4 | % | 67.8 | % | 3.7 pp | 69.2 | % | 65.5 | % | 3.7 pp | ||||||||||||||
Yield based on RTKs (US Cents) | 79.0 | 77.4 | 2.1 | % | 79.8 | 76.9 | 3.8 | % | ||||||||||||||||
Operating Revenues per ATK (US Cents) | 56.7 | 53.4 | 6.1 | % | 56.9 | 53.4 | 6.6 | % | ||||||||||||||||
Operating Costs per ATK (US Cents) | 57.9 | 53.6 | 8.0 | % | 56.5 | 51.8 | 9.2 | % | ||||||||||||||||
Fuel Gallons Consumed (millions) | 140.4 | 133.4 | 5.2 | % | 289.9 | 272.5 | 6.4 | % | ||||||||||||||||
Average Trip Length (thousands km) | 1.669 | 1.716 | -2.7 | % | 1.700 | 1.743 | -2.4 | % | ||||||||||||||||
Total Number of Employees | 22,489 | 20,808 | 8.1 | % | 22,489 | 20,808 | 8.1 | % | ||||||||||||||||
Passenger | ||||||||||||||||||||||||
ASKs (millions) | 12,318 | 11,236 | 9.6 | % | 25,775 | 23,330 | 10.5 | % | ||||||||||||||||
RPKs (millions) | 10,117 | 8,722 | 16.0 | % | 21,268 | 18,508 | 14.9 | % | ||||||||||||||||
RTKs (millions) | 910 | 792 | 14.9 | % | 1,913 | 1,671 | 14.5 | % | ||||||||||||||||
Passengers Transported (thousands) | 6,062 | 5,082 | 19.3 | % | 12,510 | 10,621 | 17.8 | % | ||||||||||||||||
Load Factor (based on ASKs) % | 82.1 | % | 77.6 | % | 4.5 pp | 82.5 | % | 79.3 | % | 3.2 pp | ||||||||||||||
Yield based on RPKs (US Cents) | 10.1 | 10.3 | -1.4 | % | 10.2 | 10.1 | 0.5 | % | ||||||||||||||||
Yield based on RTKs (US Cents) | 112.8 | 113.3 | -0.4 | % | 113.2 | 112.2 | 0.8 | % | ||||||||||||||||
Revenues per ASK (US cents) | 8.3 | 8.0 | 4.4 | % | 8.4 | 8.0 | 4.5 | % | ||||||||||||||||
Cargo | ||||||||||||||||||||||||
ATKs (millions) | 1,255 | 1,296 | -3.2 | % | 2,536 | 2,549 | -0.5 | % | ||||||||||||||||
RTKs (millions) | 874 | 893 | -2.2 | % | 1,738 | 1,744 | -0.4 | % | ||||||||||||||||
Tons Transported (thousands) | 220 | 216 | 1.9 | % | 430 | 422 | 1.8 | % | ||||||||||||||||
Load Factor (based on ATKs) % | 69.6 | % | 68.9 | % | 0.7 pp | 68.5 | % | 68.4 | % | 0.1 pp | ||||||||||||||
Yield based on RTKs (US Cents) | 43.7 | 45.5 | -3.9 | % | 43.2 | 43.2 | 0.0 | % | ||||||||||||||||
Revenues per ATK (US Cents) | 30.5 | 31.4 | -2.9 | % | 29.6 | 29.5 | 0.1 | % | ||||||||||||||||
LATAM Airlines Group S.A. 2Q12
![]()
TAM S.A.
Consolidated Operational Statistics
| For the three month period ended | ||||||||||||
| June 30 | ||||||||||||
| 2012 | 2011 | % Change | ||||||||||
Passenger | ||||||||||||
ASKs (millions) | 19,303 | 19,475 | -0.9 | % | ||||||||
RPKs (millions) | 14,285 | 14,393 | -0.7 | % | ||||||||
Passengers Transported (thousands) | 9,094 | 9,628 | -5.6 | % | ||||||||
Load Factor % | 74.0 | % | 73.9 | % | 0.1pp | |||||||
Break-Even Load Factor % 1 | 85.8 | % | 75.5 | % | 10.3pp | |||||||
Yield based on RPKs (Br Cents)1 | 19.9 | 17.4 | 14.1 | % | ||||||||
Revenues per ASK (Br cents) | 14.7 | 12.9 | 14.3 | % | ||||||||
Operating Costs per ASK (Br Cents) | 18.2 | 15.6 | 16.5 | % | ||||||||
Fuel Gallons Consumed (millions) | 171.5 | 173.4 | -1.1 | % | ||||||||
Average Trip Length (thousands km) | 1.571 | 1.495 | 5.1 | % | ||||||||
Total Number of Employees | 30,270 | 29,336 | 3.2 | % | ||||||||
Domestic Operation | ||||||||||||
ASKs (millions) | 11,810 | 11,956 | -1.2 | % | ||||||||
RPKs (millions) | 8,215 | 8,269 | -0.7 | % | ||||||||
Load Factor % | 69.6 | % | 69.2 | % | 0.4pp | |||||||
Yield based on RPKs (Br Cents)1 | 21.4 | 18.7 | 14.3 | % | ||||||||
Revenues per ASK (US cents) | 14.9 | 12.9 | 15.0 | % | ||||||||
International Operation | ||||||||||||
ASKs (millions) | 7,493 | 7,519 | -0.3 | % | ||||||||
RPKs (millions) | 6,070 | 6,123 | -0.9 | % | ||||||||
Load Factor % | 81.0 | % | 81.4 | % | -0.4pp | |||||||
Yield based on RPKs (Br Cents)1 | 17.8 | 15.7 | 13.8 | % | ||||||||
Revenues per ASK (US cents) | 14.5 | 12.8 | 13.2 | % | ||||||||
Note 1: Does not include taxes and other deductions
LATAM Airlines Group S.A. 2Q12
![]()
LATAM Airlines Group S.A.
Consolidated Fleet
| As of June 30, 2012 | ||||||||||||
| Off-Balance | On-Balance | Total | ||||||||||
Passenger Aircraft | ||||||||||||
Dash 8-200 | 10 | 0 | 10 | |||||||||
Dash 8-Q400 | 4 | 0 | 4 | |||||||||
Boeing 737-700 | 6 | 0 | 6 | |||||||||
Airbus A318-100 | 0 | 10 | 10 | |||||||||
Airbus A319-100 | 14 | 42 | 56 | |||||||||
Airbus A320-200 | 68 | 68 | 136 | |||||||||
Airbus A321-200 | 1 | 8 | 9 | |||||||||
Airbus A330-200 | 2 | 18 | 20 | |||||||||
Boeing 767-300 | 10 | 33 | 43 | |||||||||
Airbus A340-300/500 | 1 | 6 | 7 | |||||||||
Boeing 777-300 ER | 0 | 4 | 4 | |||||||||
|
|
|
|
|
| |||||||
TOTAL | 116 | 189 | 305 | |||||||||
Cargo Aircraft | ||||||||||||
Boeing 777-200F | 2 | 0 | 2 | |||||||||
Boeing 767-300F | 4 | 0 | 4 | |||||||||
|
|
|
|
|
| |||||||
TOTAL | 6 | 0 | 6 | |||||||||
TOTAL FLEET | 122 | 189 | 311 | |||||||||
|
|
|
|
|
| |||||||
Note: Table does not include one Boeing 767-200 leased to Aerovías de México S.A.
LATAM Airlines Group S.A. 2Q12
SIGNATURE
Pursuant to the requirements of the Securities Exchange Act of 1934, the registrant has duly caused this report to be signed on its behalf by the undersigned, thereunto duly authorized.
Date: August 10, 2012
LATAM AIRLINES GROUP S.A. | ||||
| By: | /s/ Alejandro de la Fuente | |||
| Name: | Alejandro de la Fuente | |||
| Title: | Chief Financial Officer | |||