| Solid Company Timely Investment | ||
Financial Community Update New York City | ||
Eugene R. McGrath Chairman, President and Chief Executive Officer | ||
March 8, 2002 | ||
[CONEDISON LOGO] |
| This presentation contains forward-looking statements, which are statements of future expectations and not facts. Actual results or developments might differ materially from those included in the forward-looking statements because of factors such as competition and industry restructuring, changes in economic conditions, changes in historical weather patterns, changes in laws, regulations or regulatory policies, developments in legal or public policy doctrines, technological developments and other presently unknown or unforeseen factors. Other risk factors are detailed from time to time in the company's SEC reports. |
[CONEDISON LOGO]
| Consolidated Edison, Inc. | ||
Business Profile Long-term Strategy Financial Strength Supply/Demand Outlook Recovery from WTC |
[CONEDISON LOGO]
| Our Business Profile Regulated Business Service Area | ||
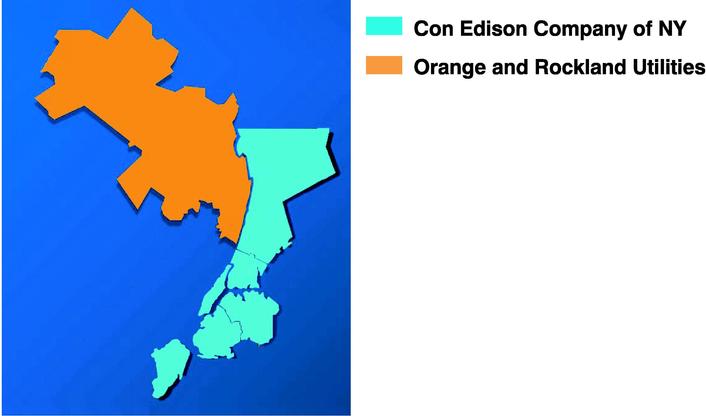 | ||
| Con Edison Company of NY 3.2 million electric customers 1.1 million gas customers 1,850 steam customers | ||
Orange and Rockland Utilities 280,000 electric customers 120,000 gas customers |
[CONEDISON LOGO]
Our Business Profile
A Compelling Investment
Strong financial base
A+ bond rating
Dependable, growing dividend
Good regulatory relations
Solid management team
Experienced, knowledgeable field force
Consistent, disciplined business strategy
[CONEDISON LOGO]
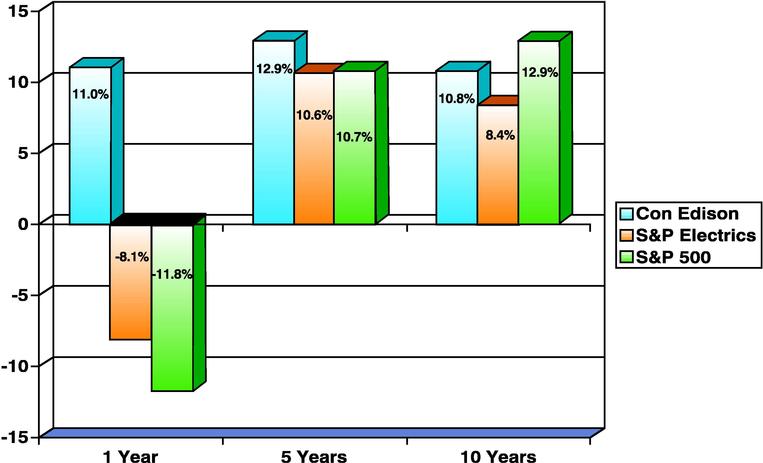
Total Return to Shareholders
Average annual total returns for periods ending December 31, 2001
[CONEDISON LOGO]
Our Long-term Strategy
Maximize value of regulated T&D assets
Focus on infrastructure needs
Leverage strong expertise to create unregulated opportunities
Conservative and disciplined growth strategy
[CONEDISON LOGO]
Long-term Annual Growth Target
3%-5% Growth Target
• Maximize Value of T&D Assets
• Economic Recovery
• Efficiencies
• Unregulated Businesses
[CONEDISON LOGO]
Maximizing the Value of Our Regulated Assets
More than $1 billion in annual infrastructure investment
East River repowering
Net addition of 200 MW of in-city generation
Completion expected in 2003
Sale of First Avenue properties
Net cash proceeds of $396 million
[CONEDISON LOGO]
Rate Agreements Provide Long-term Regulatory Stability
Rate Agreements Ending:
| Con Edison Electric | March 2005 | ||
| Con Edison Gas | September 2004 | * | |
| Con Edison Steam | September 2004 | ||
| O&R Electric | December 2002 | ||
| O&R Gas | September 2003 |
*Currently before Administrative Law Judge for approval
[CONEDISON LOGO]
Managing Business Risk
Indian Point sold
Reduced risk from ownership
Attractive energy contract for 3 years
New York supply situation stable
Power prices less volatile
Recovery of purchased power costs
Moderate unregulated investments
[CONEDISON LOGO]
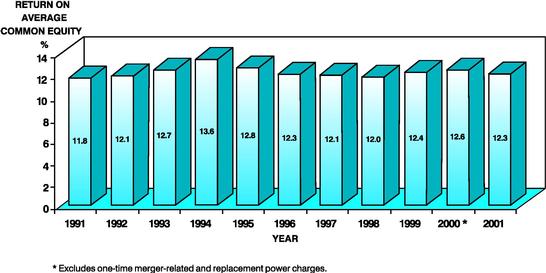
Consolidated Edison, Inc.
Return on Equity
Our Financial Strength
Utilize Strong Capital Structure
![Graph[nc_cad,228]Capital Structure](https://capedge.com/proxy/8-K/0000912057-02-009162/g526425.jpg)
[CONEDISON LOGO]
Our Strategy
Our "Wires and Pipes" Businesses Provide a Strong Foundation for Future Growth
![Graph[nc_cad,228]Future Growth](https://capedge.com/proxy/8-K/0000912057-02-009162/g713104.jpg)
[CONEDISON LOGO]
Strategic Plant Locations
1. Newington, NH
2. Springfield, MA
3. Lakewood, NJ
4. Rock Springs, MD
![GRAPH[nc_cad,228]Plant Locations](https://capedge.com/proxy/8-K/0000912057-02-009162/g543217.jpg)
[CONEDISON LOGO]
CEC Network Map—1Q2002
![GRAPH[nc_cad,228]Network Map](https://capedge.com/proxy/8-K/0000912057-02-009162/g86479.jpg)
1. 60 buildings connected to the network
2. 106 miles of fiber installed
3. 50 miles of fiber acquired through swaps
4. Jersey City ring
[CONEDISON LOGO]
Our Supply/Demand Outlook
New York State
18% capacity reserve in excess of peak load
Status for summer of 2002—adequate
New York City
80% of peak load from in-city supply
Additional 20% plus 18% reserve can be from outside NYC
Status for summer of 2002—tight but adequate
[CONEDISON LOGO]
Our Supply/Demand Outlook
Service Area Peak Load Forecast
![GRAPH[nc_cad,228]Peak Load Forecast](https://capedge.com/proxy/8-K/0000912057-02-009162/g522527.jpg)
[CONEDISON LOGO]
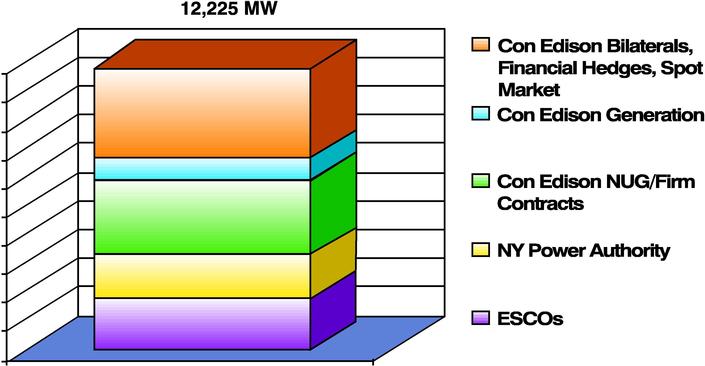
Customer Supply Responsibilities
On 2002 Peak Day
[CONEDISON LOGO]
[CONEDISON LOGO]
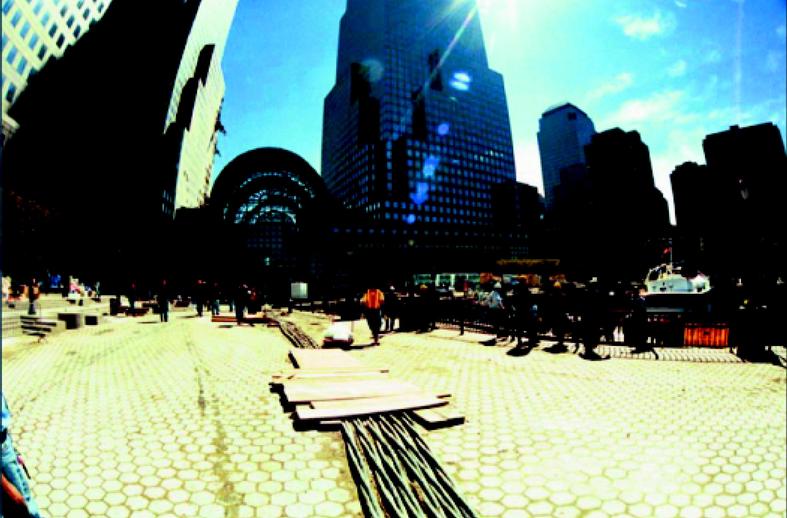
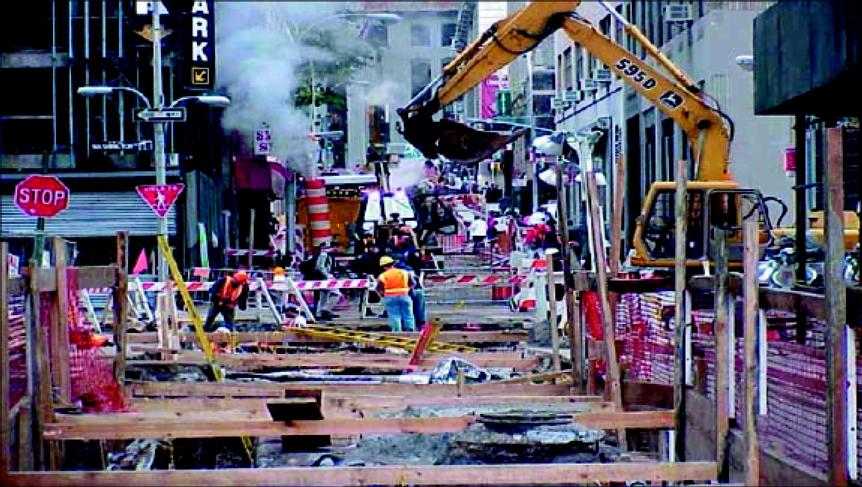
Temporary Restoration Work
[CONEDISON LOGO]
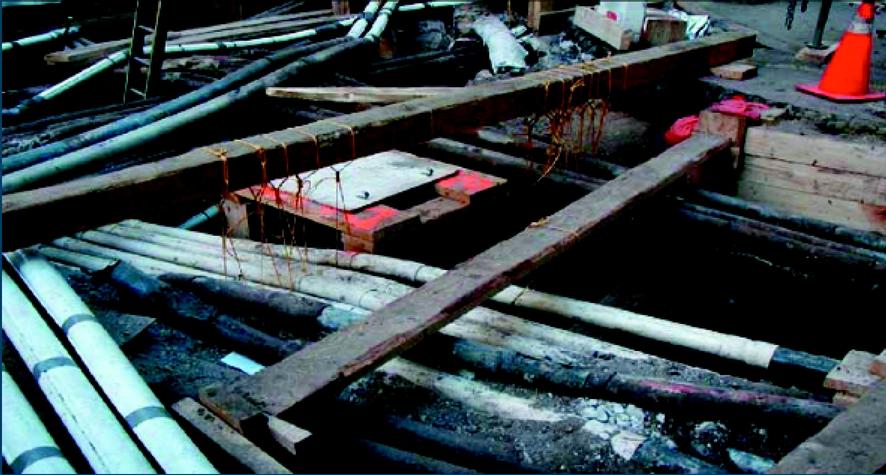
Permanent Restoration Challenges
[CONEDISON LOGO]
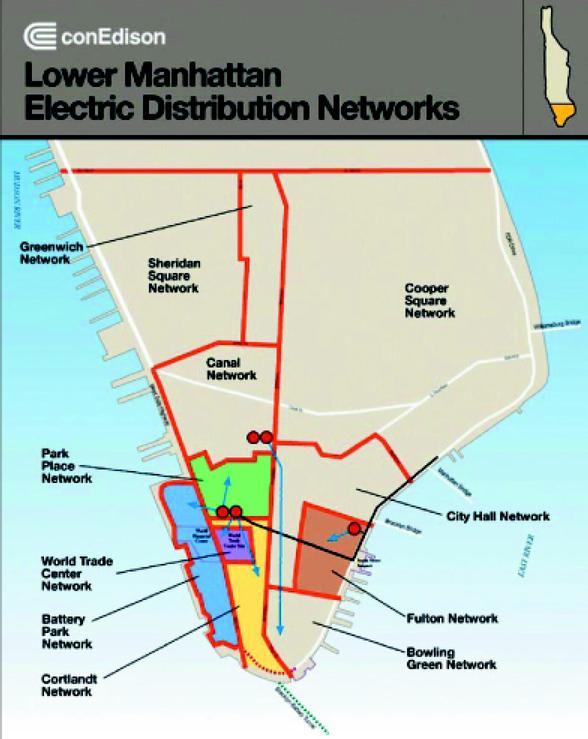
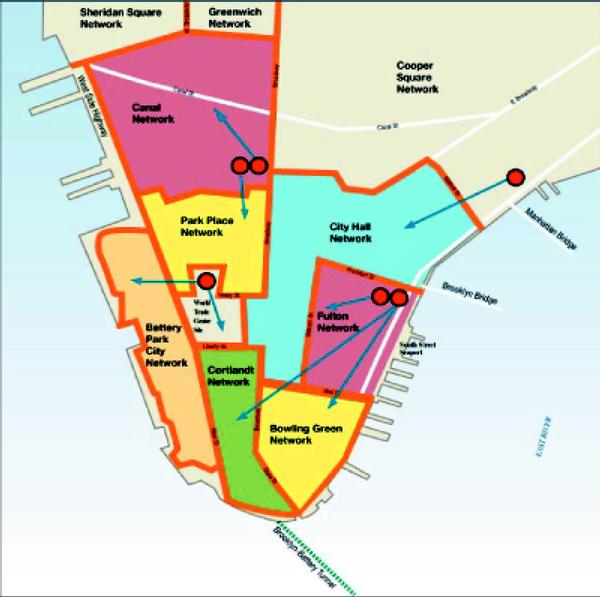
Lower Manhattan Network
Long-term Configuration
[CONEDISON LOGO]
Working 24/7 to Meet Targets
[CONEDISON LOGO]
Response to September 11
Cost of Restoration
$400 million—mostly capital—includes:
Emergency response, temporary restoration and permanent replacement of facilities
Seeking Federal reimbursement
At December 31, 2001:
$55 million capitalized
$32 million deferred as regulatory asset
[CONEDISON LOGO]
Our Value
Con Edison's Track Record
Delivered on expectations
28 consecutive years of dividend increases
Most reliable electric delivery system
Accretive acquisition of O&R
Successful transition to restructured marketplace
Disciplined management
[CONEDISON LOGO]
[CONEDISON LOGO]