Exhibit 99.1
Link to searchable text of slide shown above
Link to searchable text of slide shown above
Link to searchable text of slide shown above

Link to searchable text of slide shown above
Link to searchable text of slide shown above

Link to searchable text of slide shown above
Link to searchable text of slide shown above
Link to searchable text of slide shown above

Link to searchable text of slide shown above
Link to searchable text of slide shown above
Link to searchable text of slide shown above

Link to searchable text of slide shown above
Link to searchable text of slide shown above
Link to searchable text of slide shown above
Link to searchable text of slide shown above

Link to searchable text of slide shown above
Link to searchable text of slide shown above
Link to searchable text of slide shown above

Link to searchable text of slide shown above
Link to searchable text of slide shown above

Link to searchable text of slide shown above
Link to searchable text of slide shown above

Link to searchable text of slide shown above
Link to searchable text of slide shown above

Link to searchable text of slide shown above

Link to searchable text of slide shown above
Link to searchable text of slide shown above
Link to searchable text of slide shown above
Link to searchable text of slide shown above
Link to searchable text of slide shown above
Link to searchable text of slide shown above
Link to searchable text of slide shown above
Link to searchable text of slide shown above
Link to searchable text of slide shown above
Link to searchable text of slide shown above

Link to searchable text of slide shown above

Link to searchable text of slide shown above
Link to searchable text of slide shown above

Link to searchable text of slide shown above
Link to searchable text of slide shown above

Link to searchable text of slide shown above

Link to searchable text of slide shown above
Searchable text section of graphics shown above
Exhibit 99.1
Berenson Minella & Company and
The Williams Capital Group, L.P.
Annual Public Utility Seminar
Boston, MA
Joan S. Freilich
Executive Vice President & Chief Financial Officer
February 11, 2003
[LOGO]
This presentation contains forward-looking statements, which are statements of future expectations and not facts. Actual results or developments might differ materially from those included in the forward-looking statements because of factors such as competition and industry restructuring, changes in economic conditions, changes in historical weather patterns, changes in laws, regulations or regulatory policies, developments in legal or public policy doctrines, technological developments and other presently unknown or unforeseen factors. Other risk factors are detailed from time to time in the company’s SEC reports.
2
• Value as investment
• Core strengths
• Maintaining our edge
• Balance sheet strength and flexibility
3
| ED | |
Stock price (52-week range) |
| $32.65-$46.02 |
Shares outstanding |
| 214 million |
Market capitalization |
| $8 billion |
P/E ratio (2002E First Call) |
| 13.5x |
Current dividend yield |
| 5.6% |
4
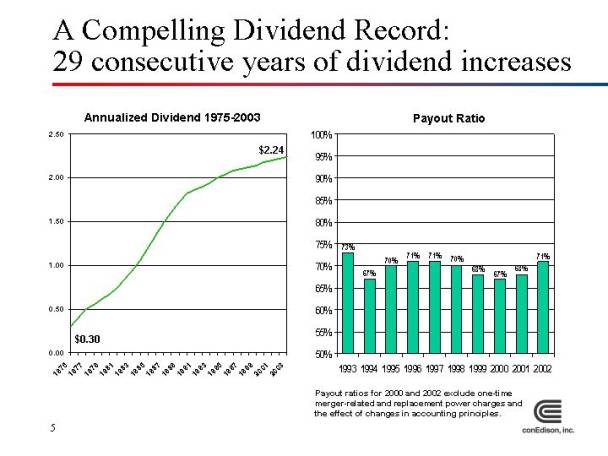
A Compelling Dividend Record:
29 consecutive years of dividend increases
Annualized Dividend 1975-2003
[CHART]
Payout Ratio
[CHART]
Payout ratios for 2000 and 2002 exclude one-time merger-related and replacement power charges and the effect of changes in accounting principles.
5
Average annual total returns for periods ending December 31, 2002
[CHART]
6
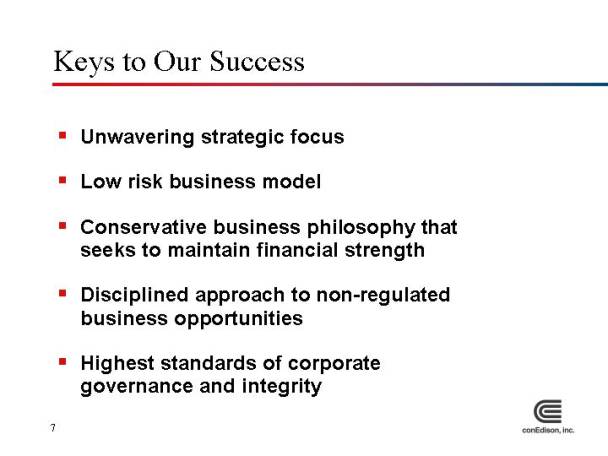
• Unwavering strategic focus
• Low risk business model
• Conservative business philosophy that seeks to maintain financial strength
• Disciplined approach to non-regulated business opportunities
• Highest standards of corporate governance and integrity
7
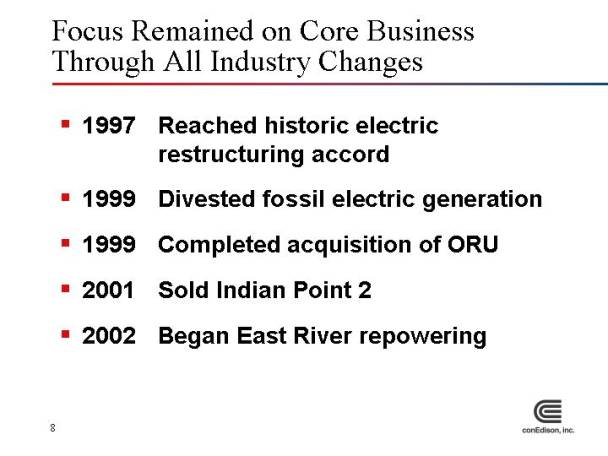
Focus Remained on Core Business Through All Industry Changes
• 1997 Reached historic electric restructuring accord
• 1999 Divested fossil electric generation
• 1999 Completed acquisition of ORU
• 2001 Sold Indian Point 2
• 2002 Began East River repowering
8
[PHOTO]
9
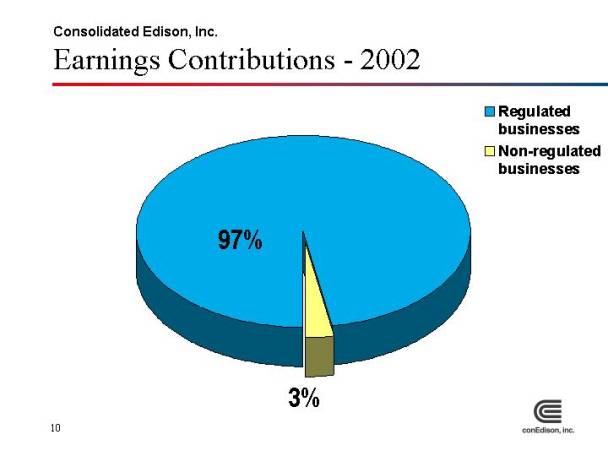
Consolidated Edison, Inc.
Earnings Contributions—2002
[CHART]
10
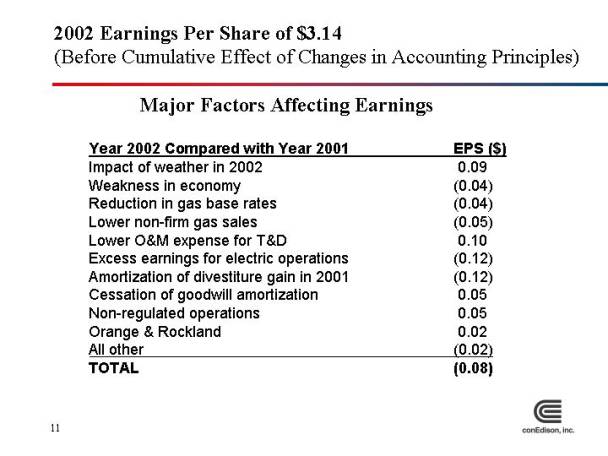
2002 Earnings Per Share of $3.14
(Before Cumulative Effect of Changes in Accounting Principles)
Major Factors Affecting Earnings
Year 2002 Compared with Year 2001 |
| EPS ($) |
| |
Impact of weather in 2002 |
| 0.09 |
| |
Weakness in economy |
| (0.04 | ) | |
Reduction in gas base rates |
| (0.04 | ) | |
Lower non-firm gas sales |
| (0.05 | ) | |
Lower O&M expense for T&D |
| 0.10 |
| |
Excess earnings for electric operations |
| (0.12 | ) | |
Amortization of divestiture gain in 2001 |
| (0.12 | ) | |
Cessation of goodwill amortization |
| 0.05 |
| |
Non-regulated operations |
| 0.05 |
| |
Orange & Rockland |
| 0.02 |
| |
All other |
| (0.02 | ) | |
TOTAL |
| (0.08 | ) | |
11
2003 Earnings Guidance
$2.90 - $3.05 per share includes:
• Anticipated decrease net after-tax in pension and OPEB credits of $54 million, or $0.25 per share
• Decline of 8.6 percent in the market value of pension plan assets for the year 2002
• Decrease in the assumed future annual return from 9.2 percent to 8.8 percent
• Increase in retiree health benefit costs
12
Business Profile
Regulated Business Service Area
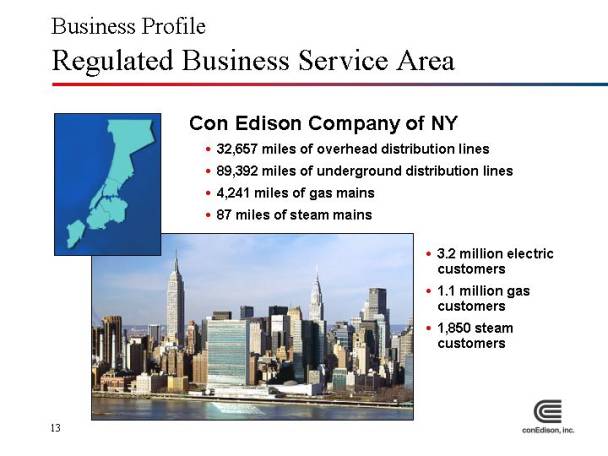
Con Edison Company of NY
• 32,657 miles of overhead distribution lines
• 89,392 miles of underground distribution lines
• 4,241 miles of gas mains
• 87 miles of steam mains
• 3.2 million electric customers
• 1.1 million gas customers
• 1,850 steam customers
[MAP]
[PHOTO]
13
Business Profile
Regulated Business Service Area
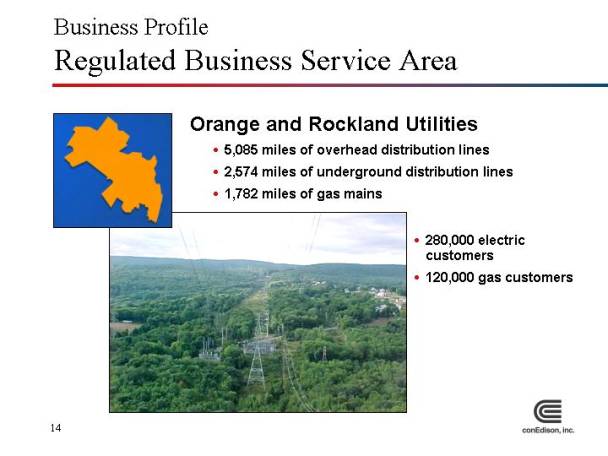
Orange and Rockland Utilities
• 5,085 miles of overhead distribution lines
• 2,574 miles of underground distribution lines
• 1,782 miles of gas mains
• 280,000 electric customers
• 120,000 gas customers
[MAP]
[PHOTO]
14
Key Drivers of Core Business Success
• Underlying strength of local economy
• Regulatory stability
• Strong cost controls
• Efficiencies from new technologies
• Dependable cash flow
15
Demand for New Housing Remains Strong
[PHOTO]
16
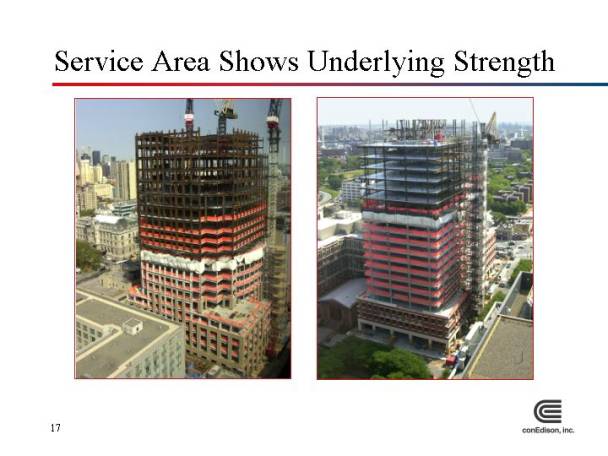
Service Area Shows Underlying Strength
[PHOTO]
[PHOTO]
17
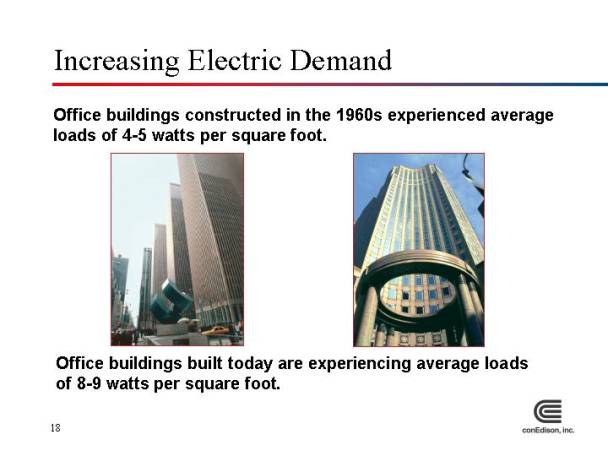
Office buildings constructed in the 1960s experienced average loads of 4-5 watts per square foot.
[PHOTO]
[PHOTO]
Office buildings built today are experiencing average loads of 8-9 watts per square foot.
18
Rate Agreements Provide Long-Term
Regulatory Stability
• Rate agreements ending:
• Con Edison Electric—March 2005
• Con Edison Gas—September 2004
• Con Edison Steam—September 2004
• O& R Electric—December 2002
• O& R Gas—September 2003
• Provide sharing between customer and shareholders above thresholds
• Continue recovery of purchased power and gas supply costs
• Continue gas weather normalization
19
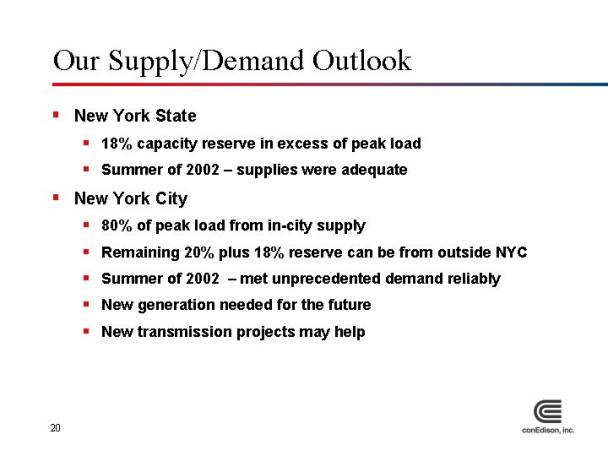
• New York State
• 18% capacity reserve in excess of peak load
• Summer of 2002—supplies were adequate
• New York City
• 80% of peak load from in-city supply
• Remaining 20% plus 18% reserve can be from outside NYC
• Summer of 2002—met unprecedented demand reliably
• New generation needed for the future
• New transmission projects may help
20
New York City Resource Situation
(MW)
|
| 2002 |
| 2003 |
|
|
| Actual |
| Forecast |
|
Peak Load |
| 10,665 |
| 11,020 |
|
Requirement (80%) |
| 8,532 |
| 8,816 |
|
Existing Resources |
| 8,839 |
| 8,878 |
|
New Supplies |
| 44 |
| 0 |
|
Difference |
| 351 |
| 62 |
|
21
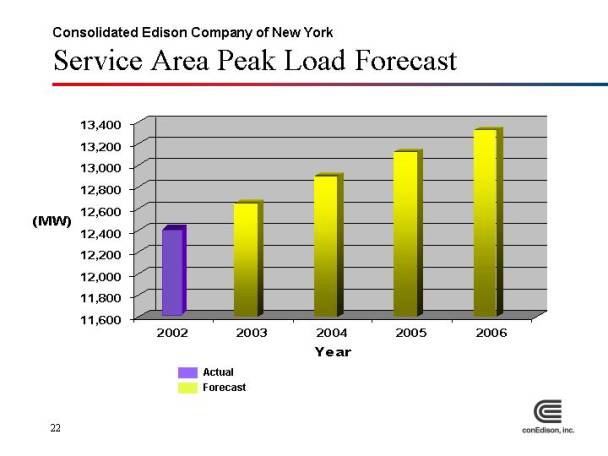
Consolidated Edison Company of New York
Service Area Peak Load Forecast
[CHART]
22
Service Area Historic Record—Peak Loads
Load
Date |
| MW |
|
08/09/01 |
| 12,207 |
|
08/10/01 |
| 12,116 |
|
07/25/01 |
| 12,097 |
|
07/03/02 |
| 12,086 |
|
08/08/01 |
| 12,084 |
|
07/23/02 |
| 12,074 |
|
08/13/02 |
| 11,893 |
|
07/29/02 |
| 11,892 |
|
07/02/02 |
| 11,880 |
|
08/07/01 |
| 11,874 |
|
• Five of top ten peak loads occurred in summer 2002
• June, July, August set three-month electricity sendout record of 17,491,313 MW
• Orange and Rockland Utilities also set records
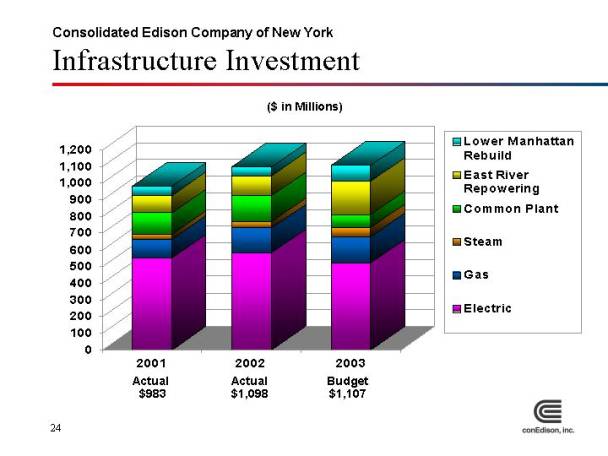
23
[CHART]
24
Cost of Lower Manhattan Restoration
• $400 million—mostly capital—includes:
• Emergency response
• Temporary restoration
• Permanent replacement of facilities
• Federal reimbursement has been approved but not yet disbursed
• Cost incurred as of December 31, 2002
• $212 million
25
Consolidated Edison Company of New York
[CHART]
Note: Indian Point 2 sold in 2001
* Projected
26
Investing for Reliability and Growth
[PHOTO]
27
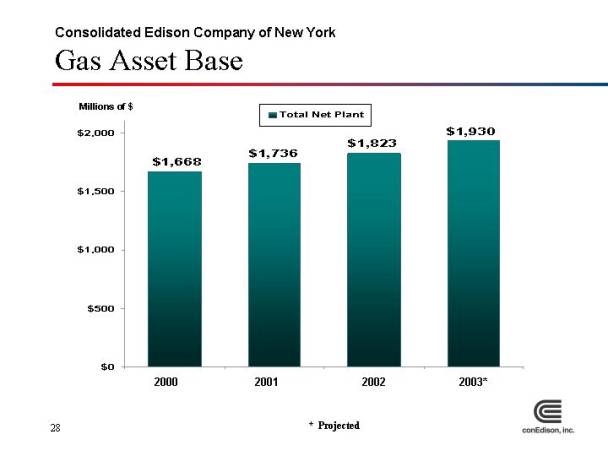
Consolidated Edison Company of New York
Gas Asset Base
[CHART]
* Projected
28
Investing for Reliability and Growth
[PHOTO]
29
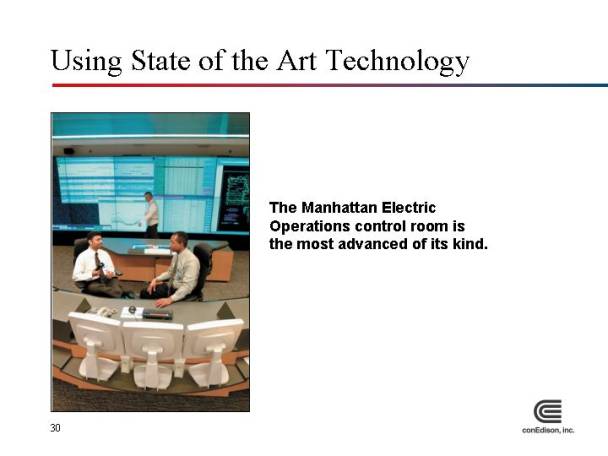
Using State of the Art Technology
[PHOTO]
The Manhattan Electric Operations control room is the most advanced of its kind.
30
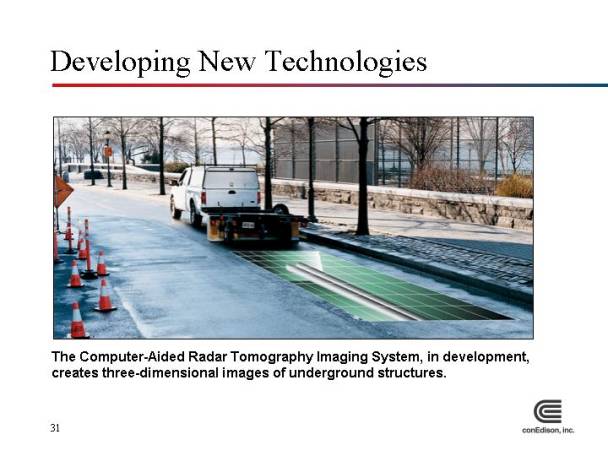
[PHOTO]
The Computer-Aided Radar Tomography Imaging System, in development, creates three-dimensional images of underground structures.
31
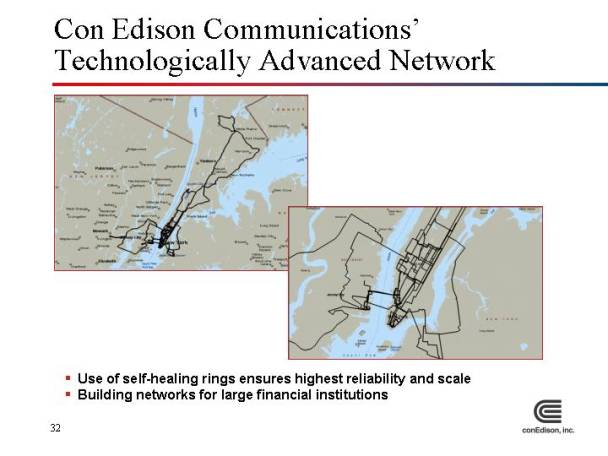
Con Edison Communications’
Technologically Advanced Network
[MAP]
[MAP]
• Use of self-healing rings ensures highest reliability and scale
• Building networks for large financial institutions
32
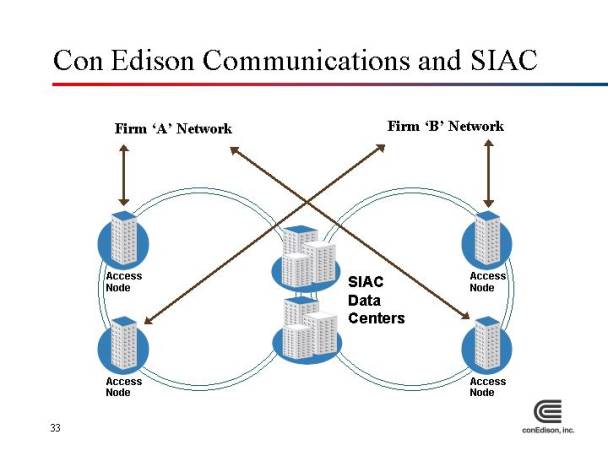
Con Edison Communications and SIAC
[CHART]
33
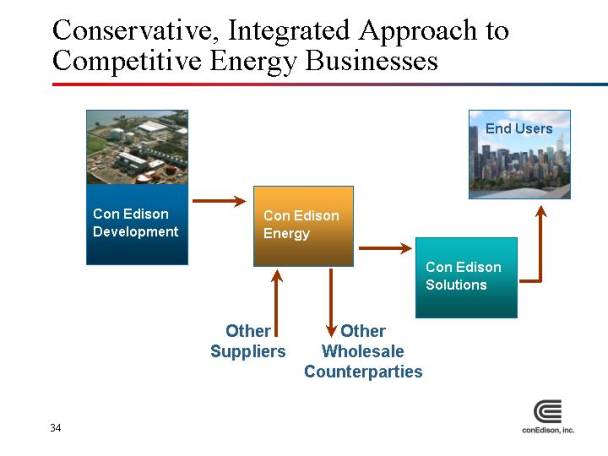
Conservative, Integrated Approach to
Competitive Energy Businesses
[CHART]
34
35
[CHART]
* Budget
36
Steady Cash Flow from Core Business
[CHART]
37
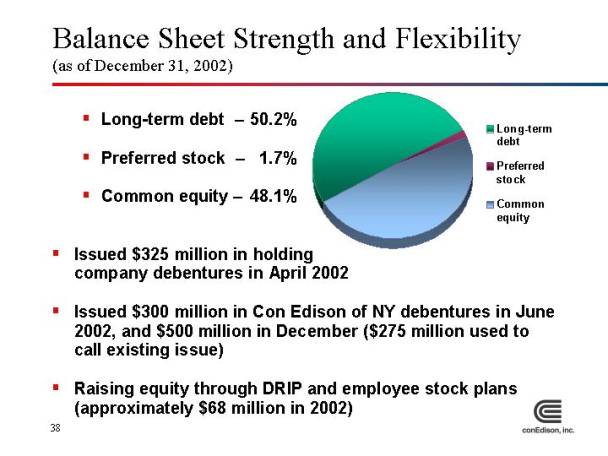
Balance Sheet Strength and Flexibility
(as of December 31, 2002)
• Long- term debt—50.2%
• Preferred stock—1.7%
• Common equity—48.1%
[CHART]
• Issued $325 million in holding company debentures in April 2002
• Issued $300 million in Con Edison of NY debentures in June 2002, and $500 million in December ($275 million used to call existing issue)
• Raising equity through DRIP and employee stock plans (approximately $68 million in 2002)
38
Liquidity
(as of December 31, 2002)
[CHART]
39
• A bond rating—holding company
• A+ bond rating—regulated businesses
• No ratings triggers
• Minimal off balance sheet financing
• Transparent financials
40
• Most reliable electric delivery system
• Focused investment in infrastructure
• Dependable and predictable earnings stream
• Strong balance sheet and solid credit ratings
• Total return for past 10 years more than double industry average
• Stability in the midst of market uncertainty
• Strong credibility in the market
41
42