UNITED STATES
SECURITIES AND EXCHANGE COMMISSION
Washington, D.C. 20549
SCHEDULE 14A
(Rule 14a-101)
INFORMATION REQUIRED IN PROXY STATEMENT
SCHEDULE 14A INFORMATION
Proxy Statement Pursuant to Section 14(a) of the
Securities Exchange Act of 1934
Filed by the Registrant x Filed by a Party other than the Registrant ¨
Check the appropriate box:
| ¨ | Preliminary Proxy Statement | |||
| ¨ | Confidential, For Use of the Commission Only (as permitted by 14a-6(e)(2)) | |||
| ¨ | Definitive Proxy Statement | |||
| x | Definitive Additional materials | |||
| ¨ | Soliciting Material Pursuant to § 240.14a-12 | |||
| ANWORTH MORTGAGE ASSET CORPORATION | ||||
| (Name of Registrant as Specified in Its Charter) | ||||
| Payment of filing fee (Check the appropriate box): | ||||
| x | No fee required. | |||
| ¨ | Fee computed on table below per Exchange Act Rules 14a-6(i)(1) and 0-11. | |||
| (1) | Title of each class of securities to which transaction applies:
| |||
| ||||
| (2) | Aggregate number of securities to which transaction applies:
| |||
| ||||
| (3) | Per unit price or other underlying value of transaction computed pursuant to Exchange Act Rule 0-11 (set forth the amount on which the filing fee is calculated and state how it was determined):
| |||
| ||||
| (4) | Proposed maximum aggregate value of transaction:
| |||
| ||||
| (5) | Total fee paid: | |||
| ||||
| ¨ | Fee paid previously with preliminary materials: | |||
| ¨ | Check box if any part of the fee is offset as provided by Exchange Act Rule 0-11(a)(2) and identify the filing for which the offsetting fee was paid previously. Identify the previous filing by registration statement number, or the form or schedule and the date of its filing. | |||
| (1) | Amount previously paid:
| |||
| ||||
| (2) | Form, schedule or registration statement no.:
| |||
| ||||
| (3) | Filing party:
| |||
| ||||
| (4) | Date filed:
| |||
| ||||
Anworth Asset Management Corporation (“Anworth”) furnished on May 2, 2014 the investor presentation filed herewith as definitive additional proxy materials, to each of Institutional Shareholder Services Inc., Glass, Lewis & Co. and Egan Jones. The investor presentation also is being furnished to, and will be used at certain meetings after the date hereof with, certain stockholders of Anworth in connection with Anworth’s 2014 annual meeting of stockholders to be held on May 22, 2014.
The investor presentation contains forward-looking statements within the meaning of Section 27A of the Securities Act of 1933, as amended, and Section 21E of the Securities Exchange Act of 1934, as amended, and, as such, may involve known and unknown risks, uncertainties and assumptions. These forward-looking statements relate to Anworth’s current expectations and are subject to the limitations and qualifications set forth in the investor presentation as well as in Anworth’s other documents filed with the U.S. Securities and Exchange Commission, including, without limitation, that actual events and/or results may differ materially from those projected in such forward-looking statements.
 Investor Presentation May 2, 2014 |
 Today’s attendees 1 Chairman, President and CEO since formation in 1997 Chairman, CIO and co-founder of Pacific Income Advisers (PIA), an investment advisory firm, and Chairman of Syndicated Capital, Inc., a registered broker-dealer Holds a Bachelor of Science in Statistics from Stanford University and a Masters in Business Administration from the University of Tennessee A Chartered Financial Analyst charterholder and a Certified Employee Benefit Specialist Lloyd McAdams President & CEO Director and EVP since June 2002 and CIO since January 2003 (joining as a VP in June 1998) Joined PIA in 1998 and holds the position of Senior Vice President, with a specialty in mortgage-backed securities Previously employed by DLJ Securities as a mortgage-backed security trader and research analyst Holds a Master of Arts degree in Economics from the University of Chicago and a Bachelor of Science degree in Economics from the Wharton School of Business A Chartered Financial Analyst charterholder Joseph E. McAdams Chief Investment Officer, EVP Partner with Acre Corporation, a private equity commercial real estate firm located in Pleasanton, California From 2005 – 2007, Mr. Maron was a founding principal of Birchmont Capital Advisors, a $1 billion real estate private equity fund Prior to forming Birchmont, spent 23 years in investment banking, leading Credit Suisse’s Los Angeles office and West Coast financial institutions practice Served on the Board of Directors of True Religion Brand Jeans until its sale to a private equity firm in July 2013 Holds a Bachelor of Arts degree from McGill University in Montreal, and holds a Master of Business Administration degree in Finance from the Wharton School of Business Mark Maron New Proposed Board Member Lead independent director with 10 years of REIT experience Is a director of 38 mutual funds managed by Capital Research and Management and is the non-Executive Chairman of American Funds Insurance Series as well as a director of Office Depot Previously the Chairman, President and CEO of Telecredit, Inc., former Chairman of In-Q-Tel, Inc., as well as former Director of the Board of Alex Brown Incorporated and Bankers Trust Corporation Holds a Bachelor of Arts degree from Yale University Lee A Ault, III Lead independent director |
 Discussion agenda Introduction Board of Directors Residential mortgage REIT primer Anworth’s actions, already underway, to continue creating long-term shareholder value Perspectives on Western’s proxy Conclusion 2 |
 Anworth has a diversified Board with strong REIT experience 3 All directors have significant experience in the REIT sector Directors have over 60 years of combined REIT experience REIT experience All directors and nominees possess financial expertise Financial expertise Directors have a strong balance of REIT and large public company Board experience Apart from REITs, directors also have financial, legal and political expertise Strong Board alignment with industry Nominated one new independent director (Mark S. Maron) with extensive real estate and financial services experience Established a Strategic Review Committee comprised of independent directors Refreshed Board Two-thirds of the Board are independent directors 100% independent audit, compensation and nominating/corporate governance committees Lead independent director is rotated annually Majority voting in uncontested elections Governance best practices Minimal anti-take over provisions All directors are elected annually No rights plan Opted out of Maryland Control Share Statute Amendment of “advance notice” provisions requires stockholder approval |
 Anworth has strong independent Board members 4 Lee A. Ault, III has been a director of our company since October 2002. From 1968 to 1992, Mr. Ault was Chief Executive Officer of Telecredit, Inc., a publicly traded payment services company. He also served as President of Telecredit, Inc. from 1968 until 1983 and as Chairman of the Board from 1983 until 1992. From 1999 until 2006, Mr. Ault served as Chairman of the Board of In-Q-Tel, Inc., a technology venture company funded principally by the Central Intelligence Agency (CIA). From 1999 through 2011, Mr. Ault served as a director, and part of the time as Chairman of the Board, of several mutual funds managed by Capital Research and Management Company, a subsidiary of The Capital Group. From 1998 until 2011, Mr. Ault served as a director of Office Depot, Inc. Mr. Ault also served as a director of the following public companies: Alex Brown Incorporated; Bankers Trust Corporation; Equifax, Inc.; Viking Office Products; and Sunrise Medical Corporation. Mr. Ault holds a Bachelor of Arts degree from Yale University. Joe E. Davis has been a director of our company since its formation. He has been a private investor since 1982. Mr. Davis currently serves as a director (since 2000) of Natural Alternatives International, Inc. as well as a member of the Audit Committee (serving as the Chairman of the Audit Committee since 2004), a member of the Human Resources Committee (since 2003) and a member of the Nominating Committee of Natural Alternatives International, Inc. (since 2004). From 1991 to 2007, Mr. Davis served as a director of several mutual funds managed by Capital Research and Management Company. Previously, Mr. Davis served as Chairman of the Board of Linear Corporation (1987-1988); President and Chief Executive Officer of BMC Industries, Inc. (1985); and President and Chief Executive Officer of National Health Enterprises, Inc. (1974-1982). Formerly, Mr. Davis was a director and a member of the Audit Committee of BMC Industries, Inc. and Wilshire Technologies, Inc., and a director of Freymiller Trucking, Inc. Mr. Davis graduated from the University of Texas with a Bachelor of Science in Chemistry. He holds a Master of Business Administration degree from Harvard Graduate School of Business Administration. Robert C. Davis has been a director of our company since May 2005. Mr. Davis has been the Chief Executive Officer of Optimus EMR, Inc. since 2000. Prior to that, he served as Chief Executive Officer and Chairman of the Board of Amcare, Inc. and as a director of Roger Cleveland Golf Company, Inc. Mr. Davis holds both a Master of Business Administration degree in Finance and a Bachelor of Science degree in Accounting from the University of Southern California. Mark S. Maron is a partner with Acre Corporation, a private equity commercial real estate firm located in Pleasanton, California. From September 2005 to December 2007, Mr. Maron was a founding principal of Birchmont Capital Advisors, LLC, (“Birchmont”) a real estate private equity firm focused on multi-family properties. After the fund closed in January 2007, Birchmont was renamed JRK Multifamily and currently has 3 funds outstanding with over $1 billion in equity under management. While no longer actively involved with JRK Multifamily, Mr. Maron remains a General Partner of the fund. Prior to forming Birchmont, Mr. Maron spent 23 years as an investment banker, including 18 years at Credit Suisse, where he ran the firm’s Investment Banking Division in Los Angeles. Mr. Maron served on the Board of Directors of True Religion Brand Jeans until its sale to a private equity firm in July 2013. Mr. Maron holds a Bachelor of Arts degree from McGill University in Montreal, Canada, and holds a Master of Business Administration degree in Finance from the Wharton School of Business. |
 Key takeaways 5 Consistent earnings since inception, despite varying interest rate environments, returning 267% compared to 67% for the FTSE NAREIT Mortgage REITs Index Anworth has provided shareholders with a total return of 68% over the last 5 years In 2014, Anworth has a total return of 34% Anworth’s historical return on average equity is more stable and less volatile than peers Performance Investing in predominately adjustable rate assets funded by hedged liabilities has provided above average long term risk adjusted returns with reduced volatility Management historical focus on maximizing shareholder value through strategic equity issuances and accretive buybacks Established diversification program to balance portfolio in changing interest rate and regulatory environments Strategy Anworth’s management fees are below the average and median of Agency mortgage REITs The Company has established a Strategic Review Committee to enhance portfolio diversification Has retained Credit Suisse to review strategic alternatives A new independent Board member was nominated in Q1 2014 Governance Source: SNL Financial. Market data as of 4/25/14. (1) Peers include CMO, CYS and HTS. |
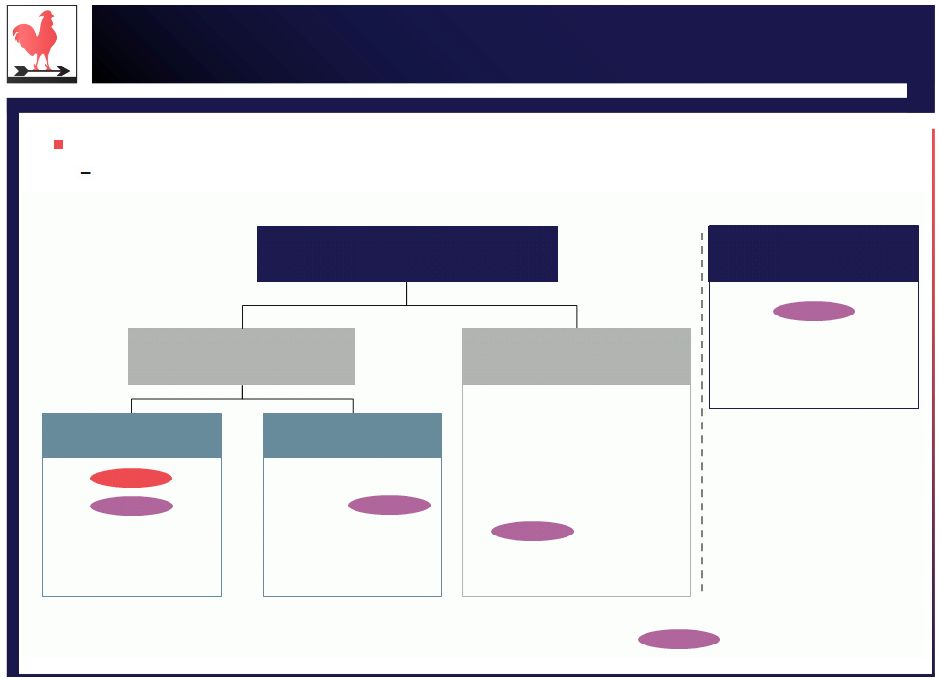 REITs have varying investment strategies 6 Source: Company filings. Market data as of 4/25/14. (1) Includes 15 year fixed rate securities. (2) At the end of 2012 and 2013, AGNC’s portfolio contained fixed rate assets of 64% and 38%, respectively. The chart below is broadly reflective of the current strategies of public mortgage REITs Strategies are continuously evolving as REIT managers adapt to changing market conditions Residential mortgage REITs Agg. market cap: $43.2 billion Agency REITs Agg. market cap: $26.4 billion Agency and non-Agency (Hybrid REITs) Agg. market cap: $16.8 billion AMTG CHMI CIM JMI MFA MTGE NRZ OAKS PMT RWT TWO ZFC DX IVR MITT Diversified mortgage REITs Agg. market cap: $3.0 billion = Peers as defined by Western Principally adjustable rate (1) ANH CMO CYS HTS Principally fixed rate AGNC ARR EARN NLY WMC |
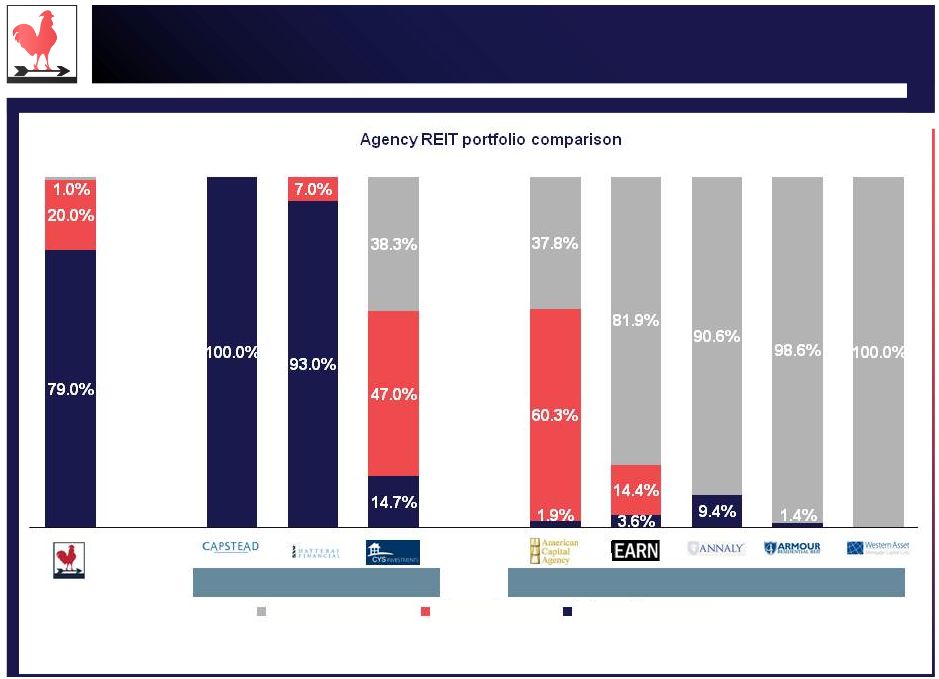 Anworth’s portfolio primarily comprises of adjustable rate securities 7 Source: Company filings for year end 2013. (1) CMO, NLY and ARR do not disclose breakdown of fixed rate portfolio. (2) AGNC’s 20/30 year fixed rate portfolio percentages were over 60% for 2011 and 2012. Peer group Other Agency REITs (1) (1) (1) (2) 20/30 year fixed rate 15 year fixed rate Adjustable rate |
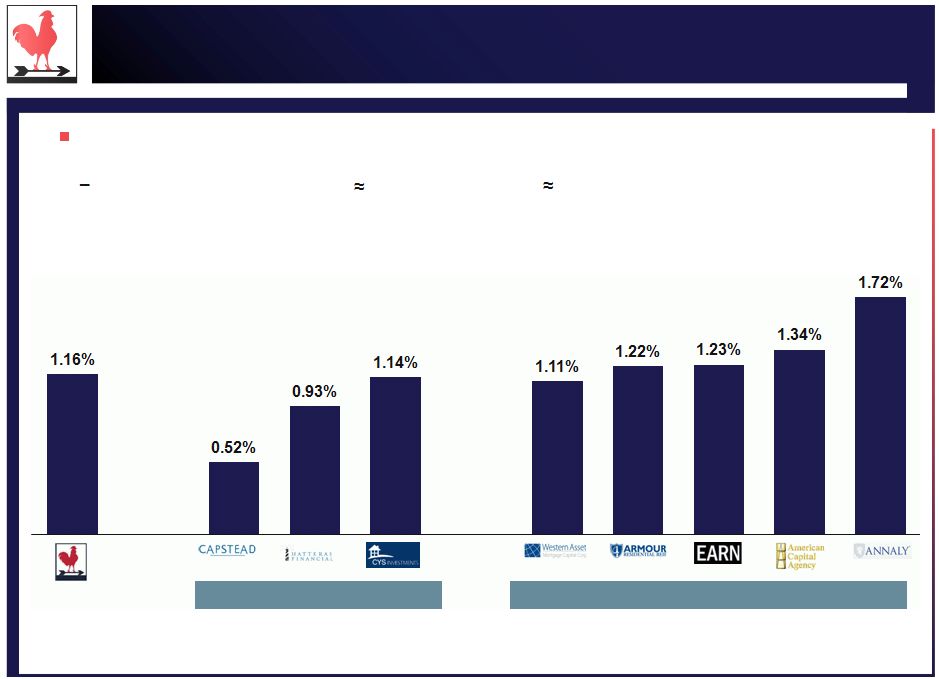
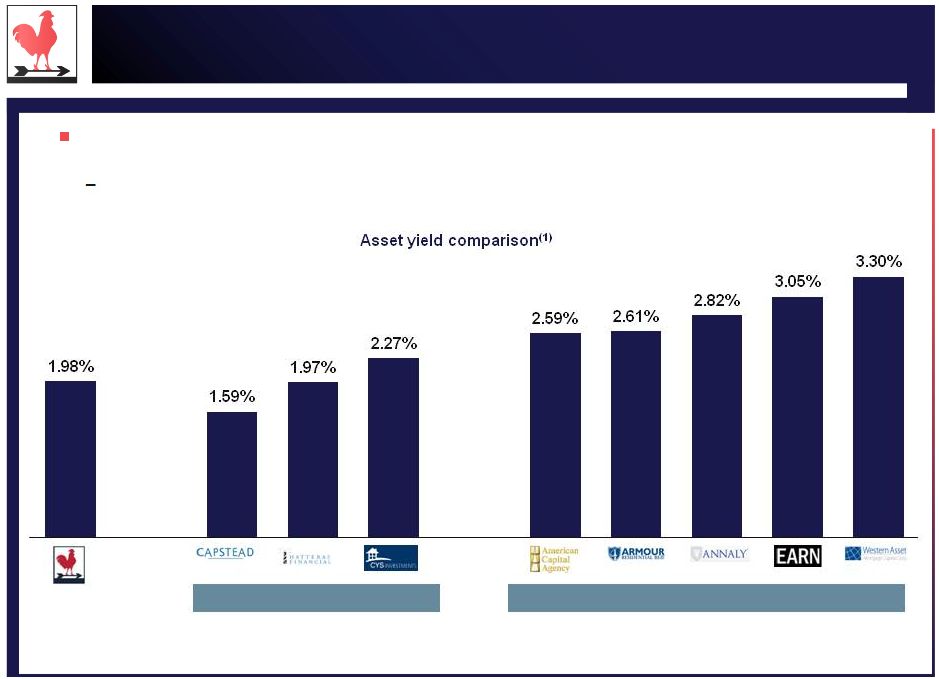 Anworth’s asset yield compares favorably to the peer group 8 Source: Company filings for year end 2013. (1) Asset yield calculated as average of quarterly reported yield in each quarter of 2013, adjusted for amortization of premium, where reported. Peer group Other Agency REITs In the current interest rate environment, fixed rate assets carry higher nominal yields than adjustable rate assets Commensurate with greater interest rate and prepayment risk |
 Anworth’s cost of funds reflects its conservative strategy 9 Source: Company filings for year end 2013. (1) Cost of funds calculated as average of quarterly reported costs in each quarter of 2013. Peer group Other Agency REITs Given the depth and breadth of the repo market, the cost of funds for Agency REITs is highly correlated to the hedging strategy Higher portfolio interest costs longer debt duration lower net portfolio risk Cost of funds comparison (1) |
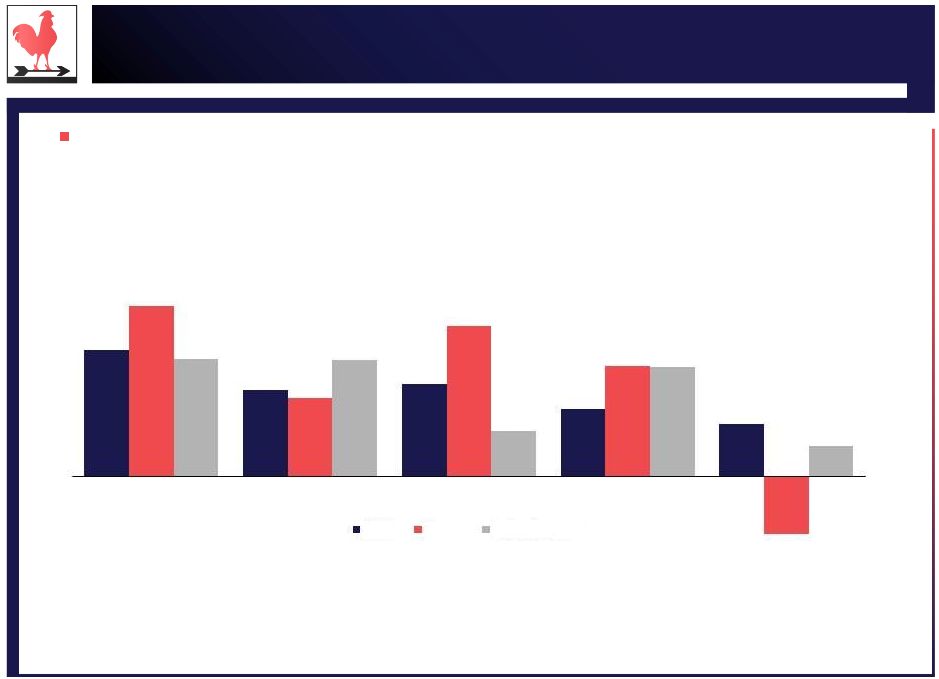 10 Source: Company filings, FactSet and SNL Financial. (1) Return on equity calculated as reported GAAP net income available to common shareholders divided by average total common equity. (2) Average of peers including CMO, CYS and HTS. (3) Average of other Agency including AGNC, ARR, EARN, NLY and WMC. Consequently, Anworth has stable and less volatile returns (2) (3) Over the last 3 years, Anworth has a return on average equity of 10.2%, exceeding peers’ return on average equity of 9.7% 18.2% 12.5% 13.3% 9.7% 7.6% 24.5% 11.3% 21.7% 15.9% (8.3%) 17.0% 16.8% 6.6% 15.8% 4.4% 2009 2010 2011 2012 2013 Return on common equity (1) ANH Peers Other Agency |
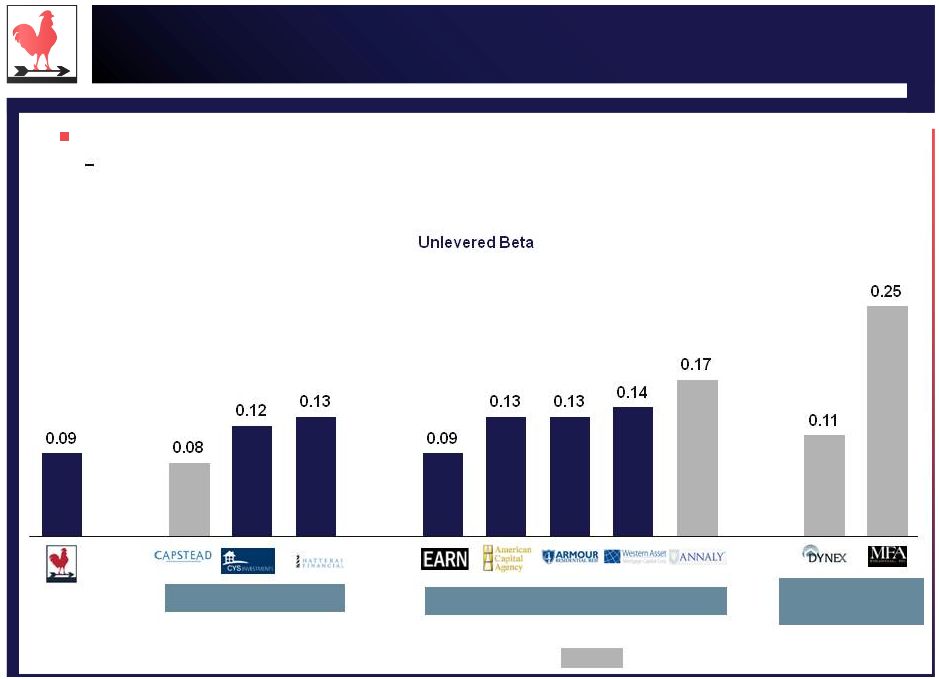 Anworth’s unlevered beta shows the lower volatility of the investment strategy Source: BARRA and company filings for year end 2013. Note: Unlevered betas based on respective company’s capital structure. Peer group Other Agency REITs Anworth’s unlevered beta of 0.09 is lower than peer and other REITs average of 0.13 Western’s peer set has an average beta of 0.14 Western’s other peers 11 = Western’s peers |
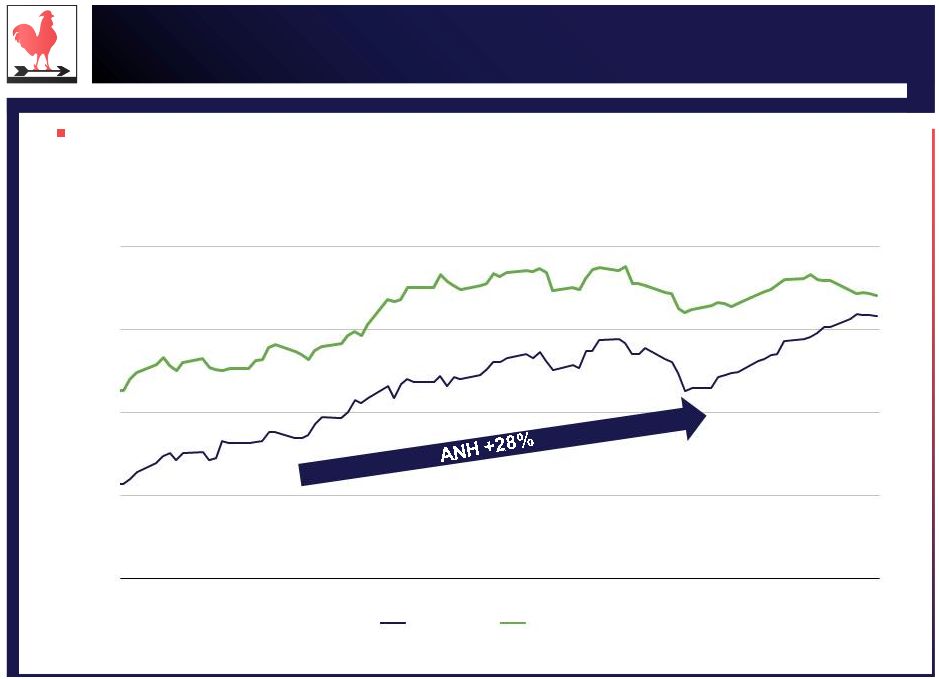
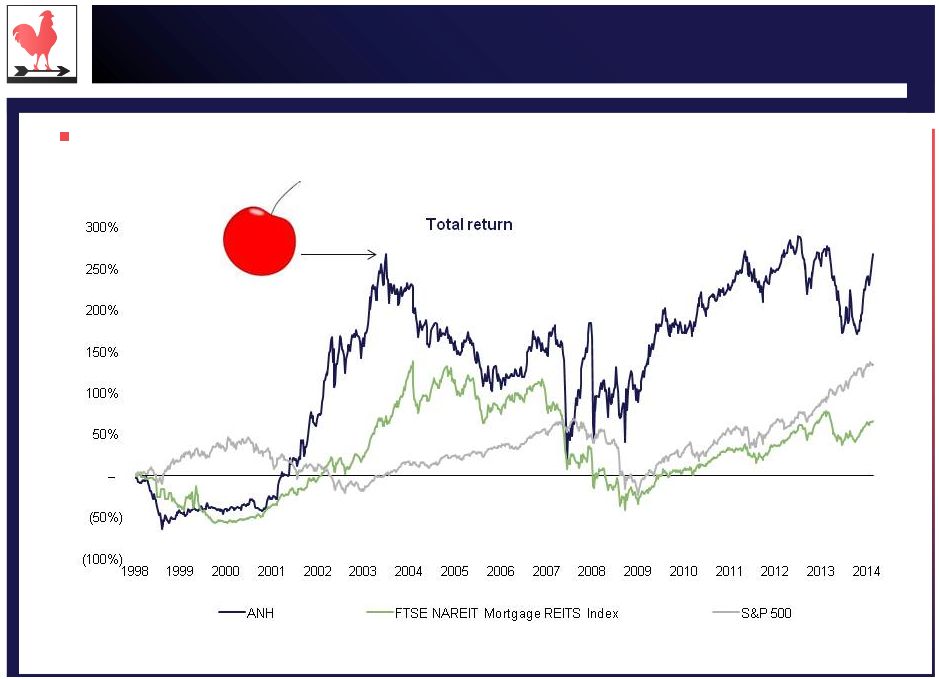 12 Source: Bloomberg data as of 4/25/14. In addition to strong recent total returns, Anworth has significantly outperformed the S&P 500 and the FTSE NAREIT Mortgage REIT index since inception Strong returns since inception 134% 267% 67% Aug. ’03 Western’s comparison date |
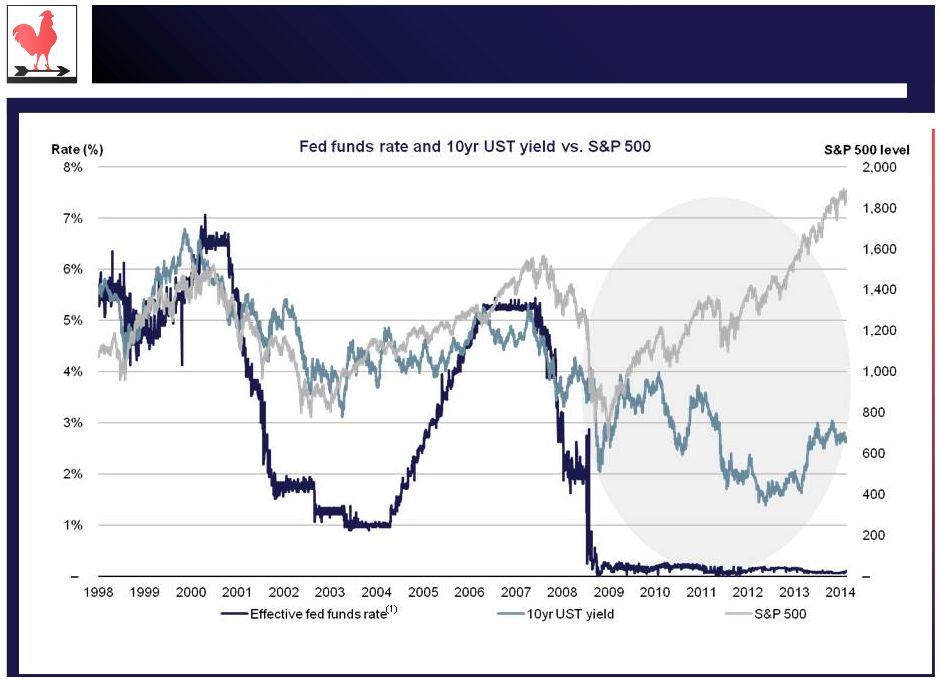 13 Source: FactSet data as of 4/25/14. (1) Effective fed funds rate used instead of target rate. In contrast to pre-crisis levels, we are currently in a very low-rate, rising stock market |
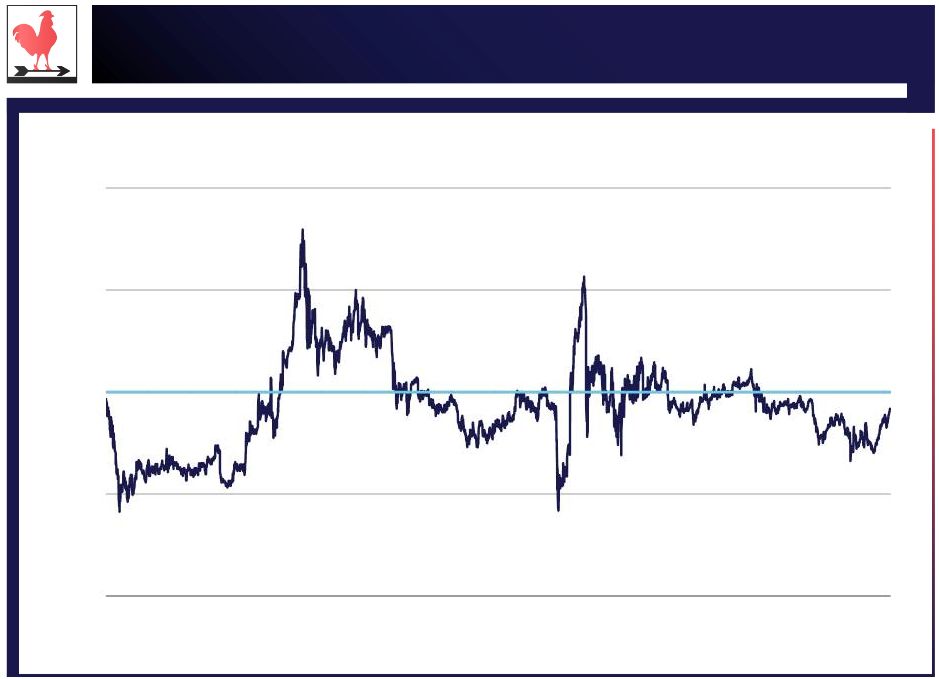 14 Source: SNL Financial data as of 4/25/14. Anworth has traded above book value for a significant amount of its history – 0.50x 1.00x 1.50x 2.00x 1998 1999 2000 2001 2002 2003 2004 2005 2006 2007 2008 2009 2010 2011 2012 2013 ANH price / book value |
 Total return 2014 YTD 1 year 3 years 5 years Since inception ANH 33.9% (2.8%) 8.5% 68.5% 267.4% HTS 23.7% (17.8%) 1.2% 62.0% NA CYS 20.4% (17.7%) 14.8% NA NA CMO 9.5% 9.8% 40.8% 116.8% 200.7% Core peer average 17.9% (8.6%) 18.9% 89.4% 200.7% ANH Rank vs. Core peers 1 of 4 2 of 4 3 of 4 2 of 3 1 of 2 NLY 19.0% (17.0%) (4.2%) 63.6% 592.7% AGNC 21.6% (19.8%) 28.1% 225.5% NA ARR 8.8% (24.1%) (6.8%) (7.4%) NA WMC 2.2% (11.0%) NA NA NA EARN 10.5% (8.7%) NA NA NA Other Agency REITs average 12.4% (16.1%) 5.7% 93.9% 592.7% ANH Rank vs. Core & Other Agency REITs 1 of 9 2 of 9 4 of 7 3 of 6 2 of 3 NLY 19.0% (17.0%) (4.2%) 63.6% 592.7% CMO 9.5% 9.8% 40.8% 116.8% 200.7% MFA 15.6% 1.1% 59.5% 178.4% 469.2% DX 10.6% (6.8%) 29.0% 116.3% (64.1%) Western peer average 13.7% (3.3%) 31.3% 118.8% 299.6% ANH rank vs. Western peers 1 of 5 3 of 5 4 of 5 4 of 5 3 of 5 15 Source: SNL Financial and FactSet data as of 4/25/14. (1) Total return since ANH IPO on 3/11/98. (2) Total return since IPO priced on 5/1/13. Anworth has delivered returns... (1) (2) |
 16 Source: SNL Financial and Bloomberg News. …while others have failed Past mortgage REIT difficulties IPO Date Resolution Agency mortgage REITs Laser Mortgage Management Nov-97 Common stock deregistered Apex Mortgage Capital Dec-97 Merged with American Home Mortgage Luminent Mortgage Capital Dec-03 Filed for bankruptcy Bimini Capital Management Sep-04 Acquired by SPAC Prime mortgage REITs American Home Mortgage Investment Corp. Oct-99 Filed for bankruptcy Thornburg Mortgage Jun-93 Filed for bankruptcy HomeBanc Corp. Jul-04 Filed for bankruptcy Subprime mortgage REITs New Century Financial Corp. Oct-04 Filed for bankruptcy Fieldstone Investment Corp Feb-05 Acquired by C-BASS ECC Capital Corp. Feb-05 Common stock deregistered Commercial mortgage REITs CRIIMI Mae Apr-94 Filed for bankruptcy Anthracite Capital Mar-98 Filed for bankruptcy Gramercy Capital Jul-04 Significant credit write downs JER Jul-05 Common stock deregistered CBRE Mar-06 Common stock deregistered Diversified mortgage REITs Deerfield Triarc Capital Jun-05 Significant credit write downs Taberna Realty Finance Trust Apr-06 Acquired by RAIT Investment Trust Crystal River Capital Jul-06 Merged with Brookfield Asset Mgmt Alesco Financial Inc. Nov-06 Merged with Cohen & Company IPO investors have lost 99% of their principal investment in every REIT named below |
 Wall Street analysts have positive views on Anworth 17 Source: Wall Street Equity Research. “ Book value per share was $6.10, up 2.0% from 4Q14 and aided by the repurchase of 3.8% of outstanding shares. We note that, in 2Q14, ANH has already repurchased an additional 3.6% of outstanding shares. ” Maxim Group, 5/1/14 “ During 1Q14, Anworth repurchased 5.6 million shares for $28.2 million. This was higher than our 4.0 million forecast for $19.8 million. Subsequent to the end of the quarter and through April 28, Anworth has purchased another 4.8 million shares at a weighted average price of $5.24, bringing buybacks to $25.1 million. ” “ As we have written about in the past, we think actual mortgage REIT liquidation is not as easily achievable as it sounds on the surface so we don’t think this will be a viable option when the stock trades at 90% of book value. ” FBR & Co., 4/30/14 “ 1Q14 results beat our estimate, primarily the result of a lower premium amortization on slower prepays. We are encouraged by our improved portfolio spread outlook, share buybacks, along with the company's strategic diversification efforts. ” RBC Capital Markets, 4/30/14 “ Given the better than expected 1Q13 results and a decrease to our blended cost of funds as we expect higher cost swaps to roll off (roughly $410m with a WA pay rate of 2.00% maturing in 5 months), we are increasing our 2014 core EPS estimate by 4c to 36c. We are increasing our net interest spread assumption by 5bps to 65bps while our year-end leverage estimate remains unchanged at 8.1x. ” Deutsche Bank, 4/30/14 |
 Anworth’s governance 18 |
 Anworth’s management has effectively governed to maximize shareholder value 19 Strong and independent Board Board members with significant prior Board experience Proposed new Board member with significant industry expertise Below average management fees Established Strategic Review Committee No 14a-8 Proposals received from stockholders for more than 10 years Effective governance Anworth has increased shareholder value through implementing a share repurchase program Since 2010, the Company has repurchased ~23 million shares All repurchases were done on an accretive basis The share repurchase program allows for the repurchase of an additional ~8 million shares Aggressive buyback policy During 2014, the Board has significantly reduced the trading discount to book value Anworth has hired Credit Suisse to review strategic opportunities Liquidation, due to “breakage” costs, does not improve shareholder NPV, while ending any future value Western, as well as nominated directors, have no experience managing public REITs The current Board provides best value to shareholders |
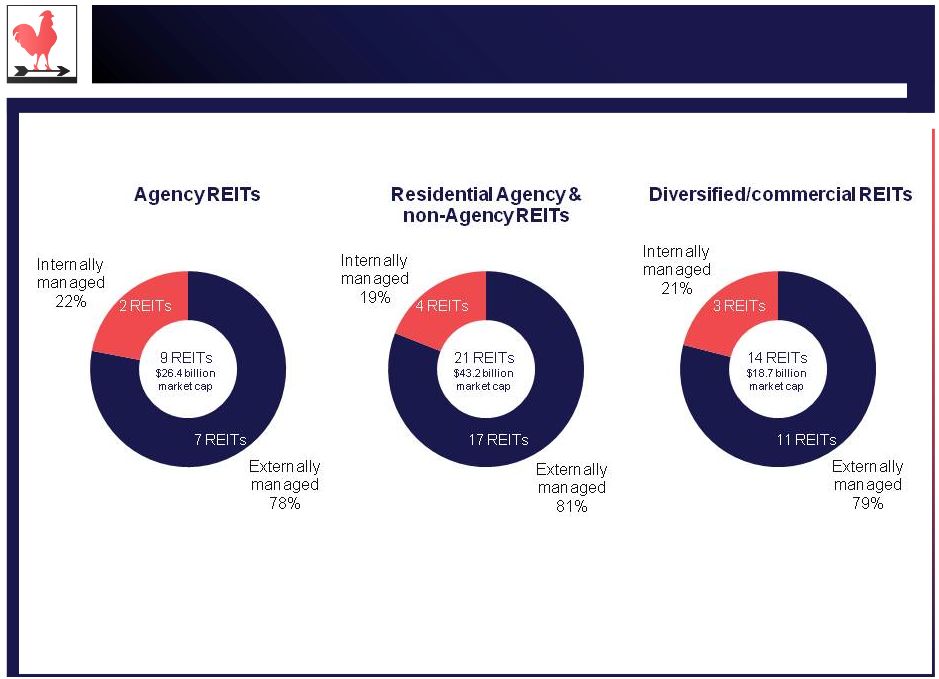 Externally managed mortgage REITs are the standard 20 Source: SNL Financial and company filings as of 4/25/14. (1) Includes AGNC, ANH, ARR, CMO, CYS, EARN, HTS, NLY and WMC. (2) Includes AGNC, AMTG, ANH, ARR, CHMI, CIM, CMO, CYS, EARN, HTS, JMI, MFA, MTGE, NLY, NRZ, OAKS, PMT, RWT, TWO, WMC and ZFC. (3) Includes ABR, ACRE, ARI, BXMT, CLNY, DX, IVR, MITT, NCT, NRF, RAS, RSO, SFI and STWD. (1) (2) (3) |
 Anworth’s management fees are below average 21 Agency assets/ Total assets Management fees (1) Anworth Mortgage Asset Corp. 99% 1.20% Agency Residential Annaly Capital Management, Inc. 94% 1.05% American Capital Agency Corp. 85% 1.25% Hatteras Financial Corp. 92% 1.04% (2) ARMOUR Residential REIT, Inc. 93% 1.50% (3) CYS Investments, Inc. 98% Internal Capstead Mortgage Corp. 96% Internal Western Asset Mortgage 92% 1.50% Ellington Residential Mortgage REIT 86% 1.50% Average 1.31% Median 1.38% Source: Company filings. Agency REITs, even those with different strategies, have comparable operating costs In May 2011, shareholders approved Anworth’s external management structure Of the voting shareholders, 94% voted in favor of the externalization (1) Base fee as a percentage of equity. (2) Management fee based on scaled fee equaling 1.50% for equity up to $250 million, plus 1.10% for equity in excess of $250 million and up to $500 million, plus 0.80% equity in excess of $500 million plus 0.50% for equity in excess of $750 million. Fee as shown based on 4Q’13 ANH total common equity plus preferred equity. (3) Management fee based on scaled fee equaling 1.50% of gross equity up to $1.0 billion plus 0.75% of gross equity in excess of $1.0 billion. Fee as shown based on 4Q’13 ANH total common equity plus preferred equity. |
 We continue to proactively strengthen our Board 22 Mark S. Maron Strategic Review Committee Partner at Acre Corporation, a private equity commercial real estate firm Founding principal of Birchmont Capital Advisors (now JRK Multifamily), a $1 billion real estate private equity fund focused on multi-family properties; Mr. Maron remains a General Partner of the fund Spent 23 years as an investment banker, including 18 years at Credit Suisse, where he began his career in the mortgage department, ultimately leading Credit Suisse’s Los Angeles office and West Coast financial institutions practice Served on the Board of Directors of True Religion Brand Jeans until its sale to a private equity firm in July 2013 Holds a Bachelor of Arts degree from McGill University in Montreal, Canada, and a Master of Business Administration degree in Finance from the Wharton School of Business Established to identify individuals and organizations which will participate in the management and execution of the Company’s recently announced diversification program to invest in other types of mortgage and real estate assets through its qualified REIT subsidiary and its taxable REIT subsidiary Completely independent Nominated one qualified, independent Board member for election in 2014 and established an independent Strategic Review Committee |
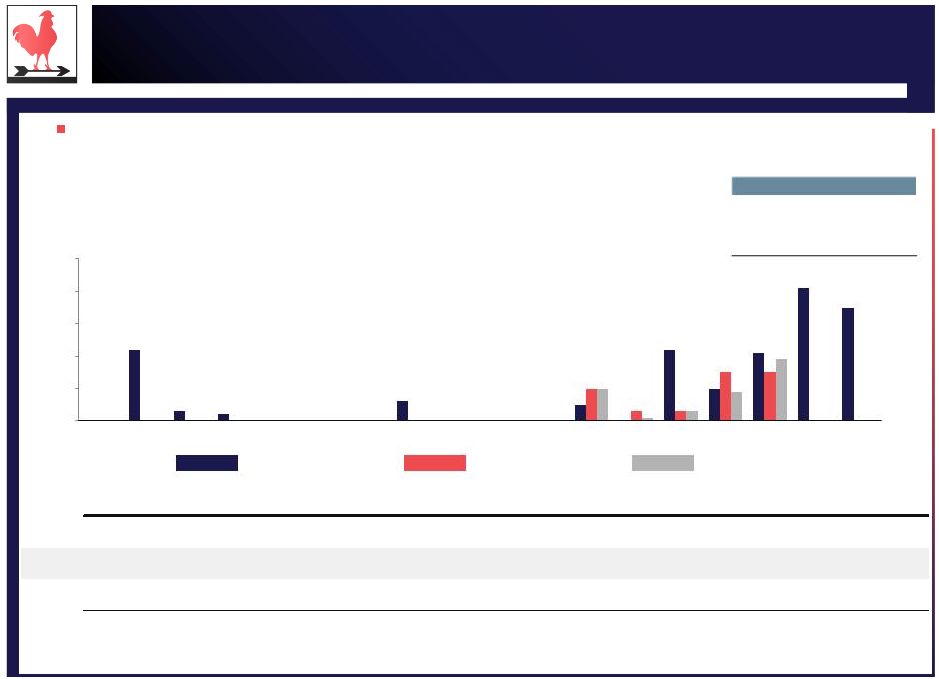 23 Source: Company filings and SNL Financial. (1) Calculated as total shares repurchased divided by total shares outstanding as of 1Q’14 plus total shares repurchased since 1Q’10. (2) Average of peers include CMO, CYS and HTS. 1Q’14 and 2Q’14 data not available for peers. (3) Average of other Agency REITs include AGNC, ARR, EARN, NLY and WMC. 1Q’14 and 2Q’14 data not available for peers. (4) Share repurchase history from April 1 to April 28, 2014 for ANH. = ANH = Peers (2) = Other Agency REITs (3) 1Q’10 2Q’10 3Q’10 4Q’10 1Q’11 2Q’11 3Q’11 4Q’11 1Q’12 2Q’12 3Q’12 4Q’12 1Q’13 2Q’13 3Q’13 4Q’13 1Q’14 2Q’14 (4) Total – 2.2% 0.3% 0.2% – – – 0.6% – – – 0.5% – 2.2% 1.0% 2.1% 4.1% 3.5% 16.7% – – – – – – – – – – – 1.0% 0.3% 0.3% 1.5% 1.5% na na 4.7% – – – – – – – – – – – 1.0% 0.1% 0.3% 0.9% 1.9% na na 3.9% ANH Peers (2) Other Agency REITs (3) Anworth has bought back ~17 percent of outstanding shares versus ~4 percent by peers and other Agency REITs (1) Longstanding buyback program with increased purchases over the last 12 months % of shares repurchased (1) ANH 16.7% Peers 4.7% Other Agency REITs 3.9% 1Q '10 2Q '10 3Q '10 4Q '10 1Q '11 2Q '11 3Q '11 4Q '11 1Q '12 2Q '12 3Q '12 4Q '12 1Q '13 2Q '13 3Q '13 4Q '13 1Q '14 2Q '14 Share repurchase history 0.0% 1.0% 2.0% 3.0% 4.0% 5.0% (2) (3) |
 24 Source: SNL and company filings as of 4/25/14. (1) Peers include CMO, CYS and HTS. Discount to book value has narrowed significantly in 2014 Anworth’s discount to the core peer average has improved from 14% to 3% this year 0.92x 0.94x Peers (1) ANH 0.60x 0.70x 0.80x 0.90x 1.00x Jan 2014 Feb 2014 Mar 2014 Apr 2014 Year to date price / book value |
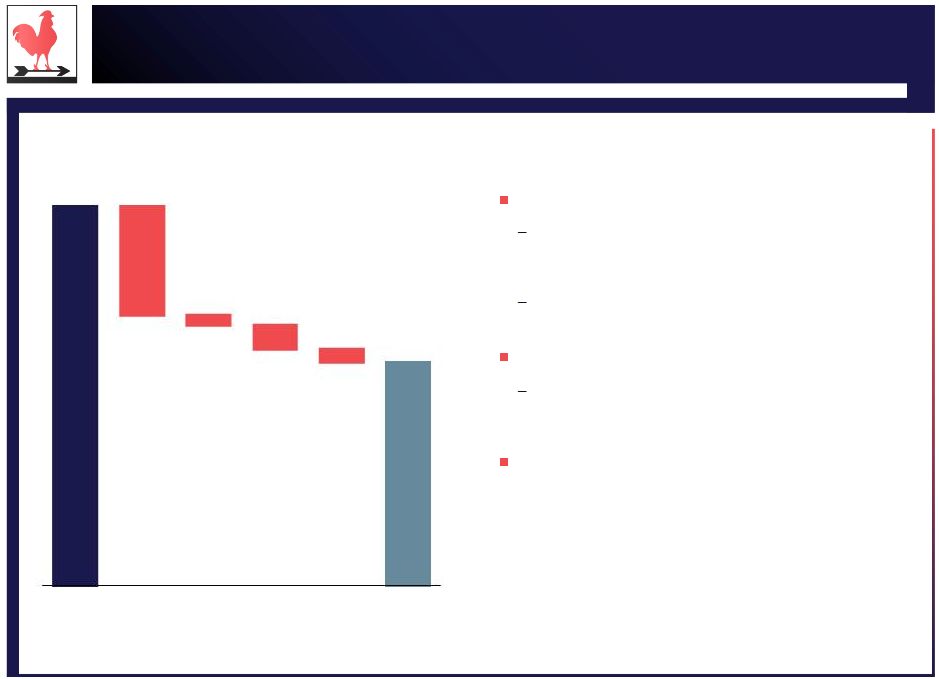 25 Source: Company filings. Book value as of 3/31/14. (1) Market data as of 4/25/14. Liquidating the company would not improve shareholder Net Present Value Liquidation considerations Estimated liquidation value Expenses that would be incurred through liquidation process are significant and would impact value realization to shareholders Expenses include termination fee, change of control payments, asset liquidation costs and others Timing Nature of corporate structure would require lengthy liquidation process, further impacting value realization Given timing issues, liquidation provides no meaningful Net Present Value upside to current market value of $5.48 (1) Assets liquidation cost $6.10 $5.65 ($0.32) ($0.03) ($0.07) ($0.04) Book value Termination fee Change of control payments Liquidation analysis (per share data) Long-term and other commitments Net value unadjusted for timing |
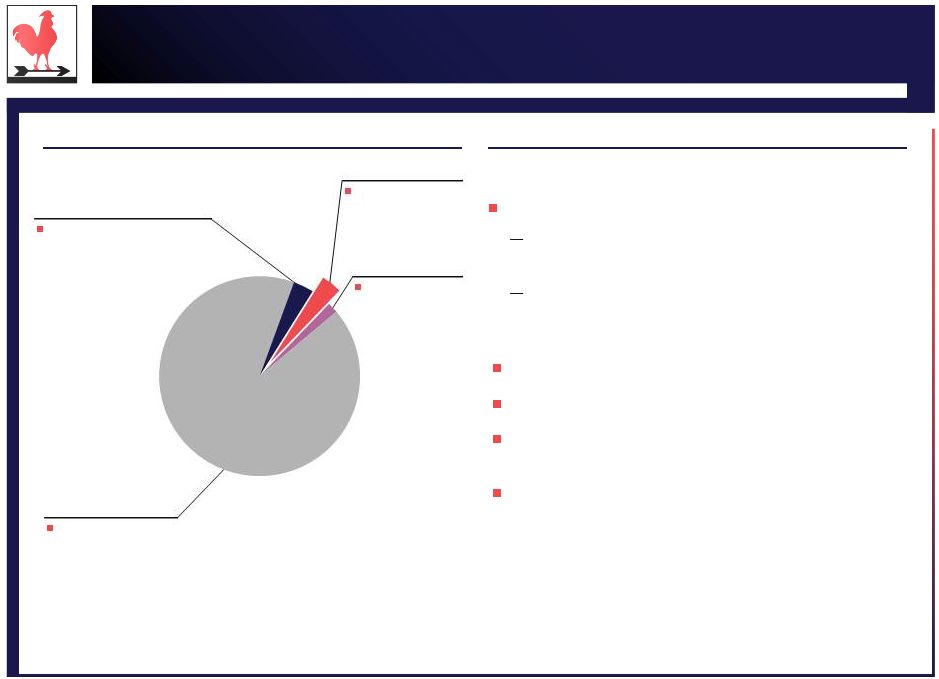 26 Western Investment’s campaign industry distribution (1) Western Investment’s two precedent REIT campaigns I. Dynex Capital, Inc. (2006) Filed 13D to report 5.0% position Source: FactSet and public filings (1) Per SharkRepellent. Includes all public campaigns. (2) End price of $8.60 per the October 6, 2006 merger closing date. Cost basis calculated as weighted average of Western Investment’s purchases and sales, per its December 5, 2005 13D/A. Return includes dividends, including special dividend of $0.50 paid October 16, 2006. Western’s focus is almost exclusively closed-end funds Suggests limited understanding of mortgage REITs Total = 60 situations (2 campaigns) (1 campaign) (2 campaigns) (55 campaigns) Advisory and lending (3.3%) REIT (3.3%) Healthcare (1.7%) Investment Trusts / Mutual Funds (91.7%) II. Sunset Financial Resources, Inc. (2005) Launched contest to replace entire six-member Board Failed to gain any seats on the Board Failed to oppose the merger with Alesco Financial Trust at $8.60 per share (2) Western’s estimated cost basis of $10.24 implies a net loss on the investment Did not amend Item 4 to announce specific control plan or proposal Announced support of management |
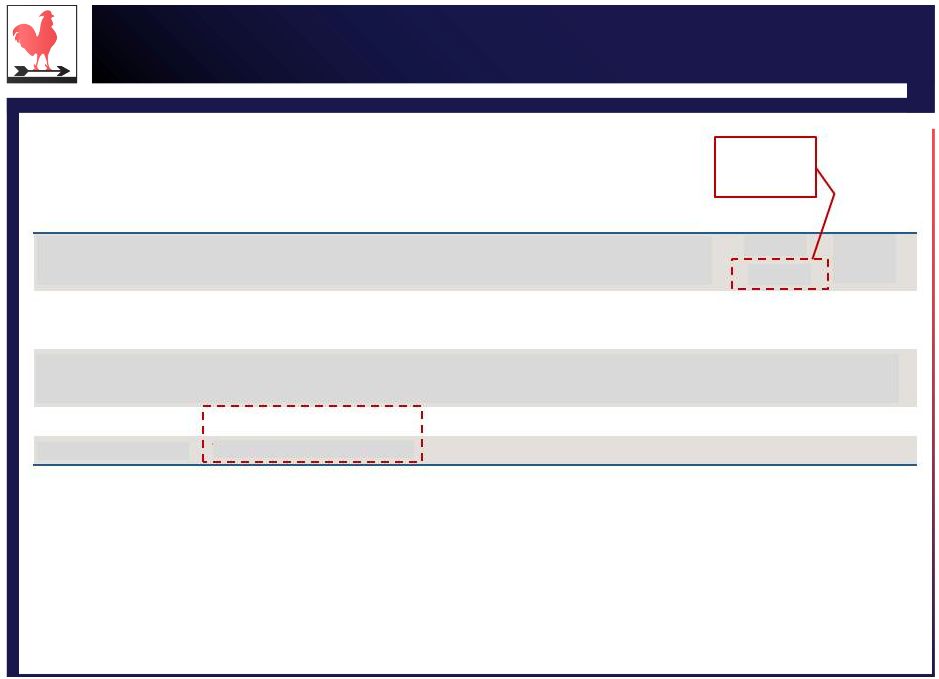 Value creation during Board tenure 27 Source: FactSet and company filings as of 4/25/14. (1) Return on stock (including reinvested dividends) against the S&P 500 Total Return index during Board tenure. Western Investment nominees Name Companies Joined Board Exited Board Return Alpha (1) Paul R. DeRosa Intervest Bancshares Corp Feb-03 N/A -26.9% -209.0% AMBAC Financial Group, Inc. Jul-08 May-13 -100.0% -139.7% Filed for bankruptcy on 8-Nov-10 Gregory R. Dube New England Realty Associates LP The Gabelli Global Multimedia Trust Inc. Oct-07 Jun-10 N/A May-13 81.3% 22.1% Kenneth B. Dunn NextEra Energy BlackRock, Inc. *No public board experience* *No public board experience* Ronald Mass Scott F. Richard Jul-10 N/A 111.6% 27.2% 138.6% 159.3% May-11 Aug-05 130.7% 90.3% |
 Conclusion Anworth has and continues to take aggressive actions to increase shareholder value and enhance corporate governance Anworth has delivered investors a total return of 267% since inception compared to 67% for the FTSE NAREIT Mortgage REITs Index Anworth’s hedged portfolio has provided above average long term risk adjusted returns Through Anworth’s aggressive buyback program, which dates back to 2005, ~17% of shares have been repurchased since 2010 Discount to book has narrowed to 0.92x Anworth continues to strengthen its Board with the nomination of a new director The Company has hired Credit Suisse to better position the Company���s strategy in changing business cycles Western's perspectives are largely without merit and not worthy of replacing the Board 28 |