
YANZHOU COAL MINING COMPANY LIMITED
Address : 298 Fushan South Road, Zoucheng, Shandong Province, China Tel : (86) 537 5382319 Fax: (86) 537 5383311
August 8, 2016
VIA EDGAR
Mr. Rufus Decker
Accounting Branch Chief
Office of Beverages, Apparel, and Mining
U.S. Securities and Exchange Commission
Division of Corporate Finance
Washington, D.C. 20549
Dear Ladies and Gentlemen,
Re: Yanzhou Coal Mining Company Limited Form 20-F for the Year Ended December 31, 2015
Filed April 26, 2016 (File No. 001-14714)
Yanzhou Coal Mining Company Limited (the “Company” or “we”) refers to the comments of the Staff (the “Staff”) of the U.S. Securities and Exchange Commission (the “SEC” or the “Commission”) dated July 11, 2016 (the “Comment Letter”) on its Annual Report on Form 20-F (the “Annual Report”). We have included the Staff’s comments in bold and numbered our responses accordingly.
Form 20-F for the Year Ended December 31, 2015
Item 3. Key Information
A. Selected Financial Data, page 9
| 1. | You disclose “operating income per share before income tax” and “profit from continuing operation per ADS before income tax,” but do not appear to disclose how these amounts were computed. Please do so in future filings. If these amounts represent non-IFRS measures, please also revise your disclosures to comply with the guidance outlined in Item 10(e) of Regulation S-K. Refer to General Instruction C(e) of Form 20-F. Please provide us your proposed disclosures. |
Response:
In response to the Staff’s comment, the Company will revise its disclosure in the future as follows:
We considered the latest update on the interpretations of the rules and regulations on the use of non-GAAP financial measures dated May 17, 2016 where certain non-GAAP per share measures are prohibited to be presented in documents filed or furnished with the Commission. We will remove the information of “operating income per share before income tax” and “profit from continuing operation per ADS before income tax” under Item 3, KEY INFORMATION, A. Selected Financial Data,Historical Financial Data,in our future filings to avoid any confusion that could be created by reading these non-IFRS measures.
Item 4. Information on the Company
B. Business Overview, page 27
| 2. | The reserve figures on pages 27 and 28 of your filing do not appear to correspond to the reserve figures that are presented in tabular format beginning on page 61 of your filing. Please advise. |
Response:
The Company respectfully submits that it inadvertently included the reserve figures of some of the PRC coal mines under PRC standards in the disclosure of reserves figures in the Annual Report, which caused the discrepancy between the reserve figures on page 27 and the corresponding reserve figures in the tables on page 61, 63 and 65 of the Annual Report. Specifically, because the reserve figures of Beisu and Yangcun coal mines were prepared based on PRC standards, there was discrepancy between (i) the sum of in-place proven and probable reserves of the six coal mines, namely Nantun, Xinglong Zhuang, Baodian, Dongtan, Jining II and Jining III, as disclosed in the table on page 61 and the recoverable reserves of Beisu and Yangcun coal mines as disclosed in the table on page 63 and (ii) the total reserve figures of these eight coal mines disclosed on page 27 of the Annual Report. For the same reason, the reserve figures of Tianchi and Zhaolou coal mines on page 27, which were prepared based on PRC standards, were different from the reserve figures prepared pursuant to JORC Code as disclosed in the table on page 65 of the Annual Report.
In prior filings, the Company disclosed the reserve figures prepared based on PRC standards in an effort to provide investors with a comprehensive overview of its operations and resources. However, in response to the Staff’s comment letter and upon further review of the disclosure requirements of Industry Guide 7, the Company has determined that it is appropriate to omit from future filings any reference to a reserve figure based on PRC standards. We attach proposed amendments to the Form 20-F (Exhibit I) that remove all such references from the Form 20-F.
The Company further submits that the total reserve figure disclosed on page 28 of the Annual Report represents the amount of total coal resources held by nine coal mines operated by the subsidiaries of the Company in Australia, whereas the table on page 68 and page 72 sets out the amount of recoverable reserves of each of these nine coal mines. These figures were prepared in compliance with the JORC 2012 Code. For clarification, the Company will revise the total reserve figure of the nine Australian coal mines on page 28 to recoverable reserve figure, which will be consistent with the sum of the recoverable reserves of the nine coal mines as individually disclosed in the tables on page 68 and 72 of the Annual Report.
Accordingly, as set forth in the proposed amendments attached as Exhibit I, the Company proposes to revise its disclosure as follows.
| • | On page 27 of the Annual Report: |
We directly own and operate six coal mines in the PRC, namely, Nantun, Xinglongzhuang, Baodian, Dongtan, Jining II and Jining III, which had approximately 1,623.3 millions tonnes of in-place proven and probable reserves as of December 31, 2015. In addition, we also own and operate Beisu and Yangcun Coal mines. These eight coal mines produced in aggregate approximately 53.7% of our total coal output in 2015. We also hold equity interests in a number of coal mines in China through our subsidiaries. Shanxi Nenghua operates Tianchi Coal Mine, which holds approximately 22.7 million tonnes of recoverable reserves as of December 31, 2015; Heze Nenghua operates Zhaolou Coal Mine, which holds approximately 94.5 million tonnes of recoverable reserves as of December 31, 2015; and Ordos Neng Hua operates Anyuan Coal Mine and Wenyu Coal Mine.
| • | On page 28 of the Annual Report: |
In Australia, we conduct our operations in Australia primarily through our subsidiaries, Yancoal Australia and Yancoal International (Holding). Yancoal Australia directly or indirectly operates seven coal mines in Australia consisting of Austar, Yarrabee, Ashton, Moolarben, Gloucester, Donaldson, Middlemount, which collectively held approximately 697 million tonnes of JORC 2012 Code compliant recoverable reserves as of December 31, 2015; and Yancoal International (Holding) directly or indirectly operates two coal mines in Australia consisting of Cameby Downs and Premier, which collectively held approximately 299 million tonnes of JORC 2012 Code compliant recoverable reserves as of December 31, 2015. Yancoal Australia also holds an early exploration stage project, Monash. Yancoal International (Holding) currently owns the exploration projects of Athena, Harrybrandt and Wilpeena. In addition, we have a number of exploration tenements adjoining our mining leases in Australia with potential for “brownfield” expansion projects as of December 31, 2015.
2
| • | On page 63 of the Annual Report |
Delete the raw of recoverable reserves disclosure and the corresponding footnote from the table.
| • | On page 64 of the Annual Report |
Beisu Coal Mine
Beisu Coal Mine is located in the southern portion of our coalfield, and covers an area of approximately 29.3 square kilometers. We acquired the assets of Beisu Coal Mine in May 2012. Beisu Coal Mine commenced operations in 1976 with an approved annual raw coal production capacity of 0.75 million tonnes. The annual raw coal production capacity has been increased to 1.0 million tonnes since 2006. The main coal seam of Beisu is divided into two thin-seam leaves. The thickness of the upper leaf averages 0.99 meters and the thickness of the lower leaf averages 0.9 meters. We primarily used the thin coal seam blasting method and the fully mechanized system to extract coal from three work faces in Beisu Coal Mine as of December 31, 2015. Beisu Coal Mine primarily produces thermal coal. Beisu Coal Mine has a coal preparation plant. The main equipment used in the coal preparation plant is a waste discharge system, which was manufactured in China.
Yangcun Coal Mine
Yangcun Coal Mine is located in the north portion of our coalfield, and covers an area of approximately 27.5 square kilometers. We acquired the entire assets of Yangcun Coal Mine in May 2012. Yangcun Coal Mine commenced operations in 1988 with an approved annual raw coal production capacity of 0.6 million tonnes. The annual raw coal production capacity has been increased to 1.15 million tonnes since 2006. The main coal seam of Yangcun is divided into three leaves. The thickness of the upper leaf averages 8.34 meters and the thickness of the lower leaves average 1.17 and 1.02 meters. We primarily used the fully mechanized sublevel caving method to extract coal from the upper leaf and the fully mechanized system to extract coal from the lower leaves. As of December 31, 2015, Yangcun Coal Mine has two work faces. Yangcun Coal Mine primarily produces thermal coal. Yangcun Coal Mine does not have any coal preparation plant.
| • | On page 66 of the Annual Report |
Delete the raw of recoverable reserves disclosure and the corresponding footnote from the table.
The Company believes its proposed revised disclosure meets the requirement of Industry Guide 7.
D. Property, Plant and Equipment, page 51
| 3. | We note your statement on page 7 that your company believes that the methods it uses to estimate these reserves are consistent with definitions and classifications in Securities Act Industry Guide 7, the JORC Code and PRC Standards, as applicable, to its PRC and Australian mines. Please confirm that all mineral reserves reported in your filing meet the definition of a reserve as defined in paragraph (a) of Industry Guide 7. In addition, please revise future filings to include a statement that all mineral reserves meet the definitions in Industry Guide 7. |
Response:
The Company confirms that all mineral reserves reported in its filing (as disclosed in the Company’s proposed amendments to the Form 20-F attached as Exhibit I) meet the definition of a reserve as defined in paragraph (a) of Industry Guide 7.
In response to the Staff’s comments, the Company will revise its disclosure as follows:
| • | On page 7 of the Annual Report |
3
A majority of our Company’s total estimated proven coal reserves are located in China and Australia. The coal reserves data in this annual report represent estimates of our Company that were calculated by its internal reserves system, which includes, among others, procedures for classifying and estimating reserves. Our Company confirms that all mineral reserves it reports in this annual report meet the definition of a reserve as defined in paragraph (a) of Industry Guide 7. The methods which the Company uses to estimate its reserves are consistent with definitions and classifications in Securities Act Industry Guide 7, the JORC Code and the PRC Standards, as applicable, to its PRC and Australian mines. This annual report does not contain references to estimates of mineral reserves which were prepared based on PRC standards. Our Company’s internal geological team focuses on periodically estimating reserves information based on geological data obtained from various geological, geophysical and engineering studies. Estimates of net reserves are based on numerous assumptions and estimates relating to technical factors such as initial coal reserves, initial production rates, production decline rates, ultimate recovery of reserves, as well as commercial factors such as future coal prices, timing and amount of capital expenditures, and operating costs that may occur during the production life of the coal reserves.
| 4. | Please disclose the reporting units for your Beisu and Yangcun recoverable reserves on page 63 of your filing and the Anyuan and Wenyu recoverable reserves on page 66 of your filing. |
Response:
The Company submits that the respective reporting unit for the Beisu and Yangcun recoverable reserves on page 63 of the Annual Report and the Anyuan and Wenyu recoverable reserves on page 66 of the Annual Report is “million tonnes”
| 5. | We note your disclosure of mineral reserves for your Beisu, Yangcun, Anyuan, and Wenyu coal mines that were prepared based on PRC standards. Please forward to our engineer as supplemental information and not as part of your filing, your technical report or the information that establishes the legal, technical and economic feasibility of the materials designated as reserves, as required by paragraph (c) of Industry Guide 7. This information should include: |
| • | Acreage breakdown by owned, leased or other. |
| • | Maps showing property, mine permit and reserve boundaries; including recent and historic production areas. |
| • | Drill-hole maps showing drill intercepts. |
| • | Justifications for the drill hole spacing used at various classification levels. |
| • | General cross-sections that indicate the relationship between coal seams, geology, and topography. |
| • | A detailed description of your procedures for estimating reserves. |
| • | The specific criteria used to estimate reserves. |
| • | An indication of how many years are left in your longest-term mining plan for each reserve block. |
| • | Site specific economic justification for the criteria you used to estimate reserves. |
| • | Mining plans or feasibility studies, including production schedules, cost estimates and cash flow projections. |
| • | Third party reviews of your reserves that were developed within the last three years. |
| • | Any other information needed to establish legal, technical and economic feasibility. |
Please provide this information on a CD, formatted as Adobe PDF files. You may ask to have this information returned by making a written request at the time it is furnished, as provided in Rule 12b-4 of Regulation 12B. If you have questions concerning the above request, please contact John Coleman, Mining Engineer at (202) 551-3610.
Response:
Because the Company’s proposed revised disclosure in response to the Staff’s comment #2 eliminates all references made in the Annual Report to the mineral reserves for Beisu, Yangcun, Anyuan, and Wenyu coal mines, which were prepared based on PRC standards, the Company respectively submits that the technical reports of Beisu, Yangcun, Anyuan, and Wenyu coal mines (which were prepared and presented in Chinese) are no longer relevant to the Company’s 20-F and need not be provided.
4
Item 5. Operating and Financial Review and Prospects
A. Operating Results
Results of Operations
Segment Information, page 85
| 6. | Your disclosure under Note 6, segment information, on page F-47 indicates that segment results is the measure reported to the chief operating decision maker for purposes of resource allocation and assessment of segment performance. Please expand your discussion in future filings to describe the underlying drivers for the changes in the segment results measure between reporting periods for each of your segments. If there are multiple drivers that are responsible for the changes in segment results, please discuss and quantify the effect for each driver that you have identified. Please provide your proposed revisions to the discussion of your results of operations for your segments for 2015 as compared to 2014 in your response. |
Response:
In response to the Staff’s comment, the Company will revise its disclosure in the future as follows:
Under Item 5, OPERATING AND FINANCIAL REVIEW AND PROSPECTS, A. Operating Results,Segment Information, the following will be revised below the section of Coal Mining Revenue and added below the section of Methanol, electricity and heat supply business, respectively:
Coal mining revenue
Our revenue from coal mining segment (before unallocated corporate income and eliminations) decreased by RMB25,723.5 million, from approximately RMB58,997.0 million in 2014 to approximately RMB33,273.5 million in 2015, primarily due to the decrease in the sales volumes of our externally purchased coal products, which caused a decrease of approximately RMB19,249.4 million in coal mining revenue, as well as a decrease in the average selling price of our coal products as a result of weak demand of coal products in the domestic and international markets, which caused a decrease of approximately RMB6,414.0 million in coal mining revenue. In addition, we recorded a profit on share of associates of RMB661.0 million in our mining business in 2015 as compared to RMB304.9 million in 2014, primarily due to the increased profit recognized by Shaanxi Chemical. We recognized a loss on our share of joint ventures in mining businesses, which decreased from RMB320.8 million in 2014 to RMB170.5 million in 2015, primarily due to share of loss recognized by the joint venture operating Middlemount Coal Mine.
Equipment manufacturing
In 2015, we acquired 100% of equity interest of Donghua Heavy Industry, which is mainly engaged in the business of sales and production of mine equipment and electronic machinery. This business contributed revenue (before unallocated corporate income and eliminations) of RMB760.2 million in 2015. After considering the nature of this business which is significantly different from our existing business as well as its size, we reported this new business as a separate segment in this annual report.
Report and Consolidated Financial Statements
Consolidated Income Statements, page F-3
| 7. | Given the significance of your share of profit of associates and your share of loss of joint ventures in comparison to profit before income taxes in 2015, please clarify how you have considered the need for separate financial statements for significant equity method investments pursuant to Rule 3-09 of Regulation S-X. As part of your response, please provide the computations prepared supporting your conclusions that financial statements for your investments in the associates, Huadian Zouxian and Shaanxi Chemical, and your joint venture interest in Middlemount Joint Venture were not required pursuant to Rule 3-09 of Regulation S-X. |
5
Response:
In response to the Staff’s comment, the Company respectfully submits the calculations pursuant to Rule 3-09 of Regulation S-X, based on the conditions set forth in Rule 1-02(w) of Regulation S-X as follows:
For the year ended December 31, 2015:
| Huadian Zouxian | Shannxi Chemical | Middlemount Joint Venture | ||||||||||||||
| RMB’000 | RMB’000 | RMB’000 | ||||||||||||||
Condition 1 – Investment test | ||||||||||||||||
Investment cost | 900,000 | 1,350,000 | 782,237 | |||||||||||||
Advances | — | — | 1,565,194 | |||||||||||||
|
|
|
|
|
| |||||||||||
Total as at December 31, 2015 | (A | ) | 900,000 | 1,350,000 | 2,347,431 | |||||||||||
Group’s total assets as per consolidated balance sheet as at December 31, 2015 | (B | ) | 142,471,875 | 142,471,875 | 142,471,875 | |||||||||||
Percentage (A)/(B) | 0.6 | % | 0.9 | % | 1.6 | % | ||||||||||
Condition 2 – Asset test | ||||||||||||||||
Interests in associates/joint ventures under equity method (proportion share of net assets) as at December 31, 2015 | (C | ) | 1,030,099 | 1,604,343 | 36,295 | |||||||||||
Group’s total assets as per consolidated balance sheet as at December 31, 2015 | (D | ) | 142,471,875 | 142,471,875 | 142,471,875 | |||||||||||
Percentage (C)/(D) |
| 0.7 | % | 1.1 | % | — | ||||||||||
Condition 3 – Income test | ||||||||||||||||
Share of profit or loss of associates/joint ventures for the year ended December 31, 2015(1) | (E | ) | 307,215 | 140,696 | (181,290 | ) | ||||||||||
Group’s average profit attributable to equity holders for the last five fiscal years(1) | (F | ) | 3,148,256 | 3,148,256 | 3,148,256 | |||||||||||
Percentage (E)/(F) | 9.8 | % | 4.5 | % | -5.8 | % | ||||||||||
| (1) | According to computational note 2 in Rule 1-02(w) of Regulation S-X,If income of the registrant and its subsidiaries consolidated exclusive of amounts attributable to any noncontrolling interests for the most recent fiscal year is at least 10 percent lower than the average of the income for the last five fiscal years, such average income should be submitted for purpose of the computation.Profit attributable to equity holders for the year ended December 31, 2015 is RMB164,459,000 which is at least 10% lower than the average of the profit attributable to equity holders for the last five fiscal years amounted to RMB3,148,256,000, and thus, the 5-year average profit attributable to equity holders is used for the Income test computation. |
| RMB’000 | ||||
Profit attributable to equity holders for the year ended December 31: | ||||
2015 | 164,459 | |||
2014 | 766,158 | |||
2013 | 0 | |||
2012 | 6,065,570 | |||
2011 | 8,745,092 | |||
|
| |||
Average | 3,148,256 | |||
|
| |||
6
For the year ended December 31, 2014:
| Huadian Zouxian | Shannxi Chemical | Middlemount Joint Venture | ||||||||||||||
| RMB’000 | RMB’000 | RMB’000 | ||||||||||||||
Condition 1 – Investment test | ||||||||||||||||
Investment cost | 900,000 | 1,350,000 | 782,237 | |||||||||||||
Advances | — | 1,250,000 | 1,705,757 | |||||||||||||
|
|
|
|
|
| |||||||||||
Total as at December 31, 2014 | (A | ) | 900,000 | 2,600,000 | 2,487,994 | |||||||||||
Group’s total assets as per consolidated balance sheet as at December 31, 2014 | (B | ) | 133,098,114 | 133,098,114 | 133,098,114 | |||||||||||
Percentage (A)/(B) | 0.7 | % | 2.0 | % | 1.9 | % | ||||||||||
Condition 2 – Asset test | ||||||||||||||||
Interests in associates/joint ventures under equity method (proportion share of net assets) as at December 31, 2014 | (C | ) | 1,188,757 | 1,456,564 | 127,518 | |||||||||||
Group’s total assets as per consolidated balance sheet as at December 31, 2014 | (D | ) | 133,098,114 | 133,098,114 | 133,098,114 | |||||||||||
Percentage (C)/(D) | 0.9 | % | 1.1 | % | 0.1 | % | ||||||||||
Condition 3 – Income test | ||||||||||||||||
Share of profit or loss of associates/joint ventures for the year ended December 31, 2014(2) | (E | ) | 184,304 | 95,351 | (321,180 | ) | ||||||||||
Group’s average profit attributable to equity holders for the last five fiscal years(2) | (F | ) | 4,971,641 | 4,971,641 | 4,971,641 | |||||||||||
Percentage (E)/(F) | 3.7 | % | 1.9 | % | -6.5 | % | ||||||||||
| (2) | According to computational note 2 in Rule 1-02(w) of Regulation S-X,If income of the registrant and its subsidiaries consolidated exclusive of amounts attributable to any non-controlling interests for the most recent fiscal year is at least 10 percent lower than the average of the income for the last five fiscal years, such average income should be submitted for purpose of the computation.Profit attributable to equity holders for the year ended December 31, 2014 is RMB766,158,000 which is at least 10% lower than the average of the profit attributable to equity holders for the last five fiscal years amounted to RMB4,971,641,000, and thus, the 5-year average profit attributable to equity holders is used for the Income test computation. |
| RMB’000 | ||||
Profit attributable to equity holders for the year ended December 31: | ||||
2014 | 766,158 | |||
2013 | 0 | |||
2012 | 6,065,570 | |||
2011 | 8,745,092 | |||
2010 | 9,281,386 | |||
|
| |||
Average | 4,971,641 | |||
|
| |||
7
For the year ended December 31, 2013:
| Huadian Zouxian | Shannxi Chemical | Middlemount Joint Venture | ||||||||||||||
| RMB’000 | RMB’000 | RMB’000 | ||||||||||||||
Condition 1 – Investment test | ||||||||||||||||
Investment cost | 900,000 | 1,350,000 | 782,237 | |||||||||||||
Advances | — | — | 1,587,001 | |||||||||||||
|
|
|
|
|
| |||||||||||
Total as at December 31, 2013 | (A | ) | 900,000 | 1,350,000 | 2,347,431 | |||||||||||
Group’s total assets as per consolidated balance sheet as at December 31, 2013 | (B | ) | 127,458,189 | 127,458,189 | 127,458,189 | |||||||||||
Percentage (A)/(B) | 0.7 | % | 1.1 | % | 1.8 | % | ||||||||||
Condition 2 – Asset test | ||||||||||||||||
Interests in associates/joint ventures under equity method (proportion share of net assets) as at December 31, 2013 | (C | ) | 1,183,098 | 1,350,000 | 471,870 | |||||||||||
Group’s total assets as per consolidated balance sheet as at December 31, 2013 | (D | ) | 127,458,189 | 127,458,189 | 127,458,189 | |||||||||||
Percentage (C)/(D) |
| 0.9 | % | 1.1 | % | 0.4 | % | |||||||||
Condition 3 – Income test | ||||||||||||||||
Share of profit or loss of associates/joint ventures for the year ended December 31, 2013(3) | (E | ) | 198,494 | — | (376,032 | ) | ||||||||||
Group’s average profit attributable to equity holders for the last five fiscal years(3) | (F | ) | 5,641,874 | 5,641,874 | 5,641,874 | |||||||||||
Percentage (E)/(F) | 3.5 | % | 0 | % | -6.7 | % | ||||||||||
| (3) | According to computational note 2 in Rule 1-02(w) of Regulation S-X,If income of the registrant and its subsidiaries consolidated exclusive of amounts attributable to any noncontrolling interests for the most recent fiscal year is at least 10 percent lower than the average of the income for the last five fiscal years, such average income should be submitted for purpose of the computation.Profit attributable to equity holders for the year ended December 31, 2013 is RMB777,368,000 which is at least 10% lower than the average of the profit attributable to equity holders for the last five fiscal years amounted to RMB5,641,874,000, and thus, the 5-year average profit attributable to equity holders is used for the Income test computation. |
| RMB’000 | ||||
Profit attributable to equity holders for the year ended December 31: | ||||
2013 | 0 | |||
2012 | 6,065,570 | |||
2011 | 8,745,092 | |||
2010 | 9,281,386 | |||
2009 | 4,117,322 | |||
|
| |||
Average | 5,641,874 | |||
|
| |||
For the calculation of average profit attributable to equity holders for the years ended December 31, profit after tax was employed in the calculation for illustrative purpose. Income taxes had not been allocated to non-controlling interests or equity holders of the Company since there is no disclosure requirement under IFRS. The effect of whether or not taking income taxes into calculation is immaterial and would not affect the accuracy of the above calculation. Thus, employing profit after tax in the calculation of average profit attributable to equity holders for the years ended December 31 applied and brought a reasonable result in above conditions tests pursuant to Rule 3-09 of Regulation S-X, based on the conditions set forth in Rule 1-02(w) of Regulation S-X.
8
Since none of the percentages calculated for the above 2 conditions exceeds 20%, the registrant was not required to file separate financial statements of any investee or joint venture pursuant to Rule 3-09 of Regulation S-X.
* * *
In addition to the above responses, as requested by the Commission, the Company hereby acknowledges that:
| • | the Company is responsible for the adequacy and accuracy of the disclosure in the filing; |
| • | staff comments or changes to disclosure in response to staff comments do not foreclose the Commission from taking any action with respect to the filing; and |
| • | the Company may not assert staff comments as a defense in any proceeding initiated by the Commission or any person under the federal securities laws of the United States. |
We hope you find the above reply responsive and helpful. We will instruct our legal counsel to submit the amended Form 20-F through EDGAR upon receipt of your confirmation on our proposed amendments. Please contact us if you have any questions regarding the above. Thank you in advance for you assistance in this matter.
| Yours sincerely, |
/S/ ZHAO Qingchun |
| ZHAO Qingchun, Chief Financial Officer |
| Yanzhou Coal Mining Company Limited |
9
Exhibit I
B. Business Overview
We are one of the largest coal producers in China and Australia, with rapidly growing coal mining operations. We primarily engage in the mining, washing, processing and distribution of coal through railway transportation. We offer a wide variety of coal products including thermal coal, semi-hard coking coal, semi-soft coking coal, PCI coal and other mixed coal products which are sold to power plants, metallurgical mills, chemical manufacturers, construction material manufacturers and fuel trading companies in China and other countries, including Japan and South Korea. Since 2004, we have expanded and diversified our operations to include the production of coal chemicals and the generation of electricity and heat. We also commenced our potash exploration business in 2011. In 2015, we expanded to equipment manufacturing business after we acquired 100% of equity interest in Donghua Heavy Industry.
We were established in 1997 and listed on the SSE, HKSE and NYSE in 1998. In addition, our subsidiary, Yancoal Australia, was listed on the ASX in 2012. Our revenue was RMB56,401.8 million, RMB60,370.8 million and RMB36,404.1 million in 2013, 2014 and 2015, respectively.
As of December 31, 2015, we were 52.93% directly owned by our parent, the Yankuang Group, which is controlled by the Shandong Provincial Government under the control of the SASAC of the Shandong Provincial Government. Yankuang Group’s wholly owned subsidiary incorporated in Hong Kong owned 3.66% of our total share capital. Yankuang Group and its wholly owned subsidiary incorporated in Hong Kong together owned 56.59% of our total share capital. The Yankuang Group was founded in 1973 to focus on coal mining and sales, the coal chemical industry, power generation, aluminum production, machinery manufacturing and financial investments.
As of December 31, 2015, we owned and operated 21 coal mines across China and Australia with abundant coal resources, including Shandong and Shanxi Provinces and the Inner Mongolia Autonomous Region in China, as well as Queensland, New South Wales and Western Australia in Australia. In addition, as of December 31, 2015, we had four coal projects under construction in China and four advanced-exploration stage projects in Australia.
We directly own and operate six coal mines in the PRC, namely, Nantun, Xinglongzhuang, Baodian, Dongtan, Jining II and Jining III, which had approximately 1,623.3 millions tonnes of in-place proven and probable reserves as of December 31, 2015. In addition, we also own and operate Beisu and Yangcun Coal mines. These eight coal mines produced in aggregate approximately 53.7% of our total coal output in 2015. We also hold equity interests in a number of coal mines in China through our subsidiaries. Shanxi Nenghua operates Tianchi Coal Mine, which holds approximately 22.7 million tonnes of recoverable reserves as of December 31, 2015; Heze Nenghua operates Zhaolou Coal Mine, which holds approximately 94.5 million tonnes of recoverable reserves as of December 31, 2015; and Ordos Neng Hua operates Anyuan Coal Mine and Wenyu Coal Mine.
27
The map below shows the approximate locations of our coal mines and projects in China.
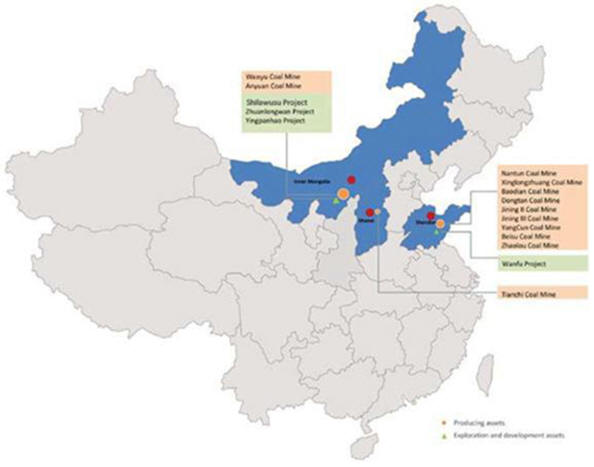
In Australia, we conduct our operations in Australia primarily through our subsidiaries, Yancoal Australia and Yancoal International (Holding). Yancoal Australia directly or indirectly operates seven coal mines in Australia consisting of Austar, Yarrabee, Ashton, Moolarben, Gloucester, Donaldson, Middlemount, which collectively held approximately 697 million tonnes of JORC 2012 Code compliant recoverable reserves as of December 31, 2015; and Yancoal International (Holding) directly or indirectly operates two coal mines in Australia consisting of Cameby Downs and Premier, which collectively held approximately 299 million tonnes of JORC 2012 Code compliant recoverable reserves as of December 31, 2015. Yancoal Australia also holds an early exploration stage project, Monash. Yancoal International (Holding) currently owns the exploration projects of Athena, Harrybrandt and Wilpeena. In addition, we have a number of exploration tenements adjoining our mining leases in Australia with potential for “brownfield” expansion projects as of December 31, 2015.
28
We primarily use the fully mechanized sublevel caving method to extract coal. At this mine, we maintained two work faces as of December 31, 2015. The Dongtan coal preparation plant produces No. 2 Clean Coal, lump coal and thermal coal. The principal pieces of equipment in the Dongtan coal preparation plant, including its slanted wheel, cyclones, TBS sorting machines and flotation machines, were manufactured in the PRC.
Jining II Coal Mine
Jining II is located in the northern portion of the Jining coalfield, with coalfield area of approximately 87.1 square kilometers. Jining II began commercial production in 1997 with an approved annual raw coal production capacity of 4.2 million tonnes. Certain sections of the main coal seam of Jining II are concentrated in one layer, with an average thickness of 6.78 meters. The remaining sections are divided into two layers, with an average thickness of 2.1 meters for the upper leaf and an average thickness of 4.68 meters for the lower leaf. As of December 31, 2015, the total in-place proven and probable reserves on the main coal layer were approximately 88,000 million tonnes.
We primarily use the fully mechanized sublevel caving method to extract coal. At this coal mine, we produced coal from two work faces as of December 31, 2015. The main equipment used in Jining II are movable-sieve jig machines, cyclones and flotation machines, most of which were manufactured in the PRC. The principal product of the coal preparation plant of Jining II is No. 2 Clean Coal.
Jining III Coal Mine
Jining III is located in the southern portion of the Jining coalfield and covers an area of 105.1 square kilometers. Jining III has an approved annual raw coal production capacity of 6.5 million tonnes. The main coal seam of Jining III is divided into two leaves. The thickness of the upper leaf averages 1.21 meters and the thickness of the lower leaf averages 4.91 meters. As of December 31, 2015, the total in-place proven and probable reserves on the main coal layer were approximately 91,700 million tonnes.
We primarily used the fully mechanized sublevel caving method to extract coal from three work faces in Jining III Coal Mine as of December 31, 2015. The main pieces of equipment used in Jining III are slanted wheel, cyclones, TBS sorting machines, flotation machines and movable-sieve jig machines, which were manufactured in the PRC. The principal products of the coal preparation plant of Jining III are No. 2 Clean Coal and thermal coal.
Beisu and Yangcun Coal Mines
The following table sets forth information about Beisu and Yangcun Coal Mines, which are directly owned and operated by the Company:
| Beisu | Yangcun | Total | ||||||||||
Background data: | ||||||||||||
Commencement of construction | 1972 | 1981 | N/A | |||||||||
Commencement of commercial production | 1976 | 1988 | N/A | |||||||||
Coalfield area (square kilometers) | 29.3 | 27.5 | 56.8 | |||||||||
Reserve data: | ||||||||||||
(as of December 31, 2015) | ||||||||||||
Mining recovery rate (%)(1) | 86.5 | 86.7 | N/A | |||||||||
Coal preparation plant recovery rate (%)(2) | N/A | N/A | N/A | |||||||||
Depth of mine (meters underground) | 269.7 | 318.8 | N/A | |||||||||
Average thickness of main coal seam (meters) | 1.0 | 8.3 | N/A | |||||||||
Type of coal | Thermal coal | Thermal coal | N/A | |||||||||
Leased/owned | Owned | Owned | N/A | |||||||||
Average calorific value (Kcal/kg) | 5,199 | 5,118 | N/A | |||||||||
Sulfur content (%) | 3.50 | 0.87 | N/A | |||||||||
Production data: (million tonnes) | ||||||||||||
Approved raw coal production capacity | 1.0 | 1.2 | 2.2 | |||||||||
Designed coal preparation input washing capacity | — | — | — | |||||||||
Raw coal production | ||||||||||||
2013 | 1.0 | 1.1 | 2.1 | |||||||||
2014 | 0.8 | 1.0 | 1.8 | |||||||||
2015 | 0.7 | 1.6 | 2.3 | |||||||||
Cumulative raw coal production as of December 31, 2015 | 3.5 | 4.8 | 8.3 | |||||||||
63
| (1) | The mining recovery rate is the rate of the amount of coal recovered from a determined amount of reserves, which is calculated by dividing the actual volume of coal recovered in a year by the volume of reserves mined and consumed in the same year. |
| (2) | “Coal preparation plant recovery rate” refers to the wash plant recovery rate of raw coal used during the production of our coal products. |
Beisu Coal Mine
Beisu Coal Mine is located in the southern portion of our coalfield, and covers an area of approximately 29.3 square kilometers. We acquired the assets of Beisu Coal Mine in May 2012. Beisu Coal Mine commenced operations in 1976 with an approved annual raw coal production capacity of 0.75 million tonnes. The annual raw coal production capacity has been increased to 1.0 million tonnes since 2006. The main coal seam of Beisu is divided into two thin-seam leaves. The thickness of the upper leaf averages 0.99 meters and the thickness of the lower leaf averages 0.9 meters. We primarily used the thin coal seam blasting method and the fully mechanized system to extract coal from three work faces in Beisu Coal Mine as of December 31, 2015. Beisu Coal Mine primarily produces thermal coal. Beisu Coal Mine has a coal preparation plant. The main equipment used in the coal preparation plant is a waste discharge system, which was manufactured in China.
Yangcun Coal Mine
Yangcun Coal Mine is located in the north portion of our coalfield, and covers an area of approximately 27.5 square kilometers. We acquired the entire assets of Yangcun Coal Mine in May 2012. Yangcun Coal Mine commenced operations in 1988 with an approved annual raw coal production capacity of 0.6 million tonnes. The annual raw coal production capacity has been increased to 1.15 million tonnes since 2006. The main coal seam of Yangcun is divided into three leaves. The thickness of the upper leaf averages 8.34 meters and the thickness of the lower leaves average 1.17 and 1.02 meters. We primarily used the fully mechanized sublevel caving method to extract coal from the upper leaf and the fully mechanized system to extract coal from the lower leaves. As of December 31, 2015, Yangcun Coal Mine has two work faces. Yangcun Coal Mine primarily produces thermal coal. Yangcun Coal Mine does not have any coal preparation plant.
64
Tianchi Coal Mine
Tianchi Coal Mine is an underground mine located in Heshun County of Shanxi, with an area of approximately 18.7 square kilometers. Tianchi Coal Mine commenced commercial production in 2006 and the designed production capacity was increased to 1.2 million tonnes per annum in the same year. Tianchi Coal Mine is operated by inclined shaft development and primarily produces thermal coal. The average thickness of the coal seam is 4.6 meters. As of December 31, 2015, the total recoverable reserves of Tianchi Coal Mine were approximately 22.7 million tonnes.
We primarily used the high seam mechanization mining method to extract coal from one work face at Tianchi Coal Mine as of December 31, 2015. The primary piece of equipment in this system is a slanted wheel, which was manufactured in China. The operations at Tianchi Coal Mine are powered by electricity from local power grids. We ship coal products from the Tianchi Coal Mine to Hebei and surrounding areas on the Yangshe Railway and the national railway network, as well as the highway network.
Zhaolou Coal Mine
Zhaolou Coal Mine is an underground longwall mine located in the central portion of Juye Coal Field in Shandong. Zhaolou Coal Mine covers an area of approximately 143.4 square kilometers, and is accessible by roadway and railway.
Zhaolou Coal Mine commenced commercial production in December 2009 and has an approved annual raw coal production capacity of 3.9 million tonnes. Zhaolou Coal Mine produces 1/3 coking coal. The average thickness of the main coal seam of Zhaolou Coal Mine is 5.2 meters. The total recoverable reserves of Zhaolou Coal Mine were approximately 94.5 million tonnes as of December 31, 2015, which was net of coal preparation and plant recovery losses.
We primarily used the longwall caving mining method to extract coal from two work faces at Zhaolou Coal Mine as of December 31, 2015. The coal preparation plant at Zhaolou Coal Mine commenced commercial production in September 2009. The main equipment used in the coal preparation plant was a slanted wheel, cyclone machines, TBS separators and flotation machines, which were mainly produced in China. The main product of Zhaolou’s coal preparation plant is No. 2 Clean Coal. Electricity generated from Zhaolou Coal Mine, after being applied internally, is sold to external parties. We ship coal products to Shandong and Hebei Provinces and surrounding areas by truck.
Coal Mines operated by Ordos Neng Hua
The following table sets forth information about Anyuan Coal Mine and Wenyu Coal Mine in China that are operated by Ordos Neng Hua:
| Anyuan | Wenyu | Total | ||||||||||
Background data: | ||||||||||||
Commencement of construction | — | 1996 | N/A | |||||||||
Commencement of commercial production | 2004 | 1997 | N/A | |||||||||
Coalfield area (square kilometers) | 9.3 | 9.4 | 18.6 | |||||||||
Reserve data: | ||||||||||||
(as of December 31, 2015) | ||||||||||||
Mining recovery rate (%)(1) | 85.4 | 85.5 | N/A | |||||||||
Coal preparation plant recovery rate (%)(2) | — | — | N/A | |||||||||
Depth of mine (meters underground) | 68 | 59 | N/A | |||||||||
Average thickness of main coal seam (meters) | 2.8 | 3.9 | N/A | |||||||||
Type of coal | Thermal coal | Thermal coal | N/A | |||||||||
Leased/owned | Owned | Owned | N/A | |||||||||
Average calorific value (Kcal/kg) | 5,170 | 5,237 | N/A | |||||||||
Sulfur content (%) | 0.35 | 0.90 | N/A | |||||||||
Production data: (million tonnes) | ||||||||||||
Approved raw coal production capacity | 1.2 | 3.0 | 4.2 | |||||||||
Designed coal preparation input washing capacity | — | — | — | |||||||||
Raw coal production | ||||||||||||
2011 | 2.3 | 2.1 | 4.4 | |||||||||
2012 | 2.3 | 4.6 | 6.9 | |||||||||
2013 | 2.2 | 4.1 | 6.3 | |||||||||
2014 | 1.8 | 4.1 | 5.9 | |||||||||
2015 | 1.6 | 1.0 | 2.6 | |||||||||
Cumulative raw coal production as of December 31, 2015 | 10.2 | 15.9 | 26.1 | |||||||||
66
| (1) | The mining recovery rate is the rate of the amount of coal recovered from a determined amount of reserves, which is calculated by dividing the actual volume of coal recovered in a year by the volume of reserves mined and consumed in the same year. |
| (2) | “Coal preparation plant recovery rate” refers to the wash plant recovery rate of raw coal used during the production of our coal products. |
67