EXHIBIT 99.1
| New York Analyst Meeting Tom Bonner Vice President, Gas Transportation Adrian P. Chapman Vice President, Regulatory Affairs and Energy Acquisition Harry A. Warren, Jr. President, Washington Gas Energy Services, Inc.June 24, 2004 |
1

| Forward-Looking Statements |
| This presentation and other statements by the company may include forward-looking statements within the meaning of the Private Securities Litigation Reform Act with respect to the outlook for earnings, revenues, and other future financial business performance or strategies and expectations. Forward-looking statements are typically identified by words such as, but not limited to, “estimates,” “expects,” “anticipates,” “intends,” “believes,” “plans,” and similar expressions, or future or conditional verbs such as “will,” “should,” “would,” and “could.” Although the company believes such forward-looking statements are based on reasonable assumptions, it cannot give assurance that every objective will be reached. Forward-looking statements speak only as of today, and the company assumes no duty to update them. |
| In addition to the factors previously disclosed in the company’s filings with the Securities and Exchange Commission, the following factors, among others, could cause actual results to differ materially from forward-looking statements or historical performance: variations in weather conditions from normal levels; changes in economic, competitive, political and regulatory conditions and developments; changes in capital and energy commodity market conditions; changes in relevant laws and regulations, including tax, environmental and employment laws and regulations; legislative, regulatory and judicial mandates and decisions; timing and success of business and product development efforts; technological improvements; the pace of deregulation efforts and the availability of other competitive alternatives; and other uncertainties. The outcome of negotiations and discussions the company holds with other parties from time-to-time regarding utility and energyrelated investments and transactions that are both recurring and nonrecurring may also affect future performance. For a further discussion of risks and uncertainties, see the company’s most recent annual report filed with the Securities and Exchange Commission on Form 10-K and most recent quarterly report on Form 10-Q. |
2
| Sustained Regional Growth and High Quality Customers Tom Bonner Vice President, Gas Transportation Washington Gas June 24, 2004 |
3
| Presentation Outline Introduction Leading Regional Economy and Growth Superior Customer Profile New Business Acceptance Capital Cost Management |
| My presentation will highlight the unique nature of the Washington DC market and some of the recent changes Washington Gas has made in the Gas Transportation Business Unit to take advantage of the marketplace in creating profitable growth and in controlling costs. I will show the unique nature of the Washington DC metropolitan area by showing its significant market strengths and how Washington Gas is controlling costs to maximize the profit from this service area. |
4
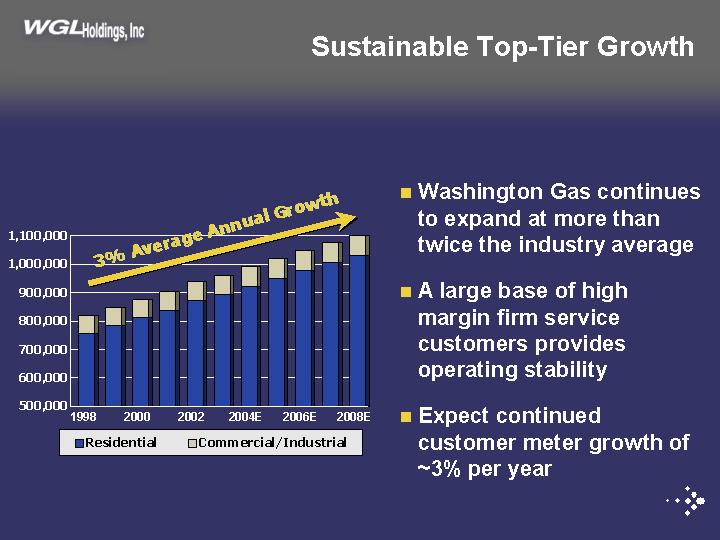
| Sustainable Top-Tier Growth 500,000600,000700,000800,000 900,0001,000,0001,100,000 1998 2000 2002 2004E 2006E 2008EResidential Commercial/Industrial 3%AverageAnnualGrowth3%AverageAnnualGrowthWashington Gas continues to expand at more thantwice the industry average A large base of highmargin firm servicecustomers providesoperating stability Expect continuedcustomer meter growth of~3% per year |
New construction market share: We capture over 90% of the residential new construction market due to the strong preference for natural gas and our established relationships with key influencers (builders and HVAC companies)
•Sustained Growth: WG will expand at more than twice the industry average with approximately a 3% customer growth projected for FY2004. In FY03 we have added approximately 33MM therms. We plan to add approximately 34MM therms/year in FY04 & FY05.
•Customer Segments:
•Approximately 40% of our gas flows to residential customers providing operating stability as this customer class cannot very easily switch to another fuel.
•30% of gas flows to high margin firm commercial and industrial customers—e.g., apt. buildings, universities, and hospitals.—all of which depend on stable supplies of gas to run their business.
•The remaining 30% flows to low margin interruptible customers. These customers, which can and do switch fuel options, account for no more than 2% of our margins.
•Outlook is for continued growth. Dr. Stephen Fuller from George Mason University (& Center for Regional Analysis) projects significant growth in Fairfax, Loudoun & Prince William counties in VA and Frederick county in MD. Overall, by 2025 the Greater Washington region is projected to grow by over 765,000 households (approximately 600,000in our service territory, including multi-family).
5
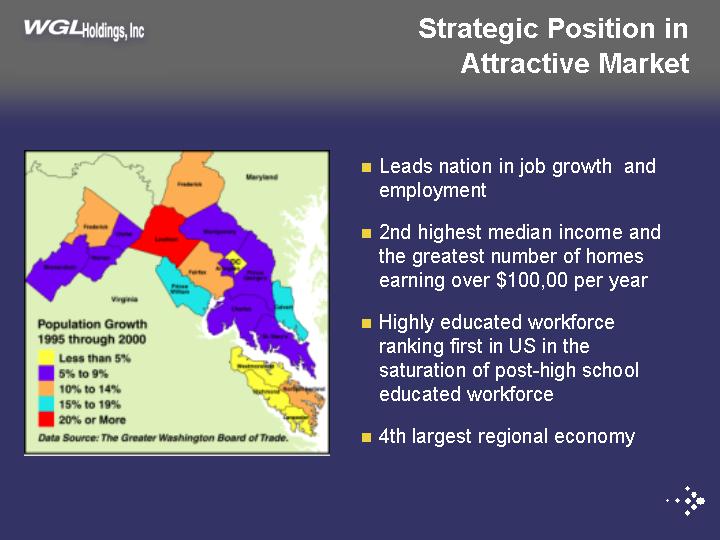
| Strategic Position in Attractive Market • Leads nation in job growth andemployment — 2nd highest median income and the greatest number of homes earning over $100,00 per year — Highly educated workforce ranking first in US in the saturation of post-high school educated workforce 4th largest regional economy |
The strength of the Washington metropolitan area’s growth places it among the nation’s elite regions.
•DC metro area ranks second in the nation for average household income (approximately $84,000) and first in the nation for the number of households with an average annual income over $100,000.
•Well-educated, ranking first in the nation for the saturation of post-high school educated people in the country.
•The leader in job creation by adding 77,000 new jobs in the last 12-months and forecasted to add over 60,000 per year for the next few years. It has the lowest unemployment rate, at 2.8%, of all major US markets.
•Loudoun County Virginia is within Washington Gas’ service territory, and it is the fastest growing county in the US. It has also been named among the 5 best places to live by the American City Business Journal. Fairfax County, also served by Washington Gas, and among the wealthiest in the nation, was named the best place to live for counties over 500,000 people.
•Slow-growth politics were removed from Loudoun County government during its most recent elections.
6
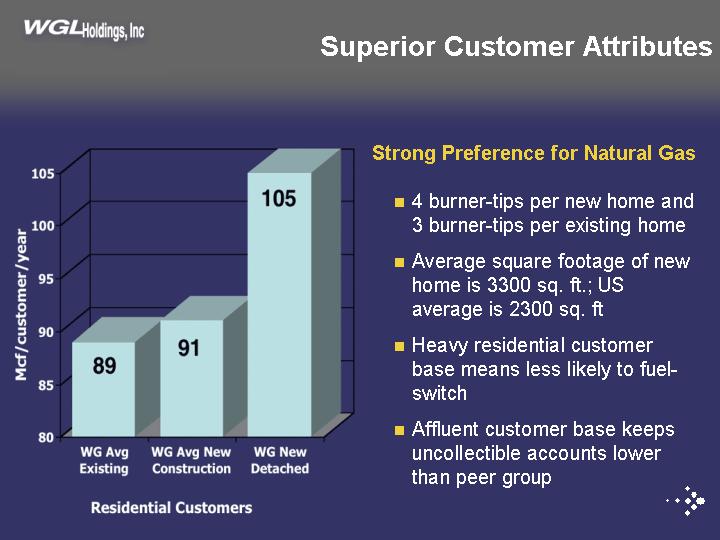
| Superior Customer Attributes Strong Preference for Natural Gas 4 burner-tips per new home and 3 burner-tips per existing home. |
| Average square footage of new home is 3300 sq. ft.; US average is 2300 sq. ft. |
| Heavy residential customer base means less likely to fuel switch |
| Affluent customer base keeps uncollectible accounts lower than peer group |
An affluent workforce, with a rapid high-value job market, creates superior housing demand, not only in numbers but also in size and amenities.
The average new home in the US averages about 2300 square feet, the average new single family detached home in the Washington DC metropolitan area averages 43% larger at 3300 square feet.
These larger new homes consume more natural gas. Average US consumption is 83 mcf per customer per year, while average Washington Gas customer consumption is 89 mcf. Washington Gas new construction residential customers consume 91 mcf (over 105 mcf for detached new construction).
Existing Washington Gas customers average 3 burner-tips per home while a new construction Washington Gas residential customer averages 4 burner-tips per home. Washington Gas also actively promotes gas burner-tips for existing customers through cost-sharing programs with regional and national appliance dealers and manufacturers.
A heavy residential customer base alleviates the fear of fuel-switching by existing customers due to high initial costs.
Finally, the affluent nature of the region is shown as WG’s uncollectible percentage is significantly lower than its peer group, 1.18% vs 1.89% (AGA).
7
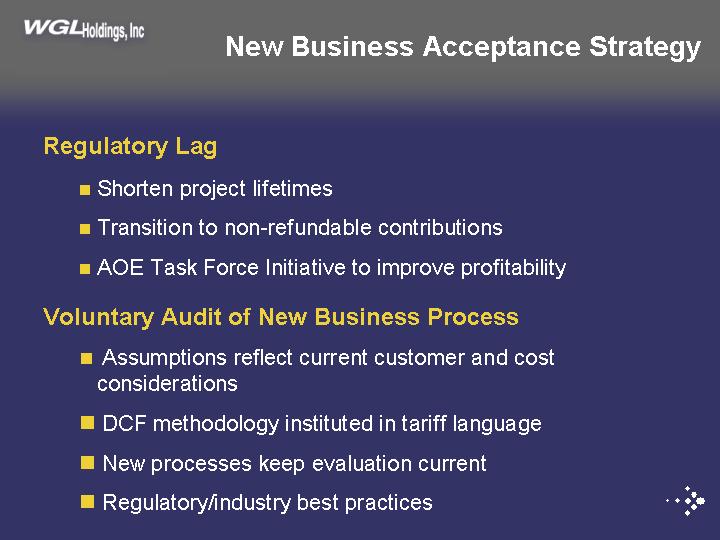
| New Business Acceptance Strategy Regulatory Lag Shorten project lifetimes Transition to non-refundable contributions AOE Task Force Initiative to improve profitability |
| Voluntary Audit of New Business Process Assumptions reflect current customer and cost considerations |
| DCF methodology instituted in tariff language |
| New processes keep evaluation current |
| Regulatory/industry best practices |
Some new initiatives are underway to continue the improvement of new business performance at Washington Gas.
Identify ways to shorten or eliminate Regulatory Lag:
• Shorter project lifetimes will provide for a quicker payback of new business projects.
• Non-refundable contributions will eliminate any refunding obligation associated with new business projects. All monies collected can go directly to lowering capital expenditures.
• An AOE task force is investigating regulatory initiatives to reduce the amount of time involved in getting new business incorporated into ratebase.
Improvements in the way we Evaluate New Business are being audited:
• Newly incorporated assumptions reflect reality (cost escalation, therm degradation, 20-year lifetime).
• DCF methodology instituted in tariff language to allow for inclusion of lifecycle customer costs. Current language only incorporates 2-years.
• If no activity takes place by the customer for one-year, the job is re-costed and re-evaluated.
• Comparison and benchmarking of new business practices to keep current or better than peer group.
8

| Increasing Capital Efficiency $3,203 $3,046 $2,766 $2,628 $2,000 $2,500 $3,000 $3,500 FY02 FY03 FY04YTD FY04E New Construction Cost per Hook-up 18% Reduction |
•The FY04 budgeted cost per hookup represents a 18% decrease from FY ‘02 and a 14% decrease from this year.
•Cost per hook-up continues its downward trend toward the goal for FY04. The YTD on the slide is April’s data. As of May, the average cost per hookup was at $2,725.
9
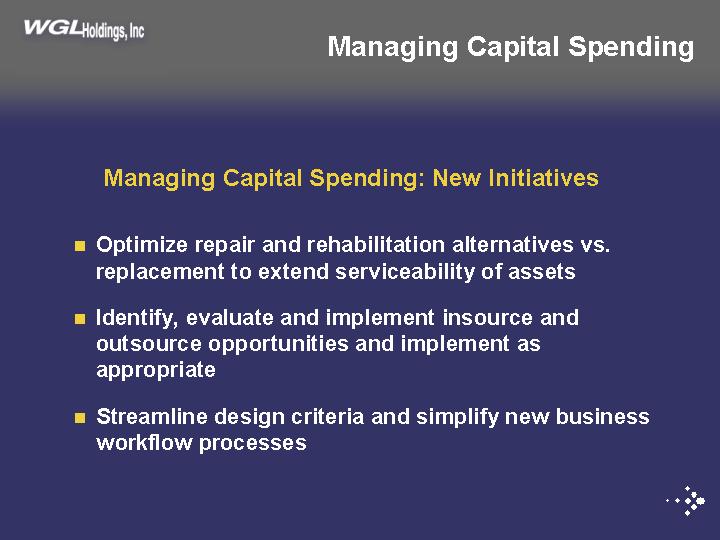
| Managing Capital Spending Managing Capital Spending: New Initiatives Optimize repair and rehabilitation alternatives vs. replacement to extend serviceability of assets Identify, evaluate and implement insource and outsource opportunities and implement as appropriate Streamline design criteria and simplify new business workflow processes |
We now evaluate all of our large replacement projects and where feasible we utilize least costly repair methods, such as internal sealing, lining technology and the latest robotics in place of direct bury replacement.
Recent examples of insourcing are: utilizing company crews in place of more costly contractor services for scattered service replacements and market enhancement services. Recent examples of outsourcing opportunities are leak survey and supply chain operations, including procurement ad warehousing.
We now use builder’s site plans in place of building our own from scratch.
We red-line proposed installations and eliminated “busy” pre-construction drawings.
As-built field documentation has been consolidated to improve accuracy and reduce re-work.
WIN will eliminate redundant data entry into multiple systems.
New construction projects are released to contractors earlier and in larger segments.
10
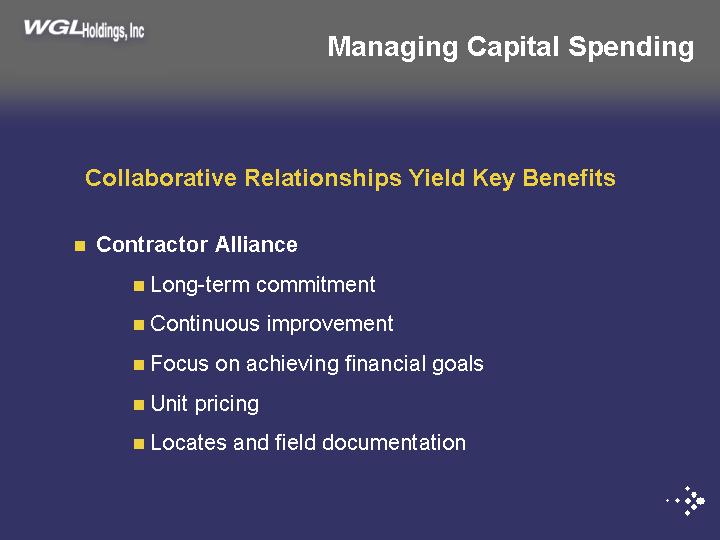
| Managing Capital Spending Collaborative Relationships Yield Key Benefits Contractor Alliance Long-term commitment Continuous improvement Focus on achieving financial goals Unit pricing Locates and field documentation |
We are now building relationships with all stakeholders including pipeline construction contractors, builders and the other occupants of the underground.
First, with our contractors, we have formed alliances. An alliance relationship is characterized by long-term commitment, confidential information sharing, cooperative continuous improvement efforts and sharing of risk and rewards leading to lower construction costs.
11
| Managing Capital Spending |
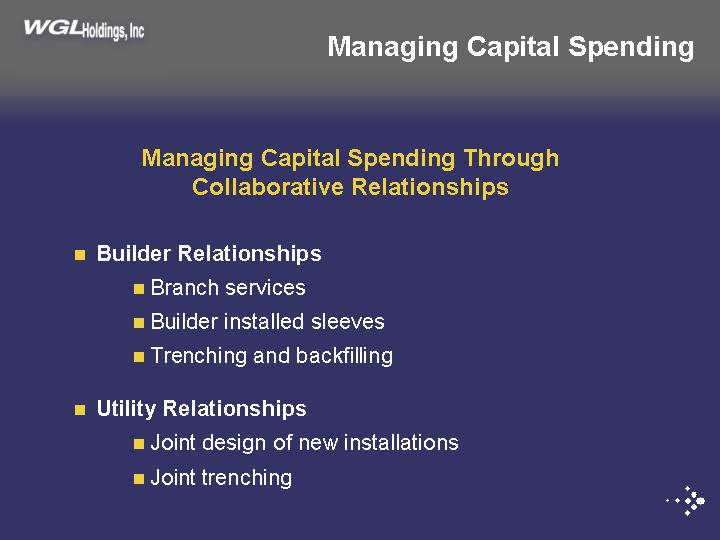
| Managing Capital Spending Through Collaborative Relationships Builder Relationships Branch services Builder installed sleeves Trenching and backfillingUtility Relationships Joint design of new installations Joint trenching |
Secondly, we work with the builder community to reduce our construction costs and offer them options to help offset their contributions while reducing WG installation costs.
And lastly we are working with the other utilities. We currently are conducting a joint trench pilot program to utilize a consolidated design and a single excavation for four utilities (gas, electric, telephone and cable) to reduce installation costs.
12
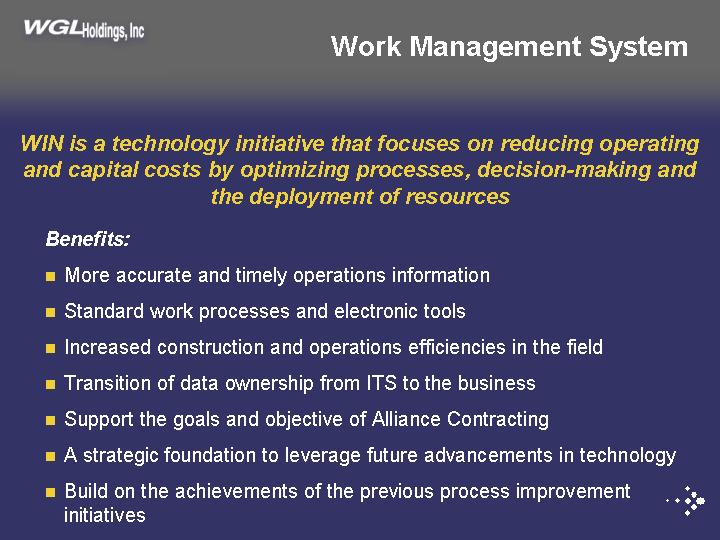
| Work Management SystemWIN is a technology initiative that focuses on reducing operating and capital costs by optimizing processes, decision-making and the deployment of resources |
| Benefits: |
| More accurate and timely operations information Standard work processes and electronic tools Increased construction and operations efficiencies in the field Transition of data ownership from ITS to the business Support the goals and objective of Alliance Contracting A strategic foundation to leverage future advancements in technology Build on the achievements of the previous process improvement initiatives |
Another example of an investment in Technology to improve processes and reduce costs, that we are very excited about, is our soon-to-be implemented work management system.
The phased rollout is scheduled to begin next month.
Some of the benefits of this system are:
| • | Allow us to retire multiple stand-alone, redundant systems |
| • | We will reduce intensive paper-driven workflow |
| • | We will be able to provide customers with a single point of contact |
| • | We will provide project managers with tools and work processes to consistently deliver accurate estimates and construction details to the organization |
| • | We will be able to integrate the key support organizations into the work process to ensure that they provide the needed support in a timely and effective manner | |||
| • | We will automate scheduling and prioritization of work, thereby optimizing utilization of resources in the field and | |||
| • | It will provide us with more and better metrics for measuring performance and quality of work in order to improve efficiency, quality and productivity |
13
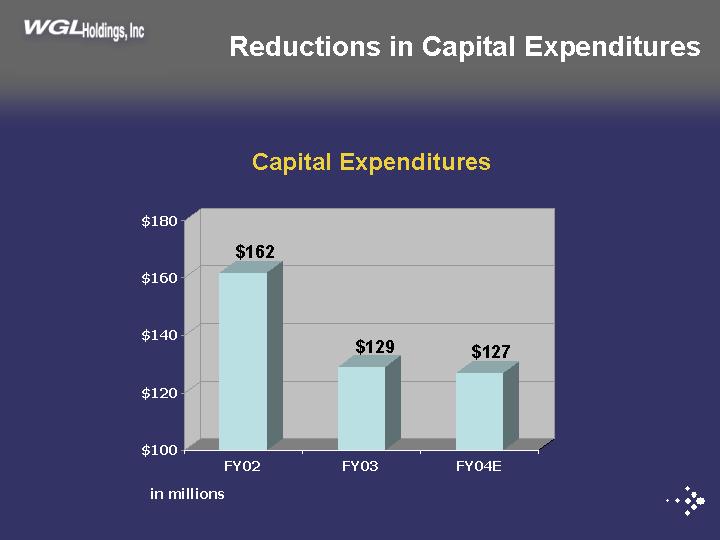
| Reductions in Capital Expenditures Capital Expenditures $162 $129 $127 $100 $120 $140 $160 $180 FY02 FY03 FY04E in millions |
As you can see, we have dramatically controlled CapEx over the past couple of years. We are forecasting to spend approximately $127MM this year compared to $162MM in FY02 or a reduction of 22%.
In the construction area for example, with an estimated savings of $418 per hook-up this year compared to last year, Washington Gas eliminates around $8.9 million from its capital expenditures ($418 * 21,490 hook-ups).
However, the anticipated reduction in capital expenditures in FY04 due to new business hook-ups is not as high as $8.9 million because Washington Gas is projected to have nearly 4,000 more hook-ups in FY04 than FY03 (21,490 vs 17,697). Basically, the per-unit has decreased but the volume has increased.
In FY04 we also took advantage of the new bonus depreciation tax laws and accelerated $4.3 million worth of FY05 projects without increasing the original budget.
14
| Regulatory Update Update Adrian P. Chapman Vice President, Regulatory Affairs & Energy Acquisition Washington Gas June 24, 2004 |
15
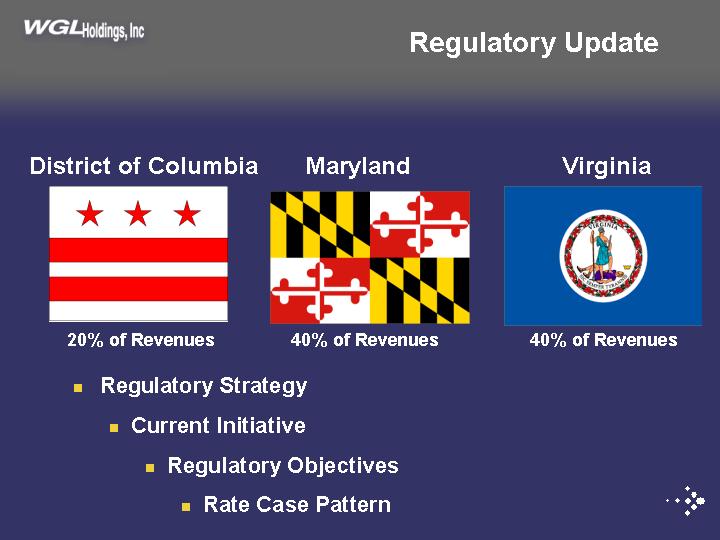
| District of Columbia Maryland Virginia Regulatory UpdateDistrict of Columbia Maryland Virginia20% of Revenues 40% of Revenues 40% of Revenues Regulatory Strategy Current Initiative Regulatory Objectives Rate Case Pattern |
Good Morning,
As you can see from Tom’s presentation we’ve been growing and expect to continue to grow. As such, we are committed to managing our regulatory strategy to ensure that we receive full recovery of and compensatory return on the investment that supports this growth.
We have been involved in a very active multi-jurisdictional regulatory environment and I would like to share with you today our regulatory strategy and successes as well as our objectives and expectation for the pattern of rate cases.
The 20-40-40 split holds true for revenues, investment and throughput.
16
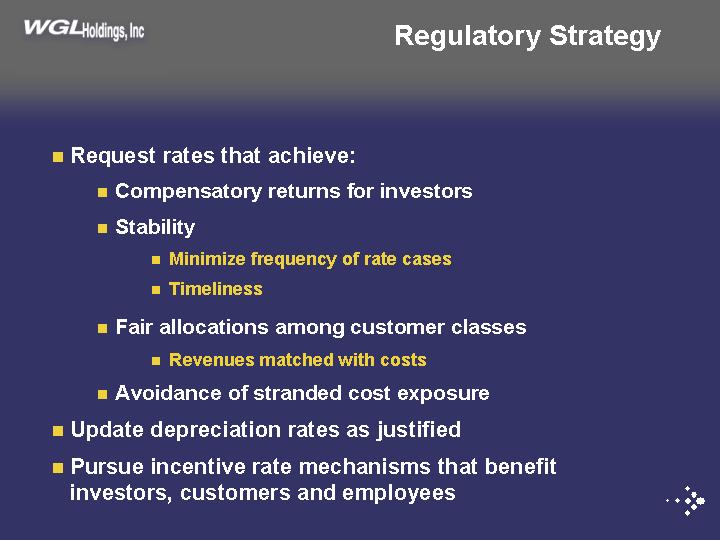
| Regulatory Strategy Request rates that achieve: Compensatory returns for investors Stability |
| Minimize frequency of rate cases Timeliness Fair allocations among customer classes Revenues matched with costs Avoidance of stranded cost exposure Update depreciation rates as justified Pursue incentive rate mechanisms that benefit investors, customers and employees |
| • | We are committed to maintaining the operational and financial health of our system and to seeking compensatory rates that enable us to achieve this objective. We remain committed to our goal of appropriately compensating investors while providing fair, stable rates for our customers. | |||
| • | Given that our regulators generally evaluate rate requests based on historical test periods, this has driven the fact that we have filed multiple cases to achieve compensatory and timely returns in each jurisdiction. | |||
| • | While it may not seem apparent from our recent spate of rate filings, one of our key goals is to achieve stability and to minimize rate cases. Prior to the latest batch of rate filings, we managed to stay out of rate cases for 8 years. After being out for so long, we always knew that it might take more than one round of rate cases to achieve both a rate structure that appropriately reflects our higher operating costs and certain regulatory principles that needed changing due to the passage of time. We have filed admittedly aggressive cases because we were trying to establish a compensatory regulatory platform that will enable us to remain out of rate cases for another extended period. | |||
| • | Our unbundling programs have been designed and implemented to balance our interest in supporting choice, maintaining reliability and managing costs. | |||
| • | Higher depreciation rates will help increase the level of internally-generated cash flow and reduce the need for external borrowing. In all three jurisdictions, we filed for higher depreciation rates. We have implemented higher depreciation rates in VA and slightly lower depreciation rates in DC. We have received a final decision regarding increased deprecation rates in MD, and will reflect that in revised rates within the next month. It had been 20 years since the last regulatory review of depreciation rates. | |||
| • | We continue to review each commission’s perspective on incentive mechanisms to determine what structure may work in future proceedings. | |||
17
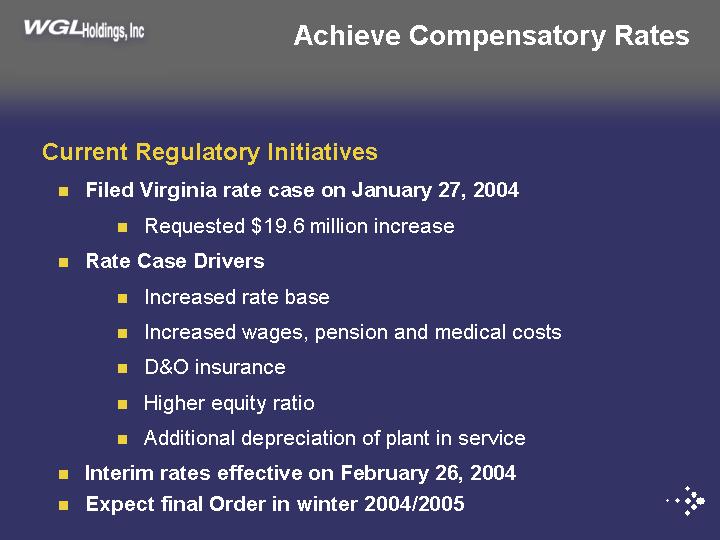
| Achieve Compensatory Rates Current Regulatory Initiatives Filed Virginia rate case on January 27, 2004 Requested $19.6 million increaseRate Case Drivers Increased rate base Increased wages, pension and medical costs D&O insurance Higher equity ratio Additional depreciation of plant in serviceInterim rates effective on February 26, 2004 Expect final Order in winter 2004/2005 |
| • | The Company currently has approximately $19 million in rate relief pending before VA State Corporation Commission. This rate case is necessary to recover costs resulting from growth in rate base and increased O&M expenses since the updated test period of August 2002 in our immediately prior VA rate case. |
| • | The following are reflected in the June 2003 test period in this case: |
Employee wage increases
Employee pension and medical costs
Higher D&O insurance
Increased rate base
Higher equity ratio
Additional depreciation of plant in service
| • | The timing of our current rate case filing in VA positions the Company to have new rates in effect for the 2004-2005 heating season. In fact, interim rates from the most recent Virginia case became effective subject to refund in late February 2004. |
18
| Regulatory Objectives for Compensatory Rates Mitigate regulatory lag Reduce effect of gas cost volatility Adjust for increased efficiency of gas usage Reduce weather-related earnings volatility |
Our objectives in each of our six rate cases have included the following:
Recognizing in rates an annual level of expenses and plant investment reflective of our current and on-going costs. Reaching beyond the historical test period levels of expenses and rate base is critical given the growth on our system discussed by Tom.
We have taken steps to mitigate the negative effects of increasing gas costs on managing working capital requirements. Higher gas costs have placed upward pressure on uncollectible accounts.
Recent rate cases have helped us address the effects of decreasing use per customer.
Successful rate design advocacy has resulted in less sensitivity to the effects of weather on our revenues.
We are involved in a proceeding in Maryland to move uncollectible account costs associated with the gas cost portion of our bill into the gas cost charge to be reconciled annually to the actual level of charge-offs.
19

| Mitigate Regulatory Lag Key initiatives for Timely Recovery of Investment Commission approval for new business acceptance model Increase acceptance of costs incurred beyond test year Suspension statutes support timeliness In place in MD & VA; appropriate for DCExpedited rate cases enable timely recovery In place in VA; appropriate in MD and DCTrackers allow timely recovery of specified expenses In place in DC for pension, OPEBs and regulatory expenses; continue to discuss in MD and VA |
| • | As Tom has mentioned, we have updated our analytical approach to send more appropriate price signals to new customers and to increase new business profitability and the time to achieve profitability. | |||
| • | Given the growth discussed by Tom, it is important that our rates recognize the level of expenses and plant investment reflective of our current and going level costs. | |||
| • | Currently, MD and VA has specific time limitation from date of filing a case to the date rates go into effect subject to refund. These are effective in providing certainty that regulatory actions will take place on a timely basis. The DC 2001 case took a very long time, and while the 2003 case was completed in approximately 10 months, we are considering legislation consistent with MD and VA to provide certainty of the timeline for case prosecution. | |||
| • | We are also considering advocacy for a streamlined rate proceeding less focused on policy issues and more focused on updating the relationship between levels of expense and rate base and the supporting rates. Using this in DC and MD will help mitigate the impact of their focus on a historical test period and the associated limitations. | |||
| • | The application of carrying cost to OPEB tracker balances provides appropriate compensation to the Company for any balances anticipated going forward and prior to recognition in future rates. Trackers have merit where costs are driven by actions outside of the Company’s direct control. However, MD and VA do not generally support trackers with the exception of gas cost recovery. | |||
20
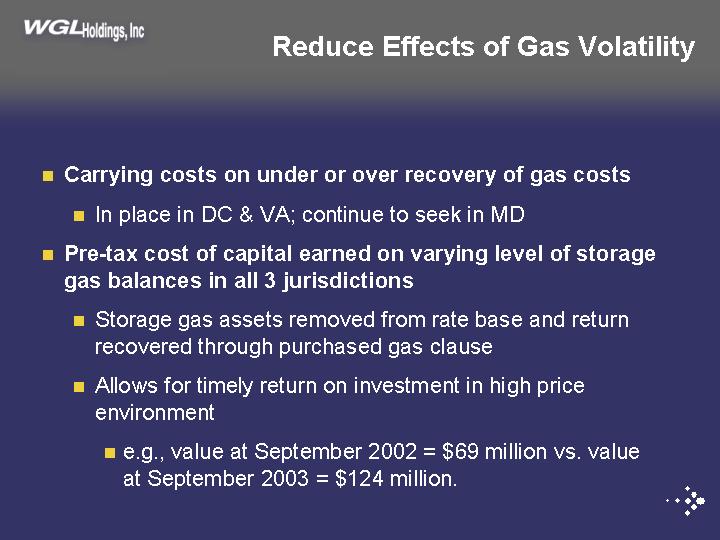
| Reduce Effects of Gas Volatility Carrying costs on under or over recovery of gas costs In place in DC & VA; continue to seek in MDPre-tax cost of capital earned on varying level of storage gas balances in all 3 jurisdictions Storage gas assets removed from rate base and return recovered through purchased gas clause Allows for timely return on investment in high price environment e.g., value at September 2002 = $69 million vs. value at September 2003 = $124 million. |
The last five rates cases in all three jurisdictions did produce tangible results in mitigating the affects of gas cost volatility:
| • | The application of carrying costs to under- and over-collected gas cost balances in DC and VA, now that we are in a sustained period of higher and more volatile gas costs, provides relief as those balances continue to climb on an absolute dollar basis. | |||
| • | Storage Gas inventory carrying costs in Virginia will now track the actual balances rather than be limited to a non-varying test period amount. | |||
21
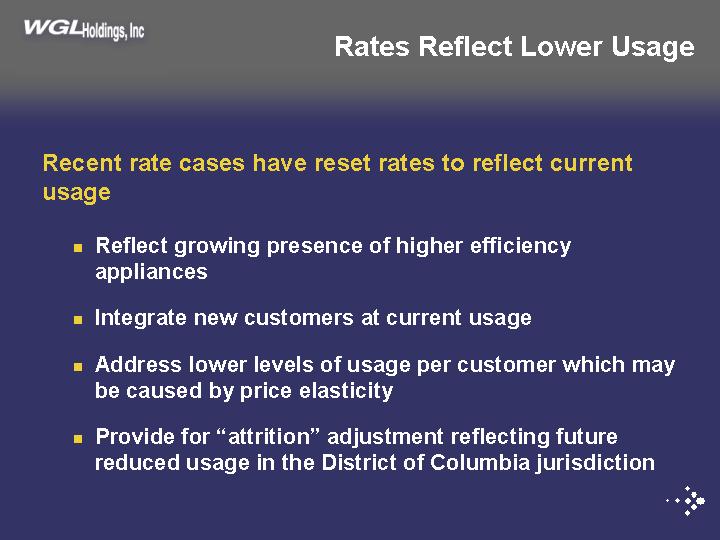
| Rates Reflect Lower Usage Recent rate cases have reset rates to reflect current usage Reflect growing presence of higher efficiency appliances Integrate new customers at current usage Address lower levels of usage per customer which may be caused by price elasticity Provide for “attrition” adjustment reflecting future reduced usage in the District of Columbia jurisdiction |
In our recent cases, we have developed new rates that reflect changes in usage per customer in all three jurisdictions to address higher efficiency appliances, new customer usage profiles and customer’s historical response to changes in prices.
In our last DC case, in addition to updating the billing determinants used to establish new rates based on average usage in the test period, we also added a further adjustment that anticipates continuing conservation in the year that new rates went into effect.
The achievement of a 50% adjustment did help position us to be better prepared to stay out of cases in the future due to the effects of continuing conservation.
22
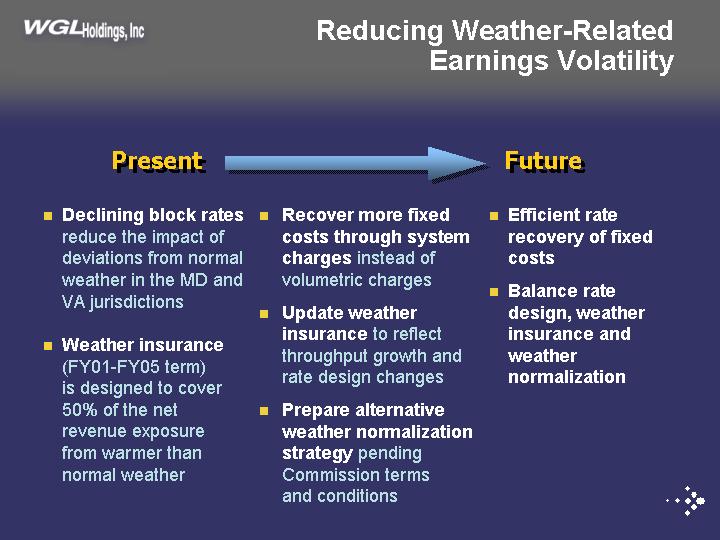
| Reducing Weather-Related Earnings Volatility Declining block ratesreduce the impact ofdeviations from normal weather in the MD andVA jurisdictionsWeather insurance(FY01-FY05 term) is designed to cover50% of the net revenue exposurefrom warmer thannormal weatherRecover more fixedcosts through system chargesinstead ofvolumetric chargesUpdate weatherinsuranceto reflectthroughput growth andrate design changesPrepare alternativeweather normalizationstrategypending Commission termsand conditionsEfficient raterecovery of fixedcosts Balance ratedesign, weatherinsurance andweathernormalizationPresent Future |
| • | To date, rather than proposing “weather normalization” that fully negates the impact of weather, the Company believes its approach to: (1) collect more of the fixed costs through fixed monthly customer charges; (2) continue its utilization of a declining block rate design; (3) set its miscellaneous charges at the cost to provide those services; and, (4) use weather insurance provides a more balanced risk/reward approach as a result of weather variances. | |||
| • | The Company’s current Virginia expedited rates case reflects a continuation of the rate design initiatives and successes of our recent five rate cases. That is, we continue to propose rate designs that mitigates the volatility of earnings resulting from our temperature sensitive loads. | |||
| • | We have made gains in collecting more of our overall revenues through fixed charges or the initial rate blocking in declining block rates, therefore making the Company less sensitive to the earnings volatility effects due to weather. | |||
| • | However, with our 5-year weather insurance policy expiring during 2005, we will review what terms and conditions we want to see in a new policy to reflect our current rate design, customer growth and anticipated continued changes in rate designs in the future. | |||
| • | While we continue to view the WNA provision as somewhat less attractive to our current rate design and weather insurance combination, evolving commission views as to the cost of a WNA may lead us to consider such a provision in the future. | |||
23
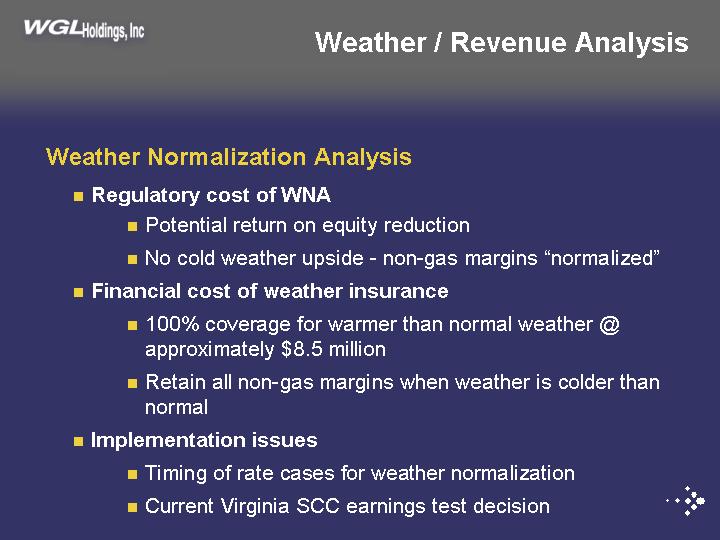
| Weather Normalization Analysis Regulatory cost of WNA Potential return on equity reduction No cold weather upside — non-gas margins “normalized”Financial cost of weather insurance 100% coverage for warmer than normal weather @ approximately $8.5 million Retain all non-gas margins when weather is colder than normalImplementation issues Timing of rate cases for weather normalization Current Virginia SCC earnings test decisionWeather / Revenue Analysis |
| • | Weather normalization techniques that could be incorporated in the rate setting process may result in ROE reductions of between 10 to 50 basis points. BGE gas case from 1999 included a 50 basis point reduction to ROE. Recent VA proceedings for Roanoke Gas and VNG have included ROE adjustments or proposed adjustments ranging from 20-40 basis points on an equivalent basis. Under weather normalization, cold weather revenues are normalized. | |||
| • | The revenue impact of such an ROE reduction would be approximately $3.5 - $7.0 million. This compares to weather insurance payments for effectively 50% coverage on an annual basis of approximately $4.25 million (or $8.5 million for 100% coverage). | |||
| • | While current weather insurance only provides partial protection, the Company’s approach still preserves the upside of colder weather with protection on the downside with insurance. | |||
| • | At this time, the Company continues to support the balanced approach provided by its movements towards a more straight – fixed variable rate design. Also, the ability to match the timing and result of WNA applications in rate cases is problematic. However, the current VA SCC position on the application of an earnings test provides additional incentive for a WNA. The result of our current VA Supreme Court appeal may provide direction to our interest in moving to a WNA in Virginia. | |||
| • | We continue to review the options available to us in preparation for the expiration of our current weather insurance policy. However, we currently favor the weather insurance approach. | |||
24
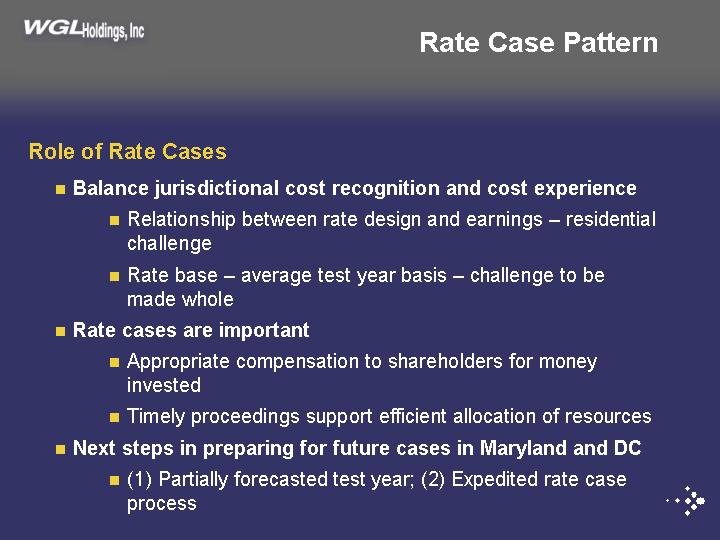
| Role of Rate Cases Balance jurisdictional cost recognition and cost experience Relationship between rate design and earnings – residentialchallenge Rate base – average test year basis – challenge to bemade wholeRate cases are important Appropriate compensation to shareholders for moneyinvested Timely proceedings support efficient allocation of resourcesNext steps in preparing for future cases in Maryland and DC (1) Partially forecasted test year; (2) Expedited rate caseprocessRate Case Pattern |
| • | Between our recently completed cases and the current Virginia expedited rate case, we have had two cases in each of our three jurisdictions. 2. We continue to spend capital dollars to serve a growing customer base. | |||
| • | Having such a significant amount of existing residential load and anticipated future load, will continue to challenge our ability to achieve rates in each jurisdiction that fully represent the current cost basis. Typically, residential rates are subsidized by non-residential rate classes. The use of average rate base and very little updating through the rate case period also provides limitations in Maryland and DC. | |||
| • | Managing the cost of new business and managing our expense will address our future ability to stay out of cases. The issues Tom raised regarding managing growth and our 5-year plan goals for free cash flow will play a key role in managing within existing rates. | |||
| • | Should we file again in the District and Maryland jurisdictions, we will begin to implement at least partially forecasted test periods to address this need to balance costs and revenues. Also, we will attempt to modify through legislation the rate case rules to support an expedited rate case process in MD and DC similar to VA. | |||
| • | We will continue to monitor jurisdictional returns and make future decisions regarding additional rates cases. | |||
25
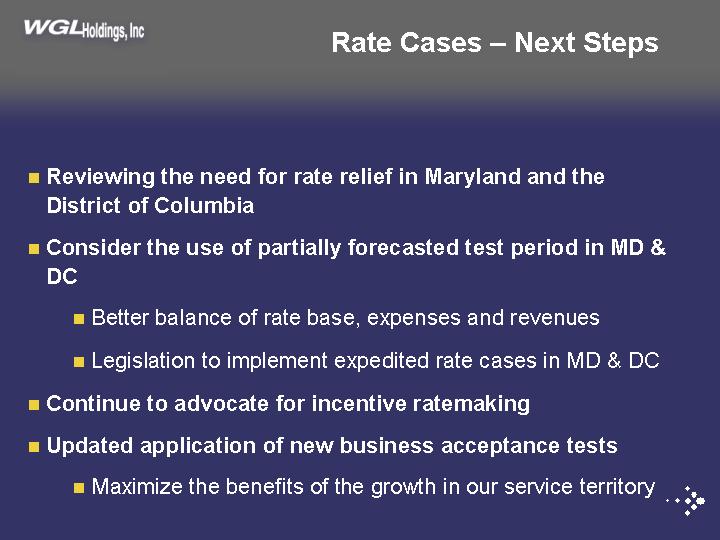
| Reviewing the need for rate relief in Maryland and the District of Columbia Consider the use of partially forecasted test period in MD & DC Better balance of rate base, expenses and revenues Legislation to implement expedited rate cases in MD & DCContinue to advocate for incentive ratemaking Updated application of new business acceptance tests Maximize the benefits of the growth in our service territoryRate Cases – Next Steps |
| • | We have not made filings in DC and MD recently; however we continue to review the need for rate relief in those two jurisdictions. | |||
| • | To the degree that we do file another case in either jurisdiction, we will consider using partially forecasted test periods to align better our costs and rates. | |||
| • | We are also considering legislation to support expedited rate cases with the intention of using such a process to match better our cost structure with current rates. | |||
| • | The signals we are receiving from our commissions regarding an IRP are that they prefer an asymmetric sharing provision. Sharing overearnings, not underearnings. They also look for a commitment to stay out of rate cases for a period of time. Something which would be difficult given their current preference for historical test periods. | |||
| • | We will continue to advocate new business tests that allow us to speed up the time by which new business becomes profitable while sending the correct price signals to the marketplace to continue to attract new customers to our system. | |||
26
| Washington Gas Energy Services Business Strategy, Progress and Prospects Harry A. Warren, Jr. President, Washington Gas Energy Services June 24, 2004 |
Good morning/afternoon. Good to see many of you again.
In the next 10 to 15 minutes I’d like to give you an overview of our Energy Services business. Toward the end I will fill you in on developments in the Maryland retail electric markets which are important to us.
I will move through my presentation as efficiently as I can to leave time for your questions, which I would ask you kindly to hold until the end.
27
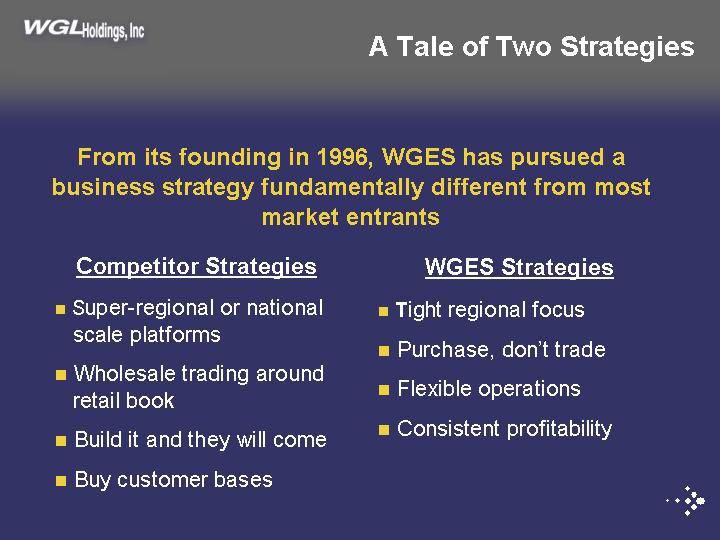
| A Tale of Two Strategies From its founding in 1996, WGES has pursued a business strategy fundamentally different from most market entrants Competitor Strategies Super-regional or national scale platforms Wholesale trading around retail book Build it and they will come Buy customer basesWGES Strategies Tight regional focus Purchase, don’t trade Flexible operations Consistent profitability |
| In discussing our business and our strategy, we think it is helpful to clarify what has made us different and what has made us successful in the business of competitive energy retailing. This industry has seen more failures than successes, and we believe that our success has been the result of our approach to the business. | ||||
| If we look back several years and review the business models of most market entrants, we see very ambitious strategies. Many tried to build businesses that covered large regions of the country if not the entire nation. In putting together their energy portfolios, they tended to mix a significant amount of wholesale trading with the purchasing of their retail supplies. They built large billing and call center infrastructures to support what they projected would be enormous customer bases, and in many cases they were willing to pay dearly to acquire initial customer bases projecting future payoffs. The common thread was that an energy retailer had to be very big, and get big fast before anyone else did. | ||||
| WGES took a very different approach. We began with and maintained a tight regional focus, leveraging our local market knowledge and building local market share. We purchased energy to supply our retail needs, and were resolute in not entering the wholesale trading business through the back door. We used outsourcing and billed through utilities to minimize our infrastructure costs, and achieve flexibility as the market developed. And most importantly, we were intent on being profitable from the outset, not tolerating losses justified by future projected profits. | ||||
28
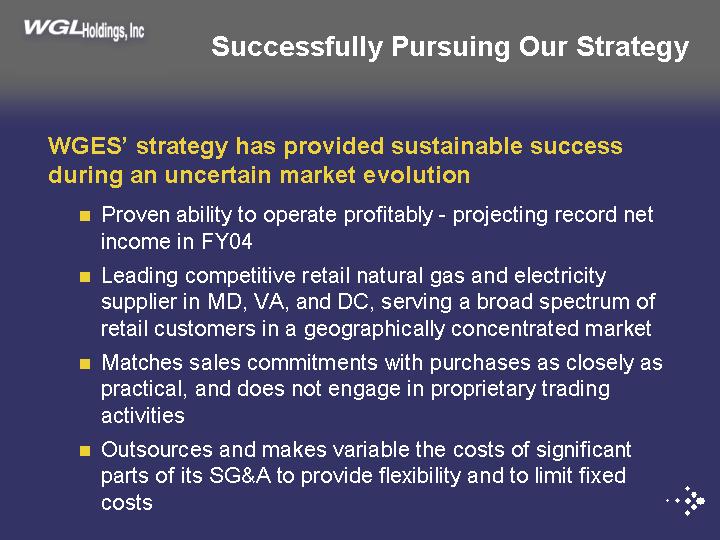
| Successfully Pursuing Our Strategy WGES’ strategy has provided sustainable success during an uncertain market evolution Proven ability to operate profitably — projecting record net income in FY04 Leading competitive retail natural gas and electricity supplier in MD, VA, and DC, serving a broad spectrum of retail customers in a geographically concentrated market Matches sales commitments with purchases as closely as practical, and does not engage in proprietary trading activities Outsources and makes variable the costs of significant parts of its SG&A to provide flexibility and to limit fixed costs |
And so, as our business continues to navigate the uncertain market development that still feels the repercussions of California and Enron, we continue to stick to our strategies, and succeed with them.
We continue to achieve what few if any other competitive retail suppliers have achieved, a nearly unbroken record of profitability since we began operations. And we are projecting record net income for FY04.
We remain focused on the Maryland/DC/Virginia region, and maintain a leading overall position in that market, serving a broad and diverse customer base.
We remain committed to a very conservative supply strategy, matching our retail sales commitments with wholesale purchases as closely as we believe is practical.
We continue to outsource to provide operational flexibility in matching resources to needs and opportunities, and financial flexibility to match costs to revenues and margins.
29
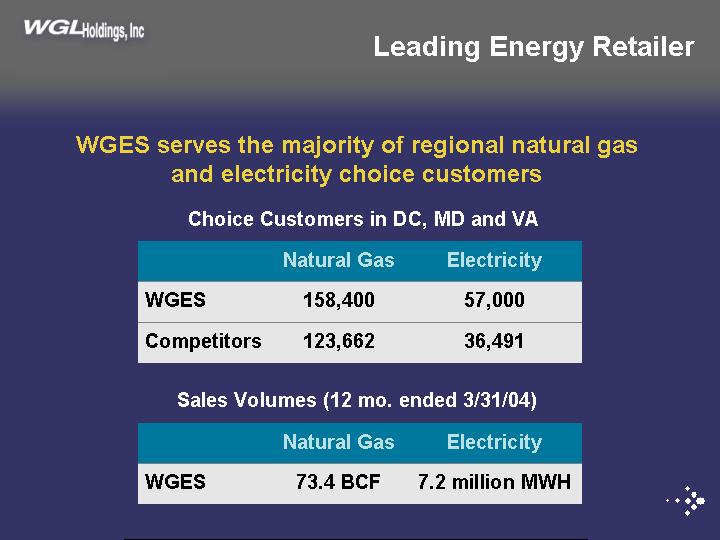
| Leading Energy Retailer WGES serves the majority of regional natural gas and electricity choice customers Choice Customers in DC, MD and VA Sales Volumes (12 mo. ended 3/31/04) 57,000 158,400 WGES 36,491 123,662 Competitors Electricity Natural Gas 7.2 million MWH 73.4 BCF WGES Electricity Natural Gas |
To drill down, briefly on a few of those aspects, when I say that we are the leading competitive energy retailer in the Maryland, DC and Virginia markets, quite simply I mean that we serve the majority of all customers who choose alternative energy suppliers in this region. And that is true for both natural gas and electricity.
These figures are based on our customer counts, which are routinely provided in the WGL Holdings quarterly publications, and on information on the total numbers of customers choosing as reported on state PSC web sites.
Our most recent 12 months sales volumes put our customer base into perspective for you, and these are impressive volumes. We did a little review recently of data from AGA and from the Energy Information Administration. Based on that data, it would appear that WGES would rank among the top 35 natural gas utilities in the U.S. in sales to end-users. On the electric side WGES would rank 89th out of the 230 investor owned utilities listed by EIA and we were 8th among 130 competitive suppliers, again in terms of sales to end-users.
30
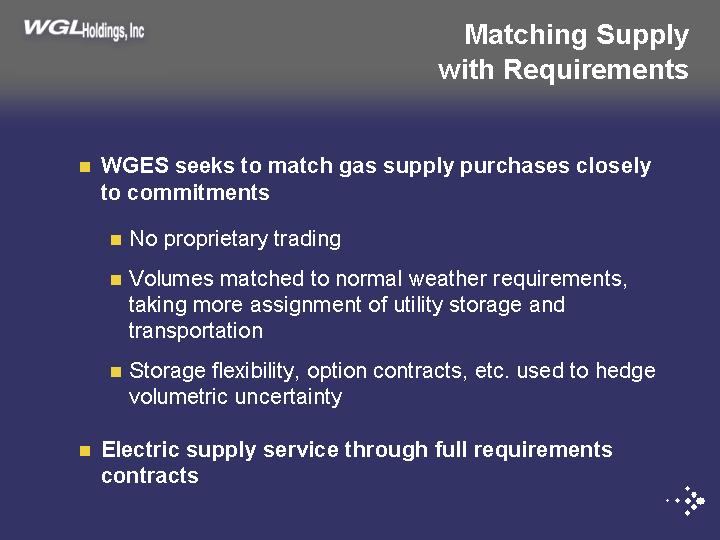
| Matching Supply with Requirements WGES seeks to match gas supply purchases closely to commitments No proprietary trading Volumes matched to normal weather requirements, taking more assignment of utility storage and transportation Storage flexibility, option contracts, etc. used to hedge volumetric uncertaintyElectric supply service through full requirements contracts |
With regard to our efforts to match our retail energy commitments closely with our wholesale energy purchases, we have different approaches to that on the natural gas and electric sides of the business, but in neither case have we or do we engage in proprietary trading.
In the gas business, we create a supply portfolio generally built to match our normal weather requirements. Traditionally we have purchased most of our gas on a city gate delivered basis from a number of wholesale suppliers. Local utilities have begun to require us to take mandatory assignment of their transportation and storage contracts causing our approach to evolve.
To hedge the risk of matching our gas supplies to the varying, weather-related needs of our full requirements fixed-price gas customers, we use a combination of storage flexibility and options contracts.
On the electric side of the business, our current approach has been to enter into full requirements contracts with our wholesale suppliers that present us with no volumetric or price risk as the retailer. At the very outset of electric competition we felt that minimizing market price exposure was very important to our retailing model, and that has worked well for us.
31

| Matching Supply with Requirements Portfolio Risk Management WGES has managed its gas supply portfolio throughout volatile markets and continued to deliver profitable results Electric supplier base is being diversified, with same low-risk approach Counterparty credit arrangements are solid |
We have shown the ability to manage our portfolio risks through all of the price volatility of recent years, and through all of the wholesale supplier difficulties of recent years as well. Last year, Fiscal 2003, in particular, we faced a very bad gas market at the end of the winter. Our disciplined approach, however, minimized our exposure to those conditions, and we still turned in a solid profitable year.
We have been diversifying our electric supplier base in recent months, but with the same low-risk approach we have always taken.
We are very focused on counter-party credit, as everyone is in our industry, and believe that we have the proper industry standard protections in place in that regard as well. And we think it is important in that regard to point out that we have never faced any rejection or renegotiation of our pre-petition Mirant contracts based on the credit protections we had put into place there.
32
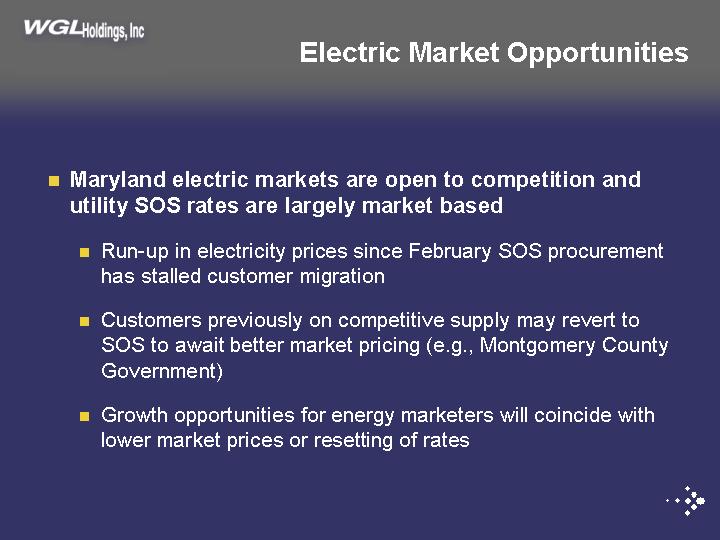
| Electric Market Opportunities Maryland electric markets are open to competition and utility SOS rates are largely market based Run-up in electricity prices since February SOS procurement has stalled customer migration Customers previously on competitive supply may revert to SOS to await better market pricing (e.g., Montgomery County Government) Growth opportunities for energy marketers will coincide with lower market prices or resetting of rates |
The hot issue, in terms of our progress in the marketplace here late in FY04, is the development of the Maryland electric markets. In February, the Maryland electric utilities took competitive wholesale supply bids for their standard-offer generation service, and the rates based on the contracts awarded go into effect on July 1st. This is an important move forward in the development of the competitive marketplace. In fact, we expected the implementation of these new rates to create a new wave of customer migration to competitive suppliers.
As we are all aware, however, between February and today we have seen a significant increase in forward market prices for electricity, in line with the run-up in gas and oil prices. So, as these new utility SOS rates go into effect based on those contracts executed in February, they are looking quite attractive relative to offers that marketers can make at this time. As a result, customers are not flocking to competitive suppliers right now. In fact, customers who had been taking competitive supply service may revert back to utility SOS to take advantage of this pricing. This has been pretty well reported in the trade press.
So, new growth opportunities for competitive retail suppliers are currently awaiting either a cooling off in forward electric prices, or if prices do not cool down, the eventual resetting of utility rates again next year.
33
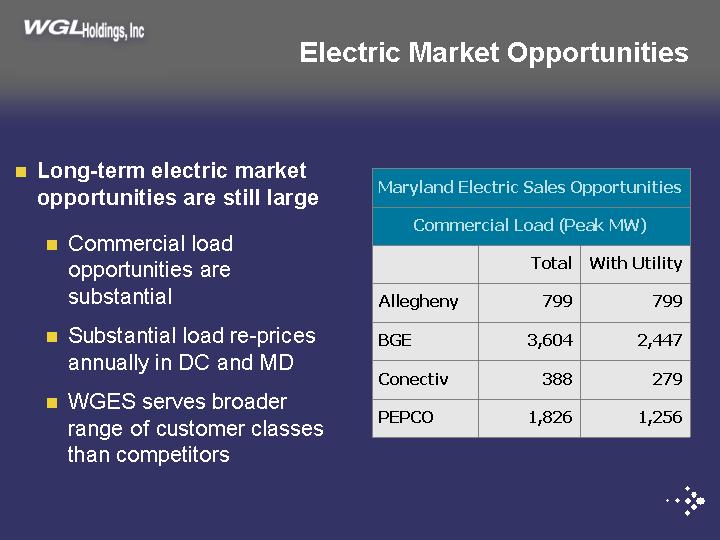
| Electric Market Opportunities Long-term electric market opportunities are still large Commercial load opportunities are substantial Substantial load re-prices annually in DC and MD WGES serves broader range of customer classes than competitors799 799 Allegheny 2,447 3,604 BGE 279 388 Conectiv 1,256 1,826 PEPCO With Utility Total Commercial Load (Peak MW) Maryland Electric Sales Opportunities |
Long-term, of course, the opportunities in the electric market are very large.
Commercial load opportunities alone are substantial, and these customers are generally prepared to respond quickly to price incentives.
In Maryland, the SOS load of utilities will be bid out each year, so pricing gets reset every year, largely to prevailing market prices. And I’d also note that DC is planning to go through the same process as Maryland later this year, with new rates going into effect in February. So, every several months, some new groups of regional customers will be getting their generation service prices reset and that should keep a flow of opportunities available to competitive suppliers.
The fact that WGES serves a broad range of customer classes positions us to take advantage of opportunities, wherever they lie.
34
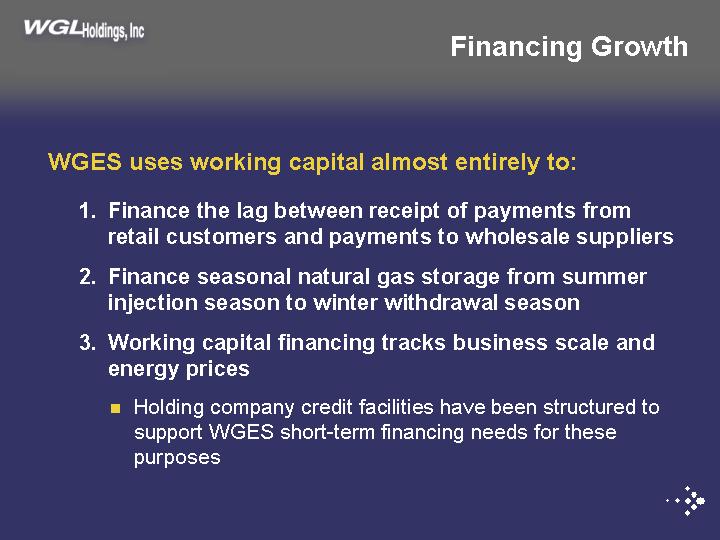
| Financing Growth WGES uses working capital almost entirely to: 1. Finance the lag between receipt of payments from retail customers and payments to wholesale suppliers 2. Finance seasonal natural gas storage from summer injection season to winter withdrawal season 3. Working capital financing tracks business scale and energy prices Holding company credit facilities have been structured to support WGES short-term financing needs for these purposes |
One final issue that may be receiving your analytical attention that we’d like to review, is WGES’ needs for working capital.
The primary use of working capital at WGES is to finance the lag between receiving payment from our retail customers and paying our wholesale suppliers.
Second, like our sister gas utility, we inject natural gas into storage in the summer for withdrawal in the winter.
Both of these requirements track our business scale and track energy prices.
In FY03, our average daily borrowings were about $42 million, and that will be up in FY04 due to recent and current higher energy prices.
The holding company credit facilities recently negotiated have been structured to support, among other needs, WGES’ financing of these short -term assets.
35
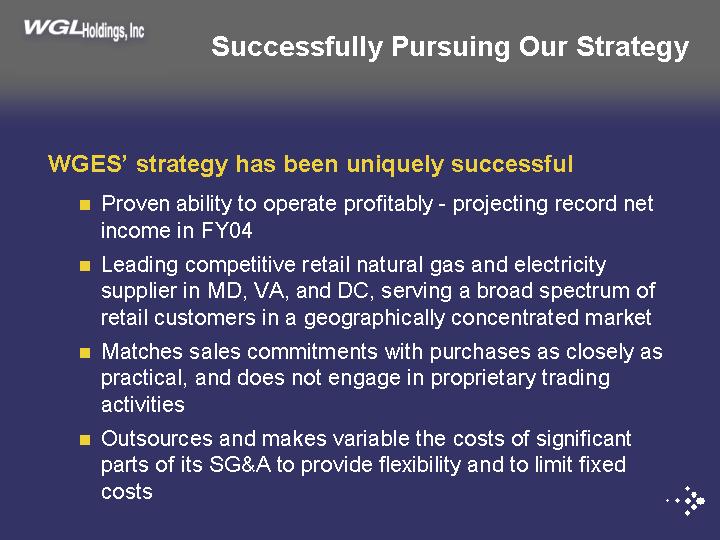
| Successfully Pursuing Our Strategy WGES’ strategy has been uniquely successful Proven ability to operate profitably — projecting record net income in FY04 Leading competitive retail natural gas and electricity supplier in MD, VA, and DC, serving a broad spectrum of retail customers in a geographically concentrated market Matches sales commitments with purchases as closely as practical, and does not engage in proprietary trading activities Outsources and makes variable the costs of significant parts of its SG&A to provide flexibility and to limit fixed costs |
That concludes my formal remarks.
I’d be happy to take your questions.
36