UNITED STATES
SECURITIES AND EXCHANGE COMMISSION
WASHINGTON, D.C. 20549
FORM 10-K
| x | ANNUAL REPORT PURSUANT TO SECTION 13 OR 15(d) OF THE SECURITIES EXCHANGE ACT OF 1934 |
For the fiscal year ended December 31, 2006
| ¨ | TRANSITION REPORT PURSUANT TO SECTION 13 OR 15(d) OF THE SECURITIES EXCHANGE ACT OF 1934 |
For the transition period from to
Commission file number: 0-23489
Access Worldwide Communications, Inc.
(Exact name of registrant as specified in its charter)
| | |
| Delaware | | 52-1309227 |
(State or other jurisdiction of incorporation or organization) | | (I.R.S.Employer Identification No.) |
| | |
| 1820 North Fort Myer Drive Arlington, VA | | 22209 |
| (Address of Principal Executive Offices) | | (Zip Code) |
Registrants telephone number including area code (703) 292-5210
Securities registered pursuant to Section 12(b) of the Act:
| | |
| Title of each class | | Name of each exchange on which registered |
| None | | None |
Securities registered pursuant to Section 12(g) of the Act:
Common Stock, $0.01 par value.
(Title of class)
Indicate by check mark if the registrant is a well-known seasoned issuer, as defined in Rule 405 of the Securities Act. Yes ¨ No x
Indicate by check mark if the registrant is not required to file reports pursuant to Section 13 or Section 15(d) of the Exchange Act. Yes¨ Nox
Indicate by check mark whether the registrant (1) has filed all reports required to be filed by Section 13 or 15(d) of the Securities Exchange Act of 1934 during the preceding 12 months (or for such shorter period that the registrant was required to file such reports), and (2) has been subject to such filing requirements for the past 90 days. Yes x No ¨
Indicate by check mark if disclosure of delinquent filers pursuant to Item 405 of Regulation S-K is not contained herein, and will not be contained, to the best of registrant’s knowledge, in definitive proxy or information statements incorporated by reference in Part III of this Form 10-K or any amendment to this Form 10-K. ¨
Indicate by check mark whether the registrant is a large accelerated filer, an accelerated filer, or a non-accelerated filer. See definition of “accelerated filer and large accelerated filer” in Rule 12b-2 of the Exchange Act.
Large accelerated filer ¨ Accelerated filer ¨ Non-accelerated filer x
Indicate by check mark whether the registrant is a shell company (as defined in Rule 12b-2 of the Exchange Act). Yes ¨ No x
As of March 15, 2007, the aggregate market value of the registrant’s common stock held by non-affiliates of the registrant was $13,645,358 based on the closing price as reported on the National Association of Securities Dealers Automated Quotation System National Market System. The number of shares outstanding of the Company’s Common Stock, $0.01 par value per share is 17,679,065 as of March 28, 2007.
DOCUMENTS INCORPORATED BY REFERENCE
Portions of the Registrant’s Proxy Statement relating to the Registrant’s Annual Meeting of Stockholders to be held on May 24, 2007 are incorporated by reference into Part III of this Form 10-K where indicated.
TABLE OF CONTENTS
i
PART I
For convenience, the terms “Access Worldwide,” “Access,” “we,” “our,” “us” or the “Company” refer to Access Worldwide Communications, Inc. and/or, as the context requires, one or more of our subsidiaries.
The following discussion of our business should be read in conjunction with Selected Financial Data and our Consolidated Financial Statements and the Notes thereto included elsewhere in this Form 10-K.
General
Established in 1983, today Access Worldwide Communications, Inc. has more than 1,000 employees in five locations across the United States (“U.S.”) and the Philippines. Access Worldwide is a premier provider of business process outsourcing (“BPO”) solutions focused on helping our clients cost-effectively acquire, retain, and profitably grow their customer base. We provide a full suite of inbound and outbound sales, customer care, marketing, IT, and back-office services in multiple languages, across all communication channels (e.g. phone, email, Internet, mail). Our clients are in a wide variety of industries including telecommunications, financial services/banks, media/publishing, and consumer product companies.
Given that each of our clients face unique challenges, we combine leading edge technology, a global, well-educated workforce and a value-added approach to provide our clients with optimal scalability and choice. Whether it is a highly targeted sales campaign carried out by one of our U.S. communications centers, or a complex customer care application serviced in the Philippines, Access Worldwide has the resources in place to meet our clients expectations. We specialize in, and have a proven track record of success, supporting the following types of programs:
| | | | |
Customer Acquisition: | | Customer Care: | | Technical Support/Help Desk: |
| Inbound/Outbound Sales | | Customer Service/Retention | | Tier 1 Issue Resolution |
| Order Entry/Up-sell | | Retention Sales | | Hardware/Software Support |
| Lead Generation | | Billing Inquires & Adjustments | | |
| Appointment Setting | | | | |
Our mission at Access Worldwide is to provide our clients with “superior service” by helping them cost-effectively obtain, retain, and profitably grow their businesses though the professional outsourcing services we provide. We accomplish this by helping our clients select the most appropriate location (U.S. or off-shore), agents, and mix of services to meet their unique challenges.
We currently operate five state-of-the-art communication centers worldwide to provide our clients with not only maximum staffing flexibility and scalability, but with specialized resources they need to meet their specific sales and customer service objectives. We have strategically located our communication centers to take advantage of significant labor pools supporting many of the various languages spoken in the U.S.
The Philippines Off-Shore Advantage
The Philippines offers a large pool of highly-skilled and college educated workers. The Philippines is unique compared to other offshore locations, with its strong service oriented society, American English proficiency and great affinity for American culture. In communication centers, Filipinos excel at quickly solving customers’ problems, and then in effectively cross-selling additional products and services.
With a population of approximately 86 million people, the Philippines has the third largest English-speaking population in the world. Each year approximately 500,000 English speaking college graduates enter the workforce and with proper training quickly become highly skilled customer service agents who are career oriented, passionate about their jobs, and great sales generators.
Communication centers are people businesses mixed with advanced technology. The Philippines has an established communications infrastructure with high-speed global communication networks and integrated phone, email and chat systems. Filipino customer service representatives are able to provide superior outsourced services that turn communication centers into profit centers.
Metro Manila, centrally located in the region, is the home of the Philippines national government. This area has developed into a commercial center and is quickly becoming a BPO hub. The city has a large skilled labor resource base, housing 81 higher education institutions and 1,600 other schools and enjoys a literacy rate of approximately 92%. It has a stable power supply, sufficient IT capabilities, a solid public transportation system and a busy international airport.
1
Industry Experience
For nearly 25 years now we have been helping clients ranging from small and mid-size niche providers to Fortune 500 conglomerates acquire, service, retain, and grow their customer base through the high quality, cost-efficient, and scalable outsourcing services we provide.
We have successfully implemented inbound, outbound and blended communication center applications for our clients in the following industries:
| | • | | Financial/Banking Services; |
| | • | | Telecommunications; and |
We have provided support in over 17 different languages, across multiple channels (e.g. phone, email, Internet, mail, etc.), and we constantly add newcomplementary services to the mix (e.g. IVR, back-office processing, transcription, etc.) to meet specific customer needs.
Our Industry
Business Process Outsourcing is the leveraging of technology or specialist process vendors to provide and manage an organization’s critical and/or non-critical enterprise processes and applications. The most common examples of BPO are call/communication centers, human resources, accounting and payroll outsourcing. BPO may involve the use of both on-shore, or U.S. based operations, and off-shore, or operations located in countries outside the U.S., such as the Philippines. BPO allows the company to focus on what it does best, its core business practices, and outsources process driven functions, which others can do more cost effectively and efficiently.
BPO in the Philippines is an emerging industry fueled mostly by customer care, medical transcription, software development, animation, and shared services. In 2005 there were approximately 112,000 people working in call/communication centers bringing in about $1.12 billion in revenue. Though customer care communication centers form the largest part of the BPO boom locally, the Philippines’ language proficient information technology, human resource, and finance/accounting professionals are significant contributing factors as well. The proficiency of many Filipinos in the English language is a major factor in the growth of BPO in the Philippines. BPO is a fast growing industry, and is expected to grow 10 percent per year from $140 billion in 2005 to over $220 billion by 2010 (Logica CMC Study).
Our Services
Our state-of-the-art communications centers in both the U.S. and the Philippines are strategically located to take advantage of significant labor pools supporting many of the various languages spoken in the U.S. We have successfully implemented inbound, outbound and blended sales and customer support applications, hardware and software support, and back-office processing, among others. Based on our experience, we are capable of serving a multitude of markets that include telecommunications, financial services and banking, media/publishing, and consumer product companies.
Multilingual Capabilities
We literally “speak the language” of the marketplace, including: English, Spanish, French, Cantonese, Mandarin, Japanese, Korean, Tagalog, and Vietnamese. Our multicultural and multilingual staff has executed more than 400 marketing campaigns, customer activations, and customer service programs all in the language of cultural origin. This type of target marketing has fueled new growth and delivered increased revenue for a number of our clients.
We have found speaking to prospects and customers in their native language is an often over-looked foundation necessary to successfully service today’s diverse cultural marketplace. Over the years, statistics have shown sales conducted in-language deliver a 20%-30% conversion rate over English used on the same targets. The ability to communicate with a client’s prospects or customers in their native language has proven to deliver: significant retention of existing customer base; increased sales revenues; higher levels of understanding; and effective customer compliance.
By a client outsourcing its multicultural needs, it can reap the following advantages: (a) efficient utilization of its existing in-house resources, (b) access to state-of-the-art technology without capital expenditure, (c) access to a large pool of in-language agents, (d) elimination of the need to hire and train additional staff, (e) increased speed of execution for new products and services, and (f) instant expansion of its existing capacity.
We have a proven track record that clearly demonstrates our ability to deliver the most complex applications, while remaining sensitive to both the client’s and prospects needs. Our philosophy dictates that we establish a comprehensive business relationship with our clients in order to deliver a seamless experience for the external customer that is consistent with their overall vision and expectations.
2
Our Training
For two decades, we have combined proven processes, extensive experience and quality people to deliver the ultimate in telesales and customer care. We create a relationship with our clients in order to understand their business, goals and overall objectives. That information is communicated to the staff to provide a seamless experience for a client’s prospects and customers. If the client has training materials, we review the documents and move directly to a train-the-trainer methodology. If training materials are not available, our team collects the necessary information and develops the required modules to successfully complete the task. It all starts with finding the right people and we do an exceptional job of locating the right talent to support our clients’ applications.
At Access we deploy talented, proactive, and exceptionally well trained people on every campaign in order to deliver our clients the ultimate in performance. We gain a complete understanding of our client needs, goals, and overall program objectives, and then customize the recruiting and selection process to uncover highly-qualified employees who will excel in delivering client-specific solutions.
Whether we utilize existing personnel or recruit new candidates, all candidates are thoroughly screened through written tests, telephone interviews and role-playing scenarios before being deployed to service a program. Each applicant is rigorously tested and their specific customer service or sales experience is then rated to individual client requirements to determine best fit.
Fortunately, Access Worldwide is located in some of the best recruiting markets in the world. Our Philippine-based professionals are college-educated, speak fluent English with an American influence, and have an affinity for the U.S. culture. Our New England-based agents have an exceptionally strong work ethic and are extremely loyal; our agents based in the Mid-Atlantic region (Maryland, Washington DC, Virginia) are culturally diverse and often multi-lingual, and experienced in multiple industries. Our strategically placed centers and high quality reputation produces a steady stream of talented people to deploy on our client’s behalf.
Quality Assurance
To ensure lasting success, our management team continually evaluates the effectiveness of employee training and delivers continuous recurrent training programs. These training areas include our culture and commitment to quality, communication skills, customer care or sales skills, and system capabilities and efficiencies.
Our call monitoring is designed to ensure quality and consistency on each call handled by our agents. We have an independent department comprised of seasoned professionals to guarantee the quality of every application and call. Our Quality Assurance (“QA”) staff works with clients to determine the specific areas of measurement and will implement a monitoring schedule that is mutually agreed upon.
A combined effort between the supervisors and the QA department enables us to monitor each agent a minimum of 10 times per month. Both remote and side-by-side monitoring is utilized. The primary purpose of the observation is to ensure contract compliance, recognize superior performance and identify individual opportunities and training needs. The agents receive immediate feedback and are coached on techniques to improve their call handling skills.
Our remote monitoring function provides real-time remote monitoring capabilities. It is one of the most accessible and user-friendly systems in the industry today. This system will allow our clients to monitor our calls during normal hours of operation without intervention by our staff.
We have a sophisticated call tracking system that allows for flexibility in reporting. Our system has the capability of providing daily, weekly, monthly and cumulative reports. All of our clients receive daily production reports with the prior day’s activities. Additionally, our Internet scripting & data management system stores all data and statistics in an SQL database and allows for almost unlimited variations of reporting criteria.
The Technology and Infrastructure
To provide our clients with maximum flexibility and scalability (i.e. some clients utilize both our U.S. and Filipino resources to support different aspects of their program), we have developed an integrated network of five communication centers using solutions from Cisco (IPCC Enterprise), Rockwell (Spectrum), Microsoft (SQL Server), and Sprint (Voice & Data Network) that is based on an open design employing a multi-tiered client/server architecture. Our open platform architecture allows us to support the complete integration of systems whether internal or external in nature.
We can securely route inbound, multi-channel communications to the optimal location based on the type of interaction and on agent skill sets, and by using the same equipment, systems, and technology at all of our communication centers, we can meet all client disaster recovery and contingency requirements. Our overall system uptime exceeds 99.5% and we feature battery, generator, and data backups as part of our key emergency processes.
3
Our current technology platform delivers Customer Relationship Management (“CRM”) solutions authored in JAVA which fully leverages a browser-based application environment. Our customized CRM system delivers superior quality inbound and outbound communication center solutions which support the business processes of our clients. We are able to adapt our suite of solutions to meet the needs of our most sophisticated client’s requirements.
Our CRM platform is integrated with Concerto Software systems providing our communication centers with a full suite of proprietary Computer Telephony Integrated (“CTI”) functionality. The solution runs on a scaleable multi-server environment running on fault-tolerant LINUX or Microsoft Server platforms.
We employ the latest technology to effectively communicate with our client’s prospects and customers to deliver quality results in the areas of customer service, sales, and support. Our technology solutions are client-tailored allowing us to offer best of breed solutions to our clients. With a mix of customized proprietary system and commercial off the shelf solutions, we are able to provide maximum value to our end-users and customers by reducing costs and improving operational efficiencies.
Business Strategy
Our business strategy is simple; operate and grow the business on a cost-effective basis while positioning the Company to benefit from the continuing trend toward outsourcing. Our goal is to increase client satisfaction while at the same time, improve shareholder value. To obtain our goals we exploit market opportunities, drive internal growth, maintain technological leadership and continue to expand our international presence.
During 2006, we sold a division of the Company and discontinued operations of another. On June 20, 2006, the Board of Directors (the “Board”) approved an asset purchase agreement, to sell all or substantially all the assets of TMS Professional Markets Group (“TMS”), the Company’s Pharmaceutical Services division. On August 3, 2006, after receiving majority consent from our outstanding stockholders, we completed the sale, and the proceeds were used for not only working capital, but to assist us in our expansion into the Philippines. On December 5, 2006, the Board passed a resolution authorizing the Company to wind down the AM Medica Communications Group, the Pharmaceutical education division of the Company, and to discontinue operations on December 31, 2006. The sale and dissolution of the pharmaceutical services and education divisions of the Company will not only provide the Company with needed capital for expansion in the Philippines, but will allow management to focus its attention on BPO, which offers the Company considerable growth opportunities moving forward.
In each industry vertical that we compete, our goal is to build and maintain a leading position through flexibility and specialized services. Whether it is a telecommunications outbound winback campaign or an off-shore software development program we employ the requisite expertise to exploit the opportunity and ensure customer satisfaction. We have an extremely flexible structure, which allows us to work with small, medium and large program opportunities. For years we have demonstrated effectiveness in communicating our clients’ products and services to complex and hard-to-reach markets.
As Access continues to expand, we continue to invest in training and quality support for our staff. Our goal is to provide value added expertise at a competitive price. The investment in our staff translates into consistently high levels of customer satisfaction, which in turn, significantly impacts our client relationships. We will continue to invest in proprietary systems and technologies that will provide us with competitive advantages. Our technology strategy is driven by our objective to maximize reliability, integration and flexibility.
Fiscal 2006 was a big year for Access internationally. It was the first full fiscal year of our off-shore presence and by all accounts we consider it a successful one with revenues exceeding $5 million. With the opening of our second communication center toward the end of our first quarter in 2007, we look forward to continued growth. The Philippines has provided a highly educated work force, employees with excellent English language skills, and an enduring American influence. By the end of 2007 we expect to have three sites fully operational in the Philippines.
4
Patents, Trademarks, Service Marks & Licenses
Our service marks relate to the names, “Access Worldwide” and “Access Worldwide Communications, Inc.” and to our logo. The name, “Access Worldwide Communications, Inc.” and our logo received Certificates of Registration from the U.S. Patent and Trademark Office in 2001.
Our application for the name, “Access Worldwide,” has been registered with the U.S. Patent and Trademark Office since March 23, 2004. There is currently no known opposition to our use of the name Access Worldwide. If we were to lose the right to use the name “Access Worldwide” in our business, it could have a material, adverse effect on us.
Government Regulations
Several industries in which our clients operate are subject to varying degrees of government regulation, particularly the pharmaceutical, healthcare and telecommunications industries. Generally, compliance with these regulations is the responsibility of our client, but with the introduction of new regulations such as the national do-not-call registry in October 2003, it is imperative we stay vigilant in our efforts to comply. We could be subject to a variety of enforcement or private actions for our failure or the failure of our clients to conform to any number of these regulations.
Our communication centers must comply with a variety of regulations enforced by the Federal Communications Commission (“FCC”) and Federal Trade Commission (“FTC”).
The FCC rules under the Federal Telephone Consumer Act of 1991, which, among other things, limits the hours which telemarketers may call consumers and prohibits the use of automated telephone dialing equipment to call certain telephone numbers. The FCC also prohibits the unauthorized switching of subscribers’ long distance carriers, known in the industry as “slamming,” and a fine of up to $100,000 may be imposed for each instance of slamming
The FTC regulates under the Federal Telemarketing and Consumer Fraud and Abuse Protection Act of 1994 (“TCFAPA”) and Telemarketing Sales Rule (“TSR”). The TCFAPA broadly authorizes the FTC to issue regulations prohibiting misrepresentation in telephone sales. In 1995, the FTC issued regulations under the TCFAPA, which, among other things, require telemarketers to make certain disclosures when soliciting sales.
The FTC has amended the TSR and made changes to the regulation of predictive dialers, which is computerized dialing equipment that significantly increases the number of calls that can be generated and completed from a communication center. This technology can sometimes generate unanswered calls or calls that are answered by a person and abandoned. The FTC requires that no more than three percent of calls generated by predictive dials be answered by a person and abandoned, measured per day per calling campaign, and that the consumer’s phone must ring a minimum of 15 seconds (approximately 4 rings) before hang up. This revision went into effect on March 31, 2003.
The FTC has also amended the TSR to require telemarketers to play an identification message to each abandoned call effective October 1, 2003.
The telemarketing legislation that gained significant media attention during 2003 was the introduction of a national do-not-call registry. The registry, created by amending the TSR, went into effect on October 1, 2003. Consumers were invited to register their home telephone number(s) on the registry in an effort to reduce the number of incoming telemarketing solicitations. Telemarketers are required to search the registry at least every three months and remove the phone numbers of consumers who have registered from their databases. However, teleservices providers are allowed to contact consumers with whom they have an established business relationship for up to 18 months after the consumer’s last purchase, delivery or payment, even if the consumer’s telephone number is on the national do-not-call registry. Effective October 1, 2003, a consumer who receives a telemarketing call despite being on the registry is able to file a complaint with the FTC, with violators facing the possibility of being fined up to $11,000 per incident. In addition to federal regulation, teleservices providers must also comply with do-not-call lists that exist on the state level.
In January of 2004, the FTC began requiring that telemarketing firms identify themselves on Caller ID. The name displayed by Caller ID must either be the company trying to make a sale or the firm making the call. The display must also include a phone number that consumers can call during regular business hours and ask that the company no longer call them. Firms operating in geographical locations that do not have Caller ID technology do not have to comply.
We believe our operating procedures comply with the telephone solicitation rules of the FCC and FTC. However, we cannot assure you that additional federal or state legislation, or changes in regulatory implementation, would not limit our activities or our clients in the future or significantly increase the cost of regulatory compliance.
In regards to slamming, we believe that our training and other procedures are designed to prevent unauthorized switching. However, we cannot assure you that each employee will always follow our mandated procedures and applicable law. Accordingly, it is possible that employees may in some instances engage in unauthorized activities, including slamming.
5
We investigate consumer complaints reported to our telecommunications clients and report the results to such clients. To our knowledge, no FCC complaint has been brought against any of our clients as a result of our services. We believe that the FCC generally examines the sales activities of long distance telecommunications providers, including our clients, and the activities of outside vendors, such as the Company. If any complaints were brought against a client of ours, that client might assert that such complaints constituted a breach of its agreement with us and, if material, seek to terminate the contract. Any termination by our largest teleservices clients, two of which are AT&T and E*Trade Financial Corporation, which represent 47% and 12% of our total consolidated revenue for the year ended December 31, 2006, respectively, would likely have a material adverse effect on the Company.
The majority of states require outbound telemarketers to comply with various registration and disclosure requirements. As a publicly traded company, we are exempt from the majority of these filing requirements. However, failure to comply with these requirements could result in fines and/or a ban on calls into states where a violation may occur.
Our Competition
The BPO industry in which we operate is very competitive and highly fragmented. We compete with other outsourced marketing services companies, ranging in size from very small companies offering specialized applications or short-term projects to larger more independent companies. While many companies provide outsourced marketing services, we believe there is no single company that dominates the entire industry.
There are significant barriers to entry into the outsourced marketing services industry. Some of these barriers include (i) large capital investment towards the development and maintenance of the necessary information technology systems; (ii) marketing knowledge and expertise within the market; (iii) the ability to simultaneously manage complex marketing programs in multiple jurisdictions, including off-shore; (iv) the establishment of solid working relationships with clients; and (v) an understanding of the complexities surrounding state, federal and foreign government regulation of the industry. From years of experience in the marketplace, Access has overcome these road blocks and become a strong competitor in the market.
Within the teleservices industry there are many companies offering one or more of the following services: center management, customer service, sales, consulting, lead generation, fulfillment and database management services. Teleservices vendors may be selected based on a number of factors including price, range of services, expertise, speed to program execution, and industry reputation, among others. We compete with both small and large teleservices companies, such as APAC Customer Services, Convergys Corporation, ICT Group, Inc., PeopleSupport, Inc., SITEL Corporation, Sykes Enterprises, TeleTech Holdings, Inc., and West Corporation.
Some clients use more than one teleservices firm at a time and reallocate work among the various providers. This creates a project-by-project comparison of the performance of the various vendors which helps the client maintain a competitive marketplace.
While telephone marketing is only one aspect of BPO, it is still a major factor in the marketing industry. The telephone marketing industry represented 29% ($47 Billion) of the total mix of direct marketing advertising dollars in 2005.
Employees
As of December 31, 2006, the Company had approximately 1,000 employees domestically and overseas. None of our employees are represented by a labor union and we are not aware of any current activity to organize any of the employees. Management considers relations between the Company and its employees to be good.
Availability of Reports and Other Information
Our corporate website is http://www.accessww.com. We make available on this website, our Annual Report on Form 10-K, Quarterly Reports on Form 10-Q, Current Reports on Form 8-K, Proxy Statements on Schedule 14A and amendments to those materials filed or furnished pursuant to Section 13(a) or 15(d) of the Securities and Exchange Act of 1934 as soon as reasonably practicable after we have electronically submitted such material to the Securities and Exchange Commission (the “Commission”). Our corporate website also contains our Corporate Governance Guidelines, Code of Ethics and Charter of the Audit Committee of the Board of Directors. Information contained in our website is not deemed incorporated into this Annual Report on Form 10K. In addition, the Commission’s website is http://www.sec.gov. The Commission makes available on its website, free of charge, reports, proxy and information statements, and other information regarding issuers, such as us, who file electronically with the Commission. Information on our website or the Commission’s website is not part of this document.
The following are certain risk factors that could affect our business, financial performance, and results of operations. These risk factors should be considered in connection with evaluating the forward-looking statements contained in this Form 10-K,
6
as the forward-looking statements are based on current expectations, and actual results and conditions could differ materially from the current expectations. Investing in our securities involves a high degree of risk, and before making an investment decision, you should carefully consider these risk factors as well as other information we include or incorporate by reference in the other reports we file with the Securities and Exchange Commission (“Commission”).
In addition to other information set forth in this report, readers should carefully consider the following risk factors in evaluating Access Worldwide and our business. Any of these risks could materially adversely affect our business, financial condition, or results of operations. These risks could also cause our actual results to differ materially from those indicated in the forward-looking statements contained herein and elsewhere. The risks described below are not the only risks facing us. Additional risks not currently known to us or those we currently deem to be immaterial may also materially and adversely affect our business operations.
Risks Related to Our Business
We have incurred significant losses over the last three years and we may never achieve or sustain profitability.
We have an accumulated deficit of $72.7 million through December 31, 2006, and although we have a net income of $2.9 million for the year ended December 31, 2006, we may never achieve operating profit. We will need to generate significantly higher revenues to sustain profitability, and we cannot be certain that we will realize sufficient revenues or operating profit to sustain our business.
We may not be able to obtain additional capital to fund our operations on reasonable terms and this could hurt our business and negatively impact our stockholders.
If adequate funds in the form of equity or debt are not available on reasonable terms or terms acceptable to us in the future, we may be unable to continue as a going concern. If we raise additional funds through the issuance of convertible debt or additional equity securities, the percentage ownership of our existing stockholders would be reduced, the securities issued may have rights, preferences and privileges senior to those of holders of our common stock, and the terms of the securities may impose restrictions on our operations.
Ability to pay Convertible Notes and possible dilution.
We have limited cash resources and our inability to make principal payments on our Convertible Notes would result in the award of default warrants to each holder of a note, and subsequent dilution. Our Convertible Notes dated December 14, 2004, for $1.15 million (“Convertible Notes II”), will be due during March of 2008. If Convertible Notes II is not repaid or refinanced, then Convertible Notes II will be in default and will accrue interest at the default rate of 16% retroactive to the issuance date and default warrants will become effective. The default interest will continue to accrue until such time that the Convertible Notes II are repaid or converted.
Conversion of the Convertible Notes will significantly dilute the percentage ownership of our existing stockholders.
If shares of our common stock are issued to the investors upon conversion of all our outstanding Convertible Notes, existing stockholders will have their ownership percentage substantially diluted. The number of shares of common stock issuable under the terms of the Convertible Notes will also affect our loss or earnings per share on a going-forward basis. The larger the number of shares deemed outstanding, the lower our earnings per share will be. The actual effect of any conversion on our loss or earnings per share will depend on the level of our losses or earnings in future periods, and the actual amount converted pursuant to the Convertible Notes. At December 31, 2006, $3.14 million in principal under Convertible Notes I, amended June 12, 2006, and Convertible Notes II dated December 14, 2004, are convertible into 3.14 million shares of our common stock. On March 17, 2006, we completed the issuance of Convertible Notes IV for approximately $2.5 million of proceeds which is convertible into 5.0 million shares of our common stock.
We could be severely impacted by the loss of any of our largest clients.
Our three largest clients, AT&T (which consists of AT&T, SBC and Bell South), E*Trade Financial Corporation, and ALL OEM (US Auto Parts Network, Inc.) together accounted for approximately 64% of Access Worldwide’s revenues for the year ended December 31, 2006. There can be no assurance that these clients will continue to do business with us, and the loss of business from any of these clients could have a material adverse effect on us.
Our growth is dependent on various factors.
Our business and future operations depend significantly on our ability to utilize our existing infrastructure and databases to perform services for new clients, as well as on our ability to develop and successfully implement new marketing methods or channels for new services for existing clients.
7
Continued growth will also depend on a number of other factors, including, but not limited to, our ability to:
| | • | | Maintain the high quality of services we provide to customers; |
| | • | | Recruit, motivate and retain qualified personnel; |
| | • | | Train existing sales representatives or recruit new sales representatives to sell various categories of services; and; |
| | • | | Open new service facilities in a timely and cost-effective manner. |
In light of, among other things, our limited resources, we cannot assure you that we will be able to execute our strategy effectively. Any growth that we would be able to attain would require the implementation of enhanced operational and financial systems and resources, as well as additional management of the resources needed for which we may not have available. Any such growth, if not managed effectively, could have a material adverse effect on us.
Our future growth is dependent on the trend toward outsourcing.
Our business and future operations depend largely on the industry trend toward outsourcing marketing services. There can be no assurance that this trend will continue, as companies may elect to perform such services internally. A significant change in the direction of this trend could have a material adverse effect on us.
The sale of all or substantially all the assets of our TMS Professional Markets Group division could negatively impact our future growth.
The TMS Professional Markets Group division was an integral part of Access Worldwide’s operation. Not only did TMS contribute financially to our operations, it also allowed for a more diversified portfolio of service offerings. Without TMS, we will no longer be able to focus on serving the Pharmaceutical Services segment and will therefore lose those potential revenue streams.
We are heavily dependent on the industries we serve, particularly the telecommunications industries.
Our business and future operations are dependent to a great extent on the industries we serve. There can be no assurance that the telecommunications industry will grow or that it will continue to utilize entities such as Access Worldwide for outsourced marketing services. In addition, there can be no assurance that our business will benefit from any growth that these industries experience.
These industries are heavily regulated by federal and state authorities. Existing regulation, or increased regulation in the future, could negatively impact the ability of the industries to operate or grow. Anything that inhibits the operations or growth of the telecommunications industry could have a material adverse effect on us.
We rely on technology and could be adversely affected if we are unable to maintain facilities with the needed equipment.
We have invested significant funds in specialized telecommunications and computer technologies and equipment to provide customized solutions to meet our clients’ needs. In addition, we have invested significantly in sophisticated proprietary databases and software that enable us to market our clients’ products to targeted markets. We anticipate that it will be necessary to continue to select, invest in and develop new and enhanced technology and proprietary databases on a timely basis in the future in order to maintain our competitiveness.
We have leased equipment and have expended substantial time and resources to train our personnel in the operation of our existing equipment and to integrate the operations of our systems and facilities. In the event of substantial improvements in computer technologies and telecommunications equipment, we may be required to acquire such new technologies and equipment at significant cost and/or phase out a portion of our existing equipment. There can be no assurance that our technologies and equipment will not be rendered obsolete or our services rendered less marketable. In addition, we cannot assure you that we will be able to continue to develop and maintain the technology and systems necessary for our business.
We are dependent on key personnel and may be affected by changes in senior management.
Our success depends in large part upon the abilities and continued service of our key management personnel. Our failure to retain the services of all of our key personnel could have a material adverse effect on our business, including our financial condition and results of operations. In addition, in order to support any growth that we are able to effectuate, we will be required to recruit and retain additional qualified management personnel. In light of our limited resources, we cannot assure you that we will be able to recruit and retain such personnel. Our inability to attract and retain such personnel could have a material adverse effect on our business, financial condition and results of operations.
8
We are dependent on our labor force and could be affected by potentially high turnover rates.
Many aspects of our business are labor intensive, and based on the transient nature of our work force, there is a potential for high personnel turnover. Our operations typically require specially trained persons, such as those employees who market services and products in languages other than English. A higher turnover rate among our employees would increase our recruiting and training costs and decrease operating efficiencies and productivity. In addition, any growth in our business will require us to recruit and train qualified personnel at an accelerated rate from time to time. There can be no assurance that we will be able to continue to hire, train and retain a sufficient labor force of qualified persons to meet the needs of our business.
We could be affected by a business interruption.
Our business is highly dependent on our computer, software and telephone equipment. The temporary or permanent loss of such systems or equipment, through casualty or operating malfunction, or a significant increase in the cost of telephone services that is not recoverable through an increase in the price of our services, could have a material adverse affect on us. Our property and business interruption insurance may not adequately compensate us for all losses that we may incur in any such event.
Our stock price has declined substantially at times in the previous year and may become more volatile.
The market price of Access Worldwide’s common stock has fluctuated in the past and is likely to fluctuate in the future as well. During the 2006 fiscal year, our stock’s closing price fluctuated from a low of $0.32 to a high of $1.01. During that time period, the average trading volume was 3,001 shares per day, but the volatility of the price is often driven by trading volumes that can total less than 2,000 shares of common stock per day. With this level of volume, small trades can have a significant impact on the price. Additional factors that may have a significant impact on the market price of the stock include:
| | • | | Future announcements concerning Access Worldwide or our competitors; |
| | • | | Results of technological innovations or service extensions; |
| | • | | Government regulations; and |
| | • | | Changes in general market conditions, particularly in the market for micro-cap stocks. |
Shortfalls in Access Worldwide’s revenues or earnings in any given period relative to any expectations in the securities markets could immediately, significantly and adversely affect the trading price of the common stock. We have experienced and may experience future quarter to quarter fluctuations in our results of operations. Quarterly results of operations may fluctuate as a result of a variety of factors, including, but not limited to, the size and timing of client orders, changes in client budgets, material variations in the cost of telephone services, the demand for our services, the timing of the introduction of new services and service enhancements by us, the market acceptance of new services, competitive conditions in the industries we serve, our ability to effectuate any strategic transactions and general economic conditions. These factors, either individually or in the aggregate, could result in decreasing revenues and earnings, which could, in turn, materially and adversely affect the price of our common stock.
We face risk due to our stock trading on the Over the Counter Bulletin Board (“OTCBB”).
Because our stock trades on the OTCBB and not on an exchange or the NASDAQ National Market or NASDAQ Capital Market, we have less ability to access the public equity and debt markets, should it be necessary or advisable to do so, than if our stock traded on one of those other more recognizable trading venues.
We face a risk that we may not be able to successfully operate our communication center in Manila, Philippines.
Our communication centers in the Philippines have only been open for less than two years, and represent our first off-shore presence. These centers required substantial investment, the establishment of a Philippines management team, and securing contracts to perform work in these facilities. The inability to continue to execute one or all of the above items would have a material adverse effect on us.
Risks Related to Our Industry
We may be adversely impacted by competition, industry consolidation and potential consumer saturation.
The outsourced marketing services industry in which we operate is very competitive and highly fragmented. We compete with other BPO and outsourced marketing services companies, ranging in size from very small companies offering specialized applications or short-term projects to large independent companies. While many companies provide outsourced marketing services, we believe that there is no single company that dominates the entire industry. A significant number of our competitors and potential competitors have more extensive marketing capabilities, more extensive experience and greater financial resources than us. Consolidation among prospective clients also increases competition for buyers of our services. There can be no assurance that we will be able to compete successfully or that competitive pressures will not materially and adversely affect us.
9
We were impacted by the events of September 11, 2001 and may be impacted in the future by events of a similar nature, war and other international conflicts.
Our businesses were impacted by the events of September 11, 2001 when we experienced, among other things, lost production days at our communication centers.
To the extent that there are any further events of a nature similar to that of September 11, 2001, war and other international conflicts, or a prolonged downturn in the U.S. economy, our financial condition and results of operations could be materially adversely affected.
We are subject to extensive regulations and compliance with these regulations can be costly, time consuming and subject us to fines for non-compliance.
Several industries in which our clients operate are subject to varying degrees of governmental regulation, in particular the telecommunications industry. Generally, compliance with these regulations is the responsibility of our clients. However, we are exposed to a variety of enforcement or private actions for our failure or the failure of our clients to comply with such regulations.
Our communication centers must comply with a variety of regulations. We believe our operating procedures comply with the telephone solicitation rules of the FCC and FTC. However, we cannot assure you that additional federal or state legislation, or changes in regulatory implementation, would not limit the activities of the Company or our clients in the future or significantly increase the cost of regulatory compliance.
In addition, the majority of states require outbound telemarketers to comply with various registration and documentation requirements. Failure to comply with the registration requirements could result in fines and call prohibitions which could have a material adverse effect on us.
FORWARD-LOOKING STATEMENTS
From time to time, including in this report, we may publish forward-looking statements within the meaning of Section 27A of the Securities Act of 1933, as amended, and Section 21E of the Securities and Exchange Act of 1934, as amended. Those statements represent our current expectations, beliefs, future plans and strategies, anticipated events or trends concerning matters that are not historical facts. Such forward-looking statements include, among others:
| | • | | Statements regarding proposed activities pursuant to agreements with clients; |
| | • | | Future plans relating to our business strategy; and, |
| | • | | Trends, or proposals, or activities of clients or industries which we serve. |
Such statements involve known and unknown risks, uncertainties and other factors that may cause the actual results to differ materially from those expressed or implied by such forward-looking statements. Factors that could cause actual results to differ materially from those expressed or implied by such forward-looking statements include, but are not limited, to the following:
| | • | | Competition from other third-party providers and those of our clients and prospects who may decide to do the work that we do in-house; |
| | • | | Industry consolidation which reduces the number of clients that we are able to serve; |
| | • | | Potential consumer saturation reducing the need for our services; |
| | • | | Certain needs for our growth; |
| | • | | Our dependence on the continuation of the trend toward outsourcing; |
| | • | | Dependence on the industries we serve; |
| | • | | Our ability and our clients’ ability to comply with state, federal and industry regulations; |
| | • | | Reliance on a limited number of major clients; |
| | • | | The effects of possible contract cancellations; |
| | • | | Reliance on technology; |
| | • | | Reliance on key personnel and recent changes in management; |
| | • | | Reliance on our labor force; |
| | • | | The possible impact of terrorist activity or attacks, war and other international conflicts, and a downturn in the US economy; |
| | • | | The effects of an interruption of our business; |
| | • | | The volatility of our stock price; |
| | • | | Risks associated with our stock trading on the OTC Bulletin Board; and |
| | • | | Our inability to successfully operate our communication center in the Philippines. |
10
Our principal executive offices are located in Arlington, Virginia. We have operations in Maryland, Virginia and Maine, domestically, and internationally, in Manila, Philippines. All of our facilities are leased and have lease terms of two to ten years. The new center in Manila, Philippines adds approximately 17,600 square feet to our facility space. We believe that our current facilities are adequate for our needs for the foreseeable future. Set forth below is a list of the facilities that we currently utilize.
| | | | |
Location | | Principal Use | | Approx. Square Feet |
Business Services Segment: | | | | |
| Arlington (Roslyn), VA | | Corporate Headquarters | | 3,000 |
| Boca Raton, FL | | Administrative Offices | | 2,000 |
| Arlington (Roslyn), VA | | Customer Sales and Service Programs | | 33,300 |
| Hyattsville, MD | | Customer Sales and Service Programs | | 24,500 |
| Augusta, ME | | Customer Sales and Service Programs | | 15,000 |
| Manila, Philippines | | Customer Sales and Service Programs | | 18,000 |
| Manila, Philippines | | Customer Sales and Service Programs | | 17,600 |
None
| Item 4. | Submission of Matters to a Vote of Security Holders |
None.
PART II
| Item 5. | Market for Registrant’s Common Equity, Related Shareholder Matters and Issuer Purchases of Equity Securities |
(a) Market Information
Our common stock trades on the Over the Counter Bulletin Board under the symbol “AWWC.” The over-the-counter market quotations reflect inter-dealer prices, without retail mark-up, mark-down or commissions and may not necessarily represent actual transactions. The following table sets forth the high and low intra-day sale prices for our common stock as reported by the markets in which our stock traded for the periods indicated:
| | | | | | | | | | | | |
| | | Market Prices |
| | | 2006 | | 2005 |
Fiscal Quarters | | High | | Low | | High | | Low |
First Quarter | | $ | 0.54 | | $ | 0.47 | | $ | 0.87 | | $ | 0.76 |
Second Quarter | | | 0.60 | | | 0.32 | | | 0.98 | | | 0.75 |
Third Quarter | | | 0.46 | | | 0.32 | | | 0.94 | | | 0.47 |
Fourth Quarter | | | 1.01 | | | 0.38 | | | 0.66 | | | 0.51 |
(b) Holders
The number of record holders of common stock as of March 28, 2007 was 227 and the number of beneficial owners of common stock as of March 28, 2007 was approximately 582.
(c) Dividends
We have never paid cash dividends on our common stock and do not anticipate paying cash dividends on our common stock in the foreseeable future.
(d) Stock Performance Graph
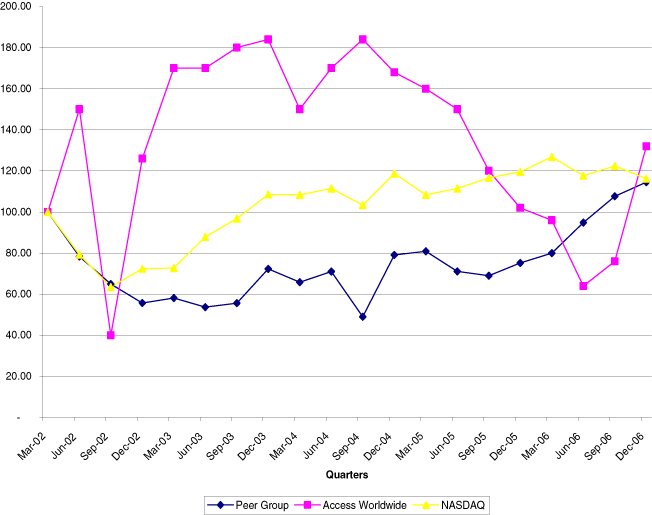
Out common stock began trading on the Nasdaq National Market System on February 13, 1998 when its initial public offering commenced. Since July 17, 2001, the Company’s Common Stock has traded on the Over the Counter Bulletin Board. The following performance graph shows the total return to stockholders of an investment in the Company’s Common Stock as compared to an investment in (i) the Nasdaq Composite Index and (ii) a peer group made up of PeopleSupport, Inc., Parexel International Corporation, TeleTech Holdings, and Convergys, Inc. (the “Peer Group”) for the period commencing January 1, 2002 and ending December 31, 2006. The data assumes that $100 was invested on January 1, 2002 in each of the Company’s Common Stock, the Nasdaq Composite Index and companies in the Peer Group Index (on a weighted market value basis) and that all dividends were reinvested. The Company has never paid any dividends.
11
COMPARISON OF CUMULATIVE TOTAL RETURN AMONG
THE NASDAQ COMPOSITE INDEX,
THE PEER GROUP INDEX, AND
ACCESS WORLDWIDE COMMUNICATIONS, INC.
| | | | | | | | | | | | | | | |
| | | 12/31/2002 | | 12/31/2003 | | 12/31/2004 | | 12/31/2005 | | 12/31/2006 |
AWWC | | $ | 63 | | $ | 92 | | $ | 84 | | $ | 102 | | $ | 132 |
NASDAQ | | $ | 72 | | $ | 109 | | $ | 119 | | $ | 120 | | $ | 116 |
Peer Group | | $ | 56 | | $ | 72 | | $ | 79 | | $ | 75 | | $ | 115 |
12
ITEM 6. SELECTED FINANCIAL DATA (UNAUDITED)
The following tables present summarized historical consolidated financial data as of and for the years ended, December 31, 2006, 2005, 2004, 2003 and 2002. Our summarized consolidated financial data as of, and for the years ended December 31, 2006, 2005 and 2004 has been derived from our audited consolidated financial statements included in this Annual Report on Form 10-K. The 2006 audited financial statements, and reclassification of discontinued operations in the 2005 and 2004 consolidated financial statements were audited by DaszkalBolton LLP and the 2005 and 2004 audited financial statements were audited by BDO Seidman, LLP. You should read this information together with “Management’s Discussion and Analysis of Financial Condition and Results of Operations,” and our consolidated financial statements and related notes for the years ended December 31, 2006, 2005 and 2004 which are included elsewhere in the Annual Report on Form 10K. Historical results are not necessarily indicative of the results to be expected in the future.
| | | | | | | | | | | | | | | | | | | | |
| | | Years Ended December 31, | |
| | | 2006 | | | 2005 | | | 2004 | | | 2003 | | | 2002 | |
| | | (In Thousands Except for Per Share Data) | |
Statements of Operations Data: | | | | | | | | | | | | | | | | | | | | |
Revenues | | $ | 27,712 | | | $ | 14,809 | | | $ | 22,359 | | | $ | 28,250 | | | $ | 21,564 | |
Cost of services | | | 21,315 | | | | 13,145 | | | | 17,443 | | | | 20,447 | | | | 14,921 | |
Selling, general and administrative expenses | | | 6,558 | | | | 4,498 | | | | 5,394 | | | | 6,324 | | | | 4,976 | |
Depreciation expense | | | 1,038 | | | | 893 | | | | 658 | | | | 1,062 | | | | 1,133 | |
| | | | | | | | | | | | | | | | | | | | |
Total cost and expenses | | | 28,911 | | | | 18,536 | | | | 23,495 | | | | 27,833 | | | | 21,030 | |
| | | | | | | | | | | | | | | | | | | | |
(Loss) income from operations | | | (1,199 | ) | | | (3,727 | ) | | | (1,136 | ) | | | 417 | | | | 534 | |
Interest income | | | 117 | | | | 32 | | | | 10 | | | | 5 | | | | 14 | |
Interest income – related parties | | | — | | | | — | | | | — | | | | — | | | | — | |
Interest expense – related parties | | | (131 | ) | | | (92 | ) | | | (87 | ) | | | (112 | ) | | | (285 | ) |
Interest expense – unrelated parties | | | (3,038 | ) | | | (1,667 | ) | | | (1,238 | ) | | | (1,255 | ) | | | (523 | ) |
Other expense | | | | | | | — | | | | — | | | | — | | | | — | |
| | | | | | | | | | | | | | | | | | | | |
(Loss) income before income taxes | | | (4,251 | ) | | | (5,454 | ) | | | (2,451 | ) | | | 945 | | | | (260 | ) |
Income tax (benefit) expense | | | — | | | | — | | | | — | | | | 546 | | | | (139 | ) |
(Loss) income from continuing operations | | | (4,251 | ) | | | (5,454 | ) | | | (2,451 | ) | | | (399 | ) | | | (121 | ) |
Discontinued operations(2)(1): | | | | | | | | | | | | | | | | | | | | |
Loss from discontinued operations, net of income tax(1) | | | (592 | ) | | | 773 | | | | 1,040 | | | | (11,242 | ) | | | (857 | ) |
Gain on disposal of segment, net of income tax expense of $1,506 for 2002. | | | 7,729 | | | | — | | | | — | | | | — | | | | 8,869 | |
| | | | | | | | | | | | | | | | | | | | |
Income (loss) from discontinued operations | | | 7,137 | | | | 773 | | | | 1,040 | | | | (11,242 | ) | | | 8,012 | |
| | | | | | | | | | | | | | | | | | | | |
Net income (loss) | | $ | 2,886 | | | | (4,681 | ) | | | (1,411 | ) | | | (11,641 | ) | | | 7,891 | |
Deemed dividend – warrants issued to certain stockholders | | | — | | | | (740 | ) | | | — | | | | — | | | | — | |
| | | | | | | | | | | | | | | | | | | | |
Net income (loss) applicable to common stockholders | | $ | 2,886 | | | $ | (5,421 | ) | | $ | (1,411 | ) | | $ | (11,641 | ) | | $ | 7,891 | |
| | | | | | | | | | | | | | | | | | | | |
Basic earnings (loss) per share of common stock: | | | | | | | | | | | | | | | | | | | | |
Continuing operations | | $ | (0.25 | ) | | $ | (0.42 | ) | | $ | (0.24 | ) | | $ | (0.04 | ) | | $ | (0.01 | ) |
Discontinued operations | | $ | 0.41 | | | $ | 0.06 | | | $ | (0.10 | ) | | $ | (1.15 | ) | | $ | 0.82 | |
Net income (loss) | | $ | 0.17 | | | $ | (0.41 | ) | | $ | (0.14 | ) | | $ | (1.20 | ) | | $ | 0.81 | |
Weighted average common shares outstanding | | | 17,340,065 | | | | 13,084,761 | | | | 10,008,271 | | | | 9,740,418 | | | | 9,740,001 | |
Diluted earnings (loss) per share of common stock: | | | | | | | | | | | | | | | | | | | | |
Continuing operations | | $ | (0.25 | ) | | $ | (0.42 | ) | | $ | (0.24 | ) | | $ | (0.04 | ) | | $ | (0.01 | ) |
Discontinued operations | | $ | 0.41 | | | $ | 0.06 | | | $ | (0.10 | ) | | $ | (1.15 | ) | | $ | 0.82 | |
Net income (loss)(3) | | $ | 0.17 | | | $ | (0.41 | ) | | $ | (0.14 | ) | | $ | (1.20 | ) | | $ | 0.81 | |
Weighted average common shares outstanding | | | 17,340,065 | | | | 13,084,761 | | | | 10,008,271 | | | | 9,740,418 | | | | 9,740,001 | |
13
| | | | | | | | | | | | | | | | | | | |
| | | As of December 31, |
| | | 2006 | | | 2005 | | | 2004 | | | 2003 | | | 2002 |
| | | (In Thousands Except for Per Share Data) |
Balance Sheet Data: | | | | | | | | | | | | | | | | | | | |
Current assets | | $ | 10,756 | | | $ | 10,381 | | | $ | 11,660 | | | $ | 14,451 | | | $ | 15,394 |
Total assets | | | 14,860 | | | | 16,263 | | | | 16,010 | | | | 19,479 | (1) | | | 29,431 |
Current liabilities | | | 6,624 | | | | 14,477 | | | | 13,526 | | | | 17,368 | | | | 18,462 |
Long-term debt, less current maturities | | | 4,885 | | | | 2,050 | | | | 1,563 | | | | 1,085 | | | | 52 |
Mandatorily redeemable preferred stock | | | 4,000 | | | | 4,000 | | | | 4,000 | | | | 4,000 | | | | 4,000 |
Common stockholders’ (deficit) equity | | | (1,180 | ) | | | (5,060 | ) | | | (3,865 | ) | | | (3,750 | ) | | | 6,603 |
| (1) | In 2003, we recorded an impairment charge of approximately $9.0 million in accordance with FASB 142, “Goodwill and Other Intangible Assets” and FASB 144, “Accounting for the Impairment or Disposal of Long-Lived Assets”. |
| (2) | In accordance with FASB 144, we have reclassified as discontinued operations, the operations of our Cultural Access Group and Phoenix divisions which were sold in the first quarter of 2002, our TMS Professional Markets Group which we sold in July 2006, and our AM Medica Group which discontinued business as of December 31, 2006. |
| (3) | Since the effects of outstanding stock options, common stock equivalents, and warrants are anti-dilutive, these effects have not been included in the calculation of diluted EPS. |
SPECIAL NOTE REGARDING FORWARD-LOOKING STATEMENTS
Many of the statements included in this Annual Report on Form 10-K contains forward-looking statements and information relating to our company. We generally identify forward-looking statements by the use of terminology such as “may,” “will,” “could,” “should,” “potential,” “continue,” “expect,” “intend,” “plan,” “estimate,” “anticipate,” “believe,” or similar phrases or the negatives of such terms. We base these statements on our beliefs as well as assumptions we made using information currently available to us. Such statements are subject to risks, uncertainties and assumptions, including those identified in “Risk Factors,” as well as other matters not currently considered material by us. Should one or more of these risks or uncertainties materialize, or should underlying assumptions prove incorrect, actual results may vary materially from those anticipated, estimated or projected. Important factors that may affect these projections or expectations include, but are not limited to those discussed in “Risk Factors.”
Given such risks and uncertainties, prospective investors are cautioned not to place undue reliance on such forward-looking statements. Forward-looking statements do not guarantee future performance and should not be considered as statements of fact.
These forward-looking statements speak only as of the date of this report and, unless required by law, we undertake no obligation to publicly update or revise any forward-looking statements to reflect new information or future events or otherwise. You should, however, review the factors and risks we describe in other reports and documents we will file with the Commission after the date of this Annual Report.
14
| ITEM 7. | MANAGEMENT’S DISCUSSION AND ANALYSIS OF FINANCIAL CONDITION AND RESULTS OF OPERATIONS |
The following discussion of our financial condition and results of operations should be read in conjunction with Selected Financial Data and our Consolidated Financial Statements and the Notes thereto included elsewhere in this Form 10-K.
OVERVIEW
Access Worldwide Communications, Inc. (“Access Worldwide,” “Access,” “we,” “our,” “us” or the “Company” refers to Access Worldwide and/or, as the context requires, one or more of our subsidiaries) was incorporated in the State of Delaware on August 11, 1983 and has been a provider of outsourced sales and marketing services since its inception. Over the past couple of years Access has sold various non-core businesses to focus on the rapidly growing business process outsourcing (“BPO”) market. Access is a provider of customer management services in the Telecommunications, Financial Services, Retail/Catalog and Media industries. Access currently has over 1,000 employees worldwide with communication centers in the U.S. and the Philippines.
QUARTERLY RESULTSOFOPERATIONSANDPERFORMANCETRENDS (UNAUDITED)
| | | | | | | | | | | | | | | | | | | | | | | | | | | | | | | | |
| | | Quarters Ended | |
| | | Dec. 31, 2006 | | | Sept. 30, 2006 | | | June 30, 2006 | | | March 31, 2006 | | | Dec. 31, 2005 | | | Sept. 30, 2005 | | | June 30, 2005 | | | March 31,
2005 | |
| | | (In Thousands Except for Per Share Data) | |
Statements of Operations Data: | | | | | | | | | | | | | | | | | | | | | | | | | | | | | | | | |
Revenues | | $ | 8,467 | | | $ | 7,406 | | | $ | 6,336 | | | $ | 5,503 | | | $ | 4,689 | | | $ | 3,267 | | | $ | 3,286 | | | $ | 3,567 | |
(Loss) from continuing operations | | | (328 | ) | | | (1,815 | ) | | | (1,105 | ) | | | (1,003 | ) | | | (1,168 | ) | | | (1,820 | ) | | | (1,430 | ) | | | (1,036 | ) |
(Loss) income from discontinued operations | | | (458 | ) | | | 8,193 | | | | (468 | ) | | | (130 | ) | | | (236 | ) | | | (197 | ) | | | 740 | | | | 466 | |
| | | | | | | | | | | | | | | | | | | | | | | | | | | | | | | | |
Net (loss) income | | $ | (786 | ) | | $ | 6,378 | | | $ | (1,573 | ) | | $ | (1,133 | ) | | $ | (1,404 | ) | | $ | (2,017 | ) | | $ | (690 | ) | | $ | (570 | ) |
| | | | | | | | | | | | | | | | | | | | | | | | | | | | | | | | |
Basic (loss) earnings per share of common stock: | | | | | | | | | | | | | | | | | | | | | | | | | | | | | | | | |
Continuing Operations Discontinued Operations Net (loss) income | | $
$
$ | (0.02
(0.03
(0.04 | )
)
) | | $
$
$ | (0.11
0.47
0.37 | )
| | $
$
$ | (0.06
(0.03
(0.09 | )
)
) | | $
$
$ | (0.06
(0.00
(0.07 | )
)
) | | $
$
$ | (0.07
(0.01
(0.08 | )
)
) | | $
$
$ | (0.13
(0.01
(0.20 | )
)
) | | $
$
$ | (0.13
0.07
(0.06 | )
) | | $
$
$ | (0.09
0.04
(0.05 | )
) |
Weighted average common shares outstanding | | | 17,340,065 | | | | 17,340,065 | | | | 17,350,507 | | | | 16,889,039 | | | | 16,609,552 | | | | 13,599,552 | | | | 11,286,219 | | | | 11,177,052 | |
Diluted (loss) earnings per share of common stock:(1) | | | | | | | | | | | | | | | | | | | | | | | | | | | | | | | | |
Continuing Operations. Discontinued Operations Net (loss) income | | $
$
$ | (0.02
(0.03
(0.04 | )
)
) | | $
$
$ | (0.11
(0.47
0.37 | )
)
| | $
$
$ | (0.06
(0.03
(0.09 | )
)
) | | $
$
$ | (0.06
(0.00
(0.07 | )
)
) | | $
$
$ | (0.07
(0.01
(0.08 | )
)
) | | $
$
$ | (0.13
(0.01
(0.20 | )
)
) | | $
$
$ | (0.13
0.07
(0.06 | )
) | | $
$
$ | (0.09
0.04
(0.05 | )
) |
Weighted average common shares outstanding | | | 17,340,065 | | | | 17,340,065 | | | | 17,350,507 | | | | 16,889,039 | | | | 16,609,552 | | | | 13,599,552 | | | | 11,286,219 | | | | 11,177,052 | |
| (1) | Since the effects of outstanding stock options, common stock equivalents, and warrants are anti-dilutive for all quarters in 2006 and 2005, these effects have not been included in the calculation of diluted earning per share. |
15
CRITICAL ACCOUNTING POLICIESAND ESTIMATES
Our discussion and analysis of our financial condition and results of operations are based upon our consolidated financial statements, which have been prepared in accordance with accounting principles generally accepted in the U.S. The preparation of these financial statements requires us to make estimates and assumptions that affect the reported amounts of assets, liabilities, sales and expenses as well as the disclosure of contingent assets and liabilities. We regularly review our estimates and assumptions. Our estimates and assumptions, which are based upon historical experience and on various other factors which we believed to be reasonable under the circumstances, form the basis of our judgments about the carrying values of our assets and liabilities that are not readily apparent from other sources. Our reported amounts and disclosures may have been different had management used different estimates and assumptions or if different conditions had occurred in the periods presented. Our accounting policies can be found inNote 2to our Consolidated Financial Statements. Below is a discussion of the policies that we believe may involve a high degree of judgment and complexity.
REVENUES
Our customer management revenues are recognized based on rates per production hour, talk time, fixed monthly fee and phone calls placed and/or received which end in sales. We recognized revenues when we have no significant obligations remaining, fees are fixed and determinable and collection of the related accounts receivable is reasonably assured.
As of December 31, 2006, we no longer provide medical education and meeting program services for which revenues were recognized on a percentage of completion methodology using project milestones, which at times results in unbilled receivables and favorable and unfavorable cost variances.
ACCOUNTSRECEIVABLE
We extend credit to our customers in the normal course of business. Our accounts receivable are concentrated in a relatively few number of customers most of which are Fortune 500 companies. However a significant change in the liquidity or financial position of these customers could have a material adverse impact on the collectability of our accounts receivable and our future operating results. We continuously monitor accounts receivable balances and payments from our customers and maintain an allowance for doubtful accounts based upon historical experience and any specific customer collection issues. For the years ended December 31, 2006 and 2005, we maintain allowance for doubtful accounts of $99,130 and $61,994, respectively. While our bad debt expenses have been historically within our expectations and the allowances we established, we cannot guarantee that we will continue to have the same experience in the future. Management’s assessment and judgment are vital in assessing the ultimate realization of accounts receivable, which include the credit-worthiness, financial stability and effects of market conditions on each customer.
VALUATIONOFLONG-LIVEDASSETS
We review our long-lived assets for impairment whenever events or changes in circumstances indicate that the carrying amount may not be fully recoverable. If we determine that the carrying amount of long-lived assets may not be fully recoverable, we measure impairment by comparing the asset’s estimated fair value to its carrying value. We determine fair value based on quoted market prices in active markets, if available, or independent appraisals; sales price negotiations; or projected future cash flows discounted at a rate we believe to be commensurate with our business risk. When we estimate fair value utilizing discounted forecasted cash flows, it includes significant judgment regarding assumptions of revenue, operating and marketing costs; selling and administrative expenses; interest rates; property, plant and equipment additions and retirements; and industry competition and general economic and business conditions, among other factors.
INCOMETAXES
We recognize deferred tax assets and liabilities based on differences between financial statement carrying amounts and its tax basis. We assessing the need for a valuation allowance we consider tax loss carrybacks, reversal of deferred tax liabilities, tax planning and estimates of future taxable income. When we determine that we are unable to realize deferred tax assets in excess of our recorded amount, an adjustment to the deferred tax asset is made which increases income. Likewise, if we determine that we would not be able to realize all or part of our net deferred tax assets in the future, an adjustment to the deferred tax assets is made which would decrease income.
ACCOUNTINGFOR STOCK-BASED COMPENSATION
FASB Statement No. 123,Accounting for Stock-Based Compensation(“SFAS No. 123”), defines a fair value method of accounting for issuance of stock options and other equity instruments. Under the fair value method, compensation cost is measured at the grant date based on the fair value of the award and is recognized over the service period, which is usually the vesting period. Pursuant to SFAS No. 123, we were not required to adopt the fair value method of accounting for employee stock-based transactions through December 31, 2005. We were permitted to account for such transactions under APB Opinion No. 25,Accounting for Stock Issued to Employees(“APB No. 25”), which defines an intrinsic value method of accounting for the issuance of stock options and other
16
equity instruments, but are required to disclose in a note to our consolidated financial statements pro forma net income and per share amounts as if we had applied the methods prescribed by SFAS No. 123. For purposes of the pro forma disclosure, we calculate the fair value of our stock options using the Black-Scholes option-pricing model. To use this model, we must judgmentally determine the estimated life of the stock option, the projected volatility of our common stock over the estimated life of the stock option, the projected dividend yield of our common stock over the estimated life of the stock option, and the risk-free interest rate. For further information regarding our pro forma disclosure estimates, seeNote 2to our Consolidated Financial Statements.
In December 2004, the FASB issued Statement No. 123 (revised 2004),Share-Based Payment (“SFAS No. 123R”). This statement is a revision of FASB Statement No. 123.Accounting for Stock-Based Compensation (“SFAS No. 123”), and supersedes APB Opinion No. 25, and its related implementation guidance. Under SFAS No. 123R, entities are required to recognize the cost of an equity award based on its fair value at the date of grant. The cost, which is calculated in a similar manner to the pro forma calculation shown inNote 2 to our Notes to Consolidated Financial Statements, is recognized over the attribution period, which is the expected period of benefit. SFAS No. 123R is effective for fiscal periods beginning on or after June 15, 2005. In April 2005, the Securities and Exchange Commission (“SEC”) amended its Regulation S-X to amend the date of compliance with SFAS No. 123R to the first reporting period of the fiscal year beginning on or after June 15, 2005.
SFAS No. 123R permits public companies to adopt its requirements using one of two methods- “modified prospective” or “modified retrospective”. The “modified prospective” method requires that compensation cost is recognized beginning with the effective date (a) based on the requirements of SFAS No. 123R for all share-based payments granted, modified or settled after the effective date and (b) based on the requirements of SFAS No. 123 for all award; granted to employees prior to the effective date of SFAS No. 123R that remain unvested on the effective date. The “modified retrospective” method which includes the requirements of the modified prospective method described above, but also permits entities to restate, based on the amounts previously recognized under SFAS 123 for purposes of pro forma disclosures, either (a) all prior periods presented or (b) prior interim periods of the year of adoption. We plan to adopted SFAS No. 123R using the modified prospective method.
RECENT ACCOUNTING PRONOUNCEMENTS
In September 2006, the Commission issued SAB 108,Considering the Effects of Prior Year Misstatements when Quantifying Misstatements in Current Year Financial Statements. SAB 108 requires analysis of misstatements using both an income statement (rollover approach) and a balance sheet (iron curtain) approach in assessing materiality and provides for a one-time cumulative effect transition adjustment. SAB 108 is effective for our fiscal year 2006 annual financial statements. The adoption of the statement did not have a material impact on our consolidated results of operations, financial position or cash flows.
In July 2006, the FASB issued Interpretation No. 48, “Accounting for Uncertainty in Income Taxes” (“FIN 48”). This interpretation, among other things, creates a two-step approach for evaluating uncertain tax positions. Recognition (step one) occurs when an enterprise concludes that a tax position, based solely on its technical merits, is more-likely-than-not to be sustained upon examination. Measurement (step two) determines the amount of benefit that more-likely-than-not will be realized upon settlement. Derecognition of a tax position that was previously recognized would occur when a company subsequently determines that a tax position no longer meets the more-likely-than-not threshold of being sustained. FIN 48 specifically prohibits the use of a valuation allowance as a substitute for derecognition of tax positions, and it has expanded disclosure requirements. FIN 48 is effective for our fiscal years beginning after December 15, 2006, in which the impact of adoption should be accounted for as a cumulative-effect adjustment to the beginning balance of retained earnings. We will evaluate the adoption of FIN 48 and determine its impact on our consolidated financial statements.
RESULTSOF OPERATIONSBY SEGMENTFOR 2006AND 2005
The following table sets forth, for the periods indicated, certain statements of operations data by segment obtained from our consolidated statements of operations.
| | | | | | | | | | | | | | | | | | | | |
| | | United States | | | International |
| | | 2006 | | | 2005 | | | Change | | | 2006 | | 2005 | | | Change |
| | | (in thousands) |
Statements of Operations Data: | | | | | | | | | | | | | | | | | | | | |
Revenues | | $ | 22,504 | | | $ | 14,217 | | | 8,287 | | | $ | 5,207 | | $ | 593 | | | 4,614 |
| | | | | | | | | | | | | | | | | | | | |
Cost of services | | | 18,407 | | | | 12,657 | | | 5,750 | | | | 2,908 | | | 488 | | | 2,420 |
Selling, general and administrative expenses | | | 5,104 | | | | 4,158 | | | 946 | | | | 1,454 | | | 340 | | | 1,114 |
Depreciation expense | | | 586 | | | | 752 | | | (166 | ) | | | 451 | | | 142 | | | 309 |
| | | | | | | | | | | | | | | | | | | | |
Operating (loss) income | | $ | (1,593 | ) | | $ | (3,350 | ) | | 1,757 | | | $ | 394 | | $ | (377 | ) | | 771 |
| | | | | | | | | | | | | | | | | | | | |
Year Ended December 31, 2006 Compared to Year Ended December 31, 2005
Revenues
Our revenues increased $12.9 million, or 87.2%, to $27.7 million for 2006, compared to $14.8 million for 2005. Revenues for the U.S. Segment increased $8.3 million, or 58.5%, to $22.5 million for 2006, compared to $14.2 million for 2005. The was primarily attributed to 111% in increase in production hours produced, with 92% attributed to organic growth and 8% from new growth. This increased growth resulted in the re-opening of our Maryland communication center in January of 2006 and resulted in our U.S. communication centers running at 69.7% capacity compared to 45.8% capacity at December 31, 2006 and 2005 respectively. Revenues for the International Segment increased $4.6 million, or 766.7%, to $5.2 million for 2006, compared to $0.6 million for 2005. The increase in revenues is primarily attributed to the opening of our international communication center in September 2005 and increased production hours resulting in our international communication center running at capacity by the end of 2006.
17
Cost of Services
Our cost of services increased $8.2 million, or 62.6%, to $21.3 million for 2006, compared to $13.1 million in 2005. Cost of services as a percentage of revenues decreased to 76.9% for 2006, compared to 88.5% for 2005. Cost of revenues as a percentage of revenues for the U.S. Segment decreased to 81.8% for 2006, compared to 89.4% for 2005. The decrease is primarily attributed to the increase in revenues coupled with increased utilization of our Teleservices Representatives. Cost of services as a percentage of revenues for the International Segment decreased to 55.8% for 2006, compared to 83.3% for 2005. The decrease is primarily attributed to the our Philippines communication center being open for four months in 2005 and twelve months in 2006 which allowed us to spread more of our fixed operating cost over more revenues.
Selling, General and Administrative
Our selling, general and administrative expenses increased $2.1 million, or 46.7%, to $6.6 million for 2006, compared to $4.5 million for 2005. Selling, general and administrative expenses as a percentage of revenues decreased to 23.5% for 2006, compared to 30.4% for 2005. Selling, general and administrative expenses as a percentage of revenues for the U.S. Segment decreased to 22.7% for 2006, compared to 29.6% for 2005. The decrease is primarily attributed to the increase in revenues and a decrease in facilities rent as we did not renew our lease for the 8th floor at our Virginia Facility. Selling, general and administrative expenses as a percentage of revenues for the International Segment decreased to 28.8% for 2006, compared to 50% for 2005. The decrease is primarily attributed to the our Philippines communication center being opened for four months in 2005 and twelve month in 2006 which allowed us to spread more of our fixed operating costs over more revenues.
Depreciation Expense:
Our depreciation expense increased $0.1 million, or 11.1%, to $1.0 million for 2006, compared to $0.9 million for 2005. Depreciation expense for the Untied States Segment decreased $0.2 million, or 25%, to $0.6 million for 2006, compared to $0.8 million for 2005. The decrease was primarily attributed to a total of $1.2 million in assets becoming fully depreciated in 2006 offset by additions to fixed assets of $0.2 million. Depreciation expense for the International Segment increased $0.4 million or 400%, to $0.5 million for 2006, compared to $0.1 million for 2005. The increase was mainly attributed to a fully year of depreciation being recorded in 2006 verses four months in 2005 and additions of $0.4 million of fixed assets in 2006.
RESULTSOF OPERATIONSBY SEGMENTFOR 2005AND 2004
The following table sets forth, for the periods indicated, certain statements of operations data by segment obtained from our consolidated statements of operations.
| | | | | | | | | | | | | | | | | | | | | | | |
| | | United States | | | International | | | |
| | | 2005 | | | 2004 | | | Change | | | 2005 | | | 2004 | | Change | |
| | | (in thousands) | |
Statements of Operations Data: | | | | | | | | | | | | | | | | | | | | | | | |
Revenues | | $ | 14,217 | | | $ | 22,359 | | | $ | (8,142 | ) | | $ | 593 | | | $ | — | | $ | 593 | |
| | | | | | | | | | | | | | | | | | | | | | | |
Cost of services | | | 12,657 | | | | 17,443 | | | | (4,786 | ) | | | 488 | | | | — | | | 488 | |
Selling, general and administrative expenses | | | 4,158 | | | | 5,394 | | | | (1,236 | ) | | | 340 | | | | — | | | 340 | |
Depreciation expense | | | 752 | | | | 658 | | | | 94 | | | | 142 | | | | — | | | 142 | |
| | | | | | | | | | | | | | | | | | | | | | | |
Operating income (loss) | | $ | (3,350 | ) | | $ | (1,136 | ) | | $ | (2,214 | ) | | $ | (377 | ) | | $ | — | | $ | (377 | ) |
| | | | | | | | | | | | | | | | | | | | | | | |
18
Year Ended December 31, 2005 Compared to Year Ended December 31, 2004
Revenues
Our revenues decreased $7.6 million, or 33.9%, to $14.8 million for 2005, compared to $22.4 million for 2004. Revenues for the U.S. Segment decreased $8.2 million, or 36.6%, to $14.2 million for 2005, compared to $22.4 million for 2004. The decrease in revenues is primarily attributed to the lead time necessary for our three new business development professionals to replace the revenue lost from a prior client prematurely halting its marketing programs due to court rulings and regulatory changes that made it difficult to sell bundled services to consumers and the completion of a major marketing campaign in 2004 for one of our main customers. Revenues for the International Segment was 0.6 million due to the opening of our Philippines communication center in September 2005 and a quick start of production for two new clients.
Cost of Services
Our cost of services decreased $4.3 million, or 24.7%, to $13.1 million for 2005, compared to $17.4 million in 2004. Cost of services as a percentage of revenues increased to 88.5% for 2005, compared to 77.7% for 2004. Cost of services as a percentage of revenues for the U.S. Segment increased to 89.4% for 2005, compared to 77.7% for 2004. The increase is primarily attributed to increase in telecommunication costs resulting from the opening of our Augusta, Maine facility which was offset slightly by the temporary closing of our Hyattsville, Maryland facility where the prior client’s programs were being performed. Cost of services as a percentage of revenues for the International Segment was 83.3% which was attributed to the opening of our Philippines communication center in September 2005 which required us to incur operating cost for the communication center as we quickly started production for two new clients.
Selling, General and Administrative
Our selling, general and administrative expenses decreased $0.9 million, or 16.7%, to $4.5 million for 2005, compared to $5.4 million for 2004. Selling, general and administrative expenses as a percentage of revenues increased to 30.4% for 2005, compared to 24.1% for 2004. Selling, general and administrative expenses as a percentage of revenues for the U.S. Segment increased to 29.6% for 2005, compared to 24.1% for 2004. The increase is attributed to the decrease in revenues and higher overhead costs in 2004 due to the restructuring of our management team. Selling, general and administrative expenses as a percentage of revenues for the International Segment was 50% which was attributed to the opening of our Philippines communication center in September 2005 which required us to incur cost to run and oversee the communication center.
Depreciation Expense:
Our depreciation expense increased $0.2 million, or 28.6%, to $0.9 million for 2005, compared to $0.7 million for 2004. Depreciation expense for the Untied States Segment increased $0.1 million, or 14.3%, to $0.8 million for 2005, compared to $0.7 million for 2004. The increase was primarily attributed to a total of $1.5 million assets becoming fully depreciated in 2005 offset by additions to fixed assets of $0.1 million. Depreciation expense for the International Segment increased to $0.1 million for 2005 due to the opening of our first offshore facility in Manila, Philippines
LIQUIDITYAND CAPITAL RESOURCES
The following table summarizes our cash flow by category for the years ended December 31, (in thousands):
| | | | | | | | | | | | |
| | | 2006 | | | 2005 | | | Change | |
Net cash used in operating activities | | $ | (6,009 | ) | | $ | (4,578 | ) | | $ | (1,431 | ) |
Net cash provided by (used in) investing activities | | $ | 9,313 | | | $ | (2,915 | ) | | $ | 12,228 | |
Net cash (used in) provided by financing activities | | $ | (2,223 | ) | | $ | 6,678 | | | $ | (8,901 | ) |
Our primary cash requirements include the funding of the following:
| | • | | capital expenditures for new and ongoing communication centers |
| | • | | interest payments and the repayment of principal on our debt. |
Our primary source of liquidity has been cash flows from operations, supplemented by borrowing under our note payable and funding from the issuance of convertible debt via private placements. For the year ended December 31, 2006 and 2005, we had cash and cash equivalents of $2.8 million and $1.8 million, respectively and working capital of $4.2 million and $(4.1) million respectively.
19
Net cash used in operating activities was 6.0 million in 2006, compared to $4.6 million in 2005. The net increase was primarily due to a increase in accounts receivable offset by a decrease in other assets and accrued interest. The primary reason for the increase in accounts receivables is attributed to the increase in revenues from continuing operations. While the increase in other assets is primarily attributed to the Hold Back from the sale of our TMS Professional Markets Group in August 2006. Net cash used in operating activities was $4.6 million in 2005, compared to net cash provided by operating activities of $3.9 million in 2004. The net decrease was primarily due to a decrease in accounts receivables of $0.4 million, a decrease on grant payable of $2.2 million, and a decrease in deferred revenues of $1.1 million and the $3.3 million increase in net loss in 2005 compared to 2004. The changes in accounts receivable was primarily the result of decreased revenues and billing in our business services segment and medical education division. The requirement of less grant payments to be made to recipients on behalf of our clients caused the change in grant payable. The change in deferred revenues was the result of an increase in requests from certain significant pharmaceutical customers to pre-bill them at the end of the 2004 year for services not yet fully performed under our contract with them, such requests were not as prevalent at the end of the 2005 year.
We utilize Days Sales Outstanding as a key performance indicator to monitor the average collection period for our accounts receivables and to assess overall collection risk. Our Days Sales Outstanding was 75.7 days, 58.2 days and 73.7 days for the years ended December 31, 2006, 2005 and 2004, respectively.
Net cash provided by investing activities was 9.3 million in 2006, compared to net cash used in investing activities of $2.9 million in 2005. The increase in cash provided by investing activities is primarily attributed to the sale of all or substantially all our assets of TMS, pursuant to a majority consent from our outstanding stockholders which resulted in net proceeds of $9.8 million offset by additions to property and equipment from continuing operations of $0.6 million and from discontinued operations of $0.2 million. The increase in property and equipment from continuing operations was primarily the result of purchases of computer equipment and computer software to support our current operations. Net cash used in investing activities was $2.9 million in 2005, compared to $0.7 million in 2004. The change was the result of significant purchases of fixed assets totaling approximately $2.3 million related to the build-out of our new communications center in Manila, Philippines in 2005.
Net cash used in financing activities was $2.2 million in 2006, compared to net cash provided by financing activities of $6.7 million in 2005. The net cash used in financing activities is primarily attributed to the repayment of our Debt Agreement with Capital Source in the amount of $4.5 million, including a $1.0 million early termination fee from the proceeds from our sale of TMS. This was offset by borrowings from our fourth private placement (5% Convertible Note IV”) which raised $2.5 million from accredited investors, including $0.5 million from certain members of the our Board of Directors and a note payable (“Note Payable”) in the amount of $2.0 million from a member of our Board of Directors. In addition, we repaid $0.2 million of Convertible Debt I and refinanced $1.9 million and repaid $0.25 million of the Note Payable. Net cash provided by financing activities was $6.7 million in 2005, compared to net cash used in financing activities of $1.1 million in 2004. The increase was primarily due to increases in net borrowing under the Debt Agreement of $1.6 million and borrowing for equipment under a capital lease in the Philippines of $0.8 million, as well as an increase due to proceeds from a private placement from Accredited Investors of $1.0 million and proceeds from the issuance of common stock of $3.3 million. The increased borrowing was primarily a result of the delays in reconciling completed projects and collections of accounts receivables and increased working capital needs due to decreases in revenues.
We expect to meet our short-term liquidity requirements through net cash provided by operations, the release of restricted cash as collateral under a lease arrangement, proceeds from our working capital settlement from the sale of TMS and cash and cash equivalents. We believe that these sources of cash will be sufficient to meet our operating needs and planned capital expenditures for at least the next twelve months.
20
CONTRACTUAL OBLIGATIONSAND OFF BALANCE SHEET ARRANGEMENTS
The following is a chart of our approximate contractual cash payment obligations, which have been aggregated to facilitate a basic understanding of our liquidity as of December 31, 2006:
Contractual Cash Obligations
| | | | | | | | | | | | |
| | | Payments Due by Period |
| | | Total | | 1 year | | 2-4 years | | 5 years |
Long-term debt | | $ | 1,750,000 | | $ | 1,750,000 | | $ | — | | $ | — |
Convertible debt | | | 5,635,000 | | | — | | | 5,635,000 | | | — |
Capital lease obligations | | | 685,000 | | | 426,000 | | | 259,000 | | | — |
Operating leases | | | 6,214,000 | | | 2,380,000 | | | 3,599,000 | | | 235,000 |
Insurance Financing | | | 14,000 | | | 14,000 | | | — | | | — |
| | | | | | | | | | | | |
Total contractual obligations | | $ | 14,298,000 | | $ | 4,570,000 | | $ | 9,493,000 | | $ | 235,000 |
| | | | | | | | | | | | |
We have no off-balance sheet arrangements. The debt and lease obligations in the table above do not include accrued interest.
EMPLOYMENT AGREEMENTS
In connection with certain acquisitions and in the normal course of business, we have entered into employment agreements with our management employees, which expire at various times through 2010, certain of whom are our stockholders. The employment agreements have terms up to three years and require annual base salary payments of $1,050,000 and bonus payments of up to $80,000 per year.
| ITEM 7A. | QUANTITATIVE AND QUALITATIVE DISCLOSURES ABOUT MARKET RISK. |
Our results of operation and cash flows are subject to fluctuations due to changes in foreign currency exchange rate, particularly the Philippines peso. For the years ended December 31, 2004, 2005 and 2006, approximately 0%, 3% and 8%, respectively, of our expenses were generated in the Philippines. We derived all of our revenues in U.S. dollars. A 10% increase in the value of the U.S. dollar relative to the Philippines peso would reduce the expenses associated with the operations of our overseas operation by approximately $0.2 million where as a 10% decrease in the relative value of the dollar would increase the cost associated with these operations by approximately $0.2 million. Expenses relating to our operations outside of the Unites States increased for the year ended December 31, 2006 when compared to the year ended December 31, 2005 due to increased cost associated with higher revenue generation and a decrease in the value of the U.S. dollar relative to the Philippine peso.
We have cash, cash and cash equivalents and restricted cash equivalents totaling $3.3 million at December 31, 2006. These amounts were primarily invested in money market funds, certificate of deposits and variable rated preferred instruments. The cash and cash equivalents are held for working capital requirements, expansion and general corporate purposes. We do not enter into investments for trading or speculative purposes. We believe that we have no material exposure to changes in the fair value of our investment portfolio as a result of changes in interest rates.
| ITEM 8. | FINANCIAL STATEMENTS AND SUPPLEMENTARY DATA. |
Our Consolidated Financial Statements and the Notes thereto, together with the reports thereon of Daszkal Bolton, LLP dated April 2, 2007, and BDO Seidman, LLP dated April 11, 2006 are filed as part of this Form 10-K.
21
| ITEM 9. | CHANGES IN AND DISAGREEMENTS WITH ACCOUNTANTS ON ACCOUNTING AND FINANCIAL DISCLOSURES |
On September 25, 2006, the Audit Committee of our Board of Directors dismissed BDO Seidman, LLP(“BDO”) as our independent registered public accounting firm.
On September 27, 2006, we engaged DaszkalBolton, LLP (“DB”) as our new independent registered public accounting firm.
The report of BDO, dated April 11, 2006, on our consolidated financial statements for the fiscal years ended December 31, 2005 and 2004 did not contain an adverse opinion or a disclaimer of opinion, nor was it qualified, however, such report did contain an explanatory paragraph expressing substantial doubt about our ability to continue as a going concern.
During our fiscal years ended December 31, 2005 and 2004, and through September 25, 2006, we did not have any disagreements with BDO on any matter of accounting principles or practices, financial statement disclosure, or auditing scope or procedure, which disagreements, if not resolved to the satisfaction of BDO, would have caused it to make reference to the subject matter of the disagreements in connection with its report.
During our fiscal years ended December 31, 2005 and 2004 and through September 25, 2006, there were no “reportable events”, as defined in Item 304(a)(1)(v) of Regulation S-K adopted by the Securities and Exchange Commission.
During our fiscal years ended December 31, 2005 and 2004 and through September 25, 2006, neither us nor anyone acting on its behalf consulted with DB regarding any of the matters specified in Item 304(a)(2) of Regulation S-K.
22
| ITEM 9A. | CONTROLS AND PROCEDURES |
Disclosure Controls and Procedures
We carried out an evaluation under the supervision and with the participation of our management, including our Chief Executive Officer and Chief Financial Officer, of the effectiveness of our disclosure controls and procedures (as defined in Exchange Act Rules 13a-15(c) and 15d-15(e)) as of the end of the period covered by this Annual Report. Based upon that evaluation, our Chief Executive Officer and Chief Financial Officer concluded that our disclosure controls and procedures were effective as of the period covered by this Annual Report in accumulating and communicating to our management, including our Chief Executive Officer and Chief Financial Officer, material information required to be included in the reports we file or submit under the Securities Exchange Act of 1934 as appropriate to allow timely decisions regarding required disclosure.
Changes in Internal Control Over Financial Reporting
Based on an evaluation under the supervision and with the participation of our management, including our Chief Executive Officer and Chief Financial Officer, there has been no change in our internal control over financial reporting during our last fiscal quarter, identified in connection with that evaluation, that has materially affected, or is reasonably likely to materially affect, our internal control over financial reporting.
| ITEM 9B. | OTHER INFORMATION |
None.
PART III
| ITEMS | 10, 11, 12, 13 and 14. |
The information required by Items 10, 11, 12, 13 and 14 (except for the information required by Item 12 required by Item 201(d) of Regulation S-K) will be set forth in our Proxy Statement relating to the 2007 Annual Meeting of Shareholders, which will be filed no later than April 30, 2007, and is incorporated herein by reference.
EQUITY COMPENSATION PLAN INFORMATION
| | | | | | | |
Plan Category | | (a)
Number of securities
to be issued upon
exercise of
outstanding options,
warrants and rights | | (b) Weighted-average
exercise price of
outstanding options,
warrants and rights | | (c) Number of securities
remaining available for
future issuance under
equity compensation plans
(excluding securities
reflected in column (a) |
Equity compensation plans approved by security holders | | 1,294,890 | | $ | 0.68 | | 634,110 |
Equity compensation plans not approved by security holders | | — | | | — | | — |
Total | | 1,294,890 | | $ | 0.68 | | 634,110 |
23
PART IV
| ITEM 15. | EXHIBITS AND FINANCIAL STATEMENT SCHEDULES |
The following report and Consolidated Financial Statements and the Notes thereto are filed as part of this report beginning on page F-1, pursuant to the Financial Statements and Supplementary Data.
(a)(1) Financial Statements.
Reports of Independent Registered Public Accounting Firms
Consolidated Balance Sheets
Consolidated Statements of Operations
Consolidated Statements of Changes in Common Stockholders’ Deficit
Consolidated Statements of Cash Flows
Notes to Consolidated Financial Statements
(a)(2) Schedule.
Schedule II: Valuation and Qualifying Accounts
Years Ended December 31, 2006, 2005, and 2004
| | | | | | | | | | | | | |
| | | Balance at
Beginning of
Period | | Charged to
Expense | | Deductions | | | Balance at
End of Period |
Year ended December 31, 2006: | | | | | | | | | | | | | |
Allowance for doubtful accounts | | $ | 61,994 | | $ | 59,248 | | $ | (22,112 | ) | | $ | 99,130 |
Deferred tax asset valuation allowance | | | 18,970,295 | | | — | | | (1,856,186 | ) | | | 17,114,109 |
Year ended December 31, 2005: | | | | | | | | | | | | | |
Allowance for doubtful accounts | | $ | 776,066 | | $ | 127 | | $ | (714,199 | ) | | $ | 61,994 |
Deferred tax asset valuation allowance | | | 18,459,070 | | | 511,225 | | | — | | | | 18,970,295 |
Year ended December 31, 2004: | | | | | | | | | | | | | |
Allowance for doubtful accounts | | $ | 707,372 | | $ | 68,694 | | $ | — | | | $ | 776,066 |
Deferred tax asset valuation allowance | | | 16,663,059 | | | 1,796,011 | | | — | | | | 18,459,070 |
All other schedules have been omitted because they are not applicable or are not required under Regulation S-X.
24
POWER OF ATTORNEY
The Registrant and each person whose signature appears below hereby appoint Shawkat Raslan and Richard Lyew as attorneys-in-fact with full power of substitution, severally, to execute in the name and on behalf of the Registrant and each such person, individually and in each capacity stated below, one or more amendments to the annual report which amendments may make such changes in the report as the attorney-in-fact acting in the premises deems appropriate and to file any such amendment to the report with the Securities and Exchange Commission.
SIGNATURES
Pursuant to the requirements of Section 13 or 15(d) of the Securities Exchange Act of 1934, the Registrant has duly caused this report to be signed on its behalf by the undersigned, thereunto duly authorized.
| | |
| Access Worldwide Communications, Inc. |
| |
| By | | /s/ Shawkat Raslan |
| | Shawkat Raslan, Chairman, President and Chief Executive Officer |
Dated: April 16, 2007
Pursuant to the requirements of the Securities Exchange Act of 1934, the following persons on behalf of the Registrant and in the capacities and on the dates indicated have signed this report below.
| | | | |
Signature | | Title | | Date |
| | |
/s/ Shawkat Raslan | | Chairman, President and Chief Executive Officer (principal executive officer) | | April 16, 2007 |
| (Shawkat Raslan) | | | | |
| | |
/s/ Richard Lyew | | Executive Vice President and Chief Financial Officer (principal financial and accounting officer) | | April 16, 2007 |
| (Richard Lyew) | | | | |
| | |
/s/ Michael Dornemann | | Director | | April 16, 2007 |
| (Michael Dornemann) | | | | |
| | |
/s/ Orhan Sadik-Khan | | Director | | April 16, 2007 |
| (Orhan Sadik-Khan) | | | | |
| | |
/s/ Frederick Thorne | | Director | | April 16, 2007 |
| (Frederick Thorne | | | | |
| | |
/s/ Carl H. Tiedemann | | Director | | April 16, 2007 |
| (Carl H. Tiedemann) | | | | |
| | |
/s/ Alfonso Yuchengco III | | Director | | April 16, 2007 |
| (Alfonso Yuchengco III) | | | | |
| | |
/s/ Charles Henri Weil | | Director | | April 16, 2007 |
| (Charles Henri Weil) | | | | |
| | |
/s/ Mark Wright | | Secretary | | April 16, 2007 |
| (Mark Wright) | | | | |
25
Index to Financial Statements
Report of Independent Registered Public Accounting Firm
To the Board of Directors and Stockholders of
Access Worldwide Communications, Inc.
We have audited, before the effects of the reclassifications of discontinued operations described in Note14, the accompanying consolidated balance sheet of Access Worldwide Communications, Inc. and subsidiaries (the “Company”) as of December 31, 2005 and the related consolidated statements of operations, changes in common stockholders’ deficit, and cash flows for each of the two years in the period ended December 31, 2005 (The 2005 and 2004 financial statements before the effects of the reclassifications of discontinued operations discussed in Note 14 are not presented herein). We have also audited the schedule for each of the two years in the period ended December 31, 2005 listed in the index appearing under Item 15 (a) (2) on page 24. These financial statements and schedule are the responsibility of the Company’s management. Our responsibility is to express an opinion on these financial statements and schedule based on our audits.
We conducted our audits in accordance with standards of the Public Company Accounting Oversight Board (United States). Those standards require that we plan and perform the audit to obtain reasonable assurance about whether the financial statements and schedule are free of material misstatement. The Company is not required to have, nor were we engaged to perform, an audit of its internal control over financial reporting. Our audit includes consideration of internal control over financial reporting as a basis for designing audit procedures that are appropriate in the circumstances, but not for the purpose of expressing an opinion on the effectiveness of the Company’s internal control over financial reporting. Accordingly, we express no such opinion. An audit also includes examining, on a test basis, evidence supporting the amounts and disclosures in the financial statements and schedule. An audit also includes assessing the accounting principles used and significant estimates made by management, as well as evaluating the overall presentation of the financial statements and schedule. We believe that our audits provide a reasonable basis for our opinion.
In our opinion, the consolidated financial statements referred to above, before the effects of the reclassifications of discontinued operations described in Note 14, present fairly, in all material respects, the financial position of Access Worldwide Communications, Inc. and subsidiaries at December 31, 2005, and the results of its operations and its cash flows for each of the two years in the period ended December 31, 2005 in conformity with accounting principles generally accepted in the United States of America.
Also, in our opinion, the schedule for each of the two years in the period ended December 31, 2005 presents fairly, in all material respects, the information set forth therein.
The accompanying consolidated financial statements and schedule have been prepared assuming that the Company will continue as a going concern. As discussed in Note 1 to the 2005 consolidated financial statements included the Company’s 2005 Form 10-K not presented herein, the Company’s recurring losses from operations, negative cash flows, and accumulated deficit raised substantial doubt about its ability to continue as a going concern. Management’s plans concerning these matters were also described in Note 1 to those financial statements. The consolidated financial statements and schedule do not include any adjustments that might result from the outcome of this uncertainty.
We were not engaged to audit, review, or apply any procedures to the reclassifications to discontinued operations described in Note 14 and, accordingly, we do not express an opinion or any other form of assurance about whether such reclassifications are appropriate and have been properly applied. Those reclassifications were audited by the Independent Registered Public Accounting Firm DaszkalBolton LLP.
/s/ BDO Seidman, LLP
West Palm Beach, Florida
April 11, 2006
F-1
Report of Independent Registered Public Accounting Firm
To the Board of Directors and Stockholders of
Access Worldwide Communications, Inc.
We have audited the accompanying consolidated balance sheet of Access Worldwide Communications, Inc. and subsidiaries (the “Company”) as of December 31, 2006 and the related consolidated statements of operations, changes in common stockholders’ deficit, and cash flows for the year then ended. We have also audited the schedule for year ended December 31, 2006 listed in the index appearing under Item 15 (a)(2) on page 24 and the effects of the reclassification of discontinued operations in the Company’s 2005 and 2004 statements of operations and cash flows. These financial statements and schedule are the responsibility of the Company’s management. Our responsibility is to express an opinion on these financial statements and schedule based on our audits.
We conducted our audits in accordance with standards of the Public Company Accounting Oversight Board (United States). Those standards require that we plan and perform the audit to obtain reasonable assurance about whether the financial statements and schedule are free of material misstatement. The Company is not required to have, nor were we engaged to perform, an audit of its internal control over financial reporting. Our audit includes consideration of internal control over financial reporting as a basis for designing audit procedures that are appropriate in the circumstances, but not for the purpose of expressing an opinion on the effectiveness of the Company’s internal control over financial reporting. Accordingly, we express no such opinion. An audit also includes examining, on a test basis, evidence supporting the amounts and disclosures in the financial statements and schedule. An audit also includes assessing the accounting principles used and significant estimates made by management, as well as evaluating the overall presentation of the financial statements and schedule. We believe that our audits provide a reasonable basis for our opinion.
In our opinion, the consolidated financial statements referred to above present fairly, in all material respects, the financial position of Access Worldwide Communications, Inc. and subsidiaries at December 31, 2006, and the results of its operations and its cash flows for the year then ended. in conformity with accounting principles generally accepted in the United States of America.
In our opinion, the schedule for the year ended December 31, 2006 presents fairly, in all material respects, the information set forth therein.
Also, in our opinion the statements of operations and cash flows for the years ended December 31, 2005 and 2004 fairly present the reclassifications to discontinued operations.
/s/ Daszkal Bolton, LLP
Daszkal Bolton LLP
April 2, 2007
F-2
ACCESS WORLDWIDE COMMUNICATIONS, INC.
CONSOLIDATED BALANCE SHEETS
| | | | | | | | |
| | | As of December 31, | |
| | | 2006 | | | 2005 | |
ASSETS | | | | | | | | |
Current assets: | | | | | | | | |
Cash and cash equivalents | | $ | 2,836,980 | | | $ | 1,755,926 | |
Restricted cash | | | 123,000 | | | | 314,000 | |
Accounts receivable, net of allowance for doubtful accounts of $99,130 and $61,994, respectively | | | 6,956,218 | | | | 7,297,583 | |
Unbilled receivables | | | 7,750 | | | | 228,083 | |
Other current assets, net | | | 831,958 | | | | 785,257 | |
| | | | | | | | |
Total current assets | | | 10,755,906 | | | | 10,380,849 | |
Property and equipment, net | | | 3,374,575 | | | | 5,025,158 | |
Restricted cash | | | 343,000 | | | | 466,000 | |
Other assets, net | | | 386,127 | | | | 390,822 | |
| | | | | | | | |
Total assets | | $ | 14,859,608 | | | $ | 16,262,829 | |
| | | | | | | | |
LIABILITIES AND COMMON STOCKHOLDERS’ DEFICIT | | | | | | | | |
Current liabilities: | | | | | | | | |
Current portion of indebtedness | | $ | 438,866 | | | $ | 4,876,381 | |
Current portion of indebtedness—related parties | | | 1,750,000 | | | | 352,334 | |
Accounts payable | | | 1,315,785 | | | | 1,878,856 | |
Accrued expenses | | | 654,140 | | | | 2,204,267 | |
Grants payable | | | — | | | | 80,000 | |
Accrued salaries, wages and related benefits | | | 586,107 | | | | 736,797 | |
Customer deposits | | | 1,210,146 | | | | 1,084,378 | |
Convertible Notes, net | | | — | | | | 1,768,584 | |
Deferred revenue | | | 669,290 | | | | 1,435,619 | |
Accrued interest and other related party expenses | | | — | | | | 59,512 | |
| | | | | | | | |
Total current liabilities | | | 6,624,334 | | | | 14,476,728 | |
Long-term portion of indebtedness | | | 259,256 | | | | 669,441 | |
Other long-term liabilities | | | 530,992 | | | | 796,418 | |
Convertible Notes, net | | | 4,625,490 | | | | 1,380,564 | |
Mandatorily redeemable preferred stock, $0.01 par value: 1,000,000 shares authorized, 40,000 shares issued and outstanding | | | 4,000,000 | | | | 4,000,000 | |
| | | | | | | | |
Total liabilities | | | 16,040,072 | | | | 21,323,151 | |
| | | | | | | | |
Commitments and contingencies | | | | | | | | |
Common stockholders’ deficit: | | | | | | | | |
Common stock, $0.01 par value: voting: 40,000,000 shares authorized; 17,340,065 and 16,616,219 shares issued and outstanding, respectively | | | 173,401 | | | | 166,162 | |
Additional paid-in capital | | | 71,362,793 | | | | 70,389,446 | |
Accumulated deficit | | | (72,716,658 | ) | | | (75,602,730 | ) |
Deferred compensation | | | — | | | | (13,200 | ) |
| | | | | | | | |
Total common stockholders’ deficit | | | (1,180,464 | ) | | | (5,060,322 | ) |
| | | | | | | | |
Total liabilities and common stockholders’ deficit | | $ | 14,859,608 | | | $ | 16,262,829 | |
| | | | | | | | |
The accompanying notes are an integral part of these financial statements.
F-3
ACCESS WORLDWIDE COMMUNICATIONS, INC.
CONSOLIDATED STATEMENTS OF OPERATIONS
| | | | | | | | | | | | |
| | | For the Years Ended December 31, | |
| | | 2006 | | | 2005 | | | 2004 | |
Revenues | | $ | 27,711,626 | | | $ | 14,809,486 | | | $ | 22,358,522 | |
Cost and expenses: | | | | | | | | | | | | |
Cost of services | | | 21,315,235 | | | | 13,145,510 | | | | 17,443,117 | |
Selling, general and administrative expenses | | | 6,557,701 | | | | 4,497,969 | | | | 5,394,349 | |
Depreciation expense | | | 1,037,856 | | | | 893,516 | | | | 657,984 | |
| | | | | | | | | | | | |
Total costs and expenses | | | 28,910,792 | | | | 18,536,995 | | | | 23,495,450 | |
| | | | | | | | | | | | |
Loss from operations | | | (1,199,166 | ) | | | (3,727,509 | ) | | | (1,136,928 | ) |
Interest income | | | 117,465 | | | | 31,903 | | | | 10,255 | |
Interest expense - related parties | | | (131,280 | ) | | | (91,750 | ) | | | (87,003 | ) |
Interest expense | | | (3,038,091 | ) | | | (1,666,641 | ) | | | (1,237,602 | ) |
| | | | | | | | | | | | |
Loss from continuing operations | | | (4,251,072 | ) | | | (5,453,997 | ) | | | (2,451,278 | ) |
Discontinued operations | | | | | | | | | | | | |
(Loss) income from discontinued operations | | | (591,631 | ) | | | 773,273 | | | | 1,040,245 | |
Gain on disposal of segment, net of income tax expense of $0 | | | 7,728,775 | | | | — | | | | — | |
| | | | | | | | | | | | |
| | | 7,137,144 | | | | 773,273 | | | | 1,040,245 | |
| | | | | | | | | | | | |
Net income (loss) | | | 2,886,072 | | | | (4,680,724 | ) | | | (1,411,033 | ) |
| | | | | | | | | | | | |
Deemed dividend - warrants issued to certain stockholders | | | — | | | | (740,000 | ) | | | — | |
| | | | | | | | | | | | |
Net income (loss) applicable to common stockholders | | $ | 2,886,072 | | | $ | (5,420,724 | ) | | $ | (1,411,033 | ) |
| | | | | | | | | | | | |
Basic and diluted income (loss) per share of common stock | | | | | | | | | | | | |
Continuing operations | | $ | (0.25 | ) | | $ | (0.42 | ) | | $ | (0.24 | ) |
Discontinued operations | | $ | 0.41 | | | $ | 0.06 | | | $ | 0.10 | |
Net income (loss) | | $ | 0.17 | | | $ | (0.41 | ) | | $ | (0.14 | ) |
Weighted average common shares outstanding | | | 17,340,065 | | | | 13,084,761 | | | | 10,008,271 | |
The accompanying notes are an integral part of these financial statements.
F-4
ACCESS WORLDWIDE COMMUNICATIONS, INC.
CONSOLIDATED STATEMENTS OF CHANGES IN
COMMON STOCKHOLDERS’ DEFICIT
For the Years Ended December 31, 2004, 2005 and 2006
| | | | | | | | | | | | | | | | | | | | | |
| | | Common Stock | | Additional
Paid-in
Capital | | | Accumulated
Deficit | | | Deferred
Compensation | | | Total | |
| | | Shares | | Amount | | | | |
Balance, December 31, 2003 | | 9,740,501 | | | 97,405 | | | 64,950,294 | | | | (68,770,973 | ) | | | (26,400 | ) | | | (3,749,674 | ) |
| | | | | | | | | | | | | | | | | | | | | |
Common stock issued to pay accrued bonuses compensation | | 143,216 | | | 1,432 | | | 85,930 | | | | — | | | | — | | | | 87,362 | |
Value of warrants issued in connection with amended Debt Agreement | | — | | | — | | | 68,360 | | | | — | | | | — | | | | 68,360 | |
Value of warrants issued in connection with Convertible Notes II | | — | | | — | | | 609,500 | | | | — | | | | — | | | | 609,500 | |
Beneficial conversion feature associated with Convertible Notes II | | — | | | — | | | 494,500 | | | | — | | | | — | | | | 494,500 | |
Amortization of deferred compensation | | — | | | — | | | — | | | | — | | | | 6,600 | | | | 6,600 | |
Common stock options exercised | | 38,002 | | | 380 | | | 19,687 | | | | — | | | | — | | | | 20,067 | |
Common stock warrants exercised | | 920,000 | | | 9,200 | | | — | | | | — | | | | — | | | | 9,200 | |
Net loss for the year ended December 31, 2004 | | — | | | — | | | — | | | | (1,411,033 | ) | | | — | | | | (1,411,033 | ) |
| | | | | | | | | | | | | | | | | | | | | |
Balance, December 31, 2004 | | 10,841,719 | | | 108,417 | | | 66,228,271 | | | | (70,182,006 | ) | | | (19,800 | ) | | | (3,865,118 | ) |
| | | | | | | | | | | | | | | | | | | | | |
Common stock options exercised | | 14,500 | | | 145 | | | 6,675 | | | | — | | | | — | | | | 6,820 | |
Common stock issued to pay accrued bonus compensation | | 185,000 | | | 1,850 | | | 183,150 | | | | — | | | | — | | | | 185,000 | |
Amortization of deferred compensation | | — | | | — | | | — | | | | — | | | | 6,600 | | | | 6,600 | |
Common stock options granted for services | | — | | | — | | | 31,500 | | | | — | | | | — | | | | 31,500 | |
Common stock issued in private placement | | 1,000,000 | | | 10,000 | | | 990,000 | | | | — | | | | — | | | | 1,000,000 | |
Common stock issued for Convertible Debt III | | 4,510,000 | | | 45,100 | | | 2,209,850 | | | | — | | | | — | | | | 2,254,950 | |
Common stock warrants exercised | | 65,000 | | | 650 | | | — | | | | — | | | | — | | | | 650 | |
Net loss for the year ended December 31, 2005 | | — | | | — | | | — | | | | (4,680,724 | ) | | | — | | | | (4,680,724 | ) |
Deemed dividend on common stock – warrants issued to certain stockholders | | — | | | — | | | 740,000 | | | | (740,000 | ) | | | — | | | | — | |
| | | | | | | | | | | | | | | | | | | | | |
Balance, December 31, 2005 | | 16,616,219 | | $ | 166,162 | | $ | 70,389,446 | | | $ | (75,602,730 | ) | | $ | (13,200 | ) | | $ | (5,060,322 | ) |
| | | | | | | | | | | | | | | | | | | | | |
Common stock warrants exercised | | 553,500 | | | 5,535 | | | — | | | | — | | | | — | | | | 5,535 | |
Common stock issued for services | | 121,199 | | | 1,212 | | | 96,288 | | | | — | | | | — | | | | 97,500 | |
Common stock issued to pay accrued bonus | | 49,147 | | | 492 | | | 24,082 | | | | — | | | | — | | | | 24,574 | |
Reversal of intrinsic value of deferred compensation | | — | | | — | | | (13,200 | ) | | | — | | | | 13,200 | | | | — | |
Share based compensation expense | | — | | | — | | | 105,046 | | | | — | | | | — | | | | 105,046 | |
Value of warrants issued in connection with refinancing Convertible Note I | | — | | | — | | | 600,385 | | | | — | | | | — | | | | 600,385 | |
Value of warrants issued in connection with note payable to related party | | — | | | — | | | 160,746 | | | | — | | | | — | | | | 160,746 | |
Net income for the year ended December 31, 2006 | | — | | | — | | | — | | | | 2,886,072 | | | | — | | | | 2,886,072 | |
| | | | | | | | | | | | | | | | | | | | | |
Balance, December 31, 2006 | | 17,340,065 | | $ | 173,401 | | $ | 71,362,793 | | | $ | (72,716,658 | ) | | $ | — | | | $ | (1,180,464 | ) |
| | | | | | | | | | | | | | | | | | | | | |
The accompanying notes are an integral part of these financial statements.
F-5
ACCESS WORLDWIDE COMMUNICATIONS, INC.
CONSOLIDATED STATEMENTS OF CASH FLOWS
| | | | | | | | | | | | |
| | | For the Years Ended December 31, | |
| | | 2006 | | | 2005 | | | 2004 | |
Cash flows from operating activities: | | | | | | | | | | | | |
Net income | | $ | 2,886,072 | | | $ | (4,680,724 | ) | | $ | (1,411,033 | ) |
Adjustments to reconcile net income to net cash (used in) provided by operating activities: | | | | | | | | | | | | |
Depreciation and amortization | | | 1,037,856 | | | | 905,156 | | | | 809,006 | |
Allowance for doubtful accounts | | | 98,821 | | | | (65,325 | ) | | | 61,764 | |
Amortization of deferred compensation | | | 10,500 | | | | 15,350 | | | | 6,600 | |
Amortization of deferred financing costs | | | 600,239 | | | | 87,217 | | | | 158,483 | |
Accretion of discount on Convertible Notes | | | 691,727 | | | | 721,463 | | | | 394,349 | |
Gain on sale of discontinued operations | | | (7,728,775 | ) | | | — | | | | — | |
Share based compensation expense | | | 227,119 | | | | — | | | | — | |
Changes in assets and liabilities from discontinued operations | | | 734,419 | | | | (2,308,861 | ) | | | 925,810 | |
Changes in operating assets and liabilities: | | | | | | | | | | | | |
Accounts receivable | | | (4,253,286 | ) | | | 128,519 | | | | 1,662,182 | |
Other assets | | | (449,720 | ) | | | (27,098 | ) | | | 991,903 | |
Accounts payable, grants payable, accrued expenses and other liabilities | | | 287,465 | | | | 797,743 | | | | 145,000 | |
Accrued salaries, wages and related benefits | | | 301,441 | | | | (58,619 | ) | | | (229,536 | ) |
Customer deposits | | | (2 | ) | | | 19,315 | | | | — | |
Deferred revenue | | | 325,603 | | | | (158,665 | ) | | | 402,352 | |
Accrued interest and related party expenses | | | (778,167 | ) | | | 46,911 | | | | — | |
| | | | | | | | | | | | |
Net cash (used in) provided by operating activities | | | (6,008,688 | ) | | | (4,577,618 | ) | | | 3,916,880 | |
| | | | | | | | | | | | |
Cash flows from investing activities: | | | | | | | | | | | | |
Additions to property and equipment, net | | | (564,988 | ) | | | (2,458,104 | ) | | | (473,010 | ) |
Additions to property and equipments from discontinued operations, net | | | (187,549 | ) | | | (387,682 | ) | | | (359,838 | ) |
Net proceeds from sale of discontinued operations | | | 9,751,470 | | | | — | | | | — | |
Decrease (increase) decrease in restricted cash | | | 314,000 | | | | (69,000 | ) | | | 123,000 | |
| | | | | | | | | | | | |
Net cash provided by (used in) investing activities | | | 9,312,933 | | | | (2,914,786 | ) | | | (709,848 | ) |
| | | | | | | | | | | | |
Cash flows from financing activities: | | | | | | | | | | | | |
Payments on capital leases | | | (383,146 | ) | | | 761,373 | | | | (1,214 | ) |
Proceeds from issuance of common stock | | | 5,535 | | | | 3,254,950 | | | | — | |
Proceeds from exercise of common stock options and warrants | | | — | | | | 7,470 | | | | 29,267 | |
Net borrowings under Credit Facility and Debt Agreement | | | (4,454,388 | ) | | | 1,623,855 | | | | (2,212,461 | ) |
Borrowings under note payable to related party | | | 2,000,000 | | | | | | | | | |
Repayment of Convertible Notes | | | (115,000 | ) | | | | | | | | |
Loan origination fees | | | (140,000 | ) | | | (40,000 | ) | | | (25,000 | ) |
Proceeds from issuance of Convertible Notes | | | 1,500,000 | | | | 1,000,000 | | | | 1,150,000 | |
Payments under note payable to related party | | | (602,334 | ) | | | | | | | | |
Proceeds from insurance financing, net | | | (17,122 | ) | | | 22,251 | | | | — | |
Payments on capital leases from discontinued operations | | | (16,736 | ) | | | 47,885 | | | | (18,800 | ) |
Payment of subordinated note from discontinued operations | | | — | | | | — | | | | (31,000 | ) |
| | | | | | | | | | | | |
Net cash (used in) provided by financing activities | | | (2,223,191 | ) | | | 6,677,784 | | | | (1,109,208 | ) |
| | | | | | | | | | | | |
Net increase (decrease) in cash and cash equivalents | | | 1,081,054 | | | | (814,620 | ) | | | 2,097,824 | |
Cash and cash equivalents, beginning of year | | | 1,755,926 | | | | 2,570,546 | | | | 472,722 | |
| | | | | | | | | | | | |
Cash and cash equivalents, end of year | | $ | 2,836,980 | | | $ | 1,755,926 | | | $ | 2,570,546 | |
| | | | | | | | | | | | |
Supplemental disclosure of cash flow information: | | | | | | | | | | | | |
Cash paid during the period for: | | | | | | | | | | | | |
Interest | | $ | 1,896,767 | | | $ | 921,768 | | | $ | 700,085 | |
| | | | | | | | | | | | |
Note: $1,000,000 was paid in 2006 for early termination of credit facility. | | | | | | | | | | | | |
Income taxes | | $ | — | | | $ | — | | | $ | 3,000 | |
| | | | | | | | | | | | |
Non-Cash Investing and Financing Activities: | | | | | | | | | | | | |
Equipment acquisitions through capital leases | | $ | 24,290 | | | $ | 1,053,832 | | | $ | 171,954 | |
| | | | | | | | | | | | |
Issuance of common stock to pay bonuses | | $ | 49,147 | | | $ | 185,000 | | | $ | 87,362 | |
| | | | | | | | | | | | |
The accompanying notes are an integral part of these financial statements.
F-6
ACCESS WORLDWIDE COMMUNICATIONS, INC.
NOTES TO CONSOLIDATED FINANCIAL STATEMENTS
1. BUSINESS DESCRIPTION
Access Worldwide Communications, Inc. (“Access Worldwide,” “Access,” “we,” “our,” “us” or the “Company” refers to Access Worldwide and/or, as the context requires, one or more of our subsidiaries) was incorporated in the State of Delaware on August 11, 1983 and has been a provider of outsourced sales and marketing services since its inception. Over the past couple of years Access has sold various non-core businesses to focus on the rapidly growing business process outsourcing (“BPO”) market. Access is a provider of customer management services in the Telecommunications, Financial Services, Retail/Catalog and Media industries. Access currently has over 1,000 employees worldwide with communication centers in the U.S. and the Philippines.
2. SIGNIFICANT ACCOUNTING POLICIES
Accounting Estimates
The preparation of financial statements in conformity with accounting principles generally accepted in the U.S. requires us to make estimates and assumptions that affect the reported amounts in our financial statements and accompanying notes. Actual results could differ from those estimates.
Concentrations of Risk
We are potentially subjected to concentration of credit risks through our cash and cash equivalents and accounts receivable. Cash and cash equivalents are deposited or managed by major financial institutions and at times are in excess of FDIC insurance limits. At December 31, 2006 and 2005 cash and cash equivalents held in excess FDIC insurance limits was approximately $0.4 million and $0.0 million, respectively.
We extend credit to our customers in the normal course of business and our accounts receivable are concentrated in a relatively few number of customers, a significant change in the liquidity or financial position of any of these customers could have a material adverse impact on the collectability of our accounts receivable and our future operating results. We continuously monitor accounts receivable balances and payments from our customers and maintain an allowance for doubtful accounts based upon historical experience and any specific customer collection issues that we have identified. For the year ended December 31, 2006 and 2005, we maintain allowance for doubtful accounts of $99,130 and $61,994, respectively. While such bad debt expenses have historically been within our expectations and the allowances established, we cannot guarantee that we will continue to experience the same collectability rates that we have in the past. Management’s assessment and judgment are vital requirements in assessing the ultimate realization of accounts receivable, including the credit-worthiness, financial stability and effects of market conditions on each client.
For the year ended December 31, 2006, 2005 and 2004, a substantial portion of our revenues was derived from three customers, who are included in our domestic and international segments (seeNote 15).
| | | | | | | | | |
| | | For the year ended December 31, | |
| | | 2006 | | | 2005 | | | 2004 | |
Revenues | | | | | | | | | |
Client A | | 47 | % | | 33 | % | | 36 | % |
Client B | | 12 | % | | 3 | % | | 0 | % |
Client C | | 6 | % | | 0 | % | | 0 | % |
Accounts Receivable | | | | | | | | | |
Client A | | 54 | % | | 27 | % | | 27 | % |
Client B | | 11 | % | | 1 | % | | 0 | % |
Client C | | 7 | % | | 6 | % | | 0 | % |
As of December 31, 2006, one of these clients is disputing accounts receivables totaling $611,000. We are continuing to do business with this client and are making every effort to negotiation a settlement. Based on current negotiations, we expect a favorable outcome and therefore have not recorded any reserves against these accounts receivables. If we are unable to negotiation a favorable settlement, we could be faced with a potential write-off of some or all of these accounts receivables.
Our revenues are dependent on clients in the telecommunications, financial services, retail/catalog and media industries, and a material decrease in demand for outsourced services in these industries could result in decreased revenues. Additionally, we
have significant operations in the Philippines and are subject to risk associated with operating in the Philippines including political, social and economic instability and increase security concern, fluctuation in currency exchange rates and exposure to different legal standards.
F-7
We maintain operational and technical facilities for our global operations, including maintaining a relationship with three significant vendors that provide maintenance of our main technology equipment and data. Any significant events leading to systems and operations unavailability before our contingency plans can be deployed could potentially lead to a disruption of services and associated financial impact.
Basis of Presentation
The consolidated financial statements present our financial position and results of operations, including all subsidiaries. All intercompany balances and transactions have been eliminated.
Cash and Cash Equivalents
Cash and Cash equivalents consist of cash on hand and short-term investments with original maturities of three months or less. Cash and cash equivalents at December 31, 2006 and 2005 consist of money market funds and investments in Variable Rate Preferred securities. At times, cash balances held at financial institutions are in excess of federally insured limits. We have not experienced any losses in such accounts and management believes the risk related to these short term investments are minimal.
As of December 31, 2006, we have restricted cash of $0.4 million in the form of a certificate of deposit which secured a letter of credit issued to the landlord of our Maryland communication center. The restriction decreases each anniversary year of the lease agreement by $0.1 million through 2008 and then remains at $0.2 million through 2010.
Property and Equipment
Property and equipment are carried at cost less accumulated depreciation. Depreciation is computed using the straight-line method over the estimated useful lives of the assets ranging from three to seven years. Leasehold improvements are amortized over the shorter of the lease term or the life of the asset. When assets are retired or otherwise disposed of, the cost and related accumulated depreciation are removed from the accounts and any resulting gain or loss is recognized in operations in the period. Expenditures for maintenance and repairs are expensed as incurred, while expenditures for major renewals that extend the useful lives are capitalized.
Long-Lived Assets
Long-lived assets, excluding indefinite-lived intangible assets, are reviewed for impairment whenever events or changes in circumstances indicate that the related carrying amounts may not be recoverable. An impairment loss on assets is recognized based on the excess of the asset’s carrying amount over the fair value of the assets, and the long-lived assets to be disposed of are reported at the lower of the carrying amount or fair value less cost to sell.
Reclassifications
Certain reclassifications have been made to the 2005 and 2004 consolidated financial statements to conform to the 2006 presentation. Such reclassifications did not change our net loss or total common stockholders’ deficit as previously reported.
Revenue Recognition
Our customer management services revenues are recognized on the following bases: production hours, inbound minutes, phone calls placed or received sales made per hour or fixed monthly fee. Revenues are recognized when we have no significant obligations remaining, fees are fixed and determinable and collection of the related accounts receivable is reasonably assured.
As of December 31, 2006, we no longer provide medical education and meeting program services for which revenues were recognized on a percentage of completion methodology using project milestones, which at times results in unbilled receivables and favorable and unfavorable cost variances.
Earnings Per Share
Basic earnings per share is based on the weighted average number of common shares outstanding and diluted earnings per share is based on the weighted average number of common shares outstanding and all potentially dilutive common shares outstanding.
F-8
The following is a summary of the number of shares or securities outstanding during the respective periods that have been excluded from the calculation because their effects on net loss from operations would have been anti-dilutive:
| | | | | | |
| | | For the Years Ended December 31, |
| | | 2006 | | 2005 | | 2004 |
Convertible debt | | 10,120,000 | | 3,250,000 | | 3,250,000 |
Warrants | | 6,671,500 | | 6,825,000 | | 1,380,000 |
Stock options | | 1,294,890 | | 1,464,006 | | 1,268,365 |
| | | | | | |
| | 18,086,390 | | 11,539,006 | | 5,898,365 |
| | | | | | |
The following is the computation of basic and diluted loss per common share:
| | | | | | | | | | |
| | | For the Years Ended December 31, | |
| | | Loss (Numerator) | | | Shares (Denominator) | | Per Share
Amount | |
2006 | | | | | | | | | | |
Basic | | $ | 2,886,072 | | | 17,340,065 | | $ | 0.17 | |
| | | | | | | | | | |
Earnings per share of common stock - diluted | | $ | 2,886,072 | | | 17,340,065 | | $ | 0.17 | |
| | | | | | | | | | |
2005 | | | | | | | | | | |
Basic | | $ | (5,420,724 | ) | | 13,084,761 | | $ | (0.41 | ) |
| | | | | | | | | | |
Loss per share of common stock - diluted | | $ | (5,420,724 | ) | | 13,084,761 | | $ | (0.41 | ) |
| | | | | | | | | | |
2004 | | | | | | | | | | |
Basic | | $ | (1,411,033 | ) | | 10,008,271 | | $ | (0.14 | ) |
| | | | | | | | | | |
Loss per share of common stock - diluted | | $ | (1,411,033 | ) | | 10,008,271 | | $ | (0.14 | ) |
| | | | | | | | | | |
Stock-Based Compensation
We maintained an incentive stock option plan that provides for the grant of stock options to our directors, officers and key employees. Under the stock option plan, stock options must be granted at an option price equal to the closing market price of the stock on the date of the stock option was awarded. Stock options granted under the plan become exercisable over three or five years, as determined by the Compensation Committee, in equal annual installments after the date of grant. All stock options granted expire ten years from the date of grant.
Options granted under our stock-based compensation plan to employees were accounted for using the intrinsic value method in accordance with the provisions of APB Opinion No. 25,Accounting for Stock Issued to Employees(“APB No. 25”), and related interpretations. We did not recognize compensation expense in connection with granting stock options to employees as the strike price of the option at the time of grant generally equals the fair market value of our stock at such time. Options granted under our stock-based compensation plan to non-employees are accounted for based on fair value accounting rules. Vesting terms are determined by the Compensation Committee at the time of grant.
In December 2004, the FASB issued Statement No. 123 (revised 2004, Share-Based Payment (“SFAS No. 123R”), which is a revision of Statement No. 123, Accounting for Stock-Based Compensation (“SFAS No. 123”). The Statement supersedes APB No. 25 and its related implementation guidance. As of December 31, 2006, there was approximately $141,956 of total unrecognized share based compensation costs related to the stock options granted under our stock plans. That cost is expected to be recognized over a weighted-average period of 6.9 years
Pro forma Information Under SFAS No. 123R for Periods Prior to Fiscal 2006
The table below illustrates the effect on net loss per share if we had applied the fair value recognition provisions of SFAS No. 123 to stock options granted for the period ended December 31,:
| | | | | | | | |
| | | 2005 | | | 2004 | |
Net loss | | | | | | | | |
As reported | | $ | (5,420,724 | ) | | $ | (1,411,033 | ) |
Add: Stock-based employee compensation expense included in reported net loss, net of related tax effect | | | 6,600 | | | | 6,600 | |
Deduct: Total stock-based employee compensation expense determined under fair value based method for all awards, net of related tax effects | | | (140,639 | ) | | | (194,196 | ) |
| | | | | | | | |
Pro forma | | $ | (5,554,763 | ) | | $ | (1,598,629 | ) |
| | | | | | | | |
Loss per share: | | | | | | | | |
Basic and diluted (1) - as reported | | $ | (0.41 | ) | | | (0.14 | ) |
Basic and diluted (1) - pro forma | | | (0.42 | ) | | | (0.16 | ) |
| (1) | Since the effects of stock options, warrants and convertible debt are anti-dilutive, these effects have not been included in the calculation of dilutive earnings per share (“EPS”). |
F-9
Valuation and Expense Information under SFAS No. 123R
The adoption of SFAS No. 123R had a negligible impact on our net income for period ended December 31, 2006. Accordingly, the adoption of SFAS No. 123R did not have an effect on income per share for the period ended December 31, 2006. We recorded share based compensation cost of approximately $105,046 for the period ended December 31, 2006.
As required by SFAS 123R, we now estimate forfeitures of employee stock options and recognize compensation cost only for those awards expected to vest. Forfeiture rates are determined for three groups of employees-directors, senior management and all other employees, based on historical experience. Estimated forfeitures are now adjusted to actual forfeiture experience as needed. The effect actual forfeitures for the period ended December 31, 2006 and the estimated forfeiture rate for the period ended December 31, 2006 was 29% and 12% respectively.
In connection with the adoption of SFAS No. 123R, we estimate the fair value of each stock option on the date of grant using a Black-Scholes-Merton option-pricing formula, applying the following assumptions, and amortize that value to expense over the option’s vesting period using the straight-line attribution approach for the period ended December 31,:
| | | | | | |
| | | 2006 | | | 2005 | |
Divided yield | | 0 | % | | 0 | % |
Expected volatility | | 106 | % | | 107 | % |
Risk-free interest rate (weighted average) | | 4.72 | % | | 4.05 | % |
Expected option term | | 6.5 years | | | 5 years | |
Nominal option term | | 10 years | | | 10 years | |
Foreign Currency Translation
The U.S. Dollar is the functional currency of our continuing operations. For subsidiaries where the U.S. Dollar is the functional currency, all foreign currency asset and liability amounts are remeasured into U.S. Dollars at end-of-period exchange rates, except for prepaid expenses, property and equipment, and other assets, which are remeasured at historical rates. Foreign currency income and expenses are remeasured at average exchange rates in effect during the year, except for expenses related to balance sheet amounts remeasured at historical exchange rates. Exchange gains and losses arising from remeasurement of foreign currency-denominated monetary assets and liabilities are included in income in the period in which they occur.
Recent Accounting Pronouncements
In September 2006, the Commission issued SAB 108,Considering the Effects of Prior Year Misstatements when Quantifying Misstatements in Current Year Financial Statements. SAB 108 requires analysis of misstatements using both an income statement (rollover approach) and a balance sheet (iron curtain) approach in assessing materiality and provides for a one-time cumulative effect transition adjustment. SAB 108 is effective for our fiscal year 2006 annual financial statements. The adoption of the statement did not have a material impact on our consolidated results of operations, financial position or cash flows.
In July 2006, the FASB issued Interpretation No. 48, “Accounting for Uncertainty in Income Taxes” (“FIN 48”). This interpretation, among other things, creates a two-step approach for evaluating uncertain tax positions. Recognition (step one) occurs when an enterprise concludes that a tax position, based solely on its technical merits, is more-likely-than-not to be sustained upon examination. Measurement (step two) determines the amount of benefit that more-likely-than-not will be realized upon settlement. Derecognition of a tax position that was previously recognized would occur when a company subsequently determines that a tax position no longer meets the more-likely-than-not threshold of being sustained. FIN 48 specifically prohibits the use of a valuation allowance as a substitute for derecognition of tax positions, and it has expanded disclosure requirements. FIN 48 is effective for our fiscal years beginning after December 15, 2006, in which the impact of adoption should be accounted for as a cumulative-effect adjustment to the beginning balance of retained earnings. We will evaluate the adoption of FIN 48 and determine its impact on our consolidated financial statements.
F-10
3. PROPERTY AND EQUIPMENT
Our property and equipment consists of the following:
| | | | | | | | | | |
| | | Useful Life In Years | | December 31, | |
| | | 2006 | | | 2005 | |
Furniture and fixtures | | 7 | | $ | 984,834 | | | $ | 1,565,209 | |
Furniture and fixtures under capital lease | | Life of lease | | | 154,802 | | | | 154,802 | |
Telephone and office equipment | | 7 | | | 2,072,639 | | | | 3,584,905 | |
Telephone and office equipment under capital lease | | Life of lease | | | 230,922 | | | | 235,667 | |
Computer equipment | | 3-5 | | | 4,650,099 | | | | 5,617,062 | |
Computer equipment under capital lease | | Life of lease | | | 1,289,651 | | | | 1,264,451 | |
Leasehold improvements | | Life of lease | | | 1,442,965 | | | | 2,904,607 | |
Fixed assets not placed in service | | | | | 208,678 | | | | 3,613 | |
| | | | | | | | | | |
| | | | | 11,034,590 | | | | 15,330,316 | |
Less: accumulated depreciation and amortization (1) | | | | | (7,660,015 | ) | | | (10,305,158 | ) |
| | | | | | | | | | |
Property and equipment, net | | | | $ | 3,374,575 | | | $ | 5,025,158 | |
| | | | | | | | | | |
Depreciation and amortization expense (including such expense for property and equipment held under capital leases) was $1,037,856, $893,516 and $657,984 for the years ended December 31, 2006, 2005 and 2004, respectively.
| (1) | Accumulated amortization on assets held under capital leases was approximately $634,000 and $233,000 at December 31, 2006 and December 31, 2005, respectively. |
4. INCOME TAXES
Our benefit for income taxes consists of the following:
| | | | | | | | | |
| | | For the Years Ended December 31, |
| | | 2006 | | 2005 | | 2004 |
Current tax benefit : | | | | | | | | | |
Federal | | $ | — | | $ | — | | $ | — |
State | | | — | | | — | | | — |
| | | | | | | | | |
| | | — | | | — | | | — |
| | | | | | | | | |
Deferred tax benefit: | | | | | | | | | |
Federal | | | — | | | — | | | — |
| | | | | | | | | |
| | $ | — | | $ | — | | $ | — |
| | | | | | | | | |
Deferred income taxes reflect the net tax effects of temporary differences between the carrying amounts of assets and liabilities for financial reporting purposes and the amounts used for income tax purposes.
Net deferred tax assets are comprised of the following:
| | | | | | | | |
| | | December 31, | |
| | | 2006 | | | 2005 | |
Deferred tax assets: | | | | | | | | |
Accrued bonus | | $ | 31,933 | | | $ | 97,610 | |
Accrued severance | | | 15,328 | | | | — | |
Bad debt expense | | | 43,539 | | | | 43,151 | |
Accrued vacation pay | | | 1,277 | | | | 54,340 | |
AMT credit | | | 178,664 | | | | 178,664 | |
Depreciation | | | 83,694 | | | | 219,068 | |
Amortization of goodwill | | | 6,901,730 | | | | 10,209,367 | |
Federal and state net operating loss carryforwards | | | 9,810,681 | | | | 7,980,851 | |
Foreign net operating loss carryforwards | | | 7,383 | | | | 147,364 | |
Other | | | 39,880 | | | | 39,880 | |
| | | | | | | | |
Gross deferred tax assets | | | 17,114,109 | | | | 18,970,295 | |
Less: valuation allowance | | | (17,114,109 | ) | | | (18,970,295 | ) |
| | | | | | | | |
Net deferred tax assets | | | — | | | | — | |
| | | | | | | | |
Deferred tax liabilities | | | — | | | | — | |
| | | | | | | | |
Net deferred taxes | | $ | — | | | $ | — | |
| | | | | | | | |
F-11
At December 31, 2006, we had approximately $21,614,000 of net operating loss (“NOL”) carryforwards for federal income tax purposes, approximately $21,095 for foreign income tax purposes, and approximately $50,078,000 for state income tax purposes, which expire at various times through 2025.
A valuation allowance to reduce deferred tax assets is recorded if, based on the weight of the available evidence, it is more likely than not that some portion or all of the deferred tax assets will not be realized. In determining the need for a valuation allowance, an assessment of all available evidence both positive and negative was required. We recorded a valuation allowance of $17,114,109 and $18,970,295 at December 31, 2006 and 2005, respectively, which primarily relates to intangible assets and net operating loss carryforwards.
Our effective tax rate was different from the federal statutory rate as follows:
| | | | | | | | | |
| | | For the Years Ended December 31, | |
| | | 2006 | | | 2005 | | | 2004 | |
Statutory rate | | (34 | )% | | (34 | )% | | (34 | )% |
Permanent difference | | 0 | | | 6 | | | 2 | |
State income taxes, net of federal benefit | | (9 | ) | | (9 | ) | | (9 | ) |
Valuation allowance | | 43 | | | 37 | | | 41 | |
| | | | | | | | | |
| | 0 | % | | 0 | % | | 0 | % |
| | | | | | | | | |
5. INDEBTEDNESS
| | | | | | | | |
| | | December 31, | |
| | | 2006 | | | 2005 | |
Our borrowings consist of the following: | | | | | | | | |
Subordinated unsecured promissory note payable to related party, constant maturity of four months and 200,000 warrants for each four month period | | $ | 1,750,000 | | | | | |
Revolving Credit, Term Loan and Security Agreement (collectively the “Debt Agreement”) | | | — | | | $ | 4,454,388 | |
6% subordinated promissory note due to former stockholder of TeleManagement Services (“TMS”); interest at default rate of 10% per year. Principal and interest payments restricted per subordination agreement to the Debt Agreement | | | — | | | | 352,334 | |
Deferred financing and insurance | | | 13,521 | | | | 30,643 | |
Capital leases payable in monthly installments through May 2010 | | | 684,601 | | | | 1,060,791 | |
| | | | | | | | |
| | | 2,448,122 | | | | 5,898,156 | |
Less: current portion | | | (2,188,866 | ) | | | (5,228,715 | ) |
| | | | | | | | |
| | $ | 259,256 | | | $ | 669,441 | |
| | | | | | | | |
On June 10, 2003, we entered into a Revolving Credit, Term Loan and Security Agreement (“Debt Agreement”) with CapitalSource Finance, LLC (“CapitalSource”), a commercial finance firm. The Debt Agreement provided up to $10.0 million under a revolving line
F-12
of credit (the “Revolver”); up to $0.5 million under a Term Loan (the “Term Loan”). Due to Events of Default that occurred through 2006, we executed five amendments to the Debt Agreement which waived these defaults, amended certain financial covenants and provided for certain other terms and conditions.
On June 20, 2006, the Board of Directors (the “Board”) approved an assets purchase agreement, to sell all or substantially all the assets of TeleManagement Services (“TMS”), pursuant to majority consent from our outstanding stockholders. On August 3, 2006, after receiving a majority consent from our outstanding stockholders, we completed the sale of substantially all of the assets of TMS for $10.5 million, less $0.4 million for the settlement of a subordinated note with the former stockholder of TeleManagement Services, accrued interest and a $0.8 million holdback for working capital settlement within 90 days, as defined in the Assets Purchase Agreement. On March 20, 2007, we settled the working capital settlement with TMS for $0.3 million. The remaining $5.3 million was used to fund operations and pay CapitalSource all amounts due under the terms of the Debt Agreement, including an early termination fee of $1.0 million which has been classified as interest expense.
On May 24, 2006, we entered into a $2.0 million subordinated unsecured promissory note agreement (the “Note”) with Charles Henri-Weil, a member of our board of directors and one of our stockholders. The Note has a constant maturity of four months which requires us to issue a warrant to purchase 200,000 shares of our common stock for each of the four month period the Note remains unpaid. The warrants are fully vested upon issuance and have an exercise price of $0.01 per share and a term of ten years.
As of December 31, 2006, we have issued two warrants to acquire 400,000 shares of our common stock. We estimated these warrants to have a fair value $161,000 using a Black-Scholes pricing model, which has been recorded as debt discount, and is being amortized to interest expense over each four month period.
We expect to meet our short-term liquidity requirements through net cash provided by operations and cash and cash equivalents. We believe that these sources of cash will be sufficient to meet the Company’s operating needs and planned capital expenditures for at least the next twelve months.
Aggregate annual principal maturities for indebtedness as of December 31, 2006 are as follows:
| | | |
2007 | | $ | 2,188,866 |
2008 | | | 231,428 |
2009 | | | 19,438 |
2010 | | | 8,390 |
| | | |
| | $ | 2,448,122 |
| | | |
6. CONVERTIBLE NOTES
On July 15, 2003 (the “Effective Date”), we completed a private placement of $2.1 million of Convertible Notes and warrants (“Convertible Notes I) to purchase up to 1.05 million shares of our common stock that were sold to accredited investors. The proceeds of the Convertible Notes I were used to fund working capital and operations. The Convertible Notes I have a 39 month term, bearing interest at a rate of 5% and convertible after one year from the Effective Date of the Convertible Notes I into our common stock at $1.00 per share. The warrants have an exercise price of $0.01 per share, a term of ten years, and are exercisable commencing July 15, 2004. Interest on the Convertible Notes I is paid quarterly, provided we are in compliance with the covenants of our senior lenders, if any. Principal is payable on the earliest of the 39 month term or a Change of Control (as defined); in either case, only after (i) all amounts due to our senior lenders, if any, have been paid or (ii) our senior lenders, if any, have consented to the payment. During 2004 and 2005, warrants to purchase 920,000 and 55,000 shares of our common stock were exercised for cash proceeds of $9,200 and $550. At December 31, 2006, warrants to purchase 75,000 shares of common stock remained outstanding.
On August 24, 2004, we filed a registration statement on Form S-3 to permit a public offering and sale of shares of common stock into which the Convertible Notes I is convertible, and of the shares of common stock issuable upon exercise of the warrants. The registration statement was declared effective on September 7, 2004.
F-13
We have recorded a debt discount of approximately $1,281,000 consisting of the intrinsic value of the beneficial conversion option of $441,000 and the portion of the proceeds allocated to the warrants of $840,000, using the Black-Scholes option pricing model, based on the relative fair values of the warrants and the Convertible Notes I. The debt discount was amortized over the contractual life of the Convertible Notes I as additional interest expense using the effective interest method.
During the third quarter of 2006, we contacted the Holders of Convertible Note I (the “Holders”) and offered each, the following options: (a) to convert their Convertible Note I to shares of our common stock, (b) to receive a payout of principal and any accrued interest, or (c) to reinvest their Convertible Note I with us for another 36 months in return for an increased conversion rate from one (1) share of our common stock per dollar invested, to two (2) shares of common stock per dollar invested. On October 13, 2006, approximately $1.985 million of the Holders agreed to reinvest in Convertible Notes I (henceforth referred to as “Convertible I” and Convertible Notes I was amended. Convertible I matures the earlier of (a) October 1, 2009 or (b) a change of control, all or any part of the principal amount may be converted at any time at a conversion rate of $0.50 per share. The sale of the underlying shares associated with the amendment was exempt from registration under the Securities Act of 1933 as a private offering to accredited investors under Section 4(2) of the Securities Act.
We have recorded a debt discount of approximately $600,385 using the Black-Scholes option pricing model. The debt discount will be amortized over the contractual life of Convertible I as additional interest expense using the effective interest method. During 2006, 2005, and 2004, approximately $354,000, $400,000, and $381,000 respectively, of debt discount were amortized as interest expense.
On December 15, 2004, we completed a private placement of $1.15 million of Convertible Notes and warrants (“Convertible Notes II”) to purchase up to 1.15 million shares of our common stock that were sold to accredited investors. The proceeds of the Convertible Notes II were used to fund working capital and operations. The Convertible Notes II have a 39 month term, bearing interest at a rate of 5% and are convertible beginning after one year from the Effective Date, as defined, of the Convertible Notes II into common stock at $1.00 per share. The warrants have an exercise price of $0.01 per share, a term of ten years, and were exercisable commencing December 15, 2005. Interest on the Convertible Notes II is paid quarterly, provided we are in compliance with the covenants of our senior lenders, if any. Principal is payable on the earliest of the 39 month term or a Change of Control (as defined); in either case, only after (i) all amounts due to our senior lenders, if any, have been paid or (ii) our senior lenders have consented to the payment.
We have recorded a debt discount of approximately $1,104,000 consisting of the intrinsic value of the beneficial conversion option of $494,500 and the portion of the proceeds allocated to the warrants of $609,500, using the Black-Scholes option pricing model, based on the relative fair values of the warrants and the Convertible Notes II. The debt discount is being amortized over the contractual life of the Convertible Notes II as additional interest expense using the effective interest method. As of December 31, 2006 and 2005, the unamortized balance of our debt discounts associated with Convertible Notes II issued for $1.1 million is approximately $0.4 million and $0.8 million, respectively. During 2006, 2005 and 2004, approximately $338,000, $322,000 and $13,000, respectively, of debt discount was amortized as interest expense.
On August 31, 2005, we completed a private placement for approximately $2.26 million of Convertible Notes (“Convertible Notes III”) and Warrants (“Warrants”) to Accredited Investors, as defined in the Securities Act of 1933, as amended. The Convertible Notes III is convertible at a ratio of 2 shares of our common stock for each $1.00 invested. Each holder of the Convertible Notes III received Warrants to purchase 2 shares of our common stock for each $1.00 invested. The Warrants, which are exercisable into an aggregate of 4,510,000 shares of our common stock, have an exercise price of $0.75 per share, a term of ten years, and are exercisable commencing upon the Vesting Date, which is defined as the completion of both (i) the date upon which the holder of the Warrant pays the purchase price for the Convertible Notes III, and (ii) the date of the Conversion Event. Convertible Notes III was automatically convertible upon the Conversion Event, which is defined as that date upon which the majority of our common stockholders voted to amend our Amended and Restated Certificate of Incorporation (“Certificate of Incorporation”), to increase the authorized shares of the Company’s common stock from 20 million to not less than 35 million.
On August 25, 2005, by written consent, a majority of our stockholders approved an amendment to our Certificate of Incorporation to increase the number of authorized shares of common stock from 20 million to 40 million. As a result of the Conversion Event, on the August 31, 2005, the closing date of the Convertible Notes III, the notes automatically converted into 4,510,000 shares of our common stock. As the Warrants were issued to investors whose Convertible Notes III automatically converted upon issuance to common stock, the Warrants represent a cost of capital. As of December 31, 2006, all Warrants issued in connection with the Convertible Notes III remain outstanding.
F-14
On March 17, 2006, we completed a private placement of $2.5 million of Convertible Notes (“Convertible Notes IV”) to purchase up to 5.0 million shares of our common stock that were sold to accredited investors. The proceeds of the Convertible Notes IV were used to fund working capital and operations. The Convertible Notes IV have a 36 month term, bearing interest at a rate of 5% and are immediately convertible into common stock at a rate of 2 shares per dollar invested, as defined. Interest on the Convertible Notes IV is paid quarterly, provided we are in compliance with the covenants of our senior lenders, if any. Principal is payable on the earliest of the 36 month term or a Change of Control (as defined); in either case, only after (i) all amounts due to our senior lenders, if any, have been paid or (ii) our senior lenders have consented to the payment.
During 2006 and 2005, warrants to purchase 553,500 and 10,000 shares, respectively, of our common stock were exercised for cash proceeds of $5,535 and $100, respectively. At December 31, 2006, warrants to purchase 6,671,500 shares of our common stock remain outstanding.
Under the terms of registration rights granted to the holders of Convertible Notes II, III and IV for the shares into which the notes are convertible, and shares into which the related warrants are exercisable, we have committed to take all reasonable efforts to file a registration statement to register and maintain registration such shares for a period of two years from the effective date of the registration statement.
Aggregate annual principal maturities for convertible notes, which are convertible into 10,120,000 shares of our common stock at the option of the note holder, as of December 31, 2006 are as follows:
| | | |
2007 | | $ | - |
2008 | | | 1,150,000 |
2009 | | | 4,485,000 |
| | | |
| | $ | 5,635,000 |
| | | |
7. PRIVATE PLACEMENT OF COMMON STOCK
On March 4, 2005, we sold and issued to accredited investors 1,000,000 shares of our common stock at a price of $1.00 per share (the “Equity Placement”), including 150,000 shares purchased by a member of our Board of Directors, and 42,500 shares issued to the same member of the Board of Directors or a company affiliated with the member of the Board of Directors on behalf of the other participants as a broker fee. The sale of these shares was exempt from registration under the Securities Act of 1933 as a private offering to “accredited investors” under Section 4(2) of the Securities Act and Rule 506 of Regulation D.
On July 10, 2005, we amended the Equity Placement agreement to include a provision to issue warrants if we raise any additional capital within a year of the Equity Placement agreement for a purchase price of less than the $1.00 per share.
On September 15, 2005, the amended Equity Placement agreement was triggered by the issuance of Convertible Notes III and we issued warrants to purchase 1,000,000 shares of our common stock (the “Warrants”) to the investors in Equity Placement. The Warrants had an exercise price of $0.01 per share, a ten year term and vested upon the Conversion Event. All Warrants are outstanding at December 31, 2006.
The Warrants had a fair value of approximately $740,000, which was determine by utilizing the Black-Scholes pricing model with the following assumptions: an expected life of 10 years, expected volatility of 108%, risk-free interest rate of 4.18%, and a 0% dividend yield. This value has been recorded as a deemed dividend to the warrants and has been classified as such in the accompanying Consolidated Statement of Operations for the year ended December 31, 2005.
8. MANDATORILY REDEEMABLE PREFERRED STOCK
We have outstanding 40,000 shares of mandatorily redeemable preferred stock (the “Preferred Stock”) which entitles the holders to dividends payable in cash and non-cash distributions equal to the product of (x) 8.33 and (y) any per share dividend and distributions paid on shares of the common stock. The Preferred Stock is mandatorily redeemable by us at a price of $100 per share upon public offerings subsequent to February 13, 1998, a change of control or when we achieve net income of $10 million over four consecutive quarters.
F-15
9. STOCK OPTION PLAN
As of December 31, 2006, 2005 and 2004, there were 634,110, 464,994 and 660,635, respectively, stock options available for issuance. A summary of the status of the Plan as of December 31, 2006, 2005 and 2004 and changes during the years then ended is presented below:
| | | | | | | | | | | | | | | |
| | | 2006 | | 2005 | | 2004 |
| | | Shares | | Weighted
Avg. Exercise
Price | | Shares | | Weighted
Avg. Exercise
Price | | Shares | | Weighted
Avg Exercise
Price |
Outstanding at beginning of year | | 1,464,006 | | $ | 0.66 | | 1,268,365 | | $ | 0.66 | | 1,307,300 | | $ | 0.68 |
Granted | | 208,000 | | | 0.50 | | 337,000 | | | 0.79 | | 238,000 | | | 0.66 |
Exercised | | 0 | | | 0.00 | | 14,500 | | | 0.48 | | 38,002 | | | 0.53 |
Forfeited | | 377,116 | | | 0.90 | | 126,859 | | | 0.80 | | 238,933 | | | 0.77 |
| | | | | | | | | | | | | | | |
Outstanding at end of year | | 1,294,890 | | | 0.68 | | 1,464,006 | | | 0.68 | | 1,344,369 | | | 0.66 |
| | | | | | | | | | | | | | | |
Options exercisable at end of Year | | 694,838 | | | | | 609,415 | | | | | 447,255 | | | |
| | | | | | | | | | | | | | | |
Weighted-average fair value of options granted ring the year | | | | $ | 0.42 | | | | $ | 0.63 | | | | $ | 0.52 |
| | | | | | | | | | | | | | | |
The following table summarizes information about stock options outstanding at December 31, 2006:
| | | | | | | | | | | | |
| | | Options Outstanding | | Options Exercisable |
Range of Exercise Prices | | Number
Outstanding | | Weighted-
Average
Remaining
Contractual
Life | | Weighted-
Average
Exercise
Price | | Number
Exercisable | | Weighted-
Average
Exercise
Price |
$0.25-$0.93 | | 1,275,790 | | 6.9 | | $ | 0.62 | | 675,738 | | $ | 0.62 |
$1.25-$2.38 | | 17,000 | | 3.0 | | | 1.62 | | 17,000 | | | 1.62 |
$9.00-$12.00 | | 2,100 | | 0.8 | | | 12.00 | | 2,100 | | | 12.00 |
| | | | | | | | | | | | |
$0.25-$12.00 | | 1,294,890 | | 6.9 | | $ | 0.66 | | 694,838 | | $ | 0.68 |
| | | | | | | | | | | | |
10. RELATED PARTY TRANSACTIONS
Consulting Agreements and Other Services
During the first quarter of 2005, we entered into a Consulting Agreement with a member of our board of directors to provide consulting services with regard to all matters and activities we are performing in the Philippines. The Consulting Agreement provides among other things (i) a term through February 29, 2008 with an option to renew on a month-by-month basis thereafter, (ii) the payment of US $5,000 a month for the remainder of the term, (iii) a designated percent commission on all Qualifying Sales as defined in the Consulting Agreement throughout the remainder of the term, and (iv) a one-time issuance of a stock option to purchase 50,000 shares of the Company’s common stock, at an exercise price of $0.79 per share (the closing market price at the date of grant), with a term of ten years, and a five year vesting schedule. On May 2006, the monthly $5,000 consulting fee was reduced to $2,000 a month. As of December 31, 2006, we have paid $36,000 in consulting fees and amortized $10,500 in compensation expense relating to the one-time issuance of a stock option above.
Office Space
In 2005, the Chief Executive Officer of Access vacated his Greenwich, Connecticut office space and moved to our New York office. For the year ended December 31, 2004, we paid $16,000 for the office space in Greenwich, Connecticut.
On March 29, 2005 and November 28, 2006, we entered into operating lease agreements for our communications centers in the Philippines from a realty company that is majority owned by the immediate family of a member of our board of directors. The leases have terms of five and three years respectively with minimum rent payments of approximately $20,000 and $26,000 per month respectively. During the years ended December 31, 2006 and 2005, we paid $209,541 and $119,000 respectively in rental payments. Additionally, at December 31, 2005 and 2006, we have approximately US $69,000 and $327,000 of cash in a Philippines bank account with a bank that is also majority owned by the immediate family of a member of our Board of Directors.
F-16
Capital Financing
In conjunction with our Third Amendment to the Debt Agreement dated November 12, 2004, we issued warrants to purchase 100,000 shares of the Company’s common stock to the Company’s Chief Executive Officer in return for a $1.0 million personal guarantee on our Debt Agreement.
The Board of Directors and certain executive management participated in our capital raisings for Convertible Debt I, II, III, and IV and invested $950,000, $800,000, $1,000,000 and $525,000, respectively. In addition, a greater than 5% shareholder has invested $25,000, and $75,000 in the Convertible Notes I and Convertible Notes II, respectively.
In accordance with the July 10, 2005 amendment to the March 4, 2005 Subscription Agreement for the private placement of our common stock, we issued warrants to purchase 1,000,000 shares of our common stock to those investors, including a warrant to purchase 192,500 shares issued to a member of the our Board of Directors who participated in the March 4, 2005 private placement. See Note 7.
11. DEFINED CONTRIBUTION PLANS
We have defined contribution employee benefit plans which cover substantially all of our employees. We may make discretionary contributions to our plans. During the years ended December 31, 2006, 2005 and 2004, no amounts were contributed to the plans.
12. COMMITMENTS AND CONTINGENCIES
Employment Agreements
In connection with certain acquisitions and in the normal course of business, we have entered into employment agreements with our management employees, which expire at various times through 2008, certain of whom are our stockholders. The employment agreements have terms up to three years and require annual base salary payments of $1,050,000 and bonus payments of up to $80,000.
Legal Proceedings
We are involved in a variety of proceedings that arise from time to time in the ordinary course of our business. We believe that the ultimate resolution of these matters will not have a material effect on our consolidated financial position, results of operations or cash flows.
Operating Leases
We lease office space and operating equipment under non-cancelable operating leases with terms ranging from two to ten years and expiring at various dates through April 2011.Certain non cancelable leases are classified as capital leases and the leased assets are included in fixed assets. Rent expense from continuing operations under operating leases was approximately $1,725,000, $2,096,000 and $2,023,000 for the years ended December 31, 2006, 2005 and 2004, respectively.
Aggregate minimum annual rentals under the operating leases as of December 31, 2006 are as follows:
| | | |
2007 | | $ | 2,380,000 |
2008 | | | 1,563,000 |
2009 | | | 1,281,000 |
2010 | | | 755,000 |
2011 | | | 235,000 |
| | | |
| | $ | 6,214,000 |
| | | |
13. FAIR VALUE OF FINANCIAL INSTRUMENTS
The carrying amount of cash and cash equivalents approximates their fair value. The fair value of our long-term debt including capital lease obligations and Convertible Notes I, II and IV are determined by calculating the present value of expected future cash outlays associated with our debt instruments. The discount rate used is equivalent to the current rate offered to us for debt of the same maturities at December 31, 2006. The fair value of our long-term indebtedness approximates the carrying value thereof.
F-17
14. DISCONTINUED OPERATIONS
In accordance with SFAS 144, Accounting for the Impairment or Disposal of Long Lived Assets, we have reclassified as discontinued operations, the operations of our TMS Professional Markets Group (“TMS”), a provider of highly professional pharmaceutical marketing services in a variety of therapeutic categories and our AM Medica Communications Group (“AMG”), a provider of highly professional pharmaceutical educations and meeting management services.
TMS was sold on August 3, 2006 for $10.5 million less $0.4 million for the settlement of a subordinated note with the former stockholder of TeleManagement Services, accrued interest and a $0.8 million holdback for the working capital settlement in 90 days, as defined in the Asset Purchase Agreement. On March 20, 2007, we settled the working capital settlement with TMS for $0.3 million. We realized a net gain, including operations through July 31, 2006, of $7.8 million on the disposal of the segment, net of income tax expense and expenses incurred in connection with the transaction as of December 31, 2006.
On December 5, 2006, the Board of Directors approved a plan to terminate our medical education and meeting management services as of December 31, 2006 and focus its attention to the rapidly growing business process outsourcing industry.
In addition to the classification of the gain on the disposal of the segment as discontinued operations, we reclassified the income (loss) from the operations of the segments, net of the related income tax (benefit) expense, for the period from January 1, 2006 until the date of the transaction and the years ended December 31, 2005 and 2004 to discontinued operations in the accompanying statements of income. Revenues and statement of income for TMS and AMG were:
| | | | | | | | | | | | |
| | | 2006 | | | 2005 | | | 2004 | |
TMS: | | | | | | | | | | | | |
Revenues | | $ | 8,617,564 | | | $ | 19,025,986 | | | | 18,568,953 | |
Operating (loss) income | | | (315,512 | ) | | | 1,659,775 | | | | 1,196,499 | |
Net (loss) income per share | | $ | (0.02 | ) | | $ | 0.12 | | | $ | 0.12 | |
| | | |
AMG: | | | | | | | | | | | | |
Revenues | | $ | 1,367,667 | | | $ | 5,086,255 | | | | 6,539,521 | |
Operating (loss) income | | | (260,268 | ) | | | (854,486 | ) | | | (156,984 | ) |
Net (loss) per share | | $ | (0.02 | ) | | $ | (0.07 | ) | | $ | (0.02 | ) |
The TMS assets and liabilities as of July 31, 2006 were as follows:
| | | |
Cash | | $ | 860,682 |
Accounts receivable, net | | | 3,303,986 |
Prepaid expenses | | | 101,974 |
Property and equipment | | | 1,062,757 |
Other assets | | | 46,177 |
| | | |
Total assets | | $ | 5,375,576 |
| | | |
Accounts payable | | $ | 1,888,103 |
Accrued expenses | | | 407,078 |
Other liabilities | | | 789,435 |
| | | |
Total liabilities | | $ | 3,084,616 |
| | | |
F-18
15. SEGMENTS
Our reportable segments are strategic business units that offer our products and services out of different geographical regions. Our reportable segments consist of U.S. Segment which provides customer management services within the U.S. and Philippines Segment which provides customer management services within the Philippines.
We evaluate the performance of our segments and allocate resources based on revenues and operating (loss) income. The tables below present information about our reportable segments for our continuing operations used by our chief operating decision-maker as of and for the years ended December 31,
| | | | | | | | | | | | |
| | | 2006 | | | 2005 | | | 2004 | |
Revenues | | | | | | | | | | | | |
Domestic | | $ | 22,504,228 | | | $ | 14,216,644 | | | $ | 22,358,522 | |
International | | | 5,207,398 | | | | 592,842 | | | | — | |
Total | | $ | 27,711,626 | | | $ | 14,809,486 | | | $ | 22,358,522 | |
Operating (loss) income | | | | | | | | | | | | |
Domestic | | $ | (1,593,363 | ) | | $ | (3,350,233 | ) | | $ | (1,136,928 | ) |
International | | | 394,197 | | | | (377,276 | ) | | | — | |
Total | | $ | (1,199,166 | ) | | $ | (3,727,509 | ) | | $ | (1,136,928 | ) |
Depreciation expense | | | | | | | | | | | | |
Domestic | | $ | 586,553 | | | $ | 751,657 | | | $ | 657,984 | |
International | | | 451,303 | | | | 141,859 | | | | — | |
Total | | $ | 1,037,856 | | | $ | 893,516 | | | $ | 657,984 | |
Total Assets | | | | | | | | | | | | |
Domestic | | $ | 13,570,101 | | | $ | 15,173,949 | | | $ | 16,009,711 | |
International | | | 1,289,507 | | | | 1,088,880 | | | | — | |
Total | | $ | 14,859,608 | | | $ | 16,262,829 | | | $ | 16,009,711 | |
F-19
(a)(3) Exhibits
INDEX TO EXHIBITS
| | |
Exhibit
Number | | |
10 (xxx)* | | Employment Agreement, dated January 21, 2004, by and between Access Worldwide Communications, Inc. and Richard Lyew (Incorporated by reference to Exhibit 10(xxx) to the Company’s For 10-Q filed on March 31, 2004). |
| |
10 (yyy)* | | Employment Agreement, dated January 18, 2004, by and between Access Worldwide Communications, Inc. and Ted Jordan (Incorporated by reference to Exhibit 10(yyy) to the Company’s For 10-Q filed on March 31, 2004). |
| |
10 (zzz)* | | Employment Agreement, dated January 20, 2004, by and between Access Worldwide Communications, Inc. and Georges André (Incorporated by reference to Exhibit 10(zzz) to the Company’s For 10-Q filed on March 31, 2004). |
| |
10 (aaaa)* | | Employment Agreement, dated January 1, 2004, by and between Access Worldwide Communications, Inc. and Guy Amato (Incorporated by reference to Exhibit 10(aaaa) to the Company’s For 10-Q filed on March 31, 2004). |
| |
10 (bbbb) | | Press release of Access Worldwide dated January 29, 2004 (incorporated by reference to Exhibit 99.1 to the Company’s 8K filed on February 4, 2004 announcing the approval of BDO Seidman, LLP as the Company’s Independent Accountants. |
| |
10 (cccc) | | Certification Pursuant to 18 U.S.C. Section 1350, as adopted pursuant to Section 906 of the Sarbanes-Oxley Act of 2002-08-06 – Shawkat Raslan, Chief Executive Officer. – March 31, 2004 (incorporated by reference to Exhibit 32.1 to the Company’s Form 10-Q filed on May 5, 2004). |
| |
10 (dddd) | | Certification Pursuant to 18 U.S.C. Section 1350, as adopted pursuant to Section 906 of the Sarbanes-Oxley Act of 2002-08-06 – John Hamerski, Chief Financial Officer. – March 31, 2004 (incorporated by reference to Exhibit 32.2 to the Company’s Form 10-Q filed on May 5, 2004). |
| |
10 (eeee)* | | Employment Agreement, dated March 30, 2004, by and between Access Worldwide Communications Inc. and Shawkat Raslan (Incorporated by reference to Exhibit 10(eeee) to the Company’s For 10-K filed on March 31, 2005). |
| |
10 (ffff) | | Press release of Access Worldwide, dated May 5, 2004 (incorporated by reference to Exhibit 99.1 to the Company’s 8-K filed on May 5, 2004. |
| |
10 (gggg) | | Press release of Access Worldwide, dated June 23, 2004 (incorporated by reference to Exhibit 99.1 to the Company’s 8K filed on June 23, 2004 announcing the addition of Michael Dornemann to the Board of Directors. |
| |
10 (hhhh) | | Certification Pursuant to 18 U.S.C. Section 1350, as adopted pursuant to Section 906 of the Sarbanes-Oxley Act of 2002-08-06 – Shawkat Raslan, Chief Executive Officer. – June 30, 2004 (incorporated by reference to Exhibit 32.1 to the Company’s Form 10-Q filed on August 9, 2004). |
| |
10 (iiii) | | Certification Pursuant to 18 U.S.C. Section 1350, as adopted pursuant to Section 906 of the Sarbanes-Oxley Act of 2002-08-06 – John Hamerski, Chief Financial Officer. – June 30, 2004 (incorporated by reference to Exhibit 32.2 to the Company’s Form 10-Q filed on August 9, 2004). |
| |
10 (jjjj) | | Press release of Access Worldwide, dated July 1, 2004 (incorporated by reference to Exhibit 99.1 to the Company’s 8K filed on July 1, 2004 announcing the elevation of Richard Lyew to Executive Vice President and Chief Financial Officer. |
| |
10 (kkkk) | | Press release of Access Worldwide, dated August 9, 2004 (incorporated by reference to Exhibit 99.1 to the Company’s 8-K filed on August 9, 2004. |
| | |
10 (llll)* | | Employment Agreement, dated September 10, 2004, by and between Access Worldwide Communications, Inc. and Stedman Stevens (Incorporated by reference to Exhibit 10(kkkk) to the Company’s For 10-K filed on March 31, 2005). |
| |
10 (mmmm) | | Certification Pursuant to 18 U.S.C. Section 1350, as adopted pursuant to Section 906 of the Sarbanes-Oxley Act of 2002-08-06 – Shawkat Raslan, Chief Executive Officer. – September 30, 2004 (incorporated by reference to Exhibit 32.1 to the Company’s Form 10-Q filed on November 15, 2004). |
| |
10 (nnnn) | | Certification Pursuant to 18 U.S.C. Section 1350, as adopted pursuant to Section 906 of the Sarbanes-Oxley Act of 2002-08-06 – John Hamerski, Chief Financial Officer. – September 30, 2004 (incorporated by reference to Exhibit 32.2 to the Company’s Form 10-Q filed on November 15, 2004). |
| |
10 (oooo) | | Press release of Access Worldwide, dated November 15, 2004 (incorporated by reference to Exhibit 99.1 to the Company’s 8-K filed on November 16, 2004. |
| |
10 (pppp) | | Third Amendment to the Revolving Credit, Term Loan and Security Agreement dated November 12, 2004 (Incorporated by reference to Exhibit 10(pppp) to the Company’s For 10-K filed on March 31, 2005). |
| |
10(qqqq) | | 5% Convertible promissory note, dated December 15, 2004, by and between Company and Holder (incorporated by reference to Exhibit 99.1 to the Company’s 8-K filed on March 7, 2005) |
| |
10(rrrr) | | Warrant Certificate, dated December 15, 2004, by and between Company and Holde (Incorporated by reference to Exhibit 99.2 to the Company’s 8-K filed on march 7, 2005). |
| |
10(ssss)* | | Consulting Agreement, dated February 9, 2005, by and between Access Worldwide Communications, Inc. and Alfonso Yuchengco, III (Incorporated by reference to Exhibit 10(gggg) to the Company’s 10-Q filed on May 16, 2005) |
| |
10(tttt) | | Subscription Agreement, dated March 4, 2005, by and between the Company and Holder (Incorporated by reference to Exhibit 10(dddd) to the Company’s Form 10-Q filed on May 16, 2005). |
| |
10(uuuu) | | Lease Agreement, dated march 29, 2005, by and between RCBC Realty Corporation and Access Worldwide (AWWC) Philippines, Inc. (Incorporated by reference to Exhibit 99.1 to the Company’s 8-K filed on April 1, 2005.). |
| |
10(vvvv) | | Press Release of Company Announcing fourth quarter 2004 earnings, dated March 31, 2005 (Incorporated by reference to Exhibit 99.1 to the Company’s 8-K filed on April 1, 2005). |
| |
10(wwww) | | Fourth Amendment to the Revolving Credit, Term Loan and Security Agreement dated August 12, 2005 (Incorporated by reference to Exhibit 10(hhhh) to the Company’s Form 10-Q filed on August 15, 2005). |
| |
10(xxxx) | | Press Release of Access Worldwide, dated May 16, 2005 (Incorporated by reference to Exhibit 99.1 to the Company’s 8-K filed on May 18, 2005). |
| |
10(yyyy) | | Press Release of Access Worldwide, dated August 15, 2005 (Incorporated by reference to Exhibit 99.1 to the Company’s 8-K filed on August 31, 2005). |
| |
10(zzzz) | | Press Release of Access Worldwide, dated November 21, 2005 (Incorporated by reference to Exhibit 99.1 to the Company’s 8-K filed on November 21, 2005). |
| |
10(aaaaa) | | Fifth Amendment to the Revolving Credit, Term Loan and Security Agreement dated March 7, 2006 (incorporated by reference to Exhibit 10(aaaaa) to the Company’s Form 10-K filed on April 17, 2006). |
| |
10(bbbbb) | | Press Release of Company announcing first quarter 2006 earnings, dated May 22, 2006 (incorporated by reference to Exhibit 99.1 to the Company’s 8-K filed on May 22, 2006). |
| |
10(ccccc) | | 5% Convertible Promissory note, dated March 17, 2006, by and between the Company and Holder (Incorporated by reference to Exhibit 99.1 to the Company’s 8-K filed on March 20, 2006). |
| | |
| 10(ddddd) | | Sixth Amendment to the Revolving Credit, Term Loan and Security Agreement by and between the Company and CapitalSource Finance, LLC dated May 18, 2006 (incorporated by reference to Exhibit 10 (ddddd) to the Company’s Form 10-Q filed on May 22, 2006). |
| |
| 10(eeeee) | | Guaranty Agreement by and between Shawkat Raslan and CapitalSource Financial, LLC dated May 18, 2006 (incorporated by reference to Exhibit 10 (eeeee) to the Company’s Form 10-Q filed on May 22, 2006). |
| |
| 10(fffff) | | Subordinated Note, dated June 12, 2006, by and between Company and Charles Henri Weil (incorporated by reference to Exhibit 99.1 to the Company’s 8-K filed on June 15, 2006). |
| |
| 10(ggggg) | | Warrant Certificate, dated June 12, 2006, by and between Company and Charles Henri Weil (incorporated by reference to Exhibit 99.2 to the Company’s 8-K filed on June 15, 2006). |
| |
| 10(hhhhh) | | Subordination Agreement, dated June 12, 2006, by and among CapitalSource Finance, LLC, the Company, and Charles Henri Weil (incorporated by reference to Exhibit 99.3 to the Company’s 8-K filed on June 15, 2006). |
| |
| 10(iiiii) | | Asset Purchase Agreement, dated June 20, 2006, by and among, Access Worldwide, Telemanagement Services, Inc. and TMS Professional Markets Group, LLC (incorporated by reference to Exhibit 99.1 to the Company’s 8-K filed on June 22, 2006). |
| |
| 10(jjjjj) | | Payoff Letter for the Revolving Credit, Term Loan and Security Agreement dated as of June 10, 2003, by and among Access Worldwide Communications, Inc., and its subsidiaries, the Lenders party thereto and CapitalSource Finance, LLC, as agents for the Lenders (as amended, supplemented or otherwise modified to date), dated August 3, 2006 (incorporated by reference to Exhibit 10(jjjjj) to the Company’s Form 10-Q filed on November 14, 2006). |
| |
| 10(kkkkk) | | Acknowledgment letter to the Securities and Exchange Commission dated September 27, 2006, from BDO Seidman, LLP to the Securities and Exchange Commission (incorporated by reference to Exhibit 16.1 to the Company’s 8-K filed September 28, 2006). |
| |
| 10(lllll) | | First Amendment to the 5% Convertible Promissory Note, by and between Access Worldwide and the Holder, dated October 13, 2006 (incorporated by reference to Exhibit 99.1 to the Company’s 8-K filed on June 22, 2006). |
| |
| 10(mmmmm) | | Lease Agreement, by and between Access Worldwide (AWWC) Philippines, Inc., a wholly owned subsidiary of Access Worldwide Communications Inc., and RCBC Realty Corporation, dated November 2006 (Incorporated by reference to Exhibit 99.1 to the Company’s Form 8-K filed on December 1, 2006). |
| |
| 10(nnnnn) | | Employment Agreement by and between Access Worldwide Communications, Inc. and Shawkat Raslan (Incorporated by reference to Exhibit 99.1 to the Company’s Form 8-K filed on January 5, 2007). |
| |
| 10(ooooo) | | Employment Agreement by and between Access Worldwide Communications, Inc. and Richard Lyew (Incorporated by reference to Exhibit 99.1 to the Company’s Form 8-K filed on January 5, 2007). |
| |
| 10(ppppp) | | Employment Agreement by and between Access Worldwide Communications, Inc. and J. Ted Jordan (Incorporated by reference to Exhibit 99.1 to the Company’s Form 8-K filed on January 5, 2007). |
| |
| 10(qqqqq) | | Employment Agreement by and between Access Worldwide Communications, Inc. and Mark Wright (Incorporated by reference to Exhibit 99.1 to the Company’s Form 8-K filed on January 5, 2007). |
| |
| 10(rrrrr) | | Press Release of Access Worldwide Communications, Inc., dated February 2, 2007 (Incorporated by reference to Exhibit 99.1 to the Company’s Form 8-K filed on February 2, 2007). |
| |
| 10(sssss) | | Press Release of Access Worldwide Communications, Inc., dated February 6, 2007 (Incorporated by reference to Exhibit 99.1 to the Company’s Form 8-K filed on February 6, 2007). |
| |
| 23.1 | | Consent of Daszkal Bolton, LLP |
| |
| 23.2 | | Consent of BDO Seidman, LLP |
| |
| 24 | | Powers of Attorney (see signature page). |
| | |
| 31.1 | | Certification of Chief Executive Officer pursuant to Section 302 of the Sarbanes-Oxley Act of 2004. |
| 31.2 | | Certification of Chief Executive Officer pursuant to Section 302 of the Sarbanes-Oxley Act of 2004. |
| 32.1 | | Certification of Chief Executive Officer pursuant to Section 906 of the Sarbanes-Oxley Act of 2004. |
| 32.2 | | Certification of Chief Executive Officer pursuant to Section 906 of the Sarbanes-Oxley Act of 2004. |
| * | Management contract or compensatory plan or arrangement. |