UNITED STATES
SECURITIES AND EXCHANGE COMMISSION
Washington, D.C. 20549
FORM N-CSR
Certified Shareholder Report of
Registered Management Investment Companies
Investment Company Act File Number: 811-00604
Washington Mutual Investors Fund
(Exact Name of Registrant as Specified in Charter)
6455 Irvine Center Drive
Irvine, California 92618
(Address of Principal Executive Offices)
Registrant's telephone number, including area code: (949) 975-5000
Date of fiscal year end: April 30
Date of reporting period: October 31, 2019
Brian C. Janssen
Washington Mutual Investors Fund
6455 Irvine Center Drive
Irvine, California 92618
(Name and Address of Agent for Service)
ITEM 1 – Reports to Stockholders
Washington Mutual
Investors FundSM
Semi-annual report
for the six months ended
October 31, 2019 |  |

We seek to generate
income and find
opportunities to grow
principal through
investment in high-
quality common stocks
Beginning January 1, 2021, as permitted by regulations adopted by the U.S. Securities and Exchange Commission, we intend to no longer mail paper copies of the fund’s shareholder reports, unless specifically requested from American Funds or your financial intermediary, such as a broker-dealer or bank. Instead, the reports will be made available on the Capital Group website (capitalgroup.com); you will be notified by mail and provided with a website link to access the report each time a report is posted. If you have already elected to receive shareholder reports electronically, you will not be affected by this change and do not need to take any action. If you prefer to receive shareholder reports and other communications electronically, you may update your mailing preferences with your financial intermediary, or enroll in e-delivery at capitalgroup.com (for accounts held directly with the fund).
You may elect to receive paper copies of all future reports free of charge. If you invest through a financial intermediary, you may contact your financial intermediary to request that you continue to receive paper copies of your shareholder reports. If you invest directly with the fund, you may inform American Funds that you wish to continue receiving paper copies of your shareholder reports by contacting us at (800) 421-4225. Your election to receive paper reports will apply to all funds held with American Funds or through your financial intermediary.
Washington Mutual Investors Fund seeks to produce income and to provide an opportunity for growth of principal consistent with sound common stock investing.
This fund is one of more than 40 offered by Capital Group, home of American Funds, one of the nation’s largest mutual fund families. For more than 85 years, Capital Group has invested with a long-term focus based on thorough research and attention to risk.
Fund results shown in this report, unless otherwise indicated, are for Class A shares at net asset value. If a sales charge (maximum 5.75%) had been deducted, the results would have been lower. Results are for past periods and are not predictive of results for future periods. Current and future results may be lower or higher than those shown. Share prices and returns will vary, so investors may lose money. Investing for short periods makes losses more likely. For current information and month-end results, visit capitalgroup.com.
Here are the average annual total returns on a $1,000 investment with all distributions reinvested for periods ended September 30, 2019 (the most recent quarter-end):
| Class A shares | 1 year | 5 years | 10 years |
| | | | |
| Reflecting 5.75% maximum sales charge | –0.25% | 8.49% | 12.08% |
For other share class results, visit capitalgroup.com and americanfundsretirement.com.
The total annual fund operating expense ratio was 0.59% for Class A shares as of the prospectus dated July 1, 2019. The expense ratio is restated to reflect current fees.
Investment results assume all distributions are reinvested and reflect applicable fees and expenses. When applicable, investment results reflect fee waivers, without which results would have been lower. Visit capitalgroup.com for more information.
The fund’s 30-day yield for Class A shares as of November 30, 2019, reflecting the 5.75% maximum sales charge and calculated in accordance with the U.S. Securities and Exchange Commission formula, was 1.58%.
Refer to the fund prospectus and the Risk Factors section of this report for more information on risks associated with investing in the fund.
Investments are not FDIC-insured, nor are they deposits of or guaranteed by a bank or any other entity, so they may lose value.
Fellow investors:
Over the six months ended October 31, 2019, Washington Mutual Investors Fund reported a total return of 3.74%, which compares to the 4.16% gain of the unmanaged Standard & Poor’s 500 Composite Index (benchmark) and a 3.21% increase for the Lipper Growth & Income Funds Index (peers).
Over the past six months, the fund paid two regular dividends totaling 40.5 cents a share. The fund also made a capital gains distribution of $0.90 a share in June 2019.
We’re pleased with the fund’s lifetime average annual total return of 11.82%. By contrast, the S&P 500 — a market capitalization-weighted index based on the results of approximately 500 widely held common stocks — had a 10.81% average annual total return over that same period of time. The fund outpaced the Lipper Growth & Income Funds Index, a peer group measure, over one-, five- and 10-year periods.
Results at a glance
Total returns for periods ended October 31, 2019, with all distributions reinvested.
| | | Cumulative
total returns | | Average annual total returns |
| | | 6 months | | 1 year | | 5 years | | 10 years | | Lifetime
(since 7/31/52) |
| | | | | | | | | | | |
| Washington Mutual Investors Fund (Class A shares) | | | 3.74 | % | | | 12.97 | % | | | 9.73 | % | | | 12.97 | % | | | 11.82 | % |
| Standard & Poor’s 500 Composite Index1 | | | 4.16 | | | | 14.33 | | | | 10.78 | | | | 13.70 | | | | 10.81 | |
| Lipper Growth & Income Funds Index2 | | | 3.21 | | | | 11.67 | | | | 7.66 | | | | 10.59 | | | | — | 3 |
| | |
| 1 | Source: S&P Dow Jones Indices LLC. The market index is unmanaged and, therefore, has no expenses. Investors cannot invest directly in an index. |
| 2 | Source: Thomson Reuters Lipper. Lipper indexes track the largest mutual funds (no more than 30), represented by one share class per fund, in the corresponding Lipper category. |
| 3 | This index was not in existence as of the date the fund’s Class A shares became available; therefore, lifetime results are not shown. |
| Washington Mutual Investors Fund | 1 |
The economy and markets
As measured by the S&P 500, U.S. equities began and ended this reporting period at record highs — buoyed by strong consumer demand, the lowest unemployment rate since 1969 and the first Federal Reserve (Fed) rate cut cycle in a decade. In between, however, ongoing trade negotiations between the U.S. and China reignited fears of a global slowdown that led to sharp selloffs in May and August.
Markets do not like the uncertainty of trade disputes when they directly impact the two largest economies in the world, as companies have to put off capital spending plans, rethink their supply chains and contemplate a variety of best- and worst-case scenarios. A comprehensive trade agreement is still not in sight, but the stock market received a boost from lower rates. As recently as December 2018, the Fed had projected two rate hikes in 2019. What changed was the move by European central banks to lower negative rates even further, putting downward pressure on U.S. rates even as most economic data remained strong.
There were clouds on the horizon: U.S. manufacturing activity contracted for the first time since 2016, a stronger dollar put corporate earnings under pressure after the temporary boost from the 2018 tax cuts, and market participants openly wondered how long the longest bull market in history could continue.
September witnessed a rotation into slower growing value stocks at the expense of more expensive growth stocks. Such caution has historically been a positive sign, as it indicates that investors lack the extreme optimism and exuberance that typically accompany stock market tops.
A look at the portfolio
Sectors: This market environment was not favorable to the fund’s sector positioning. The fund was significantly overweight in two of the worst-returning sectors, energy and industrials, as a global manufacturing slowdown exacerbated oil oversupply. The fund was also underweight in the two top sectors, utilities and real estate, both of which benefit from lower interest rates.
Stocks: Eight of the 10 largest fund holdings gained over the period. Microsoft, the fund’s largest holding, advanced 9.78%, continuing to exceed profit estimates due largely to the recurring revenue stream from its Office 365 and Azure cloud computing platforms. Semiconductor manufacturers added the U.S. blacklist of Chinese technology giant Huawei to the challenges of sluggish demand and increased competition. The fund’s second-largest holding, Broadcom, Apple’s chipmaker, fell 8.02%, but Intel, the fund’s fourth-largest holding, gained back 10.76% on improved earnings.
| 2 | Washington Mutual Investors Fund |
Comcast increased 2.96%, led by strong results at NBC and Sky TV. Boeing dropped 10.00% after it had to ground 737 MAX aircraft due to issues tied to a flight-control system. Merck gained 10.10% on the strength of its cancer treatment Keytruda. The fund’s large financial and health care holdings did well; UnitedHealth Group rose 8.42% while CME Group gained 15.01%. Rounding out the top 10, Northrop Grumman increased 21.58% on the ramp-up of U.S. defense spending, and Home Depot gained 15.16% as strong consumer spending helped select retailers.
Looking ahead
When we launched Washington Mutual Investors Fund in 1952, our goal was to produce income and an opportunity for growth with lower volatility over time. To help lower risk, we applied a strict set of eligibility rules for fund holdings. Portfolio managers and analysts continue to focus on identifying companies with a mix of strong growth and income potential.
We believe that this strategy, combined with American Funds’ time-tested approach to investing, can continue to help investors pursue their long-term financial goals. We would like to take this opportunity to welcome our new shareholders to the fund and to thank current investors for the trust and confidence they’ve placed in Washington Mutual Investors Fund.
We look forward to reporting back to you again in six months.
Cordially,
 | |  |
| | | |
| Alan N. Berro | | Eric H. Stern |
| Co-President | | Co-President |
| Washington Mutual Investors Fund | | Washington Mutual Investors Fund |
December 10, 2019
For current information about the fund, visit capitalgroup.com.
| Washington Mutual Investors Fund | 3 |
| Summary investment portfolio October 31, 2019 | unaudited |
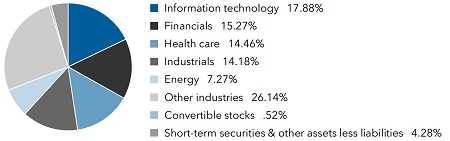
| Industry sector diversification | Percent of net assets |
| Largest equity holdings | | Percent of
net assets |
| Microsoft | | | 5.89 | % |
| Broadcom | | | 3.33 | |
| Comcast | | | 2.89 | |
| Intel | | | 2.86 | |
| Boeing | | | 2.84 | |
| Merck | | | 2.54 | |
| UnitedHealth Group | | | 2.52 | |
| CME Group | | | 2.40 | |
| Northrop Grumman | | | 2.38 | |
| Home Depot | | | 2.36 | |
| Common stocks 95.20% | | Shares | | | Value
(000) | |
| Energy 7.27% | | | | | | |
| Chevron Corp. | | | 11,064,794 | | | $ | 1,285,065 | |
| Enbridge Inc. | | | 42,109,400 | | | | 1,533,203 | |
| Exxon Mobil Corp. | | | 19,363,000 | | | | 1,308,358 | |
| Royal Dutch Shell PLC, Class A (ADR) | | | 128,867 | | | | 7,471 | |
| Royal Dutch Shell PLC, Class B (ADR) | | | 27,802,350 | | | | 1,620,599 | |
| Schlumberger Ltd. | | | 28,562,600 | | | | 933,712 | |
| Other securities | | | | | | | 2,208,187 | |
| | | | | | | | 8,896,595 | |
| | | | | | | | | |
| Materials 3.40% | | | | | | | | |
| Dow Inc. | | | 23,265,833 | | | | 1,174,692 | |
| DuPont de Nemours Inc. | | | 11,217,379 | | | | 739,337 | |
| Other securities | | | | | | | 2,246,341 | |
| | | | | | | | 4,160,370 | |
| | | | | | | | | |
| Industrials 14.18% | | | | | | | | |
| Boeing Co. | | | 10,223,700 | | | | 3,475,138 | |
| CSX Corp. | | | 19,702,300 | | | | 1,384,481 | |
| Honeywell International Inc. | | | 6,126,665 | | | | 1,058,259 | |
| Johnson Controls International PLC | | | 23,775,000 | | | | 1,030,171 | |
| Lockheed Martin Corp. | | | 5,441,500 | | | | 2,049,704 | |
| Northrop Grumman Corp. | | | 8,258,400 | | | | 2,910,921 | |
| 4 | Washington Mutual Investors Fund |
| | | Shares | | | Value
(000) | |
| Union Pacific Corp. | | | 6,527,690 | | | $ | 1,080,072 | |
| United Parcel Service, Inc., Class B | | | 6,084,000 | | | | 700,694 | |
| Other securities | | | | | | | 3,654,500 | |
| | | | | | | | 17,343,940 | |
| | | | | | | | | |
| Consumer discretionary 5.30% | | | | | | | | |
| General Motors Co. | | | 23,540,000 | | | | 874,746 | |
| Home Depot, Inc. | | | 12,312,500 | | | | 2,888,266 | |
| Other securities | | | | | | | 2,722,028 | |
| | | | | | | | 6,485,040 | |
| | | | | | | | | |
| Consumer staples 6.38% | | | | | | | | |
| Coca-Cola Co. | | | 29,127,000 | | | | 1,585,383 | |
| Costco Wholesale Corp. | | | 3,082,000 | | | | 915,693 | |
| Nestlé SA (ADR) | | | 19,930,700 | | | | 2,135,774 | |
| Other securities | | | | | | | 3,161,805 | |
| | | | | | | | 7,798,655 | |
| | | | | | | | | |
| Health care 14.46% | | | | | | | | |
| AstraZeneca PLC (ADR) | | | 16,202,900 | | | | 794,428 | |
| Cigna Corp. | | | 7,037,000 | | | | 1,255,823 | |
| CVS Health Corp. | | | 11,000,000 | | | | 730,290 | |
| Humana Inc. | | | 6,572,000 | | | | 1,933,483 | |
| Johnson & Johnson | | | 11,734,500 | | | | 1,549,423 | |
| Merck & Co., Inc. | | | 35,893,000 | | | | 3,110,487 | |
| Pfizer Inc. | | | 55,053,600 | | | | 2,112,407 | |
| UnitedHealth Group Inc. | | | 12,222,400 | | | | 3,088,601 | |
| Other securities | | | | | | | 3,109,592 | |
| | | | | | | | 17,684,534 | |
| | | | | | | | | |
| Financials 15.27% | | | | | | | | |
| BlackRock, Inc. | | | 3,418,874 | | | | 1,578,494 | |
| Capital One Financial Corp. | | | 11,808,000 | | | | 1,101,096 | |
| Chubb Ltd. | | | 9,028,830 | | | | 1,376,174 | |
| CME Group Inc., Class A | | | 14,265,189 | | | | 2,935,063 | |
| Intercontinental Exchange, Inc. | | | 8,308,490 | | | | 783,657 | |
| JPMorgan Chase & Co. | | | 19,263,400 | | | | 2,406,384 | |
| Marsh & McLennan Companies, Inc. | | | 21,134,989 | | | | 2,190,008 | |
| PNC Financial Services Group, Inc. | | | 16,862,700 | | | | 2,473,758 | |
| Other securities | | | | | | | 3,837,606 | |
| | | | | | | | 18,682,240 | |
| | | | | | | | | |
| Information technology 17.88% | | | | | | | | |
| ASML Holding NV (New York registered) | | | 4,069,500 | | | | 1,066,087 | |
| Broadcom Inc. | | | 12,805,300 | | | | 3,750,032 | |
| Intel Corp. | | | 61,868,847 | | | | 3,497,446 | |
| Mastercard Inc., Class A | | | 3,265,700 | | | | 903,978 | |
| Microsoft Corp. | | | 50,223,000 | | | | 7,200,472 | |
| Visa Inc., Class A | | | 10,389,700 | | | | 1,858,302 | |
| Other securities | | | | | | | 3,593,440 | |
| | | | | | | | 21,869,757 | |
| Washington Mutual Investors Fund | 5 |
| Common stocks (continued) | | Shares | | | Value
(000) | |
| Communication services 7.07% | | | | | | | | |
| Alphabet Inc., Class A1 | | | 637,000 | | | $ | 801,856 | |
| Alphabet Inc., Class C1 | | | 366,250 | | | | 461,515 | |
| Comcast Corp., Class A | | | 78,866,500 | | | | 3,534,797 | |
| Facebook, Inc., Class A1 | | | 5,395,300 | | | | 1,034,009 | |
| Verizon Communications Inc. | | | 30,860,400 | | | | 1,866,128 | |
| Other securities | | | | | | | 950,294 | |
| | | | | | | | 8,648,599 | |
| | | | | | | | | |
| Utilities 2.84% | | | | | | | | |
| Public Service Enterprise Group Inc. | | | 16,356,527 | | | | 1,035,532 | |
| Sempra Energy | | | 4,689,100 | | | | 677,622 | |
| Other securities | | | | | | | 1,758,720 | |
| | | | | | | | 3,471,874 | |
| | | | | | | | | |
| Real estate 1.15% | | | | | | | | |
| Digital Realty Trust, Inc. REIT | | | 6,562,035 | | | | 833,641 | |
| Other securities | | | | | | | 571,030 | |
| | | | | | | | 1,404,671 | |
| | | | | | | | | |
| Total common stocks (cost: $78,281,750,000) | | | | | | | 116,446,275 | |
| | | | | | | | | |
| Convertible stocks 0.52% | | | | | | | | |
| Information technology 0.26% | | | | | | | | |
| Broadcom Inc., Series A, 8.00% cumulative convertible preferred 2022 | | | 291,000 | | | | 315,159 | |
| | | | | | | | | |
| Other 0.26% | | | | | | | | |
| Other securities | | | | | | | 326,087 | |
| | | | | | | | | |
| Total convertible stocks (cost: $605,060,000) | | | | | | | 641,246 | |
| | | | | | | | | |
| Short-term securities 4.32% | | | | | | | | |
| Money market investments 4.32% | | | | | | | | |
| Capital Group Central Cash Fund 1.92%2 | | | 52,901,404 | | | | 5,290,669 | |
| | | | | | | | | |
| Total short-term securities (cost: $5,289,714,000) | | | | | | | 5,290,669 | |
| Total investment securities 100.04% (cost: $84,176,524,000) | | | | | | | 122,378,190 | |
| Other assets less liabilities (0.04)% | | | | | | | (54,511 | ) |
| | | | | | | | | |
| Net assets 100.00% | | | | | | $ | 122,323,679 | |
| 6 | Washington Mutual Investors Fund |
This summary investment portfolio is designed to streamline the report and help investors better focus on the fund’s principal holdings. See the inside back cover for details on how to obtain a complete schedule of portfolio holdings.
“Other securities” includes all issues that are not disclosed separately in the summary investment portfolio.
| 1 | Security did not produce income during the last 12 months. |
| 2 | Rate represents the seven-day yield at 10/31/2019. |
Key to abbreviation
ADR = American Depositary Receipts
See notes to financial statements.
| Washington Mutual Investors Fund | 7 |
Financial statements
Statement of assets and liabilities
at October 31, 2019 | unaudited
(dollars in thousands) |
| Assets: | | | | | | | | |
| Investment securities in unaffiliated issuers, at value (cost: $84,176,524) | | | | | | $ | 122,378,190 | |
| Cash | | | | | | | 37 | |
| Receivables for: | | | | | | | | |
| Sales of investments | | $ | 140,348 | | | | | |
| Sales of fund’s shares | | | 114,055 | | | | | |
| Dividends | | | 116,013 | | | | 370,416 | |
| | | | | | | | 122,748,643 | |
| Liabilities: | | | | | | | | |
| Payables for: | | | | | | | | |
| Purchases of investments | | | 239,955 | | | | | |
| Repurchases of fund’s shares | | | 124,544 | | | | | |
| Investment advisory services | | | 23,316 | | | | | |
| Services provided by related parties | | | 25,755 | | | | | |
| Board members’ deferred compensation | | | 11,170 | | | | | |
| Other | | | 224 | | | | 424,964 | |
| Net assets at October 31, 2019 | | | | | | $ | 122,323,679 | |
| | | | | | | | | |
| Net assets consist of: | | | | | | | | |
| Capital paid in on shares of beneficial interest | | | | | | $ | 79,419,599 | |
| Total distributable earnings | | | | | | | 42,904,080 | |
| Net assets at October 31, 2019 | | | | | | $ | 122,323,679 | |
See notes to financial statements.
| 8 | Washington Mutual Investors Fund |
(dollars and shares in thousands, except per-share amounts)
Shares of beneficial interest issued and outstanding (no stated par value) —
unlimited shares authorized (2,600,752 total shares outstanding)
| | | Net assets | | | Shares
outstanding | | | Net asset value
per share | |
| Class A | | $ | 60,392,280 | | | | 1,282,980 | | | $ | 47.07 | |
| Class C | | | 1,715,677 | | | | 36,990 | | | | 46.38 | |
| Class T | | | 11 | | | | — | * | | | 47.08 | |
| Class F-1 | | | 2,886,621 | | | | 61,577 | | | | 46.88 | |
| Class F-2 | | | 18,954,759 | | | | 403,009 | | | | 47.03 | |
| Class F-3 | | | 3,978,147 | | | | 84,528 | | | | 47.06 | |
| Class 529-A | | | 2,381,661 | | | | 50,721 | | | | 46.96 | |
| Class 529-C | | | 257,118 | | | | 5,514 | | | | 46.63 | |
| Class 529-E | | | 100,887 | | | | 2,162 | | | | 46.66 | |
| Class 529-T | | | 13 | | | | — | * | | | 47.08 | |
| Class 529-F-1 | | | 205,061 | | | | 4,379 | | | | 46.83 | |
| Class R-1 | | | 80,580 | | | | 1,733 | | | | 46.51 | |
| Class R-2 | | | 703,385 | | | | 15,188 | | | | 46.31 | |
| Class R-2E | | | 101,094 | | | | 2,159 | | | | 46.82 | |
| Class R-3 | | | 1,883,778 | | | | 40,402 | | | | 46.63 | |
| Class R-4 | | | 3,475,013 | | | | 74,256 | | | | 46.80 | |
| Class R-5E | | | 152,159 | | | | 3,237 | | | | 47.01 | |
| Class R-5 | | | 1,364,312 | | | | 28,991 | | | | 47.06 | |
| Class R-6 | | | 23,691,123 | | | | 502,926 | | | | 47.11 | |
| * | Amount less than one thousand. |
See notes to financial statements.
| Washington Mutual Investors Fund | 9 |
Statement of operations
for the six months ended October 31, 2019 | unaudited
(dollars in thousands) |
| Investment income: | | | | | | | | |
| Income: | | | | | | | | |
| Dividends (net of non-U.S. taxes of $8,277) | | $ | 1,426,331 | | | | | |
| Interest | | | 482 | | | $ | 1,426,813 | |
| Fees and expenses*: | | | | | | | | |
| Investment advisory services | | | 136,032 | | | | | |
| Distribution services | | | 102,985 | | | | | |
| Transfer agent services | | | 40,037 | | | | | |
| Administrative services | | | 17,769 | | | | | |
| Reports to shareholders | | | 1,548 | | | | | |
| Registration statement and prospectus | | | 2,032 | | | | | |
| Board members’ compensation | | | 1,373 | | | | | |
| Auditing and legal | | | 267 | | | | | |
| Custodian | | | 935 | | | | | |
| Other | | | 1,002 | | | | 303,980 | |
| Net investment income | | | | | | | 1,122,833 | |
| | | | | | | | | |
| Net realized gain and unrealized depreciation: | | | | | | | | |
| Net realized gain (loss) on: | | | | | | | | |
| Investments in unaffiliated issuers | | | 3,856,787 | | | | | |
| Currency transactions | | | (311 | ) | | | 3,856,476 | |
| Net unrealized depreciation on: | | | | | | | | |
| Investments in unaffiliated issuers | | | (489,281 | ) | | | (489,281 | ) |
| Net realized gain and unrealized depreciation | | | | | | | 3,367,195 | |
| | | | | | | | | |
| Net increase in net assets resulting from operations | | | | | | $ | 4,490,028 | |
| * | Additional information related to class-specific fees and expenses is included in the notes to financial statements. |
See notes to financial statements.
| 10 | Washington Mutual Investors Fund |
| Statements of changes in net assets | |
| | (dollars in thousands) |
| | | Six months ended
October 31, 2019* | | | Year ended
April 30, 2019 | |
| Operations: | | | | | | | | |
| Net investment income | | $ | 1,122,833 | | | $ | 2,159,076 | |
| Net realized gain | | | 3,856,476 | | | | 4,766,969 | |
| Net unrealized (depreciation) appreciation | | | (489,281 | ) | | | 4,839,679 | |
| Net increase in net assets resulting from operations | | | 4,490,028 | | | | 11,765,724 | |
| | | | | | | | | |
| Distributions paid to shareholders | | | (3,336,306 | ) | | | (7,793,515 | ) |
| | | | | | | | | |
| Net capital share transactions | | | 4,074,413 | | | | 11,543,884 | |
| | | | | | | | | |
| Total increase in net assets | | | 5,228,135 | | | | 15,516,093 | |
| | | | | | | | | |
| Net assets: | | | | | | | | |
| Beginning of period | | | 117,095,544 | | | | 101,579,451 | |
| End of period | | $ | 122,323,679 | | | $ | 117,095,544 | |
See notes to financial statements.
| Washington Mutual Investors Fund | 11 |
| Notes to financial statements | unaudited |
1. Organization
Washington Mutual Investors Fund (the “fund”) is registered under the Investment Company Act of 1940 as an open-end, diversified management investment company. The fund’s investment objective is to produce income and to provide an opportunity for growth of principal consistent with sound common stock investing.
The fund has 19 share classes consisting of six retail share classes (Classes A, C, T, F-1, F-2 and F-3), five 529 college savings plan share classes (Classes 529-A, 529-C, 529-E, 529-T and 529-F-1) and eight retirement plan share classes (Classes R-1, R-2, R-2E, R-3, R-4, R-5E, R-5 and R-6). The 529 college savings plan share classes can be used to save for college education. The retirement plan share classes are generally offered only through eligible employer-sponsored retirement plans. The fund’s share classes are described further in the following table:
| Share class | | Initial sales charge | | Contingent deferred sales
charge upon redemption | | Conversion feature |
| Classes A and 529-A | | Up to 5.75% | | None (except 1% for certain redemptions within 18 months of purchase without an initial sales charge) | | None |
| Class C | | None | | 1% for redemptions within one year of purchase | | Class C converts to Class F-1 after 10 years |
| Class 529-C | | None | | 1% for redemptions within one year of purchase | | Class 529-C converts to Class 529-A after 10 years |
| Class 529-E | | None | | None | | None |
| Classes T and 529-T* | | Up to 2.50% | | None | | None |
| Classes F-1, F-2, F-3 and 529-F-1 | | None | | None | | None |
| Classes R-1, R-2, R-2E, R-3, R-4, R-5E, R-5 and R-6 | | None | | None | | None |
| * | Class T and 529-T shares are not available for purchase. |
Holders of all share classes have equal pro rata rights to the assets, dividends and liquidation proceeds of the fund. Each share class has identical voting rights, except for the exclusive right to vote on matters affecting only its class. Share classes have different fees and expenses (“class-specific fees and expenses”), primarily due to different arrangements for distribution, transfer agent and administrative services. Differences in class-specific fees and expenses will result in differences in net investment income and, therefore, the payment of different per-share dividends by each share class.
| 12 | Washington Mutual Investors Fund |
2. Significant accounting policies
The fund is an investment company that applies the accounting and reporting guidance issued in Topic 946 by the U.S. Financial Accounting Standards Board. The fund’s financial statements have been prepared to comply with U.S. generally accepted accounting principles (“U.S. GAAP”). These principles require the fund’s investment adviser to make estimates and assumptions that affect reported amounts and disclosures. Actual results could differ from those estimates. Subsequent events, if any, have been evaluated through the date of issuance in the preparation of the financial statements. The fund follows the significant accounting policies described in this section, as well as the valuation policies described in the next section on valuation.
Security transactions and related investment income — Security transactions are recorded by the fund as of the date the trades are executed with brokers. Realized gains and losses from security transactions are determined based on the specific identified cost of the securities. In the event a security is purchased with a delayed payment date, the fund will segregate liquid assets sufficient to meet its payment obligations. Dividend income is recognized on the ex-dividend date and interest income is recognized on an accrual basis. Market discounts, premiums and original issue discounts on fixed-income securities are amortized daily over the expected life of the security.
Class allocations — Income, fees and expenses (other than class-specific fees and expenses) and realized and unrealized gains and losses are allocated daily among the various share classes based on their relative net assets. Class-specific fees and expenses, such as distribution, transfer agent and administrative services, are charged directly to the respective share class.
Distributions paid to shareholders — Income dividends and capital gain distributions are recorded on the ex-dividend date.
3. Valuation
Capital Research and Management Company (“CRMC”), the fund’s investment adviser, values the fund’s investments at fair value as defined by U.S. GAAP. The net asset value of each share class of the fund is generally determined as of approximately 4:00 p.m. New York time each day the New York Stock Exchange is open.
Methods and inputs — The fund’s investment adviser uses the following methods and inputs to establish the fair value of the fund’s assets and liabilities. Use of particular methods and inputs may vary over time based on availability and relevance as market and economic conditions evolve.
Equity securities are generally valued at the official closing price of, or the last reported sale price on, the exchange or market on which such securities are traded, as of the close of business on the day the securities are being valued or, lacking any sales, at the last available bid price. Prices for each security are taken from the principal exchange or market on which the security trades.
| Washington Mutual Investors Fund | 13 |
Fixed income securities, including short-term securities, are generally valued at prices obtained from one or more pricing vendors. Vendors value such securities based on one or more of the following inputs: benchmark yields, transactions, bids, offers, quotations from dealers and trading systems, new issues, spreads, interest rate volatilities, and other relationships observed in the markets among comparable securities; and proprietary pricing models such as yield measures calculated using factors such as cash flows, financial or collateral performance and other reference data.
When the fund’s investment adviser deems it appropriate to do so (such as when vendor prices are unavailable or deemed to be not representative), fixed-income securities will be valued in good faith at the mean quoted bid and ask prices that are reasonably and timely available (or bid prices, if ask prices are not available) or at prices for securities of comparable maturity, quality and type.
Securities with both fixed-income and equity characteristics, or equity securities traded principally among fixed-income dealers, are generally valued in the manner described for either equity or fixed-income securities, depending on which method is deemed most appropriate by the fund’s investment adviser. The Capital Group Central Cash Fund (“CCF”), a fund within the Capital Group Central Fund Series (“Central Funds”), is valued based upon a floating net asset value, which fluctuates with changes in the value of CCF’s portfolio securities. The underlying securities are valued based on the policies and procedures in CCF’s statement of additional information.
Securities and other assets for which representative market quotations are not readily available or are considered unreliable by the fund’s investment adviser are fair valued as determined in good faith under fair valuation guidelines adopted by authority of the fund’s board of trustees as further described. The investment adviser follows fair valuation guidelines, consistent with U.S. Securities and Exchange Commission rules and guidance, to consider relevant principles and factors when making fair value determinations. The investment adviser considers relevant indications of value that are reasonably and timely available to it in determining the fair value to be assigned to a particular security, such as the type and cost of the security; contractual or legal restrictions on resale of the security; relevant financial or business developments of the issuer; actively traded similar or related securities; conversion or exchange rights on the security; related corporate actions; significant events occurring after the close of trading in the security; and changes in overall market conditions. In addition, the closing prices of equity securities that trade in markets outside U.S. time zones may be adjusted to reflect significant events that occur after the close of local trading but before the net asset value of each share class of the fund is determined. Fair valuations and valuations of investments that are not actively trading involve judgment and may differ materially from valuations that would have been used had greater market activity occurred.
| 14 | Washington Mutual Investors Fund |
Processes and structure — The fund’s board of trustees has delegated authority to the fund’s investment adviser to make fair value determinations, subject to board oversight. The investment adviser has established a Joint Fair Valuation Committee (the “Fair Valuation Committee”) to administer, implement and oversee the fair valuation process, and to make fair value decisions. The Fair Valuation Committee regularly reviews its own fair value decisions, as well as decisions made under its standing instructions to the investment adviser’s valuation teams. The Fair Valuation Committee reviews changes in fair value measurements from period to period and may, as deemed appropriate, update the fair valuation guidelines to better reflect the results of back testing and address new or evolving issues. The Fair Valuation Committee reports any changes to the fair valuation guidelines to the board of trustees. The fund’s board and audit committee also regularly review reports that describe fair value determinations and methods.
The fund’s investment adviser has also established a Fixed-Income Pricing Review Group to administer and oversee the fixed-income valuation process, including the use of fixed-income pricing vendors. This group regularly reviews pricing vendor information and market data. Pricing decisions, processes and controls over security valuation are also subject to additional internal reviews, including an annual control self-evaluation program facilitated by the investment adviser’s compliance group.
Classifications — The fund’s investment adviser classifies the fund’s assets and liabilities into three levels based on the inputs used to value the assets or liabilities. Level 1 values are based on quoted prices in active markets for identical securities. Level 2 values are based on significant observable market inputs, such as quoted prices for similar securities and quoted prices in inactive markets. Certain securities trading outside the U.S. may transfer between Level 1 and Level 2 due to valuation adjustments resulting from significant market movements following the close of local trading. Level 3 values are based on significant unobservable inputs that reflect the investment adviser’s determination of assumptions that market participants might reasonably use in valuing the securities. The valuation levels are not necessarily an indication of the risk or liquidity associated with the underlying investment. For example, U.S. government securities are reflected as Level 2 because the inputs used to determine fair value may not always be quoted prices in an active market. At October 31, 2019, all of the fund’s investments were classified as Level 1.
| Washington Mutual Investors Fund | 15 |
4. Risk factors
Investing in the fund may involve certain risks including, but not limited to, those described below.
Market conditions — The prices of, and the income generated by, the common stocks and other securities held by the fund may decline – sometimes rapidly or unpredictably – due to various factors, including events or conditions affecting the general economy or particular industries; overall market changes; local, regional or global political, social or economic instability; governmental, governmental agency or central bank responses to economic conditions; and currency exchange rate, interest rate and commodity price fluctuations.
Issuer risks — The prices of, and the income generated by, securities held by the fund may decline in response to various factors directly related to the issuers of such securities, including reduced demand for an issuer’s goods or services, poor management performance, major litigation related to the issuer, changes in government regulations affecting the issuer or its competitive environment and strategic initiatives such as mergers, acquisitions or dispositions and the market response to any such initiatives.
Investing in income-oriented stocks — The value of the fund’s securities and income provided by the fund may be reduced by changes in the dividend policies of, and the capital resources available for dividend payments at, the companies in which the fund invests.
Investing in growth-oriented stocks — Growth-oriented common stocks and other equity-type securities (such as preferred stocks, convertible preferred stocks and convertible bonds) may involve larger price swings and greater potential for loss than other types of investments.
Management — The investment adviser to the fund actively manages the fund’s investments. Consequently, the fund is subject to the risk that the methods and analyses, including models, tools and data, employed by the investment adviser in this process may be flawed or incorrect and may not produce the desired results. This could cause the fund to lose value or its investment results to lag relevant benchmarks or other funds with similar objectives.
5. Taxation and distributions
Federal income taxation — The fund complies with the requirements under Subchapter M of the Internal Revenue Code applicable to mutual funds and intends to distribute substantially all of its net taxable income and net capital gains each year. The fund is not subject to income taxes to the extent such distributions are made. Therefore, no federal income tax provision is required.
| 16 | Washington Mutual Investors Fund |
As of and during the period ended October 31, 2019, the fund did not have a liability for any unrecognized tax benefits. The fund recognizes interest and penalties, if any, related to unrecognized tax benefits as income tax expense in the statement of operations. During the period, the fund did not incur any significant interest or penalties.
The fund’s tax returns are not subject to examination by federal, state and, if applicable, non-U.S. tax authorities after the expiration of each jurisdiction’s statute of limitations, which is generally three years after the date of filing but can be extended in certain jurisdictions.
Non-U.S. taxation — Dividend and interest income are recorded net of non-U.S. taxes paid. The fund may file withholding tax reclaims in certain jurisdictions to recover a portion of amounts previously withheld. As a result of rulings from European courts, the fund filed for additional reclaims related to prior years. These reclaims are recorded when the amount is known and there are no significant uncertainties on collectability. Gains realized by the fund on the sale of securities in certain countries, if any, may be subject to non-U.S. taxes. If applicable, the fund records an estimated deferred tax liability based on unrealized gains to provide for potential non-U.S. taxes payable upon the sale of these securities.
Distributions — Distributions paid to shareholders are based on net investment income and net realized gains determined on a tax basis, which may differ from net investment income and net realized gains for financial reporting purposes. These differences are due primarily to different treatment for items such as currency gains and losses; short-term capital gains and losses; capital losses related to sales of certain securities within 30 days of purchase; cost of investments sold and income on certain investments. The fiscal year in which amounts are distributed may differ from the year in which the net investment income and net realized gains are recorded by the fund for financial reporting purposes.
The components of distributable earnings on a tax basis are reported as of the fund’s most recent year-end. As of April 30, 2019, the components of distributable earnings on a tax basis were as follows (dollars in thousands):
| Undistributed ordinary income | | $ | 290,817 | |
| Undistributed long-term capital gains | | | 2,261,010 | |
As of October 31, 2019, the tax basis unrealized appreciation (depreciation) and cost of investments were as follows (dollars in thousands):
| Gross unrealized appreciation on investments | | $ | 41,516,172 | |
| Gross unrealized depreciation on investments | | | (2,832,774 | ) |
| Net unrealized appreciation on investments | | | 38,683,398 | |
| Cost of investments | | | 83,694,792 | |
| Washington Mutual Investors Fund | 17 |
Distributions paid were characterized for tax purposes as follows (dollars in thousands):
| | | Six months ended October 31, 2019 | | | Year ended April 30, 2019 | |
| Share class | | Ordinary
income | | | Long-term
capital gains | | | Total
distributions
paid | | | Ordinary
income | | | Long-term
capital gains | | | Total
distributions
paid | |
| Class A | | $ | 516,778 | | | $ | 1,137,295 | | | $ | 1,654,073 | | | $ | 1,077,377 | | | $ | 3,056,582 | | | $ | 4,133,959 | |
| Class C | | | 8,763 | | | | 33,685 | | | | 42,448 | | | | 19,010 | | | | 90,004 | | | | 109,014 | |
| Class T | | | — | * | | | — | * | | | — | * | | | — | * | | | 1 | | | | 1 | |
| Class F-1 | | | 23,818 | | | | 53,658 | | | | 77,476 | | | | 49,625 | | | | 149,257 | | | | 198,882 | |
| Class F-2 | | | 171,718 | | | | 331,384 | | | | 503,102 | | | | 299,379 | | | | 726,357 | | | | 1,025,736 | |
| Class F-3 | | | 37,904 | | | | 69,851 | | | | 107,755 | | | | 60,260 | | | | 137,940 | | | | 198,200 | |
| Class 529-A | | | 19,945 | | | | 46,032 | | | | 65,977 | | | | 41,752 | | | | 124,202 | | | | 165,954 | |
| Class 529-C | | | 1,247 | | | | 5,172 | | | | 6,419 | | | | 3,046 | | | | 15,669 | | | | 18,715 | |
| Class 529-E | | | 744 | | | | 2,008 | | | | 2,752 | | | | 1,649 | | | | 5,667 | | | | 7,316 | |
| Class 529-T | | | — | * | | | — | * | | | — | * | | | — | * | | | 1 | | | | 1 | |
| Class 529-F-1 | | | 1,832 | | | | 3,624 | | | | 5,456 | | | | 3,418 | | | | 8,701 | | | | 12,119 | |
| Class R-1 | | | 406 | | | | 1,693 | | | | 2,099 | | | | 961 | | | | 4,852 | | | | 5,813 | |
| Class R-2 | | | 3,479 | | | | 13,810 | | | | 17,289 | | | | 7,897 | | | | 39,016 | | | | 46,913 | |
| Class R-2E | | | 607 | | | | 1,844 | | | | 2,451 | | | | 1,085 | | | | 3,909 | | | | 4,994 | |
| Class R-3 | | | 13,457 | | | | 37,580 | | | | 51,037 | | | | 29,854 | | | | 106,193 | | | | 136,047 | |
| Class R-4 | | | 29,466 | | | | 67,250 | | | | 96,716 | | | | 65,523 | | | | 194,600 | | | | 260,123 | |
| Class R-5E | | | 1,252 | | | | 2,398 | | | | 3,650 | | | | 1,218 | | | | 2,267 | | | | 3,485 | |
| Class R-5 | | | 13,604 | | | | 26,552 | | | | 40,156 | | | | 29,335 | | | | 76,367 | | | | 105,702 | |
| Class R-6 | | | 230,186 | | | | 427,264 | | | | 657,450 | | | | 404,779 | | | | 955,762 | | | | 1,360,541 | |
| Total | | $ | 1,075,206 | | | $ | 2,261,100 | | | $ | 3,336,306 | | | $ | 2,096,168 | | | $ | 5,697,347 | | | $ | 7,793,515 | |
| * | Amount less than one thousand. |
6. Fees and transactions with related parties
CRMC, the fund’s investment adviser, is the parent company of American Funds Distributors®, Inc. (“AFD”), the principal underwriter of the fund’s shares, and American Funds Service Company® (“AFS”), the fund’s transfer agent. CRMC, AFD and AFS are considered related parties to the fund.
Investment advisory services — The fund has an investment advisory and service agreement with CRMC that provides for monthly fees accrued daily. These fees are based on a series of decreasing annual rates beginning with 0.342% on the first $3 billion of daily net assets and decreasing to 0.212% on such assets in excess of $116 billion. For the six months ended October 31, 2019, the investment advisory services fee was $136,032,000, which was equivalent to an annualized rate of 0.229% of average daily net assets.
| 18 | Washington Mutual Investors Fund |
Class-specific fees and expenses — Expenses that are specific to individual share classes are accrued directly to the respective share class. The principal class-specific fees and expenses are further described below:
Distribution services — The fund has plans of distribution for all share classes, except Class F-2, F-3, R-5E, R-5 and R-6 shares. Under the plans, the board of trustees approves certain categories of expenses that are used to finance activities primarily intended to sell fund shares and service existing accounts. The plans provide for payments, based on an annualized percentage of average daily net assets, ranging from 0.25% to 1.00% as noted in this section. In some cases, the board of trustees has limited the amounts that may be paid to less than the maximum allowed by the plans. All share classes with a plan may use up to 0.25% of average daily net assets to pay service fees, or to compensate AFD for paying service fees, to firms that have entered into agreements with AFD to provide certain shareholder services. The remaining amounts available to be paid under each plan are paid to dealers to compensate them for their sales activities.
| Share class | | Currently approved limits | | Plan limits |
| Class A | | | 0.25 | % | | | 0.25 | % |
| Class 529-A | | | 0.25 | | | | 0.50 | |
| Classes C, 529-C and R-1 | | | 1.00 | | | | 1.00 | |
| Class R-2 | | | 0.75 | | | | 1.00 | |
| Class R-2E | | | 0.60 | | | | 0.85 | |
| Classes 529-E and R-3 | | | 0.50 | | | | 0.75 | |
| Classes T, F-1, 529-T, 529-F-1 and R-4 | | | 0.25 | | | | 0.50 | |
For Class A and 529-A shares, distribution-related expenses include the reimbursement of dealer and wholesaler commissions paid by AFD for certain shares sold without a sales charge. These share classes reimburse AFD for amounts billed within the prior 15 months but only to the extent that the overall annual expense limits are not exceeded. As of October 31, 2019, there were no unreimbursed expenses subject to reimbursement for Class A or 529-A shares.
Transfer agent services — The fund has a shareholder services agreement with AFS under which the fund compensates AFS for providing transfer agent services to each of the fund’s share classes. These services include recordkeeping, shareholder communications and transaction processing. In addition, the fund reimburses AFS for amounts paid to third parties for performing transfer agent services on behalf of fund shareholders.
| Washington Mutual Investors Fund | 19 |
Administrative services — The fund has an administrative services agreement with CRMC under which the fund compensates CRMC for providing administrative services to all share classes. Administrative services are provided by CRMC and its affiliates to help assist third parties providing non-distribution services to fund shareholders. These services include providing in depth information on the fund and market developments that impact fund investments. Administrative services also include, but are not limited to, coordinating, monitoring and overseeing third parties that provide services to fund shareholders. The agreement provides the fund the ability to charge an administrative services fee at the annual rate of 0.05% of the daily net assets attributable to each share class of the fund. Prior to July 1, 2019, Class A shares paid CRMC an administrative services fee at the annual rate of 0.01% of daily net assets and all other share classes paid a fee at the annual rate of 0.05% of their respective daily net assets. The fund’s board of trustees authorized the fund to pay CRMC effective July 1, 2019, an administrative services fee at the annual rate of 0.03% of the average daily net assets attributable to each share class of the fund (which could increase as noted above) for CRMC’s provision of administrative services.
529 plan services — Each 529 share class is subject to service fees to compensate the Virginia College Savings Plan (“Virginia529”) for its oversight and administration of the CollegeAmerica 529 college savings plan. The fee is based on the combined net assets invested in Class 529 and ABLE shares of the American Funds. Class ABLE shares are offered on other American Funds by Virginia529 through ABLEAmerica®, a tax-advantaged savings program for individuals with disabilities. The quarterly fee is based on a series of decreasing annual rates beginning with 0.10% on the first $20 billion of the combined net assets invested in the American Funds and decreasing to 0.03% on such assets in excess of $100 billion. The fee for any given calendar quarter is accrued and calculated on the basis of the average net assets of Class 529 and ABLE shares of the American Funds for the last month of the prior calendar quarter. The fee is included in other expenses in the fund’s statement of operations. Virginia529 is not considered a related party to the fund.
| 20 | Washington Mutual Investors Fund |
For the six months ended October 31, 2019, class-specific expenses under the agreements were as follows (dollars in thousands):
| Share class | | Distribution
services | | Transfer agent
services | | Administrative
services | | 529 plan
services | |
| Class A | | $ 74,158 | | $21,360 | | $ 6,959 | | Not applicable | |
| Class C | | 8,557 | | 607 | | 316 | | Not applicable | |
| Class T | | — | | — | * | — | * | Not applicable | |
| Class F-1 | | 3,523 | | 1,743 | | 517 | | Not applicable | |
| Class F-2 | | Not applicable | | 10,338 | | 3,226 | | Not applicable | |
| Class F-3 | | Not applicable | | 89 | | 677 | | Not applicable | |
| Class 529-A | | 2,756 | | 734 | | 434 | | $775 | |
| Class 529-C | | 1,261 | | 82 | | 48 | | 86 | |
| Class 529-E | | 251 | | 18 | | 19 | | 33 | |
| Class 529-T | | — | | — | * | — | * | — | * |
| Class 529-F-1 | | — | | 58 | | 35 | | 62 | |
| Class R-1 | | 422 | | 43 | | 15 | | Not applicable | |
| Class R-2 | | 2,632 | | 1,194 | | 128 | | Not applicable | |
| Class R-2E | | 292 | | 96 | | 18 | | Not applicable | |
| Class R-3 | | 4,781 | | 1,432 | | 351 | | Not applicable | |
| Class R-4 | | 4,352 | | 1,739 | | 637 | | Not applicable | |
| Class R-5E | | Not applicable | | 98 | | 24 | | Not applicable | |
| Class R-5 | | Not applicable | | 362 | | 251 | | Not applicable | |
| Class R-6 | | Not applicable | | 44 | | 4,114 | | Not applicable | |
| Total class-specific expenses | | $102,985 | | $40,037 | | $17,769 | | $956 | |
| * | Amount less than one thousand. |
| Washington Mutual Investors Fund | 21 |
Board members’ deferred compensation — Board members who are unaffiliated with CRMC may elect to defer the cash payment of part or all of their compensation. These deferred amounts, which remain as liabilities of the fund, are treated as if invested in shares of the fund or other American Funds. These amounts represent general, unsecured liabilities of the fund and vary according to the total returns of the selected funds. Board members’ compensation of $1,373,000 in the fund’s statement of operations reflects $1,028,000 in current fees (either paid in cash or deferred) and a net increase of $345,000 in the value of the deferred amounts.
Affiliated officers and trustees — Officers and certain trustees of the fund are or may be considered to be affiliated with CRMC, AFD and AFS. No affiliated officers or trustees received any compensation directly from the fund.
Investment in CCF — The fund holds shares of CCF, an institutional prime money market fund managed by CRMC. CCF invests in high-quality, short-term money market instruments. CCF is used as the primary investment vehicle for the fund’s short-term investments. CCF shares are only available for purchase by CRMC, its affiliates, and other funds managed by CRMC and are not available to the public. CRMC does not receive an investment advisory services fee from CCF.
Security transactions with related funds — The fund may purchase securities from, or sell securities to, other funds managed by CRMC (or funds managed by certain affiliates of CRMC) under procedures adopted by the fund’s board of trustees. The funds involved in such transactions are considered related by virtue of having a common investment adviser (or affiliated investment advisers), common trustees and/or common officers. When such transactions occur, each transaction is executed at the current market price of the security and no brokerage commissions or fees are paid in accordance with Rule 17a-7 of the 1940 Act.
Interfund lending — Pursuant to an exemptive order issued by the SEC, the fund, along with other CRMC-managed funds (or funds managed by certain affiliates of CRMC), may participate in an interfund lending program. The program provides an alternate credit facility that permits the funds to lend or borrow cash for temporary purposes directly to or from one another, subject to the conditions of the exemptive order. The fund did not lend or borrow cash through the interfund lending program at any time during the six months ended October 31, 2019.
| 22 | Washington Mutual Investors Fund |
7. Capital share transactions
Capital share transactions in the fund were as follows (dollars and shares in thousands):
| | | Sales* | | | Reinvestments of
distributions | | | Repurchases* | | | Net increase
(decrease) | |
| Share class | | Amount | | | Shares | | | Amount | | | Shares | | | Amount | | | Shares | | | Amount | | | Shares | |
| | | | | | | | | | | | | | | | | | | | | | | | | |
| Six months ended October 31, 2019 | | | | | | | | | | | | | | | | | | |
| | | | | | | | | | | | | | | | | | | |
| Class A | | $ | 1,839,592 | | | | 40,089 | | | $ | 1,620,059 | | | | 35,797 | | | $ | (3,065,340 | ) | | | (66,748 | ) | | $ | 394,311 | | | | 9,138 | |
| Class C | | | 125,349 | | | | 2,771 | | | | 42,039 | | | | 944 | | | | (207,357 | ) | | | (4,585 | ) | | | (39,969 | ) | | | (870 | ) |
| Class T | | | — | | | | — | | | | — | | | | — | | | | — | | | | — | | | | — | | | | — | |
| Class F-1 | | | 276,506 | | | | 6,008 | | | | 75,885 | | | | 1,684 | | | | (329,386 | ) | | | (7,198 | ) | | | 23,005 | | | | 494 | |
| Class F-2 | | | 3,001,276 | | | | 65,400 | | | | 489,937 | | | | 10,827 | | | | (1,614,321 | ) | | | (35,198 | ) | | | 1,876,892 | | | | 41,029 | |
| Class F-3 | | | 603,500 | | | | 13,154 | | | | 106,325 | | | | 2,348 | | | | (297,119 | ) | | | (6,468 | ) | | | 412,706 | | | | 9,034 | |
| Class 529-A | | | 113,715 | | | | 2,481 | | | | 65,954 | | | | 1,461 | | | | (218,282 | ) | | | (4,764 | ) | | | (38,613 | ) | | | (822 | ) |
| Class 529-C | | | 16,344 | | | | 359 | | | | 6,414 | | | | 143 | | | | (41,047 | ) | | | (902 | ) | | | (18,289 | ) | | | (400 | ) |
| Class 529-E | | | 3,734 | | | | 82 | | | | 2,751 | | | | 61 | | | | (11,027 | ) | | | (242 | ) | | | (4,542 | ) | | | (99 | ) |
| Class 529-T | | | — | | | | — | | | | — | † | | | — | † | | | — | | | | — | | | | — | † | | | — | † |
| Class 529-F-1 | | | 26,671 | | | | 583 | | | | 5,453 | | | | 121 | | | | (17,199 | ) | | | (376 | ) | | | 14,925 | | | | 328 | |
| Class R-1 | | | 4,981 | | | | 110 | | | | 2,088 | | | | 47 | | | | (14,651 | ) | | | (322 | ) | | | (7,582 | ) | | | (165 | ) |
| Class R-2 | | | 61,646 | | | | 1,362 | | | | 17,264 | | | | 388 | | | | (93,604 | ) | | | (2,070 | ) | | | (14,694 | ) | | | (320 | ) |
| Class R-2E | | | 13,690 | | | | 299 | | | | 2,451 | | | | 54 | | | | (10,348 | ) | | | (226 | ) | | | 5,793 | | | | 127 | |
| Class R-3 | | | 128,662 | | | | 2,826 | | | | 50,992 | | | | 1,138 | | | | (278,867 | ) | | | (6,128 | ) | | | (99,213 | ) | | | (2,164 | ) |
| Class R-4 | | | 211,235 | | | | 4,627 | | | | 96,692 | | | | 2,149 | | | | (404,009 | ) | | | (8,848 | ) | | | (96,082 | ) | | | (2,072 | ) |
| Class R-5E | | | 38,977 | | | | 851 | | | | 3,649 | | | | 81 | | | | (11,984 | ) | | | (261 | ) | | | 30,642 | | | | 671 | |
| Class R-5 | | | 91,871 | | | | 2,004 | | | | 40,111 | | | | 886 | | | | (157,392 | ) | | | (3,423 | ) | | | (25,410 | ) | | | (533 | ) |
| Class R-6 | | | 2,012,617 | | | | 44,002 | | | | 657,131 | | | | 14,500 | | | | (1,009,215 | ) | | | (21,934 | ) | | | 1,660,533 | | | | 36,568 | |
| Total net increase (decrease) | | $ | 8,570,366 | | | | 187,008 | | | $ | 3,285,195 | | | | 72,629 | | | $ | (7,781,148 | ) | | | (169,693 | ) | | $ | 4,074,413 | | | | 89,944 | |
See end of table for footnotes.
| Washington Mutual Investors Fund | 23 |
| | | Sales* | | | Reinvestments of
distributions | | | Repurchases* | | | Net increase
(decrease) | |
| Share class | | Amount | | | Shares | | | Amount | | | Shares | | | Amount | | | Shares | | | Amount | | | Shares | |
| | | | | | | | | | | | | | | | | | | | | | | | | |
| Year ended April 30, 2019 | | | | | | | | | | | | | | | | |
| | | | | | | | | | | | | | | | | |
| Class A | | $ | 4,032,396 | | | | 90,270 | | | $ | 4,047,842 | | | | 93,861 | | | $ | (6,649,161 | ) | | | (148,577 | ) | | $ | 1,431,077 | | | | 35,554 | |
| Class C | | | 364,338 | | | | 8,248 | | | | 108,003 | | | | 2,546 | | | | (393,435 | ) | | | (8,897 | ) | | | 78,906 | | | | 1,897 | |
| Class T | | | — | | | | — | | | | — | | | | — | | | | — | | | | — | | | | — | | | | — | |
| Class F-1 | | | 606,776 | | | | 13,532 | | | | 194,973 | | | | 4,536 | | | | (826,559 | ) | | | (18,435 | ) | | | (24,810 | ) | | | (367 | ) |
| Class F-2 | | | 6,553,057 | | | | 146,216 | | | | 1,001,445 | | | | 23,332 | | | | (3,116,691 | ) | | | (70,055 | ) | | | 4,437,811 | | | | 99,493 | |
| Class F-3 | | | 1,579,277 | | | | 35,211 | | | | 193,774 | | | | 4,511 | | | | (583,068 | ) | | | (13,095 | ) | | | 1,189,983 | | | | 26,627 | |
| Class 529-A | | | 246,808 | | | | 5,507 | | | | 165,881 | | | | 3,855 | | | | (362,196 | ) | | | (8,093 | ) | | | 50,493 | | | | 1,269 | |
| Class 529-C | | | 35,013 | | | | 786 | | | | 18,710 | | | | 438 | | | | (87,549 | ) | | | (1,959 | ) | | | (33,826 | ) | | | (735 | ) |
| Class 529-E | | | 10,597 | | | | 241 | | | | 7,313 | | | | 171 | | | | (20,211 | ) | | | (455 | ) | | | (2,301 | ) | | | (43 | ) |
| Class 529-T | | | — | | | | — | | | | 1 | | | | — | † | | | — | | | | — | | | | 1 | | | | — | † |
| Class 529-F-1 | | | 55,035 | | | | 1,232 | | | | 12,115 | | | | 283 | | | | (30,958 | ) | | | (692 | ) | | | 36,192 | | | | 823 | |
| Class R-1 | | | 11,325 | | | | 253 | | | | 5,787 | | | | 136 | | | | (23,850 | ) | | | (535 | ) | | | (6,738 | ) | | | (146 | ) |
| Class R-2 | | | 148,009 | | | | 3,347 | | | | 46,848 | | | | 1,104 | | | | (217,516 | ) | | | (4,934 | ) | | | (22,659 | ) | | | (483 | ) |
| Class R-2E | | | 42,283 | | | | 945 | | | | 4,994 | | | | 117 | | | | (18,002 | ) | | | (407 | ) | | | 29,275 | | | | 655 | |
| Class R-3 | | | 402,952 | | | | 9,107 | | | | 135,978 | | | | 3,181 | | | | (600,731 | ) | | | (13,518 | ) | | | (61,801 | ) | | | (1,230 | ) |
| Class R-4 | | | 1,270,832 | | | | 28,325 | | | | 260,080 | | | | 6,062 | | | | (1,037,243 | ) | | | (23,666 | ) | | | 493,669 | | | | 10,721 | |
| Class R-5E | | | 123,963 | | | | 2,761 | | | | 3,484 | | | | 84 | | | | (24,296 | ) | | | (551 | ) | | | 103,151 | | | | 2,294 | |
| Class R-5 | | | 297,611 | | | | 6,663 | | | | 105,355 | | | | 2,437 | | | | (1,151,100 | ) | | | (25,491 | ) | | | (748,134 | ) | | | (16,391 | ) |
| Class R-6 | | | 4,979,419 | | | | 112,199 | | | | 1,359,606 | | | | 31,570 | | | | (1,745,430 | ) | | | (38,834 | ) | | | 4,593,595 | | | | 104,935 | |
| Total net increase (decrease) | | $ | 20,759,691 | | | | 464,843 | | | $ | 7,672,189 | | | | 178,224 | | | $ | (16,887,996 | ) | | | (378,194 | ) | | $ | 11,543,884 | | | | 264,873 | |
| * | Includes exchanges between share classes of the fund. |
| † | Amount less than one thousand. |
| 24 | Washington Mutual Investors Fund |
8. Investment transactions
The fund made purchases and sales of investment securities, excluding short-term securities and U.S. government obligations, if any, of $14,037,464,000 and $12,340,786,000, respectively, during the six months ended October 31, 2019.
| Washington Mutual Investors Fund | 25 |
Financial highlights
| | | | | | Income from investment operations1 | |
| Period ended | | Net asset
value,
beginning
of period | | | Net
investment
income | | | Net gains (losses)
on securities (both
realized and
unrealized) | | | Total from
investment
operations | |
| Class A: | | | | | | | | | | | | | | | | |
| 10/31/20194,5 | | $ | 46.68 | | | $ | .42 | | | $ | 1.28 | | | $ | 1.70 | |
| 4/30/2019 | | | 45.27 | | | | .88 | | | | 3.86 | | | | 4.74 | |
| 4/30/2018 | | | 42.89 | | | | .88 | | | | 4.89 | | | | 5.77 | |
| 4/30/2017 | | | 39.38 | | | | .80 | | | | 5.33 | | | | 6.13 | |
| 4/30/2016 | | | 41.23 | | | | .80 | | | | (.24 | ) | | | .56 | |
| 4/30/2015 | | | 40.40 | | | | .83 | | | | 2.89 | | | | 3.72 | |
| Class C: | | | | | | | | | | | | | | | | |
| 10/31/20194,5 | | | 46.01 | | | | .24 | | | | 1.26 | | | | 1.50 | |
| 4/30/2019 | | | 44.66 | | | | .52 | | | | 3.81 | | | | 4.33 | |
| 4/30/2018 | | | 42.36 | | | | .52 | | | | 4.81 | | | | 5.33 | |
| 4/30/2017 | | | 38.92 | | | | .47 | | | | 5.27 | | | | 5.74 | |
| 4/30/2016 | | | 40.77 | | | | .48 | | | | (.24 | ) | | | .24 | |
| 4/30/2015 | | | 39.99 | | | | .50 | | | | 2.83 | | | | 3.33 | |
| Class T: | | | | | | | | | | | | | | | | |
| 10/31/20194,5 | | | 46.68 | | | | .48 | | | | 1.28 | | | | 1.76 | |
| 4/30/2019 | | | 45.27 | | | | .98 | | | | 3.86 | | | | 4.84 | |
| 4/30/2018 | | | 42.89 | | | | .97 | | | | 4.89 | | | | 5.86 | |
| 4/30/20174,10 | | | 42.53 | | | | .01 | | | | .35 | | | | .36 | |
| Class F-1: | | | | | | | | | | | | | | | | |
| 10/31/20194,5 | | | 46.49 | | | | .40 | | | | 1.28 | | | | 1.68 | |
| 4/30/2019 | | | 45.10 | | | | .84 | | | | 3.84 | | | | 4.68 | |
| 4/30/2018 | | | 42.74 | | | | .84 | | | | 4.87 | | | | 5.71 | |
| 4/30/2017 | | | 39.25 | | | | .76 | | | | 5.32 | | | | 6.08 | |
| 4/30/2016 | | | 41.10 | | | | .76 | | | | (.23 | ) | | | .53 | |
| 4/30/2015 | | | 40.28 | | | | .81 | | | | 2.85 | | | | 3.66 | |
| Class F-2: | | | | | | | | | | | | | | | | |
| 10/31/20194,5 | | | 46.64 | | | | .46 | | | | 1.28 | | | | 1.74 | |
| 4/30/2019 | | | 45.24 | | | | .96 | | | | 3.86 | | | | 4.82 | |
| 4/30/2018 | | | 42.86 | | | | .96 | | | | 4.89 | | | | 5.85 | |
| 4/30/2017 | | | 39.36 | | | | .87 | | | | 5.33 | | | | 6.20 | |
| 4/30/2016 | | | 41.21 | | | | .86 | | | | (.23 | ) | | | .63 | |
| 4/30/2015 | | | 40.39 | | | | .89 | | | | 2.90 | | | | 3.79 | |
| Class F-3: | | | | | | | | | | | | | | | | |
| 10/31/20194,5 | | | 46.66 | | | | .49 | | | | 1.28 | | | | 1.77 | |
| 4/30/2019 | | | 45.26 | | | | 1.00 | | | | 3.86 | | | | 4.86 | |
| 4/30/2018 | | | 42.88 | | �� | | .94 | | | | 4.96 | | | | 5.90 | |
| 4/30/20174,11 | | | 41.86 | | | | .15 | | | | 1.10 | | | | 1.25 | |
| 26 | Washington Mutual Investors Fund |
| Dividends and distributions | | | | | | | | | | | | | | | | |
Dividends
(from net
investment
income) | | | Distributions
(from capital
gains) | | | Total
dividends
and
distributions | | | Net asset
value, end
of period | | | Total
return2 | | | Net assets,
end of period
(in millions) | | | Ratio of
expenses
to average
net assets3 | | | Ratio of net
income
to average
net assets | |
| | | | | | | | | | | | | | | | | | | | | | | | | | | | | | | |
| $ | (.41 | ) | | $ | (.90 | ) | | $ | (1.31 | ) | | $ | 47.07 | | | | 3.74 | %6 | | $ | 60,392 | | | | .58 | %7 | | | 1.82 | %7 |
| | (.86 | ) | | | (2.47 | ) | | | (3.33 | ) | | | 46.68 | | | | 11.26 | | | | 59,459 | | | | .57 | | | | 1.96 | |
| | (.86 | ) | | | (2.53 | ) | | | (3.39 | ) | | | 45.27 | | | | 13.77 | | | | 56,052 | | | | .57 | | | | 1.97 | |
| | (.79 | ) | | | (1.83 | ) | | | (2.62 | ) | | | 42.89 | | | | 15.91 | | | | 53,976 | | | | .58 | | | | 1.95 | |
| | (.82 | ) | | | (1.59 | ) | | | (2.41 | ) | | | 39.38 | | | | 1.62 | | | | 50,717 | | | | .58 | | | | 2.02 | |
| | (.85 | ) | | | (2.04 | ) | | | (2.89 | ) | | | 41.23 | | | | 9.28 | | | | 52,547 | | | | .58 | | | | 2.01 | |
| | | | | | | | | | | | | | | | | | | | | | | | | | | | | | | |
| | (.23 | ) | | | (.90 | ) | | | (1.13 | ) | | | 46.38 | | | | 3.36 | 6 | | | 1,716 | | | | 1.33 | 7 | | | 1.07 | 7 |
| | (.51 | ) | | | (2.47 | ) | | | (2.98 | ) | | | 46.01 | | | | 10.40 | | | | 1,742 | | | | 1.35 | | | | 1.18 | |
| | (.50 | ) | | | (2.53 | ) | | | (3.03 | ) | | | 44.66 | | | | 12.85 | | | | 1,606 | | | | 1.37 | | | | 1.18 | |
| | (.47 | ) | | | (1.83 | ) | | | (2.30 | ) | | | 42.36 | | | | 14.99 | | | | 1,643 | | | | 1.38 | | | | 1.15 | |
| | (.50 | ) | | | (1.59 | ) | | | (2.09 | ) | | | 38.92 | | | | .82 | | | | 1,588 | | | | 1.38 | | | | 1.23 | |
| | (.51 | ) | | | (2.04 | ) | | | (2.55 | ) | | | 40.77 | | | | 8.39 | | | | 1,708 | | | | 1.38 | | | | 1.21 | |
| | | | | | | | | | | | | | | | | | | | | | | | | | | | | | | |
| | (.46 | ) | | | (.90 | ) | | | (1.36 | ) | | | 47.08 | | | | 3.88 | 6,8 | | | — | 9 | | | .35 | 7,8 | | | 2.06 | 7,8 |
| | (.96 | ) | | | (2.47 | ) | | | (3.43 | ) | | | 46.68 | | | | 11.50 | 8 | | | — | 9 | | | .36 | 8 | | | 2.17 | 8 |
| | (.95 | ) | | | (2.53 | ) | | | (3.48 | ) | | | 45.27 | | | | 14.01 | 8 | | | — | 9 | | | .36 | 8 | | | 2.17 | 8 |
| | — | | | | — | | | | — | | | | 42.89 | | | | .85 | 6,8 | | | — | 9 | | | .02 | 6,8 | | | .03 | 6,8 |
| | | | | | | | | | | | | | | | | | | | | | | | | | | | | | | |
| | (.39 | ) | | | (.90 | ) | | | (1.29 | ) | | | 46.88 | | | | 3.73 | 6 | | | 2,887 | | | | .65 | 7 | | | 1.75 | 7 |
| | (.82 | ) | | | (2.47 | ) | | | (3.29 | ) | | | 46.49 | | | | 11.17 | | | | 2,840 | | | | .66 | | | | 1.88 | |
| | (.82 | ) | | | (2.53 | ) | | | (3.35 | ) | | | 45.10 | | | | 13.66 | | | | 2,771 | | | | .67 | | | | 1.89 | |
| | (.76 | ) | | | (1.83 | ) | | | (2.59 | ) | | | 42.74 | | | | 15.81 | | | | 2,999 | | | | .67 | | | | 1.86 | |
| | (.79 | ) | | | (1.59 | ) | | | (2.38 | ) | | | 39.25 | | | | 1.55 | | | | 2,897 | | | | .66 | | | | 1.94 | |
| | (.80 | ) | | | (2.04 | ) | | | (2.84 | ) | | | 41.10 | | | | 9.18 | | | | 2,908 | | | | .66 | | | | 1.95 | |
| | | | | | | | | | | | | | | | | | | | | | | | | | | | | | | |
| | (.45 | ) | | | (.90 | ) | | | (1.35 | ) | | | 47.03 | | | | 3.85 | 6 | | | 18,955 | | | | .39 | 7 | | | 2.00 | 7 |
| | (.95 | ) | | | (2.47 | ) | | | (3.42 | ) | | | 46.64 | | | | 11.47 | | | | 16,882 | | | | .38 | | | | 2.14 | |
| | (.94 | ) | | | (2.53 | ) | | | (3.47 | ) | | | 45.24 | | | | 14.00 | | | | 11,874 | | | | .38 | | | | 2.15 | |
| | (.87 | ) | | | (1.83 | ) | | | (2.70 | ) | | | 42.86 | | | | 16.10 | | | | 9,463 | | | | .41 | | | | 2.10 | |
| | (.89 | ) | | | (1.59 | ) | | | (2.48 | ) | | | 39.36 | | | | 1.81 | | | | 6,097 | | | | .41 | | | | 2.19 | |
| | (.93 | ) | | | (2.04 | ) | | | (2.97 | ) | | | 41.21 | | | | 9.48 | | | | 5,352 | | | | .40 | | | | 2.14 | |
| | | | | | | | | | | | | | | | | | | | | | | | | | | | | | | |
| | (.47 | ) | | | (.90 | ) | | | (1.37 | ) | | | 47.06 | | | | 3.92 | 6 | | | 3,978 | | | | .28 | 7 | | | 2.11 | 7 |
| | (.99 | ) | | | (2.47 | ) | | | (3.46 | ) | | | 46.66 | | | | 11.56 | | | | 3,523 | | | | .30 | | | | 2.22 | |
| | (.99 | ) | | | (2.53 | ) | | | (3.52 | ) | | | 45.26 | | | | 14.10 | | | | 2,212 | | | | .30 | | | | 2.10 | |
| | (.23 | ) | | | — | | | | (.23 | ) | | | 42.88 | | | | 2.98 | 6 | | | 249 | | | | .08 | 6 | | | .35 | 6 |
See end of table for footnotes.
| Washington Mutual Investors Fund | 27 |
Financial highlights(continued)
| | | | | | Income from investment operations1 | |
| Period ended | | Net asset
value,
beginning
of period | | | Net
investment
income | | | Net gains (losses)
on securities (both
realized and
unrealized) | | | Total from
investment
operations | |
| Class 529-A: | | | | | | | | | | | | | | | | |
| 10/31/20194,5 | | $ | 46.56 | | | $ | .41 | | | $ | 1.28 | | | $ | 1.69 | |
| 4/30/2019 | | | 45.16 | | | | .84 | | | | 3.85 | | | | 4.69 | |
| 4/30/2018 | | | 42.80 | | | | .84 | | | | 4.88 | | | | 5.72 | |
| 4/30/2017 | | | 39.30 | | | | .77 | | | | 5.32 | | | | 6.09 | |
| 4/30/2016 | | | 41.15 | | | | .76 | | | | (.24 | ) | | | .52 | |
| 4/30/2015 | | | 40.33 | | | | .79 | | | | 2.88 | | | | 3.67 | |
| Class 529-C: | | | | | | | | | | | | | | | | |
| 10/31/20194,5 | | | 46.25 | | | | .24 | | | | 1.26 | | | | 1.50 | |
| 4/30/2019 | | | 44.87 | | | | .51 | | | | 3.83 | | | | 4.34 | |
| 4/30/2018 | | | 42.48 | | | | .52 | | | | 4.82 | | | | 5.34 | |
| 4/30/2017 | | | 39.03 | | | | .45 | | | | 5.27 | | | | 5.72 | |
| 4/30/2016 | | | 40.88 | | | | .45 | | | | (.23 | ) | | | .22 | |
| 4/30/2015 | | | 40.09 | | | | .47 | | | | 2.85 | | | | 3.32 | |
| Class 529-E: | | | | | | | | | | | | | | | | |
| 10/31/20194,5 | | | 46.27 | | | | .35 | | | | 1.28 | | | | 1.63 | |
| 4/30/2019 | | | 44.90 | | | | .74 | | | | 3.82 | | | | 4.56 | |
| 4/30/2018 | | | 42.57 | | | | .73 | | | | 4.85 | | | | 5.58 | |
| 4/30/2017 | | | 39.10 | | | | .66 | | | | 5.30 | | | | 5.96 | |
| 4/30/2016 | | | 40.95 | | | | .66 | | | | (.24 | ) | | | .42 | |
| 4/30/2015 | | | 40.15 | | | | .69 | | | | 2.86 | | | | 3.55 | |
| Class 529-T: | | | | | | | | | | | | | | | | |
| 10/31/20194,5 | | | 46.68 | | | | .47 | | | | 1.28 | | | | 1.75 | |
| 4/30/2019 | | | 45.27 | | | | .95 | | | | 3.86 | | | | 4.81 | |
| 4/30/2018 | | | 42.89 | | | | .94 | | | | 4.90 | | | | 5.84 | |
| 4/30/20174,10 | | | 42.53 | | | | .01 | | | | .35 | | | | .36 | |
| Class 529-F-1: | | | | | | | | | | | | | | | | |
| 10/31/20194,5 | | | 46.44 | | | | .46 | | | | 1.27 | | | | 1.73 | |
| 4/30/2019 | | | 45.06 | | | | .94 | | | | 3.84 | | | | 4.78 | |
| 4/30/2018 | | | 42.71 | | | | .94 | | | | 4.87 | | | | 5.81 | |
| 4/30/2017 | | | 39.23 | | | | .85 | | | | 5.31 | | | | 6.16 | |
| 4/30/2016 | | | 41.08 | | | | .84 | | | | (.23 | ) | | | .61 | |
| 4/30/2015 | | | 40.27 | | | | .88 | | | | 2.87 | | | | 3.75 | |
| Class R-1: | | | | | | | | | | | | | | | | |
| 10/31/20194,5 | | | 46.13 | | | | .24 | | | | 1.26 | | | | 1.50 | |
| 4/30/2019 | | | 44.76 | | | | .51 | | | | 3.82 | | | | 4.33 | |
| 4/30/2018 | | | 42.45 | | | | .51 | | | | 4.82 | | | | 5.33 | |
| 4/30/2017 | | | 39.00 | | | | .46 | | | | 5.28 | | | | 5.74 | |
| 4/30/2016 | | | 40.85 | | | | .47 | | | | (.23 | ) | | | .24 | |
| 4/30/2015 | | | 40.06 | | | | .50 | | | | 2.85 | | | | 3.35 | |
| 28 | Washington Mutual Investors Fund |
| Dividends and distributions | | | | | | | | | | | | | | | | |
Dividends
(from net
investment
income) | | | Distributions
(from capital
gains) | | | Total
dividends
and
distributions | | | Net asset
value, end
of period | | | Total
return2 | | | Net assets,
end of period
(in millions) | | | Ratio of
expenses
to average
net assets3 | | | Ratio of net
income
to average
net assets | |
| | | | | | �� | | | | | | | | | | | | | | | | | | | | | | | | | |
| $ | (.39 | ) | | $ | (.90 | ) | | $ | (1.29 | ) | | $ | 46.96 | | | | 3.75 | %6 | | $ | 2,382 | | | | .63 | %7 | | | 1.77 | %7 |
| | (.82 | ) | | | (2.47 | ) | | | (3.29 | ) | | | 46.56 | | | | 11.18 | | | | 2,400 | | | | .65 | | | | 1.88 | |
| | (.83 | ) | | | (2.53 | ) | | | (3.36 | ) | | | 45.16 | | | | 13.67 | | | | 2,270 | | | | .65 | | | | 1.88 | |
| | (.76 | ) | | | (1.83 | ) | | | (2.59 | ) | | | 42.80 | | | | 15.82 | | | | 1,982 | | | | .66 | | | | 1.86 | |
| | (.78 | ) | | | (1.59 | ) | | | (2.37 | ) | | | 39.30 | | | | 1.52 | | | | 1,788 | | | | .68 | | | | 1.93 | |
| | (.81 | ) | | | (2.04 | ) | | | (2.85 | ) | | | 41.15 | | | | 9.17 | | | | 1,839 | | | | .68 | | | | 1.91 | |
| | | | | | | | | | | | | | | | | | | | | | | | | | | | | | | |
| | (.22 | ) | | | (.90 | ) | | | (1.12 | ) | | | 46.63 | | | | 3.34 | 6 | | | 257 | | | | 1.36 | 7 | | | 1.05 | 7 |
| | (.49 | ) | | | (2.47 | ) | | | (2.96 | ) | | | 46.25 | | | | 10.36 | | | | 273 | | | | 1.39 | | | | 1.15 | |
| | (.42 | ) | | | (2.53 | ) | | | (2.95 | ) | | | 44.87 | | | | 12.83 | | | | 298 | | | | 1.42 | | | | 1.17 | |
| | (.44 | ) | | | (1.83 | ) | | | (2.27 | ) | | | 42.48 | | | | 14.91 | | | | 470 | | | | 1.43 | | | | 1.10 | |
| | (.48 | ) | | | (1.59 | ) | | | (2.07 | ) | | | 39.03 | | | | .74 | | | | 442 | | | | 1.45 | | | | 1.15 | |
| | (.49 | ) | | | (2.04 | ) | | | (2.53 | ) | | | 40.88 | | | | 8.33 | | | | 464 | | | | 1.45 | | | | 1.14 | |
| | | | | | | | | | | | | | | | | | | | | | | | | | | | | | | |
| | (.34 | ) | | | (.90 | ) | | | (1.24 | ) | | | 46.66 | | | | 3.62 | 6 | | | 101 | | | | .87 | 7 | | | 1.54 | 7 |
| | (.72 | ) | | | (2.47 | ) | | | (3.19 | ) | | | 46.27 | | | | 10.91 | | | | 105 | | | | .89 | | | | 1.65 | |
| | (.72 | ) | | | (2.53 | ) | | | (3.25 | ) | | | 44.90 | | | | 13.40 | | | | 103 | | | | .89 | | | | 1.65 | |
| | (.66 | ) | | | (1.83 | ) | | | (2.49 | ) | | | 42.57 | | | | 15.54 | | | | 100 | | | | .90 | | | | 1.62 | |
| | (.68 | ) | | | (1.59 | ) | | | (2.27 | ) | | | 39.10 | | | | 1.29 | | | | 92 | | | | .92 | | | | 1.68 | |
| | (.71 | ) | | | (2.04 | ) | | | (2.75 | ) | | | 40.95 | | | | 8.90 | | | | 95 | | | | .92 | | | | 1.66 | |
| | | | | | | | | | | | | | | | | | | | | | | | | | | | | | | |
| | (.45 | ) | | | (.90 | ) | | | (1.35 | ) | | | 47.08 | | | | 3.86 | 6,8 | | | — | 9 | | | .39 | 7,8 | | | 2.01 | 7,8 |
| | (.93 | ) | | | (2.47 | ) | | | (3.40 | ) | | | 46.68 | | | | 11.44 | 8 | | | — | 9 | | | .41 | 8 | | | 2.12 | 8 |
| | (.93 | ) | | | (2.53 | ) | | | (3.46 | ) | | | 45.27 | | | | 13.95 | 8 | | | — | 9 | | | .42 | 8 | | | 2.10 | 8 |
| | — | | | | — | | | | — | | | | 42.89 | | | | .85 | 6,8 | | | — | 9 | | | .03 | 6,8 | | | .02 | 6,8 |
| | | | | | | | | | | | | | | | | | | | | | | | | | | | | | | |
| | (.44 | ) | | | (.90 | ) | | | (1.34 | ) | | | 46.83 | | | | 3.85 | 6 | | | 205 | | | | .40 | 7 | | | 1.99 | 7 |
| | (.93 | ) | | | (2.47 | ) | | | (3.40 | ) | | | 46.44 | | | | 11.42 | | | | 188 | | | | .42 | | | | 2.11 | |
| | (.93 | ) | | | (2.53 | ) | | | (3.46 | ) | | | 45.06 | | | | 13.93 | | | | 146 | | | | .42 | | | | 2.10 | |
| | (.85 | ) | | | (1.83 | ) | | | (2.68 | ) | | | 42.71 | | | | 16.06 | | | | 126 | | | | .44 | | | | 2.08 | |
| | (.87 | ) | | | (1.59 | ) | | | (2.46 | ) | | | 39.23 | | | | 1.76 | | | | 110 | | | | .46 | | | | 2.15 | |
| | (.90 | ) | | | (2.04 | ) | | | (2.94 | ) | | | 41.08 | | | | 9.40 | | | | 108 | | | | .45 | | | | 2.13 | |
| | | | | | | | | | | | | | | | | | | | | | | | | | | | | | | |
| | (.22 | ) | | | (.90 | ) | | | (1.12 | ) | | | 46.51 | | | | 3.35 | 6 | | | 81 | | | | 1.37 | 7 | | | 1.04 | 7 |
| | (.49 | ) | | | (2.47 | ) | | | (2.96 | ) | | | 46.13 | | | | 10.37 | | | | 88 | | | | 1.39 | | | | 1.14 | |
| | (.49 | ) | | | (2.53 | ) | | | (3.02 | ) | | | 44.76 | | | | 12.82 | | | | 92 | | | | 1.39 | | | | 1.15 | |
| | (.46 | ) | | | (1.83 | ) | | | (2.29 | ) | | | 42.45 | | | | 14.98 | | | | 93 | | | | 1.39 | | | | 1.14 | |
| | (.50 | ) | | | (1.59 | ) | | | (2.09 | ) | | | 39.00 | | | | .81 | | | | 93 | | | | 1.39 | | | | 1.22 | |
| | (.52 | ) | | | (2.04 | ) | | | (2.56 | ) | | | 40.85 | | | | 8.41 | | | | 101 | | | | 1.38 | | | | 1.21 | |
See end of table for footnotes.
| Washington Mutual Investors Fund | 29 |
Financial highlights(continued)
| | | | | | Income from investment operations1 | |
| Period ended | | Net asset
value,
beginning
of period | | | Net
investment
income | | | Net gains (losses)
on securities (both
realized and
unrealized) | | | Total from
investment
operations | |
| Class R-2: | | | | | | | | | | | | | | | | |
| 10/31/20194,5 | | $ | 45.94 | | | $ | .24 | | | $ | 1.26 | | | $ | 1.50 | |
| 4/30/2019 | | | 44.60 | | | | .51 | | | | 3.80 | | | | 4.31 | |
| 4/30/2018 | | | 42.31 | | | | .51 | | | | 4.81 | | | | 5.32 | |
| 4/30/2017 | | | 38.88 | | | | .46 | | | | 5.26 | | | | 5.72 | |
| 4/30/2016 | | | 40.73 | | | | .49 | | | | (.23 | ) | | | .26 | |
| 4/30/2015 | | | 39.95 | | | | .51 | | | | 2.84 | | | | 3.35 | |
| Class R-2E: | | | | | | | | | | | | | | | | |
| 10/31/20194,5 | | | 46.43 | | | | .31 | | | | 1.27 | | | | 1.58 | |
| 4/30/2019 | | | 45.05 | | | | .64 | | | | 3.85 | | | | 4.49 | |
| 4/30/2018 | | | 42.71 | | | | .62 | | | | 4.89 | | | | 5.51 | |
| 4/30/2017 | | | 39.26 | | | | .55 | | | | 5.33 | | | | 5.88 | |
| 4/30/2016 | | | 41.18 | | | | .52 | | | | (.07 | ) | | | .45 | |
| 4/30/20154,12 | | | 42.40 | | | | .51 | | | | 1.01 | | | | 1.52 | |
| Class R-3: | | | | | | | | | | | | | | | | |
| 10/31/20194,5 | | | 46.24 | | | | .34 | | | | 1.27 | | | | 1.61 | |
| 4/30/2019 | | | 44.87 | | | | .71 | | | | 3.82 | | | | 4.53 | |
| 4/30/2018 | | | 42.54 | | | | .71 | | | | 4.84 | | | | 5.55 | |
| 4/30/2017 | | | 39.08 | | | | .65 | | | | 5.28 | | | | 5.93 | |
| 4/30/2016 | | | 40.94 | | | | .65 | | | | (.25 | ) | | | .40 | |
| 4/30/2015 | | | 40.14 | | | | .68 | | | | 2.86 | | | | 3.54 | |
| Class R-4: | | | | | | | | | | | | | | | | |
| 10/31/20194,5 | | | 46.41 | | | | .41 | | | | 1.27 | | | | 1.68 | |
| 4/30/2019 | | | 45.03 | | | | .85 | | | | 3.83 | | | | 4.68 | |
| 4/30/2018 | | | 42.68 | | | | .84 | | | | 4.87 | | | | 5.71 | |
| 4/30/2017 | | | 39.20 | | | | .77 | | | | 5.31 | | | | 6.08 | |
| 4/30/2016 | | | 41.06 | | | | .77 | | | | (.25 | ) | | | .52 | |
| 4/30/2015 | | | 40.25 | | | | .81 | | | | 2.86 | | | | 3.67 | |
| Class R-5E: | | | | | | | | | | | | | | | | |
| 10/31/20194,5 | | | 46.61 | | | | .45 | | | | 1.29 | | | | 1.74 | |
| 4/30/2019 | | | 45.23 | | | | .94 | | | | 3.85 | | | | 4.79 | |
| 4/30/2018 | | | 42.86 | | | | .85 | | | | 4.98 | | | | 5.83 | |
| 4/30/2017 | | | 39.36 | | | | .75 | | | | 5.42 | | | | 6.17 | |
| 4/30/20164,13 | | | 41.13 | | | | .33 | | | | (.03 | ) | | | .30 | |
| Class R-5: | | | | | | | | | | | | | | | | |
| 10/31/20194,5 | | | 46.66 | | | | .48 | | | | 1.28 | | | | 1.76 | |
| 4/30/2019 | | | 45.25 | | | | .99 | | | | 3.85 | | | | 4.84 | |
| 4/30/2018 | | | 42.87 | | | | .98 | | | | 4.89 | | | | 5.87 | |
| 4/30/2017 | | | 39.37 | | | | .90 | | | | 5.32 | | | | 6.22 | |
| 4/30/2016 | | | 41.22 | | | | .89 | | | | (.24 | ) | | | .65 | |
| 4/30/2015 | | | 40.39 | | | | .93 | | | | 2.89 | | | | 3.82 | |
| 30 | Washington Mutual Investors Fund |
| Dividends and distributions | | | | | | | | | | | | | | | | |
Dividends
(from net
investment
income) | | | Distributions
(from capital
gains) | | | Total
dividends
and
distributions | | | Net asset
value, end
of period | | | Total
return2 | | | Net assets,
end of period
(in millions) | | | Ratio of
expenses
to average
net assets3 | | | Ratio of net
income
to average
net assets | |
| | | | | | | | | | | | | | | | | | | | | | | | | | | | | | | |
| $ | (.23 | ) | | $ | (.90 | ) | | $ | (1.13 | ) | | $ | 46.31 | | | | 3.35 | %6 | | $ | 703 | | | | 1.36 | %7 | | | 1.04 | %7 |
| | (.50 | ) | | | (2.47 | ) | | | (2.97 | ) | | | 45.94 | | | | 10.37 | | | | 712 | | | | 1.39 | | | | 1.14 | |
| | (.50 | ) | | | (2.53 | ) | | | (3.03 | ) | | | 44.60 | | | | 12.82 | | | | 713 | | | | 1.39 | | | | 1.15 | |
| | (.46 | ) | | | (1.83 | ) | | | (2.29 | ) | | | 42.31 | | | | 14.97 | | | | 736 | | | | 1.39 | | | | 1.13 | |
| | (.52 | ) | | | (1.59 | ) | | | (2.11 | ) | | | 38.88 | | | | .85 | | | | 718 | | | | 1.36 | | | | 1.25 | |
| | (.53 | ) | | | (2.04 | ) | | | (2.57 | ) | | | 40.73 | | | | 8.46 | | | | 803 | | | | 1.34 | | | | 1.25 | |
| | | | | | | | | | | | | | | | | | | | | | | | | | | | | | | |
| | (.29 | ) | | | (.90 | ) | | | (1.19 | ) | | | 46.82 | | | | 3.51 | 6 | | | 101 | | | | 1.07 | 7 | | | 1.32 | 7 |
| | (.64 | ) | | | (2.47 | ) | | | (3.11 | ) | | | 46.43 | | | | 10.69 | | | | 94 | | | | 1.09 | | | | 1.43 | |
| | (.64 | ) | | | (2.53 | ) | | | (3.17 | ) | | | 45.05 | | | | 13.19 | | | | 62 | | | | 1.09 | | | | 1.39 | |
| | (.60 | ) | | | (1.83 | ) | | | (2.43 | ) | | | 42.71 | | | | 15.27 | | | | 31 | | | | 1.10 | | | | 1.35 | |
| | (.78 | ) | | | (1.59 | ) | | | (2.37 | ) | | | 39.26 | | | | 1.35 | | | | 8 | | | | 1.01 | | | | 1.40 | |
| | (.70 | ) | | | (2.04 | ) | | | (2.74 | ) | | | 41.18 | | | | 3.63 | 6,8 | | | — | 9 | | | .64 | 7,8 | | | 1.84 | 7,8 |
| | | | | | | | | | | | | | | | | | | | | | | | | | | | | | | |
| | (.32 | ) | | | (.90 | ) | | | (1.22 | ) | | | 46.63 | | | | 3.59 | 6 | | | 1,884 | | | | .92 | 7 | | | 1.48 | 7 |
| | (.69 | ) | | | (2.47 | ) | | | (3.16 | ) | | | 46.24 | | | | 10.86 | | | | 1,968 | | | | .94 | | | | 1.59 | |
| | (.69 | ) | | | (2.53 | ) | | | (3.22 | ) | | | 44.87 | | | | 13.34 | | | | 1,965 | | | | .94 | | | | 1.59 | |
| | (.64 | ) | | | (1.83 | ) | | | (2.47 | ) | | | 42.54 | | | | 15.49 | | | | 1,890 | | | | .95 | | | | 1.58 | |
| | (.67 | ) | | | (1.59 | ) | | | (2.26 | ) | | | 39.08 | | | | 1.23 | | | | 1,767 | | | | .95 | | | | 1.66 | |
| | (.70 | ) | | | (2.04 | ) | | | (2.74 | ) | | | 40.94 | | | | 8.89 | | | | 1,937 | | | | .94 | | | | 1.65 | |
| | | | | | | | | | | | | | | | | | | | | | | | | | | | | | | |
| | (.39 | ) | | | (.90 | ) | | | (1.29 | ) | | | 46.80 | | | | 3.74 | 6 | | | 3,475 | | | | .62 | 7 | | | 1.78 | 7 |
| | (.83 | ) | | | (2.47 | ) | | | (3.30 | ) | | | 46.41 | | | | 11.19 | | | | 3,542 | | | | .64 | | | | 1.89 | |
| | (.83 | ) | | | (2.53 | ) | | | (3.36 | ) | | | 45.03 | | | | 13.70 | | | | 2,954 | | | | .64 | | | | 1.89 | |
| | (.77 | ) | | | (1.83 | ) | | | (2.60 | ) | | | 42.68 | | | | 15.83 | | | | 2,683 | | | | .64 | | | | 1.88 | |
| | (.79 | ) | | | (1.59 | ) | | | (2.38 | ) | | | 39.20 | | | | 1.54 | | | | 2,306 | | | | .65 | | | | 1.96 | |
| | (.82 | ) | | | (2.04 | ) | | | (2.86 | ) | | | 41.06 | | | | 9.22 | | | | 2,283 | | | | .64 | | | | 1.95 | |
| | | | | | | | | | | | | | | | | | | | | | | | | | | | | | | |
| | (.44 | ) | | | (.90 | ) | | | (1.34 | ) | | | 47.01 | | | | 3.85 | 6 | | | 152 | | | | .42 | 7 | | | 1.96 | 7 |
| | (.94 | ) | | | (2.47 | ) | | | (3.41 | ) | | | 46.61 | | | | 11.41 | | | | 120 | | | | .43 | | | | 2.11 | |
| | (.93 | ) | | | (2.53 | ) | | | (3.46 | ) | | | 45.23 | | | | 13.93 | | | | 12 | | | | .43 | | | | 1.88 | |
| | (.84 | ) | | | (1.83 | ) | | | (2.67 | ) | | | 42.86 | | | | 16.04 | | | | — | 9 | | | .48 | | | | 1.82 | |
| | (.48 | ) | | | (1.59 | ) | | | (2.07 | ) | | | 39.36 | | | | .97 | 6 | | | — | 9 | | | .22 | 6 | | | .87 | 6 |
| | | | | | | | | | | | | | | | | | | | | | | | | | | | | | | |
| | (.46 | ) | | | (.90 | ) | | | (1.36 | ) | | | 47.06 | | | | 3.89 | 6 | | | 1,364 | | | | .33 | 7 | | | 2.07 | 7 |
| | (.96 | ) | | | (2.47 | ) | | | (3.43 | ) | | | 46.66 | | | | 11.53 | | | | 1,378 | | | | .34 | | | | 2.20 | |
| | (.96 | ) | | | (2.53 | ) | | | (3.49 | ) | | | 45.25 | | | | 14.04 | | | | 2,078 | | | | .34 | | | | 2.20 | |
| | (.89 | ) | | | (1.83 | ) | | | (2.72 | ) | | | 42.87 | | | | 16.16 | | | | 2,137 | | | | .35 | | | | 2.18 | |
| | (.91 | ) | | | (1.59 | ) | | | (2.50 | ) | | | 39.37 | | | | 1.87 | | | | 1,949 | | | | .35 | | | | 2.26 | |
| | (.95 | ) | | | (2.04 | ) | | | (2.99 | ) | | | 41.22 | | | | 9.55 | | | | 1,998 | | | | .34 | | | | 2.24 | |
See end of table for footnotes.
| Washington Mutual Investors Fund | 31 |
Financial highlights(continued)
| | | | | | Income from investment operations1 | |
| Period ended | | Net asset
value,
beginning
of period | | | Net
investment
income | | | Net gains (losses)
on securities (both
realized and
unrealized) | | | Total from
investment
operations | |
| Class R-6: | | | | | | | | | | | | | | | | |
| 10/31/20194,5 | | $ | 46.71 | | | $ | .49 | | | $ | 1.28 | | | $ | 1.77 | |
| 4/30/2019 | | | 45.29 | | | | 1.01 | | | | 3.87 | | | | 4.88 | |
| 4/30/2018 | | | 42.91 | | | | .99 | | | | 4.90 | | | | 5.89 | |
| 4/30/2017 | | | 39.40 | | | | .91 | | | | 5.34 | | | | 6.25 | |
| 4/30/2016 | | | 41.25 | | | | .90 | | | | (.23 | ) | | | .67 | |
| 4/30/2015 | | | 40.42 | | | | .95 | | | | 2.89 | | | | 3.84 | |
| | | Six months ended | | Year ended April 30 |
| | | October 31, 20194,5,6 | | 2019 | | 2018 | | 2017 | | 2016 | | 2015 |
| Portfolio turnover rate for all share classes14 | | | 11 | % | | | 25 | % | | | 25 | % | | | 21 | % | | | 30 | % | | | 24 | % |
See notes to financial statements.
| 32 | Washington Mutual Investors Fund |
| Dividends and distributions | | | | | | | | | | | | | | | | |
Dividends
(from net
investment
income) | | | Distributions
(from capital
gains) | | | Total
dividends
and
distributions | | | Net asset
value, end
of period | | | Total
return2 | | | Net assets,
end of period
(in millions) | | | Ratio of
expenses
to average
net assets3 | | | Ratio of net
income
to average
net assets | |
| | | | | | | | | | | | | | | | | | | | | | | | | | | | | | | |
| $ | (.47 | ) | | $ | (.90 | ) | | $ | (1.37 | ) | | $ | 47.11 | | | | 3.92 | %6 | | $ | 23,691 | | | | .28 | %7 | | | 2.12 | %7 |
| | (.99 | ) | | | (2.47 | ) | | | (3.46 | ) | | | 46.71 | | | | 11.60 | | | | 21,782 | | | | .29 | | | | 2.23 | |
| | (.98 | ) | | | (2.53 | ) | | | (3.51 | ) | | | 45.29 | | | | 14.09 | | | | 16,371 | | | | .29 | | | | 2.22 | |
| | (.91 | ) | | | (1.83 | ) | | | (2.74 | ) | | | 42.91 | | | | 16.23 | | | | 11,692 | | | | .30 | | | | 2.21 | |
| | (.93 | ) | | | (1.59 | ) | | | (2.52 | ) | | | 39.40 | | | | 1.91 | | | | 7,800 | | | | .30 | | | | 2.30 | |
| | (.97 | ) | | | (2.04 | ) | | | (3.01 | ) | | | 41.25 | | | | 9.59 | | | | 6,301 | | | | .30 | | | | 2.28 | |
| 1 | Based on average shares outstanding. |
| 2 | Total returns exclude any applicable sales charges, including contingent deferred sales charges. |
| 3 | Ratios do not include expenses of any Central Funds. The fund indirectly bears its proportionate share of the expenses of any Central Funds. |
| 4 | Based on operations for a period that is less than a full year. |
| 5 | Unaudited. |
| 6 | Not annualized. |
| 7 | Annualized. |
| 8 | All or a significant portion of assets in this class consisted of seed capital invested by CRMC and/or its affiliates. Fees for distribution services are not charged or accrued on these seed capital assets. If such fees were paid by the fund on seed capital assets, fund expenses would have been higher and net income and total return would have been lower. |
| 9 | Amount less than $1 million. |
| 10 | Class T and 529-T shares began investment operations on April 7, 2017. |
| 11 | Class F-3 shares began investment operations on January 27, 2017. |
| 12 | Class R-2E shares began investment operations on August 29, 2014. |
| 13 | Class R-5E shares began investment operations on November 20, 2015. |
| 14 | Rates do not include the fund’s portfolio activity with respect to any Central Funds. |
| Washington Mutual Investors Fund | 33 |
As a fund shareholder, you incur two types of costs: (1) transaction costs, such as initial sales charges on purchase payments and contingent deferred sales charges on redemptions (loads), and (2) ongoing costs, including management fees, distribution and service (12b-1) fees, and other expenses. This example is intended to help you understand your ongoing costs (in dollars) of investing in the fund so you can compare these costs with the ongoing costs of investing in other mutual funds. The example is based on an investment of $1,000 invested at the beginning of the period and held for the entire six-month period (May 1, 2019, through October 31, 2019).
Actual expenses:
The first line of each share class in the table on the following page provides information about actual account values and actual expenses. You may use the information in this line, together with the amount you invested, to estimate the expenses that you paid over the period. Simply divide your account value by $1,000 (for example, an $8,600 account value divided by $1,000 = 8.6), then multiply the result by the number in the first line under the heading titled “Expenses paid during period” to estimate the expenses you paid on your account during this period.
Hypothetical example for comparison purposes:
The second line of each share class in the table on the following page provides information about hypothetical account values and hypothetical expenses based on the actual expense ratio for the share class and an assumed rate of return of 5.00% per year before expenses, which is not the actual return of the share class. The hypothetical account values and expenses may not be used to estimate the actual ending account balance or expenses you paid for the period. You may use this information to compare the ongoing costs of investing in the fund and other funds. To do so, compare this 5.00% hypothetical example with the 5.00% hypothetical examples that appear in the shareholder reports of the other funds.
Notes:
Retirement plan participants may be subject to certain fees charged by the plan sponsor, and Class F-1, F-2, F-3 and 529-F-1 shareholders may be subject to fees charged by financial intermediaries, typically ranging from 0.75% to 1.50% of assets annually depending on services offered. You can estimate the impact of these fees by adding the amount of the fees to the total estimated expenses you paid on your account during the period as calculated above. In addition, your ending account value would be lower by the amount of these fees.
Note that the expenses shown in the table on the following page are meant to highlight your ongoing costs only and do not reflect any transactional costs, such as sales charges (loads). Therefore, the second line of each share class in the table is useful in comparing ongoing costs only and will not help you determine the relative total costs of owning different funds. In addition, if these transactional costs were included, your costs would have been higher.
| 34 | Washington Mutual Investors Fund |
| | | Beginning
account value
5/1/2019 | | | Ending
account value
10/31/2019 | | | Expenses paid
during period* | | | Annualized
expense ratio | |
| Class A – actual return | | $ | 1,000.00 | | | $ | 1,037.42 | | | $ | 2.98 | | | | .58 | % |
| Class A – assumed 5% return | | | 1,000.00 | | | | 1,022.28 | | | | 2.96 | | | | .58 | |
| Class C – actual return | | | 1,000.00 | | | | 1,033.62 | | | | 6.82 | | | | 1.33 | |
| Class C – assumed 5% return | | | 1,000.00 | | | | 1,018.50 | | | | 6.77 | | | | 1.33 | |
| Class T – actual return | | | 1,000.00 | | | | 1,038.82 | | | | 1.80 | | | | .35 | |
| Class T – assumed 5% return | | | 1,000.00 | | | | 1,023.44 | | | | 1.79 | | | | .35 | |
| Class F-1 – actual return | | | 1,000.00 | | | | 1,037.27 | | | | 3.34 | | | | .65 | |
| Class F-1 – assumed 5% return | | | 1,000.00 | | | | 1,021.93 | | | | 3.31 | | | | .65 | |
| Class F-2 – actual return | | | 1,000.00 | | | | 1,038.52 | | | | 2.00 | | | | .39 | |
| Class F-2 – assumed 5% return | | | 1,000.00 | | | | 1,023.24 | | | | 1.99 | | | | .39 | |
| Class F-3 – actual return | | | 1,000.00 | | | | 1,039.18 | | | | 1.44 | | | | .28 | |
| Class F-3 – assumed 5% return | | | 1,000.00 | | | | 1,023.79 | | | | 1.43 | | | | .28 | |
| Class 529-A – actual return | | | 1,000.00 | | | | 1,037.49 | | | | 3.24 | | | | .63 | |
| Class 529-A – assumed 5% return | | | 1,000.00 | | | | 1,022.03 | | | | 3.21 | | | | .63 | |
| Class 529-C – actual return | | | 1,000.00 | | | | 1,033.37 | | | | 6.97 | | | | 1.36 | |
| Class 529-C – assumed 5% return | | | 1,000.00 | | | | 1,018.35 | | | | 6.92 | | | | 1.36 | |
| Class 529-E – actual return | | | 1,000.00 | | | | 1,036.23 | | | | 4.47 | | | | .87 | |
| Class 529-E – assumed 5% return | | | 1,000.00 | | | | 1,020.82 | | | | 4.43 | | | | .87 | |
| Class 529-T – actual return | | | 1,000.00 | | | | 1,038.58 | | | | 2.00 | | | | .39 | |
| Class 529-T – assumed 5% return | | | 1,000.00 | | | | 1,023.24 | | | | 1.99 | | | | .39 | |
| Class 529-F-1 – actual return | | | 1,000.00 | | | | 1,038.50 | | | | 2.06 | | | | .40 | |
| Class 529-F-1 – assumed 5% return | | | 1,000.00 | | | | 1,023.19 | | | | 2.04 | | | | .40 | |
| Class R-1 – actual return | | | 1,000.00 | | | | 1,033.50 | | | | 7.02 | | | | 1.37 | |
| Class R-1 – assumed 5% return | | | 1,000.00 | | | | 1,018.30 | | | | 6.97 | | | | 1.37 | |
| Class R-2 – actual return | | | 1,000.00 | | | | 1,033.55 | | | | 6.97 | | | | 1.36 | |
| Class R-2 – assumed 5% return | | | 1,000.00 | | | | 1,018.35 | | | | 6.92 | | | | 1.36 | |
| Class R-2E – actual return | | | 1,000.00 | | | | 1,035.10 | | | | 5.49 | | | | 1.07 | |
| Class R-2E – assumed 5% return | | | 1,000.00 | | | | 1,019.81 | | | | 5.45 | | | | 1.07 | |
| Class R-3 – actual return | | | 1,000.00 | | | | 1,035.93 | | | | 4.72 | | | | .92 | |
| Class R-3 – assumed 5% return | | | 1,000.00 | | | | 1,020.57 | | | | 4.69 | | | | .92 | |
| Class R-4 – actual return | | | 1,000.00 | | | | 1,037.37 | | | | 3.18 | | | | .62 | |
| Class R-4 – assumed 5% return | | | 1,000.00 | | | | 1,022.08 | | | | 3.16 | | | | .62 | |
| Class R-5E – actual return | | | 1,000.00 | | | | 1,038.54 | | | | 2.16 | | | | .42 | |
| Class R-5E – assumed 5% return | | | 1,000.00 | | | | 1,023.09 | | | | 2.14 | | | | .42 | |
| Class R-5 – actual return | | | 1,000.00 | | | | 1,038.94 | | | | 1.70 | | | | .33 | |
| Class R-5 – assumed 5% return | | | 1,000.00 | | | | 1,023.54 | | | | 1.68 | | | | .33 | |
| Class R-6 – actual return | | | 1,000.00 | | | | 1,039.15 | | | | 1.44 | | | | .28 | |
| Class R-6 – assumed 5% return | | | 1,000.00 | | | | 1,023.79 | | | | 1.43 | | | | .28 | |
| * | The “expenses paid during period” are equal to the “annualized expense ratio,” multiplied by the average account value over the period, multiplied by the number of days in the period, and divided by 365 (to reflect the one-half year period). |
| Washington Mutual Investors Fund | 35 |
Approval of Investment Advisory and Service Agreement
Washington Mutual Investors Fund’s board has approved the fund’s Investment Advisory and Service Agreement (the “agreement”) with Capital Research and Management Company (“CRMC”) for an additional one-year term through August 31, 2020. The board approved the agreement following the recommendation of the fund’s Contracts Committee (the “committee”), which is composed of all of the fund’s independent board members. The board and the committee determined in the exercise of their business judgment that the fund’s advisory fee structure was fair and reasonable in relation to the services provided, and that approving the agreement was in the best interests of the fund and its shareholders.
In reaching this decision, the board and the committee took into account information furnished to them throughout the year and otherwise provided to them, as well as information prepared specifically in connection with their review of the agreement, and were advised by their independent counsel with respect to the matters considered. They considered the following factors, among others, but did not identify any single issue or particular piece of information that, in isolation, was the controlling factor, and each board and committee member did not necessarily attribute the same weight to each factor.
1. Nature, extent and quality of services
The board and the committee considered the depth and quality of CRMC’s investment management process, including its global research capabilities; the experience, capability and integrity of its senior management and other personnel; the low turnover rates of its key personnel; the overall financial strength and stability of CRMC and the Capital Group organization; the resources and systems CRMC devotes to investment management (the manner in which the fund’s assets are managed, including liquidity management), compliance, trading, portfolio accounting and other services; and the ongoing evolution of CRMC’s organizational structure designed to maintain and strengthen these qualities. The board and the committee also considered the nature, extent and quality of administrative, compliance and shareholder services provided by CRMC to the fund under the agreement and other agreements, as well as the benefits to fund shareholders from investing in a fund that is part of a large family of funds. The board and the committee concluded that the nature, extent and quality of the services provided by CRMC have benefited and should continue to benefit the fund and its shareholders.
| 36 | Washington Mutual Investors Fund |
2. Investment results
The board and the committee considered the investment results of the fund in light of its objective to produce income and to provide an opportunity for growth of principal consistent with sound common stock investing. They compared the fund’s investment results with those of other funds (including funds that currently form the basis of the Lipper index for the category in which the fund is included), and data such as relevant market and fund indexes, over various periods through December 31, 2018. This report, including the letter to shareholders and related disclosures, contains certain information about the fund’s investment results. The board and the committee reviewed the fund’s investment results measured against various indexes, including the Lipper Growth & Income Funds Index and the S&P 500 Index. They reviewed the results for the one-year, three-year, five-year, 10-year, 20-year and lifetime periods, and placed greater emphasis on longer-term periods. They noted that the investment results of the fund generally compared favorably to the results of the Lipper Growth and Income Index for all periods, and the S&P 500 Index for the 20-year and lifetime periods, and were mixed for shorter periods. The board and the committee concluded that the fund’s investment results have been satisfactory for renewal of the agreement and that CRMC’s record in managing the fund indicated that its continued management should benefit the fund and its shareholders.
3. Advisory fees and total expenses
The board and the committee compared the advisory fees and total expense levels of the fund to those of other relevant funds. They observed that the fund’s advisory fees and expenses generally compared favorably to those of other similar funds included in the Lipper Growth & Income Funds category. The board and the committee also considered the breakpoint discounts in the fund’s advisory fee structure that reduce the level of fees charged by CRMC to the fund as fund assets increase. In addition, they reviewed information regarding the effective advisory fees charged to non-mutual fund clients by CRMC and its affiliates. They noted that, to the extent there were differences between the advisory fees paid by the fund and the advisory fees paid by those clients, the differences appropriately reflected the investment, operational, regulatory and market differences between advising the fund and the other clients. The board and the committee concluded that the fund’s cost structure was fair and reasonable in relation to the services provided, and that the fund’s shareholders receive reasonable value in return for the advisory fees and other amounts paid to CRMC by the fund.
| Washington Mutual Investors Fund | 37 |
4. Ancillary benefits
The board and the committee considered a variety of other benefits that CRMC and its affiliates receive as a result of CRMC’s relationship with the fund and other American Funds, including fees for administrative services provided to certain share classes; fees paid to CRMC’s affiliated transfer agent; sales charges and distribution fees received and retained by the fund’s principal underwriter, an affiliate of CRMC; and possible ancillary benefits to CRMC and its institutional management affiliates in managing other investment vehicles. The board and the committee reviewed CRMC’s portfolio trading practices, noting that through December 31, 2018 CRMC benefited from research obtained with commissions from portfolio transactions made on behalf of the fund and since that time has undertaken to bear the cost of obtaining such research. The board and the committee took these ancillary benefits into account in evaluating the reasonableness of the advisory fees and other amounts paid to CRMC by the fund.
5. Adviser financial information
The board and the committee reviewed information regarding CRMC’s costs of providing services to the American Funds, including personnel, systems and resources of investment, compliance, trading, accounting and other administrative operations. They considered CRMC’s costs and related cost allocation methodology as well as its track record of investing in technology, infrastructure and staff to maintain and expand services and capabilities, respond to industry and regulatory developments, and attract and retain qualified personnel. They noted information regarding the compensation structure for CRMC’s investment professionals. They reviewed information on the profitability of the investment adviser and its affiliates. The board and the committee also compared CRMC’s profitability and compensation data to the reported results and data of several large, publicly held investment management companies. The board and the committee noted the competitiveness and cyclicality of both the mutual fund industry and the capital markets, and the importance in that environment of CRMC’s long-term profitability for maintaining its independence, company culture and management continuity. They further considered the breakpoint discounts in the fund’s advisory fee structure and CRMC’s sharing of potential economies of scale, or efficiencies, through breakpoints and other fee reductions and costs voluntarily absorbed. The board and the committee concluded that the fund’s advisory fee structure reflected a reasonable sharing of benefits between CRMC and the fund’s shareholders.
| 38 | Washington Mutual Investors Fund |
This page was intentionally left blank.
| Washington Mutual Investors Fund | 39 |
This page was intentionally left blank.
| 40 | Washington Mutual Investors Fund |
This page was intentionally left blank.
| Washington Mutual Investors Fund | 41 |
This page was intentionally left blank.
| 42 | Washington Mutual Investors Fund |
This page was intentionally left blank.
| Washington Mutual Investors Fund | 43 |
Office of the fund
6455 Irvine Center Drive
Irvine, CA 92618-4518
Investment adviser
Capital Research and Management Company
333 South Hope Street
Los Angeles, CA 90071-1406
Transfer agent for shareholder accounts
American Funds Service Company
(Write to the address near you.)
P.O. Box 6007
Indianapolis, IN 46206-6007
P.O. Box 2280
Norfolk, VA 23501-2280
Custodian of assets
JPMorgan Chase Bank
270 Park Avenue
New York, NY 10017-2070
Counsel
Dechert LLP
1900 K Street, NW
Washington, DC 20006-1110
Independent registered public accounting firm
PricewaterhouseCoopers LLP
601 South Figueroa Street
Los Angeles, CA 90017-3874
Principal underwriter
American Funds Distributors, Inc.
333 South Hope Street
Los Angeles, CA 90071-1406
| 44 | Washington Mutual Investors Fund |
Investors should carefully consider investment objectives, risks, charges and expenses. This and other important information is contained in the fund prospectus and summary prospectus, which can be obtained from your financial professional and should be read carefully before investing. You may also call American Funds Service Company (AFS) at (800) 421-4225 or visit the Capital Group website at capitalgroup.com.
“American Funds Proxy Voting Procedures and Principles” — which describes how we vote proxies relating to portfolio securities — is available on our website or upon request by calling AFS. The fund files its proxy voting record with the U.S. Securities and Exchange Commission (SEC) for the 12 months ended June 30 by August 31. The proxy voting record is available free of charge on the SEC website at sec.gov and on our website.
A complete October 31, 2019, portfolio of Washington Mutual Investors Fund’s investments is available free of charge by calling AFS or visiting the SEC website (where it is part of Form N-CSR).
Washington Mutual Investors Fund files a complete list of its portfolio holdings with the SEC for the first and third quarters of each fiscal year on Form NPORT-P. This filing is available free of charge on the SEC website. Additionally, the list of portfolio holdings is available by calling AFS.
This report is for the information of shareholders of Washington Mutual Investors Fund, but it also may be used as sales literature when preceded or accompanied by the current prospectus or summary prospectus, which gives details about charges, expenses, investment objectives and operating policies of the fund. If used as sales material after December 31, 2019, this report must be accompanied by an American Funds statistical update for the most recently completed calendar quarter.
Standard & Poor’s 500 Composite Index (“Index”) is a product of S&P Dow Jones Indices LLC and/or its affiliates and has been licensed for use by Capital Group. Copyright © 2019 S&P Dow Jones Indices LLC, a division of S&P Global, and/or its affiliates. All rights reserved. Redistribution or reproduction in whole or in part are prohibited without written permission of S&P Dow Jones Indices LLC.
American Funds Distributors, Inc., member FINRA.
The Capital Advantage®
Since 1931, Capital Group, home of American Funds, has helped investors pursue long-term investment success. Our consistent approach — in combination with The Capital SystemSM— has resulted in superior outcomes.
| | Aligned with investor success |
| | We base our decisions on a long-term perspective, which we believe aligns our goals with the interests of our clients. Our portfolio managers average 27 years of investment experience, including 20 years at our company, reflecting a career commitment to our long-term approach.1 |
| | |
| | The Capital System |
| | The Capital System combines individual accountability with teamwork. Funds using The Capital System are divided into portions that are managed independently by investment professionals with diverse backgrounds, ages and investment approaches. An extensive global research effort is the backbone of our system. |
| | |
| | American Funds’ superior outcomes |
| | Equity funds have beaten their Lipper peer indexes in 92% of 10-year periods and 99% of 20-year periods.2Fixed income funds have helped investors achieve diversification through attention to correlation between bonds and equities.3Fund management fees have been among the lowest in the industry.4 |
| | 1 | Portfolio manager experience as of December 31, 2018. |
| | 2 | Based on Class F-2 share results for rolling periods through December 31, 2018. Periods covered are the shorter of the fund’s lifetime or since the comparable Lipper index inception date (except Capital Income Builder and SMALLCAP World Fund, for which the Lipper average was used). Expenses differ for each share class, so results will vary. |
| | 3 | Based on Class F-2 share results, as of December 31, 2018. Fourteen of our 15 American Funds fixed income funds that have been in existence for the three-year period showed a three-year correlation below 0.2. Standard & Poor’s 500 Composite Index was used as an equity market proxy. Correlation based on monthly total returns. Correlation is a statistical measure of how two securities move in relation to each other. A correlation ranges from –1 to 1. A positive correlation close to 1 implies that as one security moves, either up or down, the other security will move in “lockstep,” in the same direction. A negative correlation close to –1 indicates that the securities have moved in the opposite direction. |
| | 4 | On average, our management fees were in the lowest quintile 70% of the time, based on the 20-year period ended December 31, 2018, versus comparable Lipper categories, excluding funds of funds. |
Class F-2 shares were first offered on August 1, 2008. Class F-2 share results prior to the date of first sale are hypothetical based on Class A share results without a sales charge, adjusted for typical estimated expenses. Results for certain funds with an inception date after August 1, 2008, also include hypothetical returns because those funds’ Class F-2 shares sold after the funds’ date of first offering. Please see capitalgroup.com for more information on specific expense adjustments and the actual dates of first sale.
All Capital Group trademarks mentioned are owned by The Capital Group Companies, Inc., an affiliated company or fund. All other company and product names mentioned are the property of their respective companies.

ITEM 2 – Code of Ethics
Not applicable for filing of semi-annual reports to shareholders.
ITEM 3 – Audit Committee Financial Expert
Not applicable for filing of semi-annual reports to shareholders.
ITEM 4 – Principal Accountant Fees and Services
Not applicable for filing of semi-annual reports to shareholders.
ITEM 5 – Audit Committee of Listed Registrants
Not applicable to this Registrant, insofar as the Registrant is not a listed issuer as defined in Rule 10A-3 under the Securities Exchange Act of 1934.
ITEM 6 – Schedule of Investments
Washington Mutual Investors FundSM
Investment portfolio
October 31, 2019
Common stocks 95.20%
Energy 7.27% | Shares | Value
(000) |
| Baker Hughes Co., Class A | 16,235,000 | $347,429 |
| Cabot Oil & Gas Corp. | 7,594,914 | 141,569 |
| Chevron Corp. | 11,064,794 | 1,285,065 |
| ConocoPhillips | 8,176,200 | 451,326 |
| Enbridge Inc. | 42,109,400 | 1,533,203 |
| EOG Resources, Inc. | 5,437,500 | 376,873 |
| Exxon Mobil Corp. | 19,363,000 | 1,308,358 |
| Helmerich & Payne, Inc. | 2,960,639 | 111,024 |
| Pioneer Natural Resources Co. | 5,000,000 | 615,100 |
| Royal Dutch Shell PLC, Class A (ADR) | 128,867 | 7,471 |
| Royal Dutch Shell PLC, Class B (ADR) | 27,802,350 | 1,620,599 |
| Schlumberger Ltd. | 28,562,600 | 933,712 |
| Valero Energy Corp. | 1,700,000 | 164,866 |
| | | 8,896,595 |
| Materials 3.40% | | |
| Air Products and Chemicals, Inc. | 2,736,600 | 583,607 |
| Corteva, Inc. | 14,025,913 | 370,004 |
| Dow Inc. | 23,265,833 | 1,174,692 |
| DuPont de Nemours Inc. | 11,217,379 | 739,337 |
| Linde PLC | 1,968,800 | 390,512 |
| LyondellBasell Industries NV | 3,500,000 | 313,950 |
| Nucor Corp. | 4,000,000 | 215,400 |
| Packaging Corp. of America | 1,440,632 | 157,692 |
| WestRock Co. | 5,758,000 | 215,176 |
| | | 4,160,370 |
| Industrials 14.18% | | |
| Air Lease Corp., Class A | 1,635,400 | 71,925 |
| Boeing Co. | 10,223,700 | 3,475,138 |
| Caterpillar Inc. | 3,136,000 | 432,141 |
| CSX Corp. | 19,702,300 | 1,384,481 |
| Deere & Co. | 2,405,200 | 418,841 |
| Equifax Inc. | 2,493,648 | 340,907 |
| Honeywell International Inc. | 6,126,665 | 1,058,259 |
| IDEX Corp. | 157,600 | 24,512 |
| Johnson Controls International PLC | 23,775,000 | 1,030,171 |
| Lockheed Martin Corp. | 5,441,500 | 2,049,704 |
| Masco Corp. | 4,735,000 | 218,994 |
| Nidec Corp. (ADR) | 1,041,800 | 38,442 |
| Norfolk Southern Corp. | 3,338,967 | 607,692 |
| Northrop Grumman Corp. | 8,258,400 | 2,910,921 |
| PACCAR Inc. | 3,458,300 | 263,038 |
| Parker-Hannifin Corp. | 1,150,000 | 211,013 |
| RELX PLC (ADR) | 6,252,500 | 151,248 |
| Republic Services, Inc. | 1,400,000 | 122,514 |
| Union Pacific Corp. | 6,527,690 | 1,080,072 |
Washington Mutual Investors Fund — Page 1 of 5
Common stocks (continued)
Industrials (continued) | Shares | Value
(000) |
| United Parcel Service, Inc., Class B | 6,084,000 | $700,694 |
| United Technologies Corp. | 2,919,100 | 419,124 |
| Waste Connections, Inc. | 2,624,200 | 242,476 |
| Waste Management, Inc. | 216,300 | 24,271 |
| Westinghouse Air Brake Technologies Corp. | 971,054 | 67,362 |
| | | 17,343,940 |
| Consumer discretionary 5.30% | | |
| Booking Holdings Inc.1 | 21,800 | 44,663 |
| Carnival Corp., units | 11,376,800 | 487,951 |
| Chipotle Mexican Grill, Inc.1 | 206,600 | 160,768 |
| Darden Restaurants, Inc. | 1,912,000 | 214,660 |
| Domino’s Pizza, Inc. | 57,000 | 15,482 |
| General Motors Co. | 23,540,000 | 874,746 |
| Home Depot, Inc. | 12,312,500 | 2,888,266 |
| Kontoor Brands, Inc. | 363,428 | 13,810 |
| Marriott International, Inc., Class A | 2,330,600 | 294,938 |
| McDonald’s Corp. | 296,000 | 58,223 |
| NIKE, Inc., Class B | 1,695,100 | 151,796 |
| Ross Stores, Inc. | 1,031,900 | 113,169 |
| Royal Caribbean Cruises Ltd. | 1,325,300 | 144,232 |
| Starbucks Corp. | 428,300 | 36,217 |
| VF Corp. | 6,044,000 | 497,361 |
| Wynn Resorts, Ltd. | 4,028,000 | 488,758 |
| | | 6,485,040 |
| Consumer staples 6.38% | | |
| Church & Dwight Co., Inc. | 5,926,600 | 414,506 |
| Coca-Cola Co. | 29,127,000 | 1,585,383 |
| Coca-Cola European Partners PLC | 6,736,000 | 360,443 |
| Conagra Brands, Inc. | 6,720,000 | 181,776 |
| Costco Wholesale Corp. | 3,082,000 | 915,693 |
| Hormel Foods Corp. | 11,000,000 | 449,790 |
| Keurig Dr Pepper Inc. | 18,992,580 | 534,831 |
| Kraft Heinz Co. | 2,423,900 | 78,365 |
| Mondelez International, Inc. | 10,041,300 | 526,666 |
| Nestlé SA (ADR) | 19,930,700 | 2,135,774 |
| Procter & Gamble Co. | 284,700 | 35,448 |
| Reckitt Benckiser Group PLC (ADR) | 14,289,189 | 225,341 |
| Sysco Corp. | 3,635,000 | 290,327 |
| Unilever NV | 286,300 | 16,960 |
| Walgreens Boots Alliance, Inc. | 864,400 | 47,352 |
| | | 7,798,655 |
| Health care 14.46% | | |
| Abbott Laboratories | 5,966,500 | 498,859 |
| AbbVie Inc. | 5,039,450 | 400,888 |
| Amgen Inc. | 83,200 | 17,742 |
| Anthem, Inc. | 2,320,600 | 624,427 |
| AstraZeneca PLC (ADR) | 16,202,900 | 794,428 |
| Cigna Corp. | 7,037,000 | 1,255,823 |
| CVS Health Corp. | 11,000,000 | 730,290 |
| Danaher Corp. | 3,008,900 | 414,687 |
| Edwards Lifesciences Corp.1 | 147,400 | 35,137 |
| Eli Lilly and Co. | 2,809,300 | 320,120 |
Washington Mutual Investors Fund — Page 2 of 5
Common stocks (continued)
Health care (continued) | Shares | Value
(000) |
| Gilead Sciences, Inc. | 3,772,300 | $240,333 |
| Humana Inc. | 6,572,000 | 1,933,483 |
| Johnson & Johnson | 11,734,500 | 1,549,423 |
| Merck & Co., Inc. | 35,893,000 | 3,110,487 |
| Novartis AG (ADR) | 193,000 | 16,876 |
| Novo Nordisk A/S, Class B (ADR) | 1,889,700 | 104,349 |
| Pfizer Inc. | 55,053,600 | 2,112,407 |
| Thermo Fisher Scientific Inc. | 929,700 | 280,751 |
| UnitedHealth Group Inc. | 12,222,400 | 3,088,601 |
| Zoetis Inc., Class A | 1,215,000 | 155,423 |
| | | 17,684,534 |
| Financials 15.27% | | |
| Aon PLC, Class A | 1,645,000 | 317,748 |
| Apollo Global Management, Inc., Class A | 620,000 | 25,519 |
| Bank of America Corp. | 16,552,000 | 517,581 |
| Bank of New York Mellon Corp. | 5,202,700 | 243,226 |
| BlackRock, Inc. | 3,418,874 | 1,578,494 |
| Capital One Financial Corp. | 11,808,000 | 1,101,096 |
| Chubb Ltd. | 9,028,830 | 1,376,174 |
| Citigroup Inc. | 5,500,000 | 395,230 |
| CME Group Inc., Class A | 14,265,189 | 2,935,063 |
| Discover Financial Services | 7,350,000 | 589,911 |
| Everest Re Group, Ltd. | 116,467 | 29,942 |
| Intercontinental Exchange, Inc. | 8,308,490 | 783,657 |
| JPMorgan Chase & Co. | 19,263,400 | 2,406,384 |
| KeyCorp | 10,295,000 | 185,001 |
| Marsh & McLennan Companies, Inc. | 21,134,989 | 2,190,008 |
| Moody’s Corp. | 906,600 | 200,078 |
| Nasdaq, Inc. | 4,071,395 | 406,203 |
| PNC Financial Services Group, Inc. | 16,862,700 | 2,473,758 |
| S&P Global Inc. | 952,800 | 245,813 |
| State Street Corp. | 754,156 | 49,827 |
| SunTrust Banks, Inc. | 5,503,409 | 376,103 |
| Wells Fargo & Co. | 4,947,200 | 255,424 |
| | | 18,682,240 |
| Information technology 17.88% | | |
| Accenture PLC, Class A | 209,000 | 38,753 |
| Analog Devices, Inc. | 3,484,100 | 371,510 |
| Apple Inc. | 2,044,000 | 508,465 |
| Applied Materials, Inc. | 10,306,400 | 559,225 |
| ASML Holding NV (New York registered) | 4,069,500 | 1,066,087 |
| Broadcom Inc. | 12,805,300 | 3,750,032 |
| Intel Corp. | 61,868,847 | 3,497,446 |
| Jack Henry & Associates, Inc. | 2,639,700 | 373,676 |
| Mastercard Inc., Class A | 3,265,700 | 903,978 |
| Microsoft Corp. | 50,223,000 | 7,200,472 |
| NetApp, Inc. | 3,162,100 | 176,698 |
| QUALCOMM Inc. | 5,726,850 | 460,668 |
| SAP SE (ADR) | 513,700 | 68,106 |
| TE Connectivity Ltd. | 2,600,000 | 232,700 |
| Texas Instruments Inc. | 4,799,000 | 566,234 |
Washington Mutual Investors Fund — Page 3 of 5
Common stocks (continued)
Information technology (continued) | Shares | Value
(000) |
| Visa Inc., Class A | 10,389,700 | $1,858,302 |
| VMware, Inc., Class A | 1,500,000 | 237,405 |
| | | 21,869,757 |
| Communication services 7.07% | | |
| Activision Blizzard, Inc. | 8,823,600 | 494,386 |
| Alphabet Inc., Class A1 | 637,000 | 801,856 |
| Alphabet Inc., Class C1 | 366,250 | 461,515 |
| CBS Corp., Class B | 4,000,000 | 144,160 |
| Cinemark Holdings, Inc. | 5,700,000 | 208,620 |
| Comcast Corp., Class A | 78,866,500 | 3,534,797 |
| Facebook, Inc., Class A1 | 5,395,300 | 1,034,009 |
| Nexstar Media Group, Inc. | 1,060,000 | 103,128 |
| Verizon Communications Inc. | 30,860,400 | 1,866,128 |
| | | 8,648,599 |
| Utilities 2.84% | | |
| CMS Energy Corp. | 10,129,568 | 647,482 |
| DTE Energy Co. | 5,050,000 | 642,966 |
| Edison International | 3,877,479 | 243,893 |
| Exelon Corp. | 4,932,500 | 224,379 |
| Public Service Enterprise Group Inc. | 16,356,527 | 1,035,532 |
| Sempra Energy | 4,689,100 | 677,622 |
| | | 3,471,874 |
| Real estate 1.15% | | |
| Digital Realty Trust, Inc. REIT | 6,562,035 | 833,641 |
| Simon Property Group, Inc. REIT | 2,390,000 | 360,125 |
| Ventas, Inc. REIT | 3,239,700 | 210,905 |
| | | 1,404,671 |
| Total common stocks (cost: $78,281,750,000) | | 116,446,275 |
Convertible stocks 0.52%
Health care 0.05% | | |
| Danaher Corp., Series A, 4.75% cumulative convertible preferred 2022 | 59,109 | 65,630 |
| Information technology 0.26% | | |
| Broadcom Inc., Series A, 8.00% cumulative convertible preferred 2022 | 291,000 | 315,159 |
| Utilities 0.21% | | |
| Dominion Energy, Inc., Series A units, 7.25% convertible preferred 2022 | 1,610,000 | 172,608 |
| DTE Energy Co., units, 6.25% convertible preferred 2022 | 1,730,000 | 87,849 |
| | | 260,457 |
| Total convertible stocks (cost: $605,060,000) | | 641,246 |
Washington Mutual Investors Fund — Page 4 of 5
Short-term securities 4.32%
Money market investments 4.32% | Shares | Value
(000) |
| Capital Group Central Cash Fund 1.92%2 | 52,901,404 | $5,290,669 |
| Total short-term securities (cost: $5,289,714,000) | | 5,290,669 |
| Total investment securities100.04% (cost: $84,176,524,000) | | 122,378,190 |
| Other assets less liabilities(0.04%) | | (54,511) |
| Net assets100.00% | | $122,323,679 |
| 1 | Security did not produce income during the last 12 months. |
| 2 | Rate represents the seven-day yield at 10/31/2019. |
| Key to abbreviation |
| ADR = American Depositary Receipts |
Additional financial disclosures are included in the fund’s current shareholder report and should be read in conjunction with this report.
Investments are not FDIC-insured, nor are they deposits of or guaranteed by a bank or any other entity, so they may lose value.
Investors should carefully consider investment objectives, risks, charges and expenses. This and other important information is contained in the fund prospectus and summary prospectus, which can be obtained from your financial professional and should be read carefully before investing. You may also call American Funds Service Company (AFS) at (800) 421-4225 or visit the Capital Group website at capitalgroup.com.
All Capital Group trademarks mentioned are owned by The Capital Group Companies, Inc., an affiliated company or fund. All other company and product names mentioned are the property of their respective companies.
American Funds Distributors, Inc., member FINRA.
© 2019 Capital Group. All rights reserved.
| MFGEFPX-001-1219O-S73076 | Washington Mutual Investors Fund — Page 5 of 5 |
ITEM 7 – Disclosure of Proxy Voting Policies and Procedures for Closed-End Management Investment Companies
Not applicable to this Registrant, insofar as the Registrant is not a closed-end management investment company.
ITEM 8 – Portfolio Managers of Closed-End Management Investment Companies
Not applicable to this Registrant, insofar as the Registrant is not a closed-end management investment company.
ITEM 9 – Purchases of Equity Securities by Closed-End Management Investment Company and Affiliated Purchasers
Not applicable to this Registrant, insofar as the Registrant is not a closed-end management investment company.
ITEM 10 – Submission of Matters to a Vote of Security Holders
There have been no material changes to the procedures by which shareholders may recommend nominees to the Registrant’s board of trustees since the Registrant last submitted a proxy statement to its shareholders. The procedures are as follows. The Registrant has a nominating and governance committee comprised solely of persons who are not considered ‘‘interested persons’’ of the Registrant within the meaning of the Investment Company Act of 1940, as amended. The committee periodically reviews such issues as the board’s composition, responsibilities, committees, compensation and other relevant issues, and recommends any appropriate changes to the full board of trustees. While the committee normally is able to identify from its own resources an ample number of qualified candidates, it will consider shareholder suggestions of persons to be considered as nominees to fill future vacancies on the board. Such suggestions must be sent in writing to the nominating and governance committee of the Registrant, c/o the Registrant’s Secretary, and must be accompanied by complete biographical and occupational data on the prospective nominee, along with a written consent of the prospective nominee for consideration of his or her name by the nominating and governance committee.
ITEM 11 – Controls and Procedures
| (a) | The Registrant’s Principal Executive Officer and Principal Financial Officer have concluded, based on their evaluation of the Registrant’s disclosure controls and procedures (as such term is defined in Rule 30a-3 under the Investment Company Act of 1940), that such controls and procedures are adequate and reasonably designed to achieve the purposes described in paragraph (c) of such rule. |
| | |
| (b) | There were no changes in the Registrant’s internal controls over financial reporting (as defined in Rule 30a-3(d) under the Investment Company Act of 1940) that occurred during the Registrant’s semi-annual period covered by this report that has materially affected, or is reasonably likely to materially affect, the Registrant’s internal control over financial reporting. |
ITEM 12 – Exhibits
| (a)(1) | Not applicable for filing of semi-annual reports to shareholders. |
| | |
| (a)(2) | The certifications required by Rule 30a-2 of the Investment Company Act of 1940 and Sections 302 and 906 of the Sarbanes-Oxley Act of 2002 are attached as exhibits hereto. |
SIGNATURES
Pursuant to the requirements of the Securities Exchange Act of 1934 and the Investment Company Act of 1940, the Registrant has duly caused this report to be signed on its behalf by the undersigned, thereunto duly authorized.
| | WASHINGTON MUTUAL INVESTORS FUND |
| | |
| | By__/s/ Paul F. Roye____________________ |
| | Paul F. Roye, Executive Vice President and Principal Executive Officer |
| | |
| | Date: December 31, 2019 |
Pursuant to the requirements of the Securities Exchange Act of 1934 and the Investment Company Act of 1940, this report has been signed below by the following persons on behalf of the Registrant and in the capacities and on the dates indicated.
| By__/s/ Paul F. Roye_________________ |
Paul F. Roye, Executive Vice President and Principal Executive Officer |
| |
| Date: December 31, 2019 |
| By ___/s/ Brian C. Janssen __________ |
Brian C. Janssen, Treasurer and Principal Financial Officer |
| |
| Date: December 31, 2019 |