Washington Mutual Investors Fund
Annual report for the year ended
April 30, 2006
Washington Mutual Investors FundSMseeks to provide income and growth of principal through investments in quality common stocks.
This Fund is one of the 29 American Funds. The organization ranks among the nation’s three largest mutual fund families. For nearly 75 years, Capital Research and Management Company,SM the American Funds adviser, has invested with a long-term focus based on thorough research and attention to risk.
Contents | |
Letter to shareholders | 1 |
Investment adviser’s report | 2 |
The value of a long-term perspective | 3 |
The challenge of change Navigating carefully in a stock market that never stops moving | 6 |
Investment portfolio | 12 |
Financial statements | 18 |
Fund Directors, Advisory Board and officers | 32 |
| |
Figures shown in this report are past results for Class A shares (unless otherwise indicated) and are not predictive of results in future periods. Fund results shown (unless otherwise indicated) are at net asset value. If a sales charge (maximum 5.75%) had been deducted, the results would have been lower. Current and future results may be lower or higher than those shown. For the most current information and month-end results, visit americanfunds.com. Share prices and returns will vary, so investors may lose money. Investing for short periods makes losses more likely. Investments are not FDIC-insured, nor are they deposits of or guaranteed by a bank or any other entity.
Here are returns on a $1,000 investment with all distributions reinvested for periods ended March 31, 2006 (the most recent calendar quarter):
| | | 1 year | 5 years | 10 years |
Class A shares | | | | |
Reflecting 5.75% maximum sales charge | | | | |
Average annual total return | | — | +4.35% | +9.47% |
Cumulative total return | | +3.42% | +23.72% | +147.04% |
The Fund’s investment adviser and business manager each waived 5% of their management fees from September 1, 2004 through March 31, 2005, and increased the waivers to 10% on April 1, 2005. Fund results shown reflect the waivers, without which they would have been lower. Please see the Financial Highlights table on page 25 for details.
Other share class results and important information can be found on page 29.
On the cover: Mount Vernon, George Washington’s home, overlooking the Potomac River.
Fellow shareholders: 
During your Fund’s 2006 fiscal year ended April 30, the U.S. stock market performed quite well even in the face of some negative macroeconomic developments. The Federal Reserve continued its anti-inflation strategy of raising the federal funds rate by one-quarter of 1% eight times. After the fiscal year was over, the Federal Reserve raised the key rate one more time on May 10 — from 4.75% to 5%. Investors were also concerned about rising prices for oil, gas and other commodities. While the stock market remained strong through the end of our fiscal year, subsequently, the market has lost some of its gains.
The Fund posted a total return of 13.1% during the 12 months ended April 30, 2006, compared with a total return of 15.4% for the unmanaged Standard & Poor’s 500 Composite Index, a broad measure of large-company, primarily U.S. stocks. The last six months were particularly strong with Washington Mutual’s total return of 10.0% exceeding a return of 9.6% for the S&P 500. Over longer stretches of time, the Fund continued to outpace the S&P 500 by a significant margin.
Cumulative total returns (for periods ended April 30, 2006) |
| | | 1 year | 5 years | 10 years |
Washington Mutual Investors Fund | | +13.1% | +27.7% | +166.5% |
Standard & Poor’s 500 Composite Index1 | | +15.4% | +14.2% | +135.4% |
| | |
Washington Mutual’s lifetime results (July 31, 1952 - April 30, 2006) |
| | Average annual total return |
Washington Mutual Investors Fund | | +12.8% |
Standard & Poor’s 500 Composite Index1 | | +11.3% |
Consumer Price Index (inflation)2 | | +3.8% |
1The S&P 500 is unmanaged and does not reflect sales charges, commissions or expenses. 2Computed from data supplied by the U.S. Department of Labor, Bureau of Statistics. | | | |
It is worth noting that the Fund’s 1.5 percentage points advantage in average annual total return over the S&P 500 for the Fund’s lifetime translates into a significant difference in the account balance for an individual who invested in the Fund at inception. This difference is reflected in the mountain chart on page 3 of this report.
Washington Mutual has always emphasized the importance of dividends, and it is gratifying to report that 98 companies, or 70% of the approximately 140 held at the fiscal year end, increased dividend payments during the fiscal year. As a result, the Fund was able to raise its dividend twice during the fiscal year to a quarterly rate of 16 cents per share for Class A shares. During the year, shareholders received dividends totaling 62 cents and a long-term capital gain distribution of 43 cents.
Since our last report to you at October 31, 2005, two new companies appeared in the portfolio: Entergy and State Street. Fifteen companies have been eliminated: AFLAC, Applera, Baxter International, Cinergy, Consolidated Edison, Dana, DTE Energy, Guidant, International Paper, Jefferson-Pilot, Knight-Ridder, Newell Rubbermaid, SBC Communications, Schering Plough and Sunoco.
As always, we are pleased to hear your comments and questions.
Cordially, | | |
| | James H. Lemon, Jr. Vice Chairman of the Board | Jeffrey L. Steele President of the Fund |
June 1, 2006
For current information about the Fund, visit americanfunds.com.
Investment adviser’s report
The U.S. economy grew briskly in the 2006 fiscal year fueled by strong growth in personal income, gains in housing and stepped-up spending by both the corporate and government sectors. Despite rising interest rates, hurricane destruction on the Gulf Coast and a spike in oil and other commodities prices, the U.S. economy continued to expand into its fifth year of recovery. Corporate profits increased at double-digit rates and corporate profit margins remained at high levels.
In this favorable environment, the value of an investment in Washington Mutual Investors Fund, with distributions reinvested, rose 13.1% for the one-year period ended April 30, 2006. Even though the Fund’s results were strong on an absolute basis, Washington Mutual trailed the unmanaged Standard & Poor’s 500 Composite Index, which gained 15.4%. As shown in the table on page 1, the Fund’s cumulative total return has outpaced the S&P 500 for the five- and 10-year periods and over its lifetime.
The economic picture and outlook
Gross domestic product grew at an annual rate of 5.3% in the first quarter of the 2006 calendar year. Consumer spend-ing increased 5.2%. Business investment increased at a 9.3% rate.
Earnings of the S&P 500 companies continued strong with an estimated average annual profit increase of 14% for the first quarter of the 2006 calendar year, setting a new record of 16 consecutive quarters of year-over-year double-digit earnings growth. The earnings growth was broadly based with nine of the S&P 500’s 10 industry sectors registering earnings growth. The profits reflect both the economy’s strength and extensive cost cutting during the 2001 recession and 2000-2002 bear market. During the past year, the economic recovery has been aided by broad and strong worldwide corporate spending. Responding to expanding demands of customers in India, China and other developing nations, companies have invested in construction, infrastructure and business development.
Short-term interest rates continued to rise over the past 12 months. Long-term rates also started to rise in early 2006. After the Fund’s fiscal year closed, the Federal Reserve increased the federal funds rate one quarter of 1% to 5% on May 10. The action was the Fed’s 16th consecutive increase of the key rate from its low of 1% in June 2004. In a statement accompanying the increase, the Fed struck a careful balance between concern about inflation and a willingness to consider pausing in its rate-raising strategy. The Fed laid out a forecast of slowing growth that could allow it to pause on rate increases. Growth has been "quite strong," the Fed said but will "likely moderate to a more sustainable pace partly reflecting a gradual cooling of the housing market" and increases in interest rates and energy prices.
The Fund’s investments
The Fund’s five largest investment sectors at fiscal year-end as a percentage of net assets were Financials (23.0%), Industrials (12.8%), Health care (10.8%), Energy (10.8%) and Consumer discretionary (8.4%). Energy, industrial and financial stocks helped the Fund the most during the past year, powered by the strong economy and the worldwide demand for energy and rising oil and gas prices. Leading contributors among the Fund’s 10 largest investments included JPMorgan Chase (+27.9%) and BellSouth (+27.5%), which is being acquired by the new AT&T. Among other holdings, Schlumberger (+102.1%), Halliburton (+87.9%), Fluor (+80.2%), Caterpillar (+72.0%) and Marathon Oil (+70.4%) made significant contributions to results.
After a sharp run-up in prices during previous years, many utility stocks declined in price. Pharmaceutical companies lagged the market because of a lack of blockbuster drugs and company-specific problems. Pharmaceutical companies that detracted from results were Johnson & Johnson (-14.6%), Abbot Laboratories (-13.1%) and Eli Lilly (-9.5%).
Smaller companies, starting from a more depressed valuation, posted better results than large blue chip companies in recent years. We now believe that many of the nation’s largest and most successful companies with solid market positions and strong balance sheets are selling at especially attractive prices and that their stocks will be good long-term investments providing growing income as well as growth of capital.
We caution shareholders from becoming overly enthusiastic about future returns based on the Fund’s recent results. As always, we will continue our strategy of seeking to invest in quality companies that meet strict standards of financial soundness including a consistent record of paying dividends. This approach has served the Fund well in all kinds of markets and we believe it will continue to do so in the years ahead.
— Capital Research and Management Company
For current information about the Fund, visit americanfunds.com.
The value of a long-term perspective
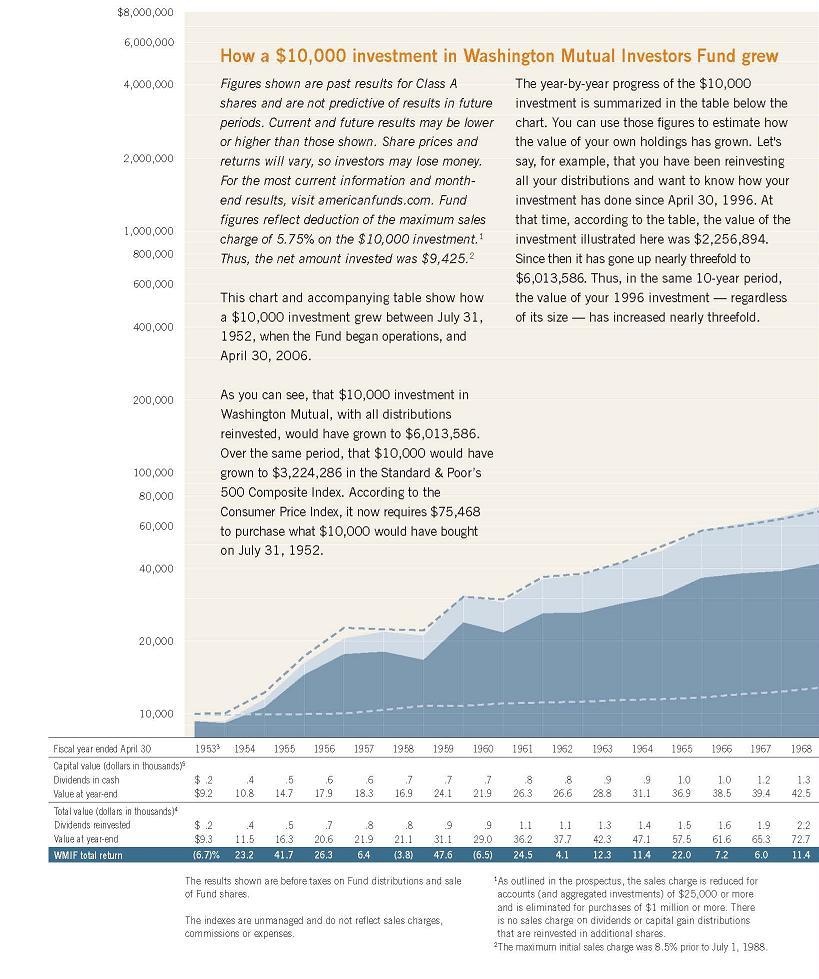

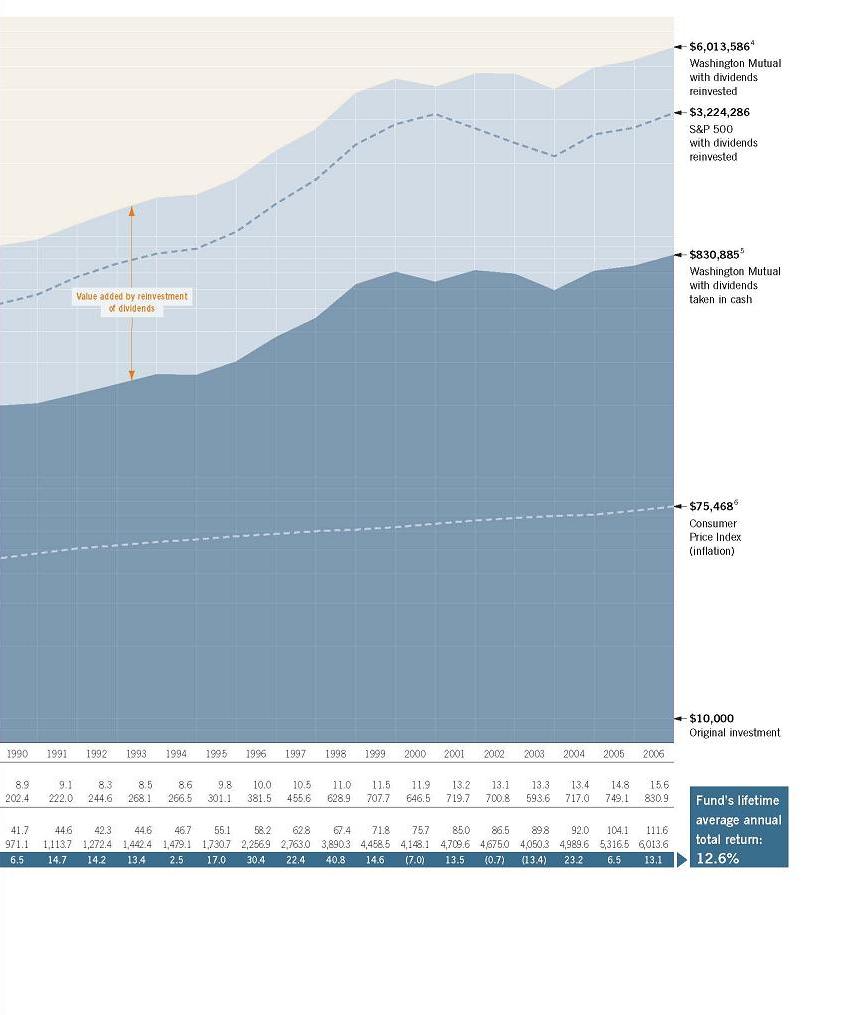
Below are the plot points for the mountain chart image featured above.
| WASHINGTON MUTUAL INVESTORS FUND | | | | | | | |
| MOUNTAIN CHART AND INDEX PLOT POINTS | | | | | | | |
| | | | | | | | |
| Results of a $10,000 investment in WMIF, the S&P500, and the CPI. | | | | | | | |
| July 31, 1952 through April 30, 2006 | | | | | | | |
| | | | | | | | |
| Year | CAPITAL VALUE3 | | TOTAL VALUE2 | | | | |
| ended | Dividends in | | Dividends | | TOTAL | | |
| April 30 | Cash | WMIF1,3 | Reinvested | WMIF1,2 | RETURN | S&P500 | CPI5 |
| | | | | | | | |
| 07/31/52 | | $9,425 | | $9,425 | | $10,000 | $10,000 |
19536 | $170 | 9,161 | $170 | 9,330 | -6.7% | 10,094 | 9,963 |
| 1954 | 434 | 10,773 | 449 | 11,494 | 23.2 | 12,282 | 10,037 |
| 1955 | 500 | 14,665 | 542 | 16,288 | 41.7 | 17,295 | 10,000 |
| 1956 | 580 | 17,851 | 654 | 20,565 | 26.3 | 22,938 | 10,075 |
| 1957 | 647 | 18,304 | 756 | 21,877 | 6.4 | 22,520 | 10,449 |
| 1958 | 680 | 16,928 | 825 | 21,055 | -3.8 | 22,269 | 10,824 |
| 1959 | 701 | 24,125 | 885 | 31,071 | 47.6 | 30,569 | 10,861 |
| 1960 | 728 | 21,871 | 948 | 29,041 | -6.5 | 29,850 | 11,049 |
| 1961 | 815 | 26,300 | 1,097 | 36,167 | 24.5 | 37,071 | 11,161 |
| 1962 | 824 | 26,592 | 1,146 | 37,654 | 4.1 | 38,158 | 11,311 |
| 1963 | 891 | 28,838 | 1,279 | 42,278 | 12.3 | 42,296 | 11,423 |
| 1964 | 923 | 31,149 | 1,369 | 47,109 | 11.4 | 49,698 | 11,573 |
| 1965 | 956 | 36,940 | 1,462 | 57,490 | 22.0 | 57,450 | 11,760 |
| 1966 | 1,048 | 38,487 | 1,648 | 61,603 | 7.2 | 60,563 | 12,097 |
| 1967 | 1,176 | 39,424 | 1,906 | 65,270 | 6.0 | 64,731 | 12,397 |
| 1968 | 1,331 | 42,481 | 2,231 | 72,692 | 11.4 | 69,365 | 12,884 |
| 1969 | 1,516 | 48,408 | 2,627 | 85,576 | 17.7 | 75,988 | 13,596 |
| 1970 | 1,605 | 39,049 | 2,874 | 71,603 | -16.3 | 61,834 | 14,419 |
| 1971 | 1,711 | 48,769 | 3,193 | 93,387 | 30.4 | 81,718 | 15,019 |
| 1972 | 1,779 | 47,991 | 3,455 | 95,521 | 2.3 | 87,267 | 15,543 |
| 1973 | 1,818 | 43,290 | 3,671 | 89,522 | -6.3 | 89,214 | 16,330 |
| 1974 | 1,858 | 40,682 | 3,907 | 87,956 | -1.7 | 77,959 | 17,978 |
| 1975 | 2,185 | 42,855 | 4,828 | 98,315 | 11.8 | 79,061 | 19,813 |
| 1976 | 2,350 | 53,771 | 5,498 | 129,949 | 32.2 | 95,785 | 21,011 |
| 1977 | 2,510 | 55,449 | 6,171 | 140,348 | 8.0 | 96,702 | 22,472 |
| 1978 | 2,658 | 54,228 | 6,849 | 144,340 | 2.8 | 100,121 | 23,933 |
| 1979 | 2,870 | 58,180 | 7,785 | 163,075 | 13.0 | 110,959 | 26,442 |
| 1980 | 3,203 | 56,032 | 9,167 | 165,848 | 1.7 | 122,446 | 30,337 |
| 1981 | 4,784 | 72,410 | 14,603 | 230,424 | 38.9 | 160,796 | 33,371 |
| 1982 | 4,097 | 69,851 | 13,327 | 235,768 | 2.3 | 148,977 | 35,543 |
| 1983 | 4,497 | 101,855 | 15,517 | 362,293 | 53.7 | 221,825 | 36,929 |
| 1984 | 4,840 | 100,116 | 17,527 | 373,509 | 3.1 | 225,698 | 38,614 |
| 1985 | 5,465 | 115,473 | 20,783 | 452,498 | 21.1 | 265,541 | 40,037 |
| 1986 | 6,110 | 152,209 | 24,380 | 623,768 | 37.9 | 361,778 | 40,674 |
| 1987 | 6,781 | 180,960 | 28,228 | 771,949 | 23.8 | 457,672 | 42,210 |
| 1988 | 7,116 | 167,083 | 30,815 | 742,856 | -3.8 | 427,911 | 43,858 |
| 1989 | 6,183 | 198,139 | 27,838 | 911,609 | 22.7 | 525,847 | 46,105 |
| 1990 | 8,920 | 202,429 | 41,689 | 971,051 | 6.5 | 581,168 | 48,277 |
| 1991 | 9,136 | 222,016 | 44,574 | 1,113,747 | 14.7 | 683,361 | 50,637 |
| 1992 | 8,319 | 244,607 | 42,315 | 1,272,372 | 14.2 | 779,015 | 52,247 |
| 1993 | 8,468 | 268,131 | 44,625 | 1,442,389 | 13.4 | 850,855 | 53,933 |
| 1994 | 8,583 | 266,513 | 46,719 | 1,479,112 | 2.5 | 896,027 | 55,206 |
| 1995 | 9,790 | 301,054 | 55,060 | 1,730,694 | 17.0 | 1,052,264 | 56,891 |
| 1996 | 10,008 | 381,514 | 58,187 | 2,256,894 | 30.4 | 1,369,880 | 58,539 |
| 1997 | 10,506 | 455,551 | 62,763 | 2,763,032 | 22.4 | 1,714,024 | 60,000 |
| 1998 | 11,033 | 628,864 | 67,443 | 3,890,253 | 40.8 | 2,417,442 | 60,861 |
| 1999 | 11,527 | 707,654 | 71,812 | 4,458,483 | 14.6 | 2,945,129 | 62,247 |
| 2000 | 11,935 | 646,507 | 75,684 | 4,148,130 | -7.0 | 3,243,332 | 64,157 |
| 2001 | 13,153 | 719,687 | 85,030 | 4,709,580 | 13.5 | 2,822,817 | 66,255 |
| 2002 | 13,116 | 700,823 | 86,458 | 4,674,962 | -0.7 | 2,466,687 | 67,341 |
| 2003 | 13,345 | 593,597 | 89,753 | 4,050,310 | -13.4 | 2,138,513 | 68,839 |
| 2004 | 13,383 | 717,050 | 92,016 | 4,989,599 | 23.2 | 2,627,509 | 70,412 |
| 2005 | 14,846 | 749,077 | 104,079 | 5,316,457 | 6.5 | 2,793,876 | 72,884 |
| 2006 | 15,614 | 830,885 | 111,648 | 6,013,586 | 13.1 | 3,224,286 | 75,468 |
| | 280,021 | | 1,450,265 | | | | |
| | | | | | | | |
1These figures, unlike those shown elsewhere in this report, reflect payment of the maximum sales charge of | | | |
| 5.75% on the $10,000 investment. Thus, the net amount invested was $9,425. As outlined in the prospectus, | | | |
| the sales charge is reduced for larger investments of $25,000 or more. There is no sales charge on dividends | | | |
| or capital gain distributions that are reinvested in additional shares. The maximum sales charge was 8.5% prior | | | |
| to July 1, 1988. Results shown do not take into account income or capital gain taxes. | | | |
| | | | | | | | |
| 2Total value includes reinvested dividends of $1,450,265 and reinvested capital gain distributions of $2,111,707. | | | |
| | | | | | | | |
| 3Capital value includes reinvested capital gain distributions of $378,683 but does not reflect income dividends of | | | |
| $280,021 taken in cash. | | | | | | | |
| | | | | | | | |
| 4Computed from data supplied by the U.S. Department of Labor, Bureau of Labor Statistics. | | | | | |
| | | | | | | | |
| 5Since the Fund's inception on July 31, 1952 | | | | |
The challenge of change
Navigating carefully in a stock market
that never stops moving
Each day when you look in the mirror, your reflection probably looks the same as it did the day before. Pull out your high-school yearbook picture, though, and it’s obvious that you have been changing gradually over the years.
Similarly, Washington Mutual Investors Fund looks pretty much the same on a day-to-day or even year-to-year basis. The Fund’s annual portfolio turnover rate has averaged less than 20% for more than two decades, while, according to the Investment Company Institute, the median for other mutual funds that invest in stocks has typically been about 60% or higher. Yet over the years that pass between when you start investing for retirement and when you hang up your hat, the Fund’s complexion changes. It must, for the Fund to take advantage of long-term investment opportunities in American commerce and industry.
Consider how different the world is now than it was 25 years ago. In 1981, personal computers were a novelty and for most people e-mail and the Internet were still more than a decade away. Nearly every long-distance phone call went through AT&T, portable phones were so bulky and complex that they came with their own suitcases, and music CDs hadn’t been introduced yet. And that’s just the past quarter century! Go back to when the Fund began, in 1952: nearly every U.S. car was built in Detroit, no highway network or fast-food chains spanned the nation, airplanes still had propellers, and television was almost exclusively black-and-white.
As the world changes, so do the fates and fortunes of companies. The Fund’s investment adviser, Capital Research and Management Company, moves the portfolio toward companies that it believes are likely to help the Fund fulfill its objective: to provide shareholders with income and an opportunity for growth of principal through investments in quality common stocks.
Capital Research brings extensive experience and expertise to the task. It has been managing assets for nearly 75 years and is among the nation’s largest mutual fund investment advisers. Portfolio counselors and research analysts work from research offices around the world, studying companies and economies firsthand.
The eight portfolio counselors who manage most of Washington Mutual’s assets (the Fund’s research analysts are responsible for a portion as well) have an average tenure of almost 15 years in their positions with this Fund — longer than more than three-quarters of all similar funds have been in business.
"Global research can be crucialwhen evaluating U.S. stocks." — Jim Dunton |
| |
|
Whatever became of |
Otis Elevator? Otis Elevator was among the Fund’s larger holdings back in 1953. United Technologies — a current Fund holding — acquired it in 1975. Other United Technologies subsidiaries include Carrier (air conditioning), Sikorsky (helicopters) and Pratt & Whitney (aircraft engines). |
|
Global perspective is important even for a U.S. portfolio
Since Washington Mutual is invested overwhelmingly in U.S. companies, all of its portfolio counselors are based in this country. However, the portfolio counselors often benefit from the insights of Capital Research colleagues working in other countries. Jim Dunton — who has been with the Fund over 34 years (seven as a research analyst and almost 28 as a portfolio counselor) — observes, "Global research can be crucial when evaluating U.S. stocks. In the pharma-ceutical industry, for instance, the top company in terms of sales is a U.S. company — Pfizer. But many of its largest competitors are foreign corporations, so we have to know what’s going on with them, too."
Capital Research’s investment professionals began traveling the world in search of global perspectives during the 1950s, the decade when the Fund was introduced. As a result, the analysts and portfolio counselors have often been able to foresee the potential effect of global competition before it has a major impact on U.S. industries.
Dale Harvey, who has been one of Washington Mutual’s portfolio counselors since 1997, says, "In the apparel industry, for example, Capital’s research people around the world have helped us stay on top of VF Corp. (the company behind the Lee, Wrangler and Nautica brands, among others), as it successfully moved most of its manufacturing overseas. Meanwhile, our researchers’ insights into global challengers in the textiles business led us to profitably sell our holdings in one-time industry leaders Burlington Industries and J.P. Stevens. Both those companies were swept under by competitors outside the U.S."
Washington office keeps an eye on Congress
Of course, it’s important to cover the home front, too. The Capital organization’s Washington, D.C., office helps to keep portfolio counselors informed about various bills coming before Congress and which companies might be affected. For example, when an industry is deregulated — as the airline, energy and electric utilities industries, among others, have been — the advent of competition forces change. Companies that may have become complacent discover nimble rivals nipping at their heels.
The banking industry dramatically illus-trates the impact changes in laws can have. Until the 1990s, U.S. banks had been relatively small and restricted to operating within states or regions. But then Congress decided to permit interstate banking and consolidation began. "Around that time, our research analysts were watching a North Carolina bank named NCNB as it grew by acquiring other banks until it dominated the Southeast. It became NationsBank in 1991, and we invested in 1994," Jim recalls. "We bought shares in BankAmerica, which dominated the West, in 1993. The two merged in 1998 and became Bank of America, the largest bank in the country and one of our largest holdings ever since."
Telecommunications provides another example of how changes brought on by government can affect investing in an industry. For many years, AT&T had a near-monopoly on long-distance phone service. It was the Fund’s largest holding in nine different years, particularly in the 1970s. In 1984, as a result of an anti-trust lawsuit brought by the U.S. Department of Justice, AT&T’s local phone companies were split into seven independent regional companies — the so-called "Baby Bells." Over the years since the breakup, several of the surviving Baby Bells, as well as AT&T, have been, at different times, among the Fund’s largest holdings. Most of the original Baby Bells have merged since the AT&T breakup. Last year, one of the seven — Southwestern Bell, aka SBC — bought what was left of AT&T. It took over the classic AT&T name and earlier this year announced the acquisition of BellSouth, another of the seven. "We’ve been following AT&T and all its parts for decades," Alan Berro, a portfolio counselor for Washington Mutual since 1998, observes. "One of the advantages of following companies for a long time is that when there are spin-offs or acquisitions, we often already know a lot about the long-term vision of various managers."
| Whatever became of | |
Chemical Bank? Started in 1823 as The New York Chemical Manufacturing Company, this firm moved into banking a year later. Among competitors it eventually acquired were Manufacturer’s Hanover Trust and Chase Manhattan, and it took on the latter’s name in 1996. In 2000, it bought J.P. Morgan & Co. — another large bank — and changed its name to JPMorgan Chase, as it is known today. As of April 30, 2006, JPMorgan Chase was the Fund’s second largest holding. |
Industry experts can make sense of conglomerates
The Fund invests only in large companies, and it’s not unusual for such companies to be broadly diversified. GE is a case in point. It’s among the leaders in dozens of industries ranging from jet engines, locomotives and appliances to healthcare, broadcasting and insurance. "As GE has grown, it’s become incredibly complicated," says Steve Bepler, who has been a portfolio counselor for Washington Mutual for 26 years. "So we have experts evaluating each of its operations independently. That means, for instance, that an airline analyst is involved, because the company is the largest maker of jet engines. A finance industry analyst watches GE Consumer Finance, which provides financial services for people in nearly 50 countries. GE is the leading manufacturer of locomotives, so a railroad analyst assesses how demand in that industry will affect the company. A medical equipment analyst looks at the part of GE that makes the world’s fastest CAT-scan machines. When you’re looking at a big company, you have to analyze each component. No one person is an expert in all the parts, so our specialists can make a big difference."
Of course, industry specialists constantly follow changes within individual industries. Forty years ago, one of the Fund’s holdings was F.W. Woolworth, the five-and-dime stores once ubiquitous on Main Street across America. As suburban living became more and more popular, "big box" stores such as Wal-Mart overtook Woolworth. Capital Research’s retail store analysts saw the change coming. The Fund sold its position in Woolworth (which has since been reincorporated as FootLocker) in 1985, and it began investing in Wal-Mart in 1995 — two years before Wal-Mart replaced Woolworth in the Dow Jones Industrial Average.
Whatever became of |
Standard Oil of New Jersey? Standard Oil Company (New Jersey) was among the holdings listed in Washington Mutual’s first annual report, in 1953. Esso ("S.O." for Standard Oil) and Mobil stations are now part of ExxonMobil, the result of a 1999 merger between these two oil companies. So are stations once labeled Humble and Socony (which stood for "Standard Oil Company of New York"). ExxonMobil was the Fund’s fifth-largest holding as of April 30, 2006. |
|
Screening process helps Fund avoid fads
Relatively few of the more than 12,000 stocks listed on U.S. exchanges meet the Fund’s eligibility standards. The criteria were originally designed for fiduciaries — people who are legally responsible for the prudent administration of trust funds. While specifics vary from industry to industry, the rules have always limited the Fund to investing in companies with strong financial records. Most of the requirements have remained unchanged since the Fund began, although one was modified slightly in early 2000 to enable the Fund to invest up to 5% of assets in stocks that don’t pay dividends (provided that the companies meet other substantially higher standards).
Washington Mutual’s strong emphasis on dividend-paying companies meant that the Fund did not fully participate in the technology boom of the late 1990s — because most technology companies did not pay dividends — and results in 1998 and 1999 trailed those of the market, as measured by the unmanaged Standard & Poor’s 500 Composite Index.
Yet that short-term negative became a long-term positive. As the table below shows, over the five years from 1998 through 2002, the Fund fared far better than the S&P 500. That’s because the Fund’s rules limited its exposure to technology stocks, which crumbled in 2000.
Washington Mutual outpaced the S&P 500 over the "tech bubble" years |
| | Total returns (with distributions reinvested) |
Year ended 12/31 | Washington Mutual | S&P 500 |
| 1998 | +19.4% | +28.6% |
| 1999 | +1.2 | +21.0 |
| 2000 | +9.1 | - 9.1 |
| 2001 | +1.5 | - 11.9 |
| 2002 | - 14.9 | - 22.1 |
5-year cumulative total returns, 1998-2002 | +13.8% | - 2.9% |
| |
"We try to understand the future so we can help today’s investors meet their goals for tomorrow." — Jim Dunton | |
| |
Not only has Washington Mutual’s screening process enabled the Fund to outpace the market over the long haul (as illustrated in the chart on pages 3 through 5) but it has also helped the Fund to fare better during inevitable downturns. During every major extended market decline that has occurred during the Fund’s lifetime, Washington Mutual has produced results superior to the S&P 500 Index (see table below).
Of course, the stock market and the Fund will always experience short-term bumps. Ups and downs come with any investment in stocks, because investors are constantly re-evaluating how much a company’s shares are worth. Yet over the long haul, the Fund’s consistent, disciplined approach has clearly benefited shareholders.
Day after day, year after year, the Fund’s investment professionals fine-tune Washington Mutual’s portfolio as they reassess where industries are going and — most importantly — how individual companies are adapting.
"The names of holdings in Washington Mutual Investors Fund do change over time, but our goal does not," says Jim. "We try to understand the future so we can help today’s investors meet their goals for tomorrow."
Washington Mutual has outpaced the S&P 500 during market declines of roughly 15% or more |
S&P 500 | Washington Mutual |
High | Low | % Change* | | Net asset value % change* | Advantage |
| 1/5/53 | 9/14/53 | -14.8% | | -14.0% | +0.8% |
| 8/2/56 | 10/22/57 | -21.6 | | -19.3 | +2.3 |
| 12/12/61 | 6/26/62 | -28.0 | | -23.1 | +4.9 |
| 2/9/66 | 10/7/66 | -22.2 | | -21.2 | +1.0 |
| 11/29/68 | 5/26/70 | -36.1 | | -34.6 | +1.5 |
| 1/11/73 | 10/3/74 | -48.2 | | -37.7 | +10.5 |
| 9/21/76 | 3/6/78 | -19.4 | | -12.9 | +6.5 |
| 11/28/80 | 8/12/82 | -27.1 | | -6.4 | +20.7 |
| 8/25/87 | 12/4/87 | -33.5 | | -29.2 | +4.3 |
| 7/16/90 | 10/11/90 | -19.9 | | -18.0 | +1.9 |
| 7/17/98 | 8/31/98 | -19.3 | | -15.4 | +3.9 |
| 3/24/00 | 10/9/02 | -49.1 | | -20.6 | +28.5 |
| *Fund and index results calculated with dividends in cash. Fund results adjusted for reinvestment of capital gain distributions. |
Figures shown are past results for Class A shares and are not predictive of results in future periods. Current and future results may be lower or higher than those shown. Share prices and returns will vary, so investors may lose money. For the most current information and month-end results, visit americanfunds.com. Fund results shown are at net asset value. If a sales charge (maximum 5.75%) had been deducted, the results would have been lower.
| Whatever became of |  |
Scott Paper? The company that invented rolled toilet paper in 1890 and paper towels in 1907 was among the Fund’s largest holdings in the mid-1970s. It was folded into Kimberly-Clark, maker of Kleenex,¨ in 1995. Kimberly-Clark has been in the Fund’s portfolio off and on since 1954 and continuously since 1995. |
Investment portfolio April 30, 2006
Industry sector holdings | Percent of net assets | | Ten largest holdings | Percent of net assets |
| Financials | 23.02% | | General Electric | 3.25% |
| Industrials | 12.81 | | JPMorgan Chase | 3.11 |
| Health care | 10.77 | | Chevron | 2.98 |
| Energy | 10.75 | | Citigroup | 2.85 |
| Consumer discretionary | 8.42 | | ExxonMobil | 2.76 |
| Consumer staples | 7.57 | | AT&T | 2.52 |
| Information technology | 7.03 | | Bank of America | 2.37 |
| Telecommunication services | 6.56 | | Bristol-Myers Squibb | 2.09 |
| Utilities | 6.41 | | BellSouth | 1.96 |
| Materials | 3.46 | | Wells Fargo | 1.75 |
| Miscellaneous | .24 | | | |
| Convertible securities | .05 | | | |
| Short-term securities and other assets less liabilities | 2.91 | | | |
Common stocks --— 97.04%
| | Shares | Market value (000) | Percent of net assets |
Energy — 10.75% | | | |
| Apache Corp. | 4,000,000 | $ 284,160 | .36% |
| Baker Hughes Inc. | 3,210,000 | 259,464 | .33 |
| Chevron Corp. | 38,579,800 | 2,354,139 | 2.98 |
| ConocoPhillips | 14,765,500 | 987,812 | 1.25 |
| EOG Resources, Inc. | 5,528,500 | 388,267 | .49 |
| Exxon Mobil Corp. | 34,626,600 | 2,184,246 | 2.76 |
| Halliburton Co. | 5,385,000 | 420,838 | .53 |
| Marathon Oil Corp. | 13,312,612 | 1,056,489 | 1.34 |
| Schlumberger Ltd. | 8,130,000 | 562,108 | .71 |
| | | 8,497,523 | 10.75 |
| | | | |
Materials — 3.46% | | | |
| Air Products and Chemicals, Inc. | 4,000,000 | 274,080 | .35 |
| Alcoa Inc. | 18,200,000 | 614,796 | .78 |
| Ashland Inc. | 1,830,000 | 120,451 | .15 |
| E.I. du Pont de Nemours and Co. | 13,200,000 | 582,120 | .74 |
| MeadWestvaco Corp. | 4,219,400 | 120,295 | .15 |
| PPG Industries, Inc. | 4,100,000 | 275,192 | .35 |
| Temple-Inland Inc. | 1,400,000 | 65,016 | .08 |
| Weyerhaeuser Co. | 9,700,000 | 683,559 | .86 |
| | | 2,735,509 | 3.46 |
| | | | |
Industrials — 12.81% | | | |
| 3M Co. | 4,200,000 | 358,806 | .45 |
| Avery Dennison Corp. | 1,700,000 | 106,250 | .13 |
| Boeing Co. | 10,200,000 | 851,190 | 1.08 |
| Caterpillar Inc. | 3,500,000 | 265,090 | .34 |
| Deere & Co. | 5,318,100 | 466,823 | .59 |
| Deluxe Corp. | 2,200,000 | 52,448 | .07 |
| Dover Corp. | 1,072,543 | $ 53,359 | .07% |
| Eaton Corp. | 1,200,000 | 91,980 | .12 |
| Emerson Electric Co. | 2,700,000 | 229,365 | .29 |
| Fluor Corp. | 536,500 | 49,846 | .06 |
| General Dynamics Corp. | 2,950,000 | 193,579 | .25 |
| General Electric Co. | 74,200,000 | 2,566,578 | 3.25 |
| Illinois Tool Works Inc. | 3,600,000 | 369,720 | .47 |
| Ingersoll-Rand Co. Ltd., Class A | 3,400,000 | 148,750 | .19 |
| Lockheed Martin Corp. | 3,950,000 | 299,805 | .38 |
| Northrop Grumman Corp. | 11,150,000 | 745,935 | .94 |
| Pitney Bowes Inc. | 6,514,900 | 272,649 | .35 |
| R.R. Donnelley & Sons Co. | 6,112,300 | 205,923 | .26 |
| Raytheon Co. | 4,000,000 | 177,080 | .22 |
| Southwest Airlines Co. | 7,500,000 | 121,650 | .15 |
| Tyco International Ltd. | 19,940,000 | 525,419 | .66 |
| Union Pacific Corp. | 1,400,000 | 127,694 | .16 |
| United Parcel Service, Inc., Class B | 10,744,100 | 871,024 | 1.10 |
| United Technologies Corp. | 15,460,000 | 971,043 | 1.23 |
| | | 10,122,006 | 12.81 |
| | | | |
Consumer discretionary — 8.42% | | | |
| Best Buy Co., Inc. | 10,425,000 | 590,681 | .75 |
| Carnival Corp., units | 7,870,000 | 368,473 | .47 |
| Federated Department Stores, Inc. | 1,401,750 | 109,126 | .14 |
| Gannett Co., Inc. | 2,250,000 | 123,750 | .16 |
| Gap, Inc. | 5,710,545 | 103,304 | .13 |
| General Motors Corp. | 23,082,512 | 528,128 | .67 |
| Genuine Parts Co. | 6,020,031 | 262,774 | .33 |
| Harley-Davidson Motor Co. | 6,300,000 | 320,292 | .40 |
| Home Depot, Inc. | 4,000,000 | 159,720 | .20 |
| Johnson Controls, Inc. | 1,700,000 | 138,635 | .18 |
| Limited Brands, Inc. | 19,930,000 | 511,005 | .65 |
| Lowe’s Companies, Inc. | 21,475,000 | 1,353,999 | 1.71 |
| McDonald’s Corp. | 7,000,000 | 241,990 | .31 |
| NIKE, Inc., Class B | 1,150,000 | 94,116 | .12 |
| ServiceMaster Co. | 9,400,000 | 113,176 | .14 |
| Target Corp. | 16,250,000 | 862,875 | 1.09 |
| TJX Companies, Inc. | 17,724,700 | 427,697 | .54 |
| VF Corp. | 3,800,000 | 232,522 | .29 |
| Walt Disney Co. | 4,000,000 | 111,840 | .14 |
| | | 6,654,103 | 8.42 |
| | | | |
Consumer staples — 7.57% | | | |
| Albertson’s, Inc. | 1,250,000 | 31,663 | .04 |
| Avon Products, Inc. | 15,771,000 | 514,292 | .65 |
| Coca-Cola Co. | 19,000,000 | 797,240 | 1.01 |
| ConAgra Foods, Inc. | 5,800,000 | 131,544 | .17 |
| General Mills, Inc. | 8,040,000 | $ 396,694 | .50% |
| H.J. Heinz Co. | 10,310,000 | 427,968 | .54 |
| Kellogg Co. | 7,200,000 | 333,432 | .42 |
| Kimberly-Clark Corp. | 12,500,000 | 731,625 | .93 |
| PepsiCo, Inc. | 10,912,500 | 635,544 | .80 |
| Procter & Gamble Co. | 1,040,000 | 60,538 | .08 |
| Sara Lee Corp. | 17,420,500 | 311,304 | .39 |
| Unilever NV (New York registered) | 2,800,000 | 201,572 | .26 |
| Walgreen Co. | 10,000,000 | 419,300 | .53 |
| Wal-Mart Stores, Inc. | 21,950,000 | 988,409 | 1.25 |
| | | 5,981,125 | 7.57 |
| | | | |
Health care — 10.77% | | | |
| Abbott Laboratories | 26,550,000 | 1,134,747 | 1.43 |
| Aetna Inc. | 2,300,000 | 88,550 | .11 |
Amgen Inc.1 | 2,850,000 | 192,945 | .24 |
| Becton, Dickinson and Co. | 1,650,000 | 104,016 | .13 |
| Bristol-Myers Squibb Co. | 64,935,000 | 1,648,050 | 2.09 |
| Cardinal Health, Inc. | 10,175,000 | 685,286 | .87 |
| CIGNA Corp. | 1,090,000 | 116,630 | .15 |
| Eli Lilly and Co. | 22,845,000 | 1,208,957 | 1.53 |
| Johnson & Johnson | 6,050,000 | 354,591 | .45 |
| McKesson Corp. | 2,500,000 | 121,475 | .15 |
| Medtronic, Inc. | 7,400,000 | 370,888 | .47 |
| Merck & Co., Inc. | 27,540,000 | 947,927 | 1.20 |
| Pfizer Inc | 31,775,000 | 804,861 | 1.02 |
| Wyeth | 15,100,000 | 734,917 | .93 |
| | | 8,513,840 | 10.77 |
| | | | |
Financials — 23.02% | | | |
| Allstate Corp. | 7,068,300 | 399,288 | .51 |
| American Express Co. | 1,800,000 | 96,858 | .12 |
| American International Group, Inc. | 13,275,000 | 866,194 | 1.10 |
| Aon Corp. | 3,150,000 | 132,016 | .17 |
| Bank of America Corp. | 37,530,000 | 1,873,498 | 2.37 |
| Bank of New York Co., Inc. | 24,550,000 | 862,933 | 1.09 |
| Citigroup Inc. | 45,121,000 | 2,253,794 | 2.85 |
| Fannie Mae | 26,145,000 | 1,322,937 | 1.67 |
| Freddie Mac | 11,440,000 | 698,526 | .88 |
| Hartford Financial Services Group, Inc. | 2,000,000 | 183,860 | .23 |
| HSBC Holdings PLC (ADR) | 10,272,000 | 890,377 | 1.13 |
| J.P. Morgan Chase & Co. | 54,116,560 | 2,455,809 | 3.11 |
| Lincoln National Corp. | 9,464,842 | 549,718 | .70 |
| Marsh & McLennan Companies, Inc. | 24,070,000 | 738,227 | .93 |
| National City Corp. | 5,600,000 | 206,640 | .26 |
| SLM Corp. | 2,100,000 | 111,048 | .14 |
| St. Paul Travelers Companies, Inc. | 10,020,000 | 441,181 | .56 |
| State Street Corp. | 1,500,000 | $ 97,980 | .12% |
| SunTrust Banks, Inc. | 4,200,000 | 324,786 | .41 |
| U.S. Bancorp | 14,275,000 | 448,806 | .57 |
| Wachovia Corp. | 6,000,000 | 359,100 | .46 |
| Washington Mutual, Inc. | 30,378,671 | 1,368,863 | 1.73 |
| Wells Fargo & Co. | 20,165,000 | 1,385,134 | 1.75 |
| XL Capital Ltd., Class A | 1,920,000 | 126,509 | .16 |
| | | 18,194,082 | 23.02 |
| | | | |
Information technology — 7.03% | | | |
| Applied Materials, Inc. | 12,500,000 | 224,375 | .28 |
| Automatic Data Processing, Inc. | 7,450,000 | 328,396 | .42 |
Dell Inc.1 | 3,500,000 | 91,700 | .12 |
| Electronic Data Systems Corp. | 2,400,000 | 64,992 | .08 |
| First Data Corp. | 2,350,000 | 112,072 | .14 |
| Hewlett-Packard Co. | 26,200,000 | 850,714 | 1.08 |
| Intel Corp. | 11,850,000 | 236,763 | .30 |
| International Business Machines Corp. | 16,180,000 | 1,332,261 | 1.69 |
| Linear Technology Corp. | 5,400,000 | 191,700 | .24 |
| Microsoft Corp. | 42,800,000 | 1,033,620 | 1.31 |
Oracle Corp.1 | 43,541,943 | 635,277 | .80 |
| Texas Instruments Inc. | 10,735,300 | 372,622 | .47 |
| Xilinx, Inc. | 3,000,000 | 83,010 | .10 |
| | | 5,557,502 | 7.03 |
| | | | |
Telecommunication services — 6.56% | | | |
| AT&T Inc. | 75,870,413 | 1,988,563 | 2.52 |
| BellSouth Corp. | 45,969,000 | 1,552,833 | 1.96 |
| Sprint Nextel Corp. | 35,188,700 | 872,680 | 1.11 |
| Verizon Communications Inc. | 23,270,000 | 768,608 | .97 |
| | | 5,182,684 | 6.56 |
| | | | |
Utilities — 6.41% | | | |
| Ameren Corp. | 4,100,000 | 206,517 | .26 |
| American Electric Power Co., Inc. | 8,524,454 | 285,228 | .36 |
| Dominion Resources, Inc. | 10,210,000 | 764,423 | .97 |
| Duke Energy Corp. | 12,690,000 | 369,533 | .47 |
| Entergy Corp. | 2,386,000 | 166,877 | .21 |
| Exelon Corp. | 13,575,000 | 733,050 | .93 |
| FirstEnergy Corp. | 8,333,635 | 422,598 | .53 |
| FPL Group, Inc. | 12,258,000 | 485,417 | .61 |
| NiSource Inc. | 4,900,000 | 103,439 | .13 |
| Pinnacle West Capital Corp. | 305,800 | 12,262 | .02 |
| PPL Corp. | 6,600,000 | 191,664 | .24 |
| Progress Energy, Inc. | 3,250,418 | 139,118 | .18 |
| Public Service Enterprise Group Inc. | 10,050,000 | 630,135 | .80 |
| Puget Sound Energy, Inc. | 2,800,000 | 58,156 | .07 |
| Southern Co. | 13,000,000 | $ 418,990 | .53% |
| Xcel Energy Inc. | 4,000,000 | 75,360 | .10 |
| | | 5,062,767 | 6.41 |
| | | | |
Miscellaneous — 0.24% | | | |
| Other common stocks in initial period of acquisition | | 190,950 | .24 |
| | | | |
Total common stocks (cost: $58,074,906,000) | | 76,692,091 | 97.04 |
| | | | |
| | | | |
| Convertible securities --— 0.05% | Principal amount (000) | | |
Consumer discretionary — 0.05% | | | |
| General Motors Corp., Series B, 5.25% convertible debentures 2032 | $ 59,800 | 39,731 | .05 |
| | | | |
Total convertible securities (cost: $60,947,000) | | 39,731 | .05 |
| Short-term securities --— 2.66% | | | |
| | | | |
3M Co. 4.65%-4.82% due 5/22-6/15/2006 | 70,300 | 70,020 | .09 |
Abbott Laboratories Inc. 4.75% due 5/9/20062 | 25,000 | 24,970 | .03 |
Atlantic Industries 4.54%-4.60% due 5/2-5/17/20062 | 79,400 | 79,342 | | .16 |
Coca-Cola Co. 4.55%-4.81% due 5/5-6/6/2006 | 50,000 | 49,861 | |
Bank of America Corp. 4.712% due 5/19/2006 | 50,000 | 49,881 | .06 |
Bank of New York Co., Inc. 4.86% due 6/1/2006 | 25,000 | 24,885 | .03 |
CAFCO, LLC 4.61%-4.65% due 5/3-5/16/20062 | 76,800 | 76,710 | .10 |
Caterpillar Financial Services Corp. 4.605%-4.83% due 5/2-6/26/2006 | 99,400 | 99,008 | .13 |
Chevron Funding Corp. 4.60% due 5/9/2006 | 25,000 | 24,971 | .03 |
Clipper Receivables Co., LLC 4.76%-4.93% due 5/4-6/14/20062 | 121,500 | 121,087 | .15 |
Concentrate Manufacturing Co. of Ireland 4.72%-4.84% due 5/2-5/16/20062 | 145,000 | 144,829 | .18 |
E.I. duPont de Nemours and Co. 4.63% due 5/12/20062 | 18,000 | 17,972 | .02 |
Eli Lilly and Co. 4.73% due 5/2/20062 | 25,000 | 24,993 | .03 |
Fannie Mae 4.655% due 6/7/2006 | 66,200 | 65,841 | .08 |
FCAR Owner Trust I 4.82% due 6/5/2006 | 50,000 | 49,760 | .06 |
Federal Farm Credit Banks 4.59%-4.80% due 5/31-6/22/2006 | 66,800 | 66,431 | .09 |
Federal Home Loan Bank 4.62%-4.66% due 5/19-6/7/2006 | 82,200 | 81,886 | .10 |
Freddie Mac 4.60%-4.81% due 5/30-7/5/2006 | 67,000 | 66,423 | .09 |
Hershey Co. 4.60%-4.80% due 5/4-6/2/20062 | 69,000 | 68,872 | .09 |
IBM Capital Inc. 4.70% due 6/8/20062 | 79,000 | 78,603 | .10 |
International Lease Finance Corp. 4.80%-4.88% due 5/16-6/13/2006 | 125,000 | 124,444 | .16 |
Kimberly-Clark Worldwide Inc. 4.79%-4.84% due 5/19-5/22/20062 | 50,000 | 49,867 | .06 |
Medtronic Inc. 4.56% due 5/5/20062 | 25,000 | 24,985 | .03 |
NetJets Inc. 4.72%-4.88% due 5/26-6/26/20062 | 65,000 | 64,588 | .08 |
Preferred Receivables Funding Corp. 4.76% due 5/3/20062 | 28,500 | 28,489 | .04 |
Procter & Gamble Co. 4.71%-4.73% due 5/3/20062 | 75,000 | 74,970 | .10 |
Three Pillars Funding, LLC 4.77%-4.86% due 5/1-5/30/20062 | 150,096 | 149,884 | .19 |
| | | | |
| | Principal amount (000) | Market value (000) | Percent of net assets |
Triple-A One Funding Corp. 4.79% due 5/11/20062 | $ 50,000 | $ 49,927 | .06% |
Variable Funding Capital Corp. 4.64%-4.92% due 5/4-6/12/20062 | 150,000 | 149,537 | .19 |
Wells Fargo Bank, N.A. 4.77%-4.81% due 5/16-5/17/2006 | 100,000 | 100,000 | .13 |
| | | | |
Total short-term securities (cost: $2,103,070,000) | | 2,103,036 | 2.66 |
| | | | |
Total investment securities (cost: $60,238,923,000) | | 78,834,858 | 99.75 |
Other assets less liabilities | | 198,099 | .25 |
| | | | |
Net assets | | $79,032,957 | 100.00% |
| | | | |
"Miscellaneous" securities include holdings in their initial period of acquisition that have not previously been publicly disclosed.
Investments in affiliates |
| A company is considered to be an affiliate of the Fund under the Investment Company Act of 1940 if the Fund’s holdings in that company represent 5% or more of the outstanding voting shares of that company. Further details on these holdings and related transactions during the year ended April 30, 2006, appear below. |
Company | Beginning shares | Purchases | Sales | Ending shares | Dividend income (000) | Market value of affiliates at 4/30/06 (000) |
| Limited Brands | 19,273,400 | 656,600 | — | 19,930,000 | $11,916 | $511,005 |
1Security did not produce income during the last 12 months.
2Restricted securities that can be resold only to institutional investors. In practice, these securities are typically as liquid as unrestricted securities in the portfolio. The total value of all restricted securities was $1,229,625,000, which represented 1.56% of the net assets of the Fund.
ADR = American Depositary Receipts
See Notes to Financial Statements
Financial statements
Statement of assets and liabilities at April 30, 2006 | (dollars and shares in thousands, except per-share amounts) |
Assets: | | |
| Investment securities at market: | | |
| Unaffiliated issuers (cost: $59,873,474) | $78,323,853 | |
| Affiliated issuers (cost: $365,449) | 511,005 | $78,834,858 |
| Cash | | 564 |
| Receivables for: | | |
| Sales of investments | 251,040 | |
| Sales of Fund’s shares | 61,815 | |
| Dividends and interest | 195,935 | 508,790 |
| | | 79,344,212 |
Liabilities: | | |
| Payables for: | | |
| Purchases of investments | 160,182 | |
| Repurchases of Fund’s shares | 84,083 | |
| Management services | 15,298 | |
| Services provided by affiliates | 50,124 | |
| Deferred directors’ and advisory board compensation | 1,380 | |
| Other fees and expenses | 188 | 311,255 |
Net assets at April 30, 2006 | | $79,032,957 |
| | | |
Net assets consist of: | | |
| Capital paid in on shares of capital stock | | $58,825,790 |
| Undistributed net investment income | | 484,601 |
| Undistributed net realized gain | | 1,126,631 |
| Net unrealized appreciation | | 18,595,935 |
Net assets at April 30, 2006 | | $79,032,957 |
Total authorized capital stock — 4,000,000 shares, $.001 par value (2,422,131 total shares outstanding) |
| | Net Assets | Shares outstanding | Net asset value per share* |
| Class A | $64,202,039 | 1,965,879 | $32.66 |
| Class B | 3,053,361 | 94,050 | 32.47 |
| Class C | 3,112,573 | 96,052 | 32.41 |
| Class F | 2,646,086 | 81,181 | 32.60 |
| Class 529-A | 832,975 | 25,531 | 32.63 |
| Class 529-B | 180,271 | 5,547 | 32.50 |
| Class 529-C | 294,608 | 9,069 | 32.49 |
| Class 529-E | 46,476 | 1,429 | 32.52 |
| Class 529-F | 31,626 | 970 | 32.59 |
| Class R-1 | 47,295 | 1,456 | 32.48 |
| Class R-2 | 811,663 | 25,053 | 32.40 |
| Class R-3 | 1,877,669 | 57,762 | 32.51 |
| Class R-4 | 1,012,857 | 31,095 | 32.57 |
| Class R-5 | 883,458 | 27,057 | 32.65 |
*Maximum offering price and redemption price per share were equal to the net asset value per share for all share classes, except for Class A and 529-A, for which the maximum offering prices per share were $34.65 and $34.62, respectively.
See Notes to Financial statements
Statement of operations for the year ended April 30, 2006 | (dollars in thousands) |
Investment income: | | |
| Income: | | |
| Dividends (net of non-U.S. taxes of $1,013; also includes $11,916 from affiliates) | $2,011,592 | |
| Interest | 76,238 | $2,087,830 |
| | | |
| Fees and expenses:* | | |
| Investment advisory services | 149,186 | |
| Business management services | 55,215 | |
| Distribution services | 240,254 | |
| Transfer agent services | 53,609 | |
| Administrative services | 19,776 | |
| Reports to shareholders | 2,200 | |
| Registration statement and prospectus | 1,813 | |
| Postage, stationery and supplies | 6,461 | |
| Directors’ and advisory board compensation | 1,011 | |
| Auditing and legal | 475 | |
| Custodian | 407 | |
| Other | 266 | |
| Total fees and expenses before reimbursements/waivers | 530,673 | |
| Less reimbursement/waiver of fees and expenses: | | |
| Investment advisory services | 14,919 | |
| Business management services | 5,522 | |
| Administrative services | 634 | |
| Total fees and expenses after reimbursements/waivers | | 509,598 |
| Net investment income | | 1,578,232 |
| | | |
Net realized gain and unrealized appreciation on investments: | | |
| Net realized gain on investments | | 1,992,122 |
| Net unrealized appreciation on investments | | 5,840,968 |
| Net realized gain and unrealized appreciation on investments | | 7,833,090 |
Net increase in net assets resulting from operations | | $9,411,322 |
| | | |
*Additional information related to class-specific fees and expenses is included in the Notes to Financial Statements.
Statements of changes in net assets | (dollars in thousands) |
| | | Year ended April 30 | |
| | | 2006 | 2005 | |
Operations: | | | |
| Net investment income | $ 1,578,232 | $ 1,547,614 | |
| Net realized gain on investments | 1,992,122 | 547,062 | |
| Net unrealized appreciation on investments | 5,840,968 | 2,329,367 | |
| Net increase in net assets resulting from operations | 9,411,322 | 4,424,043 | |
| | | | |
Dividends and distributions paid to shareholders: | | | |
| Dividends from net investment income | (1,464,289) | (1,378,347) | |
| Distributions from net realized gain on investments | (1,051,850) | (559,578) | |
| Total dividends and distributions paid to shareholders | (2,516,139) | (1,937,925) | |
| | | | |
Capital share transactions | (2,318,017) | 5,169,240 | |
| | | | |
Total increase in net assets | 4,577,166 | 7,655,358 | |
| | | | |
Net assets: | | | |
| Beginning of year | 74,455,791 | 66,800,433 | |
| End of year (including undistributed net investment income: $484,601 and $370,847, respectively) | $79,032,957 | $74,455,791 | |
| | | | |
See Notes to Financial Statements
Notes to financial statements
1. Organization and significant accounting policies |
Organization — Washington Mutual Investors Fund (the "Fund") is registered under the Investment Company Act of 1940 as an open-end, diversified management investment company. The Fund’s investment objective is to produce current income and to provide an opportunity for growth of principal consistent with sound common stock investing.
The Fund offers 14 share classes consisting of four retail share classes, five CollegeAmerica¨ savings plan share classes and five retirement plan share classes. The CollegeAmerica savings plan share classes (529-A, 529-B, 529-C, 529-E and 529-F) can be utilized to save for college education. The five retirement plan share classes (R-1, R-2, R-3, R-4 and R-5) are sold without any sales charges and do not carry any conversion rights. The Fund’s share classes are described below:
Share class | Initial sales charge | Contingent deferred sales charge upon redemption | Conversion feature |
| Class A and 529-A | Up to 5.75% | None (except 1% for certain redemptions within one year of purchase without an initial sales charge) | None |
| Class B and 529-B | None | Declines from 5% to 0% for redemptions within six years of purchase | Class B and 529-B convert to Class A and 529-A, respectively, after eight years |
| Class C | None | 1% for redemptions within one year of purchase | Class C converts to Class F after 10 years |
| Class 529-C | None | 1% for redemptions within one year of purchase | None |
| Class 529-E | None | None | None |
| Class F and 529-F | None | None | None |
| Class R-1, R-2, R-3, R-4 and R-5 | None | None | None |
Holders of all share classes have equal pro rata rights to assets, dividends and liquidation proceeds. Each share class has identical voting rights, except for the exclusive right to vote on matters affecting only its class. Share classes have different fees and expenses ("class-specific fees and expenses"), primarily due to different arrangements for distribution, administrative and shareholder services. Differences in class-specific fees and expenses will result in differences in net investment income and, therefore, the payment of different per-share dividends by each class.
Significant accounting policies — The financial statements have been prepared to comply with accounting principles generally accepted in the United States of America. These principles require management to make estimates and assumptions that affect reported amounts and disclosures. Actual results could differ from those estimates. The following is a summary of the significant accounting policies followed by the Fund:
Security valuation — Equity securities are valued at the official closing price of, or the last reported sale price on, the exchange or market on which such securities are traded, as of the close of business on the day the securities are being valued or, lacking any sales, at the last available bid price. Prices for each security are taken from the principal exchange or market in which the security trades. Fixed-income securities, including short-term securities purchased with more than 60 days left to maturity, are valued at prices obtained from an independent pricing service when such prices are available. However, where the investment adviser deems it appropriate, such securities will be valued at the mean quoted bid and asked prices (or bid prices, if asked prices are not available) or at prices for securities of comparable maturity, quality and type. Securities with both fixed-income and equity characteristics, or equity securities traded principally among fixed-income dealers, are valued in the manner described above for either equity or fixed-income securities, depending on which method is deemed most appropriate by the investment adviser. Short-term securities purchased within 60 days to maturity are valued at amortized cost, which approximates market value. The value of short-term securities originally purchased with maturities greater than 60 days is determined based on an amortized value to par when they reach 60 days or less remaining to maturity. The ability of the issuers of the debt securities held by the Fund to meet their obligations may be affected by economic developments in a specific industry, state or region. Securities and other assets for which representative market quotations are not readily available are fair valued as determined in good faith under procedures adopted by authority of the Fund’s board of directors. Various factors may be reviewed in order to make a good faith determination of a security’s fair value. These factors include, but are not limited to, the type and cost of the security; contractual or legal restrictions on resale of the security; relevant financial or business developments of the issuer; actively traded similar or related securities; conversion or exchange rights on the security; related corporate actions; significant events occurring after the close of trading in the security; and changes in overall market conditions.
Security transactions and related investment income — Security transactions are recorded by the Fund as of the date the trades are executed with brokers. Realized gains and losses from security transactions are determined based on the specific identified cost of the securities. Dividend income is recognized on the ex-dividend date and interest income is recognized on an accrual basis. Market discounts, premiums and original issue discounts on fixed-income securities are amortized daily over the expected life of the security.
Class allocations— Income, fees and expenses (other than class-specific fees and expenses) and realized and unrealized gains and losses are allocated daily among the various share classes based on their relative net assets. Class-specific fees and expenses, such as distribution, administrative and shareholder services, are charged directly to the respective share class.
Dividends and distributions to shareholders— Dividends and distributions paid to shareholders are recorded on the ex-dividend date.
2. Federal income taxation and distributions |
The Fund complies with the requirements under Subchapter M of the Internal Revenue Code applicable to mutual funds and intends to distribute substantially all of its net taxable income and net capital gains each year. The Fund is not subject to income taxes to the extent such distributions are made.
Distributions — Distributions paid to shareholders are based on net investment income and net realized gains determined on a tax basis, which may differ from net investment income and net realized gains for financial reporting purposes. These differences are due primarily to differing treatment for items such as short-term capital gains and losses; capital losses related to sales of certain securities within 30 days of purchase; deferred expenses; and cost of investments sold. The fiscal year in which amounts are distributed may differ from the year in which the net investment income and net realized gains are recorded by the Fund for financial reporting purposes. The Fund may also designate a portion of the amount paid to redeeming shareholders as a distribution for tax purposes. As of April 30, 2006, the cost of investment securities for federal income tax purposes was $60,269,393,000.
During the year ended April 30, 2006, the Fund reclassified $189,000 from undistributed net investment income and $166,000,000 from undistributed net realized gains to capital paid in on shares of capital stock to align financial reporting with tax reporting.
As of April 30, 2006, the components of distributable earnings on a tax basis were as follows (dollars in thousands):
| Undistributed net investment income | $ 486,631 |
| Undistributed long-term capital gains | 1,156,451 |
| Gross unrealized appreciation on investment securities | 20,206,607 |
| Gross unrealized depreciation on investment securities | (1,641,142) |
| Net unrealized appreciation on investment securities | 18,565,465 |
During the year ended April 30, 2006, the Fund realized, on a tax basis, a net capital gain of $1,996,182,000.
The tax character of distributions paid to shareholders was as follows (dollars in thousands):
| | Year ended April 30, 2006 | | Year ended April 30, 2005 |
Share class | Ordinary income | Long-term capital gains | Total distributions paid | | Ordinary income | Long-term capital gains | Total distributions paid |
| Class A | $1,246,004 | $ 856,631 | $2,102,635 | | $1,200,617 | $465,497 | $1,666,114 |
| Class B | 36,979 | 41,104 | 78,083 | | 34,980 | 21,983 | 56,963 |
| Class C | 36,207 | 42,338 | 78,545 | | 33,095 | 22,268 | 55,363 |
| Class F | 50,606 | 35,323 | 85,929 | | 44,042 | 18,476 | 62,518 |
| Class 529-A | 13,993 | 10,202 | 24,195 | | 10,025 | 4,223 | 14,248 |
| Class 529-B | 1,805 | 2,293 | 4,098 | | 1,410 | 1,056 | 2,466 |
| Class 529-C | 2,901 | 3,641 | 6,542 | | 2,093 | 1,539 | 3,632 |
| Class 529-E | 662 | 578 | 1,240 | | 470 | 238 | 708 |
| Class 529-F | 531 | 353 | 884 | | 306 | 137 | 443 |
| Class R-1 | 468 | 566 | 1,034 | | 295 | 197 | 492 |
| Class R-2 | 8,618 | 10,244 | 18,862 | | 6,084 | 4,018 | 10,102 |
| Class R-3 | 30,347 | 24,319 | 54,666 | | 23,111 | 11,401 | 34,512 |
| Class R-4 | 17,967 | 12,688 | 30,655 | | 10,400 | 4,362 | 14,762 |
| Class R-5 | 17,201 | 11,570 | 28,771 | | 11,419 | 4,183 | 15,602 |
| Total | $1,464,289 | $1,051,850 | $2,516,139 | | $1,378,347 | $559,578 | $1,937,925 |
3. Fees and transactions with related parties |
Business management services — The Fund has a business management agreement with Washington Management Corporation (WMC). Under this agreement, WMC provides services necessary to carry on the Fund’s general administrative and corporate affairs. These services encompass matters relating to general corporate governance, regulatory compliance and monitoring of the Fund’s contractual service providers, including custodian operations, shareholder services and Fund share distribution functions. Under the agreement, all expenses chargeable to the Class A shares of the Fund, including compensation to the business manager, shall not exceed 1% of the average net assets of the Fund on an annual basis. The agreement provides for monthly fees, accrued daily, based on a declining series of annual rates beginning with 0.175% on the first $3 billion of daily net assets and decreasing to 0.030% on daily net assets in excess of $77 billion. WMC is currently waiving 10% of business management services fees. During the year ended April 30, 2006, WMC reduced business management services fees by $5,522,000. As a result, the fee shown on the accompanying financial statements of $55,215,000, which was equivalent to an annualized rate of 0.072%, was reduced to $49,693,000, or 0.064% of average daily net assets. During the year ended April 30, 2006, WMC paid the Fund’s investment adviser $2,324,000 for performing various fund accounting services for the Fund and for The American Funds Tax-Exempt Series I, another registered investment company for which WMC serves as business manager. Johnston, Lemon & Co. Incorporated (JLC), a wholly owned subsidiary of The Johnston-Lemon Group, Incorporated (JLG) (parent company of WMC), earned $645,000 on its retail sales of shares and from the distribution plans of the Fund. JLC received no brokerage commissions resulting from the purchases and sales of securities for the investment account of the Fund.
Investment advisory services — Capital Research and Management Company (CRMC), the Fund’s investment adviser, is the parent company of American Funds Service Company (AFS), the Fund’s transfer agent, and American Funds Distributors, Inc. (AFD), the principal underwriter of the Fund’s shares. The Investment Advisory Agreement with CRMC provides for monthly fees accrued daily. These fees are based on a declining series of annual rates beginning with 0.225% on the first $3 billion of daily net assets and decreasing to 0.180% on such assets in excess of $71 billion. The board of directors approved an amended agreement effective June 16, 2005, continuing the series of rates to include an additional annual rate of 0.177% on daily net assets in excess of $89 billion. CRMC is currently waiving 10% of investment advisory services fees. During the year ended April 30, 2006, total investment advisory services fees waived by CRMC were $14,919,000. As a result, the fee shown on the accompanying financial statements of $149,186,000, which was equivalent to an annualized rate of 0.193%, was reduced to $134,267,000, or 0.174% of average daily net assets.
Class-specific fees and expenses — Expenses that are specific to individual share classes are accrued directly to the respective share class. The principal class-specific fees and expenses are described below:
Distribution services — The Fund has adopted plans of distribution for all share classes, except Class R-5. Under the plans, the board of directors approves certain categories of expenses that are used to finance activities primarily intended to sell Fund shares and service existing accounts. The plans provide for payments, based on an annualized percentage of average daily net assets, ranging from 0.25% to 1.00% as noted below. In some cases, the board of directors has limited the amounts that may be paid to less than the maximum allowed by the plans. All share classes may use up to 0.25% of average daily net assets to pay service fees, or to compensate AFD for paying service fees, to firms that have entered into agreements with AFD to provide certain shareholder services. The remaining amounts available to be paid under each plan are paid to dealers to compensate them for their sales activities.
For Class A and 529-A, the board of directors has also approved the reimbursement of dealer and wholesaler commissions paid by AFD for certain shares sold without a sales charge. These classes reimburse AFD for amounts billed within the prior 15 months but only to the extent that the overall annual expense limit of 0.25% is not exceeded. As of April 30, 2006, there were no unreimbursed expenses subject to reimbursement for Class A or 529-A.
Share class | Currently approved limits | Plan limits |
| Class A | 0.25% | 0.25% |
| Class 529-A | 0.25 | 0.50 |
| Class B and 529-B | 1.00 | 1.00 |
| Class C, 529-C and R-1 | 1.00 | 1.00 |
| Class R-2 | 0.75 | 1.00 |
| Class 529-E and R-3 | 0.50 | 0.75 |
| Class F, 529-F and R-4 | 0.25 | 0.50 |
Transfer agent services— The Fund has a transfer agent agreement with AFS for Class A and B. Under this agreement, these share classes compensate AFS for transfer agent services including shareholder recordkeeping, communications and transaction processing. AFS is also compensated for certain transfer agent services provided to all other share classes from the administrative services fees paid to CRMC described below.
Administrative services — The Fund has an administrative services agreement with CRMC to provide transfer agent and other related shareholder services for all share classes other than Class A and B. Each relevant share class pays CRMC annual fees up to 0.15% (0.10% for Class R-5) based on its respective average daily net assets. Each relevant share class also pays AFS additional amounts for certain transfer agent services. CRMC and AFS may use these fees to compensate third parties for performing these services. CRMC has agreed to pay AFS on the Fund’s behalf for a portion of the transfer agent services fees for some of the retirement plan share classes. For the year ended April 30, 2006, the total administrative services fees paid by CRMC were $2,000 and $632,000 for Class R-1 and R-2, respectively. Administrative services fees are presented gross of any payments made by CRMC. Each 529 share class is subject to an additional annual administrative services fee of 0.10% of its respective average daily net assets; this fee is payable to the Commonwealth of Virginia for the maintenance of the CollegeAmerica plan. Although these amounts are included with administrative services fees on the accompanying financial statements, the Commonwealth of Virginia is not considered a related party.
Expenses under the agreements described above for the year ended April 30, 2006, were as follows (dollars in thousands):
| | | | | | Administrative services |
Share class | Distribution services | | Transfer agent services | | CRMC administrative services | Transfer agent services | Commonwealth of Virginia administrative services |
| Class A | $150,053 | | $51,076 | | Not applicable | Not applicable | Not applicable |
| Class B | 29,891 | | 2,533 | | Not applicable | Not applicable | Not applicable |
| Class C | 30,620 | | | | $ 4,240 | $ 639 | Not applicable |
| Class F | 6,504 | | | | 2,462 | 344 | Not applicable |
| Class 529-A | 1,403 | | | | 658 | 100 | $ 731 |
| Class 529-B | 1,639 | | | | 149 | 64 | 164 |
| Class 529-C | 2,582 | | Included in | | 234 | 84 | 260 |
| Class 529-E | 204 | | administrative | | 37 | 6 | 41 |
| Class 529-F | 2 | | services | | 23 | 3 | 25 |
| Class R-1 | 404 | | | | 56 | 22 | Not applicable |
| Class R-2 | 5,433 | | | | 1,081 | 2,568 | Not applicable |
| Class R-3 | 9,181 | | | | 2,710 | 867 | Not applicable |
| Class R-4 | 2,338 | | | | 1,399 | 32 | Not applicable |
| Class R-5 | Not applicable | | | | 763 | 14 | Not applicable |
| Total | $240,254 | | $53,609 | | $13,812 | $4,743 | $1,221 |
Deferred directors’ and advisory board compensation — Since the adoption of the deferred compensation plan in 1994, independent directors and advisory board members may elect to defer the cash payment of part or all of their compensation. These deferred amounts, which remain as liabilities of the Fund, are treated as if invested in shares of the Fund or other American Funds. These amounts represent general, unsecured liabilities of the Fund and vary according to the total returns of the selected funds. Directors’ and advisory board compensation of $1,011,000, shown on the accompanying financial statements, includes $882,000 in current fees (either paid in cash or deferred) and a net increase of $129,000 in the value of the deferred amounts.
Affiliated officers and directors — All officers of the Fund and all of its directors who are affiliated with WMC receive no compensation directly from the Fund for serving in such capacities.
4. Investment transactions |
The Fund made purchases and sales of investment securities, excluding short-term securities, of $9,476,572,000 and $12,903,073,000, respectively, during the year ended April 30, 2006.
5. Capital share transactions |
Capital share transactions in the Fund were as follows (dollars and shares in thousands):
| | Sales* | | Reinvestments of dividends and distributions | | Repurchases* | | Net (decrease) increase | |
Share class | Amount | Shares | | Amount | Shares | | Amount | Shares | | Amount | Shares | |
Year ended April 30, 2006 | |
| Class A | $5,298,942 | 169,863 | | $1,984,249 | 63,236 | | $ (9,900,129) | (316,730) | | $(2,616,938) | (83,631) | |
| Class B | 197,144 | 6,359 | | 74,794 | 2,398 | | (387,807) | (12,467) | | (115,869) | (3,710) | |
| Class C | 411,237 | 13,293 | | 74,370 | 2,389 | | (637,968) | (20,562) | | (152,361) | (4,880) | |
| Class F | 645,258 | 20,720 | | 77,224 | 2,466 | | (812,986) | (26,060) | | (90,504) | (2,874) | |
| Class 529-A | 169,808 | 5,447 | | 24,194 | 771 | | (59,439) | (1,898) | | 134,563 | 4,320 | |
| Class 529-B | 23,901 | 770 | | 4,098 | 131 | | (10,474) | (336) | | 17,525 | 565 | |
| Class 529-C | 64,090 | 2,065 | | 6,542 | 210 | | (25,102) | (805) | | 45,530 | 1,470 | |
| Class 529-E | 9,853 | 317 | | 1,240 | 40 | | (3,572) | (114) | | 7,521 | 243 | |
| Class 529-F | 9,675 | 309 | | 884 | 28 | | (2,272) | (73) | | 8,287 | 264 | |
| Class R-1 | 22,484 | 725 | | 1,026 | 33 | | (14,131) | (455) | | 9,379 | 303 | |
| Class R-2 | 297,143 | 9,596 | | 18,857 | 606 | | (191,087) | (6,147) | | 124,913 | 4,055 | |
| Class R-3 | 621,188 | 20,035 | | 54,620 | 1,748 | | (659,035) | (21,381) | | 16,773 | 402 | |
| Class R-4 | 364,970 | 11,744 | | 30,654 | 979 | | (295,958) | (9,478) | | 99,666 | 3,245 | |
| Class R-5 | 373,131 | 12,027 | | 28,237 | 900 | | (207,870) | (6,613) | | 193,498 | 6,314 | |
Total net increase (decrease) | $8,508,824 | 273,270 | | $2,380,989 | 75,935 | | $(13,207,830) | (423,119) | | $(2,318,017) | (73,914) | |
Year ended April 30, 2005 | |
| Class A | $ 7,395,134 | 249,062 | | $1,569,990 | 52,168 | | $(6,916,372) | (232,386) | | $2,048,752 | 68,844 | |
| Class B | 451,234 | 15,339 | | 54,564 | 1,818 | | (248,702) | (8,408) | | 257,096 | 8,749 | |
| Class C | 753,447 | 25,600 | | 52,449 | 1,750 | | (367,965) | (12,434) | | 437,931 | 14,916 | |
| Class F | 915,300 | 30,894 | | 55,610 | 1,850 | | (459,462) | (15,406) | | 511,448 | 17,338 | |
| Class 529-A | 202,543 | 6,808 | | 14,247 | 473 | | (26,138) | (877) | | 190,652 | 6,404 | |
| Class 529-B | 35,804 | 1,212 | | 2,466 | 82 | | (4,797) | (161) | | 33,473 | 1,133 | |
| Class 529-C | 71,331 | 2,409 | | 3,631 | 120 | | (11,208) | (378) | | 63,754 | 2,151 | |
| Class 529-E | 11,939 | 402 | | 708 | 24 | | (1,592) | (54) | | 11,055 | 372 | |
| Class 529-F | 9,916 | 334 | | 442 | 15 | | (1,268) | (42) | | 9,090 | 307 | |
| Class R-1 | 23,143 | 783 | | 488 | 16 | | (6,379) | (217) | | 17,252 | 582 | |
| Class R-2 | 325,408 | 11,018 | | 10,099 | 337 | | (98,064) | (3,317) | | 237,443 | 8,038 | |
| Class R-3 | 862,578 | 29,133 | | 34,456 | 1,146 | | (241,511) | (8,100) | | 655,523 | 22,179 | |
| Class R-4 | 564,507 | 18,978 | | 14,724 | 489 | | (92,164) | (3,088) | | 487,067 | 16,379 | |
| Class R-5 | 279,665 | 9,418 | | 15,114 | 502 | | (86,075) | (2,890) | | 208,704 | 7,030 | |
Total net increase (decrease) | $11,901,949 | 401,390 | | $1,828,988 | 60,790 | | $(8,561,697) | (287,758) | | $5,169,240 | 174,422 | |
*Includes exchanges between share classes of the Fund. | |
Financial highlights1
| | | Income (loss) from investment operations2 | Dividends and distributions | | | | | | |
| | Net asset value, beginning of period | Net investment income (loss) | Net gains (losses) on securities (both realized and unrealized) | Total from investment operations | Dividends (from net investment income) | Distributions (from capital gains) | Total dividends and distributions | Net asset value, end of period | Total return3 | Net assets, end of period (in millions) | Ratio of expenses to average net assets before reim- bursements/ waivers | Ratio of expenses to average net assets after reim- bursements/ waivers4 | Ratio of net income (loss) to average net assets |
Class A: | | | | | | | | | | | | | |
| Year ended 4/30/2006 | $29.85 | $ .66 | $ 3.20 | $ 3.86 | $(.62) | $(.43) | $(1.05) | $32.66 | 13.11% | $64,202 | .60% | .57% | 2.13% |
| Year ended 4/30/2005 | 28.79 | .67 | 1.22 | 1.89 | (.60) | (.23) | (.83) | 29.85 | 6.55 | 61,185 | .61 | .60 | 2.24 |
| Year ended 4/30/2004 | 23.99 | .59 | 4.94 | 5.53 | (.54) | (.19) | (.73) | 28.79 | 23.19 | 57,027 | .64 | .64 | 2.14 |
| Year ended 4/30/2003 | 28.37 | .55 | (4.35) | (3.80) | (.54) | (.04) | (.58) | 23.99 | (13.36) | 43,701 | .67 | .67 | 2.28 |
| Year ended 4/30/2002 | 29.80 | .50 | (.75) | (.25) | (.54) | (.64) | (1.18) | 28.37 | (.73) | 50,669 | .65 | .65 | 1.72 |
Class B: | | | | | | | | | | | | | |
| Year ended 4/30/2006 | 29.69 | .42 | 3.17 | 3.59 | (.38) | (.43) | (.81) | 32.47 | 12.24 | 3,053 | 1.37 | 1.34 | 1.37 |
| Year ended 4/30/2005 | 28.64 | .43 | 1.22 | 1.65 | (.37) | (.23) | (.60) | 29.69 | 5.75 | 2,902 | 1.38 | 1.37 | 1.47 |
| Year ended 4/30/2004 | 23.88 | .37 | 4.92 | 5.29 | (.34) | (.19) | (.53) | 28.64 | 22.25 | 2,549 | 1.40 | 1.40 | 1.36 |
| Year ended 4/30/2003 | 28.25 | .36 | (4.32) | (3.96) | (.37) | (.04) | (.41) | 23.88 | (14.01) | 1,538 | 1.45 | 1.45 | 1.52 |
| Year ended 4/30/2002 | 29.71 | .25 | (.72) | (.47) | (.35) | (.64) | (.99) | 28.25 | (1.50) | 1,097 | 1.41 | 1.41 | .88 |
Class C: | | | | | | | | | | | | | |
| Year ended 4/30/2006 | 29.64 | .40 | 3.16 | 3.56 | (.36) | (.43) | (.79) | 32.41 | 12.15 | 3,113 | 1.43 | 1.41 | 1.30 |
| Year ended 4/30/2005 | 28.59 | .41 | 1.22 | 1.63 | (.35) | (.23) | (.58) | 29.64 | 5.69 | 2,991 | 1.46 | 1.45 | 1.39 |
| Year ended 4/30/2004 | 23.84 | .35 | 4.92 | 5.27 | (.33) | (.19) | (.52) | 28.59 | 22.19 | 2,460 | 1.48 | 1.48 | 1.27 |
| Year ended 4/30/2003 | 28.22 | .35 | (4.33) | (3.98) | (.36) | (.04) | (.40) | 23.84 | (14.10) | 1,214 | 1.51 | 1.51 | 1.46 |
| Year ended 4/30/2002 | 29.70 | .21 | (.73) | (.52) | (.32) | (.64) | (.96) | 28.22 | (1.68) | 678 | 1.51 | 1.51 | .72 |
Class F: | | | | | | | | | | | | | |
| Year ended 4/30/2006 | 29.80 | .65 | 3.19 | 3.84 | (.61) | (.43) | (1.04) | 32.60 | 13.06 | 2,646 | .63 | .61 | 2.10 |
| Year ended 4/30/2005 | 28.74 | .64 | 1.22 | 1.86 | (.57) | (.23) | (.80) | 29.80 | 6.47 | 2,505 | .69 | .68 | 2.15 |
| Year ended 4/30/2004 | 23.95 | .56 | 4.94 | 5.50 | (.52) | (.19) | (.71) | 28.74 | 23.13 | 1,917 | .71 | .71 | 2.04 |
| Year ended 4/30/2003 | 28.33 | .53 | (4.34) | (3.81) | (.53) | (.04) | (.57) | 23.95 | (13.42) | 899 | .74 | .74 | 2.24 |
| Year ended 4/30/2002 | 29.79 | .42 | (.72) | (.30) | (.52) | (.64) | (1.16) | 28.33 | (.89) | 444 | .78 | .78 | 1.46 |
Class 529-A: | | | | | | | | | | | | | |
| Year ended 4/30/2006 | 29.83 | .64 | 3.19 | 3.83 | (.60) | (.43) | (1.03) | 32.63 | 13.01 | 833 | .68 | .65 | 2.05 |
| Year ended 4/30/2005 | 28.76 | .63 | 1.23 | 1.86 | (.56) | (.23) | (.79) | 29.83 | 6.47 | 633 | .71 | .70 | 2.12 |
| Year ended 4/30/2004 | 23.97 | .56 | 4.95 | 5.51 | (.53) | (.19) | (.72) | 28.76 | 23.07 | 426 | .71 | .71 | 2.03 |
| Year ended 4/30/2003 | 28.36 | .54 | (4.35) | (3.81) | (.54) | (.04) | (.58) | 23.97 | (13.38) | 199 | .70 | .70 | 2.29 |
Period from 2/15/2002 to 4/30/2002 | 27.71 | .04 | .75 | .79 | (.14) | — | (.14) | 28.36 | 2.82 | 49 | .16 | .16 | .14 |
Class 529-B: | | | | | | | | | | | | | |
| Year ended 4/30/2006 | 29.72 | .38 | 3.17 | 3.55 | (.34) | (.43) | (.77) | 32.50 | 12.07 | 180 | 1.51 | 1.48 | 1.22 |
| Year ended 4/30/2005 | 28.68 | .38 | 1.21 | 1.59 | (.32) | (.23) | (.55) | 29.72 | 5.52 | 148 | 1.58 | 1.57 | 1.26 |
| Year ended 4/30/2004 | 23.91 | .32 | 4.96 | 5.28 | (.32) | (.19) | (.51) | 28.68 | 22.08 | 110 | 1.59 | 1.59 | 1.15 |
| Year ended 4/30/2003 | 28.34 | .32 | (4.35) | (4.03) | (.36) | (.04) | (.40) | 23.91 | (14.18) | 53 | 1.62 | 1.62 | 1.36 |
Period from 2/19/2002 to 4/30/2002 | 27.25 | (.01) | 1.22 | 1.21 | (.12) | — | (.12) | 28.34 | 4.38 | 11 | .30 | .30 | (.02) |
Class 529-C: | | | | | | | | | | | | | |
| Year ended 4/30/2006 | 29.71 | .38 | 3.18 | 3.56 | (.35) | (.43) | (.78) | 32.49 | 12.10 | 295 | 1.50 | 1.47 | 1.23 |
| Year ended 4/30/2005 | 28.67 | .37 | 1.22 | 1.59 | (.32) | (.23) | (.55) | 29.71 | 5.54 | 226 | 1.57 | 1.56 | 1.27 |
| Year ended 4/30/2004 | 23.91 | .32 | 4.93 | 5.25 | (.30) | (.19) | (.49) | 28.67 | 22.06 | 156 | 1.58 | 1.58 | 1.15 |
| Year ended 4/30/2003 | 28.33 | .32 | (4.34) | (4.02) | (.36) | (.04) | (.40) | 23.91 | (14.18) | 69 | 1.61 | 1.61 | 1.38 |
Period from 2/15/2002 to 4/30/2002 | 27.71 | (.01) | .75 | .74 | (.12) | — | (.12) | 28.33 | 2.65 | 15 | .32 | .32 | (.03) |
Class 529-E: | | | | | | | | | | | | | |
| Year ended 4/30/2006 | 29.74 | .54 | 3.17 | 3.71 | (.50) | (.43) | (.93) | 32.52 | 12.64 | 46 | .98 | .96 | 1.74 |
| Year ended 4/30/2005 | 28.69 | .53 | 1.22 | 1.75 | (.47) | (.23) | (.70) | 29.74 | 6.09 | 35 | 1.05 | 1.04 | 1.79 |
| Year ended 4/30/2004 | 23.92 | .46 | 4.94 | 5.40 | (.44) | (.19) | (.63) | 28.69 | 22.68 | 23 | 1.06 | 1.06 | 1.68 |
| Year ended 4/30/2003 | 28.34 | .45 | (4.35) | (3.90) | (.48) | (.04) | (.52) | 23.92 | (13.73) | 9 | 1.08 | 1.08 | 1.92 |
Period from 3/1/2002 to 4/30/2002 | 28.59 | .01 | (.13) | (.12) | (.13) | — | (.13) | 28.34 | (.44) | 1 | .17 | .17 | .04 |
| | | Income (loss) from investment operations2 | Dividends and distributions | | | | | | |
| | Net asset value, beginning of period | Net investment income | Net gains (losses) on securities (both realized and unrealized) | Total from investment operations | Dividends (from net investment income) | Distributions (from capital gains) | Total dividends and distributions | Net asset value, end of period | Total return3 | Net assets, end of period (in millions) | Ratio of expenses to average net assets before reim- bursements/ waivers | Ratio of expenses to average net assets after reim- bursements/ waivers4 | Ratio of net income to average net assets |
Class 529-F: | | | | | | | | | | | | | |
| Year ended 4/30/2006 | $29.79 | $.70 | $ 3.18 | $ 3.88 | $(.65) | $(.43) | $(1.08) | $32.59 | 13.20% | $ 32 | .49% | .46% | 2.24% |
| Year ended 4/30/2005 | 28.74 | .60 | 1.22 | 1.82 | (.54) | (.23) | (.77) | 29.79 | 6.35 | 21 | .80 | .79 | 2.03 |
| Year ended 4/30/2004 | 23.96 | .53 | 4.95 | 5.48 | (.51) | (.19) | (.70) | 28.74 | 23.00 | 11 | .81 | .81 | 1.90 |
Period from 9/16/2002 to 4/30/2003 | 23.98 | .32 | .10 | .42 | (.40) | (.04) | (.44) | 23.96 | 1.85 | 3 | .825 | .825 | 2.255 |
Class R-1: | | | | | | | | | | | | | |
| Year ended 4/30/2006 | 29.71 | .39 | 3.17 | 3.56 | (.36) | (.43) | (.79) | 32.48 | 12.10 | 47 | 1.47 | 1.44 | 1.26 |
| Year ended 4/30/2005 | 28.68 | .40 | 1.21 | 1.61 | (.35) | (.23) | (.58) | 29.71 | 5.62 | 34 | 1.50 | 1.47 | 1.35 |
| Year ended 4/30/2004 | 23.92 | .35 | 4.93 | 5.28 | (.33) | (.19) | (.52) | 28.68 | 22.16 | 16 | 1.52 | 1.49 | 1.25 |
Period from 5/29/2002 to 4/30/2003 | 28.52 | .32 | (4.46) | (4.14) | (.42) | (.04) | (.46) | 23.92 | (14.50) | 8 | 1.715 | 1.515 | 1.505 |
Class R-2: | | | | | | | | | | | | | |
| Year ended 4/30/2006 | 29.64 | .40 | 3.16 | 3.56 | (.37) | (.43) | (.80) | 32.40 | 12.13 | 812 | 1.53 | 1.41 | 1.29 |
| Year ended 4/30/2005 | 28.60 | .41 | 1.22 | 1.63 | (.36) | (.23) | (.59) | 29.64 | 5.68 | 622 | 1.57 | 1.44 | 1.38 |
| Year ended 4/30/2004 | 23.88 | .35 | 4.91 | 5.26 | (.35) | (.19) | (.54) | 28.60 | 22.12 | 371 | 1.69 | 1.45 | 1.26 |
Period from 5/31/2002 to 4/30/2003 | 28.46 | .33 | (4.40) | (4.07) | (.47) | (.04) | (.51) | 23.88 | (14.29) | 96 | 1.785 | 1.475 | 1.585 |
Class R-3: | | | | | | | | | | | | | |
| Year ended 4/30/2006 | 29.73 | .54 | 3.18 | 3.72 | (.51) | (.43) | (.94) | 32.51 | 12.68 | 1,878 | .97 | .94 | 1.75 |
| Year ended 4/30/2005 | 28.68 | .56 | 1.21 | 1.77 | (.49) | (.23) | (.72) | 29.73 | 6.17 | 1,705 | .95 | .94 | 1.89 |
| Year ended 4/30/2004 | 23.93 | .46 | 4.94 | 5.40 | (.46) | (.19) | (.65) | 28.68 | 22.68 | 1,009 | 1.07 | 1.07 | 1.63 |
Period from 6/4/2002 to 4/30/2003 | 27.81 | .41 | (3.74) | (3.33) | (.51) | (.04) | (.55) | 23.93 | (11.94) | 125 | 1.115 | 1.095 | 1.955 |
Class R-4: | | | | | | | | | | | | | |
| Year ended 4/30/2006 | 29.78 | .64 | 3.18 | 3.82 | (.60) | (.43) | (1.03) | 32.57 | 13.00 | 1,013 | .68 | .65 | 2.06 |
| Year ended 4/30/2005 | 28.73 | .64 | 1.22 | 1.86 | (.58) | (.23) | (.81) | 29.78 | 6.46 | 830 | .68 | .67 | 2.14 |
| Year ended 4/30/2004 | 23.95 | .56 | 4.94 | 5.50 | (.53) | (.19) | (.72) | 28.73 | 23.11 | 330 | .70 | .70 | 2.01 |
Period from 5/20/2002 to 4/30/2003 | 28.78 | .51 | (4.74) | (4.23) | (.56) | (.04) | (.60) | 23.95 | (14.66) | 71 | .745 | .735 | 2.325 |
Class R-5: | | | | | | | | | | | | | |
| Year ended 4/30/2006 | 29.85 | .73 | 3.19 | 3.92 | (.69) | (.43) | (1.12) | 32.65 | 13.34 | 883 | .38 | .35 | 2.34 |
| Year ended 4/30/2005 | 28.79 | .73 | 1.22 | 1.95 | (.66) | (.23) | (.89) | 29.85 | 6.78 | 619 | .38 | .37 | 2.45 |
| Year ended 4/30/2004 | 23.99 | .65 | 4.94 | 5.59 | (.60) | (.19) | (.79) | 28.79 | 23.49 | 395 | .39 | .39 | 2.36 |
Period from 5/15/2002 to 4/30/2003 | 28.84 | .57 | (4.78) | (4.21) | (.60) | (.04) | (.64) | 23.99 | (14.57) | 230 | .415 | .415 | 2.515 |
| | | | | | | | | | | | | | |
| | | | | Year ended April 30 |
| | | | | 2006 | | 2005 | | 2004 | | 2003 | | 2002 | |
| Portfolio turnover rate for all classes of shares | | 13% | | 16% | | 12% | | 21% | | 22% | |
1 Based on operations for the periods shown (unless otherwise noted) and, accordingly, may not be representative of a full year.
2 Based on average shares outstanding.
3 Total returns exclude all sales charges, including contingent deferred sales charges.
4 The ratios in this column reflect the impact, if any, of certain reimbursements/waivers from CRMC and WMC. During some of the periods shown, CRMC and WMC reduced fees for investment advisory services and business management services for all share classes. In additon, during the start-up period for the retirement plan share classes (except Class R-5), CRMC agreed to pay a portion of the fees related to transfer agent services.
5 Annualized.
See Notes to Financial Statements
Report of independent registered public accounting firm
To the Board of Directors and Shareholders of Washington Mutual Investors Fund, Inc.:
In our opinion, the accompanying statement of assets and liabilities, including the investment portfolio, and the related statements of operations and changes in net assets and the financial highlights present fairly, in all material respects, the financial position of Washington Mutual Investors Fund, Inc. (the "Fund") at April 30, 2006, the results of its operations for the year then ended, the changes in its net assets for each of the two years in the period then ended and its financial highlights for each of the periods presented, in conformity with accounting principles generally accepted in the United States of America. These financial statements and financial highlights (hereafter referred to as "financial statements") are the responsibility of the Fund’s management; our responsibility is to express an opinion on these financial statements based on our audits. We conducted our audits of these financial statements in accordance with the standards of the Public Company Accounting Oversight Board (United States). Those standards require that we plan and perform the audit to obtain reasonable assurance about whether the financial statements are free of material misstatement. An audit includes examining, on a test basis, evidence supporting the amounts and disclosures in the financial statements, assessing the accounting principles used and significant estimates made by management, and evaluating the overall financial statement presentation. We believe that our audits, which included confirmation of securities owned at April 30, 2006 by correspondence with the custodian and brokers, provide a reasonable basis for our opinion.
PricewaterhouseCoopers LLP
Los Angeles, California
June 2, 2006
Tax information unaudited
We are required to advise you within 60 days of the Fund’s fiscal year-end regarding the Federal tax status of certain distributions received by shareholders during such fiscal year. The Fund hereby designates the following amounts for the Fund’s fiscal year ended April 30, 2006.
Long-term capital gains | $1,175,850,000 |
Qualified dividend income | 100% |
Corporate dividends received deduction | 100% |
U.S. government income that may be exempt from state taxation | $7,179,000 |
Individual shareholders should refer to their Form 1099-DIV or other tax information, which will be mailed in January 2007, to determine the calendar year amounts to be included on their 2006 tax returns. Shareholders should consult their tax advisers.
Other share class results unaudited
Class B, Class C, Class F and Class 529 |
Figures shown are past results and are not predictive of results in future periods. Current and future results may be lower or higher than those shown. Share prices and returns will vary, so investors may lose money. For the most current information and month-end results, visit americanfunds.com.
Average annual total returns for periods ended March 31, 2006 (the most recent calendar quarter):
| | | 1 year | 5 years | Life of class |
Class B shares — first sold 3/15/00 | | | | |
Reflecting applicable contingent deferred sales charge (CDSC), maximum of 5%, payable only if shares are sold within six years of purchase | | +3.88% | +4.46% | +6.58% |
Not reflecting CDSC | | +8.88% | +4.79% | +6.58% |
Class C shares — first sold 3/15/01 | | | | |
Reflecting CDSC, maximum of 1%, payable only if shares are sold within one year of purchase | | +7.79% | +4.69% | +4.68% |
Not reflecting CDSC | | +8.79% | +4.69% | +4.68% |
Class F shares* — first sold 3/15/01 | | | | |
Not reflecting annual asset-based fee charged by sponsoring firm | | +9.66% | +5.50% | +5.50% |
Class 529-A shares† — first sold 2/15/02 | | | | |
Reflecting 5.75% maximum sales charge | | +3.32% | — | +4.94% |
Not reflecting maximum sales charge | | +9.61% | — | +6.46% |
Class 529-B shares† — first sold 2/19/02 | | | | |
Reflecting applicable CDSC, maximum of 5%, payable only if shares are sold within six years of purchase | | +3.69% | — | +5.58% |
Not reflecting CDSC | | +8.69% | — | +5.98% |
Class 529-C shares† — first sold 2/15/02 | | | | |
Reflecting CDSC, maximum of 1%, payable only if shares are sold within one year of purchase | | +7.70% | — | +5.54% |
Not reflecting CDSC | | +8.70% | — | +5.54% |
Class 529-E shares*† — first sold 3/1/02 | | +9.31% | — | +5.34% |
Class 529-F shares*† — first sold 9/16/02 | | | | |
Not reflecting annual asset-based fee charged by sponsoring firm | | +9.80% | — | +11.72% |
The Fund’s investment adviser and business manager each waived 5% of their management fees from September 1, 2004 through March 31, 2005, and increased the waivers to 10% on April 1, 2005. Fund results shown reflect the waivers, without which they would have been lower. Please see the Financial Highlights table on page 25 for details.
* These shares are sold without any initial or contingent deferred sales charge.
† Results shown do not reflect the $10 initial account setup fee and an annual $10 account maintenance fee.
There are several ways to invest in Washington Mutual Investors Fund. Class A shares are subject to a 5.75% maximum up-front sales charge that declines for accounts (and aggregated investments) of $25,000 or more and is eliminated for purchases of $1 million or more. Other share classes, which are generally not available for certain employer-sponsored retirement plans, have no up-front sales charges but are subject to additional annual expenses and fees. Annual expenses for Class B shares were 0.77 percentage points higher than for Class A shares; Class B shares convert to Class A shares after eight years of ownership. If redeemed within six years, Class B shares may also be subject to a contingent deferred sales charge ("CDSC") of up to 5% that declines over time. Class C shares were subject to annual expenses 0.84 percentage points higher than those for Class A shares and a 1% CDSC if redeemed within the first year after purchase. Class C shares convert to Class F shares after 10 years. Class F shares, which are available only through certain fee-based programs offered by broker-dealer firms and registered investment advisers, had higher annual expenses (by 0.04 percentage points) than did Class A shares, and an annual asset-based fee charged by the sponsoring firm. Expenses are deducted from income earned by the Fund. As a result, dividends and investment results will differ for each share class.
Expense example unaudited
As a shareholder of the Fund, you incur two types of costs: (1) transaction costs such as initial sales charges on purchase payments and contingent deferred sales charges on redemptions (loads); and (2) ongoing costs, including management fees; distribution and service (12b-1) fees; and other expenses. This example is intended to help you understand your ongoing costs (in dollars) of investing in the Fund so you can compare these costs with the ongoing costs of investing in other mutual funds. The example is based on an investment of $1,000 invested at the beginning of the period and held for the entire period (November 1, 2005 through April 30, 2006).
Actual expenses:
The first line of each share class in the table on the next page provides information about actual account values and actual expenses. You may use the information in this line, together with the amount you invested, to estimate the expenses that you paid over the period. Simply divide your account value by $1,000 (for example, an $8,600 account value divided by $1,000 = 8.6), then multiply the result by the number in the first line under the heading entitled "Expenses paid during period" to estimate the expenses you paid on your account during this period. There are some account fees that are charged to certain types of accounts, such as Individual Retirement Accounts and CollegeAmerica accounts (generally, a $10 fee is charged to set up the account and an additional $10 fee is charged to the account annually) that would increase the amount of expenses paid on your account. In addition, retirement plan participants may be subject to certain fees charged by the plan sponsor, and Class F and Class 529-F shareholders may be subject to fees charged by financial intermediaries, typically ranging from 0.75% to 1.50% of assets annually depending on services offered. You can estimate the impact of these fees by adding the amount of the fees to the total estimated expenses you paid on your account during the period as calculated above. In addition, your ending account value would also be lower by the amount of these fees.
Hypothetical example for comparison purposes:
The second line of each share class in the table on the next page provides information about hypothetical account values and hypothetical expenses based on the actual expense ratio for the share class and an assumed rate of return of 5.00% per year before expenses, which is not the actual return of the share class. The hypothetical account values and expenses may not be used to estimate the actual ending account balance or expenses you paid for the period. You may use this information to compare the ongoing costs of investing in the Fund and other funds. To do so, compare this 5.00% hypothetical example with the 5.00% hypothetical examples that appear in the shareholder reports of the other funds. There are some account fees that are charged to certain types of accounts, such as Individual Retirement Accounts and CollegeAmerica accounts (generally, a $10 fee is charged to set up the account and an additional $10 fee is charged to the account annually) that would increase the amount of expenses paid on your account. In addition, retirement plan participants may be subject to certain fees charged by the plan sponsor, and Class F and Class 529-F shareholders may be subject to fees charged by financial intermediaries, typically ranging from 0.75% to 1.50% of assets annually depending on services offered. You can estimate the impact of these fees by adding the amount of the fees to the total estimated expenses you paid on your account during the period as calculated above. In addition, your ending account value would also be lower by the amount of these fees.
Please note that the expenses shown in the table are meant to highlight your ongoing costs only and do not reflect any transactional costs, such as sales charges (loads). Therefore, the second line of each share class in the table is useful in comparing ongoing costs only, and will not help you determine the relative total costs of owning different funds. In addition, if these transactional costs were included, your costs would have been higher.
| | Beginning account value 11/1/2005 | Ending account value 4/30/2006 | Expenses paid during period* | Annualized expense ratio |
| Class A— actual return | $1,000.00 | $1,100.45 | $2.97 | .57% |
| Class A— assumed 5% return | 1,000.00 | 1,021.97 | 2.86 | .57 |
| Class B— actual return | 1,000.00 | 1,096.58 | 6.97 | 1.34 |
| Class B— assumed 5% return | 1,000.00 | 1,018.15 | 6.71 | 1.34 |
| Class C— actual return | 1,000.00 | 1,096.04 | 7.33 | 1.41 |
| Class C— assumed 5% return | 1,000.00 | 1,017.80 | 7.05 | 1.41 |
| Class F— actual return | 1,000.00 | 1,100.54 | 3.07 | .59 |
| Class F— assumed 5% return | 1,000.00 | 1,021.87 | 2.96 | .59 |
| Class 529-A— actual return | 1,000.00 | 1,100.25 | 3.38 | .65 |
| Class 529-A— assumed 5% return | 1,000.00 | 1,021.57 | 3.26 | .65 |
| Class 529-B— actual return | 1,000.00 | 1,095.84 | 7.64 | 1.47 |
| Class 529-B— assumed 5% return | 1,000.00 | 1,017.50 | 7.35 | 1.47 |
| Class 529-C— actual return | 1,000.00 | 1,095.95 | 7.59 | 1.46 |
| Class 529-C— assumed 5% return | 1,000.00 | 1,017.55 | 7.30 | 1.46 |
| Class 529-E— actual return | 1,000.00 | 1,098.59 | 4.89 | .94 |
| Class 529-E— assumed 5% return | 1,000.00 | 1,020.13 | 4.71 | .94 |
| Class 529-F— actual return | 1,000.00 | 1,101.05 | 2.29 | .44 |
| Class 529-F— assumed 5% return | 1,000.00 | 1,022.61 | 2.21 | .44 |
| Class R-1— actual return | 1,000.00 | 1,095.78 | 7.43 | 1.43 |
| Class R-1— assumed 5% return | 1,000.00 | 1,017.70 | 7.15 | 1.43 |
| Class R-2— actual return | 1,000.00 | 1,096.09 | 7.33 | 1.41 |
| Class R-2— assumed 5% return | 1,000.00 | 1,017.80 | 7.05 | 1.41 |
| Class R-3— actual return | 1,000.00 | 1,098.48 | 4.89 | .94 |
| Class R-3— assumed 5% return | 1,000.00 | 1,020.13 | 4.71 | .94 |
| Class R-4— actual return | 1,000.00 | 1,099.95 | 3.38 | .65 |
| Class R-4— assumed 5% return | 1,000.00 | 1,021.57 | 3.26 | .65 |
| Class R-5— actual return | 1,000.00 | 1,101.68 | 1.82 | .35 |
| Class R-5— assumed 5% return | 1,000.00 | 1,023.06 | 1.76 | .35 |
* Expenses are equal to the annualized expense ratio, multiplied by the average account value over the period, multiplied by the number of days in the period (181), and divided by 365 (to reflect the one-half year period).
Board of Directors and Directors Emeriti
Independent Directors |
Name and age | Year first elected a Director of the Fund1 | Principal occupations(s) during past five years | Number of portfolios in Fund complex2 overseen by Director | Other directorships3 held |
Cyrus A. Ansary, 72 Chairman of the Board (Independent and Non-Executive) | 1983 | President, Investment Services International Co., LLC (private investment company for various operating entities) | 3 | JPMorgan Value Opportunities Fund |
Charles A. Bowsher, 74 | 2001 | Retired Comptroller General of the United States | 1 | DeVry Inc.; SI International, Inc. |
Daniel J. Callahan III, 73 | 1997 | Vice Chairman and Treasurer, The Morris & Gwendolyn Cafritz Foundation | 3 | JPMorgan Value Opportunities Fund |
Barbara Hackman Franklin, 66 | 2005 | President and CEO, Barbara Franklin Enterprises (international business and governance consulting) | 1 | Aetna, Inc.; The Dow Chemical Company; Medimmune, Inc.; GenVec, Inc. |
R. Clark Hooper, 59 | 2003 | President, Dumbarton Group LLC (securities industry consulting); Former Executive Vice President - Policy and Oversight, NASD | 15 | JPMorgan Value Opportunities Fund |
Edward W. Kelley, Jr., 74 | 2002 | Retired Governor, Federal Reserve Board | 1 | Security Capital Corp. |
James C. Miller III, 63 | 1992 | Former Chairman, The CapAnalysis Group, LLC (economic, financial and regulatory consulting); Former Counselor, Citizens for a Sound Economy; Former Director, U.S. Office of Management and Budget | 3 | FLYi, Inc.; JPMorgan Value Opportunities Fund |
Katherine D. Ortega, 71 | 2002 | Former Treasurer of the United States | 3 | JPMorgan Value Opportunities Fund; The Kroger Co.; Rayonier Inc. |
J. Knox Singleton, 57 | 2001 | President and Chief Executive Officer, INOVA Health System | 3 | Healthcare Realty Trust, Inc.; JPMorgan Value Opportunities Fund |
Interested Directors4 |
Name, age, and position with Fund | Year first elected Director or officer of the Fund1 | Principal occupations(s) during past five years | Number of portfolios in Fund complex2 overseen by Director | Other directorships3 held |
James H. Lemon, Jr., 70 Vice Chairman of the Board | 1971 | Chairman of the Board and Chief Executive Officer, The Johnston-Lemon Group, Incorporated (financial services holding company) | 3 | JPMorgan Value Opportunities Fund |
Harry J. Lister, 70 | 1972 | Director, Washington Management Corporation | 1 | None |
Jeffrey L. Steele, 60 President | 2000 | President and Director, Washington Management Corporation | 3 | JPMorgan Value Opportunities Fund |
Directors Emeriti |
Stephen Hartwell, Chairman Emeritus | John A. Beck | Fred J. Brinkman | T. Eugene Smith | Stephen G. Yeonas |
Advisory Board and officers
Advisory Board members |
Name and age | Year first elected to Advisory Board1 | Principal occupations(s) during past five years | Number of portfolios in Fund complex on which Advisory Board member serves | Other directorships3 held |
Mary K. Bush, 58 | 1995 | President, Bush International Inc. (international financial advisory services) | 1 | Brady Corporation; Briggs & StrattonMGIC Investment Corporation; Pioneer Funds |
Louise M. Cromwell, 61 | 2001 | Retired Partner, Shaw Pittman | 1 | None |
C. Richard Pogue, 69 | 2001 | Retired Executive Vice President, Investment Company Institute | 1 | FAM Equity-Income Fund; FAM Value Fund |
Linda D. Rabbitt, 57 | 2001 | President, Rand Construction Corporation | 1 | Watson Wyatt & Company Holdings |
William J. Shaw, 60 | 2001 | President and Chief Operating Officer, Marriott International, Inc. | 1 | Marriott International, Inc. |
R. Clark Wadlow, 59 | 2005 | Partner, Sidley Austin, LLP | 1 | None |
Other officers |
Name, age, and position with Fund | Year first elected an officer of the Fund1 | Principal occupations(s) during past five years |
Michael W. Stockton, 39 Vice President, Treasurer and Assistant Secretary | 1995 | Vice President, Secretary, Assistant Treasurer, and Director, Washington Management Corporation |
Burton L. Raimi, 67 Secretary | 2005 | General Counsel, Washington Management Corporation; Shareholder, Law Offices of Burton L. Raimi, P.A. (2003-2005), and McCaffrey & Raimi, P.A. (1994-2003) |
Ralph S. Richard, 87 Vice President | 1953 | Vice President, Treasurer, and Director, Washington Management Corporation |
Lois A. Erhard, 53 Vice President | 1983 | Vice President, Washington Management Corporation |
J. Lanier Frank, 45 Assistant Vice President | 1997 | Assistant Vice President, Washington Management Corporation |
Jennifer L. Butler, 40 Assistant Secretary | 2005 | Assistant Vice President, Washington Management Corporation; Former Specialist, Fund Administration, Pacific Investment Management Company |
Ashley L. Shaw,5 37 Assistant Secretary | 2000 | Assistant Secretary, Washington Management Corporation |
The Statement of Additional Information includes additional information about the Fund’s Directors and is available without charge upon request by calling American Funds Service Company at 800/421-0180. The address for all Directors, Advisory Board members, and officers of the Fund is 1101 Vermont Avenue, NW, Washington, DC 20005, Attention: Fund Secretary.
1Directors, Advisory Board members and officers of the Fund serve until their resignation, removal, or retirement.
2Capital Research and Management Company manages the American Funds, consisting of 29 funds. Capital Research and Management Company also manages American Funds Insurance Series,¨ which serves as the underlying investment vehicle for certian variable insurance contracts, and Endowments, whose shareholders are limited to certain nonprofit organizations.
3This includes all directorships other than those in The American Funds Group that are held by each Director or Advisory Board member as a director of a public company or a registered investment company.
4"Interested persons" within the meaning of the 1940 Act on the basis of their affiliation with the Fund’s business manager, Washington Management Corporation.
5Ashley L. Shaw is the daughter of James H. Lemon, Jr.
Offices
Offices of the Fund and of the business manager
Washington Management Corporation
1101 Vermont Avenue, NW
Washington, DC 20005-3521
202/842-5665
Investment adviser
Capital Research and Management Company
333 South Hope Street
Los Angeles, CA 90071-1406
135 South State College Boulevard
Brea, CA 92821-5823
Transfer agent
American Funds Service Company
(Please write to the address nearest you.)
P.O. Box 25065 Santa Ana,
CA 92799-5065
P.O. Box 659522
San Antonio, TX 78265-9522
P.O. Box 6007
Indianapolis, IN 46206-6007
P.O. Box 2280
Norfolk, VA 23501-2280
Custodian of assets
JPMorgan Chase Bank
270 Park Avenue
New York, NY 10017-2070
Counsel
Dechert LLP
1775 I Street, NW
Washington, DC 20006-2401
Independent registered public accounting firm
PricewaterhouseCoopers LLP
350 South Grand Avenue
Los Angeles, CA 90071-2889
Principal underwriter
American Funds Distributors, Inc.
333 South Hope Street
Los Angeles, CA 90071-1406
Washington Mutual Investors Fund files a complete list of its portfolio holdings with the SEC for the first and third quarters of each fiscal year on Form N-Q. This filing is available free of charge on the SEC website. You may also review or, for a fee, copy this filing at the SEC’s Public Reference Room in Washington, DC (800/SEC-0330). Additionally, the list of portfolio holdings also is available by calling AFS.
This report is for the information of shareholders of Washington Mutual Investors Fund, but it may also be used as sales literature when preceded or accompanied by the current prospectus, which gives details about charges, expenses, investment objectives and operating policies of the Fund. If used as sales material after June 30, 2006, this report must be accompanied by an American Funds statistical update for the most recently completed calendar quarter.
What makes American Funds different?
For nearly 75 years, we have followed a consistent philosophy that we firmly believe is in our investors’ best
interests. The range of opportunities offered by our family of just 29 carefully conceived, broadly diversified funds
has attracted over 35 million shareholder accounts.
Our unique combination of strengths includes these five factors: |
| A long-term, value-oriented approach We buy stocks and bonds of well-managed companies at reasonable prices and hold them for the long-term. |
| An extensive global research effort American Funds investment professionals search the world to gain a comprehensive understanding of companies and markets. |
| The multiple portfolio counselor system Our unique method of portfolio management, developed nearly 50 years ago, blends teamwork with individual accountability and has provided American Funds with a sustainable method of achieving fund objectives. |
| Experienced investment professionals American Funds portfolio counselors have an average of 23 years of investment experience, providing a wealth of knowledge and experience that few organizations have. |
| A commitment to low operating expenses The American Funds provide exceptional value for shareholders, with operating expenses that are among the lowest in the mutual fund industry. |
Investors should carefully consider the investment objectives, risks, charges and expenses of the American Funds. This and other important information is contained in the Fund’s prospectus, which can be obtained from your financial adviser and should be read carefully before investing. You may also call American Funds Service Company (AFS) at 800/421-0180 or visit the American Funds website at americanfunds.com. |
"American Funds Proxy Voting Guidelines" — which describes how we vote proxies relating to portfolio securities — is available free of charge on the U.S. Securities and Exchange Commission (SEC) website at sec.gov, on the American Funds website or upon request by calling AFS. The Fund files its proxy voting record with the SEC for the 12 months ended June 30 by August 31. The report also is available on the SEC and American Funds websites.
Washington Mutual Investors Fund, Inc.
1101 Vermont Avenue, NW
Washington, DC 20005
202/842-5665
Lit. No. MFGEAR-901-0606PPrinted on recycled paper
ITEM 2 - Code of Ethics
The Registrant has adopted a code of ethics that applies to its Principal Executive Officer and Principal Financial Officer. The Registrant undertakes to provide to any person without charge, upon request, a copy of the Code of Ethics. Such request can be made to American Funds Service Company at 800/421-0180 or to the Secretary of the Registrant, 1101 Vermont Avenue, NW, Suite 600, Washington, DC 20005.
ITEM 3 - Audit Committee Financial Expert
The Registrant’s Board has determined that Charles A. Bowsher, a member of the Registrant’s Audit Committee, is an “audit committee financial expert” and “independent,” as such terms are defined in this Item. This designation will not increase the designee’s duties, obligations or liability as compared to his duties, obligations and liability as a member of the Audit Committee and of the Board; nor will it reduce the responsibility of the other Audit Committee members. There may be other individuals who, through education or experience, would qualify as “audit committee financial experts” if the Board had designated them as such. Most importantly, the Board believes each member of the Audit Committee contributes significantly to the effective oversight of the Registrant’s financial statements and condition.
ITEM 4 - Principal Accountant Fees and Services
Registrant:
2005 $85,000
2006 $88,000
2005 none
2006 none
2005 $7,000
2006 $7,000
The tax fees consist of professional services relating to the preparation of the registrant’s tax returns.
2005 none
2006 none
ITEM 4 - Principal Accountant Fees and Services (continued)
Adviser and affiliates (includes only fees for non-audit services billed to the adviser and affiliates for engagements that relate directly to the operations and financial reporting of the registrant and were subject to the pre-approval policies described below):
2005 none
2006 none
2005 none
2006 $26,000
2005 none
2006 none
The registrant’s Audit Committee will pre-approve all audit and permissible non-audit services that the Committee considers compatible with maintaining the auditors’ independence. The pre-approval requirement will extend to all non-audit services provided to the registrant, the business manager, the investment adviser, and any entity controlling, controlled by, or under common control with the investment adviser or business manager that provides ongoing services to the registrant, if the engagement relates directly to the operations and financial reporting of the registrant. The Committee will not delegate its responsibility to pre-approve these services to the business manager or investment adviser. The Committee may delegate to one or more Committee members the authority to review and pre-approve audit and permissible non-audit services. Actions taken under any such delegation will be reported to the full Committee at its next meeting. The pre-approval requirement is waived with respect to non-audit services if certain conditions are met. The pre-approval requirement was not waived for any of the services listed above under paragraphs b, c and d.
Aggregate non-audit fees paid to the registrant’s auditors, including fees for all services billed to the adviser and affiliates were $7,000 for fiscal year 2005 and $33,000 for fiscal year 2006. The non-audit services represented by these amounts were brought to the attention of the Committee and considered to be compatible with maintaining the auditors’ independence.
ITEM 5 - Audit Committee of Listed Registrants
Not applicable to this Registrant, insofar as the Registrant is not a listed issuer as defined in Rule 10A-3 under the Securities Exchange Act of 1934.
ITEM 6 - Schedule of Investments
The full schedule of investments for the Fund is included as part of the report to shareholders filed under Item 1 of this Form.
ITEM 7 - Disclosure of Proxy Voting Policies and Procedures for Closed-End Management Investment Companies
Not applicable to this Registrant, insofar as the Registrant is not a closed-end management investment company.
ITEM 8 - Portfolio Managers of Equity Securities by Closed End Management Investment Companies
Not applicable to this Registrant, insofar as the Registrant is not a closed-end management investment company.
ITEM 9 - Purchases of Equity Securities by Closed-End Management Investment Company and Affiliated Purchasers
Not applicable to this Registrant, insofar as the Registrant is not a closed-end management investment company.
ITEM 10 - Submission of Matters to a Vote of Security Holders
There have been no material changes to the procedures by which shareholders may recommend nominees to the registrant’s Board of Directors since the registrant last submitted a proxy statement to its shareholders. The procedures are as follows. The registrant has a Governance Committee comprised solely of persons who are not considered “interested persons” of the registrant within the meaning of the Investment Company Act of 1940. The committee periodically reviews such issues as the Board’s composition, responsibilities, committees, compensation and other relevant issues, and recommends any appropriate changes to the full Board of Directors. While the committee normally is able to identify from its own resources an ample number of qualified candidates, it will consider shareholder suggestions of persons to be considered as nominees to fill future vacancies on the Board. Such suggestions must be sent in writing to the Governance Committee of the registrant, c/o the registrant’s Secretary, and should be accompanied by complete biographical and occupational data on the prospective nominee, along with a written consent of the prospective nominee for consideration of his or her name by the Governance Committee.
ITEM 11 - Controls and Procedures
| (a) | The Registrant’s Principal Executive Officer and Principal Financial Officer have concluded, based on their evaluation of the Registrant’s disclosure controls and procedures (as such term is defined in Rule 30a-3 under the Investment Company Act of 1940), that such controls and procedures are adequate and reasonably designed to achieve the purposes described in paragraph (c) of such rule. |
| (b) | There were no changes in the Registrant’s internal controls over financial reporting (as defined in Rule 30a-3(d) under the Investment Company Act of 1940) that occurred during the Registrant’s last fiscal half-year (the Registrant’s second fiscal half-year in the case of an annual report) that has materially affected, or is reasonably likely to materially affect, the Registrant’s internal control over financial reporting. |
ITEM 12 - Exhibits
| (a) | The Code of Ethics that is the subject of the disclosure required by Item 2 is attached as an exhibit hereto. |
| (b) | The certifications required by Rule 30a-2 of the Investment Company Act of 1940, as amended, and Sections 302 and 906 of the Sarbanes-Oxley Act of 2002 are attached as exhibits hereto. |
SIGNATURES
Pursuant to the requirements of the Securities Exchange Act of 1934 and the Investment Company Act of 1940, the registrant has duly caused this report to be signed on its behalf by the undersigned, thereunto duly authorized.
Washington Mutual Investors Fund, Inc.
By /s/ Jeffery L. Steele
Jeffrey L. Steele, President and PEO
Date: June 28, 2006
Pursuant to the requirements of the Securities Exchange Act of 1934 and the Investment Company Act of 1940, this report has been signed below by the following persons on behalf of the registrant and in the capacities and on the dates indicated.
By /s/ Jeffery L. Steele
Jeffrey L. Steele, President and PEO
Date: June 28, 2006
By /s/ Michael W. Stockton
Michael W. Stockton, Vice President and Treasurer
Date: June 28, 2006