UNITED STATES
SECURITIES AND EXCHANGE COMMISSION
Washington, D.C. 20549
FORM N-CSR
Certified Shareholder Report of
Registered Management Investment Companies
Investment Company Act File Number: 811-604
Washington Mutual Investors Fund, Inc.
(Exact Name of Registrant as specified in charter)
1101 Vermont Avenue, NW
Washington, DC 20005
(Address of principal executive offices)
Jennifer L. Butler
Secretary
Washington Mutual Investors Fund, Inc.
1101 Vermont Avenue, NW
Washington, DC 20005
(name and address of agent for service)
Registrant's telephone number, including area code: (202) 842-5665
Date of fiscal year end: April 30, 2008
Date of reporting period: April 30, 2008
ITEM 1 - Reports to Stockholders
Annual report dated April 30, 2008
The right choice for the long term¨
Washington Mutual Investors Fund
Annual report for the year ended April 30, 2008
Washington Mutual Investors FundSM seeks to provide income and growth of principal through investments in quality common stocks.
This Fund is one of the 30 American Funds. American Funds is one of the nation’s largest mutual fund families. For more than 75 years, Capital Research and Management Company,SM the American Funds adviser, has invested with a long-term focus based on thorough research and attention to risk.
| Contents | |
| Letter to shareholders | 1 |
| Investment adviser’s report | 2 |
| The value of a long-term perspective | 3 |
| Feature article Baby boomers in transition | 6 |
| Investment portfolio | 12 |
| Financial statements | 17 |
| Board of directors, advisory board and other officers | 32 |
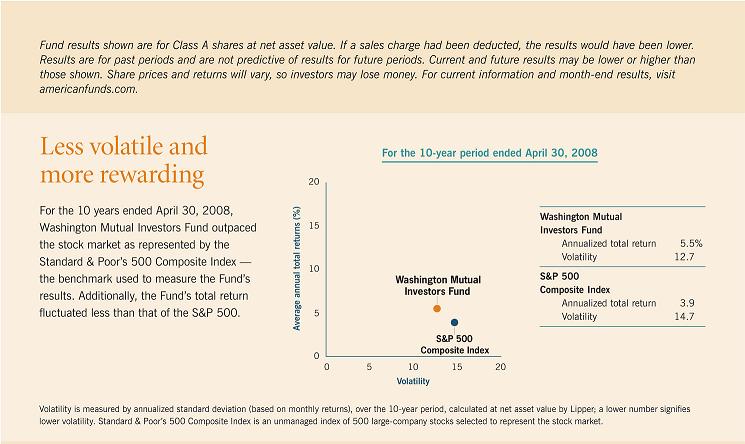
Fund results shown in this report, unless otherwise indicated, are for Class A shares at net asset value. If a sales charge (maximum 5.75%) had been deducted, the results would have been lower. Results are for past periods and are not predictive of results for future periods. Current and future results may be lower or higher than those shown. Share prices and returns will vary, so investors may lose money. Investing for short periods makes losses more likely. Investments are not FDIC-insured, nor are they deposits of or guaranteed by a bank or any other entity. For current information and month-end results, visit americanfunds.com.
Here are the returns on a $1,000 investment with all distributions reinvested for periods ended March 31, 2008 (the most recent calendar quarter-end):
Class A shares Reflecting 5.75% maximum sales charge | | 1 year | 5 years | 10 years |
| Average annual total return | | — | 9.90% | 4.45% |
| Cumulative total return | | –10.67% | 60.31 | 54.62 |
The total annual Fund operating expense ratio for Class A shares as of the most recent fiscal year-end was 0.60%. This figure does not reflect any fee waivers that were in effect; therefore, the actual expense ratio, which reflects the fee waivers described below, was lower.
The Fund’s investment adviser and business manager each waived 5% of their management fees from September 1, 2004 through March 31, 2005, and increased the waivers to 10% on April 1, 2005. Fund results shown reflect actual expenses, with the waivers applied. Fund results would have been lower without the waivers. Please see the Financial Highlights table on pages 25 and 26 for details.
Results for other share classes can be found on page 29.
Fellow shareholders:
For the fiscal year ended April 30, 2008, the value of an investment in Washington Mutual Investors Fund declined by 5.8% (with reinvestment of income dividends of 72 cents per share and a long-term capital gain distribution of $1.94 per share). The second half of the Fund’s fiscal year was particularly difficult for the financial markets and the Fund.
The unmanaged Standard & Poor’s 500 Composite Index reached an all-time high on October 9, 2007, but then began to fall as subprime mortgage defaults accelerated on the back of a rapid decline in housing prices. Several large financial institutions were forced to take substantial losses as the value of many mortgage-backed securities plummeted. Lenders of all types began to tighten loan and credit standards, leading to a credit crunch, particularly in the financial sector. At the same time, the economy continued to slow, growing at the annual rate of only 0.6% in the fourth quarter of 2007 and 0.9% in the first quarter of 2008.
The Federal Reserve responded by gradually lowering the federal funds target rate from 5.25% in September 2007 to 2.00% by the end of April 2008. The Fed has also taken other steps to combat frozen credit markets and the consequent loss of liquidity in the financial sector. While concerns about the financial sector and the economy remain, the stock market recovered some lost ground in April and credit markets appear to be improving. Economists continue to debate whether the country is in a recession. Oil and food prices have been rising, and certainly some segments of the economy are experiencing lower levels of business activity. However, we do believe that the actions of the Federal Reserve and the federal government’s economic stimulus package are likely to have an ameliorating effect on conditions in the financial markets and the economy generally.
Throughout the past fiscal year, the Fund has generally been helped by its positions in the energy, industrial and information technology sectors, while financial and health care holdings have detracted from investment results. More information about the Fund’s results are discussed in the Investment Adviser’s report on page 2.
The chart below shows the Fund’s investment results for the past year and longer periods:
| Average annual total returns for periods ended April 30, 2008, with all distributions reinvested | | 1 year | 5 years | 10 years | Lifetime (Since 7/31/52) |
Washington Mutual Investors Fund (Class A shares) | | –5.8% | 10.3% | 5.5% | 12.5% |
| Standard & Poor’s 500 Composite Index* | | –4.7 | 10.6 | 3.9 | 11.1 |
| *The S&P 500 is unmanaged and does not reflect the effect of sales charges, commissions or expenses. |
Since October 31, 2007, when we last reported to you, 11 new companies appeared in the Fund’s portfolio: American Express, Bard, Burlington Northern Santa Fe, Cisco Systems, Dow Chemical, Hess, Honda Motor, Masco, Royal Dutch Shell, Rohm and Haas, and SunTrust Banks. Six companies have been eliminated: Aon, R.R. Donnelley & Sons, Maxim Integrated Products, Southern Co., TJX Companies and Wm. Wrigley Jr.
As always, we are pleased to hear your comments and questions.
| Cordially, | |  |
| | James H. Lemon, Jr. Vice Chairman of the Board | Jeffrey L. Steele President of the Fund |
May 30, 2008
For current information about the Fund, visit americanfunds.com.
Investment adviser’s report
To meet its income goals, the Fund traditionally invests in quality companies in a wide variety of industries that follow a consistent policy of paying dividends. The approach was no different this past year, but even quality financial companies were damaged by the subprime mortgage collapse and resulting credit crunch. Fortunately, the Fund’s investments in energy, industrials and information technology companies helped offset the unusually challenging year. Washington Mutual Investors Fund posted a loss of 5.8% for the 2008 fiscal year, compared with the 4.7% decline of the unmanaged Standard & Poor’s 500 Composite Index.
Although the Fund slightly trailed the S&P 500 during the past 12 months and for the five years, it continued to outpace the S&P 500 over longer periods by solid margins. For the 10-year period ended April 30, 2008, which includes both the burst of the Internet-technology bubble and the market’s subsequent recovery, the Fund had an average annual total return of 5.5%, compared with the 3.9% of the S&P 500. In addition, the Fund’s share price fluctuated less than the S&P 500, providing a smoother ride for investors. Over its nearly 56-year lifespan, Washington Mutual Investors Fund has had an average annual return of 12.5%, compared with 11.1% for the S&P 500.
The economic picture and outlook
In May 2008, the Federal Reserve characterized the economy as "far from normal," noting that — in light of the ongoing pressures in both the credit and financial markets — it could remain sluggish for some time. In an effort to bolster the economy, the Fed lowered the federal funds rate during the past year and created several lending tools to relieve pressure in lending markets. Even so, the gross domestic product grew at an annual rate of only 0.6% in the fourth quarter of 2007 and 0.9% in the first quarter of the 2008 calendar year.
The Fund’s investments
The Fund’s five largest investment sectors at fiscal year-end as a percentage of net assets were Industrials (14.4%), Financials (14.0%), Energy (14.0%), Health care (11.5%) and Information technology (10.1%). During the past year, energy, industrial and information technology companies were major contributors to the Fund. Oil and gas production, exploration and service companies benefited from record crude oil prices and continuing demand from developing nations such as China, India, Brazil and Russia. Schlumberger, a leading provider of services and technology to the oil industry, rose 36.2%. Industrial companies that benefited from the boom in agriculture and infrastructure construction included Deere (+53.7%) and Caterpillar (+12.7%). In the information technology sector, IBM, one of the Fund’s largest holdings, climbed 18.1%.
The sector that most hampered Fund results was financials. Among the specific stocks detracting from results were Citigroup (–52.9%), Fannie Mae (–52.0%) and Bank of America (–26.2%). Health care companies Merck (–26.0%) and Bristol-Myers Squibb (–23.9%) also slumped.
Although it has been a challenging year, we will continue our long-term strategy of investing in quality companies that meet strict standards of financial soundness and maintain a consistent record of paying dividends. This approach has served the Fund well in all kinds of markets and we believe it will continue to do so in the future.
— Capital Research and Management Company
For current information about the Fund, visit americanfunds.com.
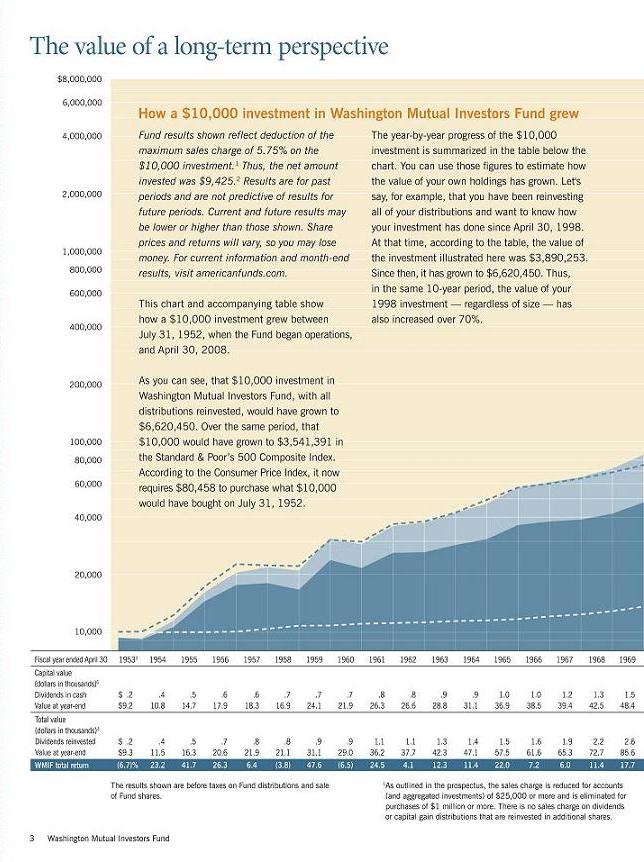
The value of a long-term perspective
Below are plot points for the mountain chart image featured above.
| WASHINGTON MUTUAL INVESTORS FUND |
| MOUNTAIN CHART AND INDEX PLOT POINTS |
| | |
| Results of a $10,000 investment in WMIF, the S&P 500, and the CPI. |
| July 31, 1952 through April 30, 2008 |
| Year | CAPITAL VALUE | TOTAL VALUE | | | |
| ended | Dividends in | | Dividends | | TOTAL | | |
| April 30 | Cash | WMIF6 | Reinvested | WMIF4 | RETURN | S&P500 | CPI7 |
| | | | | | | | |
| 07/31/52 | | $9,425 | | $9,425 | | $10,000 | $10,000 |
19533 | $170 | 9,161 | $170 | 9,330 | -6.7% | 10,094 | 9,963 |
| 1954 | 434 | 10,773 | 449 | 11,494 | 23.2 | 12,282 | 10,037 |
| 1955 | 500 | 14,665 | 542 | 16,288 | 41.7 | 17,295 | 10,000 |
| 1956 | 580 | 17,851 | 654 | 20,565 | 26.3 | 22,938 | 10,075 |
| 1957 | 647 | 18,304 | 756 | 21,877 | 6.4 | 22,520 | 10,449 |
| 1958 | 680 | 16,928 | 825 | 21,055 | -3.8 | 22,269 | 10,824 |
| 1959 | 701 | 24,125 | 885 | 31,071 | 47.6 | 30,569 | 10,861 |
| 1960 | 728 | 21,871 | 948 | 29,041 | -6.5 | 29,850 | 11,049 |
| 1961 | 815 | 26,300 | 1,097 | 36,167 | 24.5 | 37,071 | 11,161 |
| 1962 | 824 | 26,592 | 1,146 | 37,654 | 4.1 | 38,158 | 11,311 |
| 1963 | 891 | 28,838 | 1,279 | 42,278 | 12.3 | 42,296 | 11,423 |
| 1964 | 923 | 31,149 | 1,369 | 47,109 | 11.4 | 49,698 | 11,573 |
| 1965 | 956 | 36,940 | 1,462 | 57,490 | 22.0 | 57,450 | 11,760 |
| 1966 | 1,048 | 38,487 | 1,648 | 61,603 | 7.2 | 60,563 | 12,097 |
| 1967 | 1,176 | 39,424 | 1,906 | 65,270 | 6.0 | 64,731 | 12,397 |
| 1968 | 1,331 | 42,481 | 2,231 | 72,692 | 11.4 | 69,365 | 12,884 |
| 1969 | 1,516 | 48,408 | 2,627 | 85,576 | 17.7 | 75,988 | 13,596 |
| 1970 | 1,605 | 39,049 | 2,874 | 71,603 | -16.3 | 61,834 | 14,419 |
| 1971 | 1,711 | 48,769 | 3,193 | 93,387 | 30.4 | 81,718 | 15,019 |
| 1972 | 1,779 | 47,991 | 3,455 | 95,521 | 2.3 | 87,267 | 15,543 |
| 1973 | 1,818 | 43,290 | 3,671 | 89,522 | -6.3 | 89,214 | 16,330 |
| 1974 | 1,858 | 40,682 | 3,907 | 87,956 | -1.7 | 77,959 | 17,978 |
| 1975 | 2,185 | 42,855 | 4,828 | 98,315 | 11.8 | 79,061 | 19,813 |
| 1976 | 2,350 | 53,771 | 5,498 | 129,949 | 32.2 | 95,785 | 21,011 |
| 1977 | 2,510 | 55,449 | 6,171 | 140,348 | 8.0 | 96,702 | 22,472 |
| 1978 | 2,658 | 54,228 | 6,849 | 144,340 | 2.8 | 100,121 | 23,933 |
| 1979 | 2,870 | 58,180 | 7,785 | 163,075 | 13.0 | 110,959 | 26,442 |
| 1980 | 3,203 | 56,032 | 9,167 | 165,848 | 1.7 | 122,446 | 30,337 |
| 1981 | 4,784 | 72,410 | 14,603 | 230,424 | 38.9 | 160,796 | 33,371 |
| 1982 | 4,097 | 69,851 | 13,327 | 235,768 | 2.3 | 148,977 | 35,543 |
| 1983 | 4,497 | 101,855 | 15,517 | 362,293 | 53.7 | 221,825 | 36,929 |
| 1984 | 4,840 | 100,116 | 17,527 | 373,509 | 3.1 | 225,698 | 38,614 |
| 1985 | 5,465 | 115,473 | 20,783 | 452,498 | 21.1 | 265,541 | 40,037 |
| 1986 | 6,110 | 152,209 | 24,380 | 623,768 | 37.9 | 361,778 | 40,674 |
| 1987 | 6,781 | 180,960 | 28,228 | 771,949 | 23.8 | 457,672 | 42,210 |
| 1988 | 7,116 | 167,083 | 30,815 | 742,856 | -3.8 | 427,911 | 43,858 |
| 1989 | 6,183 | 198,139 | 27,838 | 911,609 | 22.7 | 525,847 | 46,105 |
| 1990 | 8,920 | 202,429 | 41,689 | 971,051 | 6.5 | 581,168 | 48,277 |
| 1991 | 9,136 | 222,016 | 44,574 | 1,113,747 | 14.7 | 683,361 | 50,637 |
| 1992 | 8,319 | 244,607 | 42,315 | 1,272,372 | 14.2 | 779,015 | 52,247 |
| 1993 | 8,468 | 268,131 | 44,625 | 1,442,389 | 13.4 | 850,855 | 53,933 |
| 1994 | 8,583 | 266,513 | 46,719 | 1,479,112 | 2.5 | 896,027 | 55,206 |
| 1995 | 9,790 | 301,054 | 55,060 | 1,730,694 | 17.0 | 1,052,264 | 56,891 |
| 1996 | 10,008 | 381,514 | 58,187 | 2,256,894 | 30.4 | 1,369,880 | 58,539 |
| 1997 | 10,506 | 455,551 | 62,763 | 2,763,032 | 22.4 | 1,714,024 | 60,000 |
| 1998 | 11,033 | 628,864 | 67,443 | 3,890,253 | 40.8 | 2,417,442 | 60,861 |
| 1999 | 11,527 | 707,654 | 71,812 | 4,458,483 | 14.6 | 2,945,129 | 62,247 |
| 2000 | 11,935 | 646,507 | 75,684 | 4,148,130 | -7.0 | 3,243,332 | 64,157 |
| 2001 | 13,153 | 719,687 | 85,030 | 4,709,580 | 13.5 | 2,822,817 | 66,255 |
| 2002 | 13,116 | 700,823 | 86,458 | 4,674,962 | -0.7 | 2,466,687 | 67,341 |
| 2003 | 13,345 | 593,597 | 89,753 | 4,050,310 | -13.4 | 2,138,513 | 68,839 |
| 2004 | 13,383 | 717,050 | 92,016 | 4,989,599 | 23.2 | 2,627,509 | 70,412 |
| 2005 | 14,846 | 749,077 | 104,079 | 5,316,457 | 6.5 | 2,793,876 | 72,884 |
| 2006 | 15,614 | 830,885 | 111,648 | 6,013,586 | 13.1 | 3,224,286 | 75,468 |
| 2007 | 16,895 | 952,250 | 123,209 | 7,027,094 | 16.9 | 3,715,238 | 77,410 |
| 2008 | 19,026 | 879,074 | 141,440 | 6,620,450 | -5.8 | 3,541,391 | 80,458 |
The results shown are before taxes on fund Distributions and sale of Fund shares.
| 1 | As outlined in the prospectus, the sales charge is reduced for accounts (and aggregated investments) of $25,000 or more and is eliminated for purchases of $1 million or more. There is no sales charge on dividends or capital gain distributions that are reinvested in additional shares. |
| 2 | The maximum initial sales charge was 8.5% prior to July 1, 1988. |
| 3 | For the period July 31, 1952 (when the Fund began operations) through April 30, 1953. |
| 4 | Total value includes reinvested dividends of $1,714,914 and reinvested capital gain distributions of $2,643,548. |
| 5 | The S&P 500 cannot be invested in directly, is unmanaged, and does not reflect sales charges, commissions or expenses. |
| 6 | Capital value includes reinvested capital gain distributions of $450,469 but does not reflect income dividends of $315,942 taken in cash. |
| 7 | Computed from data supplied by the U.S. Department of Labor, Bureau of Labor Statistics. |
Baby boomers in transition
Washington Mutual Investors Fund’s role
in the lives of a storied generation
| The nearly 80 million Americans born between 1946 and 1964 may pride themselves on being different, but they have at least one thing in common — they’re all "baby boomers," the largest generation in American history. The oldest of them are now reaching an age commonly associated with retirement, and each day over the next two decades thousands more will follow.
Washington Mutual Investors Fund grew up right along with them. It began operations in July 1952 and over time became one of the nation’s largest mutual funds. These days, the portion of Washington Mutual’s assets representing retirement plans such as IRAs and 401(k)s is larger than most of the more than 4,700 equity funds available to investors.
Over the years, the Fund’s portfolio has often reflected the relative importance of products and industries at various stages in boomers’ lives. Meanwhile, the Fund’s growth in assets over the years has clearly reflected the generation’s financial hopes and dreams. |
|  |
With boomers beginning to celebrate a new chapter in life, we thought it might be timely to take a look at what the Fund may mean to them in the future — and vice versa.
Corporate pension plans and Social Security — no longer a sure thing Unlike their parents, most boomers won’t be able to live on payments from traditional corporate pension plans. A quarter of a century ago, more than six in every 10 U.S. workers were covered by such plans; now it’s only about two in every 10.
Meanwhile, Social Security is anything but secure because the overburdened program was implemented at a time when recipients didn’t live as long as they do now. Indeed, for a couple reaching age 65 today, there’s a better-than-even chance one spouse will live to be at least 90.
So boomers are likely to need more of their own resources to pay the bills. Plenty say they’ll keep working — roughly 80%, according to several AARP surveys. "Some boomers will work until they’re 75 or older," says research analyst and telecommunications expert Brad Vogt, who was born in early 1965 and missed being a boomer by just a few weeks. "They’re not a homogeneous group, all planning to hang up their hats at age 65."
Eventually, though, most will leave paychecks behind and rely on their investments instead. Typically they’ll tap their most liquid assets — checking, savings and money market accounts — before moving on to their taxable investments in stocks and bonds. Putting off withdrawals from retirement accounts for as long as possible is usually a popular strategy because it enables investors to get the most benefit from the compounding of tax-deferred growth. (Your financial adviser can help you decide what would work best in your case.)
Minimizing volatility is crucial Mutual funds that invest in stocks have long been the most popular choice for retirement accounts. They offer professional management of a diversified portfolio of equities that can grow in value and help shareholders stay ahead of inflation. Many boomers are likely to be around for another three, four or even five decades, and the cost of living is sure to keep going up.
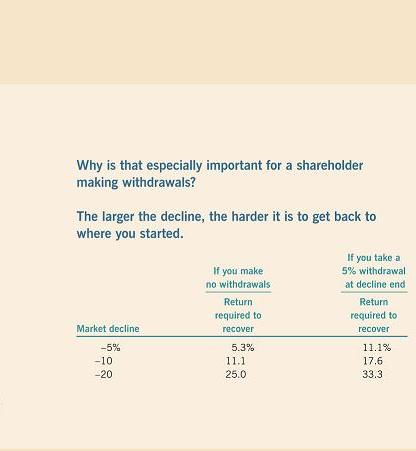
Of course, stock prices can change every day — sometimes dramatically. The fluctuations can be temporarily disconcerting for investors in the process of building their retirement accounts and downright alarming for those taking withdrawals. As portfolio counselor Jim Dunton — who has been in the investment management business since before some baby boomers were born — points out, "When you have to take money out of an account while stock prices are declining, that makes things worse, so it’s especially important to minimize the vulnerability of one’s holdings to down markets." |
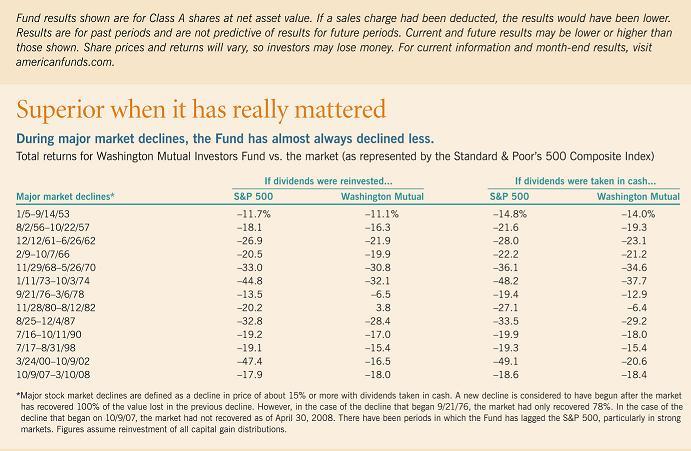
Throughout its 56-year history, Washington Mutual has helped investors reduce the effects of stock market downturns. As you will see in the chart above, the value of an investment in the Fund has typically held up better than Standard & Poor’s 500 Composite Index during major market declines. For example, when the air came out of the dot-com bubble between the spring of 2000 and the autumn of 2002, the S&P 500 tumbled nearly 50%. Meanwhile, the value of an investment in the Fund declined less than 21% (with dividends taken in cash). Of course, there have been periods when the Fund has lagged the S&P 500, but over the long term, losing less in weak markets can be more important than gaining more in strong markets.
Unique standards an integral part of the Fund’s success
Washington Mutual’s shareholders have enjoyed a smoother ride than the market, in part because only select blue chip stocks meet the Fund’s "eligible list" requirements, a series of standards originally established by a federal court in the District of Columbia to ensure prudent decisions by trust fund administrators.
This rigorous screening process typically eliminates more than 95% of the stocks listed on U.S. stock exchanges. Small companies, new companies and those with erratic earnings records are among the many that do not survive the cut. Those that do generally have a long history of paying dividends. As Jim Dunton observes, "There are plenty of reasons to like dividends. They provide regular income. They tend to reflect a company’s
confidence in its long-term prospects. And they can limit downside risk, because a stock’s yield rises when the share price falls, and before long there’s a new group of investors interested in the income."
Another distinctive feature of Washington Mutual is that the Fund must be "fully invested" at all times, with 95% or more of its assets held in equities. The Fund’s founder, Bernard J. Nees, strongly believed in this premise: "How do you make money in the stock market? Be invested at the bottom. How do you ensure you’re invested at the bottom? Always be invested." That can make a big difference. Subtract the contributions of the five most rewarding days the S&P 500 has chalked up in the past 10 years and your gain (not including dividends) would have been 66% lower than if you’d been continuously invested.
U.S.-based portfolio benefits from global trends
Well-established companies like those in Washington Mutual’s portfolio tend to operate worldwide. Indeed, in 2006 some 44% of revenues for Standard & Poor’s 500 companies came from outside the U.S. "Some of our holdings earn more than half their revenues overseas," according to portfolio counselor Alan Berro. "Coca-Cola, for instance, makes more than two-thirds of its sales abroad."
When the Fund began operating in the 1950s, the U.S. was an industrial powerhouse. These days, the domestic economy is focused more on providing services and less on manufacturing products. Some industries have been largely overtaken by foreign competition. U.S. automakers, for example, are not the force they once were — nor are the stocks of those companies the reliable investments they once were. In fact, none currently meet the Fund’s standards. Recognizing this shift, the Fund’s board made a small change to its standards in 2007, authorizing up to 5% of assets to be invested in stocks of issuers domiciled outside the U.S. that are listed on U.S. exchanges — provided that the stocks satisfy even more stringent measures than those required for their U.S. counterparts. Only 16 of approximately 450 possibilities were then selected.
Low turnover has kept costs down
Because so few stocks meet all of the Fund’s requirements, more than a few of those that do become long-term holdings. "Our ideal investments are stocks we don’t ever have to sell," remarks Alan, a triathlete who understands the rewards of going the distance. Not doing a lot of buying and selling has kept costs down, and increased the ultimate return to investors. Over the past decade, the Fund’s turnover rate — the volume of a mutual fund’s holdings sold or replaced annually — has never exceeded 30% a year and usually has been considerably lower. It was 19% in 2007, compared with 83% for the average equity fund, according to Lipper, Inc.
Multiple perspectives, yet balance and continuity
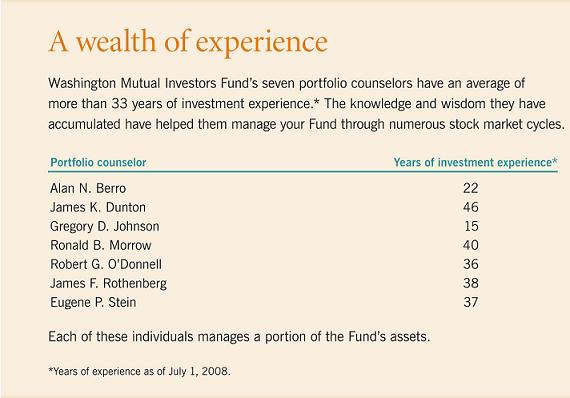
Even if a stock clears all the hurdles, it won’t become part of the Fund unless it appeals to one or more of the professionals who manage assets for Washington Mutual. Seven portfolio counselors each manage a slice of the portfolio as if it were an entire fund. In addition, Washington Mutual has nearly two dozen research analysts who manage another slice.
Mark Merritt, one of the research analysts, observes that this approach allows investment professionals to concentrate on their best ideas. "I don’t see how it’s possible for a fund manager anywhere to have strong opinions on hundreds of companies, or even to know very much about his or her 111th choice. This way each manager has a shorter list of favorites and can be knowledgeable on every one of them."
The system also provides perspective. "We have some people who’ve been around for 40 years or more, and they’ve seen almost everything. We also have colleagues who don’t know what it was like to do business without cell phones and the Internet. So we all benefit from tremendous institutional memory coupled with fresh insights," adds Alan Berro.
"Each of us has a different way of getting from point A to point B," portfolio counselor Greg Johnson explains. "I’m more oriented toward growth. I’m not afraid to sprinkle in technology or health care stocks that don’t offer much in terms of income, balanced with some out-of-favor stocks that have paid very attractive dividends."
Brad Vogt points out that style differences can be complementary. "I approach things stock by stock. The one time I made a big macro decision — to avoid oil stocks — it was wrong. Fortunately, several of the other invest-ment professionals liked that sector more than I did."
Portfolio counselor Jim Rothenberg sees another key advantage to the system: "It provides continuity, because only a small portion of the Fund’s portfolio changes hands at any one time. We can test new portfolio counselors before gradually expanding their responsibilities, and that helps us prepare effectively for transition and succession."
How do boomer needs and tastes affect the Fund’s portfolio?
Walk into almost any major grocery store these days and listen for a minute. Odds are the background music will be rock ’n’ roll — the boomer soundtrack. That wasn’t the case 20 years ago, and the change reflects how important the generation has become in both the supermarket and the stock market.
Boomers as consumers have probably passed their peak acquisition years. They already own their homes, cars and other big-ticket items. According to a 2006 survey by Yankelovich, a consumer research firm, boomers are spending increasing amounts on financial planning, restaurants, entertainment, spas, home improvements, education and even pet-related products.
Brad Vogt believes the pace will increase. "What do you do when you have a lot of free time? Shop, travel, seek out new activities. Then there’s the Internet, which helps make all those things easier to do. This is a generation that has always sought connections to each other, to the community, to the world as a whole — and they’re making many of their connections online. My dad retired a year ago and I noticed that all of a sudden he was sending me more e-mail than I could handle."
Of course, there’s another industry boomers are sure to embrace in years to come, whether they want to or not: "We can be sure health care spending will continue to grow," says Alan Berro.
Adds Jim Dunton, "These trends have been developing over a long period and it will take the length of a generation for their full impact to pass. We take them into account, directly or indirectly, with every investment decision we make for the Fund."
The Fund’s investment professionals are already looking beyond the impact of the boomers. Comments Mark Merritt, "I’m intrigued by the ‘digital divide’ between today’s high school and college students and the rest of us. They interact and collaborate differently. I think about how they might run companies in the future, as well as what sort of consumers and investors they will be."
A Fund for all generations
For some boomers, the goal is simply to have their money last as long as they do. Others, though, may want to leave legacies to their favorite charities. They’re likely to limit their retirement plan with-drawals to the applicable legal minimums — and perhaps even to donate those withdrawals to social causes they favor.
Greg Johnson is a director of the Yosemite Fund, a nonprofit organization that raises money used for preservation and improve-ment projects in Yosemite National Park. He says, "Many of our largest donations have come from baby boomers who grew up wanting to save the world and now have the financial resources to help do that."
Of course, many boomers have named their children as retirement plan beneficiaries. And, as Alan notes, "the Fund stands ready to serve younger generations just as it has served boomers, their parents and grandparents." ■
Investment portfolio April 30, 2008
| Industry sector diversification | Percent of net assets | | Ten largest holdings | Percent of net assets |
| Industrials | 14.36% | | Chevron | 4.09% |
| Financials | 14.01 | | AT&T | 3.95 |
| Energy | 13.96 | | General Electric | 3.50 |
| Health care | 11.50 | | IBM | 2.85 |
| Information technology | 10.15 | | United Parcel Service | 2.25 |
| Consumer discretionary | 8.69 | | ExxonMobil | 2.23 |
| Consumer staples | 7.06 | | Bank of America | 2.18 |
| Telecommunication services | 5.95 | | Exelon | 2.08 |
| Utilities | 5.84 | | Lowe’s | 1.83 |
| Materials | 3.44 | | Coca-Cola | 1.75 |
| Miscellaneous | 1.67 | | | |
| Short-term securities & other assets less liabilities | 3.37 | | | |
| | | | | |
Common stocks — 96.63%
| | Shares | Market value (000) | | Percent of net assets |
| Energy — 13.96% | | | | |
| Apache Corp. | 4,000,000 | $538,720 | | .70% |
| Baker Hughes Inc. | 6,740,000 | 545,131 | | .71 |
| Chevron Corp. | 32,539,800 | 3,128,702 | | 4.09 |
| ConocoPhillips | 5,300,000 | 456,595 | | .60 |
| EOG Resources, Inc. | 6,630,000 | 865,082 | | 1.13 |
| Exxon Mobil Corp. | 18,290,000 | 1,702,250 | | 2.23 |
| Halliburton Co. | 12,095,000 | 555,281 | | .73 |
| Hess Corp. | 2,150,000 | 228,330 | | .30 |
| Marathon Oil Corp. | 22,225,224 | 1,012,804 | | 1.33 |
| Occidental Petroleum Corp. | 3,150,000 | 262,112 | | .34 |
| Royal Dutch Shell PLC, Class B (ADR) | 3,050,000 | 243,085 | | .32 |
| Schlumberger Ltd. | 11,235,000 | 1,129,679 | | 1.48 |
| | | 10,667,771 | | 13.96 |
| | | | | |
| Materials — 3.44% | | | | |
| Air Products and Chemicals, Inc. | 4,000,000 | 393,720 | | .52 |
| Alcoa Inc. | 14,819,300 | 515,415 | | .68 |
| CRH PLC (ADR) | 2,000,000 | 77,240 | | .10 |
| Dow Chemical Co. | 1,000,000 | 40,150 | | .05 |
| E.I. du Pont de Nemours and Co. | 9,800,000 | 479,318 | | .63 |
| Newmont Mining Corp. | 4,200,000 | 185,682 | | .24 |
| PPG Industries, Inc. | 3,539,587 | 217,224 | | .28 |
| Rohm and Haas Co. | 2,675,000 | 142,979 | | .19 |
| Weyerhaeuser Co. | 9,000,000 | 574,920 | | .75 |
| | | 2,626,648 | | 3.44 |
| | | | | |
| Industrials — 14.36% | | | | |
| 3M Co. | 2,800,000 | 215,320 | | .28 |
| Boeing Co. | 7,340,000 | 622,873 | | .82 |
| Burlington Northern Santa Fe Corp. | 1,000,000 | 102,550 | | .13 |
| Caterpillar Inc. | 10,890,000 | 891,673 | | 1.17 |
| Deere & Co. | 5,000,000 | 420,350 | | .55 |
| Eaton Corp. | 1,200,000 | 105,408 | | .14 |
| Emerson Electric Co. | 3,400,000 | 177,684 | | .23 |
| General Dynamics Corp. | 2,950,000 | 266,739 | | .35 |
| General Electric Co. | 81,870,000 | 2,677,149 | | 3.50 |
| Illinois Tool Works Inc. | 6,800,000 | 355,572 | | .47 |
| Ingersoll-Rand Co. Ltd., Class A | 4,200,000 | 186,396 | | .24 |
| Lockheed Martin Corp. | 2,000,000 | 212,080 | | .28 |
| Masco Corp. | 4,950,000 | 90,140 | | .12 |
| Northrop Grumman Corp. | 13,200,000 | 971,124 | | 1.27 |
| Pitney Bowes Inc. | 4,000,000 | 144,440 | | .19 |
| Raytheon Co. | 3,000,000 | 191,910 | | .25 |
| Southwest Airlines Co. | 7,500,000 | 99,300 | | .13 |
| Tyco International Ltd. | 6,943,750 | 324,898 | | .43 |
| Union Pacific Corp. | 1,400,000 | 203,266 | | .27 |
| United Parcel Service, Inc., Class B | 23,795,900 | 1,723,061 | | 2.25 |
| United Technologies Corp. | 13,605,000 | 985,954 | | 1.29 |
| | | 10,967,887 | | 14.36 |
| | | | | |
| Consumer discretionary — 8.69% | | | | |
| Best Buy Co., Inc. | 13,445,000 | 578,404 | | .76 |
| Carnival Corp., units | 12,750,000 | 512,167 | | .67 |
| Gannett Co., Inc. | 4,000,000 | 114,480 | | .15 |
| Harley-Davidson, Inc. | 3,950,000 | 151,087 | | .20 |
| Home Depot, Inc. | 3,240,000 | 93,312 | | .12 |
| Honda Motor Co., Ltd. (ADR) | 5,700,000 | 180,975 | | .24 |
| Johnson Controls, Inc. | 22,298,200 | 786,235 | | 1.03 |
| Limited Brands, Inc. | 16,657,155 | 308,491 | | .40 |
| Lowe’s Companies, Inc. | 55,480,000 | 1,397,541 | | 1.83 |
| McDonald’s Corp. | 12,600,000 | 750,708 | | .98 |
| News Corp., Class A | 16,960,000 | 303,584 | | .40 |
| Target Corp. | 22,120,000 | 1,175,236 | | 1.54 |
| VF Corp. | 3,800,000 | 282,644 | | .37 |
| | | 6,634,864 | | 8.69 |
| | | | | |
| Consumer staples — 7.06% | | | | |
| Avon Products, Inc. | 13,240,000 | 516,625 | | .68 |
| Coca-Cola Co. | 22,655,000 | 1,333,700 | | 1.75 |
| ConAgra Foods, Inc. | 877,100 | 20,664 | | .03 |
| H.J. Heinz Co. | 3,500,000 | 164,605 | | .21 |
| Kellogg Co. | 1,559,962 | 79,823 | | .10 |
| Kimberly-Clark Corp. | 4,250,000 | 271,958 | | .36 |
| PepsiCo, Inc. | 16,802,568 | 1,151,480 | | 1.51 |
| Procter & Gamble Co. | 2,000,000 | 134,100 | | .18 |
| SYSCO Corp. | 7,600,000 | 232,332 | | .30 |
| Walgreen Co. | 16,900,000 | 588,965 | | .77 |
| Wal-Mart Stores, Inc. | 15,465,847 | 896,710 | | 1.17 |
| | | 5,390,962 | | 7.06 |
| | | | | |
| Health care — 11.50% | | | | |
| Abbott Laboratories | 22,710,000 | 1,197,953 | | 1.57 |
| Aetna Inc. | 8,441,400 | 368,045 | | .48 |
Amgen Inc.1 | 8,876,000 | 371,638 | | .49 |
| Bristol-Myers Squibb Co. | 38,190,000 | 839,034 | | 1.10 |
| C. R. Bard, Inc. | 1,430,000 | 134,663 | | .18 |
| Cardinal Health, Inc. | 7,750,000 | 403,542 | | .53 |
| Eli Lilly and Co. | 21,908,191 | 1,054,660 | | 1.38 |
| Johnson & Johnson | 14,740,000 | 988,907 | | 1.29 |
| McKesson Corp. | 2,500,000 | 130,300 | | .17 |
| Medtronic, Inc. | 11,575,000 | 563,471 | | .74 |
| Merck & Co., Inc. | 32,019,487 | 1,218,021 | | 1.59 |
| Pfizer Inc | 17,225,000 | 346,395 | | .45 |
| Stryker Corp. | 4,390,000 | 284,604 | | .37 |
| UnitedHealth Group Inc. | 9,970,000 | 325,321 | | .42 |
| Wyeth | 12,650,000 | 562,546 | | .74 |
| | | 8,789,100 | | 11.50 |
| | | | | |
| Financials — 14.01% | | | | |
| AFLAC Inc. | 3,275,000 | 218,344 | | .29 |
| Allstate Corp. | 8,000,000 | 402,880 | | .53 |
| American Express Co. | 3,000,000 | 144,060 | | .19 |
| American International Group, Inc. | 8,026,600 | 370,829 | | .48 |
| Bank of America Corp. | 44,405,000 | 1,666,964 | | 2.18 |
| Bank of New York Mellon Corp. | 4,500,000 | 195,885 | | .26 |
| Citigroup Inc. | 44,370,100 | 1,121,232 | | 1.47 |
| Countrywide Financial Corp. | 6,000,000 | 34,680 | | .04 |
| Fannie Mae | 29,522,700 | 835,492 | | 1.09 |
| Fifth Third Bancorp | 5,500,000 | 117,865 | | .15 |
| Freddie Mac | 7,807,900 | 194,495 | | .25 |
| HSBC Holdings PLC (ADR) | 5,172,000 | 448,878 | | .59 |
| JPMorgan Chase & Co. | 24,566,000 | 1,170,570 | | 1.53 |
| Lincoln National Corp. | 5,700,000 | 306,432 | | .40 |
| Marsh & McLennan Companies, Inc. | 22,966,900 | 633,657 | | .83 |
| MGIC Investment Corp. | 3,275,000 | 42,673 | | .06 |
| SunTrust Banks, Inc. | 2,300,000 | 128,225 | | .17 |
| U.S. Bancorp | 20,003,000 | 677,902 | | .89 |
| Wachovia Corp. | 13,643,900 | 397,720 | | .52 |
| Washington Mutual, Inc. | 31,750,000 | 390,207 | | .51 |
| Wells Fargo & Co. | 35,616,700 | 1,059,597 | | 1.39 |
| XL Capital Ltd., Class A | 4,225,000 | 147,410 | | .19 |
| | | 10,705,997 | | 14.01 |
| | | | | |
| Information technology — 10.15% | | | | |
Cisco Systems, Inc.1 | 12,780,000 | 327,679 | | .43 |
Google Inc., Class A1 | 1,211,600 | 695,810 | | .91 |
| Hewlett-Packard Co. | 23,585,000 | 1,093,165 | | 1.43 |
| Intel Corp. | 30,900,000 | 687,834 | | .90 |
| International Business Machines Corp. | 18,075,000 | 2,181,652 | | 2.85 |
| Linear Technology Corp. | 3,965,000 | 138,616 | | .18 |
| Microsoft Corp. | 27,734,600 | 790,991 | | 1.04 |
| Motorola, Inc. | 3,500,000 | 34,860 | | .05 |
Oracle Corp.1 | 31,691,943 | 660,777 | | .86 |
| Paychex, Inc. | 8,450,000 | 307,327 | | .40 |
| SAP AG (ADR) | 9,720,000 | 488,236 | | .64 |
| Texas Instruments Inc. | 12,020,000 | 350,503 | | .46 |
| | | 7,757,450 | | 10.15 |
| | | | | |
| Telecommunication services — 5.95% | | | | |
| AT&T Inc. | 78,002,500 | 3,019,477 | | 3.95 |
| Sprint Nextel Corp., Series 1 | 59,500,000 | 475,405 | | .62 |
| Verizon Communications Inc. | 27,320,000 | 1,051,273 | | 1.38 |
| | | 4,546,155 | | 5.95 |
| | | | | |
| Utilities — 5.84% | | | | |
| Ameren Corp. | 4,700,000 | 213,192 | | .28 |
| American Electric Power Co., Inc. | 7,100,000 | 316,873 | | .41 |
| Constellation Energy Group, Inc. | 4,500,000 | 380,925 | | .50 |
| Dominion Resources, Inc. | 4,550,000 | 197,424 | | .26 |
| Entergy Corp. | 8,100,000 | 930,366 | | 1.22 |
| Exelon Corp. | 18,560,000 | 1,586,509 | | 2.08 |
| FPL Group, Inc. | 7,000,000 | 464,030 | | .60 |
| NiSource Inc. | 2,500,000 | 44,750 | | .06 |
| PPL Corp. | 1,500,000 | 72,030 | | .09 |
| Public Service Enterprise Group Inc. | 4,000,000 | 175,640 | | .23 |
| Xcel Energy Inc. | 4,000,000 | 83,200 | | .11 |
| | | 4,464,939 | | 5.84 |
| | | | | |
| Miscellaneous — 1.67% | | | | |
| Other common stocks in initial period of acquisition | | 1,275,530 | | 1.67 |
| | | | | |
Total common stocks (cost: $57,220,160,000) | | 73,827,303 | | 96.63 |
| | | | | |
| Short-term securities — 3.23% | Principal amount (000) | Market value (000) | | Percent of net assets |
| | | | | |
3M Co. 2.05% due 5/21/2008 | $ 32,500 | $ 32,461 | | .04% |
Chevron Corp. 2.30% due 5/16/2008 | 50,000 | 49,949 | | .06 |
Coca-Cola Co. 2.05%–2.67% due 5/16–6/12/20082 | 150,800 | 150,486 | | .20 |
Eaton Corp. 2.62% due 6/10/20082 | 35,000 | 34,895 | | .05 |
Fannie Mae 2.10% due 11/4/2008 | 25,000 | 24,727 | | .03 |
Federal Farm Credit Banks 3.31% due 8/14/2008 | 35,000 | 34,809 | | .05 |
Federal Home Loan Bank 1.67%–2.55% due 6/4–10/20/2008 | 351,512 | 349,992 | | .46 |
Freddie Mac 2.00%–3.625% due 6/12–11/7/2008 | 453,000 | 450,417 | | .59 |
Genentech, Inc. 2.10% due 6/11/20082 | 40,800 | 40,700 | | .05 |
Harvard University 2.45% due 5/9/2008 | 40,000 | 39,975 | | .05 |
Honeywell International Inc. 2.04%–2.06% due 7/11–7/24/20082 | 82,900 | 82,370 | | .11 |
IBM Corp. 2.08% due 6/2/20082 | 40,000 | 39,924 | | .05 |
Johnson & Johnson 2.25%–2.30% due 6/9–6/27/20082 | 122,000 | 121,510 | | .16 |
JPMorgan Chase & Co. 2.95% due 5/6/2008 | 45,400 | 45,377 | | |
Jupiter Securitization Co., LLC 2.70% due 5/14/20082 | 18,100 | 18,081 | | .08 |
Merck & Co., Inc. 2.17% due 5/12/2008 | 25,000 | 24,982 | | .03 |
NetJets Inc. 2.00% due 5/8/20082 | 30,000 | 29,987 | | .04 |
Park Avenue Receivables Co., LLC 2.85% due 5/19/20082 | 100,000 | 99,849 | | .13 |
PepsiCo Inc. 2.10% due 5/6/20082 | 27,355 | 27,345 | | .04 |
Procter & Gamble Co. 2.08% due 5/28/20082 | 52,200 | 52,116 | | |
Procter & Gamble International Funding S.C.A. 2.10% due 6/3–6/27/20082 | 36,300 | 36,161 | | .12 |
Target Corp. 2.15% due 5/19/2008 | 22,100 | 22,075 | | .03 |
U.S. Treasury Bills 1.34%–1.545% due 5/29–10/9/2008 | 185,200 | 184,265 | | .24 |
Union Bank of California, N.A. 2.72% due 5/30/2008 | 50,000 | 50,000 | | .07 |
United Parcel Service Inc. 2.54% due 7/31/20082 | 35,000 | 34,739 | | .04 |
Variable Funding Capital Corp. 2.79% due 5/22/20082 | 88,800 | 88,648 | | .11 |
Wal-Mart Stores Inc. 2.05%–2.10% due 12/9–12/22/20082 | 138,000 | 135,313 | | .18 |
Wells Fargo & Co. 2.24% due 5/14–5/15/2008 | 165,000 | 164,850 | | .22 |
| | | | | |
Total short-term securities (cost: $2,466,666,000) | | 2,466,003 | | 3.23 |
| | | | | |
Total investment securities (cost: $59,686,826,000) | | 76,293,306 | | 99.86 |
| Other assets less liabilities | | 109,787 | | .14 |
| | | | | |
| Net assets | | $76,403,093 | | 100.00% |
| | | | | |
| | | | | |
| "Miscellaneous" securities include holdings in their initial period of acquisition that have not previously been publicly disclosed. |
| | | | | |
1Security did not produce income during the last 12 months. | | | | |
2Purchased in a transaction exempt from registration under the Securities Act of 1933. May be resold in the United States in transactions exempt from registration, normally to qualified institutional buyers. The total value of all such securities was $992,124,000, which represented 1.30% of the net assets of the Fund. |
| | | | | |
| ADR = American Depositary Receipts | | | | |
| | | | | |
| See Notes to financial statements | | | | |
Financial statements
Statement of assets and liabilities at April 30, 2008 | (dollars and shares in thousands, except per-share amounts) |
| Assets: | | | | | | |
| Investment securities at market (cost: $59,686,826) | | | | | $ | 76,293,306 | |
| Cash | | | | | | 341 | |
| Receivables for: | | | | | | | |
| Sales of investments | | $ | 655,079 | | | | | |
| Sales of Fund’s shares | | | 52,383 | | | | | |
| Dividends | | | 129,374 | | | | 836,836 | |
| | | | | | | | 77,130,483 | |
| Liabilities: | | | | | | | | |
| Payables for: | | | | | | | | |
| Purchases of investments | | | 557,515 | | | | | |
| Repurchases of Fund’s shares | | | 102,708 | | | | | |
| Management services | | | 14,890 | | | | | |
| Services provided by affiliates | | | 50,389 | | | | | |
| Director and advisory board deferred compensation | | | 1,787 | | | | | |
| Other | | | 101 | | | | 727,390 | |
| Net assets at April 30, 2008 | | | | | | $ | 76,403,093 | |
| | | | | | | | | |
| Net assets consist of: | | | | | | | | |
| Capital paid in on shares of capital stock | | | | | | $ | 58,193,586 | |
| Undistributed net investment income | | | | | | | 525,739 | |
| Undistributed net realized gain | | | | | | | 1,077,288 | |
| Net unrealized appreciation | | | | | | | 16,606,480 | |
| Net assets at April 30, 2008 | | | | | | $ | 76,403,093 | |
Total authorized capital stock — 4,000,000 shares, $.001 par value (2,395,697 total shares outstanding) |
| | Net assets | Shares outstanding | Net asset value per share* |
| Class A | $60,781,928 | 1,903,957 | $31.92 |
| Class B | 2,725,506 | 85,942 | 31.71 |
| Class C | 2,979,293 | 94,143 | 31.65 |
| Class F | 2,947,430 | 92,537 | 31.85 |
| Class 529-A | 1,088,732 | 34,143 | 31.89 |
| Class 529-B | 204,231 | 6,434 | 31.74 |
| Class 529-C | 361,241 | 11,385 | 31.73 |
| Class 529-E | 60,133 | 1,893 | 31.77 |
| Class 529-F | 52,481 | 1,648 | 31.85 |
| Class R-1 | 66,966 | 2,111 | 31.72 |
| Class R-2 | 864,862 | 27,338 | 31.64 |
| Class R-3 | 1,826,683 | 57,513 | 31.76 |
| Class R-4 | 1,124,695 | 35,331 | 31.83 |
| Class R-5 | 1,318,912 | 41,322 | 31.92 |
*Maximum offering price and redemption price per share were equal to the net asset value per share for all share classes, except for Class A and 529-A, for which the maximum offering prices per share were $33.87 and $33.84, respectively.
See Notes to financial statements
Financial statements
Statement of operations for the year ended April 30, 2008 | (dollars in thousands) |
| Investment income: | | | | | | |
| Income: | | | | | | |
| Dividends (net of non-U.S. taxes of $517) | | $ | 2,055,691 | | | | |
| Interest | | | 119,324 | | | $ | 2,175,015 | |
| | | | | | | | | |
| Fees and expenses*: | | | | | | | | |
| Investment advisory services | | | 160,915 | | | | | |
| Business management services | | | 57,171 | | | | | |
| Distribution services | | | 261,321 | | | | | |
| Transfer agent services | | | 58,530 | | | | | |
| Administrative services | | | 21,962 | | | | | |
| Reports to shareholders | | | 2,050 | | | | | |
| Registration statement and prospectus | | | 1,679 | | | | | |
| Postage, stationery and supplies | | | 9,041 | | | | | |
| Director and advisory board compensation | | | 1,080 | | | | | |
| Auditing and legal | | | 327 | | | | | |
| Custodian | | | 414 | | | | | |
| Other | | | 203 | | | | | |
| Total fees and expenses before reimbursements/waivers | | | 574,693 | | | | | |
| Less reimbursements/waivers of fees and expenses: | | | | | | | | |
| Investment advisory services | | | 16,092 | | | | | |
| Business management services | | | 5,718 | | | | | |
| Total fees and expenses after reimbursements/waivers | | | | | | | 552,883 | |
| Net investment income | | | | | | | 1,622,132 | |
| | | | | | | | | |
| Net realized gain and unrealized depreciation on investments: | | | | | | | | |
| Net realized gain on investments | | | | | | | 3,890,592 | |
| Net unrealized depreciation on investments | | | | | | | (10,379,430 | ) |
| Net realized gain and unrealized depreciation on investments | | | | | | | (6,488,838 | ) |
| Net decrease in net assets resulting from operations | | | | | | $ | (4,866,706 | ) |
*Additional information related to class-specific fees and expenses is included in the Notes to financial statements.
| Statements of changes in net assets | (dollars in thousands) |
| | Year ended April 30 | |
| | 2008 | | 2007 | |
| Operations: | | | | |
| Net investment income | $ 1,622,132 | | $ 1,563,276 | |
| Net realized gain on investments | 3,890,592 | | 2,894,512 | |
| Net unrealized (depreciation) appreciation on investments | (10,379,430) | | 8,389,975 | |
| Net (decrease) increase in net assets resulting from operations | (4,866,706) | | 12,847,763 | |
| | | | | |
| Dividends and distributions paid to shareholders: | | | | |
| Dividends from net investment income | (1,632,468) | | (1,512,000) | |
| Distributions from net realized gain on investments | (4,501,360) | | (1,982,588) | |
| Total dividends and distributions paid to shareholders | (6,133,828) | | (3,494,588) | |
| | | | | |
| Net capital share transactions | (777,245) | | (205,260) | |
| | | | | |
| Total (decrease) increase in net assets | (11,777,779) | | 9,147,915 | |
| | | | | |
| Net assets: | | | | |
| Beginning of year | 88,180,872 | | 79,032,957 | |
| End of year (including undistributed net investment income: $525,739 and $536,429, respectively) | $ 76,403,093 | | $88,180,872 | |
See Notes to financial statements
Notes to financial statements
| 1. Organization and significant accounting policies |
Organization — Washington Mutual Investors Fund (the "Fund") is registered under the Investment Company Act of 1940 as an open-end, diversified management investment company. The Fund’s investment objective is to produce current income and to provide an opportunity for growth of principal consistent with sound common stock investing.
The Fund offers 14 share classes consisting of four retail share classes, five 529 college savings plan share classes and five retirement plan share classes. The 529 college savings plan share classes (529-A, 529-B, 529-C, 529-E and 529-F) can be used to save for college education. The five retirement plan share classes (R-1, R-2, R-3, R-4 and R-5) are sold without any sales charges and do not carry any conversion rights. The Fund’s share classes are described below:
| Share class | Initial sales charge | Contingent deferred sales charge upon redemption | Conversion feature |
Class A and 529-A | Up to 5.75% | None (except 1% for certain redemptions within one year of purchase without an initial sales charge) | None |
Class B and 529-B | None | Declines from 5% to 0% for redemptions within six years of purchase | Class B and 529-B convert to Class A and 529-A, respectively, after eight years |
Class C | None | 1% for redemptions within one year of purchase | Class C converts to Class F after 10 years |
Class 529-C | None | 1% for redemptions within one year of purchase | None |
Class 529-E | None | None | None |
Class F and 529-F | None | None | None |
Class R-1, R-2, R-3, R-4 and R-5 | None | None | None |
Holders of all share classes have equal pro rata rights to assets, dividends and liquidation proceeds. Each share class has identical voting rights, except for the exclusive right to vote on matters affecting only its class. Share classes have different fees and expenses ("class-specific fees and expenses"), primarily due to different arrangements for distribution, administrative and shareholder services. Differences in class-specific fees and expenses will result in differences in net investment income and, therefore, the payment of different per-share dividends by each class.
Significant accounting policies — The financial statements have been prepared to comply with accounting principles generally accepted in the United States of America. These principles require management to make estimates and assumptions that affect reported amounts and disclosures. Actual results could differ from those estimates. The following is a summary of the significant accounting policies followed by the Fund:
Security valuation — Equity securities are valued at the official closing price of, or the last reported sale price on, the exchange or market on which such securities are traded, as of the close of business on the day the securities are being valued or, lacking any sales, at the last available bid price. Prices for each security are taken from the principal exchange or market in which the security trades. Fixed-income securities, including short-term securities purchased with more than 60 days left to maturity, are valued at prices obtained from an independent pricing service when such prices are available. However, where the investment adviser deems it appropriate, such securities will be valued at the mean quoted bid and asked prices (or bid prices, if asked prices are not available) or at prices for securities of comparable maturity, quality and type. Securities with both fixed-income and equity characteristics, or equity securities traded principally among fixed-income dealers, are valued in the manner described above for either equity or fixed-income securities, depending on which method is deemed most appropriate by the investment adviser. Short-term securities purchased within 60 days to maturity are valued at amortized cost, which approximates market value. The value of short-term securities originally purchased with maturities greater than 60 days is determined based on an amortized value to par when they reach 60 days or less remaining to maturity. The ability of the issuers of the debt securities held by the Fund to meet their obligations may be affected by economic developments in a specific industry, state or region.
Securities and other assets for which representative market quotations are not readily available or are considered unreliable by the investment adviser are fair valued as determined in good faith under procedures adopted by authority of the Fund’s board of directors. Various factors may be reviewed in order to make a good faith determination of a security’s fair value. These factors include, but are not limited to, the type and cost of the security; contractual or legal restrictions on resale of the security; relevant financial or business developments of the issuer; actively traded similar or related securities; conversion or exchange rights on the security; related corporate actions; significant events occurring after the close of trading in the security; and changes in overall market conditions.
Security transactions and related investment income — Security transactions are recorded by the Fund as of the date the trades are executed with brokers. Realized gains and losses from security transactions are determined based on the specific identified cost of the securities. Dividend income is recognized on the ex-dividend date and interest income is recognized on an accrual basis. Market discounts,
premiums and original issue discounts on fixed-income securities are amortized daily over the expected life of the security.
Class allocations — Income, fees and expenses (other than class-specific fees and expenses) and realized and unrealized gains and losses are allocated daily among the various share classes based on their relative net assets. Class-specific fees and expenses, such as distribution, administrative and shareholder services, are charged directly to the respective share class.
Dividends and distributions to shareholders — Dividends and distributions paid to shareholders are recorded on the ex-dividend date.
| 2. Federal income taxation and distributions |
The Fund complies with the requirements under Subchapter M of the Internal Revenue Code applicable to mutual funds and intends to distribute substantially all of its net taxable income and net capital gains each year. The Fund is not subject to income taxes to the extent such distributions are made. Therefore, no federal income tax provision is required.
The Fund adopted the provisions of Financial Accounting Standards Board Interpretation No. 48 (FIN 48), Accounting for Uncertainty in Income Taxes, on June 29, 2007. The implementation of FIN 48 resulted in no material liability for unrecognized tax benefits and no material change to the beginning net asset value of the Fund.
As of and during the period ended April 30, 2008, the Fund did not have a liability for any unrecognized tax benefits. The Fund recognizes interest and penalties, if any, related to unrecognized tax benefits as income tax expense in the statement of operations. During the period, the Fund did not incur any interest or penalties.
The Fund is not subject to examination by U.S. federal tax authorities for tax years before 2004 and by state tax authorities for tax years before 2004.
Distributions — Distributions paid to shareholders are based on net investment income and net realized gains determined on a tax basis, which may differ from net investment income and net realized gains for financial reporting purposes. These differences are due primarily to differing treatment for items such as short-term capital gains and losses; capital losses related to sales of certain securities within 30 days of purchase; and cost of investments sold. The fiscal year in which amounts are distributed may differ from the year in which the net investment income and net realized gains are recorded by the Fund for financial reporting purposes. The Fund may also designate a portion of the amount paid to redeeming shareholders as a distribution for tax purposes.
During the year ended April 30, 2008, the Fund reclassified $354,000 from undistributed net investment income and $238,000,000 from undistributed net realized gain to capital paid in on shares of capital stock to align financial reporting with tax reporting.
As of April 30, 2008, the tax basis components of distributable earnings, unrealized appreciation (depreciation) and cost of investment securities were as follows:
| | (dollars in thousands) |
| Undistributed ordinary income | $ 527,526 |
| Undistributed long-term capital gain | 1,100,284 |
| Gross unrealized appreciation on investment securities | 21,370,441 |
| Gross unrealized depreciation on investment securities | (4,786,958) |
| Net unrealized appreciation on investment securities | 16,583,483 |
| Cost of investment securities | 59,709,823 |
The tax character of distributions paid to shareholders was as follows (dollars in thousands):
| | | Year ended April 30, 2008 | | Year ended April 30, 2007 |
Share class | | Ordinary income | | Long-term capital gains | | Total distributions paid | | Ordinary income | | Long-term capital gains | | Total distributions paid |
| Class A | | $1,359,595 | | $3,585,283 | | $4,944,878 | | $1,275,081 | | $1,597,354 | | $2,872,435 |
| Class B | | 39,436 | | 166,455 | | 205,891 | | 37,056 | | 75,227 | | 112,283 |
| Class C | | 40,970 | | 180,117 | | 221,087 | | 36,403 | | 78,461 | | 114,864 |
| Class F | | 62,521 | | 169,167 | | 231,688 | | 54,831 | | 70,012 | | 124,843 |
| Class 529-A | | 21,708 | | 60,771 | | 82,479 | | 17,405 | | 22,998 | | 40,403 |
| Class 529-B | | 2,504 | | 11,804 | | 14,308 | | 2,090 | | 4,793 | | 6,883 |
| Class 529-C | | 4,373 | | 20,528 | | 24,901 | | 3,511 | | 8,006 | | 11,517 |
| Class 529-E | | 1,034 | | 3,388 | | 4,422 | | 823 | | 1,280 | | 2,103 |
| Class 529-F | | 1,103 | | 2,796 | | 3,899 | | 794 | | 955 | | 1,749 |
| Class R-1 | | 869 | | 3,940 | | 4,809 | | 637 | | 1,438 | | 2,075 |
| Class R-2 | | 11,428 | | 51,095 | | 62,523 | | 9,964 | | 21,847 | | 31,811 |
| Class R-3 | | 33,998 | | 108,304 | | 142,302 | | 32,045 | | 49,786 | | 81,831 |
| Class R-4 | | 23,449 | | 64,857 | | 88,306 | | 19,453 | | 25,099 | | 44,552 |
| Class R-5 | | 29,480 | | 72,855 | | 102,335 | | 21,907 | | 25,332 | | 47,239 |
| Total | | $1,632,468 | | $4,501,360 | | $6,133,828 | | $1,512,000 | | $1,982,588 | | $3,494,588 |
| | | | | | | | | | | | | |
| 3. Fees and transactions with related parties |
Business management services — The Fund has a Business Management Agreement with Washington Management Corporation (WMC). Under this agreement, WMC provides services necessary to carry on the Fund’s general administrative and corporate affairs. These services encompass matters relating to general corporate governance, regulatory compliance and monitoring of the Fund’s contractual service providers, including custodian operations, shareholder services and Fund share distribution functions. Under the agreement, all expenses chargeable to the Class A shares of the Fund, including compensation to the business manager, shall not exceed 1% of the Class A average net assets of the Fund on an annual basis. The agreement provides for monthly fees, accrued daily, based on a declining series of annual rates beginning with 0.175% on the first $3 billion of daily net assets and decreasing to 0.030% on such assets in excess of $77 billion. WMC is currently waiving 10% of business management services fees. During the year ended April 30, 2008, WMC reduced business management services fees by $5,718,000. As a result, the fee shown on the accompanying financial statements of $57,171,000, which was equivalent to an annualized rate of 0.068%, was reduced to $51,453,000, or 0.061% of average daily net assets. During the year ended April 30, 2008, WMC paid the Fund’s investment adviser $2,320,000 for performing various fund accounting services for the Fund and for The American Funds Tax-Exempt Series I, another registered investment company for which WMC serves as business manager. Johnston, Lemon & Co. Incorporated (JLC), a wholly owned subsidiary of The Johnston-Lemon Group, Incorporated (parent company of WMC), earned $599,000 on its retail sales of shares and distribution plans of the Fund. JLC received no brokerage commissions resulting from the purchases and sales of securities for the investment account of the Fund.
Investment advisory services — Capital Research and Management Company (CRMC), the Fund’s investment adviser, is the parent company of American Funds Service Company¨ (AFS), the Fund’s transfer agent, and American Funds Distributors,¨ Inc. (AFD), the principal underwriter of the Fund’s shares. The Investment Advisory Agreement with CRMC provides for monthly fees accrued daily. These fees are based on a declining series of annual rates beginning with 0.225% on the first $3 billion of daily net assets and decreasing to 0.177% on such assets in excess of $89 billion. CRMC is currently waiving 10% of investment advisory services fees. During the year ended April 30, 2008, total investment advisory services fees waived by CRMC were $16,092,000. As a result, the fee shown on the accompanying financial statements of $160,915,000, which was equivalent to an annualized rate of 0.192%, was reduced to $144,823,000, or 0.173% of average daily net assets.
Class-specific fees and expenses — Expenses that are specific to individual share classes are accrued directly to the respective share class. The principal class-specific fees and expenses are described below:
Distribution services — The Fund has adopted plans of distribution for all share classes, except Class R-5. Under the plans, the board of directors approves certain categories of expenses that are used to finance activities primarily intended to sell Fund shares and service existing accounts. The plans provide for payments, based on an annualized percentage of average daily net assets, ranging from 0.25% to 1.00% as noted below. In some cases, the board of directors has limited the amounts that may be paid to less than the maximum allowed by the plans. All share classes may use up to 0.25% of average daily net assets to pay service fees, or to compensate AFD for paying service fees, to firms that have entered into agreements with AFD to provide certain shareholder services. The remaining amounts available to be paid under each plan are paid to dealers to compensate them for their sales activities.
For Class A and 529-A, the board of directors has also approved the reimbursement of dealer and wholesaler commissions paid by AFD for certain shares sold without a sales charge. These classes reimburse AFD for amounts billed within the prior 15 months but only to the extent that the overall annual expense limit of 0.25% is not exceeded. As of April 30, 2008, there were no unreimbursed expenses subject to reimbursement for Class A or 529-A.
| Share class | Currently approved limits | Plan limits |
| Class A | 0.25% | 0.25% |
| Class 529-A | 0.25 | 0.50 |
| Class B and 529-B | 1.00 | 1.00 |
| Class C, 529-C and R-1 | 1.00 | 1.00 |
| Class R-2 | 0.75 | 1.00 |
| Class 529-E and R-3 | 0.50 | 0.75 |
| Class F, 529-F and R-4 | 0.25 | 0.50 |
Transfer agent services — The Fund has a transfer agent agreement with AFS for Class A and B. Under this agreement, these share classes compensate AFS for transfer agent services including shareholder recordkeeping, communications and transaction processing. AFS is also compensated for certain transfer agent services provided to all other share classes from the administrative services fees paid to CRMC described below.
Administrative services — The Fund has an administrative services agreement with CRMC to provide transfer agent and other related shareholder services for all share classes other than Class A and B. Each relevant share class pays CRMC annual fees up to 0.15% (0.10% for Class R-5) based on its respective average daily net assets. Each relevant share class also pays AFS additional amounts for certain transfer agent services. CRMC and AFS may use these fees to compensate third parties for performing these services. CRMC has agreed to pay AFS on the Fund’s behalf for a portion of the transfer agent services fees for some of the retirement plan share classes. Administrative services fees are presented gross of any payments made by CRMC. Each 529 share class is subject to an additional annual administrative services fee of 0.10% of its respective average daily net assets; this fee is payable to the Commonwealth of Virginia for the maintenance of the 529 college savings plan. Although these amounts are included with administrative services fees on the accompanying financial statements, the Commonwealth of Virginia is not considered a related party.
Expenses under the agreements described above for the year ended April 30, 2008, were as follows (dollars in thousands):
| | | | | | | Administrative services |
Share class | | Distribution services | | Transfer agent services | | CRMC administrative services | | Transfer agent services | | Commonwealth of Virginia administrative services |
| Class A | | $160,222 | | $56,104 | | Not applicable | | Not applicable | | Not applicable |
| Class B | | 30,798 | | 2,426 | | Not applicable | | Not applicable | | Not applicable |
| Class C | | 33,054 | | | | $3,729 | | $514 | | Not applicable |
| Class F | | 7,757 | | | | 3,009 | | 321 | | Not applicable |
Class 529-A | | 2,348 | | | | 983 | | 131 | | $1,109 |
Class 529-B | | 2,155 | | | | 191 | | 49 | | 215 |
Class 529-C | | 3,746 | | Included in | | 332 | | 75 | | 375 |
Class 529-E | | 308 | | administrative | | 55 | | 7 | | 62 |
Class 529-F | | — | | services | | 44 | | 6 | | 50 |
Class R-1 | | 709 | | | | 74 | | 32 | | Not applicable |
Class R-2 | | 7,070 | | | | 1,398 | | 2,493 | | Not applicable |
Class R-3 | | 10,177 | | | | 2,796 | | 845 | | Not applicable |
Class R-4 | | 2,977 | | | | 1,745 | | 41 | | Not applicable |
| Class R-5 | | Not applicable | | | | 1,261 | | 20 | | Not applicable |
| Total | | $261,321 | | $58,530 | | $15,617 | | $4,534 | | $1,811 |
| | | | | | | | | | | |
Director and advisory board deferred compensation — Since the adoption of the deferred compensation plan in 1994, independent directors and advisory board members may elect to defer the cash payment of part or all of their compensation. These deferred amounts, which remain as liabilities of the Fund, are treated as if invested in shares of the Fund or other American Funds. These amounts represent general, unsecured liabilities of the Fund and vary according to the total returns of the selected funds. Director and advisory board compensation of $1,080,000, shown on the accompanying financial statements, includes $1,162,000 in current fees (either paid in cash or deferred) and a net decrease of $82,000 in the value of the deferred amounts.
Affiliated officers and directors — All officers and all interested directors of the Fund are affiliated with WMC. Officers and interested directors do not receive compensation directly from the Fund.
| 4. Investment transactions |
The Fund made purchases and sales of investment securities, excluding short-term securities, of $14,346,446,000 and $18,930,716,000, respectively, during the year ended April 30, 2008.
| 5. Capital share transactions |
Capital share transactions in the Fund were as follows (dollars and shares in thousands):
| | | Sales* | | Reinvestments of dividends and distributions | | Repurchases* | | Net (decrease) increase | |
| Share class | | Amount | | Shares | | Amount | | Shares | | Amount | | Shares | | Amount | | Shares | |
Year ended April 30, 2008 | |
| Class A | | $4,539,386 | | 130,369 | | $4,685,429 | | 136,946 | | $(10,494,108) | | (300,495) | | $(1,269,293) | | (33,180) | |
| Class B | | 116,384 | | 3,359 | | 197,425 | | 5,817 | | (477,569) | | (13,972) | | (163,760) | | (4,796) | |
| Class C | | 297,165 | | 8,550 | | 209,865 | | 6,199 | | (568,835) | | (16,619) | | (61,805) | | (1,870) | |
| Class F | | 687,457 | | 19,989 | | 205,850 | | 6,033 | | (711,508) | | (20,623) | | 181,799 | | 5,399 | |
| Class 529-A | | 164,214 | | 4,721 | | 82,461 | | 2,416 | | (101,966) | | (2,941) | | 144,709 | | 4,196 | |
| Class 529-B | | 16,779 | | 483 | | 14,305 | | 422 | | (16,237) | | (473) | | 14,847 | | 432 | |
| Class 529-C | | 56,392 | | 1,625 | | 24,887 | | 734 | | (43,637) | | (1,263) | | 37,642 | | 1,096 | |
| Class 529-E | | 10,112 | | 291 | | 4,422 | | 130 | | (6,934) | | (201) | | 7,600 | | 220 | |
| Class 529-F | | 13,317 | | 386 | | 3,893 | | 114 | | (5,026) | | (144) | | 12,184 | | 356 | |
| Class R-1 | | 26,619 | | 761 | | 4,766 | | 141 | | (23,725) | | (690) | | 7,660 | | 212 | |
| Class R-2 | | 252,990 | | 7,342 | | 62,491 | | 1,847 | | (311,606) | | (9,032) | | 3,875 | | 157 | |
| Class R-3 | | 488,721 | | 13,952 | | 142,237 | | 4,182 | | (740,133) | | (21,068) | | (109,175) | | (2,934) | |
| Class R-4 | | 357,582 | | 10,359 | | 88,262 | | 2,589 | | (375,296) | | (10,884) | | 70,548 | | 2,064 | |
| Class R-5 | | 579,553 | | 16,475 | | 101,570 | | 2,974 | | (335,199) | | (9,716) | | 345,924 | | 9,733 | |
Total net increase (decrease) | | $7,606,671 | | 218,662 | | $5,827,863 | | 170,544 | | $(14,211,779) | | (408,121) | | $ (777,245) | | (18,915) | |
Year ended April 30, 2007 | |
| Class A | | $5,485,824 | | 161,128 | | $2,714,524 | | 79,294 | | $ (9,140,888) | | (269,164) | | $(940,540) | | (28,742) | |
| Class B | | 167,204 | | 4,940 | | 107,610 | | 3,151 | | (384,471) | | (11,403) | | (109,657) | | (3,312) | |
| Class C | | 416,267 | | 12,327 | | 109,088 | | 3,198 | | (523,219) | | (15,564) | | 2,136 | | (39) | |
| Class F | | 730,783 | | 21,540 | | 110,798 | | 3,241 | | (638,997) | | (18,824) | | 202,584 | | 5,957 | |
| Class 529-A | | 179,183 | | 5,246 | | 40,396 | | 1,180 | | (68,337) | | (2,010) | | 151,242 | | 4,416 | |
| Class 529-B | | 19,859 | | 586 | | 6,881 | | 201 | | (11,217) | | (332) | | 15,523 | | 455 | |
| Class 529-C | | 62,414 | | 1,838 | | 11,515 | | 336 | | (32,201) | | (954) | | 41,728 | | 1,220 | |
| Class 529-E | | 10,815 | | 318 | | 2,103 | | 62 | | (4,589) | | (136) | | 8,329 | | 244 | |
| Class 529-F | | 12,042 | | 354 | | 1,749 | | 51 | | (2,838) | | (83) | | 10,953 | | 322 | |
| Class R-1 | | 26,397 | | 777 | | 2,059 | | 60 | | (13,412) | | (394) | | 15,044 | | 443 | |
| Class R-2 | | 265,526 | | 7,854 | | 31,803 | | 932 | | (225,982) | | (6,658) | | 71,347 | | 2,128 | |
| Class R-3 | | 636,863 | | 18,771 | | 81,789 | | 2,395 | | (627,948) | | (18,481) | | 90,704 | | 2,685 | |
| Class R-4 | | 414,755 | | 12,155 | | 44,401 | | 1,300 | | (382,117) | | (11,283) | | 77,039 | | 2,172 | |
| Class R-5 | | 519,446 | | 15,001 | | 46,541 | | 1,359 | | (407,679) | | (11,828) | | 158,308 | | 4,532 | |
Total net increase (decrease) | | $8,947,378 | | 262,835 | | $3,311,257 | | 96,760 | | $(12,463,895) | | (367,114) | | $(205,260) | | (7,519) | |
*Includes exchanges between share classes of the Fund. | | | | | | | | | | | |
| | |
Financial highlights
| | | (Loss) income from investment operations1 | Dividends and distributions | | | | | | |
| | Net asset value, beginning of year | Net investment income | Net (losses) gains on securities (both realized and unrealized) | Total from investment operations | Dividends (from net investment income) | Distributions (from capital gains) | Total dividends and distributions | Net asset value, end of year | Total return2,3 | Net assets, end of year (in millions) | Ratio of expenses to average net assets before reim- bursements/ waivers | Ratio of expenses to average net assets after reim- bursements/ waivers3 | Ratio of net income to average net assets3 |
| Class A: | | | | | | | | | | | | | |
| Year ended 4/30/2008 | $36.55 | $.71 | $(2.68) | $(1.97) | $(.72) | $(1.94) | $(2.66) | $31.92 | (5.78)% | $60,782 | .60% | .58% | 2.02% |
| Year ended 4/30/2007 | 32.66 | .68 | 4.71 | 5.39 | (.66) | (.84) | (1.50) | 36.55 | 16.85 | 70,811 | .60 | .57 | 2.00 |
| Year ended 4/30/2006 | 29.85 | .66 | 3.20 | 3.86 | (.62) | (.43) | (1.05) | 32.66 | 13.11 | 64,202 | .60 | .57 | 2.13 |
| Year ended 4/30/2005 | 28.79 | .67 | 1.22 | 1.89 | (.60) | (.23) | (.83) | 29.85 | 6.55 | 61,185 | .61 | .60 | 2.24 |
| Year ended 4/30/2004 | 23.99 | .59 | 4.94 | 5.53 | (.54) | (.19) | (.73) | 28.79 | 23.19 | 57,027 | .64 | .64 | 2.14 |
| Class B: | | | | | | | | | | | | | |
| Year ended 4/30/2008 | 36.33 | .44 | (2.67) | (2.23) | (.45) | (1.94) | (2.39) | 31.71 | (6.51) | 2,726 | 1.36 | 1.33 | 1.27 |
| Year ended 4/30/2007 | 32.47 | .42 | 4.69 | 5.11 | (.41) | (.84) | (1.25) | 36.33 | 15.98 | 3,296 | 1.36 | 1.33 | 1.24 |
| Year ended 4/30/2006 | 29.69 | .42 | 3.17 | 3.59 | (.38) | (.43) | (.81) | 32.47 | 12.24 | 3,053 | 1.37 | 1.34 | 1.37 |
| Year ended 4/30/2005 | 28.64 | .43 | 1.22 | 1.65 | (.37) | (.23) | (.60) | 29.69 | 5.75 | 2,902 | 1.38 | 1.37 | 1.47 |
| Year ended 4/30/2004 | 23.88 | .37 | 4.92 | 5.29 | (.34) | (.19) | (.53) | 28.64 | 22.25 | 2,549 | 1.40 | 1.40 | 1.36 |
| Class C: | | | | | | | | | | | | | |
| Year ended 4/30/2008 | 36.26 | .42 | (2.66) | (2.24) | (.43) | (1.94) | (2.37) | 31.65 | (6.54) | 2,979 | 1.41 | 1.38 | 1.22 |
| Year ended 4/30/2007 | 32.41 | .39 | 4.68 | 5.07 | (.38) | (.84) | (1.22) | 36.26 | 15.91 | 3,481 | 1.42 | 1.40 | 1.17 |
| Year ended 4/30/2006 | 29.64 | .40 | 3.16 | 3.56 | (.36) | (.43) | (.79) | 32.41 | 12.15 | 3,113 | 1.43 | 1.41 | 1.30 |
| Year ended 4/30/2005 | 28.59 | .41 | 1.22 | 1.63 | (.35) | (.23) | (.58) | 29.64 | 5.69 | 2,991 | 1.46 | 1.45 | 1.39 |
| Year ended 4/30/2004 | 23.84 | .35 | 4.92 | 5.27 | (.33) | (.19) | (.52) | 28.59 | 22.19 | 2,460 | 1.48 | 1.48 | 1.27 |
| Class F: | | | | | | | | | | | | | |
| Year ended 4/30/2008 | 36.48 | .70 | (2.68) | (1.98) | (.71) | (1.94) | (2.65) | 31.85 | (5.82) | 2,947 | .63 | .61 | 1.99 |
| Year ended 4/30/2007 | 32.60 | .67 | 4.70 | 5.37 | (.65) | (.84) | (1.49) | 36.48 | 16.83 | 3,179 | .62 | .59 | 1.97 |
| Year ended 4/30/2006 | 29.80 | .65 | 3.19 | 3.84 | (.61) | (.43) | (1.04) | 32.60 | 13.06 | 2,646 | .63 | .61 | 2.10 |
| Year ended 4/30/2005 | 28.74 | .64 | 1.22 | 1.86 | (.57) | (.23) | (.80) | 29.80 | 6.47 | 2,505 | .69 | .68 | 2.15 |
| Year ended 4/30/2004 | 23.95 | .56 | 4.94 | 5.50 | (.52) | (.19) | (.71) | 28.74 | 23.13 | 1,917 | .71 | .71 | 2.04 |
| Class 529-A: | | | | | | | | | | | | | |
| Year ended 4/30/2008 | 36.51 | .67 | (2.66) | (1.99) | (.69) | (1.94) | (2.63) | 31.89 | (5.85) | 1,089 | .69 | .66 | 1.93 |
| Year ended 4/30/2007 | 32.63 | .65 | 4.71 | 5.36 | (.64) | (.84) | (1.48) | 36.51 | 16.75 | 1,094 | .67 | .65 | 1.91 |
| Year ended 4/30/2006 | 29.83 | .64 | 3.19 | 3.83 | (.60) | (.43) | (1.03) | 32.63 | 13.01 | 833 | .68 | .65 | 2.05 |
| Year ended 4/30/2005 | 28.76 | .63 | 1.23 | 1.86 | (.56) | (.23) | (.79) | 29.83 | 6.47 | 633 | .71 | .70 | 2.12 |
| Year ended 4/30/2004 | 23.97 | .56 | 4.95 | 5.51 | (.53) | (.19) | (.72) | 28.76 | 23.07 | 426 | .71 | .71 | 2.03 |
| Class 529-B: | | | | | | | | | | | | | |
| Year ended 4/30/2008 | 36.36 | .39 | (2.66) | (2.27) | (.41) | (1.94) | (2.35) | 31.74 | (6.62) | 204 | 1.49 | 1.46 | 1.13 |
| Year ended 4/30/2007 | 32.50 | .38 | 4.68 | 5.06 | (.36) | (.84) | (1.20) | 36.36 | 15.82 | 218 | 1.48 | 1.46 | 1.11 |
| Year ended 4/30/2006 | 29.72 | .38 | 3.17 | 3.55 | (.34) | (.43) | (.77) | 32.50 | 12.07 | 180 | 1.51 | 1.48 | 1.22 |
| Year ended 4/30/2005 | 28.68 | .38 | 1.21 | 1.59 | (.32) | (.23) | (.55) | 29.72 | 5.52 | 148 | 1.58 | 1.57 | 1.26 |
| Year ended 4/30/2004 | 23.91 | .32 | 4.96 | 5.28 | (.32) | (.19) | (.51) | 28.68 | 22.08 | 110 | 1.59 | 1.59 | 1.15 |
| Class 529-C: | | | | | | | | | | | | | |
| Year ended 4/30/2008 | 36.35 | .39 | (2.66) | (2.27) | (.41) | (1.94) | (2.35) | 31.73 | (6.62) | 361 | 1.49 | 1.46 | 1.13 |
| Year ended 4/30/2007 | 32.49 | .38 | 4.69 | 5.07 | (.37) | (.84) | (1.21) | 36.35 | 15.84 | 374 | 1.48 | 1.45 | 1.11 |
| Year ended 4/30/2006 | 29.71 | .38 | 3.18 | 3.56 | (.35) | (.43) | (.78) | 32.49 | 12.10 | 295 | 1.50 | 1.47 | 1.23 |
| Year ended 4/30/2005 | 28.67 | .37 | 1.22 | 1.59 | (.32) | (.23) | (.55) | 29.71 | 5.54 | 226 | 1.57 | 1.56 | 1.27 |
| Year ended 4/30/2004 | 23.91 | .32 | 4.93 | 5.25 | (.30) | (.19) | (.49) | 28.67 | 22.06 | 156 | 1.58 | 1.58 | 1.15 |
| Class 529-E: | | | | | | | | | | | | | |
| Year ended 4/30/2008 | 36.39 | .57 | (2.66) | (2.09) | (.59) | (1.94) | (2.53) | 31.77 | (6.14) | 60 | .98 | .95 | 1.64 |
| Year ended 4/30/2007 | 32.52 | .55 | 4.70 | 5.25 | (.54) | (.84) | (1.38) | 36.39 | 16.44 | 61 | .97 | .94 | 1.62 |
| Year ended 4/30/2006 | 29.74 | .54 | 3.17 | 3.71 | (.50) | (.43) | (.93) | 32.52 | 12.64 | 46 | .98 | .96 | 1.74 |
| Year ended 4/30/2005 | 28.69 | .53 | 1.22 | 1.75 | (.47) | (.23) | (.70) | 29.74 | 6.09 | 35 | 1.05 | 1.04 | 1.79 |
| Year ended 4/30/2004 | 23.92 | .46 | 4.94 | 5.40 | (.44) | (.19) | (.63) | 28.69 | 22.68 | 23 | 1.06 | 1.06 | 1.68 |
| Class 529-F: | | | | | | | | | | | | | |
| Year ended 4/30/2008 | 36.47 | .74 | (2.66) | (1.92) | (.76) | (1.94) | (2.70) | 31.85 | (5.65) | 52 | .48 | .45 | 2.14 |
| Year ended 4/30/2007 | 32.59 | .72 | 4.70 | 5.42 | (.70) | (.84) | (1.54) | 36.47 | 17.01 | 47 | .47 | .44 | 2.11 |
| Year ended 4/30/2006 | 29.79 | .70 | 3.18 | 3.88 | (.65) | (.43) | (1.08) | 32.59 | 13.20 | 32 | .49 | .46 | 2.24 |
| Year ended 4/30/2005 | 28.74 | .60 | 1.22 | 1.82 | (.54) | (.23) | (.77) | 29.79 | 6.35 | 21 | .80 | .79 | 2.03 |
| Year ended 4/30/2004 | 23.96 | .53 | 4.95 | 5.48 | (.51) | (.19) | (.70) | 28.74 | 23.00 | 11 | .81 | .81 | 1.90 |
| | | | | | | | | | | | | | |
| | | | | | | | | | | | | | |
| | | | | | | | | | | | | | |
| | | (Loss) income from investment operations1 | Dividends and distributions | | | | | | |
| | Net asset value, beginning of year | Net investment income | Net (losses) gains on securities (both realized and unrealized) | Total from investment operations | Dividends (from net investment income) | Distributions (from capital gains) | Total dividends and distributions | Net asset value, end of year | Total return3 | Net assets, end of year (in millions) | Ratio of expenses to average net assets before reim- bursements/ waivers | Ratio of expenses to average net assets after reim- bursements/ waivers3 | Ratio of net income to average net assets3 |
| Class R-1: | | | | | | | | | | | | | |
| Year ended 4/30/2008 | $36.33 | $.42 | $(2.66) | $(2.24) | $(.43) | $(1.94) | $(2.37) | $31.72 | (6.55)% | $ 67 | 1.42% | 1.40% | 1.20% |
| Year ended 4/30/2007 | 32.48 | .39 | 4.68 | 5.07 | (.38) | (.84) | (1.22) | 36.33 | 15.86 | 69 | 1.43 | 1.41 | 1.15 |
| Year ended 4/30/2006 | 29.71 | .39 | 3.17 | 3.56 | (.36) | (.43) | (.79) | 32.48 | 12.10 | 47 | 1.47 | 1.44 | 1.26 |
| Year ended 4/30/2005 | 28.68 | .40 | 1.21 | 1.61 | (.35) | (.23) | (.58) | 29.71 | 5.62 | 34 | 1.50 | 1.47 | 1.35 |
| Year ended 4/30/2004 | 23.92 | .35 | 4.93 | 5.28 | (.33) | (.19) | (.52) | 28.68 | 22.16 | 16 | 1.52 | 1.49 | 1.25 |
| Class R-2: | | | | | | | | | | | | | |
| Year ended 4/30/2008 | 36.25 | .41 | (2.66) | (2.25) | (.42) | (1.94) | (2.36) | 31.64 | (6.57) | 865 | 1.44 | 1.41 | 1.19 |
| Year ended 4/30/2007 | 32.40 | .39 | 4.68 | 5.07 | (.38) | (.84) | (1.22) | 36.25 | 15.91 | 985 | 1.47 | 1.41 | 1.15 |
| Year ended 4/30/2006 | 29.64 | .40 | 3.16 | 3.56 | (.37) | (.43) | (.80) | 32.40 | 12.13 | 812 | 1.53 | 1.41 | 1.29 |
| Year ended 4/30/2005 | 28.60 | .41 | 1.22 | 1.63 | (.36) | (.23) | (.59) | 29.64 | 5.68 | 622 | 1.57 | 1.44 | 1.38 |
| Year ended 4/30/2004 | 23.88 | .35 | 4.91 | 5.26 | (.35) | (.19) | (.54) | 28.60 | 22.12 | 371 | 1.69 | 1.45 | 1.26 |
| Class R-3: | | | | | | | | | | | | | |
| Year ended 4/30/2008 | 36.38 | .58 | (2.67) | (2.09) | (.59) | (1.94) | (2.53) | 31.76 | (6.13) | 1,827 | .95 | .93 | 1.67 |
| Year ended 4/30/2007 | 32.51 | .55 | 4.70 | 5.25 | (.54) | (.84) | (1.38) | 36.38 | 16.45 | 2,199 | .96 | .93 | 1.63 |
| Year ended 4/30/2006 | 29.73 | .54 | 3.18 | 3.72 | (.51) | (.43) | (.94) | 32.51 | 12.68 | 1,878 | .97 | .94 | 1.75 |
| Year ended 4/30/2005 | 28.68 | .56 | 1.21 | 1.77 | (.49) | (.23) | (.72) | 29.73 | 6.17 | 1,705 | .95 | .94 | 1.89 |
| Year ended 4/30/2004 | 23.93 | .46 | 4.94 | 5.40 | (.46) | (.19) | (.65) | 28.68 | 22.68 | 1,009 | 1.07 | 1.07 | 1.63 |
| Class R-4: | | | | | | | | | | | | | |
| Year ended 4/30/2008 | 36.46 | .68 | (2.68) | (2.00) | (.69) | (1.94) | (2.63) | 31.83 | (5.87) | 1,125 | .67 | .65 | 1.95 |
| Year ended 4/30/2007 | 32.57 | .65 | 4.72 | 5.37 | (.64) | (.84) | (1.48) | 36.46 | 16.82 | 1,213 | .67 | .64 | 1.92 |
| Year ended 4/30/2006 | 29.78 | .64 | 3.18 | 3.82 | (.60) | (.43) | (1.03) | 32.57 | 13.00 | 1,013 | .68 | .65 | 2.06 |
| Year ended 4/30/2005 | 28.73 | .64 | 1.22 | 1.86 | (.58) | (.23) | (.81) | 29.78 | 6.46 | 830 | .68 | .67 | 2.14 |
| Year ended 4/30/2004 | 23.95 | .56 | 4.94 | 5.50 | (.53) | (.19) | (.72) | 28.73 | 23.11 | 330 | .70 | .70 | 2.01 |
| Class R-5: | | | | | | | | | | | | | |
| Year ended 4/30/2008 | 36.55 | .78 | (2.67) | (1.89) | (.80) | (1.94) | (2.74) | 31.92 | (5.57) | 1,319 | .37 | .35 | 2.24 |
| Year ended 4/30/2007 | 32.65 | .76 | 4.72 | 5.48 | (.74) | (.84) | (1.58) | 36.55 | 17.15 | 1,154 | .37 | .35 | 2.22 |
| Year ended 4/30/2006 | 29.85 | .73 | 3.19 | 3.92 | (.69) | (.43) | (1.12) | 32.65 | 13.34 | 883 | .38 | .35 | 2.34 |
| Year ended 4/30/2005 | 28.79 | .73 | 1.22 | 1.95 | (.66) | (.23) | (.89) | 29.85 | 6.78 | 619 | .38 | .37 | 2.45 |
| Year ended 4/30/2004 | 23.99 | .65 | 4.94 | 5.59 | (.60) | (.19) | (.79) | 28.79 | 23.49 | 395 | .39 | .39 | 2.36 |
| | | | | | | | | | | | | | |
| | | | | Year ended April 30 | |
| | | | | 2008 | | 2007 | | 2006 | | 2005 | | 2004 | |
| Portfolio turnover rate for all classes of shares | | 18% | | 19% | | 13% | | 16% | | 12% | |
1Based on average shares outstanding.
2Total returns exclude any applicable sales charges, including contingent deferred sales charges.
3This column reflects the impact, if any, of certain reimbursements/waivers from CRMC and WMC. During some of the years shown, CRMC and WMC reduced fees for investment advisory services and business management services. In addition, during some of the years shown, CRMC paid a portion of the Fund’s transfer agent fees for certain retirement plan share classes.
See Notes to financial statements
Report of Independent Registered Public Accounting Firm
To the Board of Directors and Shareholders of Washington Mutual Investors Fund, Inc.:
In our opinion, the accompanying statement of assets and liabilities, including the investment portfolio, and the related statements of operations and of changes in net assets and the financial highlights present fairly, in all material respects, the financial position of Washington Mutual Investors Fund, Inc. (the "Fund") at April 30, 2008, the results of its operations for the year then ended, the changes in its net assets for each of the two years in the period then ended and its financial highlights for each of the periods presented, in conformity with accounting principles generally accepted in the United States of America. These financial statements and financial highlights (hereafter referred to as "financial statements") are the responsibility of the Fund’s management; our responsibility is to express an opinion on these financial statements based on our audits. We conducted our audits of these financial statements in accordance with the standards of the Public Company Accounting Oversight Board (United States). Those standards require that we plan and perform the audit to obtain reasonable assurance about whether the financial statements are free of material misstatement. An audit includes examining, on a test basis, evidence supporting the amounts and disclosures in the financial statements, assessing the accounting principles used and significant estimates made by management, and evaluating the overall financial statement presentation. We believe that our audits, which included confirmation of securities owned at April 30, 2008, by correspondence with the custodian and brokers, provide a reasonable basis for our opinion.
PricewaterhouseCoopers LLP
Los Angeles, California
June 9, 2008
We are required to advise you within 60 days of the Fund’s fiscal year-end regarding the federal tax status of certain distributions received by shareholders during such fiscal year. The Fund hereby designates the following amounts for the Fund’s fiscal year ended April 30, 2008:
| Long-term capital gains | $4,739,360,000 |
| Qualified dividend income | 100% |
| Corporate dividends received deduction | 100% |
| U.S. government income that may be exempt from state taxation | $14,495,000 |
Individual shareholders should refer to their Form 1099 or other tax information, which will be mailed in January 2009, to determine the calendar year amounts to be included on their 2008 tax returns. Shareholders should consult their tax advisers.
| Other share class results | unaudited |
| Class B, Class C, Class F and Class 529 |
Fund results shown are for past periods and are not predictive of results for future periods. Current and future results may be lower or higher than those shown. Share prices and returns will vary, so investors may lose money. For current information and month-end results, visit americanfunds.com.
Average annual total returns for periods ended March 31, 2008 (the most recent calendar quarter-end):
| | | 1 year | 5 years | Life of class |
Class B shares — first sold 3/15/00 | | | | |
| Reflecting applicable contingent deferred sales charge (CDSC), maximum of 5%, payable only if shares are sold within six years of purchase | | –10.33% | 10.09% | 5.73% |
| Not reflecting CDSC | | –5.94 | 10.36 | 5.73 |
Class C shares — first sold 3/15/01 | | | | |
| Reflecting CDSC, maximum of 1%, payable only if shares are sold within one year of purchase | | –6.83 | 10.29 | 4.24 |
| Not reflecting CDSC | | –5.96 | 10.29 | 4.24 |
Class F shares* — first sold 3/15/01 | | | | |
Not reflecting annual asset-based fee charged by sponsoring firm | | –5.23 | 11.15 | 5.06 |
Class 529-A shares? — first sold 2/15/02 | | | | |
Reflecting 5.75% maximum sales charge | | –10.74 | 9.81 | 4.60 |
| Not reflecting maximum sales charge | | –5.30 | 11.11 | 5.61 |
Class 529-B shares? — first sold 2/19/02 | | | | |
Reflecting applicable CDSC, maximum of 5%, payable only if shares are sold within six years of purchase | | –10.43 | 9.92 | 5.03 |
| Not reflecting CDSC | | –6.04 | 10.19 | 5.03 |
Class 529-C shares? — first sold 2/15/02 | | | | |
Reflecting CDSC, maximum of 1%, payable only if shares are sold within one year of purchase | | –6.92 | 10.19 | 4.73 |
| Not reflecting CDSC | | –6.04 | 10.19 | 4.73 |
Class 529-E shares*? — first sold 3/1/02 | | –5.56 | 10.76 | 4.76 |
Class 529-F shares*? — first sold 9/16/02 | | | | |
Not reflecting annual asset-based fee charged by sponsoring firm | | –5.08 | 11.20 | 8.91 |
*These shares are sold without any initial or contingent deferred sales charge. ?Results shown do not reflect the $10 initial account setup fee and an annual $10 account maintenance fee. | | |
The Fund’s investment adviser and business manager each waived 5% of their management fees from September 1, 2004 through March 31, 2005, and increased the waivers to 10% on April 1, 2005. Fund results shown reflect the waivers, without which they would have been lower. Please see the Financial Highlights table on pages 25 and 26 for details.
For information regarding the differences among the various share classes, please refer to the Fund’s prospectus.
As a shareholder of the Fund, you incur two types of costs: (1) transaction costs such as initial sales charges on purchase payments and contingent deferred sales charges on redemptions (loads); and (2) ongoing costs, including management fees; distribution and service (12b-1) fees; and other expenses. This example is intended to help you understand your ongoing costs (in dollars) of investing in the Fund so you can compare these costs with the ongoing costs of investing in other mutual funds. The example is based on an investment of $1,000 invested at the beginning of the period and held for the entire period (November 1, 2007 through April 30, 2008).
Actual expenses:
The first line of each share class in the table on the next page provides information about actual account values and actual expenses. You may use the information in this line, together with the amount you invested, to estimate the expenses that you paid over the period. Simply divide your account value by $1,000 (for example, an $8,600 account value divided by $1,000 = 8.6), then multiply the result by the number in the first line under the heading entitled "Expenses paid during period" to estimate the expenses you paid on your account during this period.
Hypothetical example for comparison purposes:
The second line of each share class in the table on the next page provides information about hypothetical account values and hypothetical expenses based on the actual expense ratio for the share class and an assumed rate of return of 5.00% per year before expenses, which is not the actual return of the share class. The hypothetical account values and expenses may not be used to estimate the actual ending account balance or expenses you paid for the period. You may use this information to compare the ongoing costs of investing in the Fund and other funds. To do so, compare this 5.00% hypothetical example with the 5.00% hypothetical examples that appear in the shareholder reports of the other funds.
Notes:
There are some account fees that are charged to certain types of accounts, such as individual retirement accounts and 529 college savings plan accounts (generally, a $10 fee is charged to set up the account and an additional $10 fee is charged to the account annually) that would increase the amount of expenses paid on your account. In addition, retirement plan participants may be subject to certain fees charged by the plan sponsor, and Class F and 529-F shareholders may be subject to fees charged by financial intermediaries, typically ranging from 0.75% to 1.50% of assets annually depending on services offered. You can estimate the impact of these fees by adding the amount of the fees to the total estimated expenses you paid on your account during the period as calculated above. In addition, your ending account value would also be lower by the amount of these fees.
Please note that the expenses shown in the table are meant to highlight your ongoing costs only and do not reflect any transactional costs, such as sales charges (loads). Therefore, the second line of each share class in the table is useful in comparing ongoing costs only, and will not help you determine the relative total costs of owning different funds. In addition, if these transactional costs were included, your costs would have been higher.
| | Beginning account value 11/1/2007 | Ending account value 4/30/2008 | Expenses paid during period* | Annualized expense ratio |
Class A — actual return | $1,000.00 | $ 902.54 | $2.79 | .59% |
Class A — assumed 5% return | 1,000.00 | 1,021.93 | 2.97 | .59 |
Class B — actual return | 1,000.00 | 899.23 | 6.37 | 1.35 |
Class B — assumed 5% return | 1,000.00 | 1,018.15 | 6.77 | 1.35 |
Class C — actual return | 1,000.00 | 899.11 | 6.56 | 1.39 |
Class C — assumed 5% return | 1,000.00 | 1,017.95 | 6.97 | 1.39 |
Class F — actual return | 1,000.00 | 902.50 | 2.93 | .62 |
Class F — assumed 5% return | 1,000.00 | 1,021.78 | 3.12 | .62 |
Class 529-A — actual return | 1,000.00 | 902.33 | 3.17 | .67 |
Class 529-A — assumed 5% return | 1,000.00 | 1,021.53 | 3.37 | .67 |
Class 529-B — actual return | 1,000.00 | 898.75 | 6.94 | 1.47 |
Class 529-B — assumed 5% return | 1,000.00 | 1,017.55 | 7.37 | 1.47 |
Class 529-C — actual return | 1,000.00 | 898.72 | 6.94 | 1.47 |
Class 529-C — assumed 5% return | 1,000.00 | 1,017.55 | 7.37 | 1.47 |
Class 529-E — actual return | 1,000.00 | 900.93 | 4.54 | .96 |
Class 529-E — assumed 5% return | 1,000.00 | 1,020.09 | 4.82 | .96 |
Class 529-F — actual return | 1,000.00 | 903.46 | 2.18 | .46 |
Class 529-F — assumed 5% return | 1,000.00 | 1,022.58 | 2.31 | .46 |
Class R-1 — actual return | 1,000.00 | 899.17 | 6.52 | 1.38 |
Class R-1 — assumed 5% return | 1,000.00 | 1,018.00 | 6.92 | 1.38 |
Class R-2 — actual return | 1,000.00 | 899.18 | 6.66 | 1.41 |
Class R-2 — assumed 5% return | 1,000.00 | 1,017.85 | 7.07 | 1.41 |
Class R-3 — actual return | 1,000.00 | 901.25 | 4.35 | .92 |
Class R-3 — assumed 5% return | 1,000.00 | 1,020.29 | 4.62 | .92 |
Class R-4 — actual return | 1,000.00 | 902.48 | 3.07 | .65 |
Class R-4 — assumed 5% return | 1,000.00 | 1,021.63 | 3.27 | .65 |
Class R-5 — actual return | 1,000.00 | 903.85 | 1.66 | .35 |
Class R-5 — assumed 5% return | 1,000.00 | 1,023.12 | 1.76 | .35 |
| *The "expenses paid during period" are equal to the "annualized expense ratio," multiplied by the average account value over the period, multiplied by the number of days in the period (182), and divided by 366 (to reflect the one-half year period). |
Board of directors and directors emeriti
| Independent directors |
Name and age | Year first elected a director of the Fund1 | Principal occupation(s) during past five years | Number of portfolios in Fund complex2 overseen by director | Other directorships3 held |
Cyrus A. Ansary, 74 Chairman of the Board (Independent and Non-Executive) | 1983 | President, Investment Services International Co., LLC (private investment company for various operating entities) | 3 | JPMorgan Value Opportunities Fund |
Nariman Farvardin, 51 | 2007 | Senior Vice President for Academic Affairs & Provost, University of Maryland; Former Dean, The A. James Clark School of Engineering, University of Maryland | 1 | None |
Barbara Hackman Franklin, 68 | 2005 | President and CEO, Barbara Franklin Enterprises (international business and governance consulting); Former U.S. Secretary of Commerce | 3 | Aetna, Inc.; The Dow Chemical Company; JPMorgan Value Opportunities Fund |
R. Clark Hooper, 61 | 2003 | Private investor; Former President, Dumbarton Group LLC (securities industry consulting); Former Executive Vice President — Policy and Oversight, NASD | 18 | JPMorgan Value Opportunities Fund; The Swiss Helvetia Fund Inc. |
James C. Miller III, 65 | 1992 | Senior Adviser, Husch Blackwell Sanders LLP; Former Chairman, The CapAnalysis Group, LLC (economic, financial and regulatory consulting); Former Director, U.S. Office of Management and Budget | 3 | Clean Energy Fuels Corporation; JPMorgan Value Opportunities Fund |
Donald L. Nickles, 59 | 2007 | Chairman of the Board and Chief Executive Officer, The Nickles Group (consulting and business venture firm); Former United States Senator | 1 | Chesapeake Energy Corporation; Fortress International Group, Inc.; Valero Energy Corporation |
Katherine D. Ortega, 73 | 2002 | Former Treasurer of the United States | 3 | JPMorgan Value Opportunities Fund; The Kroger Co. |
J. Knox Singleton, 59 | 2001 | President and Chief Executive Officer, INOVA Health System | 3 | Healthcare Realty Trust, Inc.; JPMorgan Value Opportunities Fund |
Interested directors4 |
Name, age and position with Fund | Year first elected a director or officer of the Fund1 | Principal occupation(s) during past five years | Number of portfolios in Fund complex2 overseen by director | Other directorships3 held |
James H. Lemon, Jr., 72 Vice Chairman of the Board | 1971 | Chairman of the Board and Chief Executive Officer, The Johnston-Lemon Group, Incorporated (financial services holding company) | 3 | JPMorgan Value Opportunities Fund |
Harry J. Lister, 72 | 1972 | Director, Washington Management Corporation | 1 | None |
Jeffrey L. Steele, 62 President | 2000 | President and Director, Washington Management Corporation | 3 | JPMorgan Value Opportunities Fund |
| Directors emeriti |
Stephen Hartwell, Chairman Emeritus |
| Charles A. Bowsher | Fred J. Brinkman | Daniel J. Callahan III | Edward W. Kelly, Jr. | T. Eugene Smith |
The Statement of Additional Information includes additional information about the Fund’s directors and is available without charge upon request by calling American Funds Service Company at 800/421-0180. The address for all directors, advisory board members and officers of the Fund is 1101 Vermont Avenue, NW, Washington, DC 20005, Attention: Fund Secretary.
Advisory board and other officers
| Advisory board members |
Name and age | Year first elected to advisory board1 | Principal occupation(s) during past five years | Number of portfolios in Fund complex on which advisory board member serves | Other directorships3 held |
Mary K. Bush, 60 | 1995 | President, Bush International, LLC (international financial advisory services) | 1 | Briggs & Stratton; Discover Financial Services; ManTech International Corporation; Pioneer Funds; UAL Corporation |
Louise M. Cromwell, 63 | 2001 | Retired Partner, Shaw Pittman | 1 | None |
Jeffrey A. Eisenach, 50 | 2008 | Chairman of the Board, Criterion Economics, LLC (economic litigation, regulation and legislation consulting); Former Chairman and President, The CapAnalysis Group, LLC (economic, financial and regulatory consulting) | 1 | None |
C. Richard Pogue, 71 | 2001 | Retired Executive Vice President, Investment Company Institute | 1 | FAM Equity-Income Fund; FAM Value Fund |
Linda D. Rabbitt, 59 | 2001 | President, Rand Construction Corporation | 1 | Watson Wyatt & Company Holdings |
William J. Shaw, 62 | 2001 | President and Chief Operating Officer, Marriott International, Inc. | 1 | Marriott International, Inc. |
Robert G. Templin, Jr., 60 | 2008 | President, Northern Virginia Community College | 1 | None |
R. Clark Wadlow, 61 | 2005 | Senior Counsel, Sidley Austin, LLP | 1 | None |
| Other officers |
Name, age and position with Fund | Year first elected an officer of the Fund1 | Principal occupation(s) during past five years |
Michael W. Stockton, 41 Vice President, Treasurer and Assistant Secretary | 1995 | Senior Vice President, Secretary, Treasurer and Director; Washington Management Corporation |
Lois A. Erhard, 55 Vice President | 1983 | Vice President, Washington Management Corporation |
J. Lanier Frank, 47 Assistant Vice President | 1997 | Assistant Vice President, Washington Management Corporation |
Jennifer L. Butler, 42 Secretary | 2005 | Vice President and Assistant Secretary, Washington Management Corporation; Former Specialist, Fund Administration, Pacific Investment Management Company |
Stephanie L. Pfromer, 39 Assistant Secretary | 2007 | Vice President and General Counsel, Washington Management Corporation; Former Vice President and Senior Counsel, The BISYS Group, Inc. |
Ashley L. Shaw,5 39 Assistant Secretary | 2000 | Vice President and Assistant General Counsel, Washington Management Corporation |
Curt M. Scott, 29 Assistant Treasurer | 2006 | Assistant Vice President and Assistant Treasurer, Washington Management Corporation; Former Financial Analyst, The BISYS Group, Inc. |
1Directors, advisory board members and officers of the Fund serve until their resignation, removal or retirement.
2Capital Research and Management Company manages the American Funds, consisting of 30 funds. Capital Research and Management Company also manages American Funds Insurance Series,¨ which serves as the underlying investment vehicle for certain variable insurance contracts; American Funds Target Date Retirement Series,¨ which is available to investors in tax-deferred retirement plans and IRAs; and Endowments, whose shareholders are limited to certain nonprofit organizations.
3This includes all directorships other than those in the American Funds that are held by each director or advisory board member as a director of a public company or a registered investment company.
4"Interested persons" within the meaning of the 1940 Act on the basis of their affiliation with the Fund’s business manager, Washington Management Corporation.
5Ashley L. Shaw is the daughter of James H. Lemon, Jr.
Offices
Offices of the Fund and of the business manager
Washington Management Corporation
1101 Vermont Avenue, NW
Washington, DC 20005-3521
202/842-5665
Investment adviser
Capital Research and Management Company
333 South Hope Street
Los Angeles, CA 90071-1406
6455 Irvine Center Drive
Irvine, CA 92618
Principal underwriter
American Funds Distributors, Inc.
333 South Hope Street
Los Angeles, CA 90071-1406
Custodian of assets
JPMorgan Chase Bank
270 Park Avenue
New York, NY 10017-2070
Transfer agent
American Funds Service Company
(Please write to the address nearest you.)
P.O. Box 25065
Santa Ana, CA 92799-5065
P.O. Box 659522
San Antonio, TX 78265-9522
P.O. Box 6007
Indianapolis, IN 46206-6007
P.O. Box 2280
Norfolk, VA 23501-2280
Counsel
Dechert LLP
1775 I Street, NW
Washington, DC 20006-2401
Independent registered public accounting firm
PricewaterhouseCoopers LLP
350 South Grand Avenue
Los Angeles, CA 90071-2889
Investors should carefully consider the investment objectives, risks, charges and expenses of the American Funds. This and other important information is contained in the Fund’s prospectus, which can be obtained from your financial professional and should be read carefully before investing. You may also call American Funds Service Company (AFS) at 800/421-0180 or visit the American Funds website at americanfunds.com. |
"American Funds Proxy Voting Guidelines" — which describes how we vote proxies relating to portfolio securities — is available free of charge on the U.S. Securities and Exchange Commission (SEC) website at sec.gov, on the American Funds website or upon request by calling AFS. The Fund files its proxy voting record with the SEC for the 12 months ended June 30 by August 31. The report also is available on the SEC and American Funds websites.
Washington Mutual Investors Fund files a complete list of its portfolio holdings with the SEC for the first and third quarters of each fiscal year on Form N-Q. This filing is available free of charge on the SEC website. You may also review or, for a fee, copy this filing at the SEC’s Public Reference Room in Washington, DC (800/SEC-0330). Additionally, the list of portfolio holdings also is available by calling AFS.
This report is for the information of shareholders of Washington Mutual Investors Fund, but it may also be used as sales literature when preceded or accompanied by the current prospectus, which gives details about charges, expenses, investment objectives and operating policies of the Fund. If used as sales material after June 30, 2008, this report must be accompanied by an American Funds statistical update for the most recently completed calendar quarter.
What makes American Funds different?
For more than 75 years, we have followed a consistent philosophy to benefit our investors. Our 30 carefully conceived, broadly diversified funds, in addition to the target date retirement series, offer opportunities that have attracted over 50 million shareholder accounts.
Our unique combination of strengths includes these five factors: |
■ | A long-term, value-oriented approach We seek to buy securities at reasonable prices relative to their prospects and hold them for the long term. |
■ | An extensive global research effort Our investment professionals travel the world to find the best investment opportunities and gain a comprehensive understanding of companies and markets. |
■ | The multiple portfolio counselor system Our unique method of portfolio management, developed 50 years ago, blends teamwork with individual accountability and has provided American Funds with a sustainable method of achieving fund objectives. |
■ | Experienced investment professionals American Funds portfolio counselors have an average of 26 years of investment experience, providing a wealth of knowledge and experience that few organizations have. |
■ | A commitment to low operating expenses The American Funds provide exceptional value for shareholders, with operating expenses that are among the lowest in the mutual fund industry. |
Washington Mutual Investors Fund, Inc.
1101 Vermont Avenue, NW
Washington, DC 20005
202/842-5665
The Capital Group Companies
American FundsCapital Research and ManagementCapital InternationalCapital GuardianCapital Bank and Trust
Lit. No. MFGEAR-901-0608P (S10051)
Printed on paper containing 10% post-consumer waste Printed with inks containing soy and/or vegetable oil
ITEM 2 - Code of Ethics
The Registrant has adopted a code of ethics that applies to its Principal Executive Officer and Principal Financial Officer. The Registrant undertakes to provide to any person without charge, upon request, a copy of the Code of Ethics. Such request can be made to American Funds Service Company at 800/421-0180 or to the Secretary of the Registrant, 1101 Vermont Avenue, NW, Suite 600, Washington, DC 20005.
ITEM 3 - Audit Committee Financial Expert
The Registrant’s Board has determined that Katherine D. Ortega, a member of the Registrant’s Audit Committee, is an “audit committee financial expert” and “independent,” as such terms are defined in this Item. This designation will not increase the designee’s duties, obligations or liability as compared to her duties, obligations and liability as a member of the Audit Committee and of the Board; nor will it reduce the responsibility of the other Audit Committee members. There may be other individuals who, through education or experience, would qualify as “audit committee financial experts” if the Board had designated them as such. Most importantly, the Board believes each member of the Audit Committee contributes significantly to the effective oversight of the Registrant’s financial statements and condition.
ITEM 4 - Principal Accountant Fees and Services
| Registrant: |
| | a) Audit Fees: |
| | | 2007 | $91,000 |
| | | 2008 | $94,000 |
| | | |
| | b) Audit-Related Fees: |
| | | 2007 | None |
| | | 2008 | None |
| | |
| | c) Tax Fees: |
| | | 2007 | $7,000 |
| | | 2008 | $7,000 |
| | | The tax fees consist of professional services relating to the preparation of the Registrant’s tax returns. |
| | |
| | d) All Other Fees: |
| | | 2007 | None |
| | | 2008 | None |
| | | |
| Adviser and affiliates (includes only fees for non-audit services billed to the adviser and affiliates for engagements that relate directly to the operations and financial reporting of the Registrant and were subject to the pre-approval policies described below): |
| | a) Audit-Related Fees: |
| | | 2007 | None |
| | | 2008 | None |
| | |
| | b) Tax Fees: |
| | | 2007 | $4,000 |
| | | 2008 | $4,000 |
| | | The tax fees consist of consulting services relating to the Registrant’s investments. |
| | |
| | c) All Other Fees: |
| | | 2007 | None |
| | | 2008 | None |
| | | |
The Registrant’s audit committee will pre-approve all audit and permissible non-audit services that the committee considers compatible with maintaining the independent registered public accounting firm’s independence. The pre-approval requirement will extend to all non-audit services provided to the Registrant, the business manager, the investment adviser, and any entity controlling, controlled by, or under common control with the investment adviser or business manager that provides ongoing services to the Registrant, if the engagement relates directly to the operations and financial reporting of the Registrant. The committee will not delegate its responsibility to pre-approve these services to the business manager or investment adviser. The committee may delegate to one or more committee members the authority to review and pre-approve audit and permissible non-audit services. Actions taken under any such delegation will be reported to the full committee at its next meeting. The pre-approval requirement is waived with respect to non-audit services if certain conditions are met. The pre-approval requirement was not waived for any of the non-audit services listed above provided to the Registrant, adviser, and affiliates.
Aggregate non-audit fees paid to the Registrant’s auditors, including fees for all services billed to the Registrant and the adviser and affiliates that provide ongoing services to the Registrant were $11,000 for fiscal year 2007 and $11,000 for fiscal year 2008. The non-audit services represented by these amounts were brought to the attention of the committee and considered to be compatible with maintaining the auditors’ independence.
ITEM 5 - Audit Committee of Listed Registrants
Not applicable to this Registrant, insofar as the Registrant is not a listed issuer as defined in Rule 10A-3 under the Securities Exchange Act of 1934.
ITEM 6 – Schedule of Investments
The full schedule of investments for the Fund is included as part of the report to shareholders filed under Item 1 of this Form.
ITEM 7 - Disclosure of Proxy Voting Policies and Procedures for Closed-End Management Investment Companies
Not applicable to this Registrant, insofar as the Registrant is not a closed-end management investment company.
ITEM 8 – Portfolio Managers of Closed-End Management Investment Companies
Not applicable to this Registrant, insofar as the Registrant is not a closed-end management investment company.
ITEM 9 – Purchases of Equity Securities by Closed-End Management Investment Company and Affiliated Purchasers
Not applicable to this Registrant, insofar as the Registrant is not a closed-end management investment company.
ITEM 10 - Submission of Matters to a Vote of Security Holders
There have been no material changes to the procedures by which shareholders may recommend nominees to the registrant’s Board of Directors since the registrant last submitted a proxy statement to its shareholders. The procedures are as follows. The registrant has a Governance Committee comprised solely of persons who are not considered “interested persons” of the registrant within the meaning of the Investment Company Act of 1940. The committee periodically reviews such issues as the Board’s composition, responsibilities, committees, compensation and other relevant issues, and recommends any appropriate changes to the full Board of Directors. While the committee normally is able to identify from its own resources an ample number of qualified candidates, it will consider shareholder suggestions of persons to be considered as nominees to fill future vacancies on the Board. Such suggestions must be sent in writing to the Governance Committee of the registrant, c/o the registrant’s Secretary, and should be accompanied by complete biographical and occupational data on the prospective nominee, along with a written consent of the prospective nominee for consideration of his or her name by the Governance Committee.
ITEM 11 - Controls and Procedures
| (a) | The Registrant’s Principal Executive Officer and Principal Financial Officer have concluded, based on their evaluation of the Registrant’s disclosure controls and procedures (as such term is defined in Rule 30a-3(c) under the Investment Company Act of 1940), that such controls and procedures are adequate and reasonably designed to achieve the purposes described in paragraph (c) of such rule. |
| (b) | There were no changes in the Registrant’s internal controls over financial reporting (as defined in Rule 30a-3(d) under the Investment Company Act of 1940) that occurred during the Registrant’s second fiscal quarter of the period covered by this report that has materially affected, or is reasonably likely to materially affect, the Registrant’s internal control over financial reporting. |
ITEM 12 - Exhibits
| (a) | The Code of Ethics that is the subject of the disclosure required by Item 2 is attached as an exhibit hereto. |
| (b) | The certifications required by Rule 30a-2 of the Investment Company Act of 1940, as amended, and Sections 302 and 906 of the Sarbanes-Oxley Act of 2002 are attached as exhibits hereto. |
SIGNATURES
Pursuant to the requirements of the Securities Exchange Act of 1934 and the Investment Company Act of 1940, the registrant has duly caused this report to be signed on its behalf by the undersigned, thereunto duly authorized.
Washington Mutual Investors Fund, Inc.
By
/s/ Jeffrey L. Steele, President and Principal Executive Officer
Date: June 26, 2008
Pursuant to the requirements of the Securities Exchange Act of 1934 and the Investment Company Act of 1940, this report has been signed below by the following persons on behalf of the registrant and in the capacities and on the dates indicated.
/s/ Jeffrey L. Steele, President and Principal Executive Officer
By
/s/ Michael W. Stockton, Vice President, Principal Financial Officer
and Treasurer
Date: June 26, 2008