The right choice for the long term¨
Washington Mutual Investors Fund
Annual report for the year ended April 30, 2009
Washington Mutual Investors FundSM seeks to provide income and growth of principal through investments in quality common stocks.
This Fund is one of the American Funds. American Funds is one of the nation’s largest mutual fund families. For nearly 80 years, Capital Research and Management Company,SM the American Funds adviser, has invested with a long-term focus based on thorough research and attention to risk.
Fund results shown in this report, unless otherwise indicated, are for Class A shares at net asset value. If a sales charge (maximum 5.75%) had been deducted, the results would have been lower. Results are for past periods and are not predictive of results for future periods. Current and future results may be lower or higher than those shown. Share prices and returns will vary, so investors may lose money. Investing for short periods makes losses more likely. Investments are not FDIC-insured, nor are they deposits of or guaranteed by a bank or any other entity, so they may lose value. For current information and month-end results, visit americanfunds.com.
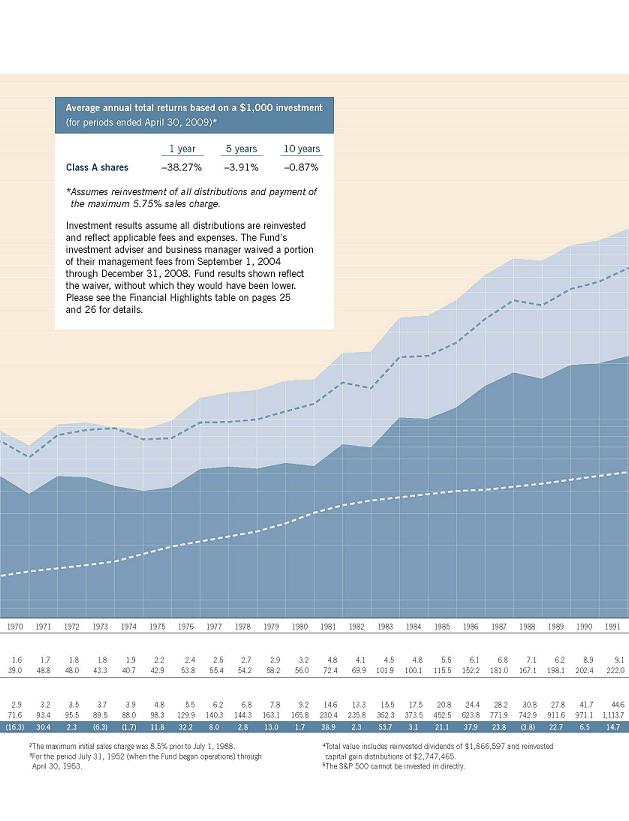
Here are the average annual total returns on a $1,000 investment with all distributions reinvested for periods ended March 31, 2009 (the most recent calendar quarter-end):
| Class A shares | 1 year | 5 years | 10 years | Lifetime (Since 7/31/52) |
| Reflecting 5.75% maximumsales charge | –40.55% | –5.54% | –0.88% | 11.17% |
The total annual Fund operating expense ratio was 0.67% for Class A shares as of April 30, 2009. This figure does not reflect the fee waivers described below.
Investment results assume all distributions are reinvested and reflect applicable fees and expenses. The Fund’s investment adviser and business manager waived a portion of their management fees from September 1, 2004 through December 31, 2008. Fund results shown reflect the waiver, without which they would have been lower. Please see the Financial Highlights table on pages 24 and 25 for details.
Results for other share classes can be found on page 27.
| In this report |
| | |
| | |
| | Special feature |
| | |
| 6 | Where do we go from here? The Fund’s management and investment professionals share their thoughts and answer some questions you might have about recent market events. |
| | |
| | |
| | Contents |
| | |
| 1 | Letter to shareholders |
| | |
| 3 | The value of a long-term perspective |
| | |
| 12 | Investment portfolio |
| | |
| 16 | Financial statements |
| | |
| 30 | Board of directors, advisory board and other officers |
| | |
| | |
The fiscal year ended April 30, 2009, marked the Fund’s most difficult period in its history. The value of an investment declined by 34.5% (with the reinvestment of income dividends of 72 cents per share and a long-term capital gain distribution of 49.5 cents per share). The Standard & Poor’s 500 Composite Index fell 35.3% (with dividends reinvested) during this period.
The S&P 500 fell to its lowest point during 2008 on November 20 but then hit a new low on March 9, 2009. As of the end of the Fund’s fiscal year, the S&P 500 had recovered by 29% from its low in March, perhaps signaling that the worst has passed. The financial crisis that began with the downturn in home prices and defaults in the subprime mortgage market became more intense during 2008 and hit large financial institutions particularly hard in the fall of 2008. The stock market reacted with a furious and sudden fall that drove down all industry sectors as well as stock and bond markets around the world.
The federal government’s strong and multifaceted reaction has helped the financial sector avoid further significant failures and has begun to restore some public confidence. While we remain in the worst recession since the Great Depression — GDP (gross domestic product) fell at an annual rate of 6.3% in the fourth quarter of 2008 and 5.7% in the first quarter of this year — some economic signs are turning more hopeful. The decline in home prices appears to be abating, mortgage rates are quite low and home sales have been increasing. The banking system, while still under significant pressure, does seem to be stabilizing. Consumer spending has been increasing, and business inventories are being drawn down at a fast pace. Unemployment, however, remains high and likely will be among the last economic indicators to change direction. And even the Federal Reserve foresees a slow recovery for the overall economy.
While both consumers and financial institutions seem to be adopting more sensible approaches to the use of debt and leverage, the federal government has been forced to take on much more debt with the likelihood of higher deficits in the years ahead. This leads us to be concerned that, eventually, interest rates and inflation will increase, although this may not happen for some time.
The Investment Adviser’s Report on page 2 provides more information on the Fund’s results, and our feature article beginning on page 6 seeks to provide more information and perspective on the market’s decline during the past year.
Average annual total returns for periods ended April 30, 2009, with all distributions reinvested | | 1 year | 5 years | 10 years | Lifetime (Since 7/31/52) |
Washington Mutual Investors Fund (Class A shares) | | –34.5% | –2.8% | –0.3% | 11.4% |
| Standard & Poor’s 500 Composite Index* | | –35.3 | –2.7 | –2.5 | 10.1 |
| *The S&P 500 is unmanaged and does not reflect the effect of sales charges, commissions or expenses. |
Since October 31, 2008, when we last reported to you, 12 new companies appeared in the Fund’s portfolio: 3M Co., Automatic Data Processing, Baxter International, Clorox, Honeywell International, KeyCorp, Moody’s, Nordstrom, PNC Financial Services Group, Praxair, Sara Lee and Southern Co. Sixteen companies have been eliminated: AFLAC, American International Group, Amgen, Archer Daniels Midland, Bank of New York Mellon, Carnival, Citigroup, Danaher, Dow Chemical, Fannie Mae, Fifth Third Bancorp, Honda Motor, Newmont Mining, Progressive, SunTrust Banks and Sysco.
| Cordially, | |  |
| | James H. Lemon, Jr. Vice Chairman of the Board | Jeffrey L. Steele President of the Fund |
May 29, 2009
For current information about the Fund, visit americanfunds.com.
Investment adviser’s report
Washington Mutual Investors Fund’s objective is to provide income and growth of principal through investments in quality common stocks. To accomplish this goal, the Fund traditionally invests in quality dividend-paying companies in a variety of industries. In past years, financial services companies represented an important source of investment opportunity and had held up well in market declines with their steady stream of dividends. Unfortunately, in the recent 2009 fiscal year, the subprime mortgage meltdown and the global credit crisis had a severe impact on the financial services industry, which has been a cornerstone of income-producing portfolios. These stocks plunged with the rest of the market. As a result, our fully-invested Fund suffered in line with the broad market, posting a loss of 34.5%, only marginally better than the 35.3% loss of the unmanaged Standard & Poor’s 500 Composite Index.
In 2008, battered by the global recession and the cr edit freeze, firms in the S&P 500 cut their dividends by an aggregate of $40.6 billion. As of April 30, 2009, the year-to-date dividend cuts had already reached $45.1 billion. Standard & Poor’s expects the cuts for the full year to be the worst since 1938. While Washington Mutual Investors Fund continued to pay its 18-cent a share quarterly dividend throughout fiscal 2009, it may be difficult to continue paying dividends at this level throughout the coming fiscal year.
Although the Fund slightly trailed the S&P 500 during the past five years, it continued to outpace the S&P 500 by significant margins over longer periods. For the 10-year period ended April 30, 2009, which includes both the burst of the Internet-technology bubble and much of the current steep decline, the Fund had a cumulative total return of –2.7% compared with a cumulative total return of –22.2% by the S&P 500. Over its nearly 57-year lifespan, Washington Mutual Investors Fund has had an average annual return of 11.4%, compared with 10.1% by the S&P 500.
The Fund’s investments
The Fund’s five largest investment sectors at fiscal year-end as a percentage of net assets were Industrials (16.3%), Energy (13.6%), Health care (13.4%), Information technology (9.2%) and Consumer staples (8.9%). The consumer staples sector did the best on a relative basis. Financial and energy companies detracted the most from the Fund’s results. Financial companies that hurt results included Bank of America (–76.2%); HSBC Holdings (–59.0%); and General Electric (–61.3%), an industrial company with large financial holdings. Oil and gas production, exploration and service companies were hurt by the sharp drop in crude oil prices and a slowdown in demand from the worldwide recession. They included Exelon (–46.0%) and ConocoPhillips (-–52.4%).
The financial sector now consists of 7.7% of the Fund’s net assets, compared with 14.0% a year ago, because of declines in financial share prices and sales of some financial holdings. Because of widespread dividend cuts by financial companies and declining earnings, fewer financials now qualify for the Fund’s eligible list, which emphasizes companies with strong dividend records and stable long-term earnings.
We are hopeful that the worst of the market decline is behind us. The financial crisis appears to be dissipating, but the future recovery could be more muted than some past recoveries. We believe that we are moving into a generational shift from excessive debt to increased conservatism. In a less predictable and less assured economic environment, we believe that the Fund is well served by concentrating on high-quality companies that provide substantial current income.
— Capital Research and Management Company
For current information about the Fund, visit americanfunds.com.
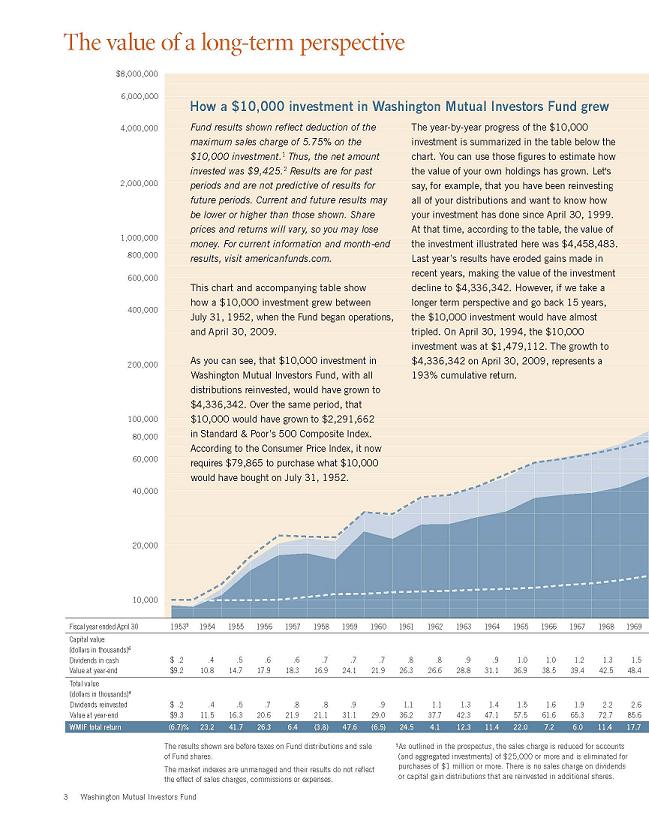
The value of a long-term perspective
Below are plot points for the mountain chart image featured above.
| WASHINGTON MUTUAL INVESTORS FUND | | | | | |
| MOUNTAIN CHART AND INDEX PLOT POINTS | | | | | |
| | | | | | | | |
| Results of a $10,000 investment in WMIF, the S&P500, and the CPI. | | | | |
| July 31, 1952 through April 30, 2007 | | | | | | |
| | | | | | | | |
| Year | CAPITAL VALUE | TOTAL VALUE | | | |
| ended | Dividends in | | Dividends | | TOTAL | | |
| April 30 | Cash | WMIF6 | Reinvested | WMIF4 | RETURN | S&P500 | CPI7 |
| | | | | | | | |
| 07/31/52 | | $9,425 | | $9,425 | | $10,000 | $10,000 |
19533 | $170 | 9,161 | $170 | 9,330 | -6.7% | 10,094 | 9,963 |
| 1954 | 434 | 10,773 | 449 | 11,494 | 23.2 | 12,282 | 10,037 |
| 1955 | 500 | 14,665 | 542 | 16,288 | 41.7 | 17,295 | 10,000 |
| 1956 | 580 | 17,851 | 654 | 20,565 | 26.3 | 22,938 | 10,075 |
| 1957 | 647 | 18,304 | 756 | 21,877 | 6.4 | 22,520 | 10,449 |
| 1958 | 680 | 16,928 | 825 | 21,055 | -3.8 | 22,269 | 10,824 |
| 1959 | 701 | 24,125 | 885 | 31,071 | 47.6 | 30,569 | 10,861 |
| 1960 | 728 | 21,871 | 948 | 29,041 | -6.5 | 29,850 | 11,049 |
| 1961 | 815 | 26,300 | 1,097 | 36,167 | 24.5 | 37,071 | 11,161 |
| 1962 | 824 | 26,592 | 1,146 | 37,654 | 4.1 | 38,158 | 11,311 |
| 1963 | 891 | 28,838 | 1,279 | 42,278 | 12.3 | 42,296 | 11,423 |
| 1964 | 923 | 31,149 | 1,369 | 47,109 | 11.4 | 49,698 | 11,573 |
| 1965 | 956 | 36,940 | 1,462 | 57,490 | 22.0 | 57,450 | 11,760 |
| 1966 | 1,048 | 38,487 | 1,648 | 61,603 | 7.2 | 60,563 | 12,097 |
| 1967 | 1,176 | 39,424 | 1,906 | 65,270 | 6.0 | 64,731 | 12,397 |
| 1968 | 1,331 | 42,481 | 2,231 | 72,692 | 11.4 | 69,365 | 12,884 |
| 1969 | 1,516 | 48,408 | 2,627 | 85,576 | 17.7 | 75,988 | 13,596 |
| 1970 | 1,605 | 39,049 | 2,874 | 71,603 | -16.3 | 61,834 | 14,419 |
| 1971 | 1,711 | 48,769 | 3,193 | 93,387 | 30.4 | 81,718 | 15,019 |
| 1972 | 1,779 | 47,991 | 3,455 | 95,521 | 2.3 | 87,267 | 15,543 |
| 1973 | 1,818 | 43,290 | 3,671 | 89,522 | -6.3 | 89,214 | 16,330 |
| 1974 | 1,858 | 40,682 | 3,907 | 87,956 | -1.7 | 77,959 | 17,978 |
| 1975 | 2,185 | 42,855 | 4,828 | 98,315 | 11.8 | 79,061 | 19,813 |
| 1976 | 2,350 | 53,771 | 5,498 | 129,949 | 32.2 | 95,785 | 21,011 |
| 1977 | 2,510 | 55,449 | 6,171 | 140,348 | 8.0 | 96,702 | 22,472 |
| 1978 | 2,658 | 54,228 | 6,849 | 144,340 | 2.8 | 100,121 | 23,933 |
| 1979 | 2,870 | 58,180 | 7,785 | 163,075 | 13.0 | 110,959 | 26,442 |
| 1980 | 3,203 | 56,032 | 9,167 | 165,848 | 1.7 | 122,446 | 30,337 |
| 1981 | 4,784 | 72,410 | 14,603 | 230,424 | 38.9 | 160,796 | 33,371 |
| 1982 | 4,097 | 69,851 | 13,327 | 235,768 | 2.3 | 148,977 | 35,543 |
| 1983 | 4,497 | 101,855 | 15,517 | 362,293 | 53.7 | 221,825 | 36,929 |
| 1984 | 4,840 | 100,116 | 17,527 | 373,509 | 3.1 | 225,698 | 38,614 |
| 1985 | 5,465 | 115,473 | 20,783 | 452,498 | 21.1 | 265,541 | 40,037 |
| 1986 | 6,110 | 152,209 | 24,380 | 623,768 | 37.9 | 361,778 | 40,674 |
| 1987 | 6,781 | 180,960 | 28,228 | 771,949 | 23.8 | 457,672 | 42,210 |
| 1988 | 7,116 | 167,083 | 30,815 | 742,856 | -3.8 | 427,911 | 43,858 |
| 1989 | 6,183 | 198,139 | 27,838 | 911,609 | 22.7 | 525,847 | 46,105 |
| 1990 | 8,920 | 202,429 | 41,689 | 971,051 | 6.5 | 581,168 | 48,277 |
| 1991 | 9,136 | 222,016 | 44,574 | 1,113,747 | 14.7 | 683,361 | 50,637 |
| 1992 | 8,319 | 244,607 | 42,315 | 1,272,372 | 14.2 | 779,015 | 52,247 |
| 1993 | 8,468 | 268,131 | 44,625 | 1,442,389 | 13.4 | 850,855 | 53,933 |
| 1994 | 8,583 | 266,513 | 46,719 | 1,479,112 | 2.5 | 896,027 | 55,206 |
| 1995 | 9,790 | 301,054 | 55,060 | 1,730,694 | 17.0 | 1,052,264 | 56,891 |
| 1996 | 10,008 | 381,514 | 58,187 | 2,256,894 | 30.4 | 1,369,880 | 58,539 |
| 1997 | 10,506 | 455,551 | 62,763 | 2,763,032 | 22.4 | 1,714,024 | 60,000 |
| 1998 | 11,033 | 628,864 | 67,443 | 3,890,253 | 40.8 | 2,417,442 | 60,861 |
| 1999 | 11,527 | 707,654 | 71,812 | 4,458,483 | 14.6 | 2,945,129 | 62,247 |
| 2000 | 11,935 | 646,507 | 75,684 | 4,148,130 | -7.0 | 3,243,332 | 64,157 |
| 2001 | 13,153 | 719,687 | 85,030 | 4,709,580 | 13.5 | 2,822,817 | 66,255 |
| 2002 | 13,116 | 700,823 | 86,458 | 4,674,962 | -0.7 | 2,466,687 | 67,341 |
| 2003 | 13,345 | 593,597 | 89,753 | 4,050,310 | -13.4 | 2,138,513 | 68,839 |
| 2004 | 13,383 | 717,050 | 92,016 | 4,989,599 | 23.2 | 2,627,509 | 70,412 |
| 2005 | 14,846 | 749,077 | 104,079 | 5,316,457 | 6.5 | 2,793,876 | 72,884 |
| 2006 | 15,614 | 830,885 | 111,648 | 6,013,586 | 13.1 | 3,224,286 | 75,468 |
| 2007 | 16,895 | 952,250 | 123,209 | 7,027,094 | 16.9 | 3,715,238 | 77,410 |
| 2008 | 19,026 | 879,074 | 141,440 | 6,620,450 | -5.8 | 3,541,391 | 80,458 |
| 2009 | 19,946 | 558,444 | 151,683 | 4,336,342 | -34.5 | 2,291,662 | 79,865 |
| | 335,888 | | 1,866,597 | | | | |
| | | | | | | | |
| | | | | | | Fund's lifetime | |
| | | | | | | average annual | |
| | | | | | | compound | |
| | | | | | | return: | |
| | | | | | | 11.3% | |
| | | | | | | 56.7479 | |
| | | | | | | | |
3 For the period July 31, 1952 (when the Fund began operations) through April 30, 1953. | | | |
| | | | | | | | |
4 Total value includes reinvested dividends of $1,866,597 and reinvested capital gain distributions of $2,747,465. | | |
| | | | | | | | |
5 The S&P 500 cannot be invested in directly. | | | | | |
| | | | | | | | |
6 Capital value includes reinvested capital gain distributions of $464,101 but does not reflect income dividends of | | |
| $335,888 taken in cash. | | | | | | |
| | | | | | | | |
7 Computed from data supplied by the U.S. Department of Labor, Bureau of Labor Statistics. | | | |
| | | | | | | | |
| | | | | | | | |
| | | | | | | | |
|
Where do we go from here? |
It would be great if by the time you read these words, the stock market had returned to year-ago levels or higher. That does not seem likely. But even if it should come to pass, we want to take this opportunity to help put recent events into perspective. With that in mind, we thought it might be useful to gather questions you might have and ask the Fund’s management and investment professionals for their thoughts.
| The fall How does this market decline stack up against past downturns?
"This has been the steepest decline I have ever seen," says Ron Morrow, a portfolio counselor who has worked in the financial industry for more than four decades. The statement would still be true even if Ron Morrow had been in his job nearly twice as long, because not since the Great Depression have stock prices fallen so far so fast. Yet over the years, the market has withstood many major blows. In 1987, for example, the Dow Jones Industrial Average lost more than 20% in a single day. Early in this decade, when the tech bubble burst, the Nasdaq stock index fell 78%. Since the Fund was launched in 1952, stock prices — as measured by the unmanaged Standard & Poor’s 500 Composite Index — have fallen at least 20% nine times, not including the most recent decline. The Fund has done better than the market as a whole each time including, so far, the current downturn, as of the Fund’s fiscal year ended April 30, 2009. |
Fund results shown are for Class A shares at net asset value. If a sales charge had been deducted, the results would have been lower. Results are for past periods and are not predictive of results for future periods. Current and future results may be lower or higher than those shown. Share prices and returns will vary, so investors may lose money. For current information and month-end results, visit americanfunds.com. | |
Can what is happening today be compared to the Great Depression and the 1929–32 period?
We believe that there are important differences. Consider that at the beginning of the Great Depression, the Federal Deposit Insurance Corporation and the U.S. Securities and Exchange Commission did not exist. They were created only after several years of bank failures, falling stock prices, rampant bankruptcies, and much higher unemployment. Social Security and unemployment insurance did not exist yet, either. The Federal Reserve Board was a relatively new government agency and did not have all the powers that it has today.
"We are better off today having these agencies and protections already in place," says veteran portfolio counselor Jim Dunton, "even though there are limits to how much they can do. In any case, when the current crisis began, the U.S. government and other governments around the world reacted more quickly and forcefully than ever before to contain the damage."
| Washington Mutual Investors Fund has done better than the market during major declines. |
| |
| | Total returns for the Fund vs. the market (as represented by Standard & Poor’s 500 Composite Index) |
| | | | | If dividends were reinvested... | | If dividends were taken in cash... |
| | Major market declines* | | | S&P 500 | | Washington Mutual | | S&P 500 | | Washington Mutual |
| | 8/2/56–10/22/57 | | | –18.1% | | –16.3% | | –21.6% | | –19.3% |
| | 12/12/61–6/26/62 | | | –26.9 | | –21.9 | | –28.0 | | –23.1 |
| | 2/9/66–10/7/66 | | | –20.5 | | –19.9 | | –22.2 | | –21.2 |
| | 11/29/68–5/26/70 | | | –33.0 | | –30.8 | | –36.1 | | –34.6 |
| | 1/11/73–10/3/74 | | | –44.8 | | –32.1 | | –48.2 | | –37.7 |
| | 11/28/80–8/12/82 | | | –20.2 | | 3.8 | | –27.1 | | –6.4 |
| | 8/25/87–12/4/87 | | | –32.8 | | –28.4 | | –33.5 | | –29.2 |
| | 7/16/90–10/11/90 | | | –19.2 | | –17.0 | | –19.9 | | –18.0 |
| | 3/24/00–10/9/02 | | | –47.4 | | –16.5 | | –49.1 | | –20.6 |
| | Figures assume reinvestment of all capital gain distributions. *Market declines of 20% or more, without reinvestment of dividends. A new decline is considered to have begun after the market has recovered 100% of the value lost in the previous decline. In the case of the current decline that began in October 2007, the market had not recovered as of April 30, 2009. There have been periods in which the Fund has lagged the S&P 500, particularly in strong markets. |
Your Fund’s portfolio
The Fund invests only in stocks that meet strict criteria based on rules originally established by a federal court in the District of Columbia to ensure prudent decisions by trust fund administrators. Those standards emphasize large companies with strong dividend records and stable long-term earnings. Why didn’t they provide shareholders with more protection?
"Nothing could have prevented the ferociousness of this decline from taking its toll," says portfolio counselor Jim Rothenberg, "as many sold off stocks without regard to company fundamentals. Every industry was hit — and hit hard. Bellwether companies long thought to be essential parts of the American economy disappeared or underwent restructuring, and several of those with long histories of paying dividends broke stride."
During the past year, pretty much the only way to avoid losing money was to remain in U.S. Treasury bills or government agency securities and not go near the stock market, but the Fund’s investment policy is to be 95% or more invested in equities at all times. As painful as this might seem sometimes, it has proved to benefit the Fund’s shareholders over time.
Washington Mutual Investors Fund’s founder, Bernie Nees, knew what a challenge it was to predict market bottoms and so believed the Fund should remain fully invested at all times.
Here’s how important that can be: Investors who missed the five days of highest returns over the past 10 years sacrificed 51% of gains over the entire period. Clearly, being out of the market on any given day can make a very big difference, and you never know which day might matter most. The Dow Jones Industrial Average’s best day since 1933 was October 13, 2008, when it rose 936 points, representing an 11.1% gain.
What a difference a few days make! |
| Most of the stock market’s long-term gains are recorded on a handful of days. But no one knows ahead of time when those days will be. |
| | Percentage of market gains lost* (for the investment period: 1/1/1999–12/31/2008) |
| | There were 2,515 trading days in this 10-year period. |
| | Invested without interruption | Not invested on the five "best" days | Not invested on the 10 "best" days | Not invested on the 20 "best" days | Not invested on the 30 "best" days | Not invested on the 40 "best" days |
| | 0% | 50.9% | 62.1% | 75.3% | 83.1% | 88.0% |
| *The market is represented by the S&P 500 Composite Index, without dividends reinvested. |
| |
Positioning your Fund for a recovery
What might signal that the market has hit bottom?
"The traditional wisdom is that there’s a capitulation — a dramatic final sell-off, flushing out the last of the fearful investors," says Ron Morrow. "We’ve already experienced a few days when we thought maybe that had happened, but we won’t know for sure until time makes it clear." While past market declines have lasted about 14 months — and this one began in fall 2007 — this is not an average downturn and could last longer than most. "Unfortunately, no one rings a bell," observes Jim Rothenberg.
What will the recovery look like, when it comes?
While the U.S. is a likely candidate to lead the world out of the economic recession, China is also a possibility. As portfolio counselor Gene Stein notes, "Even with a new and popular president here in the U.S., the wheels of democracy turn slowly. In China, the economy can be stimulated overnight."
The stock market recovery is likely to be jagged. The market might make some dramatic upward moves, only to retreat. Volatility isn’t unusual when investors are struggling to regain their confidence. In the past, upswings in the stock market have generally preceded recoveries in the economy.
After previous major market declines, stock prices (as measured by the S&P 500) have often rebounded very strongly. In fact, just a year after each of the nine market lows since 1952 — when the Fund began operations — and 2008, stocks were up at least 25% and as much as 66%. The Fund’s worst single calendar year prior to 2008 was 1974, when it was off 17% versus a 26% fall by the S&P 500. A year later, the Fund was up 45% and the S&P 500 gained 37%.
"Overall, it might be wise to think in terms of single-digit returns once the equity market returns to more normal valuations. The severity of this setback has caused many investors to lose their appetite for risk, and that means rewards are likely to be less," says Jim Rothenberg.
What types of companies might be among the first to turn around, and why?
"The best companies, at first, are likely to be the ones that people worry least about — such as diversified industrial companies with customers around the world, strong balance sheets, comfortable debt levels and minimal short-term refinancing needs," says Gene Stein.
Alan Berro observes, "Many manufacturers and retailers have reduced their inventories as sales have slowed down. When recovery begins, they will have to restock and that could lead to a quick snapback not just for their suppliers but also for transportation and energy companies."
The role of government action
How might the bailout and stimulus programs affect industries and companies that play major roles in the Fund’s portfolio?
The bailout programs have created some challenging inequities in the market, as troubled companies with government guarantees may be seen as being "safer" investments than those that were healthy enough to not seek help. As Alan Berro notes, "When you get a weak player being subsidized, the laws of capitalism and competitive dynamics don’t fully apply any more. It’s much harder to know what will happen once you start to protect bad behavior."
As for the stimulus spending package, Jim Rothenberg says, "There will be winners and losers in several industries. Consider utilities, for example. The winners are likely to be those that already have low ‘carbon footprints.’ They will be able to sell their unused emission allowances to other companies still struggling to improve. Several of the utilities in the Fund’s portfolio rank among the cleanest because their power generation sources tend to be nuclear, hydroelectric, natural gas or wind, rather than coal." (According to a May 2008 study, emission rates at three of the Fund’s largest utility holdings — Exelon, Entergy and FPL Group — are considerably less than half the national average.)*
Will these programs — and similar programs sponsored by governments around the world — eventually fuel inflation?
"It’s certainly possible," says Ron Morrow. "We’ve seen some short-term deflation because of much lower demand brought on by the credit collapse and exacerbated by rising unemployment. Meanwhile, energy prices have been relatively low. But I’m concerned that with even a moderate recovery in the global economy, prices for commodities and energy and any number of other things could rise quickly, bringing on inflation."
If that occurs, investors who have stayed in stocks are likely to benefit, because stocks have proved, over time, to be the only financial investments that can keep pace when the cost of living rises.
Managing your Fund in the wake of the decline
Have recent events changed the way you evaluate companies?
Some of the measures — price/earnings ratios, for example — long considered to be important for evaluating nearly any company may be misleading in times like these. While both stock prices and corporate earnings have fallen considerably, in many cases the latter decline has been more dramatic, skewing the ratio beyond usefulness.
"We’re continuing to pay very close attention to balance sheets and debt levels and the ability of a company’s cash flow to service the debt," says Alan Berro.
"Our global investment research capabilities are more important than ever in times like these. As a result, we’ve been increasing the size of our research staff because that’s the best way to pick up on the subtle nuances that things are beginning to improve," says Jim Rothenberg.
"Of course, we’re also aware of how various companies have come through previous recessions," says Jim Dunton. "The past year has reminded us that anything is possible, but most of the companies in the Fund’s portfolio have strong industry positions and should be around decades from now — in part because of how they do in times like these."
Experience helps | |
When you’re flying through turbulent skies, you want a seasoned crew upfront. Washington Mutual Investors Fund’s seven portfolio counselors — each of whom manages a portion of the portfolio — have an average of more than 34 years of investment experience.* |
| | Portfolio counselor | Years of investment experience* | |
| | Alan N. Berro | 23 | |
| | James K. Dunton | 47 | |
| | Gregory D. Johnson | 16 | |
| | Ronald B. Morrow | 41 | |
| | Robert G. O’Donnell | 37 | |
| | James F. Rothenberg | 39 | |
| | Eugene P. Stein | 38 | |
| | | | |
| | *Years of experience as of July 1, 2009. | |
There seems to be much less stigma associated with reducing or eliminating dividends. How does this affect the Fund?
In tough economic times, when revenues are flagging, it isn’t unusual for companies to cut or eliminate their dividends in order to have enough cash on hand for continuing operations. During the Great Depression, for example, dividends paid by companies included in the S&P 500 fell 55%.
As you might expect in the current downturn, the impact has been most notable among banks. According to Beth Schulte, a banking industry analyst who has worked for the Fund’s investment adviser for the past six years, "Many banks whose stock is in the Fund’s portfolio have dropped their dividends to a token penny or nickel a share." That presents a challenge to the Fund, because in recent years, bank stock dividends have accounted for roughly a quarter of the Fund’s income.
In order to qualify as investments for the Fund, most companies must have paid a dividend in nine of the past 10 years and their earnings per share must have covered at least the amount paid as a dividend in four of the past five years. This means 20 companies have been removed from the Fund’s eligible list in the past year. "If a company becomes ineligible, that must be reported at the next meeting of the board of directors and then the stock must soon be removed from the portfolio," says Alan Berro.
"We’re working as hard as possible, however, to find companies that can maintain and even grow their dividends," says Alan Berro, "but with this environment, the ability to maintain the Fund’s dividend is the subject of an ongoing conversation with the board of directors." "Historically, the Fund has always provided a rising income stream for shareholders who have reinvested their capital gain distributions and taken dividends in cash, and we are working to maintain that record," says Jim Rothenberg.
Have redemption pressures affected the Fund?
"We have wonderful shareholders who focus, as we do, on the long haul," says Jim Dunton. "While redemptions have been up, we haven’t been pressured to sell securities in an untimely way to meet the requests of redeeming shareholders."
Might the Fund’s standards, based in large part on lessons learned during the Great Depression, be updated as a result of recent events?
"We continue to believe that dedication to sound investment principles is the surest way to achieve long-term financial success," says Knox Singleton, who became the independent chairman of the Fund’s board of directors at the end of 2008. "Of course, we periodically consider whether the Fund’s standards are still working as intended, and on occasion we make modifications.
During the past decade, for example, we decided to give the Fund’s portfolio counselors the flexibility to invest up to 5 percent of assets in stocks that do not pay dividends and the same percentage in stocks of companies based outside the United States. In doing so, we established additional requirements for those stocks in order to ensure that we do not reduce quality levels."
| Bear market lows and recoveries | | | |
| | | | | |
S&P 500 date of low | 3 months after low | 6 months after low | 12 months after low | 3 years after low |
| 6/1/1932 | 96.61% | 58.97% | 137.60% | 154.17% |
| 2/27/1933 | 77.33 | 109.76 | 105.43 | 204.85 |
| 3/14/1935 | 28.25 | 49.15 | 88.37 | 54.09 |
| 4/28/1942 | 18.73 | 29.87 | 64.26 | 134.59 |
| 6/13/1949 | 18.17 | 27.77 | 52.74 | 122.30 |
| 10/22/1957 | 6.91 | 12.03 | 36.30 | 52.12 |
| 6/26/1962 | 8.27 | 22.74 | 37.42 | 74.94 |
| 10/7/1966 | 13.38 | 24.28 | 37.34 | 40.00 |
| 5/26/1970 | 18.41 | 25.26 | 48.96 | 71.29 |
| 10/3/1974 | 15.08 | 34.15 | 44.43 | 76.76 |
| 8/12/1982 | 38.14 | 47.93 | 66.11 | 110.27 |
| 12/4/1987 | 20.44 | 21.21 | 25.92 | 62.13 |
| 10/11/1990 | 7.73 | 30.05 | 33.55 | 71.06 |
| 10/9/2002 | 19.98 | 12.53 | 36.15 | 62.37 |
| Median | 18.57 | 28.82 | 46.70 | 73.12 |
| | | | | |
Results shown are total returns for Standard & Poor’s 500 Composite Index. Dates for market lows are based on a decline of at least 20% in the S&P 500. A new decline is considered to have begun after the market recovered 100% of the value lost in the previous decline. June 1, 1932 represents the day the S&P 500 hit its lowest point after the 1929 stock market crash. |
What should shareholders do?
Is this likely to be a good time to invest in the Fund?
You might want to spend some time with your financial adviser to make sure your overall portfolio still reflects your needs.
"With yields on traditionally safe fixed income investments, such as U.S. Treasuries, at historic lows, it is well worth considering investing in the Fund. If you are willing to take some risk, the Fund is providing a similar yield but also offering the opportunity to have the value of your investment appreciate," according to Jim Rothenberg.
What is the best way to invest in the Fund at a time like this?
Alan Berro points out that investors in the Fund can do what he and the other portfolio counselors do in times of high uncertainty. "When I’m purchasing a stock for the portfolio, I typically do it over a period of time rather than all at once. People who invest the same amount of money in the Fund at regular intervals reduce their chances of getting in at the ‘wrong’ time — near the top of a peak. Financial advisers call this ‘dollar cost averaging.’ Over time, it can prove to be a sound investment technique." If you make monthly contributions to your 401(k) plan, for example, you are already doing this. n
Regular investing does not ensure a profit or protect against loss. Investors should consider their willingness to keep investing when share prices are declining.
*According to "Benchmarking Air Emissions of the 100 Largest Electric Power Producers in the United States" by Ceres, the largest coalition of investors, environmental and public interest organizations in North America.
Investment portfolio April 30, 2009
| Industry sector diversification | Percent of net assets | | | Ten largest holdings | Percent of net assets | |
| Industrials | 16.27% | | | Chevron | 4.76% | |
| Energy | 13.56 | | | AT&T | 4.58 | |
| Health care | 13.42 | | | Royal Dutch Shell | 3.22 | |
| Information technology | 9.21 | | | United Technologies | 2.93 | |
| Consumer staples | 8.86 | | | Verizon | 2.75 | |
| Utilities | 8.27 | | | Exelon | 2.44 | |
| Financials | 7.69 | | | Coca-Cola | 2.29 | |
| Telecommunication services | 7.33 | | | United Parcel Service | 2.18 | |
| Consumer discretionary | 7.17 | | | Merck | 2.10 | |
| Materials | 4.41 | | | Boeing | 2.07 | |
| Miscellaneous | 1.90 | | | | | |
| Short-term securities & other assets less liabilities | 1.91 | | | | | |
| | | | | | | |
| Common stocks — 98.09% | Shares | | Value (000) | | Percent of net assets |
| Energy — 13.56% | | | | | |
| Apache Corp. | 2,717,100 | | $197,968 | | .46% |
| Baker Hughes Inc. | 3,000,000 | | 106,740 | | .25 |
| Chevron Corp. | 31,166,800 | | 2,060,125 | | 4.76 |
| ConocoPhillips | 10,700,000 | | 438,700 | | 1.01 |
| EOG Resources, Inc. | 1,364,644 | | 86,628 | | .20 |
| Exxon Mobil Corp. | 7,400,000 | | 493,358 | | 1.14 |
| Halliburton Co. | 18,500,000 | | 374,070 | | .86 |
| Hess Corp. | 2,140,000 | | 117,251 | | .27 |
| Marathon Oil Corp. | 8,570,000 | | 254,529 | | .59 |
| Occidental Petroleum Corp. | 1,600,000 | | 90,064 | | .21 |
| Royal Dutch Shell PLC, Class B (ADR) | 30,682,777 | | 1,396,066 | | 3.22 |
| Schlumberger Ltd. | 5,250,000 | | 257,198 | | .59 |
| | | | 5,872,697 | | 13.56 |
| | | | | | |
| Materials — 4.41% | | | | | |
| Air Products and Chemicals, Inc. | 4,000,000 | | 263,600 | | .61 |
| Alcoa Inc. | 31,950,000 | | 289,786 | | .67 |
| E.I. du Pont de Nemours and Co. | 10,100,000 | | 281,790 | | .65 |
| Monsanto Co. | 880,000 | | 74,703 | | .17 |
| PPG Industries, Inc. | 5,838,232 | | 257,174 | | .59 |
| Praxair, Inc. | 4,900,000 | | 365,589 | | .84 |
| Vulcan Materials Co. | 4,374,000 | | 207,984 | | .48 |
| Weyerhaeuser Co. | 4,860,000 | | 171,364 | | .40 |
| | | | 1,911,990 | | 4.41 |
| | | | | | |
| Industrials — 16.27% | | | | | |
| 3M Co. | 3,800,000 | | 218,880 | | .51 |
| Avery Dennison Corp. | 5,290,000 | | 152,035 | | .35 |
| Boeing Co. | 22,343,200 | | 894,845 | | 2.07 |
| Burlington Northern Santa Fe Corp. | 2,700,000 | | 182,196 | | .42 |
| Caterpillar Inc. | 2,500,000 | | 88,950 | | .21 |
| Deere & Co. | 4,250,000 | | 175,355 | | .40 |
| Eaton Corp. | 1,200,000 | | 52,560 | | .12 |
| Emerson Electric Co. | 3,400,000 | | 115,736 | | .27 |
| General Dynamics Corp. | 2,950,000 | | 152,426 | | .35 |
| General Electric Co. | 33,000,000 | | 417,450 | | .96 |
| Honeywell International Inc. | 5,000,000 | | 156,050 | | .36 |
| Illinois Tool Works Inc. | 6,930,000 | | 227,304 | | .52 |
| Ingersoll-Rand Co. Ltd., Class A | 4,200,000 | | 91,434 | | .21 |
| Lockheed Martin Corp. | 1,900,000 | | 149,207 | | .34 |
| Masco Corp. | 7,950,000 | | 70,437 | | .16 |
| Northrop Grumman Corp. | 14,400,000 | | 696,240 | | 1.61 |
| Pitney Bowes Inc. | 8,581,700 | | 210,595 | | .49 |
| Raytheon Co. | 2,000,000 | | 90,460 | | .21 |
| Rockwell Automation | 3,000,000 | | 94,770 | | .22 |
| Southwest Airlines Co. | 7,500,000 | | 52,350 | | .12 |
| Tyco International Ltd. | 12,143,750 | | 288,535 | | .67 |
| Union Pacific Corp. | 1,820,000 | | 89,435 | | .21 |
| United Parcel Service, Inc., Class B | 18,075,900 | | 946,093 | | 2.18 |
| United Technologies Corp. | 25,955,000 | | 1,267,642 | | 2.93 |
| Waste Management, Inc. | 6,200,000 | | 165,354 | | .38 |
| | | | 7,046,339 | | 16.27 |
| | | | | | |
| Consumer discretionary — 7.17% | | | | | |
| Best Buy Co., Inc. | 3,250,000 | | 124,735 | | .29 |
| Gannett Co., Inc. | 4,000,000 | | 15,640 | | .04 |
| Harley-Davidson, Inc. | 3,950,000 | | 87,532 | | .20 |
| Home Depot, Inc. | 14,975,000 | | 394,142 | | .91 |
| Johnson Controls, Inc. | 27,498,200 | | 522,741 | | 1.21 |
| Limited Brands, Inc. | 8,200,000 | | 93,644 | | .22 |
| Lowe’s Companies, Inc. | 15,200,000 | | 326,800 | | .75 |
| McDonald’s Corp. | 16,285,000 | | 867,827 | | 2.00 |
| News Corp., Class A | 15,560,000 | | 128,526 | | .30 |
| NIKE, Inc., Class B | 1,000,000 | | 52,470 | | .12 |
| Nordstrom, Inc. | 6,930,000 | | 156,826 | | .36 |
| Target Corp. | 2,250,000 | | 92,835 | | .21 |
| VF Corp. | 4,098,400 | | 242,912 | | .56 |
| | | | 3,106,630 | | 7.17 |
| | | | | | |
| Consumer staples — 8.86% | | | | | |
| Avon Products, Inc. | 12,080,400 | | 274,950 | | .63 |
| Clorox Co. | 1,950,000 | | 109,297 | | .25 |
| Coca-Cola Co. | 23,015,000 | | 990,796 | | 2.29 |
| H.J. Heinz Co. | 5,000,000 | | 172,100 | | .40 |
| Hershey Co. | 2,000,000 | | 72,280 | | .17 |
| Kimberly-Clark Corp. | 4,632,784 | | 227,655 | | .53 |
| Kraft Foods Inc., Class A | 30,340,000 | | 709,956 | | 1.64 |
| PepsiCo, Inc. | 5,750,000 | | 286,120 | | .66 |
| Procter & Gamble Co. | 7,150,800 | | 353,536 | | .82 |
| Sara Lee Corp. | 6,000,000 | | 49,920 | | .11 |
| Walgreen Co. | 3,500,000 | | 110,005 | | .25 |
| Wal-Mart Stores, Inc. | 9,580,000 | | 482,832 | | 1.11 |
| | | | 3,839,447 | | 8.86 |
| | | | | | |
| Health care — 13.42% | | | | | |
| Abbott Laboratories | 20,675,400 | | 865,266 | | 2.00 |
| Aetna Inc. | 8,400,000 | | 184,884 | | .43 |
| Baxter International Inc. | 2,500,000 | | 121,250 | | .28 |
| Becton, Dickinson and Co. | 1,000,000 | | 60,480 | | .14 |
| Bristol-Myers Squibb Co. | 37,182,410 | | 713,902 | | 1.65 |
| C. R. Bard, Inc. | 890,000 | | 63,751 | | .15 |
| Cardinal Health, Inc. | 7,750,000 | | 261,873 | | .60 |
| Eli Lilly and Co. | 21,808,191 | | 717,926 | | 1.66 |
| Johnson & Johnson | 16,140,000 | | 845,090 | | 1.95 |
| McKesson Corp. | 2,500,000 | | 92,500 | | .21 |
| Medtronic, Inc. | 9,465,000 | | 302,880 | | .70 |
| Merck & Co., Inc. | 37,519,487 | | 909,472 | | 2.10 |
| Pfizer Inc | 10,500,000 | | 140,280 | | .32 |
| Stryker Corp. | 3,000,000 | | 116,130 | | .27 |
| UnitedHealth Group Inc. | 3,700,000 | | 87,024 | | .20 |
| Wyeth | 7,750,000 | | 328,600 | | .76 |
| | | | 5,811,308 | | 13.42 |
| | | | | | |
| Financials — 7.69% | | | | | |
| Allstate Corp. | 8,800,000 | | 205,304 | | .48 |
| American Express Co. | 16,100,000 | | 406,042 | | .94 |
| Bank of America Corp. | 4,000,000 | | 35,720 | | .08 |
| Chubb Corp. | 2,150,000 | | 83,743 | | .19 |
| HSBC Holdings PLC (ADR) | 4,646,666 | | 165,421 | | .38 |
| JPMorgan Chase & Co. | 15,189,100 | | 501,240 | | 1.16 |
| KeyCorp | 7,000,000 | | 43,050 | | .10 |
| Lincoln National Corp. | 2,576,246 | | 28,957 | | .07 |
| Marsh & McLennan Companies, Inc. | 23,896,900 | | 503,986 | | 1.16 |
| Moody’s Corp. | 2,870,000 | | 84,722 | | .20 |
| PNC Financial Services Group, Inc. | 3,965,000 | | 157,411 | | .36 |
| U.S. Bancorp | 30,197,500 | | 550,198 | | 1.27 |
| Wells Fargo & Co. | 26,249,700 | | 525,256 | | 1.21 |
| XL Capital Ltd, Class A | 4,225,000 | | 40,180 | | .09 |
| | | | 3,331,230 | | 7.69 |
| | | | | | |
| Information technology — 9.21% | | | | | |
| Automatic Data Processing, Inc. | 4,485,000 | | 157,872 | | .36 |
Cisco Systems, Inc.1 | 1,500,000 | | 28,980 | | .07 |
Google Inc., Class A1 | 667,000 | | 264,112 | | .61 |
| Hewlett-Packard Co. | 12,910,000 | | 464,502 | | 1.07 |
| Intel Corp. | 49,450,000 | | 780,321 | | 1.80 |
| International Business Machines Corp. | 7,335,000 | | 757,045 | | 1.75 |
| Linear Technology Corp. | 8,065,000 | | 175,656 | | .41 |
| Microsoft Corp. | 25,306,100 | | 512,702 | | 1.18 |
| Nokia Corp. (ADR) | 6,100,000 | | 86,254 | | .20 |
| Oracle Corp. | 10,198,300 | | 197,235 | | .46 |
| Paychex, Inc. | 10,950,000 | | 295,759 | | .68 |
| SAP AG (ADR) | 4,009,300 | | 152,714 | | .35 |
| Texas Instruments Inc. | 6,500,000 | | 117,390 | | .27 |
| | | | 3,990,542 | | 9.21 |
| | | | | | |
| Telecommunication services — 7.33% | | | | | |
| AT&T Inc. | 77,465,000 | | 1,984,653 | | 4.58 |
| Verizon Communications Inc. | 39,230,000 | | 1,190,238 | | 2.75 |
| | | | 3,174,891 | | 7.33 |
| | | | | | |
| Utilities — 8.27% | | | | | |
| Ameren Corp. | 1,400,000 | | 32,228 | | .07 |
| American Electric Power Co., Inc. | 7,100,000 | | 187,298 | | .43 |
| Dominion Resources, Inc. | 4,550,000 | | 137,228 | | .32 |
| Entergy Corp. | 9,471,184 | | 613,449 | | 1.42 |
| Exelon Corp. | 22,915,000 | | 1,057,069 | | 2.44 |
| FPL Group, Inc. | 7,500,000 | | 403,425 | | .93 |
| NiSource Inc. | 2,500,000 | | 27,475 | | .06 |
| PPL Corp. | 18,700,000 | | 559,317 | | 1.29 |
| Public Service Enterprise Group Inc. | 1,000,000 | | 29,840 | | .07 |
| Southern Co. | 9,300,000 | | 268,584 | | .62 |
| Xcel Energy Inc. | 14,500,000 | | 267,380 | | .62 |
| | | | 3,583,293 | | 8.27 |
| | | | | | |
| Miscellaneous — 1.90% | | | | | |
| Other common stocks in initial period of acquisition | | | 822,020 | | 1.90 |
| | | | | | |
Total common stocks (cost: $44,216,140,000) | | | 42,490,387 | | 98.09 |
| | | | | | |
| | | | | | |
| Short-term securities — 2.09% | Principal amount (000) | | | | |
| | | | | | |
Abbott Laboratories 0.21% due 7/20/20092 | $ 25,000 | | 24,986 | | .06 |
Citigroup Funding Inc., FDIC insured, 0.30% due 5/22/2009 | 25,000 | | 24,996 | | .06 |
Coca-Cola Co. 0.27% due 7/9/20092 | 25,800 | | 25,786 | | .06 |
Fannie Mae 0.17%–0.50% due 5/13–7/22/2009 | 144,781 | | 144,745 | | .33 |
Federal Home Loan Bank 0.39%–0.40% due 5/19–6/29/2009 | 12,000 | | 11,997 | | .03 |
Freddie Mac 0.23%–0.45% due 5/27–10/13/2009 | 99,400 | | 99,314 | | .23 |
General Dynamics Corp. 0.19%–0.20% due 5/6–5/15/20092 | 46,000 | | 45,997 | | .11 |
General Electric Capital Corp., FDIC insured, 0.25% due 6/29/2009 | 75,000 | | 74,969 | | .17 |
Honeywell International Inc. 0.20%–0.23% due 5/26–6/25/20092 | 43,900 | | 43,885 | | .10 |
IBM Corp. 0.23% due 6/8/20092 | 40,000 | | 39,983 | | .09 |
Johnson & Johnson 0.25% due 7/20/20092 | 32,200 | | 32,182 | | .07 |
Merck & Co. Inc. 0.20% due 5/1/2009 | 25,000 | | 25,000 | | .06 |
NetJets Inc. 0.25% due 5/5/20092 | 22,800 | | 22,799 | | .05 |
Park Avenue Receivables Co., LLC 0.30%–0.35% due 5/26–6/16/20092 | 50,900 | | 50,879 | | .12 |
PepsiCo Inc. 0.12% due 5/6/20092 | 30,000 | | 29,999 | | .07 |
Private Export Funding Corp. 0.38% due 7/13/20092 | 25,000 | | 24,976 | | .06 |
Procter & Gamble International Funding S.C.A. 0.20% due 6/10/20092 | 8,000 | | 7,998 | | .02 |
U.S. Treasury Bills 0.139%–0.334% due 5/28–7/9/2009 | 175,600 | | 175,576 | | .40 |
| | | | | | |
Total short-term securities (cost: $905,942,000) | | | 906,067 | | 2.09 |
| | | | | | |
Total investment securities (cost: $45,122,082,000) | | | 43,396,454 | | 100.18 |
| Other assets less liabilities | | | (79,944) | | (.18) |
| | | | | | |
| Net assets | | | $43,316,510 | | 100.00% |
| | | | | | |
| "Miscellaneous" securities include holdings in their initial period of acquisition that have not previously been publicly disclosed. |
| | | | | | |
1Security did not produce income during the last 12 months. | | | | | |
2Purchased in a transaction exempt from registration under the Securities Act of 1933. May be resold in the U.S. in transactions exempt from registration, normally to qualified institutional buyers. The total value of all such securities was $349,470,000, which represented .81% of the net assets of the Fund. |
| | | | | | |
| Key to abbreviation | | | | | |
| ADR = American Depositary Receipts | | | | | |
| | | | | | |
| See Notes to financial statements | | | | | |
Financial statements
Statement of assets and liabilities at April 30, 2009 | (dollars in thousands) |
| Assets: | | | | | | |
| Investment securities, at value (cost: $45,122,082): | | | | | $ | 43,396,454 | |
| Cash | | | | | | 673 | |
| Receivables for: | | | | | | | |
| Sales of investments | | $ | 130,268 | | | | | |
| Sales of Fund’s shares | | | 37,379 | | | | | |
| Dividends | | | 112,384 | | | | 280,031 | |
| | | | | | | | 43,677,158 | |
| Liabilities: | | | | | | | | |
| Payables for: | | | | | | | | |
| Purchases of investments | | | 255,421 | | | | | |
| Repurchases of Fund’s shares | | | 69,364 | | | | | |
| Management services | | | 10,312 | | | | | |
| Services provided by affiliates | | | 24,002 | | | | | |
| Directors’ and advisory board’s deferred compensation | | | 1,440 | | | | | |
| Other | | | 109 | | | | 360,648 | |
| Net assets at April 30, 2009 | | | | | | $ | 43,316,510 | |
| | | | | | | | | |
| Net assets consist of: | | | | | | | | |
| Capital paid in on shares of capital stock | | | | | | $ | 53,433,060 | |
| Undistributed net investment income | | | | | | | 351,063 | |
| Accumulated net realized loss | | | | | | | (8,741,985) | |
| Net unrealized depreciation | | | | | | | (1,725,628) | |
| Net assets at April 30, 2009 | | | | | | $ | 43,316,510 | |
| |
| (dollars and shares in thousands, except per-share amounts) |
| |
Total authorized capital stock — 4,000,000 shares, $.001 par value (2,189,065 total shares outstanding) |
| | Net assets | Shares outstanding | Net asset value per share* |
| Class A | $34,012,277 | 1,717,095 | $19.81 |
| Class B | 1,388,793 | 70,594 | 19.67 |
| Class C | 1,612,578 | 82,158 | 19.63 |
| Class F-1 | 1,505,986 | 76,210 | 19.76 |
| Class F-2 | 146,717 | 7,405 | 19.81 |
| Class 529-A | 709,085 | 35,841 | 19.78 |
| Class 529-B | 125,971 | 6,397 | 19.69 |
| Class 529-C | 226,453 | 11,505 | 19.68 |
| Class 529-E | 40,829 | 2,071 | 19.71 |
| Class 529-F-1 | 35,082 | 1,776 | 19.76 |
| Class R-1 | 44,133 | 2,243 | 19.68 |
| Class R-2 | 547,898 | 27,923 | 19.62 |
| Class R-3 | 1,009,891 | 51,257 | 19.70 |
| Class R-4 | 781,920 | 39,589 | 19.75 |
| Class R-5 | 1,128,897 | 57,001 | 19.80 |
*Maximum offering price and redemption price per share were equal to the net asset value per share for all share classes, except for Classes A and 529-A, for which the maximum offering prices per share were $21.02 and $20.99, respectively.
See Notes to financial statements
Statement of operations for the year ended April 30, 2009 | (dollars in thousands) |
| Investment income: | | | | | | |
| Income: | | | | | | |
| Dividends (net of non-U.S. taxes of $3,369) | | $ | 1,801,286 | | | | |
| Interest | | | 30,099 | | | $ | 1,831,385 | |
| | | | | | | | | |
| Fees and expenses*: | | | | | | | | |
| Investment advisory services | | | 110,730 | | | | | |
| Business management services | | | 46,735 | | | | | |
| Distribution services | | | 172,827 | | | | | |
| Transfer agent services | | | 60,309 | | | | | |
| Administrative services | | | 17,490 | | | | | |
| Reports to shareholders | | | 3,645 | | | | | |
| Registration statement and prospectus | | | 1,626 | | | | | |
| Directors’ and advisory board’s compensation | | | 667 | | | | | |
| Auditing and legal | | | 338 | | | | | |
| Custodian | | | 401 | | | | | |
| State and local taxes | | | 1 | | | | | |
| Other | | | 3,689 | | | | | |
| Total fees and expenses before waivers | | | 418,458 | | | | | |
| Less waivers of fees and expenses: | | | | | | | | |
| Investment advisory services | | | 8,278 | | | | | |
| Business management services | | | 3,343 | | | | | |
| Total fees and expenses after waivers | | | | | | | 406,837 | |
| Net investment income | | | | | | | 1,424,548 | |
| | | | | | | | | |
| Net realized loss and unrealized depreciation on investments: | | | | | | | | |
| Net realized loss on investments | | | | | | | (8,718,989) | |
| Net unrealized depreciation on investments | | | | | | | (18,332,108) | |
| Net realized loss and unrealized depreciation on investments | | | | | | | (27,051,097) | |
| Net decrease in net assets resulting from operations | | | | | | $ | (25,626,549) | |
*Additional information related to class-specific fees and expenses is included in the Notes to financial statements.
| Statements of changes in net assets | (dollars in thousands) |
| | | Year ended April 30 | |
| | | 2009 | | | 2008 | |
| Operations: | | | | | | |
| Net investment income | | $ | 1,424,548 | | | $ | 1,622,132 | |
| Net realized (loss) gain on investments | | | (8,718,989) | | | | 3,890,592 | |
| Net unrealized depreciation on investments | | | (18,332,108) | | | | (10,379,430) | |
| Net decrease in net assets resulting from operations | | | (25,626,549) | | | | (4,866,706) | |
| | | | | | | | | |
| Dividends and distributions paid to shareholders: | | | | | | | | |
| Dividends from net investment income | | | (1,596,849) | | | | (1,632,468) | |
| Distributions from net realized gain on investments | | | (1,101,866) | | | | (4,501,360) | |
| Total dividends and distributions paid to shareholders | | | (2,698,715) | | | | (6,133,828) | |
| | | | | | | | | |
| Net capital share transactions | | | (4,761,319) | | | | (777,245) | |
| | | | | | | | | |
| Total decrease in net assets | | | (33,086,583) | | | | (11,777,779) | |
| | | | | | | | | |
| Net assets: | | | | | | | | |
| Beginning of year | | | 76,403,093 | | | | 88,180,872 | |
| End of year (including undistributed net investment income: $351,063 and $525,739, respectively) | | $ | 43,316,510 | | | $ | 76,403,093 | |
See Notes to financial statements
Notes to financial statements
| 1. Organization and significant accounting policies |
Organization — Washington Mutual Investors Fund (the "Fund") is registered under the Investment Company Act of 1940 as an open-end, diversified management investment company. The Fund’s investment objective is to produce current income and to provide an opportunity for growth of principal consistent with sound common stock investing.
The Fund has 15 share classes consisting of five retail share classes, five 529 college savings plan share classes and five retirement plan share classes. The 529 college savings plan share classes (529-A, 529-B, 529-C, 529-E and 529-F-1) can be used to save for college education. The five retirement plan share classes (R-1, R-2, R-3, R-4 and R-5) are generally offered only through eligible employer-sponsored retirement plans. The Fund’s share classes are described below:
| Share class | Initial sales charge | Contingent deferred sales charge upon redemption | Conversion feature |
| Classes A and 529-A | Up to 5.75% | None (except 1% for certain redemptions within one year of purchase without an initial sales charge) | None |
| Classes B and 529-B* | None | Declines from 5% to 0% for redemptions within six years of purchase | Classes B and 529-B convert to Classes A and 529-A, respectively, after eight years |
| Class C | None | 1% for redemptions within one year of purchase | Class C converts to Class F-1 after 10 years |
Class 529-C | None | 1% for redemptions within one year of purchase | None |
Class 529-E | None | None | None |
Classes F-1, F-2 and 529-F-1 | None | None | None |
Classes R-1, R-2, R-3, R-4 and R-5 | None | None | None |
*Effective April 21, 2009, Class B and 529-B shares of the Fund are not available for purchase. |
On August 1, 2008, the Fund made an additional retail share class (Class F-2) available for sale pursuant to an amendment to its registration statement filed with the Securities and Exchange Commission (SEC). In addition, Class F shares were renamed Class F-1 and Class 529-F shares were renamed Class 529-F-1. On May 1, 2009, the Fund made an additional retirement plan share class (Class R-6) available for sale pursuant to an amendment to its registration statement filed with the SEC. Refer to the Fund’s respective prospectus for more details.
Holders of all share classes have equal pro rata rights to assets, dividends and liquidation proceeds. Each share class has identical voting rights, except for the exclusive right to vote on matters affecting only its class. Share classes have different fees and expenses ("class-specific fees and expenses"), primarily due to different arrangements for distribution, administrative and shareholder services. Differences in class-specific fees and expenses will result in differences in net investment income and, therefore, the payment of different per-share dividends by each class.
Significant accounting policies — The financial statements have been prepared to comply with accounting principles generally accepted in the United States of America. These principles require management to make estimates and assumptions that affect reported amounts and disclosures. Actual results could differ from those estimates. The following is a summary of the significant accounting policies followed by the Fund:
Security valuation — Equity securities are valued at the official closing price of, or the last reported sale price on, the exchange or market on which such securities are traded, as of the close of business on the day the securities are being valued or, lacking any sales, at the last available bid price. Prices for each security are taken from the principal exchange or market in which the security trades. Fixed-income securities, including short-term securities purchased with more than 60 days left to maturity, are valued at prices obtained from an independent pricing service when such prices are available. However, where the investment adviser deems it appropriate, such securities will be valued at the mean quoted bid and asked prices (or bid prices, if asked prices are not available) or at prices for securities of comparable maturity, quality and type. Securities with both fixed-income and equity characteristics, or equity securities traded principally among fixed-income dealers, are valued in the manner described above for either equity or fixed-income securities, depending on which method is deemed most appropriate by the investment adviser. Short-term securities purchased within 60 days to maturity are valued at amortized cost, which approximates market value. The value of short-term securities originally purchased with maturities greater than 60 days is determined based on an amortized value to par when they reach 60 days or less remaining to maturity.
Securities and other assets for which representative market quotations are not readily available or are considered unreliable by the investment adviser are fair valued as determined in good faith under procedures adopted by authority of the Fund’s board of directors. Various factors may be reviewed in order to make a good faith determination of a security’s fair value. These factors include, but are not limited to, the type and cost of the security; contractual or legal restrictions on resale of the security; relevant financial or business developments of the issuer; actively traded similar or related securities; conversion or exchange rights on the security; related corporate actions; significant events occurring after the close of trading in the security; and changes in overall market conditions.
Security transactions and related investment income — Security transactions are recorded by the Fund as of the date the trades are executed with brokers. Realized gains and losses from security transactions are determined based on the specific identified cost of the securities. Dividend income is recognized on the ex-dividend date and interest income is recognized on an accrual basis. Market discounts, premiums and original issue discounts on fixed-income securities are amortized daily over the expected life of the security.
Class allocations — Income, fees and expenses (other than class-specific fees and expenses) and realized and unrealized gains and losses are allocated daily among the various share classes based on their relative net assets. Class-specific fees and expenses, such as distribution, administrative and shareholder services, are charged directly to the respective share class.
Dividends and distributions to shareholders — Dividends and distributions paid to shareholders are recorded on the ex-dividend date.
Investing in the Fund may involve certain risks including, but not limited to, those described below.
The prices of, and the income generated by, securities held by the Fund may decline in response to certain events taking place around the world, including those directly involving the companies whose securities are owned by the Fund; conditions affecting the general economy; overall market changes; local, regional or global political, social or economic instability; and currency, interest rate and commodity price fluctuations.
| 3. Taxation and distributions |
Federal income taxation — The Fund complies with the requirements under Subchapter M of the Internal Revenue Code applicable to mutual funds and intends to distribute substantially all of its net taxable income and net capital gains each year. The Fund is not subject to income taxes to the extent such distributions are made. Therefore, no federal income tax provision is required.
As of and during the period ended April 30, 2009, the Fund did not have a liability for any unrecognized tax benefits. The Fund recognizes interest and penalties, if any, related to unrecognized tax benefits as income tax expense in the statement of operations. During the period, the Fund did not incur any interest or penalties.
The Fund is not subject to examination by U.S. federal tax authorities or state tax authorities for tax years before 2005.
Non-U.S. taxation — Dividend income is recorded net of non-U.S. taxes paid.
Distributions — Distributions paid to shareholders are based on net investment income and net realized gains determined on a tax basis, which may differ from net investment income and net realized gains for financial reporting purposes. These differences are due primarily to differing treatment for items such as short-term capital gains and losses; capital losses related to sales of certain securities within 30 days of purchase; and cost of investments sold. The fiscal year in which amounts are distributed may differ from the year in which the net investment income and net realized gains are recorded by the Fund for financial reporting purposes.
During the year ended April 30, 2009, the Fund reclassified $793,000 from undistributed net investment income to capital paid in on shares of capital stock and $1,582,000 from undistributed net investment income to accumulated net realized loss to align financial reporting with tax reporting. The Fund had post-October capital loss deferrals (realized during the period November 1, 2008 through April 30, 2009) of $5,718,784,000. These deferrals are considered incurred in the subsequent year.
As of April 30, 2009, the tax basis components of distributable earnings, unrealized appreciation (depreciation) and cost of investment securities were as follows:
| | (dollars in thousands) |
| Undistributed ordinary income | $ 352,503 |
| Capital loss carryforward expiring 2017* | (2,944,294) |
| Gross unrealized appreciation on investment securities | 4,319,251 |
| Gross unrealized depreciation on investment securities | (6,123,786) |
| Net unrealized depreciation on investment securities | (1,804,535) |
| Cost of investment securities | 45,200,989 |
*The capital loss carryforward will be used to offset any capital gains realized by the Fund in future years through the expiration date. The Fund will not make distributions from capital gains while a capital loss carryforward remains. |
The tax character of distributions paid to shareholders was as follows (dollars in thousands):
| | Year ended April 30, 2009 | | Year ended April 30, 2008 |
Share class | Ordinary income | | Long-term capital gains | | Total distributions paid | | Ordinary income | | Long-term capital gains | | Total distributions paid |
| Class A | $1,297,249 | | $ 870,934 | | $2,168,183 | | $1,359,595 | | $3,585,283 | | $4,944,878 |
| Class B | 41,064 | | 37,205 | | 78,269 | | 39,436 | | 166,455 | | 205,891 |
| Class C | 45,521 | | 42,136 | | 87,657 | | 40,970 | | 180,117 | | 221,087 |
| Class F-1 | 61,223 | | 40,201 | | 101,424 | | 62,521 | | 169,167 | | 231,688 |
| Class F-2* | 2,328 | | 2,274 | | 4,602 | | — | | — | | — |
| Class 529-A | 24,494 | | 17,169 | | 41,663 | | 21,708 | | 60,771 | | 82,479 |
| Class 529-B | 3,214 | | 3,124 | | 6,338 | | 2,504 | | 11,804 | | 14,308 |
| Class 529-C | 5,743 | | 5,563 | | 11,306 | | 4,373 | | 20,528 | | 24,901 |
| Class 529-E | 1,245 | | 971 | | 2,216 | | 1,034 | | 3,388 | | 4,422 |
| Class 529-F-1 | 1,255 | | 819 | | 2,074 | | 1,103 | | 2,796 | | 3,899 |
| Class R-1 | 1,145 | | 1,062 | | 2,207 | | 869 | | 3,940 | | 4,809 |
| Class R-2 | 13,966 | | 13,255 | | 27,221 | | 11,428 | | 51,095 | | 62,523 |
| Class R-3 | 33,432 | | 24,518 | | 57,950 | | 33,998 | | 108,304 | | 142,302 |
| Class R-4 | 26,156 | | 17,866 | | 44,022 | | 23,449 | | 64,857 | | 88,306 |
| Class R-5 | 38,814 | | 24,769 | | 63,583 | | 29,480 | | 72,855 | | 102,335 |
| Total | $1,596,849 | | $1,101,866 | | $2,698,715 | | $1,632,468 | | $4,501,360 | | $6,133,828 |
*Class F-2 was offered beginning August 1, 2008. |
| 4. Fees and transactions with related parties |
Business management services — The Fund has a Business Management Agreement with Washington Management Corporation (WMC). Under this agreement, WMC provides services necessary to carry on the Fund’s general administrative and corporate affairs. These services encompass matters relating to general corporate governance, regulatory compliance and monitoring of the Fund’s contractual service providers, including custodian operations, shareholder services and Fund share distribution functions. Under the agreement, all expenses chargeable to the Class A shares of the Fund, including compensation to the business manager, shall not exceed 1% of the Class A average net assets of the Fund on an annual basis. The agreement provides for monthly fees, accrued daily, based on a declining series of annual rates beginning with 0.175% on the first $3 billion of daily net assets and decreasing to 0.030% on such assets in excess of $77 billion. WMC waived a portion of its business management services fee commencing on September 1, 2004 and terminating on December 31, 2008. During the year ended April 30, 2009, total business management services fees waived by WMC were $3,343,000. As a result, the fee shown on the accompanying financial statements of $46,735,000, which was equivalent to an annualized rate of 0.083%, was reduced to $43,392,000, or 0.077% of average daily net assets. During the year ended April 30, 2009, WMC paid the Fund’s investment adviser $2,303,000 for performing various fund accounting services for the Fund and for The American Funds Tax-Exempt Series I, another registered investment company for which WMC serves as business manager. Johnston, Lemon & Co. Incorporated (JLC), a wholly owned subsidiary of The Johnston-Lemon Group, Incorporated (parent company of WMC), earned $508,000 on its retail sales of shares, including payments under the distribution plans of the Fund. JLC received no brokerage commissions resulting from the purchases and sales of securities for the investment account of the Fund.
Investment advisory services — Capital Research and Management Company (CRMC), the Fund’s investment adviser, is the parent company of American Funds Service Company¨ (AFS), the Fund’s transfer agent, and American Funds Distributors,¨ Inc. (AFD), the principal underwriter of the Fund’s shares. The Investment Advisory Agreement with CRMC provides for monthly fees accrued daily. These fees are based on a declining series of annual rates beginning with 0.225% on the first $3 billion of daily net assets and decreasing to 0.177% on such assets in excess of $89 billion. CRMC waived a portion of its investment advisory services fee commencing on September 1, 2004 and terminating on December 31, 2008. During the year ended April 30, 2009, total investment advisory services fees waived by CRMC were $8,278,000. As a result, the fee shown on the accompanying financial statements of $110,730,000, which was equivalent to an annualized rate of 0.196%, was reduced to $102,452,000 or 0.182% of average daily net assets.
Class-specific fees and expenses — Expenses that are specific to individual share classes are accrued directly to the respective share class. The principal class-specific fees and expenses are described below:
Distribution services — The Fund has adopted plans of distribution for all share classes, except Classes F-2 and R-5. Under the plans, the board of directors approves certain categories of expenses that are used to finance activities primarily intended to sell Fund shares and service existing accounts. The plans provide for payments, based on an annualized percentage of average daily net assets, ranging from 0.25% to 1.00% as noted below. In some cases, the board of directors has limited the amounts that may be paid to less than the maximum allowed by the plans. All share classes, except Classes F-2 and R-5, may use up to 0.25% of average daily net assets to pay service fees, or to compensate AFD for paying service fees, to firms that have entered into agreements with AFD to provide certain shareholder services. The remaining amounts available to be paid under each plan are paid to dealers to compensate them for their sales activities.
For Classes A and 529-A, the board of directors has also approved the reimbursement of dealer and wholesaler commissions paid by AFD for certain shares sold without a sales charge. These classes reimburse AFD for amounts billed within the prior 15 months but only to the extent that the overall annual expense limit of 0.25% is not exceeded. As of April 30, 2009, there were no unreimbursed expenses subject to reimbursement for Classes A or 529-A.
| Share class | Currently approved limits | Plan limits |
| Class A | 0.25% | 0.25% |
| Class 529-A | 0.25 | 0.50 |
| Classes B and 529-B | 1.00 | 1.00 |
| Classes C, 529-C and R-1 | 1.00 | 1.00 |
| Class R-2 | 0.75 | 1.00 |
| Classes 529-E and R-3 | 0.50 | 0.75 |
| Classes F-1, 529-F-1 and R-4 | 0.25 | 0.50 |
Transfer agent services — The Fund has a transfer agent agreement with AFS for Classes A and B. Under this agreement, these share classes compensate AFS for transfer agent services including shareholder recordkeeping, communications and transaction processing. AFS is also compensated for certain transfer agent services provided to all other share classes from the administrative services fees paid to CRMC described below.
Administrative services — The Fund has an administrative services agreement with CRMC to provide transfer agent and other related shareholder services for all share classes other than Classes A and B. Each relevant share class pays CRMC annual fees up to 0.15% (0.10% for Class R-5) based on its respective average daily net assets. Each relevant share class also pays AFS additional amounts for certain transfer agent services. CRMC and AFS may use these fees to compensate third parties for performing these services. Each 529 share class is subject to an additional administrative services fee payable to the Commonwealth of Virginia for the maintenance of the 529 college savings plan. The quarterly fee is based on a declining series of annual rates beginning with 0.10% on the first $30 billion of the net assets invested in Class 529 shares of the American Funds and decreasing to 0.06% on such assets between $120 billion and $150 billion. The fee for any given calendar quarter is accrued and calculated on the basis of the average net assets of Class 529 shares of the American Funds for the last month of the prior calendar quarter. Although these amounts are included with administrative services fees on the accompanying financial statements, the Commonwealth of Virginia is not considered a related party.
Expenses under the agreements described on the previous page for the year ended April 30, 2009, were as follows (dollars in thousands):
| | | | | | Administrative services |
Share class | Distribution services | | Transfer agent services | | CRMC administrative services | | Transfer agent services | | Commonwealth of Virginia administrative services |
| Class A | $106,506 | | $57,970 | | Not applicable | | Not applicable | | Not applicable |
| Class B | 19,223 | | 2,339 | | Not applicable | | Not applicable | | Not applicable |
| Class C | 21,524 | | | | $3,163 | | $476 | | Not applicable |
| Class F-1 | 5,202 | | | | 2,705 | | 235 | | Not applicable |
| Class F-2* | Not applicable | | | | 81 | | 9 | | Not applicable |
| Class 529-A | 1,793 | | | | 857 | | 148 | | $850 |
| Class 529-B | 1,553 | | | | 157 | | 50 | | 156 |
| Class 529-C | 2,743 | | Included in | | 278 | | 80 | | 276 |
| Class 529-E | 239 | | administrative | | 48 | | 8 | | 40 |
| Class 529-F-1 | — | | services | | 41 | | 7 | | 48 |
| Class R-1 | 515 | | | | 51 | | 27 | | Not applicable |
| Class R-2 | 4,934 | | | | 975 | | 2,054 | | Not applicable |
| Class R-3 | 6,391 | | | | 1,556 | | 714 | | Not applicable |
| Class R-4 | 2,204 | | | | 1,246 | | 36 | | Not applicable |
| Class R-5 | Not applicable | | | | 1,100 | | 18 | | Not applicable |
| Total | $172,827 | | $60,309 | | $12,258 | | $3,862 | | $1,370 |
*Class F-2 was offered beginning August 1, 2008. |
Directors’ and advisory board’s deferred compensation — Since the adoption of the deferred compensation plan in 1994, independent directors and advisory board members may elect to defer the cash payment of part or all of their compensation. These deferred amounts, which remain as liabilities of the Fund, are treated as if invested in shares of the Fund or other American Funds. These amounts represent general, unsecured liabilities of the Fund and vary according to the total returns of the selected funds. Directors’ and advisory board’s compensation of $667,000, shown on the accompanying financial statements, includes $1,362,000 in current fees (either paid in cash or deferred) and a net decrease of $695,000 in the value of the deferred amounts.
Affiliated officers and directors — All officers and all interested directors of the Fund are affiliated with WMC. Officers and interested directors do not receive compensation directly from the Fund.
| 5. Disclosure of fair value measurements |
The Fund adopted the Statement of Financial Accounting Standards No. 157 (FAS 157), Fair Value Measurements, on May 1, 2008. FAS 157 requires the Fund to classify its assets and liabilities into three levels based on the method used to value the assets or liabilities. Level 1 values are based on quoted prices in active markets for identical securities. Level 2 values are based on significant observable market inputs, such as quoted prices for similar securities and quoted prices in inactive markets. Level 3 values are based on significant unobservable inputs that reflect the Fund’s determination of assumptions that market participants might reasonably use in valuing the securities. The valuation levels are not necessarily an indication of the risk or liquidity associated with the underlying investment. For example, U.S. government securities are generally high-quality and liquid; however, they are reflected as Level 2 because the inputs used to determine fair value may not always be quoted prices in an active market. The following table presents the Fund’s valuation levels as of April 30, 2009 (dollars in thousands):
| | Investment securities |
| Level 1 – Quoted prices | | $42,490,387 |
| Level 2 – Other significant observable inputs | | 906,067 |
| Level 3 – Significant unobservable inputs | | — |
| Total | | $43,396,454 |
| 6. Capital share transactions |
Capital share transactions in the Fund were as follows (dollars and shares in thousands):
| | | Sales* | | | Reinvestments of dividends and distributions | | | Repurchases* | | | Net (decrease) increase | |
| Share class | | Amount | | Shares | | | Amount | | Shares | | | Amount | | Shares | | | Amount | | Shares | |
| Year ended April 30, 2009 | |
| Class A | | $ | 4,200,504 | | | 180,201 | | | $ | 2,058,558 | | | 91,881 | | | $ | (10,541,874) | | | (458,944) | | | $ | (4,282,812) | | | (186,862) | |
| Class B | | | 92,539 | | | 4,019 | | | | 75,383 | | | 3,435 | | | | (531,235) | | | (22,802) | | | | (363,313) | | | (15,348) | |
| Class C | | | 244,752 | | | 10,579 | | | | 83,430 | | | 3,822 | | | | (605,517) | | | (26,386) | | | | (277,335) | | | (11,985) | |
| Class F-1 | | | 578,188 | | | 24,356 | | | | 90,468 | | | 4,030 | | | | (1,023,594) | | | (44,713) | | | | (354,938) | | | (16,327) | |
Class F-2 † | | | 240,487 | | | 10,436 | | | | 3,918 | | | 194 | | | | (68,292) | | | (3,225) | | | | 176,113 | | | 7,405 | |
| Class 529-A | | | 107,569 | | | 4,506 | | | | 41,655 | | | 1,877 | | | | (108,292) | | | (4,685) | | | | 40,932 | | | 1,698 | |
| Class 529-B | | | 11,096 | | | 464 | | | | 6,335 | | | 291 | | | | (18,358) | | | (792) | | | | (927) | | | (37) | |
| Class 529-C | | | 36,622 | | | 1,551 | | | | 11,300 | | | 520 | | | | (45,606) | | | (1,951) | | | | 2,316 | | | 120 | |
| Class 529-E | | | 7,947 | | | 341 | | | | 2,215 | | | 101 | | | | (5,958) | | | (264) | | | | 4,204 | | | 178 | |
| Class 529-F-1 | | | 8,609 | | | 362 | | | | 2,074 | | | 94 | | | | (8,049) | | | (328) | | | | 2,634 | | | 128 | |
| Class R-1 | | | 18,248 | | | 765 | | | | 2,194 | | | 101 | | | | (17,362) | | | (734) | | | | 3,080 | | | 132 | |
| Class R-2 | | | 187,302 | | | 8,071 | | | | 27,194 | | | 1,251 | | | | (205,867) | | | (8,737) | | | | 8,629 | | | 585 | |
| Class R-3 | | | 306,695 | | | 13,036 | | | | 57,913 | | | 2,611 | | | | (552,239) | | | (21,903) | | | | (187,631) | | | (6,256) | |
| Class R-4 | | | 330,062 | | | 14,278 | | | | 43,973 | | | 1,989 | | | | (287,409) | | | (12,009) | | | | 86,626 | | | 4,258 | |
| Class R-5 | | | 650,276 | | | 26,249 | | | | 62,999 | | | 2,850 | | | | (332,172) | | | (13,420) | | | | 381,103 | | | 15,679 | |
| Total net increase (decrease) | | $ | 7,020,896 | | | 299,214 | | | $ | 2,569,609 | | | 115,047 | | | $ | (14,351,824) | | | (620,893) | | | $ | (4,761,319) | | | (206,632) | |
| Year ended April 30, 2008 | |
| Class A | | $ | 4,539,386 | | | 130,369 | | | $ | 4,685,429 | | | 136,946 | | | $ | (10,494,108) | | | (300,495) | | | $ | (1,269,293) | | | (33,180) | |
| Class B | | | 116,384 | | | 3,359 | | | | 197,425 | | | 5,817 | | | | (477,569) | | | (13,972) | | | | (163,760) | | | (4,796) | |
| Class C | | | 297,165 | | | 8,550 | | | | 209,865 | | | 6,199 | | | | (568,835) | | | (16,619) | | | | (61,8050 | | | (1,870) | |
| Class F-1 | | | 687,457 | | | 19,989 | | | | 205,850 | | | 6,033 | | | | (711,508) | | | (20,623) | | | | 181,799 | | | 5,399 | |
| Class 529-A | | | 164,214 | | | 4,721 | | | | 82,461 | | | 2,416 | | | | (101,966) | | | (2,941) | | | | 144,709 | | | 4,196 | |
| Class 529-B | | | 16,779 | | | 483 | | | | 14,305 | | | 422 | | | | (16,237) | | | (473) | | | | 14,847 | | | 432 | |
| Class 529-C | | | 56,392 | | | 1,625 | | | | 24,887 | | | 734 | | | | (43,637) | | | (1,263) | | | | 37,642 | | | 1,096 | |
| Class 529-E | | | 10,112 | | | 291 | | | | 4,422 | | | 130 | | | | (6,934) | | | (201) | | | | 7,600 | | | 220 | |
| Class 529-F-1 | | | 13,317 | | | 386 | | | | 3,893 | | | 114 | | | | (5,026) | | | (144) | | | | 12,184 | | | 356 | |
| Class R-1 | | | 26,619 | | | 761 | | | | 4,766 | | | 141 | | | | (23,725) | | | (690) | | | | 7,660 | | | 212 | |
| Class R-2 | | | 252,990 | | | 7,342 | | | | 62,491 | | | 1,847 | | | | (311,606) | | | (9,032) | | | | 3,875 | | | 157 | |
| Class R-3 | | | 488,721 | | | 13,952 | | | | 142,237 | | | 4,182 | | | | (740,1330 | | | (21,068) | | | | (109,175) | ) | | (2,934) | |
| Class R-4 | | | 357,582 | | | 10,359 | | | | 88,262 | | | 2,589 | | | | (375,296) | | | (10,884) | | | | 70,548 | | | 2,064 | |
| Class R-5 | | | 579,553 | | | 16,475 | | | | 101,570 | | | 2,974 | | | | (335,199) | | | (9,716) | | | | 345,924 | | | 9,733 | |
| Total net increase (decrease) | | $ | 7,606,671 | | | 218,662 | | | $ | 5,827,863 | | | 170,544 | | | $ | (14,211,779) | | | (408,121) | | | $ | (777,245) | | | (18,915) | |
*Includes exchanges between share classes of the Fund. † Class F-2 was offered beginning August 1, 2008. | | | | | | | | | | | | | | | | | | |
| 7. Investment transactions |
The Fund made purchases and sales of investment securities, excluding short-term securities and U.S. government obligations, if any, of $21,286,598,000 and $25,553,517,000, respectively, during the year ended April 30, 2009.
Financial highlights1
| | (Loss) income from investment operations2 | Dividends and distributions | | | | Ratio of expenses to average net assets before reimbursements/ waivers | Ratio of expenses to average net assets after reimbursements/ waivers4 | Ratio of net income to average net assets4 |
| | Net asset value, beginning of period | Net investment income | Net (losses) gains on securities (both realized and unrealized) | Total from investment operations | Dividends (from net investment income) | Distributions (from capital gains) | Total dividends and distributions | Net asset value, end of period | Total return3,4 | Net assets, end of period (in millions) |
| Class A: | | | | | | | | | | | | | |
| Year ended 4/30/2009 | $31.92 | $.64 | $(11.53) | $(10.89) | $(.72) | $ (.50) | $(1.22) | $19.81 | (34.50)% | $34,012 | .67% | .65% | 2.60% |
| Year ended 4/30/2008 | 36.55 | .71 | (2.68) | (1.97) | (.72) | (1.94) | (2.66) | 31.92 | (5.78) | 60,782 | .60 | .58 | 2.02 |
| Year ended 4/30/2007 | 32.66 | .68 | 4.71 | 5.39 | (.66) | (.84) | (1.50) | 36.55 | 16.85 | 70,811 | .60 | .57 | 2.00 |
| Year ended 4/30/2006 | 29.85 | .66 | 3.20 | 3.86 | (.62) | (.43) | (1.05) | 32.66 | 13.11 | 64,202 | .60 | .57 | 2.13 |
| Year ended 4/30/2005 | 28.79 | .67 | 1.22 | 1.89 | (.60) | (.23) | (.83) | 29.85 | 6.55 | 61,185 | .61 | .60 | 2.24 |
| Class B: | | | | | | | | | | | | | |
| Year ended 4/30/2009 | 31.71 | .45 | (11.46) | (11.01) | (.53) | (.50) | (1.03) | 19.67 | (35.01) | 1,389 | 1.42 | 1.40 | 1.85 |
| Year ended 4/30/2008 | 36.33 | .44 | (2.67) | (2.23) | (.45) | (1.94) | (2.39) | 31.71 | (6.51) | 2,726 | 1.36 | 1.33 | 1.27 |
| Year ended 4/30/2007 | 32.47 | .42 | 4.69 | 5.11 | (.41) | (.84) | (1.25) | 36.33 | 15.98 | 3,296 | 1.36 | 1.33 | 1.24 |
| Year ended 4/30/2006 | 29.69 | .42 | 3.17 | 3.59 | (.38) | (.43) | (.81) | 32.47 | 12.24 | 3,053 | 1.37 | 1.34 | 1.37 |
| Year ended 4/30/2005 | 28.64 | .43 | 1.22 | 1.65 | (.37) | (.23) | (.60) | 29.69 | 5.75 | 2,902 | 1.38 | 1.37 | 1.47 |
| Class C: | | | | | | | | | | | | | |
| Year ended 4/30/2009 | 31.65 | .44 | (11.44) | (11.00) | (.52) | (.50) | (1.02) | 19.63 | (35.04) | 1,613 | 1.47 | 1.44 | 1.80 |
| Year ended 4/30/2008 | 36.26 | .42 | (2.66) | (2.24) | (.43) | (1.94) | (2.37) | 31.65 | (6.54) | 2,979 | 1.41 | 1.38 | 1.22 |
| Year ended 4/30/2007 | 32.41 | .39 | 4.68 | 5.07 | (.38) | (.84) | (1.22) | 36.26 | 15.91 | 3,481 | 1.42 | 1.40 | 1.17 |
| Year ended 4/30/2006 | 29.64 | .40 | 3.16 | 3.56 | (.36) | (.43) | (.79) | 32.41 | 12.15 | 3,113 | 1.43 | 1.41 | 1.30 |
| Year ended 4/30/2005 | 28.59 | .41 | 1.22 | 1.63 | (.35) | (.23) | (.58) | 29.64 | 5.69 | 2,991 | 1.46 | 1.45 | 1.39 |
| Class F-1: | | | | | | | | | | | | | |
| Year ended 4/30/2009 | 31.85 | .64 | (11.51) | (10.87) | (.72) | (.50) | (1.22) | 19.76 | (34.52) | 1,506 | .67 | .65 | 2.59 |
| Year ended 4/30/2008 | 36.48 | .70 | (2.68) | (1.98) | (.71) | (1.94) | (2.65) | 31.85 | (5.82) | 2,947 | .63 | .61 | 1.99 |
| Year ended 4/30/2007 | 32.60 | .67 | 4.70 | 5.37 | (.65) | (.84) | (1.49) | 36.48 | 16.83 | 3,179 | .62 | .59 | 1.97 |
| Year ended 4/30/2006 | 29.80 | .65 | 3.19 | 3.84 | (.61) | (.43) | (1.04) | 32.60 | 13.06 | 2,646 | .63 | .61 | 2.10 |
| Year ended 4/30/2005 | 28.74 | .64 | 1.22 | 1.86 | (.57) | (.23) | (.80) | 29.80 | 6.47 | 2,505 | .69 | .68 | 2.15 |
| Class F-2: | | | | | | | | | | | | | |
Period from 8/5/2008 to 4/30/2009 | 29.64 | .46 | (9.22) | (8.76) | (.57) | (.50) | (1.07) | 19.81 | (29.77) | 147 | .445 | .435 | 3.105 |
| Class 529-A: | | | | | | | | | | | | | |
| Year ended 4/30/2009 | 31.89 | .62 | (11.52) | (10.90) | (.71) | (.50) | (1.21) | 19.78 | (34.57) | 709 | .73 | .71 | 2.55 |
| Year ended 4/30/2008 | 36.51 | .67 | (2.66) | (1.99) | (.69) | (1.94) | (2.63) | 31.89 | (5.85) | 1,089 | .69 | .66 | 1.93 |
| Year ended 4/30/2007 | 32.63 | .65 | 4.71 | 5.36 | (.64) | (.84) | (1.48) | 36.51 | 16.75 | 1,094 | .67 | .65 | 1.91 |
| Year ended 4/30/2006 | 29.83 | .64 | 3.19 | 3.83 | (.60) | (.43) | (1.03) | 32.63 | 13.01 | 833 | .68 | .65 | 2.05 |
| Year ended 4/30/2005 | 28.76 | .63 | 1.23 | 1.86 | (.56) | (.23) | (.79) | 29.83 | 6.47 | 633 | .71 | .70 | 2.12 |
| Class 529-B: | | | | | | | | | | | | | |
| Year ended 4/30/2009 | 31.74 | .42 | (11.47) | (11.05) | (.50) | (.50) | (1.00) | 19.69 | (35.08) | 126 | 1.53 | 1.51 | 1.74 |
| Year ended 4/30/2008 | 36.36 | .39 | (2.66) | (2.27) | (.41) | (1.94) | (2.35) | 31.74 | (6.62) | 204 | 1.49 | 1.46 | 1.13 |
| Year ended 4/30/2007 | 32.50 | .38 | 4.68 | 5.06 | (.36) | (.84) | (1.20) | 36.36 | 15.82 | 218 | 1.48 | 1.46 | 1.11 |
| Year ended 4/30/2006 | 29.72 | .38 | 3.17 | 3.55 | (.34) | (.43) | (.77) | 32.50 | 12.07 | 180 | 1.51 | 1.48 | 1.22 |
| Year ended 4/30/2005 | 28.68 | .38 | 1.21 | 1.59 | (.32) | (.23) | (.55) | 29.72 | 5.52 | 148 | 1.58 | 1.57 | 1.26 |
| Class 529-C: | | | | | | | | | | | | | |
| Year ended 4/30/2009 | 31.73 | .43 | (11.47) | (11.04) | (.51) | (.50) | (1.01) | 19.68 | (35.08) | 226 | 1.52 | 1.50 | 1.75 |
| Year ended 4/30/2008 | 36.35 | .39 | (2.66) | (2.27) | (.41) | (1.94) | (2.35) | 31.73 | (6.62) | 361 | 1.49 | 1.46 | 1.13 |
| Year ended 4/30/2007 | 32.49 | .38 | 4.69 | 5.07 | (.37) | (.84) | (1.21) | 36.35 | 15.84 | 374 | 1.48 | 1.45 | 1.11 |
| Year ended 4/30/2006 | 29.71 | .38 | 3.18 | 3.56 | (.35) | (.43) | (.78) | 32.49 | 12.10 | 295 | 1.50 | 1.47 | 1.23 |
| Year ended 4/30/2005 | 28.67 | .37 | 1.22 | 1.59 | (.32) | (.23) | (.55) | 29.71 | 5.54 | 226 | 1.57 | 1.56 | 1.27 |
| Class 529-E: | | | | | | | | | | | | | |
| Year ended 4/30/2009 | 31.77 | .55 | (11.48) | (10.93) | (.63) | (.50) | (1.13) | 19.71 | (34.74) | 41 | 1.02 | 1.00 | 2.26 |
| Year ended 4/30/2008 | 36.39 | .57 | (2.66) | (2.09) | (.59) | (1.94) | (2.53) | 31.77 | (6.14) | 60 | .98 | .95 | 1.64 |
| Year ended 4/30/2007 | 32.52 | .55 | 4.70 | 5.25 | (.54) | (.84) | (1.38) | 36.39 | 16.44 | 61 | .97 | .94 | 1.62 |
| Year ended 4/30/2006 | 29.74 | .54 | 3.17 | 3.71 | (.50) | (.43) | (.93) | 32.52 | 12.64 | 46 | .98 | .96 | 1.74 |
| Year ended 4/30/2005 | 28.69 | .53 | 1.22 | 1.75 | (.47) | (.23) | (.70) | 29.74 | 6.09 | 35 | 1.05 | 1.04 | 1.79 |
| | | | | | | | | | | | | | |
| | (Loss) income from investment operations2 | Dividends and distributions | | | | Ratio of expenses to average net assets before reimbursements/ waivers | Ratio of expenses to average net assets after reimbursements/ waivers4 | Ratio of net income to average net assets4 |
| | Net asset value, beginning of period | Net investment income | Net (losses) gains on securities (both realized and unrealized) | Total from investment operations | Dividends (from net investment income) | Distributions (from capital gains) | Total dividends and distributions | Net asset value, end of period | Total return4 | Net assets, end of period (in millions) |
| Class 529-F-1: | | | | | | | | | | | | | |
| Year ended 4/30/2009 | $31.85 | $.67 | $(11.50) | $(10.83) | $(.76) | $(.50) | $(1.26) | $19.76 | (34.41)% | $35 | .52% | .50% | 2.77% |
| Year ended 4/30/2008 | 36.47 | .74 | (2.66) | (1.92) | (.76) | (1.94) | (2.70) | 31.85 | (5.65) | 52 | .48 | .45 | 2.14 |
| Year ended 4/30/2007 | 32.59 | .72 | 4.70 | 5.42 | (.70) | (.84) | (1.54) | 36.47 | 17.01 | 47 | .47 | .44 | 2.11 |
| Year ended 4/30/2006 | 29.79 | .70 | 3.18 | 3.88 | (.65) | (.43) | (1.08) | 32.59 | 13.20 | 32 | .49 | .46 | 2.24 |
| Year ended 4/30/2005 | 28.74 | .60 | 1.22 | 1.82 | (.54) | (.23) | (.77) | 29.79 | 6.35 | 21 | .80 | .79 | 2.03 |
| Class R-1: | | | | | | | | | | | | | |
| Year ended 4/30/2009 | 31.72 | .45 | (11.46) | (11.01) | (.53) | (.50) | (1.03) | 19.68 | (34.99) | 44 | 1.43 | 1.41 | 1.85 |
| Year ended 4/30/2008 | 36.33 | .42 | (2.66) | (2.24) | (.43) | (1.94) | (2.37) | 31.72 | (6.55) | 67 | 1.42 | 1.40 | 1.20 |
| Year ended 4/30/2007 | 32.48 | .39 | 4.68 | 5.07 | (.38) | (.84) | (1.22) | 36.33 | 15.86 | 69 | 1.43 | 1.41 | 1.15 |
| Year ended 4/30/2006 | 29.71 | .39 | 3.17 | 3.56 | (.36) | (.43) | (.79) | 32.48 | 12.10 | 47 | 1.47 | 1.44 | 1.26 |
| Year ended 4/30/2005 | 28.68 | .40 | 1.21 | 1.61 | (.35) | (.23) | (.58) | 29.71 | 5.62 | 34 | 1.50 | 1.47 | 1.35 |
| Class R-2: | | | | | | | | | | | | | |
| Year ended 4/30/2009 | 31.64 | .43 | (11.44) | (11.01) | (.51) | (.50) | (1.01) | 19.62 | (35.07) | 548 | 1.50 | 1.48 | 1.77 |
| Year ended 4/30/2008 | 36.25 | .41 | (2.66) | (2.25) | (.42) | (1.94) | (2.36) | 31.64 | (6.57) | 865 | 1.44 | 1.41 | 1.19 |
| Year ended 4/30/2007 | 32.40 | .39 | 4.68 | 5.07 | (.38) | (.84) | (1.22) | 36.25 | 15.91 | 985 | 1.47 | 1.41 | 1.15 |
| Year ended 4/30/2006 | 29.64 | .40 | 3.16 | 3.56 | (.37) | (.43) | (.80) | 32.40 | 12.13 | 812 | 1.53 | 1.41 | 1.29 |
| Year ended 4/30/2005 | 28.60 | .41 | 1.22 | 1.63 | (.36) | (.23) | (.59) | 29.64 | 5.68 | 622 | 1.57 | 1.44 | 1.38 |
| Class R-3: | | | | | | | | | | | | | |
| Year ended 4/30/2009 | 31.76 | .56 | (11.48) | (10.92) | (.64) | (.50) | (1.14) | 19.70 | (34.72) | 1,010 | .97 | .95 | 2.29 |
| Year ended 4/30/2008 | 36.38 | .58 | (2.67) | (2.09) | (.59) | (1.94) | (2.53) | 31.76 | (6.13) | 1,827 | .95 | .93 | 1.67 |
| Year ended 4/30/2007 | 32.51 | .55 | 4.70 | 5.25 | (.54) | (.84) | (1.38) | 36.38 | 16.45 | 2,199 | .96 | .93 | 1.63 |
| Year ended 4/30/2006 | 29.73 | .54 | 3.18 | 3.72 | (.51) | (.43) | (.94) | 32.51 | 12.68 | 1,878 | .97 | .94 | 1.75 |
| Year ended 4/30/2005 | 28.68 | .56 | 1.21 | 1.77 | (.49) | (.23) | (.72) | 29.73 | 6.17 | 1,705 | .95 | .94 | 1.89 |
| Class R-4: | | | | | | | | | | | | | |
| Year ended 4/30/2009 | 31.83 | .63 | (11.50) | (10.87) | (.71) | (.50) | (1.21) | 19.75 | (34.52) | 782 | .69 | .67 | 2.59 |
| Year ended 4/30/2008 | 36.46 | .68 | (2.68) | (2.00) | (.69) | (1.94) | (2.63) | 31.83 | (5.87) | 1,125 | .67 | .65 | 1.95 |
| Year ended 4/30/2007 | 32.57 | .65 | 4.72 | 5.37 | (.64) | (.84) | (1.48) | 36.46 | 16.82 | 1,213 | .67 | .64 | 1.92 |
| Year ended 4/30/2006 | 29.78 | .64 | 3.18 | 3.82 | (.60) | (.43) | (1.03) | 32.57 | 13.00 | 1,013 | .68 | .65 | 2.06 |
| Year ended 4/30/2005 | 28.73 | .64 | 1.22 | 1.86 | (.58) | (.23) | (.81) | 29.78 | 6.46 | 830 | .68 | .67 | 2.14 |
| Class R-5: | | | | | | | | | | | | | |
| Year ended 4/30/2009 | 31.92 | .70 | (11.53) | (10.83) | (.79) | (.50) | (1.29) | 19.80 | (34.31) | 1,129 | .39 | .37 | 2.91 |
| Year ended 4/30/2008 | 36.55 | .78 | (2.67) | (1.89) | (.80) | (1.94) | (2.74) | 31.92 | (5.57) | 1,319 | .37 | .35 | 2.24 |
| Year ended 4/30/2007 | 32.65 | .76 | 4.72 | 5.48 | (.74) | (.84) | (1.58) | 36.55 | 17.15 | 1,154 | .37 | .35 | 2.22 |
| Year ended 4/30/2006 | 29.85 | .73 | 3.19 | 3.92 | (.69) | (.43) | (1.12) | 32.65 | 13.34 | 883 | .38 | .35 | 2.34 |
| Year ended 4/30/2005 | 28.79 | .73 | 1.22 | 1.95 | (.66) | (.23) | (.89) | 29.85 | 6.78 | 619 | .38 | .37 | 2.45 |
| | | | | | | | | | | | | | |
| | | | | Year ended April 30 |
| | | | | 2009 | 2008 | 2007 | 2006 | 2005 |
| Portfolio turnover rate for all classes of shares | 39% | 18% | 19% | 13% | 16% |
1Based on operations for the periods shown (unless otherwise noted) and, accordingly, may not be representative of a full year.
2Based on average shares outstanding.
3Total returns exclude any applicable sales charges, including contingent deferred sales charges.
4This column reflects the impact, if any, of certain reimbursements/waivers from CRMC and WMC. During the periods shown, CRMC and WMC reduced fees for investment advisory services and business management services. In addition, during some of the periods shown, CRMC paid a portion of the Fund’s transfer agent fees for certain retirement plan share classes.
5Annualized.
See Notes to financial statements
Report of Independent Registered Public Accounting Firm
To the Board of Directors and Shareholders of Washington Mutual Investors Fund, Inc.:
In our opinion, the accompanying statement of assets and liabilities, including the investment portfolio, and the related statements of operations and of changes in net assets and the financial highlights present fairly, in all material respects, the financial position of Washington Mutual Investors Fund, Inc. (the "Fund") at April 30, 2009, the results of its operations for the year then ended, the changes in its net assets for each of the two years in the period then ended and its financial highlights for each of the periods presented, in conformity with accounting principles generally accepted in the United States of America. These financial statements and financial highlights (hereafter referred to as "financial statements") are the responsibility of the Fund’s management; our responsibility is to express an opinion on these financial statements based on our audits. We conducted our audits of these financial statements in accordance with the standards of the Public Company Accounting Oversight Board (United States). Those standards require that we plan and perform the audit to obtain reasonable assurance about whether the financial statements are free of material misstatement. An audit includes examining, on a test basis, evidence supporting the amounts and disclosures in the financial statements, assessing the accounting principles used and significant estimates made by management, and evaluating the overall financial statement presentation. We believe that our audits, which included confirmation of securities owned at April 30, 2009 by correspondence with the custodian and brokers, provide a reasonable basis for our opinion.
PricewaterhouseCoopers LLP
Los Angeles, California
June 5, 2009
| Other share class results | unaudited |
Fund results shown are for past periods and are not predictive of results for future periods. Current and future results may be lower or
higher than those shown. Share prices and returns will vary, so investors may lose money. For current information and month-end results, visit americanfunds.com.
Average annual total returns for periods ended March 31, 2009 (the most recent calendar quarter-end):
| | | 1 year | 5 years | Life of class |
Class B shares1 — first sold 3/15/00 | | | | |
Reflecting applicable contingent deferred sales charge (CDSC), maximum of 5%, payable only if shares are sold within six years of purchase | | –40.36% | –5.45% | –0.14% |
| Not reflecting CDSC | | –37.37 | –5.13 | –0.14 |
Class C shares — first sold 3/15/01 | | | | |
Reflecting CDSC, maximum of 1%, payable only if shares are sold within one year of purchase | | –38.00 | –5.19 | –2.16 |
| Not reflecting CDSC | | –37.41 | –5.19 | –2.16 |
Class F-1 shares2 — first sold 3/15/01 | | | | |
Not reflecting annual asset-based fee charged by sponsoring firm | | –36.91 | –4.45 | –1.39 |
Class F-2 shares2 — first sold 8/5/08 | | | | |
Not reflecting annual asset-based fee charged by sponsoring firm | | — | — | –34.773 |
Class 529-A shares4 — first sold 2/15/02 | | | | |
Reflecting 5.75% maximum sales charge | | –40.56 | –5.61 | –2.58 |
| Not reflecting maximum sales charge | | –36.94 | –4.49 | –1.77 |
Class 529-B shares1,4 — first sold 2/19/02 | | | | |
Reflecting applicable CDSC, maximum of 5%, payable only if shares are sold within six years of purchase | | –40.44 | –5.58 | –2.36 |
| Not reflecting CDSC | | –37.45 | –5.27 | –2.36 |
Class 529-C shares4 — first sold 2/15/02 | | | | |
Reflecting CDSC, maximum of 1%, payable only if shares are sold within one year of purchase | | –38.03 | –5.26 | –2.58 |
| Not reflecting CDSC | | –37.44 | –5.26 | –2.58 |
Class 529-E shares2,4 — first sold 3/1/02 | | –37.12 | –4.78 | –2.52 |
Class 529-F-1 shares2,4 — first sold 9/16/02 | | | | |
Not reflecting annual asset-based fee charged by sponsoring firm | | –36.82 | –4.36 | 0.21 |
1These shares are no longer available for purchase. 2These shares are sold without any initial or contingent deferred sales charge. 3Results are cumulative total returns; they are not annualized. 4Results shown do not reflect the $10 account setup fee and an annual $10 account maintenance fee. | | |
Investment results assume all distributions are reinvested and reflect applicable fees and expenses. The Fund’s investment adviser and business manager waived a portion of their management fees from September 1, 2004 through December 31, 2008. Fund results shown reflect the waiver, without which they would have been lower. Please see the Financial Highlights table on pages 24 and 25 for details.
For information regarding the differences among the various share classes, please refer to the Fund’s prospectus.
As a shareholder of the Fund, you incur two types of costs: (1) transaction costs, such as initial sales charges on purchase payments and contingent deferred sales charges on redemptions (loads), and (2) ongoing costs, including management fees, distribution and service (12b-1) fees, and other expenses. This example is intended to help you understand your ongoing costs (in dollars) of investing in the Fund so you can compare these costs with the ongoing costs of investing in other mutual funds. The example is based on an investment of $1,000 invested at the beginning of the period and held for the entire period (November 1, 2008 through April 30, 2009).
Actual expenses:
The first line of each share class in the table on the next page provides information about actual account values and actual expenses. You may use the information in this line, together with the amount you invested, to estimate the expenses that you paid over the period. Simply divide your account value by $1,000 (for example, an $8,600 account value divided by $1,000 = 8.6), then multiply the result by the number in the first line under the heading entitled "Expenses paid during period" to estimate the expenses you paid on your account during this period.
Hypothetical example for comparison purposes:
The second line of each share class in the table on the next page provides information about hypothetical account values and hypothetical expenses based on the actual expense ratio for the share class and an assumed rate of return of 5.00% per year before expenses, which is not the actual return of the share class. The hypothetical account values and expenses may not be used to estimate the actual ending account balance or expenses you paid for the period. You may use this information to compare the ongoing costs of investing in the Fund and other funds. To do so, compare this 5.00% hypothetical example with the 5.00% hypothetical examples that appear in the shareholder reports of the other funds.
Notes:
There are some account fees that are charged to certain types of accounts, such as individual retirement accounts and 529 college savings plan accounts (generally, a $10 fee is charged to set up the account and an additional $10 fee is charged to the account annually), that would increase the amount of expenses paid on your account. In addition, retirement plan participants may be subject to certain fees charged by the plan sponsor, and Class F-1, F-2 and 529-F-1 shareholders may be subject to fees charged by financial intermediaries, typically ranging from 0.75% to 1.50% of assets annually depending on services offered. You can estimate the impact of these fees by adding the amount of the fees to the total estimated expenses you paid on your account during the period as calculated above. In addition, your ending account value would be lower by the amount of these fees.
Please note that the expenses shown in the table are meant to highlight your ongoing costs only and do not reflect any transactional costs, such as sales charges (loads). Therefore, the second line of each share class in the table is useful in comparing ongoing costs only and will not help you determine the relative total costs of owning different funds. In addition, if these transactional costs were included, your costs would have been higher.
| | Beginning account value 11/1/2008 | Ending account value 4/30/2009 | Expenses paid during period* | Annualized expense ratio |
| Class A — actual return | $1,000.00 | $889.96 | $3.33 | .71% |
| Class A — assumed 5% return | 1,000.00 | 1,021.27 | 3.56 | .71 |
| Class B — actual return | 1,000.00 | 886.27 | 6.83 | 1.46 |
| Class B — assumed 5% return | 1,000.00 | 1,017.55 | 7.30 | 1.46 |
| Class C — actual return | 1,000.00 | 886.33 | 7.02 | 1.50 |
| Class C — assumed 5% return | 1,000.00 | 1,017.36 | 7.50 | 1.50 |
| Class F-1 — actual return | 1,000.00 | 889.73 | 3.28 | .70 |
| Class F-1 — assumed 5% return | 1,000.00 | 1,021.32 | 3.51 | .70 |
| Class F-2 — actual return | 1,000.00 | 890.76 | 2.06 | .44 |
| Class F-2 — assumed 5% return | 1,000.00 | 1,022.61 | 2.21 | .44 |
| Class 529-A — actual return | 1,000.00 | 889.27 | 3.51 | .75 |
| Class 529-A — assumed 5% return | 1,000.00 | 1,021.08 | 3.76 | .75 |
| Class 529-B — actual return | 1,000.00 | 885.99 | 7.29 | 1.56 |
| Class 529-B — assumed 5% return | 1,000.00 | 1,017.06 | 7.80 | 1.56 |
| Class 529-C — actual return | 1,000.00 | 885.99 | 7.20 | 1.54 |
| Class 529-C — assumed 5% return | 1,000.00 | 1,017.16 | 7.70 | 1.54 |
| Class 529-E — actual return | 1,000.00 | 888.39 | 4.87 | 1.04 |
| Class 529-E — assumed 5% return | 1,000.00 | 1,019.64 | 5.21 | 1.04 |
| Class 529-F-1 — actual return | 1,000.00 | 890.88 | 2.53 | .54 |
| Class 529-F-1 — assumed 5% return | 1,000.00 | 1,022.12 | 2.71 | .54 |
| Class R-1 — actual return | 1,000.00 | 886.80 | 6.74 | 1.44 |
| Class R-1 — assumed 5% return | 1,000.00 | 1,017.65 | 7.20 | 1.44 |
| Class R-2 — actual return | 1,000.00 | 885.92 | 7.34 | 1.57 |
| Class R-2 — assumed 5% return | 1,000.00 | 1,017.01 | 7.85 | 1.57 |
| Class R-3 — actual return | 1,000.00 | 888.39 | 4.78 | 1.02 |
| Class R-3 — assumed 5% return | 1,000.00 | 1,019.74 | 5.11 | 1.02 |
| Class R-4 — actual return | 1,000.00 | 889.68 | 3.28 | .70 |
| Class R-4 — assumed 5% return | 1,000.00 | 1,021.32 | 3.51 | .70 |
| Class R-5 — actual return | 1,000.00 | 891.33 | 1.88 | .40 |
| Class R-5 — assumed 5% return | 1,000.00 | 1,022.81 | 2.01 | .40 |
*The "expenses paid during period" are equal to the "annualized expense ratio," multiplied by the average account value over the period, multiplied by the number of days in the period (181), and divided by 365 (to reflect the one-half year period). |
We are required to advise you within 60 days of the Fund’s fiscal year-end regarding the federal tax status of certain distributions received by shareholders during such fiscal year. The Fund hereby designates the following amounts for the Fund’s fiscal year ended April 30, 2009:
| Long-term capital gains | $1,101,866,000 |
| Qualified dividend income | 100% |
| Corporate dividends received deduction | 100% |
| U.S. government income that may be exempt from state taxation | $4,722,000 |
Individual shareholders should refer to their Form 1099 or other tax information, which will be mailed in January 2010, to determine the calendar year amounts to be included on their 2009 tax returns. Shareholders should consult their tax advisers.
Board of directors and directors emeriti
Independent directors |
Name and age | Year first elected a director of the Fund1 | Principal occupation(s) during past five years | Number of portfolios in Fund complex2 overseen by director | Other directorships3 held |
Nariman Farvardin, 52 | 2007 | Senior Vice President for Academic Affairs & Provost, University of Maryland; former Dean, The A. James Clark School of Engineering, University of Maryland | 1 | None |
Barbara Hackman Franklin, 69 | 2005 | President and Chief Executive Officer, Barbara Franklin Enterprises (international business and governance consulting); former U.S. Secretary of Commerce | 3 | Aetna, Inc.; The Dow Chemical Company; JPMorgan Value Opportunities Fund |
R. Clark Hooper, 62 | 2003 | Private investor; former President, Dumbarton Group LLC (securities industry consulting); former Executive Vice President — Policy and Oversight, NASD | 18 | JPMorgan Value Opportunities Fund; The Swiss Helvetia Fund, Inc. |
James C. Miller III, 66 | 1992 | Senior Advisor, Husch Blackwell Sanders LLP; former Chairman, The CapAnalysis Group, LLC (economic, financial and regulatory consulting); former Director, U.S. Office of Management and Budget | 3 | Clean Energy Fuels Corporation; JPMorgan Value Opportunities Fund |
Donald L. Nickles, 60 | 2007 | Chairman of the Board and Chief Executive Officer, The Nickles Group (consulting and business venture firm); former United States Senator | 1 | Chesapeake Energy Corporation; Fortress International Group, Inc.; Valero Energy Corporation |
Katherine D. Ortega, 74 | 2002 | Former Treasurer of the United States | 3 | JPMorgan Value Opportunities Fund |
J. Knox Singleton, 60 Chairman of the Board (Independent and Non-Executive) | 2001 | President and Chief Executive Officer, INOVA Health System | 3 | Healthcare Realty Trust, Inc.; JPMorgan Value Opportunities Fund |
William J. Shaw, 63 | 2009 | Vice Chairman; former President and Chief Operating Officer (1997–April 2009), Marriott International, Inc. | 1 | Marriott International, Inc. |
Interested directors4 |
Name, age and position with Fund | Year first elected a director or officer of the Fund1 | Principal occupation(s) during past five years | Number of portfolios in Fund complex2 overseen by director | Other directorships3 held |
James H. Lemon, Jr., 73 Vice Chairman of the Board | 1971 | Chairman of the Board and Chief Executive Officer, The Johnston-Lemon Group, Incorporated (financial services holding company) | 3 | JPMorgan Value Opportunities Fund |
Harry J. Lister, 73 | 1972 | Director, Washington Management Corporation | 1 | None |
Jeffrey L. Steele, 63 President | 2000 | President and Director, Washington Management Corporation | 3 | JPMorgan Value Opportunities Fund |
| Directors emeriti |
Stephen Hartwell, Chairman Emeritus |
| Cyrus A. Ansary | Charles A. Bowsher | Fred J. Brinkman | Daniel J. Callahan III | Edward W. Kelley, Jr. | T. Eugene Smith |
The Fund’s statement of additional information includes additional information about the Fund’s directors and is available without charge upon request by calling American Funds Service Company at 800/421-0180. The address for all directors, advisory board members and officers of the Fund is 1101 Vermont Avenue, NW, Washington, DC 20005, Attention: Fund Secretary.
Advisory board and other officers
Advisory board members |
Name and age | Year first elected to advisory board1 | Principal occupation(s) during past five years | Number of portfolios in Fund complex on which advisory board member serves | Other directorships3 held |
Mary K. Bush, 61 | 1995 | President, Bush International, LLC (international financial advisory services) | 1 | Briggs & Stratton; Discover Financial Services; ManTech International Corporation; Pioneer Funds; UAL Corporation |
Louise M. Cromwell, 64 | 2001 | Retired Partner, Shaw Pittman | 1 | None |
Jeffrey A. Eisenach, 51 | 2008 | Chairman and Managing Partner, Empiris, LLC (economic consulting); former Chairman, Criterion Economics, LLC (economic litigation, regulation and legislation consulting); former Chairman and President, The CapAnalysis Group, LLC (economic, financial and regulatory consulting) | 1 | None |
Linda D. Rabbitt, 60 | 2001 | Chairman and Chief Executive Officer, Rand Construction Corporation | 1 | Brookfield Properties Corporation; Watson Wyatt & Company Holdings |
Robert G. Templin, Jr., 61 | 2008 | President, Northern Virginia Community College | 1 | None |
R. Clark Wadlow, 62 | 2005 | Senior Counsel, Sidley Austin, LLP | 1 | None |
| Other officers |
Name, age and position with Fund | Year first elected an officer of the Fund1 | Principal occupation(s) during past five years |
Michael W. Stockton, 42 Vice President, Treasurer and Assistant Secretary | 1995 | Senior Vice President, Secretary, Treasurer and Director; Washington Management Corporation |
Lois A. Erhard, 56 Vice President | 1983 | Vice President, Washington Management Corporation |
J. Lanier Frank, 48 Assistant Vice President | 1997 | Assistant Vice President, Washington Management Corporation |
Jennifer L. Butler, 43 Secretary | 2005 | Vice President and Assistant Secretary, Washington Management Corporation; former Specialist, Fund Administration, Pacific Investment Management Company |
Stephanie L. Pfromer, 40 Assistant Secretary | 2007 | Vice President and General Counsel, Washington Management Corporation; former Vice President and Senior Counsel, The BISYS Group, Inc. |
Curt M. Scott, 30 Assistant Treasurer | 2006 | Assistant Vice President and Assistant Treasurer, Washington Management Corporation; former Financial Analyst, The BISYS Group, Inc. |
1Directors, advisory board members and officers of the Fund serve until their resignation, removal or retirement.
2Capital Research and Management Company manages the American Funds. Capital Research and Management Company also manages American Funds Insurance Series,¨ which serves as the underlying investment vehicle for certain variable insurance contracts; American Funds Target Date Retirement Series,¨ which is available to investors in tax-deferred retirement plans and IRAs; and Endowments, whose shareholders are limited to certain nonprofit organizations.
3This includes all directorships other than those in the American Funds that are held by each director or advisory board member as a director of a public company or a registered investment company.
4"Interested persons" within the meaning of the 1940 Act on the basis of their affiliation with the Fund’s business manager, Washington Management Corporation.
Offices of the Fund and of the
business manager
Washington Management Corporation
1101 Vermont Avenue, NW
Washington, DC 20005-3521
202/842-5665
Investment adviser
Capital Research and
Management Company
333 South Hope Street
Los Angeles, CA 90071-1406
6455 Irvine Center Drive
Irvine, CA 92618
Transfer agent
American Funds Service Company
(Please write to the address
near you.)
P.O. Box 6007
Indianapolis, IN 46206-6007
P.O. Box 2280
Norfolk, VA 23501-2280
Custodian of assets
JPMorgan Chase Bank
270 Park Avenue
New York, NY 10017-2070
Counsel
Dechert LLP
1775 I Street, NW
Washington, DC 20006-2402
Independent registered public
accounting firm
PricewaterhouseCoopers LLP
350 South Grand Avenue
Los Angeles, CA 90071-2889
Principal underwriter
American Funds Distributors, Inc.
333 South Hope Street
Los Angeles, CA 90071-1406
| Investors should carefully consider the investment objectives, risks, charges and expenses of the American Funds. This and other important information is contained in the Fund’s summary prospectus, which can be obtained from your financial professional and should be read carefully before investing. You may also call American Funds Service Company (AFS) at 800/421-0180 or visit the American Funds website at americanfunds.com. |
"American Funds Proxy Voting Procedures and Principles" — which describes how we vote proxies relating to portfolio securities — is available on the American Funds website or upon request by calling AFS. The Fund files its proxy voting record with the U.S. Securities and Exchange Commission (SEC) for the 12 months ended June 30 by August 31. The proxy voting record is available free of charge on the SEC website at sec.gov and on the American Funds website.
Washington Mutual Investors Fund files a complete list of its portfolio holdings with the SEC for the first and third quarters of each fiscal year on Form N-Q. This filing is available free of charge on the SEC website. You may also review or, for a fee, copy this filing at the SEC’s Public Reference Room in Washington, DC. Additional information regarding the operation of the Public Reference Room may be obtained by calling the SEC’s Office of Investor Education and Advocacy at 800/SEC-0330. Additionally, the list of portfolio holdings is available on the American Funds website or by calling AFS.
This report is for the information of shareholders of Washington Mutual Investors Fund, but it may also be used as sales literature when preceded or accompanied by the current summary prospectus, which gives details about charges, expenses, investment objectives and operating policies of the Fund. If used as sales material after June 30, 2009, this report must be accompanied by an American Funds statistical update for the most recently completed calendar quarter.
The Capital Group Companies
American FundsCapital Research and ManagementCapital InternationalCapital GuardianCapital Bank and TrustLit.
No. MFGEAR-901-0609P (S16788)
Printed on paper containing 10% post-consumer waste Printed with inks containing soy and/or vegetable oil
Washington Mutual Investors Fund, Inc.
1101 Vermont Avenue, NW
Washington, DC 20005
202/842-5665