UNITED STATES
SECURITIES AND EXCHANGE COMMISSION
Washington, D. C. 20549
FORM N-CSR
CERTIFIED SHAREHOLDER REPORT OF REGISTERED
MANAGEMENT INVESTMENT COMPANIES
Investment Company Act File Number: 811-08495
NATIONWIDE MUTUAL FUNDS
(Exact name of registrant as specified in charter)
1000 CONTINENTAL DRIVE, SUITE 400, KING OF PRUSSIA, PENNSYLVANIA 19406-2850
(Address of principal executive offices) (Zip code)
Eric E. Miller, Esq.
1000 Continental Drive
Suite 400
King of Prussia, Pennsylvania 19406-2850
(Name and address of agent for service)
Registrant’s telephone number, including area code: (610) 230-2839
Date of fiscal year end: July 31, 2014
Date of reporting period: August 1, 2013 through January 31, 2014
Form N-CSR is to be used by management investment companies to file reports with the Commission not later than ten (10) days after the transmission to stockholders of any report that is required to be transmitted to stockholders under Rule 30e-1 under the Investment Company Act of 1940 (17 CFR § 270.30e-1). The Commission may use the information provided on Form N-CSR in the Commission’s regulatory, disclosure review, inspection, and policymaking roles.
A registrant is required to disclose the information specified by Form N-CSR, and the Commission will make this information public. A registrant is not required to respond to the collection of information contained in Form N-CSR unless the Form displays a currently valid Office of Management and Budget (“OMB”) control number. Please direct comments concerning the accuracy of the information collection burden estimate and any suggestions for reducing the burden to Secretary, Securities and Exchange Commission, 450 Fifth Street, NW, Washington, D. C. 20549-0609. The OMB has reviewed this collection of information under the clearance requirements of 44 U.S.C. § 3507.
Item 1. Reports to Stockholders.
Include a copy of the report transmitted to stockholders pursuant to Rule 30e-1 under the Act (17 CFR § 270.30e-1).

Semiannual Report
January 31, 2014
Nationwide Mutual Funds
Equity Funds
Nationwide Bailard Cognitive Value Fund
Nationwide Bailard International Equities Fund
Nationwide Bailard Technology & Science Fund
Nationwide Geneva Mid Cap Growth Fund
Nationwide Geneva Small Cap Growth Fund
Nationwide HighMark Balanced Fund
Nationwide HighMark Large Cap Core Equity Fund
Nationwide HighMark Large Cap Growth Fund
Nationwide HighMark Small Cap Core Fund
Nationwide HighMark Value Fund
Nationwide Ziegler Equity Income Fund
Nationwide Ziegler NYSE Arca Tech 100 Index Fund

| Nationwide Funds® |
Commentary in this report is provided by the portfolio manager(s) of each Fund as of the date of this report and is subject to change at any time based on market or other conditions.
Third-party information has been obtained from sources that Nationwide Fund Advisors (NFA), the investment adviser to the Funds, deems reliable. This report and the holdings provided are for informational purposes only and are not intended to be relied on as investment advice. Portfolio composition is accurate as of the date of this report and is subject to change at any time and without notice. NFA, one of its affiliated advisers or its employees may hold a position in the securities in this report.
Statement Regarding Availability of Quarterly Portfolio Holdings.
The Trust files complete schedules of portfolio holdings for each Fund with the Securities and Exchange Commission (SEC) for the first and third quarters of each fiscal year on Form N-Q. Additionally, the Trust files a schedule of portfolio holdings monthly for the Nationwide Money Market Fund on Form N-MFP. Forms N-Q and Forms N-MFP are available on the SEC’s website at http://www.sec.gov. Forms N-Q and Forms N-MFP may be reviewed and copied at the SEC’s Public Reference Room in Washington, DC, and information on the operation of the Public Reference Room may be obtained by calling 800-SEC-0330. The Trust also makes this information available to shareholders on nationwide.com/mutualfunds or upon request without charge.
Statement Regarding Availability of Proxy Voting Record.
Information regarding how the Funds voted proxies relating to portfolio securities held during the most recent 12-month period ended June 30 is available without charge, upon request, by calling 800-848-0920, and on the SEC’s website at http://www.sec.gov.
| Nationwide Funds® Semiannual Report |
Nationwide Funds®
January 31, 2014
Dear Shareholder,
I am pleased to write this message to you for the mutual fund reports covering the six-month period ended January 31, 2014. Perhaps you recently became a Nationwide Funds shareholder through our 2013 acquisition of 17 HighMark Funds. Or maybe you have been a Nationwide Funds shareholder for a long time and are now invested in one of our newer solutions. Either way, we sincerely value your business. You can be assured that we are dedicated to your success and look forward to providing you and your advisor with timely information and service.
This is an exciting time to be a Nationwide Funds shareholder. The HighMark acquisition expanded the breadth of our fund lineup by adding exposure to eight new asset classes, giving us the ability to offer our shareholders more diverse investment options.
As a Nationwide Funds shareholder you understand that planning and preparation are essential steps to reaching future goals. When I think about smart planning I think about Abraham Lincoln, who said “Give me six hours to chop down a tree and I will spend the first four sharpening the ax.” By working with your advisor and taking a considered, disciplined, long-term approach to investing, you are taking the time to sharpen your ax. Doing so can enable you to be well positioned, even during periods of market volatility and economic downturns.
After several years of tepid economic recovery, many investors are casting a wary eye toward the future. While we have seen progress across economic indicators quarter to quarter, we understand that for many Americans it still does not feel like things are getting better. Domestically, economic progress has been evident as the unemployment rate, gross domestic product (GDP) and the housing market showed modest indications of improvement throughout the six months of the reporting period. Broad U.S. stock market performance increased for the reporting period, with gains for the S&P 500® Index at 6.85%. Still, many investors’ portfolio returns were tempered during the reporting period by low-yielding fixed-income investments, as evidenced by the Barclays U.S. Aggregate Bond Index, which returned 1.78%. More market mending is still needed.
Yet, with preparation, poise and a patient forward-looking perspective, you may confidently pursue your goals no matter what the current economic or market climate. Nationwide has the wisdom and perspective that come from a long history of caring for our customers. For more than 80 years, we have nurtured our customers’ assets through all phases of market cycles. We are honored to now work with you.
Thank you for investing with Nationwide Funds.
Sincerely,

Michael S. Spangler
President & CEO
Nationwide Funds
1
| Economic Review |
During the six-month reporting period ended January 31, 2014, the level of investment return in the markets varied greatly by asset class. U.S. equities experienced a broad-based rally, with the S&P 500® Index delivering a 6.85% return, and nearly all sectors and capitalization ranges showing strong performance for the reporting period. International equities results were mixed, with positive developed market performance offset by negative returns in emerging markets. Fixed-income returns were positive, primarily in the long-term and credit-sensitive segments.
In the United States, investment performance during the reporting period was affected by news from Washington and reports of uncertainty regarding emerging market economies. Equity market returns and bond yields reacted to actions by the Federal Reserve Board to decrease (taper) the asset purchase program, also known as Quantitative Easing (QE).
The S&P 500 Index registered negative performance in the first and last months of the reporting period (August 2013 and January 2014), but delivered strong performance from September through December 2013.
The best-performing sectors for the S&P 500 Index during the reporting period were technology, up 13.2%; industrials, up 11.7%; and health care, up 10.7%. Technology and industrials benefited from a strong earnings environment, while health care rallied in reaction to excitement surrounding new products. The weakest sectors during the reporting period were telecommunications, with -2.6%; consumer staples, with -0.2%; and utilities, with 1.1%. These three sectors were affected by investors’ move away from dividend-focused sectors as rates rose and cyclical exposure was preferred.
The strong performance in U.S. equities was broad based during the reporting period, with small-capitalization stocks outperforming large-cap stocks, and growth outperforming value.
U.S. economic activity was strong during the reporting period; third-quarter 2013 gross domestic product (GDP) growth of 4.1% was the second-highest quarterly result since March 2006. GDP growth decelerated to 3.2% in the fourth quarter of 2013 but remained above average in relation to other post-recession quarters. Inflation remained well controlled throughout the reporting period, with the U.S. Consumer Price Index (CPI) and the core CPI (excluding the volatile food and energy categories) remaining below 2%. Despite job-creation levels coming in lower than during many past recoveries, the unemployment rate continued to decline during the reporting period, falling from 7.2% to 6.6%.
Throughout the reporting period, the performance of international stocks continued to be positive, but weaker relative to U.S. stocks. Europe was reminded of the fragile state of the banking systems of its weaker members, this time with Cyprus. Continued political tensions in Greece, sluggish European economic growth and worries about a U.S. tapering depressed relative returns through mid-2013 before the market rallied in response to the stabilization of political and banking system risk. Returns in Asia were mixed, with relative strength exhibited in Japan due to the prospect of renewed stimulus by Japan’s central bank and a beneficial exchange rate offset by weakness in the developing economies. Emerging market stocks were weak on concerns about slowing economic growth in China, political tensions in Brazil, Turkey, North Korea and the Middle East, and steadily declining commodity prices.
2
| Economic Review (con’t.) |
Performance in the fixed-income markets was driven by stabilization in interest rates during the reporting period. Long-term Treasury yields rose from 1.63% to 2.71% in the three months prior to the reporting period (May 1 through August 1), but showed little volatility during the reporting period, ending at 2.65%. Fixed-income returns were positive, as investors absorbed the news that the Fed will begin to taper the QE program. Long-term and credit-sensitive bonds delivered the strongest performance during the reporting period.
| Index | Six-Month Total Return (as of 1/31/14) | |||
| Barclays Emerging Markets USD Aggregate Bond | 1.16% | |||
| Barclays Municipal Bond | 2.99% | |||
| Barclays U.S. 1-3 Year Government/Credit Bond | 0.55% | |||
| Barclays U.S. 10-20 Year Treasury Bond | 1.69% | |||
| Barclays U.S. Aggregate Bond | 1.78% | |||
| Barclays U.S. Corporate High Yield | 4.70% | |||
| MSCI Emerging Markets® | -0.33% | |||
| MSCI World ex USA | 6.44% | |||
| Russell 1000® Growth | 10.15% | |||
| Russell 1000® Value | 4.63% | |||
| Russell 2000® | 8.88% | |||
| S&P 500® | 6.85% | |||
3
| Fund Commentary | Nationwide Bailard Cognitive Value Fund |
For the semiannual period ended January 31, 2014, the Nationwide Bailard Cognitive Value Fund (Class M at NAV) returned 3.69%* versus 9.44% for its benchmark, the S&P SmallCap 600 Value Index. For broader comparison, the median return for the Fund’s closest Lipper peer category of Small-Cap Value Funds (consisting of 319 funds as of January 31, 2014) was 6.86% for the same time period.
*Performance prior to the Fund’s inception on September 16, 2013, is based on the performance of the Fund’s predecessor fund.
The subadvisor utilizes a proprietary multifactor model, the Behavioral Ranking Model (BRM), to aid in portfolio construction. There are two primary determinants of the Fund’s relative performance. One is how the subadviser’s BRM performs relative to the benchmark, and the other is how successfully the BRM’s signals are translated into Fund performance.
For the reporting period, the BRM outperformed the Fund’s benchmark index. However, the positive model performance did not translate in actual Fund performance. The underperformance of the Fund versus the model and the benchmark was the result of delayed implementation of model changes into the actual Fund. Once implemented, changes to the Fund had a positive impact on relative performance, but were insufficient to offset the underperformance from the early part of the reporting period.
The Fund’s strategy seeks to minimize relative sector and subsector weights versus the benchmark, as we believe that stock selection holds greater potential for excess return. As a result, the Fund’s tracking error tends to max out at about 4.5%, below the typical small-cap value managers’ 6.5% tracking error. When sector weights do diverge from the benchmark, it is a result of stock selection and the abundance or scarcity of high BRM scores in the sector rather than an active portfolio decision.
For the reporting period, overweights in the industrials sector and underweights in the energy sector were the largest contributors to Fund performance versus the benchmark index. Kimball
International and Universal Insurance were the largest individual stock performance contributors for the Fund during the reporting period. In Kimball’s case this was due to positive earnings surprises, and in Universal’s case due to a lack of hurricane activity.
For the reporting period, an overweight in telecommunication services and an underweight in health care were the largest detractors from Fund performance versus the benchmark index, though in health care’s case the detraction was minimal. Renewable Energy Group and Gain Capital were the largest detractors from Fund performance involving individual stocks during the reporting period. In Renewable’s case this was due to unfavorable legislation. In Gain’s case this was due to earnings dilution.
Subadviser:
Bailard, Inc.
Portfolio Manager:
Thomas J. Mudge III
The Fund is subject to the risks of investing in equity securities and risks associated with investing in stocks of smaller companies. Value funds may underperform other funds that use different investing styles. The Fund may invest in more-aggressive investments such as derivatives (many of which create investment leverage and are highly volatile), exchange-traded funds (ETFs) (shareholders will bear additional costs) and foreign securities (which are volatile, harder to price and less liquid than U.S. securities). Please refer to the summary prospectus for a more detailed explanation of the Fund’s principal risks.
A description of the benchmarks can be found on the Market Index Definitions page at the back of this book.
4
| Fund Overview (Unaudited) | Nationwide Bailard Cognitive Value Fund |
Objective
The Fund seeks long-term capital appreciation.
Highlights
| Ÿ | For the six-month period ended January 31, 2014, the Fund (Class M at NAV) returned 3.69%, underperforming the benchmark by 5.75% and the Lipper peer category by 3.17%. |
| Ÿ | Overweights in the industrials sector and underweights in the energy sector were the largest contributors to Fund performance versus the benchmark index during the reporting period. |
| Ÿ | An overweight in telecommunication services and an underweight in health care were the largest detractors from Fund performance versus the benchmark index during the reporting period. |
Asset Allocation†
| Common Stocks | 95.1% | |||
| Exchange Traded Funds | 3.8% | |||
| Mutual Fund | 1.0% | |||
| Other assets in excess of liabilities | 0.1% | |||
| 100.0% |
Top Industries††
| Commercial Banks | 9.0% | |||
| Insurance | 7.1% | |||
| Aerospace & Defense | 4.7% | |||
| Real Estate Investment Trusts (REITs) | 4.6% | |||
| Electrical Equipment | 4.6% | |||
| Commercial Services & Supplies | 4.2% | |||
| Oil, Gas & Consumable Fuels | 3.8% | |||
| Electronic Equipment, Instruments & Components | 3.6% | |||
| Health Care Providers & Services | 3.5% | |||
| Semiconductors & Semiconductor Equipment | 3.0% | |||
| Other Industries | 51.9% | |||
| 100.0% |
Top Holdings††
| Kimball International, Inc., Class B | 3.2% | |||
| EnerSys, Inc. | 3.0% | |||
| Carriage Services, Inc. | 2.9% | |||
| Schweitzer-Mauduit International, Inc. | 2.8% | |||
| Exelis, Inc. | 2.7% | |||
| Insteel Industries, Inc. | 2.7% | |||
| Electronics For Imaging, Inc. | 2.7% | |||
| Blucora, Inc. | 2.4% | |||
| FutureFuel Corp. | 2.3% | |||
| Hanover Insurance Group, Inc. (The) | 2.1% | |||
| Other Holdings | 73.2% | |||
| 100.0% |
| † | Percentages indicated are based upon net assets as of January 31, 2014. |
| †† | Percentages indicated are based upon total investments as of January 31, 2014. |
5
| Fund Performance | Nationwide Bailard Cognitive Value Fund |
Average Annual Total Return
(For periods ended January 31, 2014)
| Six Months* | 1 Yr. | 5 Yr. | 10 Yr. | |||||||||||||||
| Class A | w/o SC1 | 3.52% | 17.13% | 19.51% | 7.33% | |||||||||||||
| w/SC2 | -2.17% | 10.69% | 18.17% | 6.73% | ||||||||||||||
| Class C | w/o SC1 | 3.20% | 16.40% | 18.80% | 6.69% | |||||||||||||
| w/SC3 | 2.20% | 15.40% | 18.80% | 6.69% | ||||||||||||||
| Class M4 | w/o SC | 3.69% | 17.53% | 19.99% | 7.77% | |||||||||||||
| Institutional Service Class4,5 | w/o SC | 3.61% | 17.43% | 19.89% | 7.67% | |||||||||||||
| Institutional Class4 | w/o SC | 3.55% | 6 | — | — | — | ||||||||||||
All figures showing the effect of a sales charge (SC) reflect the maximum charge possible, because it has the most significant effect on performance data.
| * | Not annualized. |
| 1 | These returns do not reflect the effects of SCs. |
| 2 | For the period from September 16, 2013 through January 31, 2014 a front-end sales charge of 5.75% was deducted. Prior to September 16, 2013, a front-end sales charge of 5.50% was deducted. |
| 3 | A 1.00% CDSC was deducted from the one year return because it is charged when you sell Class C shares within the first year after purchase. |
| 4 | Not subject to any SCs. |
| 5 | Effective September 16, 2013 Fiduciary Shares were renamed Institutional Service Class Shares. |
| 6 | Since inception date of September 18, 2013. Not Annualized. |
Expense Ratios
| Gross Expense Ratio* | Net Expense Ratio* | |||||
| Class A | 1.54% | 1.48% | ||||
| Class C | 2.04% | 2.04% | ||||
| Class M | 1.04% | 1.04% | ||||
| Institutional Service Class | 1.29% | 1.23% | ||||
| Institutional Class | 1.04% | 1.04% | ||||
| * | Current effective prospectus dated September 16, 2013. The difference between gross and net operating expenses reflects contractual waivers in place through November 30, 2015. Please see the Fund’s most recent prospectus for details. |
6
| Fund Performance | Nationwide Bailard Cognitive Value Fund |
Performance of a $10,000 Investment
Investment return and principal value will fluctuate, and when redeemed, shares may be worth more or less than original cost. Past performance is no guarantee of future results and does not reflect the deduction of taxes that a shareholder would pay on fund distributions or the redemption of fund shares. Investing in mutual funds involves market risk, including loss of principal. Performance returns assume the reinvestment of all distributions.
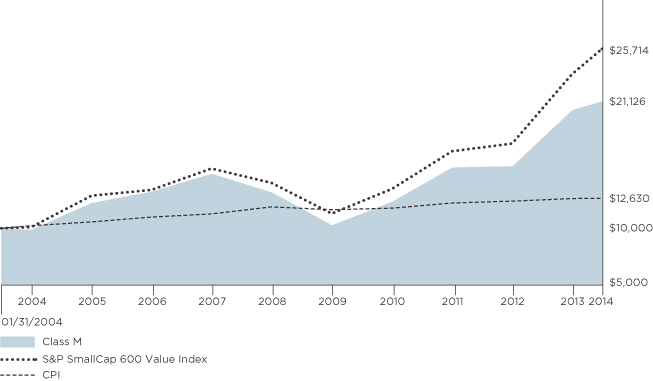
Comparative performance of $10,000 invested in Class M shares of the Nationwide Bailard Cognitive Value Fund versus the S&P SmallCap 600 Value Index and the Consumer Price Index (CPI) over the 10-year period ended 1/31/14. Unlike the Fund, the performance for these unmanaged indexes does not reflect any fees, expenses, or sales charges. One cannot invest directly in a market index. A description of the benchmarks can be found on the Market Index Definitions page at the back of this book.
7
| Shareholder Expense Example | Nationwide Bailard Cognitive Value Fund |
As a shareholder of the Fund, you incur two types of costs: (1) transaction costs, including sales charges (loads) paid on purchase payments and redemption fees; and (2) ongoing costs, including investment advisory fees, administration fees, distribution fees and other Fund expenses. The examples below are intended to help you understand your ongoing costs (in dollars) of investing in the Fund and to compare these costs with the ongoing costs of investing in other mutual funds. Per Securities and Exchange Commission (“SEC”) requirements, the examples assume that you had a $1,000 investment in the Class at the beginning of the reporting period (August 1, 2013) and continued to hold your shares at the end of the reporting period (January 31, 2014).
Actual Expenses
For each Class of the Fund in the table below, the first line provides information about actual account values and actual expenses. You may use the information in this line, together with the amount you invested, to estimate the expenses that you paid from August 1, 2013 through January 31, 2014. Simply divide your account value by $1,000 (for example, an $8,600 account value divided by $1,000 = 8.6), then multiply the result by the number in the first line of each Class under the heading entitled “Expenses Paid During Period” to estimate the expenses you paid on your account during this period.
Hypothetical Expenses for Comparison Purposes
The second line of each Class in the table below provides information about hypothetical account values and hypothetical expenses based on the Class’ actual expense ratio and an assumed rate of return of 5% per year before expenses, which is not the Class’ actual return. The hypothetical account values and expenses may not be used to estimate the actual ending account balance or expenses you paid for the period from August 1, 2013 through January 31, 2014. You may use this information to compare the ongoing costs of investing in the Class of the Fund and other funds. To do so, compare this 5% hypothetical example with the 5% hypothetical examples that appear in the shareholder reports of the other funds.
Please note that the expenses shown in the table are meant to highlight your ongoing costs only and do not reflect any transaction costs, such as sales charges (loads) or redemption fees. If these transaction costs were included, your costs would have been higher. Therefore, the second line for each Class in the table is useful in comparing ongoing costs only, and will not help you determine the relative total costs of owning different funds. The examples also assume all dividends and distributions are reinvested.
Schedule of Shareholder Expenses
Expense Analysis of a $1,000 Investment
Nationwide Bailard Cognitive January 31, 2014 | Beginning Account Value ($) 08/01/13 | Ending Account Value ($) 01/31/14 | Expenses Paid During Period ($) 08/01/13 - 01/31/14 | Expense Ratio During Period (%) 08/01/13 - 01/31/14 | ||||||||
| Class A Shares | Actual | a | 1,000.00 | 1,035.20 | 7.44 | 1.45 | ||||||
| Hypothetical | a,b | 1,000.00 | 1,017.90 | 7.38 | 1.45 | |||||||
| Class C Shares | Actual | a | 1,000.00 | 1,032.00 | 10.14 | 1.98 | ||||||
| Hypothetical | a,b | 1,000.00 | 1,015.22 | 10.06 | 1.98 | |||||||
| Class M Shares | Actual | a | 1,000.00 | 1,036.90 | 5.19 | 1.01 | ||||||
| Hypothetical | a,b | 1,000.00 | 1,020.11 | 5.14 | 1.01 | |||||||
| Institutional Service Class Sharesc | Actual | a | 1,000.00 | 1,036.10 | 6.16 | 1.20 | ||||||
| Hypothetical | a,b | 1,000.00 | 1,019.16 | 6.11 | 1.20 | |||||||
| Institutional Class Shares | Actual | d | 1,000.00 | 1,035.50 | 3.73 | 0.99 | ||||||
| Hypothetical | a,b | 1,000.00 | 1,020.21 | 5.04 | 0.99 | |||||||
| a | Expenses are equal to the Fund’s annualized expense ratio multiplied by the average account value from August 1, 2013 through January 31, 2014 multiplied to reflect one-half year period. The expense ratio presented represents a six-month, annualized ratio in accordance with Securities and Exchange Commission guidelines. |
| b | Represents the hypothetical 5% return before expenses. |
| c | Effective September 16, 2013, Fiduciary Shares were renamed Institutional Service Class Shares. |
| d | Actual expenses are equal to the Fund’s annualized expense ratio multiplied by the average account value from September 19, 2013 through January 31, 2014 to reflect the period from commencement of operations. |
8
Statement of Investments
January 31, 2014 (Unaudited)
Nationwide Bailard Cognitive Value Fund
| Common Stocks 95.1% | ||||||||||
| Shares | Market Value | |||||||||
| ||||||||||
Aerospace & Defense 4.7% | ||||||||||
Alliant Techsystems, Inc. | 4,000 | $ | 574,800 | |||||||
Engility Holdings, Inc.* | 39,800 | 1,524,738 | ||||||||
Exelis, Inc. | 146,000 | 2,860,140 | ||||||||
|
| |||||||||
| 4,959,678 | ||||||||||
|
| |||||||||
| ||||||||||
Automobiles 0.3% |
| |||||||||
Thor Industries, Inc. | 6,200 | 318,494 | ||||||||
|
| |||||||||
| ||||||||||
Building Products 2.7% |
| |||||||||
Insteel Industries, Inc. | 152,500 | 2,841,075 | ||||||||
|
| |||||||||
| ||||||||||
Capital Markets 1.2% |
| |||||||||
FBR & Co.* | 54,200 | 1,314,892 | ||||||||
|
| |||||||||
| ||||||||||
Chemicals 2.6% |
| |||||||||
Chase Corp. | 9,000 | 284,580 | ||||||||
FutureFuel Corp. | 150,400 | 2,460,544 | ||||||||
|
| |||||||||
| 2,745,124 | ||||||||||
|
| |||||||||
| ||||||||||
Commercial Banks 9.0% |
| |||||||||
1st Source Corp. | 11,900 | 350,693 | ||||||||
American National Bankshares, Inc. | 11,469 | 266,654 | ||||||||
Center Bancorp, Inc. | 8,201 | 145,568 | ||||||||
Central Pacific Financial Corp. | 65,400 | 1,200,090 | ||||||||
Financial Institutions, Inc. | 5,007 | 104,546 | ||||||||
First Interstate BancSystem, Inc. | 79,321 | 2,035,377 | ||||||||
German American Bancorp, Inc. | 16,400 | 442,144 | ||||||||
Independent Bank Corp.* | 123,500 | 1,636,375 | ||||||||
MainSource Financial Group, Inc. | 70,613 | 1,151,698 | ||||||||
Metro Bancorp, Inc.* | 35,200 | 699,424 | ||||||||
MidWestOne Financial Group, Inc. | 9,100 | 223,678 | ||||||||
Northrim BanCorp, Inc. | 50,375 | 1,210,008 | ||||||||
|
| |||||||||
| 9,466,255 | ||||||||||
|
| |||||||||
| ||||||||||
Commercial Services & Supplies 4.2% |
| |||||||||
Courier Corp. | 41,865 | 661,048 | ||||||||
Kimball International, Inc., Class B | 225,218 | 3,348,992 | ||||||||
UniFirst Corp. | 3,900 | 412,620 | ||||||||
|
| |||||||||
| 4,422,660 | ||||||||||
|
| |||||||||
| ||||||||||
Computers & Peripherals 2.7% | ||||||||||
Electronics For Imaging, Inc.* | 66,300 | 2,809,131 | ||||||||
|
| |||||||||
| ||||||||||
Construction & Engineering 1.7% |
| |||||||||
Comfort Systems USA, Inc. | 37,400 | 637,296 | ||||||||
Furmanite Corp.* | 102,300 | 1,194,864 | ||||||||
|
| |||||||||
| 1,832,160 | ||||||||||
|
| |||||||||
| ||||||||||
Consumer Finance 2.9% | ||||||||||
Nelnet, Inc., Class A | 25,000 | 931,250 | ||||||||
Nicholas Financial, Inc. | 64,650 | 1,020,177 | ||||||||
World Acceptance Corp.* | 11,600 | 1,110,004 | ||||||||
|
| |||||||||
| 3,061,431 | ||||||||||
|
| |||||||||
| Common Stocks (continued) | ||||||||||
| Shares | Market Value | |||||||||
| ||||||||||
Containers & Packaging 1.6% | ||||||||||
Myers Industries, Inc. | 90,400 | $ | 1,731,160 | |||||||
|
| |||||||||
| ||||||||||
Distributors 0.6% |
| |||||||||
Weyco Group, Inc. | 23,600 | 623,512 | ||||||||
|
| |||||||||
| ||||||||||
Diversified Consumer Services 2.9% |
| |||||||||
Carriage Services, Inc. | 140,717 | 3,011,344 | ||||||||
|
| |||||||||
| ||||||||||
Electric Utilities 2.3% |
| |||||||||
Great Plains Energy, Inc. | 22,500 | 555,300 | ||||||||
PNM Resources, Inc. | 45,500 | 1,121,575 | ||||||||
Portland General Electric Co. | 23,200 | 700,176 | ||||||||
|
| |||||||||
| 2,377,051 | ||||||||||
|
| |||||||||
| ||||||||||
Electrical Equipment 4.6% |
| |||||||||
EnerSys, Inc. | 46,400 | 3,157,984 | ||||||||
Espey Manufacturing & Electronics Corp. | 8,300 | 259,375 | ||||||||
Lihua International, Inc.* | 38,400 | 209,664 | ||||||||
Powell Industries, Inc. | 7,100 | 436,011 | ||||||||
SL Industries, Inc.* | 29,203 | 759,862 | ||||||||
|
| |||||||||
| 4,822,896 | ||||||||||
|
| |||||||||
| ||||||||||
Electronic Equipment, Instruments & Components 3.6% |
| |||||||||
Benchmark Electronics, Inc.* | 24,800 | 563,704 | ||||||||
Hollysys Automation Technologies Ltd.* | 60,911 | 1,027,569 | ||||||||
PC Connection, Inc. | 63,157 | 1,292,192 | ||||||||
Sanmina Corp.* | 32,322 | 540,424 | ||||||||
Vishay Intertechnology, Inc.* | 30,300 | 411,474 | ||||||||
|
| |||||||||
| 3,835,363 | ||||||||||
|
| |||||||||
| ||||||||||
Energy Equipment & Services 2.0% |
| |||||||||
Matrix Service Co.* | 80,100 | 2,105,028 | ||||||||
|
| |||||||||
| ||||||||||
Food & Staples Retailing 0.8% |
| |||||||||
Andersons, Inc. (The) | 9,700 | 802,578 | ||||||||
|
| |||||||||
| ||||||||||
Food Products 0.6% |
| |||||||||
John B. Sanfilippo & Son, Inc. | 4,777 | 110,588 | ||||||||
Sanderson Farms, Inc. | 7,600 | 565,060 | ||||||||
|
| |||||||||
| 675,648 | ||||||||||
|
| |||||||||
| ||||||||||
Gas Utilities 0.5% |
| |||||||||
Gas Natural, Inc. | 52,700 | 483,259 | ||||||||
|
| |||||||||
| ||||||||||
Health Care Equipment & Supplies 0.4% |
| |||||||||
Kewaunee Scientific Corp. | 9,725 | 161,435 | ||||||||
Span-America Medical Systems, Inc. | 11,000 | 218,240 | ||||||||
|
| |||||||||
| 379,675 | ||||||||||
|
| |||||||||
| ||||||||||
Health Care Providers & Services 3.5% |
| |||||||||
Addus HomeCare Corp.* | 76,000 | 1,796,640 | ||||||||
PharMerica Corp.* | 7,100 | 172,814 | ||||||||
Triple-S Management Corp., Class B* | 93,734 | 1,672,215 | ||||||||
|
| |||||||||
| 3,641,669 | ||||||||||
|
| |||||||||
9
Statement of Investments (Continued)
January 31, 2014 (Unaudited)
Nationwide Bailard Cognitive Value Fund (Continued)
| Common Stocks (continued) | ||||||||||
| Shares | Market Value | |||||||||
| ||||||||||
Hotels, Restaurants & Leisure 0.3% | ||||||||||
Rick’s Cabaret International, Inc.* | 28,800 | $ | 325,152 | |||||||
|
| |||||||||
| ||||||||||
Household Durables 0.5% |
| |||||||||
La-Z-Boy, Inc. | 18,900 | 508,788 | ||||||||
|
| |||||||||
| ||||||||||
Household Products 0.9% |
| |||||||||
Oil-Dri Corp. of America | 27,800 | 954,930 | ||||||||
|
| |||||||||
| ||||||||||
Information Technology Services 0.2% |
| |||||||||
Global Cash Access Holdings, Inc.* | 29,100 | 246,768 | ||||||||
NCI, Inc., Class A* | 200 | 1,330 | ||||||||
|
| |||||||||
| 248,098 | ||||||||||
|
| |||||||||
| ||||||||||
Insurance 7.1% |
| |||||||||
Allied World Assurance Co. Holdings AG | 5,900 | 607,228 | ||||||||
Aspen Insurance Holdings Ltd. | 23,550 | 916,095 | ||||||||
FBL Financial Group, Inc., Class A | 10,600 | 409,478 | ||||||||
Hanover Insurance Group, Inc. (The) | 39,038 | 2,167,780 | ||||||||
HCI Group, Inc. | 21,238 | 903,252 | ||||||||
Safety Insurance Group, Inc. | 6,907 | 373,531 | ||||||||
United Insurance Holdings Corp. | 33,800 | 444,808 | ||||||||
Universal Insurance Holdings, Inc. | 145,430 | 1,621,544 | ||||||||
|
| |||||||||
| 7,443,716 | ||||||||||
|
| |||||||||
| ||||||||||
Internet Software & Services 2.5% |
| |||||||||
Blucora, Inc.* | 97,400 | 2,494,414 | ||||||||
XO Group, Inc.* | 15,500 | 188,015 | ||||||||
|
| |||||||||
| 2,682,429 | ||||||||||
|
| |||||||||
| ||||||||||
Life Sciences Tools & Services 0.5% |
| |||||||||
Nordion, Inc.* | 56,400 | 539,184 | ||||||||
|
| |||||||||
| ||||||||||
Machinery 1.6% |
| |||||||||
CIRCOR International, Inc. | 10,800 | 777,816 | ||||||||
Greenbrier Cos., Inc. (The)* | 10,400 | 381,576 | ||||||||
NN, Inc. | 28,100 | 497,089 | ||||||||
|
| |||||||||
| 1,656,481 | ||||||||||
|
| |||||||||
| ||||||||||
Marine 1.5% |
| |||||||||
Safe Bulkers, Inc. | 163,751 | 1,603,122 | ||||||||
|
| |||||||||
| ||||||||||
Media 0.1% |
| |||||||||
Insignia Systems, Inc.* | 31,220 | 85,543 | ||||||||
|
| |||||||||
| ||||||||||
Multi-Utilities 0.6% |
| |||||||||
Avista Corp. | 21,500 | 619,845 | ||||||||
|
| |||||||||
| ||||||||||
Oil, Gas & Consumable Fuels 3.8% |
| |||||||||
Adams Resources & Energy, Inc. | 7,500 | 498,900 | ||||||||
Delek US Holdings, Inc. | 28,100 | 851,430 | ||||||||
Gran Tierra Energy, Inc.* | 125,598 | 948,265 | ||||||||
TransGlobe Energy Corp.* | 237,684 | �� | 1,730,339 | |||||||
|
| |||||||||
| 4,028,934 | ||||||||||
|
| |||||||||
| Common Stocks (continued) | ||||||||||
| Shares | Market Value | |||||||||
| ||||||||||
Paper & Forest Products 2.8% |
| |||||||||
Schweitzer-Mauduit International, Inc. | 63,796 | $ | 2,942,909 | |||||||
|
| |||||||||
| ||||||||||
Professional Services 1.0% |
| |||||||||
VSE Corp. | 24,129 | 1,064,330 | ||||||||
|
| |||||||||
| ||||||||||
Real Estate Investment Trusts (REITs) 4.6% |
| |||||||||
DuPont Fabros Technology, Inc. | 28,600 | 743,314 | ||||||||
Franklin Street Properties Corp. | 64,400 | 772,156 | ||||||||
Medical Properties Trust, Inc. | 22,700 | 301,229 | ||||||||
One Liberty Properties, Inc. | 46,000 | 959,560 | ||||||||
Pennsylvania Real Estate Investment Trust | 15,100 | 281,615 | ||||||||
Post Properties, Inc. | 16,400 | 769,652 | ||||||||
Urstadt Biddle Properties, Inc., Class A | 7,095 | 133,102 | ||||||||
Winthrop Realty Trust | 81,103 | 931,063 | ||||||||
|
| |||||||||
| 4,891,691 | ||||||||||
|
| |||||||||
| ||||||||||
Semiconductors & Semiconductor Equipment 3.0% |
| |||||||||
Cascade Microtech, Inc.* | 90,182 | 928,874 | ||||||||
Silicon Motion Technology Corp., ADR-TW | 6,100 | 102,663 | ||||||||
Supertex, Inc.* | 78,088 | 2,084,950 | ||||||||
|
| |||||||||
| 3,116,487 | ||||||||||
|
| |||||||||
|
|
|
|
| ||||||
Software 2.0% |
| |||||||||
Perfect World Co., Ltd., ADR-CN | 109,000 | 2,109,150 | ||||||||
|
| |||||||||
| ||||||||||
Specialty Retail 1.4% |
| |||||||||
Haverty Furniture Cos., Inc. | 15,939 | 443,423 | ||||||||
Kirkland’s, Inc.* | 11,100 | 209,013 | ||||||||
Trans World Entertainment Corp.* | 222,049 | 879,314 | ||||||||
|
| |||||||||
| 1,531,750 | ||||||||||
|
| |||||||||
| ||||||||||
Textiles, Apparel & Luxury Goods 1.0% |
| |||||||||
Crown Crafts, Inc. | 130,166 | 1,041,328 | ||||||||
|
| |||||||||
| ||||||||||
Thrifts & Mortgage Finance 1.8% |
| |||||||||
First Defiance Financial Corp. | 34,100 | 877,052 | ||||||||
WSFS Financial Corp. | 14,040 | 1,008,072 | ||||||||
|
| |||||||||
| 1,885,124 | ||||||||||
|
| |||||||||
| ||||||||||
Trading Companies & Distributors 1.2% |
| |||||||||
Aceto Corp. | 60,648 | 1,293,015 | ||||||||
|
| |||||||||
| ||||||||||
Wireless Telecommunication Services 1.3% |
| |||||||||
USA Mobility, Inc. | 93,800 | 1,337,588 | ||||||||
|
| |||||||||
Total Common Stocks |
| 100,169,677 | ||||||||
|
| |||||||||
10
Statement of Investments (Continued)
January 31, 2014 (Unaudited)
Nationwide Bailard Cognitive Value Fund (Continued)
| Exchange Traded Funds 3.8% | ||||||||||
| Shares | Market Value | |||||||||
| ||||||||||
Equity Funds 3.8% | ||||||||||
iShares Russell 2000 Value ETF | 21,000 | $ | 2,008,440 | |||||||
Vanguard Small-Cap Value ETF | 21,000 | 1,987,860 | ||||||||
|
| |||||||||
| 3,996,300 | ||||||||||
|
| |||||||||
Total Exchange Traded Funds |
| 3,996,300 | ||||||||
|
| |||||||||
| Mutual Fund 1.0% | ||||||||||
Money Market Fund 1.0% | ||||||||||
Fidelity Institutional Money Market Fund — Institutional Class, 0.08% (a) | 1,078,490 | 1,078,490 | ||||||||
|
| |||||||||
Total Mutual Fund (cost $1,078,490) |
| 1,078,490 | ||||||||
|
| |||||||||
Total Investments |
| 105,244,467 | ||||||||
Other assets in excess of liabilities — 0.1% |
| 83,134 | ||||||||
|
| |||||||||
NET ASSETS — 100.0% |
| $ | 105,327,601 | |||||||
|
| |||||||||
| * | Denotes a non-income producing security. |
| (a) | Represents 7-day effective yield as of January 31, 2014. |
| (b) | See notes to financial statements for tax cost and unrealized appreciation/(depreciation) of securities. |
| ADR | American Depositary Receipt |
| AG | Stock Corporation |
| CN | China |
| ETF | Exchange Traded Fund |
| Ltd. | Limited |
| REIT | Real Estate Investment Trust |
| TW | Taiwan |
The accompanying notes are an integral part of these financial statements.
11
Statement of Assets and Liabilities
January 31, 2014 (Unaudited)
| Nationwide Bailard Cognitive Value Fund | ||||||
Assets: | ||||||
Investments, at value (cost $99,480,793) | $ | 105,244,467 | ||||
Dividends receivable | 39,224 | |||||
Receivable for investments sold | 1,996,265 | |||||
Receivable for capital shares issued | 1,394,080 | |||||
Prepaid expenses | 17,874 | |||||
|
| |||||
Total Assets | 108,691,910 | |||||
|
| |||||
Liabilities: | ||||||
Payable for investments purchased | 3,213,006 | |||||
Payable for capital shares redeemed | 27,495 | |||||
Cash overdraft (Note 2) | 12 | |||||
Accrued expenses and other payables: | ||||||
Investment advisory fees | 69,324 | |||||
Fund administration fees | 6,325 | |||||
Distribution fees | 11,993 | |||||
Administrative servicing fees | 1,502 | |||||
Accounting and transfer agent fees | 4,350 | |||||
Trustee fees | 1,172 | |||||
Deferred compensation (Note 2) | 6,254 | |||||
Custodian fees | 585 | |||||
Compliance program costs (Note 3) | 1,528 | |||||
Professional fees | 14,034 | |||||
Printing fees | 4,432 | |||||
Other | 2,297 | |||||
|
| |||||
Total Liabilities | 3,364,309 | |||||
|
| |||||
Net Assets | $ | 105,327,601 | ||||
|
| |||||
Represented by: | ||||||
Capital | $ | 98,775,896 | ||||
Accumulated distributions in excess of net investment income | (312,991 | ) | ||||
Accumulated net realized gains from investment transactions | 1,101,022 | |||||
Net unrealized appreciation/(depreciation) from investments | 5,763,674 | |||||
|
| |||||
Net Assets | $ | 105,327,601 | ||||
|
| |||||
Net Assets: | ||||||
Class A Shares | $ | 1,166,369 | ||||
Class C Shares | 13,197,488 | |||||
Class M Shares | 89,803,168 | |||||
Institutional Service Class Shares | 1,150,222 | |||||
Institutional Class Shares | 10,354 | |||||
|
| |||||
Total | $ | 105,327,601 | ||||
|
| |||||
Shares Outstanding (unlimited number of shares authorized): | ||||||
Class A Shares | 93,617 | |||||
Class C Shares | 1,104,431 | |||||
Class M Shares | 7,233,599 | |||||
Institutional Service Class Shares | 92,538 | |||||
Institutional Class Shares | 834 | |||||
|
| |||||
Total | 8,525,019 | |||||
|
| |||||
12
Statement of Assets and Liabilities (Continued)
January 31, 2014 (Unaudited)
| Nationwide Bailard Cognitive Value Fund | ||||||
Net asset value and redemption price per share (Net assets by class divided by shares outstanding by class, respectively): | ||||||
Class A Shares (a) | $ | 12.46 | ||||
Class C Shares (b) | $ | 11.95 | ||||
Class M Shares | $ | 12.41 | ||||
Institutional Service Class Shares | $ | 12.43 | ||||
Institutional Class Shares | $ | 12.41 | ||||
Maximum offering price per share (100%/(100%-maximum sales charge) of net asset value adjusted to the nearest cent): | ||||||
Class A Shares | $ | 13.22 | ||||
|
| |||||
Maximum Sales Charge: | ||||||
Class A Shares | 5.75 | % | ||||
|
| |||||
| (a) | For Class A Shares, the redemption price per share is reduced by 1.00% on sales of shares of original purchases of $1,000,000 or more or that were not subject to a front-end sales charge made with 18 months of the purchase date. |
| (b) | For Class C Shares, the redemption price per share is reduced by 1.00% for shares held less than 1 year. |
The accompanying notes are an integral part of these financial statements.
13
Statement of Operations
For the Six Months Ended January 31, 2014 (Unaudited)
| Nationwide Bailard Cognitive Value Fund | ||||||
INVESTMENT INCOME: | ||||||
Dividend income | $ | 998,230 | ||||
Interest income | 39 | |||||
Foreign tax withholding | (2,728 | ) | ||||
|
| |||||
Total Income | 995,541 | |||||
|
| |||||
EXPENSES: | ||||||
Investment advisory fees | 391,450 | |||||
Fund administration fees | 65,492 | |||||
Distribution fees Class A | 1,436 | |||||
Distribution fees Class C | 39,338 | |||||
Administrative servicing fees Class A | 1,219 | |||||
Administrative servicing fees Institutional Service Class (a) | 1,736 | |||||
Registration and filing fees | 25,167 | |||||
Professional fees | 16,399 | |||||
Printing fees | 9,108 | |||||
Trustee fees | 1,891 | |||||
Custodian fees | 2,223 | |||||
Accounting and transfer agent fees | 7,969 | |||||
Compliance program costs (Note 3) | 1,748 | |||||
Other | 8,790 | |||||
|
| |||||
Total expenses before earnings credit, fees waived, and expenses reimbursed | 573,966 | |||||
|
| |||||
Earnings credit (Note 5) | (41 | ) | ||||
Administrative servicing fees voluntarily waived — Class A (Note 3) | (141 | ) | ||||
Administrative servicing fees voluntarily waived — Institutional Service Class (a) (Note 3) | (235 | ) | ||||
Expenses reimbursed by adviser (Note 3) | (3,943 | ) | ||||
|
| |||||
Net Expenses | 569,606 | |||||
|
| |||||
NET INVESTMENT INCOME | 425,935 | |||||
|
| |||||
REALIZED/UNREALIZED GAINS (LOSSES) FROM INVESTMENTS: | ||||||
Net realized gains from investment transactions | 3,834,901 | |||||
Net change in unrealized appreciation/(depreciation) from investments | (614,020 | ) | ||||
|
| |||||
Net realized/unrealized gains from investments | 3,220,881 | |||||
|
| |||||
CHANGE IN NET ASSETS RESULTING FROM OPERATIONS | $ | 3,646,816 | ||||
|
| |||||
| (a) | Effective September 16, 2013, Fiduciary Shares were renamed Institutional Service Class Shares. |
The accompanying notes are an integral part of these financial statements.
14
Statements of Changes in Net Assets
| Nationwide Bailard Cognitive Value Fund | ||||||||||||
| Six Months Ended January 31, 2014 (Unaudited) | Year Ended July 31, 2013 | |||||||||||
Operations: | ||||||||||||
Net investment income | $ | 425,935 | $ | 1,330,136 | ||||||||
Net realized gains from investment transactions | 3,834,901 | 22,104,698 | ||||||||||
Net change in unrealized appreciation/(depreciation) from investments | (614,020 | ) | 1,516,351 | |||||||||
|
|
|
| |||||||||
Change in net assets resulting from operations | 3,646,816 | 24,951,185 | ||||||||||
|
|
|
| |||||||||
Distributions to Shareholders From: | ||||||||||||
Net investment income: | ||||||||||||
Class A | (8,779 | ) | (5,466 | ) | ||||||||
Class C | (142,234 | ) | (1,418 | ) | ||||||||
Class M | (1,084,904 | ) | (975,185 | ) | ||||||||
Institutional Service Class (a) | (12,511 | ) | (35,776 | ) | ||||||||
Institutional Class | (120 | )(b) | – | |||||||||
Net realized gains: | ||||||||||||
Class A | (204,658 | ) | – | |||||||||
Class C | (2,644,093 | ) | – | |||||||||
Class M | (17,530,044 | ) | – | |||||||||
Institutional Service Class (a) | (246,368 | ) | – | |||||||||
Institutional Class | (1,945 | )(b) | – | |||||||||
|
|
|
| |||||||||
Change in net assets from shareholder distributions | (21,875,656 | ) | (1,017,845 | ) | ||||||||
|
|
|
| |||||||||
Change in net assets from capital transactions | 26,774,861 | (9,217,565 | ) | |||||||||
|
|
|
| |||||||||
Change in net assets | 8,546,021 | 14,715,775 | ||||||||||
|
|
|
| |||||||||
Net Assets: | ||||||||||||
Beginning of period | 96,781,580 | 82,065,805 | ||||||||||
|
|
|
| |||||||||
End of period | $ | 105,327,601 | $ | 96,781,580 | ||||||||
|
|
|
| |||||||||
Accumulated undistributed (distributions in excess of) net investment income at end of period | $ | (312,991 | ) | $ | 509,622 | |||||||
|
|
|
| |||||||||
CAPITAL TRANSACTIONS: | ||||||||||||
Class A Shares | ||||||||||||
Proceeds from shares issued | $ | 213,764 | $ | 493,322 | (c) | |||||||
Dividends reinvested | 187,155 | 4,699 | ||||||||||
Cost of shares redeemed | (179,896 | ) | (205,914 | ) | ||||||||
|
|
|
| |||||||||
Total Class A Shares | 221,023 | 292,107 | ||||||||||
|
|
|
| |||||||||
Class C Shares | ||||||||||||
Proceeds from shares issued | 14,406,228 | 125,270 | (c) | |||||||||
Dividends reinvested | 2,776,516 | 1,190 | ||||||||||
Cost of shares redeemed | (1,814,130 | ) | (102,342 | ) | ||||||||
|
|
|
| |||||||||
Total Class C Shares | 15,368,614 | 24,118 | ||||||||||
|
|
|
| |||||||||
| (a) | Effective September 16, 2013, Fiduciary Shares were renamed Institutional Service Class Shares. |
| (b) | For the period from September 19, 2013 (commencement of operations) through January 31, 2014. |
| (c) | Includes redemption fees. See Note 4 for further information. |
15
Statements of Changes in Net Assets (Continued)
| Nationwide Bailard Cognitive Value Fund | ||||||||||||
| Six Months Ended January 31, 2014 (Unaudited) | Year Ended July 31, 2013 | |||||||||||
CAPITAL TRANSACTIONS: (continued) | ||||||||||||
Class M Shares | ||||||||||||
Proceeds from shares issued | $ | 4,337,002 | $ | 6,055,974 | (c) | |||||||
Dividends reinvested | 16,825,543 | 866,070 | ||||||||||
Cost of shares redeemed | (9,391,980 | ) | (12,514,797 | ) | ||||||||
|
|
|
| |||||||||
Total Class M Shares | 11,770,565 | (5,592,753 | ) | |||||||||
|
|
|
| |||||||||
Institutional Service Class Shares (a) | ||||||||||||
Proceeds from shares issued | 10,984 | 1,303,454 | (c) | |||||||||
Dividends reinvested | 233,874 | 30,635 | ||||||||||
Cost of shares redeemed | (842,264 | ) | (5,275,126 | ) | ||||||||
|
|
|
| |||||||||
Total Institutional Service Class Shares | (597,406 | ) | (3,941,037 | ) | ||||||||
|
|
|
| |||||||||
Institutional Class Shares | ||||||||||||
Proceeds from shares issued | 10,000 | (b) | – | |||||||||
Dividends reinvested | 2,065 | (b) | – | |||||||||
Cost of shares redeemed | – | (b) | – | |||||||||
|
|
|
| |||||||||
Total Institutional Class Shares | 12,065 | (b) | – | |||||||||
|
|
|
| |||||||||
Change in net assets from capital transactions | $ | 26,774,861 | $ | (9,217,565 | ) | |||||||
|
|
|
| |||||||||
SHARE TRANSACTIONS: | ||||||||||||
Class A Shares | ||||||||||||
Issued | 15,523 | 36,204 | ||||||||||
Reinvested | 15,020 | 383 | ||||||||||
Redeemed | (11,893 | ) | (15,249 | ) | ||||||||
|
|
|
| |||||||||
Total Class A Shares | 18,650 | 21,338 | ||||||||||
|
|
|
| |||||||||
Class C Shares | ||||||||||||
Issued | 967,299 | 9,595 | ||||||||||
Reinvested | 232,150 | 100 | ||||||||||
Redeemed | (133,506 | ) | (7,810 | ) | ||||||||
|
|
|
| |||||||||
Total Class C Shares | 1,065,943 | 1,885 | ||||||||||
|
|
|
| |||||||||
Class M Shares | ||||||||||||
Issued | 308,343 | 455,168 | ||||||||||
Reinvested | 1,355,805 | 70,873 | ||||||||||
Redeemed | (662,285 | ) | (922,037 | ) | ||||||||
|
|
|
| |||||||||
Total Class M Shares | 1,001,863 | (395,996 | ) | |||||||||
|
|
|
| |||||||||
Institutional Service Class Shares (a) | ||||||||||||
Issued | 838 | 98,683 | ||||||||||
Reinvested | 18,815 | 2,507 | ||||||||||
Redeemed | (56,690 | ) | (412,288 | ) | ||||||||
|
|
|
| |||||||||
Total Institutional Service Class Shares | (37,037 | ) | (311,098 | ) | ||||||||
|
|
|
| |||||||||
| (a) | Effective September 16, 2013, Fiduciary Shares were renamed Institutional Service Class Shares. |
| (b) | For the period from September 19, 2013 (commencement of operations) through January 31, 2014. |
| (c) | Includes redemption fees. See Note 4 for further information. |
16
Statements of Changes in Net Assets (Continued)
| Nationwide Bailard Cognitive Value Fund | ||||||||||||
| Six Months Ended January 31, 2014 (Unaudited) | Year Ended July 31, 2013 | |||||||||||
SHARE TRANSACTIONS: (continued) | ||||||||||||
Institutional Class Shares | ||||||||||||
Issued | 668 | (b) | – | |||||||||
Reinvested | 166 | (b) | – | |||||||||
Redeemed | – | (b) | – | |||||||||
|
|
|
| |||||||||
Total Institutional Class Shares | 834 | (b) | – | |||||||||
|
|
|
| |||||||||
Total change in shares | 2,050,253 | (683,871 | ) | |||||||||
|
|
|
| |||||||||
Amounts designated as “–” are zero or have been rounded to zero.
| (b) | For the period from September 19, 2013 (commencement of operations) through January 31, 2014. |
The accompanying notes are an integral part of these financial statements.
17
Financial Highlights
Selected data for each share of capital outstanding throughout the periods indicated
Nationwide Bailard Cognitive Value Fund
| Operations | Distributions | Ratios/Supplemental Data | ||||||||||||||||||||||||||||||||||||||||||||||||||||||||||
| Net Asset Value, Beginning of Period | Net Investment Income (Loss) | Net Realized and Unrealized Gains (Losses) from Investments | Total from Operations | Net Investment Income | Net Realized Gains | Total Distributions | Redemption Fees | Net Asset Value, End of Period | Total Return (a)(b) | Net Assets at End of Period | Ratio of Expenses to Average Net Assets (c) | Ratio of Net Investment Income (Loss) to Average Net Assets (c) | Ratio of Expenses (Prior to Reimbursements) to Average Net Assets (c)(d) | Portfolio Turnover (e) | ||||||||||||||||||||||||||||||||||||||||||||||
| Class A Shares | ||||||||||||||||||||||||||||||||||||||||||||||||||||||||||||
Six Months Ended January 31, 2014 (f) | $ | 14.97 | 0.03 | 0.49 | 0.52 | (0.12 | ) | (2.91 | ) | (3.03 | ) | – | $ | 12.46 | 3.52% | $ | 1,166,369 | 1.45% | 0.44 | % | 1.48% | 174.67% | ||||||||||||||||||||||||||||||||||||||
Year Ended July 31, 2013 (f) | $ | 11.48 | 0.14 | 3.45 | 3.59 | (0.10 | ) | – | (0.10 | ) | – | $ | 14.97 | 31.48% | $ | 1,122,377 | 1.47% | 1.09 | % | 1.58% | 339.00% | |||||||||||||||||||||||||||||||||||||||
Year Ended July 31, 2012 (f) | $ | 11.51 | 0.03 | (0.01 | ) | 0.02 | (0.05 | ) | – | (0.05 | ) | – | $ | 11.48 | 0.21% | $ | 615,772 | 1.47% | 0.23 | % | 1.60% | 268.00% | ||||||||||||||||||||||||||||||||||||||
Year Ended July 31, 2011 (f) | $ | 9.37 | 0.07 | 2.19 | 2.26 | (0.12 | ) | – | (0.12 | ) | – | $ | 11.51 | 24.05% | $ | 961,056 | 1.47% | 0.60 | % | 1.58% | 216.00% | |||||||||||||||||||||||||||||||||||||||
Year Ended July 31, 2010 (f) | $ | 7.89 | 0.03 | 1.50 | 1.53 | (g) | (0.05 | ) | – | (0.05 | ) | – | $ | 9.37 | 19.60% | (g) | $ | 654,681 | 1.45% | 0.34 | % | 1.58% | 152.00% | |||||||||||||||||||||||||||||||||||||
Year Ended July 31, 2009 (f) | $ | 10.19 | 0.06 | (2.34 | ) | (2.28 | ) | (0.02 | ) | – | (0.02 | ) | – | $ | 7.89 | (22.40% | ) | $ | 332,812 | 1.40% | 0.74 | % | 1.59% | 141.00% | ||||||||||||||||||||||||||||||||||||
| Class C Shares | ||||||||||||||||||||||||||||||||||||||||||||||||||||||||||||
Six Months Ended January 31, 2014 (f) | $ | 14.55 | (0.01 | ) | 0.48 | 0.47 | (0.16 | ) | (2.91 | ) | (3.07 | ) | – | $ | 11.95 | 3.20% | $ | 13,197,488 | 1.98% | (0.08 | %) | 1.98% | 174.67% | |||||||||||||||||||||||||||||||||||||
Year Ended July 31, 2013 (f) | $ | 11.17 | 0.06 | 3.36 | 3.42 | (0.04 | ) | – | (0.04 | ) | – | $ | 14.55 | 30.67% | $ | 559,903 | 2.07% | 0.49 | % | 2.08% | 339.00% | |||||||||||||||||||||||||||||||||||||||
Year Ended July 31, 2012 (f) | $ | 11.20 | (0.04 | ) | 0.01 | (0.03 | ) | – | – | – | – | $ | 11.17 | (0.27% | ) | $ | 408,689 | 2.07% | (0.37 | %) | 2.10% | 268.00% | ||||||||||||||||||||||||||||||||||||||
Year Ended July 31, 2011 (f) | $ | 9.11 | – | 2.12 | 2.12 | (0.03 | ) | – | (0.03 | ) | – | $ | 11.20 | 23.30% | $ | 567,831 | 2.07% | – | 2.08% | 216.00% | ||||||||||||||||||||||||||||||||||||||||
Year Ended July 31, 2010 (f) | $ | 7.68 | (0.02 | ) | 1.47 | 1.45 | (g) | (0.02 | ) | – | (0.02 | ) | – | $ | 9.11 | 18.92% | (g) | $ | 520,057 | 2.05% | (0.26 | %) | 2.08% | 152.00% | ||||||||||||||||||||||||||||||||||||
Year Ended July 31, 2009 (f) | $ | 10.04 | 0.01 | (2.32 | ) | (2.31 | ) | (0.05 | ) | – | (0.05 | ) | – | $ | 7.68 | (22.92% | ) | $ | 413,389 | 2.02% | 0.12 | % | 2.09% | 141.00% | ||||||||||||||||||||||||||||||||||||
| Class M Shares | ||||||||||||||||||||||||||||||||||||||||||||||||||||||||||||
Six Months Ended January 31, 2014 (f) | $ | 14.95 | 0.07 | 0.48 | 0.55 | (0.18 | ) | (2.91 | ) | (3.09 | ) | – | $ | 12.41 | 3.69% | $ | 89,803,168 | 1.01% | 0.90 | % | 1.02% | 174.67% | ||||||||||||||||||||||||||||||||||||||
Year Ended July 31, 2013 (f) | $ | 11.47 | 0.19 | 3.44 | 3.63 | (0.15 | ) | – | (0.15 | ) | – | $ | 14.95 | 31.94% | $ | 93,162,527 | 1.07% | 1.49 | % | 1.08% | 339.00% | |||||||||||||||||||||||||||||||||||||||
Year Ended July 31, 2012 (f) | $ | 11.51 | 0.07 | – | 0.07 | (0.11 | ) | – | (0.11 | ) | – | $ | 11.47 | 0.71% | $ | 75,990,508 | 1.07% | 0.63 | % | 1.10% | 268.00% | |||||||||||||||||||||||||||||||||||||||
Year Ended July 31, 2011 (f) | $ | 9.37 | 0.11 | 2.18 | 2.29 | (0.15 | ) | – | (0.15 | ) | – | $ | 11.51 | 24.54% | $ | 87,921,410 | 1.07% | 1.00 | % | 1.08% | 216.00% | |||||||||||||||||||||||||||||||||||||||
Year Ended July 31, 2010 (f) | $ | 7.87 | 0.06 | 1.51 | 1.57 | (g) | (0.07 | ) | – | (0.07 | ) | – | $ | 9.37 | 20.08% | (g) | $ | 70,390,248 | �� | 1.05% | 0.74 | % | 1.08% | 152.00% | ||||||||||||||||||||||||||||||||||||
Year Ended July 31, 2009 (f) | $ | 10.22 | 0.08 | (2.34 | ) | (2.26 | ) | (0.09 | ) | – | (0.09 | ) | – | $ | 7.87 | (22.02% | ) | $ | 67,710,862 | 1.02% | 1.12 | % | 1.09% | 141.00% | ||||||||||||||||||||||||||||||||||||
| Institutional Service Class Shares (h) | ||||||||||||||||||||||||||||||||||||||||||||||||||||||||||||
Six Months Ended January 31, 2014 (f) | $ | 14.95 | 0.06 | 0.48 | 0.54 | (0.15 | ) | (2.91 | ) | (3.06 | ) | – | $ | 12.43 | 3.61% | $ | 1,150,222 | 1.20% | 0.75 | % | 1.24% | 174.67% | ||||||||||||||||||||||||||||||||||||||
Year Ended July 31, 2013 (f) | $ | 11.46 | 0.18 | 3.45 | 3.63 | (0.14 | ) | – | (0.14 | ) | – | $ | 14.95 | 31.93% | $ | 1,936,773 | 1.14% | 1.42 | % | 1.33% | 339.00% | |||||||||||||||||||||||||||||||||||||||
Year Ended July 31, 2012 (f) | $ | 11.50 | 0.06 | – | 0.06 | (0.10 | ) | – | (0.10 | ) | – | $ | 11.46 | 0.60% | $ | 5,050,836 | 1.16% | 0.54 | % | 1.35% | 268.00% | |||||||||||||||||||||||||||||||||||||||
Year Ended July 31, 2011 (f) | $ | 9.36 | 0.09 | 2.19 | 2.28 | (0.14 | ) | – | (0.14 | ) | – | $ | 11.50 | 24.32% | $ | 5,075,223 | 1.21% | 0.86 | % | 1.33% | 216.00% | |||||||||||||||||||||||||||||||||||||||
Year Ended July 31, 2010 (f) | $ | 7.87 | 0.06 | 1.50 | 1.56 | (g) | (0.07 | ) | – | (0.07 | ) | – | $ | 9.36 | 20.06% | (g) | $ | 2,230,226 | 1.13% | 0.66 | % | 1.33% | 152.00% | |||||||||||||||||||||||||||||||||||||
Year Ended July 31, 2009 (f) | $ | 10.23 | 0.08 | (2.35 | ) | (2.27 | ) | (0.09 | ) | – | (0.09 | ) | – | $ | 7.87 | (22.10% | ) | $ | 1,837,049 | 1.03% | 1.11 | % | 1.34% | 141.00% | ||||||||||||||||||||||||||||||||||||
| Institutional Class Shares | ||||||||||||||||||||||||||||||||||||||||||||||||||||||||||||
Period Ended January 31, 2014 (f)(i) | $ | 14.97 | 0.04 | 0.49 | 0.53 | (0.18 | ) | (2.91 | ) | (3.09 | ) | – | $ | 12.41 | 3.55% | $ | 10,354 | 0.99% | 0.70 | % | 0.99% | 174.67% | ||||||||||||||||||||||||||||||||||||||
Amounts designated as “–” are zero or have been rounded to zero.
| (a) | Excludes sales charge. |
| (b) | Not annualized for periods less than one year. |
| (c) | Annualized for periods less than one year. |
| (d) | During the period, certain fees may have been waived and/or reimbursed. If such waivers/reimbursements had not occurred, the ratios would have been as indicated. |
| (e) | Portfolio turnover is calculated on the basis of the Fund as a whole without distinguishing among the classes of shares. |
| (f) | Per share calculations were performed using average shares method. |
| (g) | Includes payment by affiliates of $0.001 per share. The effects of such pauments did not affect the amount shown as total return for the period. |
| (h) | Effective September 16, 2013, Fiduciary Shares were renamed Institutional Service Class Shares. |
| (i) | For the period from September 19, 2013 (commencement of operations) through January 31, 2014. Total return is calculated based on inception date of September 18, 2013 through January 31, 2014. |
The accompanying notes are an integral part of these financial statements.
18
| Fund Commentary | Nationwide Bailard International Equities Fund |
For the semiannual period ended January 31, 2014, the Nationwide Bailard International Equities Fund (Class M at NAV) returned 10.34%* versus 5.48% for its benchmark, the MSCI ACWI ex USA. For broader comparison, the median return for the Fund’s closest Lipper peer category of International Multi-Cap Core Funds (consisting of 165 funds as of January 31, 2014) was 6.21% for the same time period.
| * | Performance prior to the Fund’s inception on September 16, 2013, is based on the performance of the Fund’s predecessor fund. |
The Fund operates from the top down, with a strategy that focuses first on country selection, followed by stock selection within each individual market. During the reporting period, both country and stock selection were positive contributors to Fund performance versus the primary benchmark. Broadly speaking, added value on the country selection side came from overweighting the better-performing markets of developed Europe and underweighting a number of poor-performing emerging markets. The six months of the reporting period saw a wide divergence in returns between developed markets, particularly in Europe (the MSCI Europe ex-UK Index rose more than 10%), and emerging markets (the MSCI Emerging Markets® Index posted a small loss). In Europe, positive gross domestic product (GDP) growth readings in Spain and Italy, along with a revised economic outlook from the Organization for Economic Cooperation and Development (OECD), provided evidence of the Continent’s emergence from recession. Meanwhile, the anticipation and start of bond purchase tapering (gradual reduction in monetary easing) by the U.S. Federal Reserve had widely negative effects on sentiment toward emerging market stocks and currencies.
Country choices that proved beneficial for Fund performance during the reporting period included overweight positions in Finland, Germany and Spain, zero-weight positions in laggards Canada and Singapore, and underweight or zero-weight positions in troubled emerging markets Brazil, Indonesia, Thailand, South Africa and Turkey. Also helpful for Fund performance was an overweight in Egypt, a top performer among all markets. A large overweight in Japan, combined with a
sizable currency hedge, formed a “long local market, short yen” position that proved beneficial to the Fund as the yen weakened from 98 to 102 per dollar during the reporting period.
Results on the stock selection side were strongest for the Fund during the reporting period in Japan and across much of developed Europe (France, Switzerland, the U.K., Spain, Germany and the Netherlands), where portfolio holdings far outperformed the respective MSCI country indexes. Within each market, the Fund’s sector weights are generally held in line with the country index, and sector selection is not pursued as an investment strategy. Notable individual stock outperformers included Fund holdings in printer and watch maker Seiko Epson in Japan, computer peripheral company Logitech International in Switzerland, banks Credit Agricole in France and Bankinter in Spain, retailer W.H. Smith in the U.K., travel services firm TUI in Germany and temporary staffing company Randstad in the Netherlands.
Country selection decisions that did not help Fund results during the reporting period included a couple of “misses” in high-flying developed Europe (zero weights in Italy and Denmark) as well as overweight exposures to disappointing emerging markets Hungary and Russia (positions still held at the end of the reporting period) and the typhoon-struck Philippines (position sold at the end of 2013).
Points of weakness for stock selection within the Fund during the reporting period were Belgium and Finland, where Fund holdings failed to keep up with the respective MSCI country indexes. Results for the emerging markets as a whole were negative, due to slippage in China, Russia, the Czech Republic and Egypt, standing in stark contrast to the very strong developed market results; fortunately, the impact from this on overall Fund performance was minimal as the Fund’s average weight in emerging markets was less than 10%. The most notable individual stock detractor was a name not held by the Fund, Nokia in Finland, which rose mightily on a generous bid by Microsoft for its handset business.
19
| Fund Commentary (cont’d) | Nationwide Bailard International Equities Fund |
The Fund entered into financial futures contracts (“futures contracts”) to enable the Fund to more closely approximate the performance of its benchmark indices or for tactical hedging purposes. The Fund entered into forward foreign currency contracts in connection with planned purchases or sales of securities denominated in a foreign currency and/or to hedge the U.S. dollar value of portfolio securities denominated in a foreign currency.
Subadviser:
Bailard, Inc.
Portfolio Managers:
Anthony Craddock; Peter M. Hill; and Eric P. Leve
The Fund is subject to the risks of investing in equity securities and risks associated with investing in foreign securities, such as currency fluctuation, political risk, differences in accounting and limited availability of information, all of which are magnified in emerging markets. The Fund may invest in more-aggressive investments such as derivatives (many of which create investment leverage and are highly volatile) and exchange-traded funds (ETFs) (shareholders will bear additional costs). Please refer to the summary prospectus for a more detailed explanation of the Fund’s principal risks.
A description of the benchmarks can be found on the Market Index Definitions page at the back of this book.
20
| Fund Overview (Unaudited) | Nationwide Bailard International Equities Fund |
Objective
The Fund seeks long-term capital appreciation.
Highlights
| Ÿ | For the semiannual period ended January 31, 2014, the Fund (Class M at NAV) returned 10.34%, outperforming the benchmark by 4.86% and the Lipper peer category by 4.13%. |
| Ÿ | Country choices that proved beneficial for Fund performance during the reporting period included overweight positions in Finland, Germany and Spain, zero-weight positions in laggards Canada and Singapore, and underweight or zero-weight positions in troubled emerging markets Brazil, Indonesia, Thailand, South Africa and Turkey. |
| Ÿ | Country selection detracted from Fund performance during the reporting period in developed Europe (zero weights in Italy and Denmark) as well as overweight exposures to disappointing emerging markets Hungary, Russia and the Philippines. |
Asset Allocation†
| Common Stocks | 95.5% | |||
| Mutual Fund | 3.4% | |||
| Exchange Traded Funds | 2.0% | |||
| Liabilities in excess of other assets | (0.9)% | |||
| 100.0% |
Top Industries††
| Commercial Banks | 10.3% | |||
| Pharmaceuticals | 7.9% | |||
| Insurance | 6.6% | |||
| Oil, Gas & Consumable Fuels | 5.1% | |||
| Auto Components | �� | 4.4% | ||
| Hotels, Restaurants & Leisure | 4.3% | |||
| Diversified Telecommunication Services | 3.0% | |||
| Food Products | 3.0% | |||
| Information Technology Services | 2.5% | |||
| Construction & Engineering | 2.4% | |||
| Other Industries | 50.5% | |||
| 100.0% |
Top Holdings††
| Fidelity Institutional Money Market Fund —Institutional Class | 3.4% | |||
| Roche Holding AG | 2.7% | |||
| Sumitomo Mitsui Financial Group, Inc. | 2.1% | |||
| Market Vectors ETF Trust | 1.5% | |||
| Bankinter SA | 1.5% | |||
| Credit Agricole SA | 1.4% | |||
| Vinci SA | 1.3% | |||
| Seiko Epson Corp. | 1.3% | |||
| Cie Generale des Etablissements Michelin | 1.3% | |||
| Bayer AG | 1.2% | |||
| Other Holdings | 82.3% | |||
| 100.0% |
Top Countries†
| Japan | 20.5% | |||
| United Kingdom | 12.9% | |||
| France | 11.6% | |||
| Switzerland | 11.1% | |||
| Germany | 8.1% | |||
| United States | 5.4% | |||
| Netherlands | 5.1% | |||
| Spain | 4.2% | |||
| Finland | 3.8% | |||
| Australia | 3.5% | |||
| Other Countries | 13.8% | |||
| 100.0% |
| † | Percentages indicated are based upon net assets as of January 31, 2014. |
| †† | Percentages indicated are based upon total investments as of January 31, 2014. |
21
| Fund Performance | Nationwide Bailard International Equities Fund |
Average Annual Total Return
(For periods ended January 31, 2014)
| Six Months* | 1 Yr. | 5 Yr. | 10 Yr. | |||||||||||||||
| Class A | w/o SC1 | 10.00% | 11.20% | 13.89% | 7.18% | |||||||||||||
| w/SC2 | 3.96% | 5.04% | 12.60% | 6.57% | ||||||||||||||
| Class C | w/o SC1 | 9.62% | 10.52% | 13.10% | 6.47% | |||||||||||||
| w/SC3 | 8.62% | 9.52% | 13.10% | 6.47% | ||||||||||||||
| Class M4 | w/o SC | 10.34% | 11.85% | 14.28% | 7.55% | |||||||||||||
| Institutional Service Class4,5 | w/o SC | 10.05% | 11.41% | 14.07% | 7.39% | |||||||||||||
| Institutional Class4 | w/o SC | 3.09% | 6 | — | — | — | ||||||||||||
All figures showing the effect of a sales charge (SC) reflect the maximum charge possible, because it has the most significant effect on performance data.
| * | Not annualized. |
| 1 | These returns do not reflect the effects of SCs. |
| 2 | For the period from September 16, 2013 through January 31, 2014 a front-end sales charge of 5.75% was deducted. Prior to September 16, 2013, a front-end sales charge of 5.50% was deducted. |
| 3 | A 1.00% CDSC was deducted from the one year return because it is charged when you sell Class C shares within the first year after purchase. |
| 4 | Not subject to any SCs. |
| 5 | Effective September 16, 2013 Fiduciary Shares were renamed Institutional Service Class Shares. |
| 6 | Since inception date of September 18, 2013. Not Annualized. |
Expense Ratios
| Expense Ratio* | ||
| Class A | 1.42% | |
| Class C | 1.92% | |
| Class M | 0.92% | |
| Institutional Service Class | 1.17% | |
| Institutional Class | 0.92% |
| * | Current effective prospectus dated September 16, 2013. Please see the Fund’s most recent prospectus for details. |
22
| Fund Performance | Nationwide Bailard International Equities Fund |
Performance of a $10,000 Investment
Investment return and principal value will fluctuate, and when redeemed, shares may be worth more or less than original cost. Past performance is no guarantee of future results and does not reflect the deduction of taxes that a shareholder would pay on fund distributions or the redemption of fund shares. Investing in mutual funds involves market risk, including loss of principal. Performance returns assume the reinvestment of all distributions.
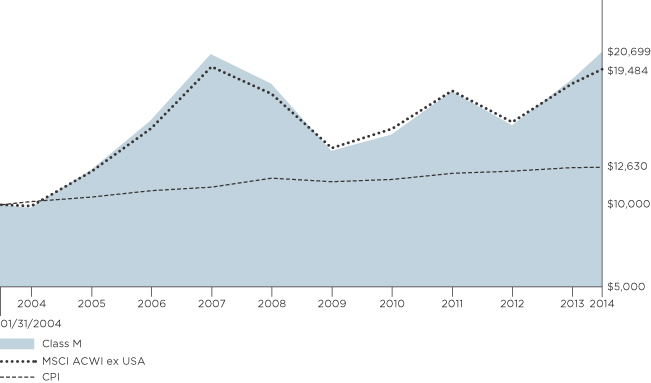
Comparative performance of $10,000 invested in Class M shares of the Nationwide Bailard International Equities Fund versus the MSCI ACWI ex USA and the Consumer Price Index (CPI) over the 10-year period ended 1/31/14. Fund performance prior to the Fund’s inception on 9/16/13 is based on the Fund’s predecessor Fund. Unlike the Fund, the performance for these unmanaged indexes does not reflect any fees, expenses, or sales charges. One cannot invest directly in a market index. A description of the benchmarks can be found on the Market Index Definitions page at the back of this book.
23
| Shareholder Expense Example | Nationwide Bailard International Equities Fund |
As a shareholder of the Fund, you incur two types of costs: (1) transaction costs, including sales charges (loads) paid on purchase payments and redemption fees; and (2) ongoing costs, including investment advisory fees, administration fees, distribution fees and other Fund expenses. The examples below are intended to help you understand your ongoing costs (in dollars) of investing in the Fund and to compare these costs with the ongoing costs of investing in other mutual funds. Per Securities and Exchange Commission (“SEC”) requirements, the examples assume that you had a $1,000 investment in the Class at the beginning of the reporting period (August 1, 2013) and continued to hold your shares at the end of the reporting period (January 31, 2014).
Actual Expenses
For each Class of the Fund in the table below, the first line provides information about actual account values and actual expenses. You may use the information in this line, together with the amount you invested, to estimate the expenses that you paid from August 1, 2013 through January 31, 2014. Simply divide your account value by $1,000 (for example, an $8,600 account value divided by $1,000 = 8.6), then multiply the result by the number in the first line of each Class under the heading entitled “Expenses Paid During Period” to estimate the expenses you paid on your account during this period.
Hypothetical Expenses for Comparison Purposes
The second line of each Class in the table below provides information about hypothetical account values and hypothetical expenses based on the Class’ actual expense ratio and an assumed rate of return of 5% per year before expenses, which is not the Class’ actual return. The hypothetical account values and expenses may not be used to estimate the actual ending account balance or expenses you paid for the period from August 1, 2013 through January 31, 2014. You may use this information to compare the ongoing costs of investing in the Class of the Fund and other funds. To do so, compare this 5% hypothetical example with the 5% hypothetical examples that appear in the shareholder reports of the other funds.
Please note that the expenses shown in the table are meant to highlight your ongoing costs only and do not reflect any transaction costs, such as sales charges (loads) or redemption fees. If these transaction costs were included, your costs would have been higher. Therefore, the second line for each Class in the table is useful in comparing ongoing costs only, and will not help you determine the relative total costs of owning different funds. The examples also assume all dividends and distributions are reinvested.
Schedule of Shareholder Expenses
Expense Analysis of a $1,000 Investment
Nationwide Bailard International January 31, 2014 | Beginning Account Value ($) 08/01/13 | Ending Account Value ($) 01/31/14 | Expenses Paid During Period ($) 08/01/13 - 01/31/14 | Expense Ratio During Period (%) 08/01/13 - 01/31/14 | ||||||||
| Class A Shares | Actual | a | 1,000.00 | 1,100.00 | 7.36 | 1.39 | ||||||
| Hypothetical | a,b | 1,000.00 | 1,018.20 | 7.07 | 1.39 | |||||||
| Class C Shares | Actual | a | 1,000.00 | 1,096.20 | 10.20 | 1.93 | ||||||
| Hypothetical | a,b | 1,000.00 | 1,015.48 | 9.80 | 1.93 | |||||||
| Class M Shares | Actual | a | 1,000.00 | 1,103.40 | 4.93 | 0.93 | ||||||
| Hypothetical | a,b | 1,000.00 | 1,020.52 | 4.74 | 0.93 | |||||||
| Institutional Service Class Sharesc | Actual | a | 1,000.00 | 1,100.50 | 6.14 | 1.16 | ||||||
| Hypothetical | a,b | 1,000.00 | 1,019.36 | 5.90 | 1.16 | |||||||
| Institutional Class Shares | Actual | d | 1,000.00 | 1,030.90 | 3.31 | 0.88 | ||||||
| Hypothetical | a,b | 1,000.00 | 1,020.77 | 4.48 | 0.88 | |||||||
| a | Expenses are equal to the Fund’s annualized expense ratio multiplied by the average account value from August 1, 2013 through January 31, 2014 multiplied to reflect one-half year period. The expense ratio presented represents a six-month, annualized ratio in accordance with Securities and Exchange Commission guidelines. |
| b | Represents the hypothetical 5% return before expenses. |
| c | Effective September 16, 2013, Fiduciary Shares were renamed Institutional Service Class Shares. |
| d | Actual expenses are equal to the Fund’s annualized expense ratio multiplied by the average account value from September 19, 2013 through January 31, 2014 to reflect the period from commencement of operations. |
24
Statement of Investments
January 31, 2014 (Unaudited)
Nationwide Bailard International Equities Fund
| Common Stocks 95.5% | ||||||||||
| Shares | Market Value | |||||||||
| ||||||||||
AUSTRALIA 3.5% |
| |||||||||
Capital Markets 0.3% |
| |||||||||
Perpetual Ltd. | 20,000 | $ | 823,134 | |||||||
|
| |||||||||
Construction & Engineering 0.3% |
| |||||||||
Leighton Holdings Ltd. | 50,000 | 718,607 | ||||||||
|
| |||||||||
Containers & Packaging 0.5% |
| |||||||||
Amcor Ltd. | 120,000 | 1,125,638 | ||||||||
Orora Ltd.* | 120,000 | 134,423 | ||||||||
|
| |||||||||
| 1,260,061 | ||||||||||
| �� |
|
| ||||||||
Diversified Financial Services 0.4% |
| |||||||||
Challenger Ltd. | 250,000 | 1,310,781 | ||||||||
|
| |||||||||
Diversified Telecommunication Services 0.4% |
| |||||||||
Telstra Corp., Ltd. | 200,000 | 900,162 | ||||||||
|
| |||||||||
Electric Utilities 0.3% |
| |||||||||
Spark Infrastructure Group | 500,000 | 718,140 | ||||||||
|
| |||||||||
Health Care Providers & Services 0.3% |
| |||||||||
Primary Health Care Ltd. | 150,000 | 651,582 | ||||||||
|
| |||||||||
Hotels, Restaurants & Leisure 0.3% |
| |||||||||
Flight Centre Travel Group Ltd. | 15,000 | 621,625 | ||||||||
|
| |||||||||
Metals & Mining 0.4% |
| |||||||||
Arrium Ltd. | 700,000 | 951,669 | ||||||||
|
| |||||||||
Oil, Gas & Consumable Fuels 0.3% |
| |||||||||
Woodside Petroleum Ltd. | 20,000 | 654,096 | ||||||||
|
| |||||||||
| 8,609,857 | ||||||||||
|
| |||||||||
| ||||||||||
BRAZIL 0.8% |
| |||||||||
Diversified Consumer Services 0.3% |
| |||||||||
Kroton Educacional SA | 40,000 | 611,292 | ||||||||
|
| |||||||||
Electric Utilities 0.2% |
| |||||||||
Cia Energetica de Minas Gerais, ADR | 104,612 | 603,611 | ||||||||
|
| |||||||||
Metals & Mining 0.3% |
| |||||||||
Vale SA, ADR | 60,000 | 816,000 | ||||||||
|
| |||||||||
| 2,030,903 | ||||||||||
|
| |||||||||
| ||||||||||
COLOMBIA 0.6% |
| |||||||||
Commercial Banks 0.3% |
| |||||||||
Bancolombia SA – Preference Shares, ADR | 15,000 | 659,100 | ||||||||
|
| |||||||||
Oil, Gas & Consumable Fuels 0.3% |
| |||||||||
Ecopetrol SA, ADR | 20,000 | 685,200 | ||||||||
|
| |||||||||
| 1,344,300 | ||||||||||
|
| |||||||||
| ||||||||||
EGYPT 0.6% |
| |||||||||
Commercial Banks 0.3% |
| |||||||||
Commercial International Bank Egypt SAE, GDR REG | 180,000 | 795,671 | ||||||||
|
| |||||||||
Wireless Telecommunication Services 0.3% |
| |||||||||
Global Telecom Holding, GDR* | 200,000 | 662,903 | ||||||||
|
| |||||||||
| 1,458,574 | ||||||||||
|
| |||||||||
| Common Stocks (continued) | ||||||||||
| Shares | Market Value | |||||||||
| ||||||||||
FINLAND 3.8% |
| |||||||||
Diversified Financial Services 0.3% |
| |||||||||
Pohjola Bank PLC, Class A | 40,000 | $ | 783,389 | |||||||
|
| |||||||||
Diversified Telecommunication Services 0.6% |
| |||||||||
Elisa OYJ | 60,000 | 1,538,077 | ||||||||
|
| |||||||||
Insurance 0.7% |
| |||||||||
Sampo OYJ, Class A | 35,000 | 1,622,876 | ||||||||
|
| |||||||||
Oil, Gas & Consumable Fuels 0.3% |
| |||||||||
Neste Oil OYJ | 45,000 | 803,268 | ||||||||
|
| |||||||||
Paper & Forest Products 1.6% |
| |||||||||
Stora Enso OYJ, Class R | 200,000 | 1,866,655 | ||||||||
UPM-Kymmene OYJ | 130,000 | 1,991,164 | ||||||||
|
| |||||||||
| 3,857,819 | ||||||||||
|
| |||||||||
Pharmaceuticals 0.3% |
| |||||||||
Orion OYJ, Class B | 25,000 | 652,510 | ||||||||
|
| |||||||||
| 9,257,939 | ||||||||||
|
| |||||||||
| ||||||||||
FRANCE 11.7% |
| |||||||||
Aerospace & Defense 1.0% |
| |||||||||
Safran SA | 15,000 | 1,065,994 | ||||||||
Thales SA | 20,000 | 1,301,491 | ||||||||
|
| |||||||||
| 2,367,485 | ||||||||||
|
| |||||||||
Auto Components 2.0% |
| |||||||||
Cie Generale des Etablissements Michelin | 30,000 | 3,155,711 | ||||||||
Valeo SA | 15,000 | 1,673,782 | ||||||||
|
| |||||||||
| 4,829,493 | ||||||||||
|
| |||||||||
Automobiles 0.5% |
| |||||||||
Renault SA | 15,000 | 1,303,036 | ||||||||
|
| |||||||||
Commercial Banks 2.1% |
| |||||||||
Credit Agricole SA* | 250,000 | 3,354,554 | ||||||||
Natixis | 200,000 | 1,173,228 | ||||||||
Societe Generale SA | 15,000 | 847,498 | ||||||||
|
| |||||||||
| 5,375,280 | ||||||||||
|
| |||||||||
Construction & Engineering 1.8% |
| |||||||||
Eiffage SA | 20,000 | 1,161,154 | ||||||||
Vinci SA | 50,000 | 3,269,464 | ||||||||
|
| |||||||||
| 4,430,618 | ||||||||||
|
| |||||||||
Electric Utilities 0.5% |
| |||||||||
Electricite de France | 35,000 | 1,188,129 | ||||||||
|
| |||||||||
Information Technology Services 0.9% |
| |||||||||
AtoS | 17,000 | 1,486,669 | ||||||||
Cap Gemini SA | 12,000 | 816,288 | ||||||||
|
| |||||||||
| 2,302,957 | ||||||||||
|
| |||||||||
Insurance 0.9% |
| |||||||||
AXA SA | 50,000 | 1,311,549 | ||||||||
SCOR SE | 25,000 | 809,912 | ||||||||
|
| |||||||||
| 2,121,461 | ||||||||||
|
| |||||||||
25
Statement of Investments (Continued)
January 31, 2014 (Unaudited)
Nationwide Bailard International Equities Fund (Continued)
| Common Stocks (continued) | ||||||||||
| Shares | Market Value | |||||||||
| ||||||||||
FRANCE (continued) |
| |||||||||
Multi-Utilities 0.5% |
| |||||||||
GDF Suez | 50,000 | $ | 1,103,674 | |||||||
|
| |||||||||
Oil, Gas & Consumable Fuels 1.1% |
| |||||||||
Total SA | 45,000 | 2,567,326 | ||||||||
|
| |||||||||
Pharmaceuticals 0.4% |
| |||||||||
Sanofi | 10,000 | 977,610 | ||||||||
|
| |||||||||
| 28,567,069 | ||||||||||
|
| |||||||||
| ||||||||||
GERMANY 8.2% |
| |||||||||
Air Freight & Logistics 0.9% |
| |||||||||
Deutsche Post AG REG | 60,000 | 2,072,269 | ||||||||
|
| |||||||||
Airlines 0.4% |
| |||||||||
Deutsche Lufthansa AG REG* | 45,000 | 1,068,933 | ||||||||
|
| |||||||||
Auto Components 0.5% |
| |||||||||
Continental AG | 6,000 | 1,287,690 | ||||||||
|
| |||||||||
Automobiles 0.7% |
| |||||||||
Daimler AG REG | 20,000 | 1,670,518 | ||||||||
|
| |||||||||
Computers & Peripherals 0.3% |
| |||||||||
Wincor Nixdorf AG | 10,000 | 710,380 | ||||||||
|
| |||||||||
Hotels, Restaurants & Leisure 1.0% |
| |||||||||
TUI AG* | 140,000 | 2,382,913 | ||||||||
|
| |||||||||
Insurance 1.7% | ||||||||||
Allianz SE REG | 10,000 | 1,662,404 | ||||||||
Hannover Rueck SE | 20,000 | 1,586,597 | ||||||||
Muenchener Rueckversicherungs AG REG | 5,000 | 1,030,402 | ||||||||
|
| |||||||||
| 4,279,403 | ||||||||||
|
| |||||||||
Media 0.4% |
| |||||||||
ProSiebenSat.1 Media AG REG | 20,000 | 895,934 | ||||||||
|
| |||||||||
Pharmaceuticals 1.5% |
| |||||||||
Bayer AG REG | 22,000 | 2,895,328 | ||||||||
Merck KGaA | 5,000 | 774,207 | ||||||||
|
| |||||||||
| 3,669,535 | ||||||||||
|
| |||||||||
Wireless Telecommunication Services 0.8% |
| |||||||||
Freenet AG* | 60,000 | 1,829,401 | ||||||||
|
| |||||||||
| 19,866,976 | ||||||||||
|
| |||||||||
| ||||||||||
GREECE 1.9% |
| |||||||||
Diversified Telecommunication Services 0.9% |
| |||||||||
Hellenic Telecommunications Organization SA* | 140,000 | 2,046,658 | ||||||||
|
| |||||||||
Electric Utilities 0.3% |
| |||||||||
Public Power Corp. SA | 50,000 | 669,820 | ||||||||
|
| |||||||||
Hotels, Restaurants & Leisure 0.7% |
| |||||||||
OPAP SA | 140,000 | 1,810,423 | ||||||||
|
| |||||||||
| 4,526,901 | ||||||||||
|
| |||||||||
| ||||||||||
HONG KONG 3.0% |
| |||||||||
Air Freight & Logistics 0.1% |
| |||||||||
Kerry Logistics Network Ltd.* | 75,000 | 126,742 | ||||||||
|
| |||||||||
| Common Stocks (continued) | ||||||||||
| Shares | Market Value | |||||||||
| ||||||||||
HONG KONG (continued) | ||||||||||
Commercial Banks 0.3% |
| |||||||||
BOC Hong Kong Holdings Ltd. | 250,000 | $ | 759,813 | |||||||
|
| |||||||||
Electrical Equipment 0.4% |
| |||||||||
Johnson Electric Holdings Ltd. | 1,200,000 | 1,069,452 | ||||||||
|
| |||||||||
Hotels, Restaurants & Leisure 0.3% |
| |||||||||
SJM Holdings Ltd. | 250,000 | 774,888 | ||||||||
|
| |||||||||
Industrial Conglomerates 0.3% |
| |||||||||
Hutchison Whampoa Ltd. | 60,000 | 743,036 | ||||||||
|
| |||||||||
Real Estate Management & Development 1.6% |
| |||||||||
Cheung Kong Holdings Ltd. | 80,000 | 1,186,702 | ||||||||
Kerry Properties Ltd. | 150,000 | 481,094 | ||||||||
New World Development Co., Ltd. | 1,100,000 | 1,375,631 | ||||||||
Wharf Holdings Ltd. | 125,000 | 850,928 | ||||||||
|
| |||||||||
| 3,894,355 | ||||||||||
|
| |||||||||
| 7,368,286 | ||||||||||
|
| |||||||||
| ||||||||||
HUNGARY 1.6% |
| |||||||||
Commercial Banks 0.7% |
| |||||||||
OTP Bank PLC | 100,000 | 1,830,297 | ||||||||
|
| |||||||||
Oil, Gas & Consumable Fuels 0.6% |
| |||||||||
MOL Hungarian Oil & Gas PLC | 22,000 | 1,346,454 | ||||||||
|
| |||||||||
Pharmaceuticals 0.3% |
| |||||||||
Richter Gedeon Nyrt | 35,000 | 707,472 | ||||||||
|
| |||||||||
| 3,884,223 | ||||||||||
|
| |||||||||
| ||||||||||
IRELAND 0.9% |
| |||||||||
Containers & Packaging 0.5% |
| |||||||||
Smurfit Kappa Group PLC | 60,000 | 1,404,914 | ||||||||
|
| |||||||||
Food Products 0.4% |
| |||||||||
Kerry Group PLC, Class A | 13,000 | 874,902 | ||||||||
|
| |||||||||
| 2,279,816 | ||||||||||
|
| |||||||||
| ||||||||||
JAPAN 20.5% |
| |||||||||
Airlines 0.7% |
| |||||||||
Japan Airlines Co., Ltd. | 35,000 | 1,751,879 | ||||||||
|
| |||||||||
Auto Components 1.8% |
| |||||||||
Bridgestone Corp. | 60,000 | 2,154,140 | ||||||||
Toyo Tire & Rubber Co., Ltd. | 150,000 | 843,835 | ||||||||
Toyota Boshoku Corp. | 40,000 | 455,518 | ||||||||
Yokohama Rubber Co., Ltd. (The) | 100,000 | 890,502 | ||||||||
|
| |||||||||
| 4,343,995 | ||||||||||
|
| |||||||||
Automobiles 1.0% |
| |||||||||
Daihatsu Motor Co., Ltd. | 50,000 | 779,800 | ||||||||
Toyota Motor Corp. | 30,000 | 1,716,590 | ||||||||
|
| |||||||||
| 2,496,390 | ||||||||||
|
| |||||||||
Capital Markets 0.5% |
| |||||||||
Daiwa Securities Group, Inc. | 120,000 | 1,112,929 | ||||||||
|
| |||||||||
26
Statement of Investments (Continued)
January 31, 2014 (Unaudited)
Nationwide Bailard International Equities Fund (Continued)
| Common Stocks (continued) | ||||||||||
| Shares | Market Value | |||||||||
| ||||||||||
JAPAN (continued) | ||||||||||
Chemicals 1.6% |
| |||||||||
DIC Corp. | 300,000 | $ | 853,178 | |||||||
Sumitomo Chemical Co., Ltd. | 300,000 | 1,215,367 | ||||||||
Tosoh Corp. | 400,000 | 1,705,534 | ||||||||
|
| |||||||||
| 3,774,079 | ||||||||||
|
| |||||||||
Commercial Banks 3.7% |
| |||||||||
Mizuho Financial Group, Inc. | 1,200,000 | 2,543,187 | ||||||||
Resona Holdings, Inc. | 200,000 | 1,054,216 | ||||||||
Sumitomo Mitsui Financial Group, Inc. | 110,000 | 5,095,874 | ||||||||
|
| |||||||||
| 8,693,277 | ||||||||||
|
| |||||||||
Computers & Peripherals 1.3% |
| |||||||||
Seiko Epson Corp. | 125,000 | 3,246,061 | ||||||||
|
| |||||||||
Electric Utilities 0.4% |
| |||||||||
Tokyo Electric Power Co., Inc.* | 200,000 | 907,669 | ||||||||
|
| |||||||||
Food & Staples Retailing 1.0% |
| |||||||||
Aeon Co., Ltd. | 200,000 | 2,493,807 | ||||||||
|
| |||||||||
Health Care Providers & Services 0.4% |
| |||||||||
Medipal Holdings Corp. | 70,000 | 1,022,183 | ||||||||
|
| |||||||||
Household Durables 0.8% |
| |||||||||
Sekisui House Ltd. | 140,000 | 1,930,934 | ||||||||
|
| |||||||||
Information Technology Services 1.1% |
| |||||||||
IT Holdings Corp. | 40,000 | 661,639 | ||||||||
SCSK Corp. | 70,000 | 1,928,901 | ||||||||
|
| |||||||||
| 2,590,540 | ||||||||||
|
| |||||||||
Leisure Equipment & Products 0.9% |
| |||||||||
Heiwa Corp. | 40,000 | 708,730 | ||||||||
Namco Bandai Holdings, Inc. | 60,000 | 1,361,663 | ||||||||
|
| |||||||||
| 2,070,393 | ||||||||||
|
| |||||||||
Machinery 0.8% |
| |||||||||
Hino Motors Ltd. | 100,000 | 1,455,187 | ||||||||
Mitsui Engineering & Shipbuilding Co., Ltd. | 300,000 | 585,229 | ||||||||
|
| |||||||||
| 2,040,416 | ||||||||||
|
| |||||||||
Metals & Mining 0.3% |
| |||||||||
Mitsubishi Materials Corp. | 250,000 | 839,264 | ||||||||
|
| |||||||||
Office Electronics 0.4% |
| |||||||||
Ricoh Co., Ltd. | 100,000 | 1,050,830 | ||||||||
|
| |||||||||
Oil, Gas & Consumable Fuels 0.2% |
| |||||||||
Idemitsu Kosan Co., Ltd. | 26,000 | 576,853 | ||||||||
|
| |||||||||
Real Estate Management & Development 0.1% |
| |||||||||
Daikyo, Inc. | 150,000 | 364,544 | ||||||||
|
| |||||||||
Road & Rail 0.7% |
| |||||||||
Sankyu, Inc. | 240,000 | 903,601 | ||||||||
West Japan Railway Co. | 20,000 | 819,243 | ||||||||
|
| |||||||||
| 1,722,844 | ||||||||||
|
| |||||||||
Trading Companies & Distributors 1.8% |
| |||||||||
ITOCHU Corp. | 100,000 | 1,221,728 | ||||||||
Marubeni Corp. | 250,000 | 1,744,060 | ||||||||
| Common Stocks (continued) | ||||||||||
| Shares | Market Value | |||||||||
| ||||||||||
JAPAN (continued) | ||||||||||
Trading Companies & Distributors (continued) |
| |||||||||
Sojitz Corp. | 400,000 | $ | 685,730 | |||||||
Sumitomo Corp. | 60,000 | 747,620 | ||||||||
|
| |||||||||
| 4,399,138 | ||||||||||
|
| |||||||||
Wireless Telecommunication Services 1.0% |
| |||||||||
KDDI Corp. | 45,000 | 2,477,797 | ||||||||
|
| |||||||||
| 49,905,822 | ||||||||||
|
| |||||||||
| ||||||||||
MACAU 0.6% |
| |||||||||
Hotels, Restaurants & Leisure 0.6% |
| |||||||||
MGM China Holdings Ltd. | 350,000 | 1,371,800 | ||||||||
|
| |||||||||
| ||||||||||
NETHERLANDS 5.2% |
| |||||||||
Air Freight & Logistics 0.5% |
| |||||||||
PostNL NV* | 200,000 | 1,119,540 | ||||||||
|
| |||||||||
Diversified Financial Services 0.8% |
| |||||||||
ING Groep NV, CVA* | 150,000 | 1,981,049 | ||||||||
|
| |||||||||
Energy Equipment & Services 0.3% |
| |||||||||
SBM Offshore NV* | 40,000 | 771,896 | ||||||||
|
| |||||||||
Food & Staples Retailing 0.7% |
| |||||||||
Koninklijke Ahold NV | 100,000 | 1,664,529 | ||||||||
|
| |||||||||
Industrial Conglomerates 0.4% |
| |||||||||
Koninklijke Philips NV | 25,000 | 867,354 | ||||||||
|
| |||||||||
Insurance 0.7% |
| |||||||||
Aegon NV | 200,000 | 1,743,314 | ||||||||
|
| |||||||||
Media 0.4% |
| |||||||||
Wolters Kluwer NV | 35,000 | 965,651 | ||||||||
|
| |||||||||
Oil, Gas & Consumable Fuels 0.9% |
| |||||||||
Royal Dutch Shell PLC, Class B | 60,000 | 2,194,630 | ||||||||
|
| |||||||||
Professional Services 0.5% |
| |||||||||
Randstad Holding NV | 20,000 | 1,268,335 | ||||||||
|
| |||||||||
| 12,576,298 | ||||||||||
|
| |||||||||
| ||||||||||
PAKISTAN 1.1% |
| |||||||||
Chemicals 0.4% |
| |||||||||
Engro Corp. Ltd.* | 600,000 | 1,014,531 | ||||||||
|
| |||||||||
Oil, Gas & Consumable Fuels 0.4% |
| |||||||||
Pakistan Petroleum Ltd. | 450,000 | 945,417 | ||||||||
|
| |||||||||
Textiles, Apparel & Luxury Goods 0.3% |
| |||||||||
Nishat Mills Ltd. | 500,000 | 639,148 | ||||||||
|
| |||||||||
| 2,599,096 | ||||||||||
|
| |||||||||
| ||||||||||
RUSSIA 1.5% |
| |||||||||
Commercial Banks 0.4% |
| |||||||||
Sberbank of Russia, ADR | 80,000 | 865,600 | ||||||||
|
| |||||||||
Oil, Gas & Consumable Fuels 0.8% |
| |||||||||
Gazprom OAO, ADR | 120,000 | 988,204 | ||||||||
Lukoil OAO, ADR | 20,000 | 1,140,000 | ||||||||
|
| |||||||||
| 2,128,204 | ||||||||||
|
| |||||||||
27
Statement of Investments (Continued)
January 31, 2014 (Unaudited)
Nationwide Bailard International Equities Fund (Continued)
| Common Stocks (continued) | ||||||||||
| Shares | Market Value | |||||||||
| ||||||||||
RUSSIA (continued) | ||||||||||
Wireless Telecommunication Services 0.3% |
| |||||||||
Mobile Telesystems OJSC, ADR | 40,000 | $ | 690,000 | |||||||
|
| |||||||||
| 3,683,804 | ||||||||||
|
| |||||||||
| ||||||||||
SPAIN 4.3% |
| |||||||||
Commercial Banks 1.5% |
| |||||||||
Bankinter SA | 500,000 | 3,733,651 | ||||||||
|
| |||||||||
Electrical Equipment 0.4% |
| |||||||||
Gamesa Corp. Tecnologica SA* | 90,000 | 986,739 | ||||||||
|
| |||||||||
Gas Utilities 0.8% |
| |||||||||
Gas Natural SDG SA | 75,000 | 1,853,519 | ||||||||
|
| |||||||||
Information Technology Services 0.5% |
| |||||||||
Amadeus IT Holding SA, Class A | 30,000 | 1,186,739 | ||||||||
|
| |||||||||
Oil, Gas & Consumable Fuels 0.6% |
| |||||||||
Repsol SA | 65,000 | 1,519,171 | ||||||||
|
| |||||||||
Transportation Infrastructure 0.5% |
| |||||||||
Abertis Infraestructuras SA | 50,000 | 1,115,757 | ||||||||
|
| |||||||||
| 10,395,576 | ||||||||||
|
| |||||||||
| ||||||||||
SWEDEN 1.5% |
| |||||||||
Commercial Banks 0.5% |
| |||||||||
Skandinaviska Enskilda Banken AB, Class A | 90,000 | 1,159,622 | ||||||||
|
| |||||||||
Commercial Services & Supplies 0.3% |
| |||||||||
Securitas AB, Class B | 70,000 | 726,515 | ||||||||
|
| |||||||||
Construction & Engineering 0.3% |
| |||||||||
NCC AB, Class B | 25,000 | 797,775 | ||||||||
|
| |||||||||
Household Products 0.4% |
| |||||||||
Svenska Cellulosa AB SCA, Class B | 30,000 | 853,061 | ||||||||
|
| |||||||||
| 3,536,973 | ||||||||||
|
| |||||||||
| ||||||||||
SWITZERLAND 11.2% |
| |||||||||
Capital Markets 0.4% |
| |||||||||
Credit Suisse Group AG REG* | 35,853 | 1,080,285 | ||||||||
|
| |||||||||
Computers & Peripherals 0.6% |
| |||||||||
Logitech International SA REG | 90,000 | 1,414,803 | ||||||||
|
| |||||||||
Food Products 1.3% |
| |||||||||
Aryzta AG* | 12,000 | 942,959 | ||||||||
Nestle SA REG | 30,000 | 2,174,141 | ||||||||
|
| |||||||||
| 3,117,100 | ||||||||||
|
| |||||||||
Hotels, Restaurants & Leisure 0.4% |
| |||||||||
Kuoni Reisen Holding AG REG* | 2,000 | 903,992 | ||||||||
|
| |||||||||
Insurance 2.3% |
| |||||||||
Swiss Life Holding AG REG* | 8,000 | 1,721,830 | ||||||||
Swiss Re AG* | 30,000 | 2,589,034 | ||||||||
Zurich Insurance Group AG* | 4,000 | 1,159,763 | ||||||||
|
| |||||||||
| 5,470,627 | ||||||||||
|
| |||||||||
Life Sciences Tools & Services 0.6% |
| |||||||||
Lonza Group AG REG* | 15,000 | 1,504,597 | ||||||||
|
| |||||||||
| Common Stocks (continued) | ||||||||||
| Shares | Market Value | |||||||||
| ||||||||||
SWITZERLAND (continued) | ||||||||||
Machinery 1.3% |
| |||||||||
Georg Fischer AG REG* | 2,000 | $ | 1,369,983 | |||||||
OC Oerlikon Corp. AG REG* | 120,000 | 1,887,856 | ||||||||
|
| |||||||||
| 3,257,839 | ||||||||||
|
| |||||||||
Pharmaceuticals 3.7% |
| |||||||||
Novartis AG REG | 30,000 | 2,371,226 | ||||||||
Roche Holding AG | 24,000 | 6,584,776 | ||||||||
|
| |||||||||
| 8,956,002 | ||||||||||
|
| |||||||||
Professional Services 0.6% |
| |||||||||
Adecco SA REG* | 20,000 | 1,570,931 | ||||||||
|
| |||||||||
| 27,276,176 | ||||||||||
|
| |||||||||
| ||||||||||
UNITED KINGDOM 13.0% |
| |||||||||
Aerospace & Defense 0.9% |
| |||||||||
BAE Systems PLC | 300,000 | 2,116,466 | ||||||||
|
| |||||||||
Capital Markets 1.2% |
| |||||||||
3i Group PLC | 150,000 | 919,252 | ||||||||
Aberdeen Asset Management PLC | 300,000 | 1,924,195 | ||||||||
|
| |||||||||
| 2,843,447 | ||||||||||
|
| |||||||||
Commercial Banks 0.6% |
| |||||||||
Lloyds Banking Group PLC* | 1,000,000 | 1,363,742 | ||||||||
|
| |||||||||
Containers & Packaging 0.8% |
| |||||||||
DS Smith PLC | 200,000 | 1,076,933 | ||||||||
Rexam PLC | 108,000 | 873,867 | ||||||||
|
| |||||||||
| 1,950,800 | ||||||||||
|
| |||||||||
Diversified Telecommunication Services 1.2% |
| |||||||||
BT Group PLC | 450,000 | 2,833,687 | ||||||||
|
| |||||||||
Food Products 1.3% |
| |||||||||
Tate & Lyle PLC | 70,000 | 870,567 | ||||||||
Unilever PLC | 60,000 | 2,302,801 | ||||||||
|
| |||||||||
| 3,173,368 | ||||||||||
|
| |||||||||
Hotels, Restaurants & Leisure 1.0% |
| |||||||||
Compass Group PLC | 110,000 | 1,643,989 | ||||||||
William Hill PLC | 150,000 | 818,742 | ||||||||
|
| |||||||||
| 2,462,731 | ||||||||||
|
| |||||||||
Insurance 0.3% |
| |||||||||
Old Mutual PLC | 300,000 | 848,971 | ||||||||
|
| |||||||||
Media 1.1% |
| |||||||||
Daily Mail & General Trust PLC, Class A | 80,000 | 1,263,786 | ||||||||
ITV PLC | 400,000 | 1,290,762 | ||||||||
|
| |||||||||
| 2,554,548 | ||||||||||
|
| |||||||||
Paper & Forest Products 0.4% |
| |||||||||
Mondi PLC | 60,000 | 907,950 | ||||||||
|
| |||||||||
Pharmaceuticals 1.7% |
| |||||||||
AstraZeneca PLC | 38,085 | 2,415,128 | ||||||||
GlaxoSmithKline PLC | 70,000 | 1,799,293 | ||||||||
|
| |||||||||
| 4,214,421 | ||||||||||
|
| |||||||||
28
Statement of Investments (Continued)
January 31, 2014 (Unaudited)
Nationwide Bailard International Equities Fund (Continued)
| Common Stocks (continued) | ||||||||||
| Shares | Market Value | |||||||||
| ||||||||||
UNITED KINGDOM (continued) | ||||||||||
Road & Rail 0.4% |
| |||||||||
Stagecoach Group PLC | 150,000 | $ | 896,136 | |||||||
|
| |||||||||
Software 0.3% |
| |||||||||
Micro Focus International PLC | 67,132 | 826,131 | ||||||||
|
| |||||||||
Specialty Retail 0.8% |
| |||||||||
WH Smith PLC | 120,000 | 2,055,026 | ||||||||
|
| |||||||||
Tobacco 1.0% |
| |||||||||
British American Tobacco PLC | 30,000 | 1,431,533 | ||||||||
Imperial Tobacco Group PLC | 30,000 | 1,094,765 | ||||||||
|
| |||||||||
| 2,526,298 | ||||||||||
|
| |||||||||
| 31,573,722 | ||||||||||
|
| |||||||||
Total Common Stocks |
| 232,114,111 | ||||||||
|
| |||||||||
| Exchange Traded Funds 2.0% | ||||||||||
UNITED STATES 2.0% |
| |||||||||
Market Vectors ETF Trust* | 150,000 | 3,789,000 | ||||||||
Market Vectors Vietnam ETF | 50,000 | 1,053,500 | ||||||||
|
| |||||||||
Total Exchange Traded Funds |
| 4,842,500 | ||||||||
|
| |||||||||
| Mutual Fund 3.4% | ||||||||||
Money Market Fund 3.4% |
| |||||||||
Fidelity Institutional Money Market | 8,276,892 | 8,276,892 | ||||||||
|
| |||||||||
Total Mutual Fund (cost $8,276,892) |
| 8,276,892 | ||||||||
|
| |||||||||
Total Investments | 245,233,503 | |||||||||
Liabilities in excess of other assets — (0.9)% |
| (2,102,448 | ) | |||||||
|
| |||||||||
NET ASSETS — 100.0% |
| $ | 243,131,055 | |||||||
|
| |||||||||
| * | Denotes a non-income producing security. |
| (a) | Represents 7-day effective yield as of January 31, 2014. |
| (b) | See notes to financial statements for tax cost and unrealized appreciation/(depreciation) of securities. |
| AB | Stock Company |
| ADR | American Depositary Receipt |
| AG | Stock Corporation |
| CVA | Dutch Certificate |
| ETF | Exchange Traded Fund |
| GDR | Global Depositary Receipt |
| KGaA | Limited Partnership with shares |
| Ltd. | Limited |
| NV | Public Traded Company |
| OAO | Joint Stock Company |
| OJSC | Open Joint Stock Company |
| OYJ | Public Traded Company |
| PLC | Public Limited Company |
| RE | Reinsured |
| REG | Registered Shares |
| SA | Stock Company |
| SCA | Limited partnership with share capital |
| SE | European Public Limited Liability Company |
At January 31, 2014, the Fund’s open forward foreign currency contracts against the United States Dollar were as follows (Note 2):
| Currency | Counterparty | Delivery Date | Currency Delivered | Contract Value | Market Value | Unrealized Appreciation/ (Depreciation) | ||||||||||||||||
Short Contracts: | ||||||||||||||||||||||
| Japanese Yen | Brown Brothers Harriman & Co. | 3/19/14 | (2,000,000,000 | ) | $ | (19,513,337 | ) | $ | (19,579,186 | ) | $ | (65,849 | ) | |||||||||
|
|
|
|
|
| |||||||||||||||||
The accompanying notes are an integral part of these financial statements.
29
Statement of Assets and Liabilities
January 31, 2014 (Unaudited)
Nationwide Bailard International Equities Fund | ||||||
Assets: | ||||||
Investments, at value (cost $199,160,256) | $ | 245,233,503 | ||||
Cash | 1,940 | |||||
Foreign currencies, at value (cost $44,732) | 44,336 | |||||
Dividends receivable | 209,052 | |||||
Receivable for investments sold | 6,554,850 | |||||
Receivable for capital shares issued | 382,870 | |||||
Reclaims receivable | 292,214 | |||||
Prepaid expenses | 16,416 | |||||
|
| |||||
Total Assets | 252,735,181 | |||||
|
| |||||
Liabilities: | ||||||
Payable for investments purchased | 9,118,073 | |||||
Payable for capital shares redeemed | 131,129 | |||||
Unrealized depreciation on forward foreign currency contracts (Note 2) | 65,849 | |||||
Accrued expenses and other payables: | ||||||
Investment advisory fees | 157,729 | |||||
Fund administration fees | 14,118 | |||||
Distribution fees | 2,178 | |||||
Administrative servicing fees | 53,409 | |||||
Accounting and transfer agent fees | 6,568 | |||||
Trustee fees | 2,840 | |||||
Deferred compensation (Note 2) | 15,375 | |||||
Custodian fees | 8,880 | |||||
Compliance program costs (Note 3) | 1,548 | |||||
Professional fees | 15,940 | |||||
Printing fees | 5,697 | |||||
Other | 4,793 | |||||
|
| |||||
Total Liabilities | 9,604,126 | |||||
| �� |
|
| ||||
Net Assets | $ | 243,131,055 | ||||
|
| |||||
Represented by: | ||||||
Capital | $ | 232,875,787 | ||||
Accumulated undistributed net investment income | 121,824 | |||||
Accumulated net realized losses from investment, futures, forward and foreign currency transactions | (35,887,645 | ) | ||||
Net unrealized appreciation/(depreciation) from investments | 46,073,247 | |||||
Net unrealized appreciation/(depreciation) from forward foreign currency contracts (Note 2) | (65,849 | ) | ||||
Net unrealized appreciation/(depreciation) from translation of assets and liabilities denominated in foreign currencies | 13,691 | |||||
|
| |||||
Net Assets | $ | 243,131,055 | ||||
|
| |||||
30
Statement of Assets and Liabilities (Continued)
January 31, 2014 (Unaudited)
Nationwide Bailard International Equities Fund | ||||||
Net Assets: | ||||||
Class A Shares | $ | 3,348,264 | ||||
Class C Shares | 1,685,102 | |||||
Class M Shares | 166,070,585 | |||||
Institutional Service Class Shares | 72,016,790 | |||||
Institutional Class Shares | 10,314 | |||||
|
| |||||
Total | $ | 243,131,055 | ||||
|
| |||||
Shares Outstanding (unlimited number of shares authorized): | ||||||
Class A Shares | 419,015 | |||||
Class C Shares | 211,350 | |||||
Class M Shares | 20,821,154 | |||||
Institutional Service Class Shares | 9,033,804 | |||||
Institutional Class Shares | 1,294 | |||||
|
| |||||
Total | 30,486,617 | |||||
|
| |||||
Net asset value and redemption price per share (Net assets by class divided by shares outstanding by class, respectively): | ||||||
Class A Shares (a) | $ | 7.99 | ||||
Class C Shares (b) | $ | 7.97 | ||||
Class M Shares | $ | 7.98 | ||||
Institutional Service Class Shares | $ | 7.97 | ||||
Institutional Class Shares | $ | 7.97 | ||||
Maximum offering price per share (100%/(100%-maximum sales charge) of net asset value adjusted to the nearest cent): | ||||||
Class A Shares | $ | 8.48 | ||||
|
| |||||
Maximum Sales Charge: | ||||||
Class A Shares | 5.75 | % | ||||
|
| |||||
| (a) | For Class A Shares, the redemption price per share is reduced by 1.00% on sales of shares of original purchases of $1,000,000 or more or that were not subject to a front-end sales charge made with 18 months of the purchase date. |
| (b) | For Class C Shares, the redemption price per share is reduced by 1.00% for shares held less than 1 year. |
The accompanying notes are an integral part of these financial statements.
31
Statement of Operations
For the Six Months Ended January 31, 2014 (Unaudited)
Nationwide Bailard Equities Fund | ||||||
INVESTMENT INCOME: | ||||||
Dividend income | $ | 2,214,885 | ||||
Foreign tax withholding | (171,566 | ) | ||||
|
| |||||
Total Income | 2,043,319 | |||||
|
| |||||
EXPENSES: | ||||||
Investment advisory fees | 886,156 | |||||
Fund administration fees | 103,079 | |||||
Distribution fees Class A | 5,132 | |||||
Distribution fees Class C | 6,790 | |||||
Administrative servicing fees Class A | 5,132 | |||||
Administrative servicing fees Institutional Service Class (a) | 83,457 | |||||
Registration and filing fees | 25,727 | |||||
Professional fees | 24,026 | |||||
Printing fees | 11,907 | |||||
Trustee fees | 4,237 | |||||
Custodian fees | 21,752 | |||||
Accounting and transfer agent fees | 11,600 | |||||
Compliance program costs (Note 3) | 1,866 | |||||
Other | 17,588 | |||||
|
| |||||
Total expenses before earnings credit, fees waived, and expenses reimbursed | 1,208,449 | |||||
|
| |||||
Earnings credit (Note 5) | (109 | ) | ||||
Administrative servicing fees voluntarily waived – Class A (Note 3) | (1,055 | ) | ||||
Administrative servicing fees voluntarily waived – Institutional Service Class (a) (Note 3) | (7,733 | ) | ||||
Expenses reimbursed by adviser (Note 3) | (5,050 | ) | ||||
|
| |||||
Net Expenses | 1,194,502 | |||||
|
| |||||
NET INVESTMENT INCOME | 848,817 | |||||
|
| |||||
REALIZED/UNREALIZED GAINS (LOSSES) FROM INVESTMENTS: | ||||||
Net realized gains from investment transactions† | 6,597,033 | |||||
Net realized gains from futures transactions (Note 2) | 114,341 | |||||
Net realized gains from forward and foreign currency transactions (Note 2) | 568,381 | |||||
|
| |||||
Net realized gains from investment, futures, forward and foreign currency transactions | 7,279,755 | |||||
|
| |||||
Net change in unrealized appreciation/(depreciation) from investments | 13,735,260 | |||||
Net change in unrealized appreciation/(depreciation) from futures contracts (Note 2) | (84,595 | ) | ||||
Net change in unrealized appreciation/(depreciation) from forward foreign currency contracts (Note 2) | 217,199 | |||||
Net change in unrealized appreciation/(depreciation) from translation of assets and liabilities denominated in foreign currencies | (6,801 | ) | ||||
|
| |||||
Net change in unrealized appreciation/(depreciation) from investments, futures contracts, forward foreign currency contracts, and translation of assets and liabilities denominated in foreign currencies | 13,861,063 | |||||
|
| |||||
Net realized/unrealized gains from investment, futures, forward and foreign currency transactions, and translation of assets and liabilities denominated in foreign currencies | 21,140,818 | |||||
|
| |||||
CHANGE IN NET ASSETS RESULTING FROM OPERATIONS | $ | 21,989,635 | ||||
|
| |||||
| (a) | Effective September 16, 2013, Fiduciary Shares were renamed Institutional Service Class Shares. |
| † | Net of capital gain country taxes of $11,963. |
The accompanying notes are an integral part of these financial statements.
32
Statements of Changes in Net Assets
| Nationwide Bailard International Equities Fund | ||||||||||||
| Six Months Ended January 31, 2014 (Unaudited) | Year Ended July 31, 2013 | |||||||||||
Operations: | ||||||||||||
Net investment income | $ | 848,817 | $ | 4,674,601 | ||||||||
Net realized gains from investment, futures, forward and foreign currency transactions | 7,279,755 | 12,360,956 | ||||||||||
Net change in unrealized appreciation/(depreciation) from investments, futures contracts, forward foreign currency contracts, and translation of assets and liabilities denominated in foreign currencies | 13,861,063 | 21,360,062 | ||||||||||
|
|
|
| |||||||||
Change in net assets resulting from operations | 21,989,635 | 38,395,619 | ||||||||||
|
|
|
| |||||||||
Distributions to Shareholders From: | ||||||||||||
Net investment income: | ||||||||||||
Class A | (81,222 | ) | (50,144 | ) | ||||||||
Class C | (17,079 | ) | (7,450 | ) | ||||||||
Class M | (3,735,701 | ) | (2,633,788 | ) | ||||||||
Institutional Service Class (a) | (1,435,087 | ) | (1,189,568 | ) | ||||||||
Institutional Class | (231 | )(b) | – | |||||||||
|
|
|
| |||||||||
Change in net assets from shareholder distributions | (5,269,320 | ) | (3,880,950 | ) | ||||||||
|
|
|
| |||||||||
Change in net assets from capital transactions | 11,936,749 | (10,857,206 | ) | |||||||||
|
|
|
| |||||||||
Change in net assets | 28,657,064 | 23,657,463 | ||||||||||
|
|
|
| |||||||||
Net Assets: | ||||||||||||
Beginning of period | 214,473,991 | 190,816,528 | ||||||||||
|
|
|
| |||||||||
End of period | $ | 243,131,055 | $ | 214,473,991 | ||||||||
|
|
|
| |||||||||
Accumulated undistributed net investment income at end of period | $ | 121,824 | $ | 4,542,327 | ||||||||
|
|
|
| |||||||||
CAPITAL TRANSACTIONS: | ||||||||||||
Class A Shares | ||||||||||||
Proceeds from shares issued | $ | 767,402 | $ | 1,714,811 | (c) | |||||||
Dividends reinvested | 75,925 | 43,775 | ||||||||||
Cost of shares redeemed | (2,036,910 | ) | (1,484,760 | ) | ||||||||
|
|
|
| |||||||||
Total Class A Shares | (1,193,583 | ) | 273,826 | |||||||||
|
|
|
| |||||||||
Class C Shares | ||||||||||||
Proceeds from shares issued | 566,645 | 141,363 | (c) | |||||||||
Dividends reinvested | 15,435 | 6,555 | ||||||||||
Cost of shares redeemed | (148,693 | ) | (363,280 | ) | ||||||||
|
|
|
| |||||||||
Total Class C Shares | 433,387 | (215,362 | ) | |||||||||
|
|
|
| |||||||||
Class M Shares | ||||||||||||
Proceeds from shares issued | 8,400,427 | 14,021,008 | (c) | |||||||||
Dividends reinvested | 3,344,102 | 2,300,833 | ||||||||||
Cost of shares redeemed | (5,867,483 | ) | (13,903,604 | ) | ||||||||
|
|
|
| |||||||||
Total Class M Shares | 5,877,046 | 2,418,237 | ||||||||||
|
|
|
| |||||||||
| (a) | Effective September 16, 2013, Fiduciary Shares were renamed Institutional Service Class Shares. |
| (b) | For the period from September 19, 2013 (commencement of operations) through January 31, 2014. |
| (c) | Includes redemption fees. See Note 4 for further information. |
33
Statements of Changes in Net Assets (Continued)
| Nationwide Bailard International Equities Fund | ||||||||||||
| Six Months Ended January 31, 2014 (Unaudited) | Year Ended July 31, 2013 | |||||||||||
CAPITAL TRANSACTIONS: (continued) | ||||||||||||
Institutional Service Class Shares (a) | ||||||||||||
Proceeds from shares issued | $ | 12,306,414 | $ | 18,806,412 | (c) | |||||||
Dividends reinvested | 491,055 | 460,313 | ||||||||||
Cost of shares redeemed | (5,987,801 | ) | (32,600,632 | ) | ||||||||
|
|
|
| |||||||||
Total Institutional Service Class Shares | 6,809,668 | (13,333,907 | ) | |||||||||
|
|
|
| |||||||||
Institutional Class Shares | ||||||||||||
Proceeds from shares issued | 10,000 | (b) | – | |||||||||
Dividends reinvested | 231 | (b) | – | |||||||||
Cost of shares redeemed | – | (b) | – | |||||||||
|
|
|
| |||||||||
Total Institutional Class Shares | 10,231 | (b) | – | |||||||||
|
|
|
| |||||||||
Change in net assets from capital transactions | $ | 11,936,749 | $ | (10,857,206 | ) | |||||||
|
|
|
| |||||||||
SHARE TRANSACTIONS: | ||||||||||||
Class A Shares | ||||||||||||
Issued | 94,246 | 242,887 | ||||||||||
Reinvested | 9,598 | 6,353 | ||||||||||
Redeemed | (253,554 | ) | (208,284 | ) | ||||||||
|
|
|
| |||||||||
Total Class A Shares | (149,710 | ) | 40,956 | |||||||||
|
|
|
| |||||||||
Class C Shares | ||||||||||||
Issued | 69,777 | 19,970 | ||||||||||
Reinvested | 1,954 | 954 | ||||||||||
Redeemed | (18,456 | ) | (52,939 | ) | ||||||||
|
|
|
| |||||||||
Total Class C Shares | 53,275 | (32,015 | ) | |||||||||
|
|
|
| |||||||||
Class M Shares | ||||||||||||
Issued | 1,072,452 | 1,959,519 | ||||||||||
Reinvested | 423,841 | 335,398 | ||||||||||
Redeemed | (739,986 | ) | (1,942,751 | ) | ||||||||
|
|
|
| |||||||||
Total Class M Shares | 756,307 | 352,166 | ||||||||||
|
|
|
| |||||||||
Institutional Service Class Shares (a) | ||||||||||||
Issued | 1,556,889 | 2,671,833 | ||||||||||
Reinvested | 62,238 | 67,003 | ||||||||||
Redeemed | (766,125 | ) | (4,608,686 | ) | ||||||||
|
|
|
| |||||||||
Total Institutional Service Class Shares | 853,002 | (1,869,850 | ) | |||||||||
|
|
|
| |||||||||
Institutional Class Shares | ||||||||||||
Issued | 1,265 | (b) | – | |||||||||
Reinvested | 29 | (b) | – | |||||||||
Redeemed | – | (b) | – | |||||||||
|
|
|
| |||||||||
Total Institutional Class Shares | 1,294 | (b) | – | |||||||||
|
|
|
| |||||||||
Total change in shares | 1,514,168 | (1,508,743 | ) | |||||||||
|
|
|
| |||||||||
Amounts designated as “–” are zero or have been rounded to zero.
| (a) | Effective September 16, 2013, Fiduciary Shares were renamed Institutional Service Class Shares. |
| (b) | For the period from September 19, 2013 (commencement of operations) through January 31, 2014. |
| (c) | Includes redemption fees. See Note 4 for further information. |
The accompanying notes are an integral part of these financial statements.
34
Financial Highlights
Selected data for each share of capital outstanding throughout the periods indicated
Nationwide Bailard International Equities Fund
| Operations | Distributions | Ratios/Supplemental Data | ||||||||||||||||||||||||||||||||||||||||||||||||||||||||||
Net Asset of Period | Net Investment Income (Loss) | Net Realized Gains (Losses) Investments | Total from Operations | Net Investment Income | Net Realized Gains | Total Distributions | Redemption Fees | Net Asset Value, End | Total Return (a)(b) | Net Assets Period | Ratio of to Average Net Assets (c) | Ratio of Net Net Assets (c) | Ratio of Expenses to Average Net Assets (c)(d) | Portfolio Turnover (e) | ||||||||||||||||||||||||||||||||||||||||||||||
| Class A Shares | ||||||||||||||||||||||||||||||||||||||||||||||||||||||||||||
Six Months Ended January 31, 2014 | $ | 7.41 | 0.01 | 0.73 | 0.74 | (0.16 | ) | – | (0.16 | ) | – | $ | 7.99 | 10.00% | $ | 3,348,264 | 1.39% | 0.36% | 1.44% | 39.38% | ||||||||||||||||||||||||||||||||||||||||
Year Ended July 31, 2013 (f) | $ | 6.27 | 0.14 | 1.11 | 1.25 | (0.11 | ) | – | (0.11 | ) | – | $ | 7.41 | 20.04% | $ | 4,216,776 | 1.38% | 1.94% | 1.58% | 97.00% | ||||||||||||||||||||||||||||||||||||||||
Year Ended July 31, 2012 (f) | $ | 7.45 | 0.13 | (1.15 | ) | (1.02 | ) | (0.16 | ) | – | (0.16 | ) | – | $ | 6.27 | (13.57% | ) | $ | 3,306,852 | 1.49% | 2.04% | 1.67% | 102.00% | |||||||||||||||||||||||||||||||||||||
Year Ended July 31, 2011 (f) | $ | 6.32 | 0.11 | 1.14 | 1.25 | (0.12 | ) | – | (0.12 | ) | – | $ | 7.45 | 20.05% | $ | 5,066,564 | 1.62% | 1.52% | 1.77% | 95.00% | ||||||||||||||||||||||||||||||||||||||||
Year Ended July 31, 2010 (f) | $ | 5.98 | 0.08 | 0.40 | 0.48 | (0.14 | ) | – | (0.14 | ) | – | $ | 6.32 | 8.04% | $ | 6,692,942 | 1.60% | 1.28% | 1.78% | 84.00% | ||||||||||||||||||||||||||||||||||||||||
Year Ended July 31, 2009 (f) | $ | 8.45 | 0.11 | (2.34 | ) | (2.23 | ) | (0.10 | ) | (0.14 | ) | (0.24 | ) | – | $ | 5.98 | (25.77% | ) | $ | 10,003,501 | 1.57% | 1.92% | 1.81% | 134.00% | ||||||||||||||||||||||||||||||||||||
| Class C Shares | ||||||||||||||||||||||||||||||||||||||||||||||||||||||||||||
Six Months Ended | $ | 7.37 | (0.01 | ) | 0.72 | 0.71 | (0.11 | ) | – | (0.11 | ) | – | $ | 7.97 | 9.62% | $ | 1,685,102 | 1.93% | (0.20% | ) | 1.93% | 39.38% | ||||||||||||||||||||||||||||||||||||||
Year Ended July 31, 2013 (f) | $ | 6.22 | 0.09 | 1.11 | 1.20 | (0.05 | ) | – | (0.05 | ) | – | $ | 7.37 | 19.28% | $ | 1,164,820 | 2.08% | 1.24% | 2.08% | 97.00% | ||||||||||||||||||||||||||||||||||||||||
Year Ended July 31, 2012 (f) | $ | 7.37 | 0.08 | (1.13 | ) | (1.05 | ) | (0.10 | ) | – | (0.10 | ) | – | $ | 6.22 | (14.07% | ) | $ | 1,181,621 | 2.17% | 1.36% | 2.17% | 102.00% | |||||||||||||||||||||||||||||||||||||
Year Ended July 31, 2011 (f) | $ | 6.26 | 0.06 | 1.13 | 1.19 | (0.08 | ) | – | (0.08 | ) | – | $ | 7.37 | 19.16% | $ | 2,289,773 | 2.27% | 0.87% | 2.27% | 95.00% | ||||||||||||||||||||||||||||||||||||||||
Year Ended July 31, 2010 (f) | $ | 5.92 | 0.04 | 0.39 | 0.43 | (0.09 | ) | – | (0.09 | ) | – | $ | 6.26 | 7.39% | $ | 1,974,951 | 2.28% | 0.60% | 2.28% | 84.00% | ||||||||||||||||||||||||||||||||||||||||
Year Ended July 31, 2009 (f) | $ | 8.35 | 0.07 | (2.30 | ) | (2.23 | ) | (0.06 | ) | (0.14 | ) | (0.20 | ) | – | $ | 5.92 | (26.34% | ) | $ | 2,217,072 | 2.27% | 1.22% | 2.31% | 134.00% | ||||||||||||||||||||||||||||||||||||
| Class M Shares | ||||||||||||||||||||||||||||||||||||||||||||||||||||||||||||
Six Months Ended January 31, 2014 | $ | 7.40 | 0.03 | 0.73 | 0.76 | (0.18 | ) | – | (0.18 | ) | – | $ | 7.98 | 10.34% | $ | 166,070,585 | 0.93% | 0.80% | 0.94% | 39.38% | ||||||||||||||||||||||||||||||||||||||||
Year Ended July 31, 2013 (f) | $ | 6.26 | 0.16 | 1.12 | 1.28 | (0.14 | ) | – | (0.14 | ) | – | $ | 7.40 | 20.53% | $ | 148,561,732 | 1.08% | 2.24% | 1.08% | 97.00% | ||||||||||||||||||||||||||||||||||||||||
Year Ended July 31, 2012 (f) | $ | 7.47 | 0.15 | (1.16 | ) | (1.01 | ) | (0.20 | ) | – | (0.20 | ) | – | $ | 6.26 | (13.28% | ) | $ | 123,438,593 | 1.17% | 2.36% | 1.17% | 102.00% | |||||||||||||||||||||||||||||||||||||
Year Ended July 31, 2011 (f) | $ | 6.34 | 0.13 | 1.15 | 1.28 | (0.15 | ) | – | (0.15 | ) | – | $ | 7.47 | 20.39% | $ | 150,887,844 | 1.27% | 1.87% | 1.27% | 95.00% | ||||||||||||||||||||||||||||||||||||||||
Year Ended July 31, 2010 (f) | $ | 6.00 | 0.10 | 0.40 | 0.50 | (0.16 | ) | – | (0.16 | ) | – | $ | 6.34 | 8.31% | $ | 133,320,908 | 1.28% | 1.60% | 1.28% | 84.00% | ||||||||||||||||||||||||||||||||||||||||
Year Ended July 31, 2009 (f) | $ | 8.48 | 0.12 | (2.34 | ) | (2.22 | ) | (0.12 | ) | (0.14 | ) | (0.26 | ) | – | $ | 6.00 | (25.55% | ) | $ | 134,220,243 | 1.27% | 2.22% | 1.31% | 134.00% | ||||||||||||||||||||||||||||||||||||
| Institutional Service Class Shares (g) | ||||||||||||||||||||||||||||||||||||||||||||||||||||||||||||
Six Months Ended January 31, 2014 | $ | 7.40 | 0.02 | 0.72 | 0.74 | (0.17 | ) | – | (0.17 | ) | – | $ | 7.97 | 10.05% | $ | 72,016,790 | 1.16% | 0.57% | 1.19% | 39.38% | ||||||||||||||||||||||||||||||||||||||||
Year Ended July 31, 2013 (f) | $ | 6.26 | 0.15 | 1.11 | 1.26 | (0.12 | ) | – | (0.12 | ) | – | $ | 7.40 | 20.34% | $ | 60,530,663 | 1.21% | 2.11% | 1.33% | 97.00% | ||||||||||||||||||||||||||||||||||||||||
Year Ended July 31, 2012 (f) | $ | 7.46 | 0.14 | (1.16 | ) | (1.02 | ) | (0.18 | ) | – | (0.18 | ) | – | $ | 6.26 | (13.35% | ) | $ | 62,889,462 | 1.31% | 2.21% | 1.42% | 102.00% | |||||||||||||||||||||||||||||||||||||
Year Ended July 31, 2011 (f) | $ | 6.33 | 0.12 | 1.15 | 1.27 | (0.14 | ) | – | (0.14 | ) | – | $ | 7.46 | 20.25% | $ | 93,100,614 | 1.45% | 1.69% | 1.52% | 95.00% | ||||||||||||||||||||||||||||||||||||||||
Year Ended July 31, 2010 (f) | $ | 6.00 | 0.09 | 0.39 | 0.48 | (0.15 | ) | – | (0.15 | ) | – | $ | 6.33 | 8.03% | $ | 79,236,673 | 1.44% | 1.44% | 1.53% | 84.00% | ||||||||||||||||||||||||||||||||||||||||
Year Ended July 31, 2009 (f) | $ | 8.48 | 0.11 | (2.34 | ) | (2.23 | ) | (0.11 | ) | (0.14 | ) | (0.25 | ) | – | $ | 6.00 | (25.64% | ) | $ | 63,644,211 | 1.39% | 2.10% | 1.56% | 134.00% | ||||||||||||||||||||||||||||||||||||
| Institutional Class Shares | ||||||||||||||||||||||||||||||||||||||||||||||||||||||||||||
Period Ended January 31, 2014 | $ | 7.91 | 0.02 | 0.22 | 0.24 | (0.18 | ) | – | (0.18 | ) | – | $ | 7.97 | 3.09% | $ | 10,314 | 0.88% | 0.77% | 0.88% | 39.38% | ||||||||||||||||||||||||||||||||||||||||
Amounts designated as “–” are zero or have been rounded to zero.
| (a) | Excludes sales charge. |
| (b) | Not annualized for periods less than one year. |
| (c) | Annualized for periods less than one year. |
| (d) | During the period, certain fees may have been waived and/or reimbursed. If such waivers/reimbursements had not occurred, the ratios would have been as indicated. |
| (e) | Portfolio turnover is calculated on the basis of the Fund as a whole without distinguishing among the classes of shares. |
| (f) | Per share calculations were performed using average shares method. |
| (g) | Effective September 16, 2013, Fiduciary Shares were renamed Institutional Service Class Shares. |
| (h) | For the period from September 19, 2013 (commencement of operations) through January 31, 2014. Total return is calculated based on inception date of September 18, 2013 through January 31, 2014. |
The accompanying notes are an integral part of these financial statements.
35
| Fund Commentary | Nationwide Bailard Technology & Science Fund |
For the semiannual period ended January 31, 2014, the Nationwide Bailard Technology & Science Fund (Class M at NAV) returned 14.85%* versus 14.78% for its primary benchmark, the NASDAQ-100 Index and 14.02% for its secondary benchmark, the S&P North American Technology Sector IndexTM. For broader comparison, the median return for the Fund’s closest Lipper peer category of Science & Technology Funds (consisting of 155 funds as of January 31, 2014) was 14.94% for the same time period.
*Performance prior to the Fund’s inception on September 16, 2013, is based on the performance of the Fund’s predecessor fund.
Portfolio Performance and Return Drivers
During the reporting period, the Fund’s performance against the NASDAQ-100 Index was aided by allocation but held back by stock selection. The Fund’s overweight position to software and services was accretive; however, selection within the industry detracted, particularly an underweight position to Facebook. Fund holding IBM also was a laggard despite already depressed valuations as the firm continued to struggle with slowing growth in major product lines. The Fund’s overweight positions in smaller software companies Aspen Technology and Manhattan Associates aided selection as both firms continued to outperform expectations. Fund holdings LSI and Responsys were both acquired (by Avago and Oracle, respectively) benefitting performance during the reporting period.
Stock selection in biotechnology also was helpful for Fund performance during the reporting period as the Fund’s health-care exposure posted a return of 26.7% for the reporting period against the NASDAQ Biotechnology Index (a modified market capitalization-weighted index comprising approximately 120 members), which rose 24.5% during the reporting period. The Fund’s overweight bets in Enanta, Gilead, Biogen and Incyte Corp. were the largest contributors to Fund performance during the reporting period. The Fund had a small overweight exposure to ARIAD Pharmaceuticals that moderately hindered Fund performance.
Market Commentary
Technology stocks continued to enjoy the overall strength in equity markets, posting solid gains during the reporting period. In particular, growth technology has continued to power forward despite sky-high valuations, buoyed by solid returns from standouts Facebook and Yelp and a number of successful initial public offerings (IPOs). SAAS (Software-as-a-Service) companies continue to demand a hefty premium, in our opinion only justified in a few select cases. A small sell-off in January provided an interesting data point should the market experience continued near-term volatility.
Biotechnology stocks (as measured by the NASDAQ Biotechnology Index) rose in dramatic fashion during the reporting period. Large-cap stocks moved higher as Gilead released positive clinical data related to its Hepatitis C Virus (HCV) program, and Biogen’s script data for its new Multiple Sclerosis drug continued to impress. While there were no significant signs of the financing window closing, there was a blip on the radar when ARIAD Pharmaceuticals announced that it had discovered a cardiovascular toxicity linked to its oncology drug Iclusig™. This announcement led to an 85% drop in the stock price. Still, the sector held on to the positive tailwinds of various clinical successes and the positive financing environment.
Outlook and Positioning
Investors are starved for organic growth and the technology sector is benefiting. High growth valuations have been bid up, in some cases to unjustifiable levels, while more-stable companies have lagged their counterparts. We believe this leads to opportunity as valuation differentials contract. We are pleased to have kept pace during the reporting period, given our preference for earnings quality and free cash flow, and remain diligent in identifying quality companies to add to the portfolio. Significant downside exists for high growth companies when expectations are missed, as slight changes in growth multiples can have large ramifications on overall company valuation. We believe that an emphasis on process and quality is particularly important in this environment.
36
| Fund Commentary (con’t.) | Nationwide Bailard Technology & Science Fund |
Our long-term belief is that a healthy financing/IPO window is what makes the innovation engine run, and over the longer term we expect that this innovation will allow biotechnology to outpace other sectors of the market with respect to growth. We remain vigilant, however, concerning certain sector observations: IPOs of biotechnology companies with little to no clinical data are sporting valuations of nearly $1 billion, and sell-side expectations are increasingly based on higher multiples and clinical success rates as valuations outgrow their “more conservative” discounted cash flow (DCF) estimates. This trend is likely a byproduct of generalist money coming to the table and is something we need to watch carefully, as the historical success rates of biotechnology products are low and clinical-trial failures are often just as spectacularly negative as their positive counterparts—as we witnessed with ARIAD. The Fund held no derivatives during the period.
Subadviser:
Bailard, Inc.
Portfolio Manager:
Sonya Thadhani
The Fund is subject to the risks of investing in equity securities, including new public companies. Growth funds may underperform other funds that use different investing styles. Funds that concentrate on specific sectors may be subject to greater volatility than that of other mutual funds. The Fund may invest in more-aggressive investments such as derivatives (many of which create investment leverage and are highly volatile) and foreign securities (which are volatile, harder to price and less liquid than U.S. securities). Please refer to the summary prospectus for a more detailed explanation of the Fund’s principal risks.
A description of the benchmarks can be found on the Market Index Definitions page at the back of this book.
37
| Fund Overview (Unaudited) | Nationwide Bailard Technology & Science Fund |
Objective
The Fund seeks long-term capital appreciation.
Highlights
| Ÿ | For the semiannual period ended January 31, 2014, the Fund (Class M at NAV) returned 14.85%, outperforming the primary benchmark by 0.07% and underperforming the Lipper peer category by 0.09%. |
| Ÿ | Technology stocks continued to enjoy the overall strength in equity markets during the reporting period, posting solid gains. |
| Ÿ | The Fund’s performance against the NASDAQ-100 Index during the reporting period was aided by allocation but held back by stock selection. |
Asset Allocation†
| Common Stocks | 98.9% | |||
| Mutual Fund | 0.8% | |||
| Exchange Traded Fund | 0.4% | |||
| Liabilities in excess of other assets | (0.1)% | |||
| 100.0% |
Top Industries††
| Software | 15.9% | |||
| Internet Software & Services | 15.4% | |||
| Computers & Peripherals | 14.8% | |||
| Semiconductors & Semiconductor Equipment | 14.4% | |||
| Information Technology Services | 12.7% | |||
| Communications Equipment | 7.9% | |||
| Biotechnology | 7.1% | |||
| Internet & Catalog Retail | 4.0% | |||
| Electronic Equipment, Instruments & Components | 3.6% | |||
| Media | 1.1% | |||
| Other Industries | 3.1% | |||
| 100.0% |
Top Holdings††
| Google, Inc., Class A | 6.9% | |||
| Apple, Inc. | 6.5% | |||
| Microsoft Corp. | 3.5% | |||
| QUALCOMM, Inc. | 2.9% | |||
| Cisco Systems, Inc. | 2.7% | |||
| Oracle Corp. | 2.0% | |||
| eBay, Inc. | 1.9% | |||
| Facebook, Inc., Class A | 1.9% | |||
| International Business Machines Corp. | 1.8% | |||
| Amazon.com, Inc. | 1.7% | |||
| Other Holdings | 68.2% | |||
| 100.0% |
| † | Percentages indicated are based upon net assets as of January 31, 2014. |
| †† | Percentages indicated are based upon total investments as of January 31, 2014. |
38
| Fund Performance | Nationwide Bailard Technology & Science Fund |
Average Annual Total Return
(For periods ended January 31, 2014)
| Six Months* | 1 Yr. | 5 Yr. | 10 Yr. | |||||||||||||||
| Class A | w/o SC1 | 14.66% | 28.86% | 21.75% | 6.43% | |||||||||||||
| w/SC2 | 8.32% | 19.89% | 20.37% | 5.83% | ||||||||||||||
| Class C | w/o SC1 | 14.29% | 26.06% | 20.98% | 5.83% | |||||||||||||
| w/SC3 | 13.29% | 25.06% | 20.98% | 5.83% | ||||||||||||||
| Class M4 | w/o SC | 14.85% | 27.30% | 22.19% | 6.88% | |||||||||||||
| Institutional Service Class4,5 | w/o SC | 14.84% | 27.23% | 22.17% | 6.79% | |||||||||||||
| Institutional Class4 | w/o SC | 9.66% | 6 | — | — | — | ||||||||||||
All figures showing the effect of a sales charge (SC) reflect the maximum charge possible, because it has the most significant effect on performance data.
| * | Not annualized. |
| 1 | These returns do not reflect the effects of SCs. |
| 2 | For the period from September 16, 2013 through January 31, 2014 a front-end sales charge of 5.75% was deducted. Prior to September 16, 2013, a front-end sales charge of 5.50% was deducted. |
| 3 | A 1.00% CDSC was deducted from the one year return because it is charged when you sell Class C shares within the first year after purchase. |
| 4 | Not subject to any SCs. |
| 5 | Effective September 16, 2013 Fiduciary Shares were renamed Institutional Service Class Shares. |
| 6 | Since inception date of September 18, 2013. Not Annualized. |
Expense Ratios
| Gross Expense Ratio* | Net Expense Ratio* | |||||||
| Class A | 1.53% | 1.45% | ||||||
| Class C | 2.03% | 2.03% | ||||||
| Class M | 1.03% | 1.03% | ||||||
| Institutional Service Class | 1.28% | 1.20% | ||||||
| Institutional Class | 1.03% | 1.03% | ||||||
| * | Current effective prospectus dated September 16, 2013. The difference between gross and net operating expenses reflects contractual waivers in place through November 30, 2015. Please see the Fund’s most recent prospectus for details. |
39
| Fund Performance | Nationwide Bailard Technology & Science Fund |
Performance of a $10,000 Investment
Investment return and principal value will fluctuate, and when redeemed, shares may be worth more or less than original cost. Past performance is no guarantee of future results and does not reflect the deduction of taxes that a shareholder would pay on fund distributions or the redemption of fund shares. Investing in mutual funds involves market risk, including loss of principal. Performance returns assume the reinvestment of all distributions.
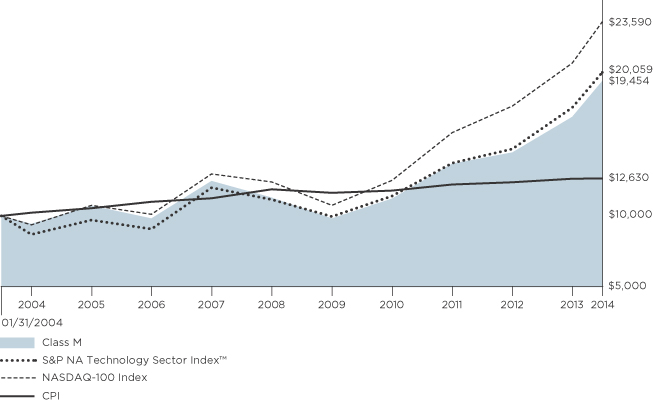
Comparative performance of $10,000 invested in Class M shares of the Nationwide Bailard Technology & Science Fund versus the S&P North American (NA) Technology Sector IndexTM, the NASDAQ-100 Index and the Consumer Price Index (CPI) over the 10-year period ended 1/31/14. Fund performance prior to the Fund’s inception on 9/16/13 is based on the Fund’s predecessor Fund. Unlike the Fund, the performance for these unmanaged indexes does not reflect any fees, expenses, or sales charges. One cannot invest directly in a market index. A description of the benchmarks can be found on the Market Index Definitions page at the back of this book.
40
| Shareholder Expense Example | Nationwide Bailard Technology & Science Fund |
As a shareholder of the Fund, you incur two types of costs: (1) transaction costs, including sales charges (loads) paid on purchase payments and redemption fees; and (2) ongoing costs, including investment advisory fees, administration fees, distribution fees and other Fund expenses. The examples below are intended to help you understand your ongoing costs (in dollars) of investing in the Fund and to compare these costs with the ongoing costs of investing in other mutual funds. Per Securities and Exchange Commission (“SEC”) requirements, the examples assume that you had a $1,000 investment in the Class at the beginning of the reporting period (August 1, 2013) and continued to hold your shares at the end of the reporting period (January 31, 2014).
Actual Expenses
For each Class of the Fund in the table below, the first line provides information about actual account values and actual expenses. You may use the information in this line, together with the amount you invested, to estimate the expenses that you paid from August 1, 2013 through January 31, 2014. Simply divide your account value by $1,000 (for example, an $8,600 account value divided by $1,000 = 8.6), then multiply the result by the number in the first line of each Class under the heading entitled “Expenses Paid During Period” to estimate the expenses you paid on your account during this period.
Hypothetical Expenses for Comparison Purposes
The second line of each Class in the table below provides information about hypothetical account values and hypothetical expenses based on the Class’ actual expense ratio and an assumed rate of return of 5% per year before expenses, which is not the Class’ actual return. The hypothetical account values and expenses may not be used to estimate the actual ending account balance or expenses you paid for the period from August 1, 2013 through January 31, 2014. You may use this information to compare the ongoing costs of investing in the Class of the Fund and other funds. To do so, compare this 5% hypothetical example with the 5% hypothetical examples that appear in the shareholder reports of the other funds.
Please note that the expenses shown in the table are meant to highlight your ongoing costs only and do not reflect any transaction costs, such as sales charges (loads) or redemption fees. If these transaction costs were included, your costs would have been higher. Therefore, the second line for each Class in the table is useful in comparing ongoing costs only, and will not help you determine the relative total costs of owning different funds. The examples also assume all dividends and distributions are reinvested.
Schedule of Shareholder Expenses
Expense Analysis of a $1,000 Investment
Nationwide Bailard Technology & January 31, 2014 | Beginning Account Value ($) 08/01/13 | Ending Account Value ($) 01/31/14 | Expenses Paid During Period ($) 08/01/13 - 01/31/14 | Expense Ratio During Period (%) 08/01/13 - 01/31/14 | ||||||||
| Class A Shares | Actual | a | 1,000.00 | 1,146.60 | 7.63 | 1.41 | ||||||
| Hypothetical | a,b | 1,000.00 | 1,018.10 | 7.17 | 1.41 | |||||||
| Class C Shares | Actual | a | 1,000.00 | 1,142.90 | 10.80 | 2.00 | ||||||
| Hypothetical | a,b | 1,000.00 | 1,015.12 | 10.16 | 2.00 | |||||||
| Class M Shares | Actual | a | 1,000.00 | 1,148.50 | 5.47 | 1.01 | ||||||
| Hypothetical | a,b | 1,000.00 | 1,020.11 | 5.14 | 1.01 | |||||||
| Institutional Service Class Sharesc | Actual | a | 1,000.00 | 1,148.40 | 6.28 | 1.16 | ||||||
| Hypothetical | a,b | 1,000.00 | 1,019.36 | 5.90 | 1.16 | |||||||
| Institutional Class Shares | Actual | d | 1,000.00 | 1,096.60 | 3.88 | 1.00 | ||||||
| Hypothetical | a,b | 1,000.00 | 1,020.16 | 5.09 | 1.00 | |||||||
| a | Expenses are equal to the Fund’s annualized expense ratio multiplied by the average account value from August 1, 2013 through January 31, 2014 multiplied to reflect one-half year period. The expense ratio presented represents a six-month, annualized ratio in accordance with Securities and Exchange Commission guidelines. |
| b | Represents the hypothetical 5% return before expenses. |
| c | Effective September 16, 2013, Fiduciary Shares were renamed Institutional Service Class Shares. |
| d | Actual expenses are equal to the Fund’s annualized expense ratio multiplied by the average account value from September 19, 2013 through January 31, 2014 to reflect the period from commencement of operations. |
41
Statement of Investments
January 31, 2014 (Unaudited)
Nationwide Bailard Technology & Science Fund
| Common Stocks 98.9% | ||||||||||
| Shares | Market Value | |||||||||
| ||||||||||
Automobiles 0.3% |
| |||||||||
Tesla Motors, Inc.* | 1,500 | $ | 272,115 | |||||||
|
| |||||||||
| ||||||||||
Biotechnology 7.1% |
| |||||||||
Alexion Pharmaceuticals, Inc.* | 2,500 | 396,825 | ||||||||
Alkermes PLC* | 3,000 | 146,040 | ||||||||
Alnylam Pharmaceuticals, Inc.* | 2,400 | 200,784 | ||||||||
Amgen, Inc. | 6,000 | 713,700 | ||||||||
ARIAD Pharmaceuticals, Inc.* | 8,700 | 64,293 | ||||||||
Array BioPharma, Inc.* | 19,800 | 95,238 | ||||||||
Biogen Idec, Inc.* | 2,500 | 781,600 | ||||||||
BioMarin Pharmaceutical, Inc.* | 4,000 | 275,520 | ||||||||
Celgene Corp.* | 4,400 | 668,492 | ||||||||
Clovis Oncology, Inc.* | 1,500 | 97,545 | ||||||||
Cubist Pharmaceuticals, Inc.* | 2,000 | 146,180 | ||||||||
Enanta Pharmaceuticals, Inc.* | 9,000 | 329,220 | ||||||||
Gilead Sciences, Inc.* | 9,800 | 790,370 | ||||||||
Incyte Corp., Ltd.* | 3,000 | 196,560 | ||||||||
Infinity Pharmaceuticals, Inc.* | 4,000 | 51,400 | ||||||||
InterMune, Inc.* | 10,000 | 133,500 | ||||||||
Isis Pharmaceuticals, Inc.* | 3,900 | 199,134 | ||||||||
KaloBios Pharmaceuticals, Inc.* | 30,000 | 93,600 | ||||||||
Medivation, Inc.* | 1,500 | 119,400 | ||||||||
Momenta Pharmaceuticals, Inc.* | 5,000 | 89,500 | ||||||||
NewLink Genetics Corp.* | 6,000 | 222,120 | ||||||||
NPS Pharmaceuticals, Inc.* | 5,300 | 189,634 | ||||||||
Orexigen Therapeutics, Inc.* | 35,000 | 238,000 | ||||||||
Regeneron Pharmaceuticals, Inc.* | 1,325 | 382,382 | ||||||||
Seattle Genetics, Inc.* | 3,000 | 134,580 | ||||||||
Vertex Pharmaceuticals, Inc.* | 4,500 | 355,680 | ||||||||
XOMA Corp.* | 20,000 | 155,400 | ||||||||
|
| |||||||||
| 7,266,697 | ||||||||||
|
| |||||||||
| ||||||||||
Communications Equipment 7.9% |
| |||||||||
Cisco Systems, Inc. | 124,000 | 2,716,840 | ||||||||
F5 Networks, Inc.* | 7,400 | 791,800 | ||||||||
Motorola Solutions, Inc. | 24,300 | 1,550,340 | ||||||||
QUALCOMM, Inc. | 40,200 | 2,983,644 | ||||||||
|
| |||||||||
| 8,042,624 | ||||||||||
|
| |||||||||
| ||||||||||
Computers & Peripherals 14.8% |
| |||||||||
Apple, Inc. | 13,350 | 6,683,010 | ||||||||
Electronics For Imaging, Inc.* | 29,500 | 1,249,915 | ||||||||
EMC Corp. | 64,500 | 1,563,480 | ||||||||
Hewlett-Packard Co. | 5,600 | 162,400 | ||||||||
Lexmark International, Inc., Class A | 11,000 | 431,090 | ||||||||
NetApp, Inc. | 32,020 | 1,355,727 | ||||||||
SanDisk Corp. | 4,800 | 333,840 | ||||||||
Seagate Technology PLC | 22,200 | 1,173,492 | ||||||||
Synaptics, Inc.* | 16,800 | 980,448 | ||||||||
Western Digital Corp. | 14,200 | 1,223,614 | ||||||||
|
| |||||||||
| 15,157,016 | ||||||||||
|
| |||||||||
| Common Stocks (continued) | ||||||||||
| Shares | Market Value | |||||||||
| ||||||||||
Diversified Telecommunication Services 0.1% |
| |||||||||
inContact, Inc.* | 14,000 | $ | 122,920 | |||||||
|
| |||||||||
| ||||||||||
Electrical Equipment 0.2% |
| |||||||||
Rockwell Automation, Inc. | 1,300 | 149,292 | ||||||||
|
| |||||||||
| ||||||||||
Electronic Equipment, Instruments & Components 3.6% |
| |||||||||
Amphenol Corp., Class A | 12,000 | 1,042,560 | ||||||||
Jabil Circuit, Inc. | 33,600 | 603,792 | ||||||||
Sanmina Corp.* | 16,000 | 267,520 | ||||||||
SYNNEX Corp.* | 14,000 | 786,100 | ||||||||
TE Connectivity Ltd. | 17,800 | 1,005,878 | ||||||||
|
| |||||||||
| 3,705,850 | ||||||||||
|
| |||||||||
| ||||||||||
Information Technology Services 12.7% |
| |||||||||
Accenture PLC, Class A | 19,300 | 1,541,684 | ||||||||
Alliance Data Systems Corp.* | 2,650 | 635,099 | ||||||||
Amdocs Ltd. | 31,200 | 1,349,712 | ||||||||
Automatic Data Processing, Inc. | 9,800 | 750,680 | ||||||||
Cognizant Technology Solutions Corp., Class A* | 14,500 | 1,405,340 | ||||||||
Computer Sciences Corp. | 19,000 | 1,147,790 | ||||||||
Euronet Worldwide, Inc.* | 30,610 | 1,311,944 | ||||||||
Fidelity National Information Services, Inc. | 7,200 | 365,040 | ||||||||
Fiserv, Inc.* | 15,600 | 874,380 | ||||||||
FleetCor Technologies, Inc.* | 2,600 | 276,432 | ||||||||
International Business Machines Corp. | 10,150 | 1,793,302 | ||||||||
MasterCard, Inc., Class A | 10,800 | 817,344 | ||||||||
Sapient Corp.* | 18,600 | 298,158 | ||||||||
Visa, Inc., Class A | 1,920 | 413,626 | ||||||||
|
| |||||||||
| 12,980,531 | ||||||||||
|
| |||||||||
| ||||||||||
Internet & Catalog Retail 4.0% |
| |||||||||
Amazon.com, Inc.* | 4,900 | 1,757,581 | ||||||||
priceline.com, Inc.* | 1,000 | 1,144,890 | ||||||||
TripAdvisor, Inc.* | 15,000 | 1,157,850 | ||||||||
|
| |||||||||
| 4,060,321 | ||||||||||
|
| |||||||||
| ||||||||||
Internet Software & Services 15.4% |
| |||||||||
AOL, Inc.* | 3,800 | 175,104 | ||||||||
Blucora, Inc.* | 17,300 | 443,053 | ||||||||
eBay, Inc.* | 37,100 | 1,973,720 | ||||||||
Facebook, Inc., Class A* | 30,300 | 1,895,871 | ||||||||
Google, Inc., Class A* | 5,950 | 7,026,771 | ||||||||
IAC/InterActiveCorp. | 12,700 | 889,508 | ||||||||
LinkedIn Corp., Class A* | 2,375 | 511,124 | ||||||||
MercadoLibre, Inc. | 1,400 | 135,086 | ||||||||
Qihoo 360 Technology Co. Ltd., ADR-CN* | 2,800 | 283,024 | ||||||||
Tencent Holdings Ltd., ADR-CN | 2,600 | 179,790 | ||||||||
ValueClick, Inc.* | 14,600 | 313,900 | ||||||||
VeriSign, Inc.* | 18,500 | 1,086,875 | ||||||||
XO Group, Inc.* | 8,000 | 97,040 | ||||||||
Yahoo!, Inc.* | 16,200 | 583,524 | ||||||||
Yelp, Inc.* | 2,000 | 151,900 | ||||||||
|
| |||||||||
| 15,746,290 | ||||||||||
|
| |||||||||
42
Statement of Investments (Continued)
January 31, 2014 (Unaudited)
Nationwide Bailard Technology & Science Fund (Continued)
| Common Stocks (continued) | ||||||||||
| Shares | Market Value | |||||||||
| ||||||||||
Life Sciences Tools & Services 0.5% |
| |||||||||
Illumina, Inc.* | 2,000 | $ | 304,000 | |||||||
Luminex Corp.* | 5,000 | 91,350 | ||||||||
NanoString Technologies, Inc.* | 7,000 | 127,260 | ||||||||
|
| |||||||||
| 522,610 | ||||||||||
|
| |||||||||
| ||||||||||
Media 1.1% |
| |||||||||
Comcast Corp., Class A | 20,000 | 1,089,000 | ||||||||
|
| |||||||||
| ||||||||||
Pharmaceuticals 0.9% |
| |||||||||
Endocyte, Inc.* | 9,000 | 106,830 | ||||||||
Merck & Co., Inc. | 1,500 | 79,455 | ||||||||
Mylan, Inc.* | 7,500 | 340,575 | ||||||||
Salix Pharmaceuticals Ltd.* | 2,000 | 194,680 | ||||||||
Shire PLC, ADR-IE | 1,500 | 224,430 | ||||||||
|
| |||||||||
| 945,970 | ||||||||||
|
| |||||||||
| ||||||||||
Semiconductors & Semiconductor Equipment 14.4% |
| |||||||||
Altera Corp. | 14,300 | 478,049 | ||||||||
Analog Devices, Inc. | 26,000 | 1,255,020 | ||||||||
Applied Materials, Inc. | 13,700 | 230,434 | ||||||||
Avago Technologies Ltd. | 6,300 | 344,232 | ||||||||
Broadcom Corp., Class A | 18,000 | 535,680 | ||||||||
Cree, Inc.* | 3,100 | 187,302 | ||||||||
First Solar, Inc.* | 11,400 | 576,612 | ||||||||
Intel Corp. | 8,300 | 203,682 | ||||||||
KLA-Tencor Corp. | 21,500 | 1,321,605 | ||||||||
Lam Research Corp.* | 13,400 | 678,174 | ||||||||
Linear Technology Corp. | 26,700 | 1,189,218 | ||||||||
Marvell Technology Group Ltd. | 24,400 | 364,292 | ||||||||
Maxim Integrated Products, Inc. | 35,900 | 1,086,334 | ||||||||
Micron Technology, Inc.* | 50,100 | 1,154,304 | ||||||||
NVIDIA Corp. | 50,000 | 785,000 | ||||||||
NXP Semiconductor NV* | 22,300 | 1,078,205 | ||||||||
Samsung Electronics Co., Ltd., GDR-KR Reg. S | 2,350 | 1,376,061 | ||||||||
Texas Instruments, Inc. | 15,000 | 636,000 | ||||||||
Xilinx, Inc. | 26,400 | 1,225,488 | ||||||||
|
| |||||||||
| 14,705,692 | ||||||||||
|
| |||||||||
| ||||||||||
Software 15.9% |
| |||||||||
Activision Blizzard, Inc. | 38,300 | 656,079 | ||||||||
Adobe Systems, Inc.* | 7,100 | 420,249 | ||||||||
Advent Software, Inc. | 10,300 | 338,458 | ||||||||
ANSYS, Inc.* | 4,300 | 337,679 | ||||||||
Aspen Technology, Inc.* | 33,650 | 1,533,430 | ||||||||
Autodesk, Inc.* | 8,000 | 410,000 | ||||||||
CA, Inc. | 9,200 | 295,136 | ||||||||
Check Point Software Technologies Ltd.* | 5,800 | 379,494 | ||||||||
CommVault Systems, Inc.* | 4,950 | 341,897 | ||||||||
Intuit, Inc. | 11,300 | 827,725 | ||||||||
Manhattan Associates, Inc.* | 26,800 | 903,696 | ||||||||
Microsoft Corp. | 94,000 | 3,557,900 | ||||||||
Oracle Corp. | 55,300 | 2,040,570 | ||||||||
| Common Stocks (continued) | ||||||||||
| Shares | Market Value | |||||||||
| ||||||||||
Software (continued) |
| |||||||||
Pegasystems, Inc. | 10,000 | $ | 454,400 | |||||||
Red Hat, Inc.* | 15,200 | 858,800 | ||||||||
Salesforce.com, Inc.* | 10,700 | 647,671 | ||||||||
Splunk, Inc.* | 4,100 | 315,823 | ||||||||
Symantec Corp. | 73,600 | 1,575,776 | ||||||||
VMware, Inc., Class A* | 2,600 | 234,364 | ||||||||
Workday, Inc., Class A* | 1,500 | 134,310 | ||||||||
|
| |||||||||
| 16,263,457 | ||||||||||
|
| |||||||||
Total Common Stocks |
| 101,030,385 | ||||||||
|
| |||||||||
| Exchange Traded Fund 0.4% | ||||||||||
Equity Fund 0.4% |
| |||||||||
Powershares QQQ Trust | 5,000 | 431,350 | ||||||||
|
| |||||||||
Total Exchange Traded Fund |
| 431,350 | ||||||||
|
| |||||||||
| Mutual Fund 0.8% | ||||||||||
Money Market Fund 0.8% |
| |||||||||
Fidelity Institutional Money Market Fund —Institutional Class, 0.08% (a) | 868,317 | 868,317 | ||||||||
|
| |||||||||
Total Mutual Fund (cost $868,317) |
| 868,317 | ||||||||
|
| |||||||||
Total Investments | 102,330,052 | |||||||||
Liabilities in excess of other assets — (0.1%) |
| (95,430 | ) | |||||||
|
| |||||||||
NET ASSETS — 100.0% |
| $ | 102,234,622 | |||||||
|
| |||||||||
| * | Denotes a non-income producing security. |
| (a) | Represents 7-day effective yield as of January 31, 2014. |
| (b) | See notes to financial statements for tax cost and unrealized appreciation/(depreciation) of securities. |
| ADR | American Depositary Receipt |
| CN | China |
| GDR | Global Depositary Receipt |
| IE | Ireland |
| KR | South Korea |
| Ltd. | Limited |
| NV | Public Traded Company |
| PLC | Public Limited Company |
| Reg. S | Regulation S |
The accompanying notes are an integral part of these financial statements.
43
Statement of Assets and Liabilities
January 31, 2014 (Unaudited)
Nationwide Bailard | ||||||
Assets: | ||||||
Investments, at value (cost $57,953,972) | $ | 102,330,052 | ||||
Dividends receivable | 12,743 | |||||
Receivable for investments sold | 278,429 | |||||
Receivable for capital shares issued | 35,355 | |||||
Reclaims receivable | 992 | |||||
Prepaid expenses | 17,491 | |||||
|
| |||||
Total Assets | 102,675,062 | |||||
|
| |||||
Liabilities: | ||||||
Payable for investments purchased | 297,962 | |||||
Payable for capital shares redeemed | 33,339 | |||||
Accrued expenses and other payables: | ||||||
Investment advisory fees | 65,621 | |||||
Fund administration fees | 10,809 | |||||
Distribution fees | 797 | |||||
Administrative servicing fees | 299 | |||||
Accounting and transfer agent fees | 3,090 | |||||
Trustee fees | 1,139 | |||||
Deferred compensation (Note 2) | 5,754 | |||||
Custodian fees | 579 | |||||
Compliance program costs (Note 3) | 1,540 | |||||
Professional fees | 13,579 | |||||
Printing fees | 5,347 | |||||
Other | 585 | |||||
|
| |||||
Total Liabilities | 440,440 | |||||
|
| |||||
Net Assets | $ | 102,234,622 | ||||
|
| |||||
Represented by: | ||||||
Capital | $ | 58,144,101 | ||||
Accumulated distributions in excess of net investment income | (50,694 | ) | ||||
Accumulated net realized losses from investment transactions | (234,865 | ) | ||||
Net unrealized appreciation/(depreciation) from investments | 44,376,080 | |||||
|
| |||||
Net Assets | $ | 102,234,622 | ||||
|
| |||||
Net Assets: | ||||||
Class A Shares | $ | 1,797,335 | ||||
Class C Shares | 479,583 | |||||
Class M Shares | 98,720,401 | |||||
Institutional Service Class Shares | 1,226,335 | |||||
Institutional Class Shares | 10,968 | |||||
|
| |||||
Total | $ | 102,234,622 | ||||
|
| |||||
Shares Outstanding (unlimited number of shares authorized): | ||||||
Class A Shares | 116,061 | |||||
Class C Shares | 32,398 | |||||
Class M Shares | 6,195,804 | |||||
Institutional Service Class Shares | 77,054 | |||||
Institutional Class Shares | 690 | |||||
|
| |||||
Total | 6,422,007 | |||||
|
| |||||
44
Statement of Assets and Liabilities (Continued)
January 31, 2014 (Unaudited)
Nationwide Bailard | ||||||
Net asset value and redemption price per share (Net assets by class divided by shares outstanding by class, respectively): | ||||||
Class A Shares (a) | $ | 15.49 | ||||
Class C Shares (b) | $ | 14.80 | ||||
Class M Shares | $ | 15.93 | ||||
Institutional Service Class Shares | $ | 15.92 | ||||
Institutional Class Shares | $ | 15.90 | ||||
Maximum offering price per share (100%/(100%-maximum sales charge) of net asset value adjusted to the nearest cent): | ||||||
Class A Shares | $ | 16.44 | ||||
|
| |||||
Maximum Sales Charge: | ||||||
Class A Shares | 5.75 | % | ||||
|
| |||||
| (a) | For Class A Shares, the redemption price per share is reduced by 1.00% on sales of shares of original purchases of $1,000,000 or more or that were not subject to a front-end sales charge made within 18 months of the purchase date. |
| (b) | For Class C Shares, the redemption price per share is reduced by 1.00% for shares held less than 1 year. |
The accompanying notes are an integral part of these financial statements.
45
Statement of Operations
For the Six Months Ended January 31, 2014 (Unaudited)
Nationwide Technology & | ||||||
INVESTMENT INCOME: | ||||||
Dividend income | $ | 581,302 | ||||
Interest income | 47 | |||||
Foreign tax withholding | (122 | ) | ||||
|
| |||||
Total Income | 581,227 | |||||
|
| |||||
EXPENSES: | ||||||
Investment advisory fees | 365,018 | |||||
Fund administration fees | 62,553 | |||||
Distribution fees Class A | 2,097 | |||||
Distribution fees Class C | 2,228 | |||||
Administrative servicing fees Class A | 1,451 | |||||
Administrative servicing fees Institutional Service Class (a) | 1,232 | |||||
Registration and filing fees | 24,131 | |||||
Professional fees | 15,739 | |||||
Printing fees | 9,098 | |||||
Trustee fees | 1,738 | |||||
Custodian fees | 2,006 | |||||
Accounting and transfer agent fees | 5,470 | |||||
Compliance program costs (Note 3) | 1,747 | |||||
Other | 8,314 | |||||
|
| |||||
Total expenses before earnings credit, fees waived, and expenses reimbursed | 502,822 | |||||
|
| |||||
Earnings credit (Note 5) | (18 | ) | ||||
Administrative servicing fees voluntarily waived — Class A (Note 3) | (193 | ) | ||||
Administrative servicing fees voluntarily waived — Institutional Service Class (a) (Note 3) | (189 | ) | ||||
Expenses reimbursed by adviser (Note 3) | (5,440 | ) | ||||
|
| |||||
Net Expenses | 496,982 | |||||
|
| |||||
NET INVESTMENT INCOME | 84,245 | |||||
|
| |||||
REALIZED/UNREALIZED GAINS (LOSSES) FROM INVESTMENTS: | ||||||
Net realized gains from investment transactions | 5,748,919 | |||||
Net change in unrealized appreciation/(depreciation) from investments | 7,517,036 | |||||
|
| |||||
Net realized/unrealized gains from investments | 13,265,955 | |||||
|
| |||||
CHANGE IN NET ASSETS RESULTING FROM OPERATIONS | $ | 13,350,200 | ||||
|
| |||||
| (a) | Effective September 16, 2013, Fiduciary Shares were renamed Institutional Service Class Shares. |
The accompanying notes are an integral part of these financial statements.
46
Statements of Changes in Net Assets
Nationwide Bailard Technology & Science Fund | ||||||||||||
| Six Months Ended January 31, 2014 (Unaudited) | Year Ended July 31, 2013 | |||||||||||
Operations: | ||||||||||||
Net investment income | $ | 84,245 | $ | 215,422 | ||||||||
Net realized gains from investment transactions | 5,748,919 | 5,772,714 | ||||||||||
Net change in unrealized appreciation/(depreciation) from investments | 7,517,036 | 7,636,756 | ||||||||||
|
|
|
| |||||||||
Change in net assets resulting from operations | 13,350,200 | 13,624,892 | ||||||||||
|
|
|
| |||||||||
Distributions to Shareholders From: | ||||||||||||
Net investment income: | ||||||||||||
Class A | – | – | ||||||||||
Class C | – | – | ||||||||||
Class M | (201,450 | ) | – | |||||||||
Institutional Service Class (a) | (708 | ) | – | |||||||||
Institutional Class | (22 | )(b) | – | |||||||||
|
|
|
| |||||||||
Change in net assets from shareholder distributions | (202,180 | ) | – | |||||||||
|
|
|
| |||||||||
Change in net assets from capital transactions | (974,736 | ) | (4,517,352 | ) | ||||||||
|
|
|
| |||||||||
Change in net assets | 12,173,284 | 9,107,540 | ||||||||||
|
|
|
| |||||||||
Net Assets: | ||||||||||||
Beginning of period | 90,061,338 | 80,953,798 | ||||||||||
|
|
|
| |||||||||
End of period | $ | 102,234,622 | $ | 90,061,338 | ||||||||
|
|
|
| |||||||||
Accumulated undistributed (distributions in excess of) net investment income at end of period | $ | (50,694 | ) | $ | 67,241 | |||||||
|
|
|
| |||||||||
CAPITAL TRANSACTIONS: | ||||||||||||
Class A Shares | ||||||||||||
Proceeds from shares issued | $ | 243,840 | $ | 310,643 | ||||||||
Dividends reinvested | – | – | ||||||||||
Cost of shares redeemed | (130,119 | ) | (462,227 | ) | ||||||||
|
|
|
| |||||||||
Total Class A Shares | 113,721 | (151,584 | ) | |||||||||
|
|
|
| |||||||||
Class C Shares | ||||||||||||
Proceeds from shares issued | 47,488 | 296,440 | ||||||||||
Dividends reinvested | – | – | ||||||||||
Cost of shares redeemed | (10,635 | ) | (62,169 | ) | ||||||||
|
|
|
| |||||||||
Total Class C Shares | 36,853 | 234,271 | ||||||||||
|
|
|
| |||||||||
Class M Shares | ||||||||||||
Proceeds from shares issued | 3,973,911 | 6,074,346 | ||||||||||
Dividends reinvested | 186,718 | – | ||||||||||
Cost of shares redeemed | (4,794,535 | ) | (9,179,691 | ) | ||||||||
|
|
|
| |||||||||
Total Class M Shares | (633,906 | ) | (3,105,345 | ) | ||||||||
|
|
|
| |||||||||
| (a) | Effective September 16, 2013, Fiduciary Shares were renamed Institutional Service Class Shares. |
| (b) | For the period from September 19, 2013 (commencement of operations) through January 31, 2014. |
47
Statements of Changes in Net Assets (Continued)
| Nationwide Bailard Technology & Science Fund | ||||||||||||
| Six Months Ended January 31, 2014 (Unaudited) | Year Ended July 31, 2013 | |||||||||||
CAPITAL TRANSACTIONS: (continued) | ||||||||||||
Institutional Service Class Shares (a) | ||||||||||||
Proceeds from shares issued | $ | 7,801 | $ | 686,194 | ||||||||
Dividends reinvested | 708 | – | ||||||||||
Cost of shares redeemed | (509,935 | ) | (2,180,888 | ) | ||||||||
|
|
|
| |||||||||
Total Institutional Service Class Shares | (501,426 | ) | (1,494,694 | ) | ||||||||
|
|
|
| |||||||||
Institutional Class Shares | ||||||||||||
Proceeds from shares issued | 10,000 | (b) | – | |||||||||
Dividends reinvested | 22 | (b) | – | |||||||||
Cost of shares redeemed | – | (b) | – | |||||||||
|
|
|
| |||||||||
Total Institutional Class Shares | 10,022 | (b) | – | |||||||||
|
|
|
| |||||||||
Change in net assets from capital transactions | $ | (974,736 | ) | $ | (4,517,352 | ) | ||||||
|
|
|
| |||||||||
SHARE TRANSACTIONS: | ||||||||||||
Class A Shares | ||||||||||||
Issued | 17,315 | 25,493 | ||||||||||
Reinvested | – | – | ||||||||||
Redeemed | (9,202 | ) | (38,465 | ) | ||||||||
|
|
|
| |||||||||
Total Class A Shares | 8,113 | (12,972 | ) | |||||||||
|
|
|
| |||||||||
Class C Shares | ||||||||||||
Issued | 3,498 | 24,443 | ||||||||||
Reinvested | – | – | ||||||||||
Redeemed | (731 | ) | (5,480 | ) | ||||||||
|
|
|
| |||||||||
Total Class C Shares | 2,767 | 18,963 | ||||||||||
|
|
|
| |||||||||
Class M Shares | ||||||||||||
Issued | 267,874 | 473,576 | ||||||||||
Reinvested | 12,236 | – | ||||||||||
Redeemed | (319,840 | ) | (709,516 | ) | ||||||||
|
|
|
| |||||||||
Total Class M Shares | (39,730 | ) | (235,940 | ) | ||||||||
|
|
|
| |||||||||
Institutional Service Class Shares (a) | ||||||||||||
Issued | 551 | 54,441 | ||||||||||
Reinvested | 46 | – | ||||||||||
Redeemed | (34,827 | ) | (177,027 | ) | ||||||||
|
|
|
| |||||||||
Total Institutional Service Class Shares | (34,230 | ) | (122,586 | ) | ||||||||
|
|
|
| |||||||||
Institutional Class Shares | ||||||||||||
Issued | 688 | (b) | – | |||||||||
Reinvested | 2 | (b) | – | |||||||||
Redeemed | – | (b) | – | |||||||||
|
|
|
| |||||||||
Total Institutional Class Shares | 690 | (b) | – | |||||||||
|
|
|
| |||||||||
Total change in shares | (62,390 | ) | (352,535 | ) | ||||||||
|
|
|
| |||||||||
Amounts designated as “–” are zero or have been rounded to zero.
| (a) | Effective September 16, 2013, Fiduciary Shares were renamed Institutional Service Class Shares. |
| (b) | For the period from September 19, 2013 (commencement of operations) through January 31, 2014. |
The accompanying notes are an integral part of these financial statements.
48
Financial Highlights
Selected data for each share of capital outstanding throughout the periods indicated
Nationwide Bailard Technology & Science Fund
| Operations | Distributions | Ratios/Supplemental Data | ||||||||||||||||||||||||||||||||||||||||||||||||||
Net Asset of Period | Net Investment Income (Loss) | Net Realized and Unrealized Gains (Losses) from Investments | Total from Operations | Net Investment Income | Total Distributions | Net Asset Value, End of Period | Total Return (a)(b) | Net Assets at End of Period | Ratio of Expenses Net Assets (c) | Ratio of Net to Average Net Assets (c) | Ratio of Expenses Net Assets (c)(d) | Portfolio Turnover (e) | ||||||||||||||||||||||||||||||||||||||||
| Class A Shares | ||||||||||||||||||||||||||||||||||||||||||||||||||||
Six Months Ended January 31, 2014 (f) (Unaudited) | $ | 13.51 | (0.02 | ) | 2.00 | 1.98 | – | – | $ | 15.49 | 14.66% | $ | 1,797,335 | 1.41% | (0.22% | ) | 1.44% | 20.78% | ||||||||||||||||||||||||||||||||||
Year Ended July 31, 2013 (f) | $ | 11.56 | (0.02 | ) | 1.97 | 1.95 | – | – | $ | 13.51 | 16.87% | $ | 1,458,286 | 1.45% | (0.13% | ) | 1.58% | 45.00% | ||||||||||||||||||||||||||||||||||
Year Ended July 31, 2012 (f) | $ | 10.98 | (0.06 | ) | 0.64 | 0.58 | – | – | $ | 11.56 | 5.28% | $ | 1,397,618 | 1.45% | (0.57% | ) | 1.60% | 11.00% | ||||||||||||||||||||||||||||||||||
Year Ended July 31, 2011 (f) | $ | 9.05 | (0.06 | ) | 1.99 | 1.93 | – | – | $ | 10.98 | 21.33% | $ | 1,973,765 | 1.45% | (0.61% | ) | 1.58% | 16.00% | ||||||||||||||||||||||||||||||||||
Year Ended July 31, 2010 (f) | $ | 7.96 | (0.04 | ) | 1.13 | 1.09 | – | – | $ | 9.05 | 13.71% | $ | 2,277,231 | 1.43% | (0.46% | ) | 1.58% | 17.00% | ||||||||||||||||||||||||||||||||||
Year Ended July 31, 2009 (f) | $ | 9.17 | (0.02 | ) | (1.19 | ) | (1.21 | ) | – | – | $ | 7.96 | (13.20% | ) | $ | 875,347 | 1.40% | (0.26% | ) | 1.56% | 24.00% | |||||||||||||||||||||||||||||||
| Class C Shares | ||||||||||||||||||||||||||||||||||||||||||||||||||||
Six Months Ended January 31, 2014 (f) (Unaudited) | $ | 12.95 | (0.06 | ) | 1.91 | 1.85 | – | – | $ | 14.80 | 14.29% | $ | 479,583 | 2.00% | (0.82% | ) | 2.02% | 20.78% | ||||||||||||||||||||||||||||||||||
Year Ended July 31, 2013 (f) | $ | 11.15 | (0.09 | ) | 1.89 | 1.80 | – | – | $ | 12.95 | 16.14% | $ | 383,795 | 2.05% | (0.73% | ) | 2.08% | 45.00% | ||||||||||||||||||||||||||||||||||
Year Ended July 31, 2012 (f) | $ | 10.66 | (0.12 | ) | 0.61 | 0.49 | – | – | $ | 11.15 | 4.60% | $ | 118,946 | 2.05% | (1.17% | ) | 2.10% | 11.00% | ||||||||||||||||||||||||||||||||||
Year Ended July 31, 2011 (f) | $ | 8.84 | (0.13 | ) | 1.95 | 1.82 | – | – | $ | 10.66 | 20.59% | $ | 271,742 | 2.05% | (1.21% | ) | 2.08% | 16.00% | ||||||||||||||||||||||||||||||||||
Year Ended July 31, 2010 (f) | $ | 7.82 | (0.09 | ) | 1.11 | 1.02 | – | – | $ | 8.84 | 13.04% | $ | 179,645 | 2.03% | (1.06% | ) | 2.08% | 17.00% | ||||||||||||||||||||||||||||||||||
Year Ended July 31, 2009 (f) | $ | 9.07 | (0.06 | ) | (1.19 | ) | (1.25 | ) | – | – | $ | 7.82 | (13.78% | ) | $ | 121,987 | 2.00% | (0.87% | ) | 2.06% | 24.00% | |||||||||||||||||||||||||||||||
| Class M Shares | ||||||||||||||||||||||||||||||||||||||||||||||||||||
Six Months Ended January 31, 2014 (f) (Unaudited) | $ | 13.90 | 0.01 | 2.05 | 2.06 | (0.03 | ) | (0.03 | ) | $ | 15.93 | 14.85% | $ | 98,720,401 | 1.01% | 0.19% | 1.02% | 20.78% | ||||||||||||||||||||||||||||||||||
Year Ended July 31, 2013 (f) | $ | 11.85 | 0.03 | 2.02 | 2.05 | – | – | $ | 13.90 | 17.30% | $ | 86,675,286 | 1.05% | 0.27% | 1.08% | 45.00% | ||||||||||||||||||||||||||||||||||||
Year Ended July 31, 2012 (f) | $ | 11.21 | (0.02 | ) | 0.66 | 0.64 | – | – | $ | 11.85 | 5.71% | $ | 76,669,709 | 1.05% | (0.17% | ) | 1.10% | 11.00% | ||||||||||||||||||||||||||||||||||
Year Ended July 31, 2011 (f) | $ | 9.20 | (0.02 | ) | 2.03 | 2.01 | – | – | $ | 11.21 | 21.85% | $ | 86,181,523 | 1.05% | (0.21% | ) | 1.08% | 16.00% | ||||||||||||||||||||||||||||||||||
Year Ended July 31, 2010 (f) | $ | 8.07 | (0.01 | ) | 1.15 | 1.14 | (0.01 | ) | (0.01 | ) | $ | 9.20 | 14.04% | $ | 64,408,363 | 1.03% | (0.06% | ) | 1.08% | 17.00% | ||||||||||||||||||||||||||||||||
Year Ended July 31, 2009 (f) | $ | 9.27 | 0.01 | (1.21 | ) | (1.20 | ) | – | – | $ | 8.07 | (12.84% | ) | $ | 65,867,273 | 1.00% | 0.13% | 1.06% | 24.00% | |||||||||||||||||||||||||||||||||
| Institutional Service Class Shares (g) | ||||||||||||||||||||||||||||||||||||||||||||||||||||
Six Months Ended January 31, 2014 (f) (Unaudited) | $ | 13.87 | 0.01 | 2.05 | 2.06 | (0.01 | ) | (0.01 | ) | $ | 15.92 | 14.84% | $ | 1,226,335 | 1.16% | 0.07% | 1.20% | 20.78% | ||||||||||||||||||||||||||||||||||
Year Ended July 31, 2013 (f) | $ | 11.83 | 0.02 | 2.02 | 2.04 | – | – | $ | 13.87 | 17.24% | $ | 1,543,971 | 1.14% | 0.18% | 1.33% | 45.00% | ||||||||||||||||||||||||||||||||||||
Year Ended July 31, 2012 (f) | $ | 11.20 | (0.03 | ) | 0.66 | 0.63 | – | – | $ | 11.83 | 5.63% | $ | 2,767,525 | 1.11% | (0.23% | ) | 1.35% | 11.00% | ||||||||||||||||||||||||||||||||||
Year Ended July 31, 2011 (f) | $ | 9.20 | (0.03 | ) | 2.03 | 2.00 | – | – | $ | 11.20 | 21.74% | $ | 1,980,407 | 1.09% | (0.25% | ) | 1.33% | 16.00% | ||||||||||||||||||||||||||||||||||
Year Ended July 31, 2010 (f) | $ | 8.07 | (0.01 | ) | 1.15 | 1.14 | (0.01 | ) | (0.01 | ) | $ | 9.20 | 14.17% | $ | 1,676,367 | 1.06% | (0.09% | ) | 1.33% | 17.00% | ||||||||||||||||||||||||||||||||
Year Ended July 31, 2009 (f) | $ | 9.26 | 0.01 | (1.20 | ) | (1.19 | ) | – | – | $ | 8.07 | (12.85% | ) | $ | 1,996,051 | 1.00% | 0.13% | 1.31% | 24.00% | |||||||||||||||||||||||||||||||||
| Institutional Class Shares | ||||||||||||||||||||||||||||||||||||||||||||||||||||
Period Ended January 31, 2014 (f)(h) (Unaudited) | $ | 14.53 | – | 1.40 | 1.40 | (0.03 | ) | (0.03 | ) | $ | 15.90 | 9.66% | $ | 10,968 | 1.00% | 0.01% | 1.00% | 20.78% | ||||||||||||||||||||||||||||||||||
Amounts designated as “–” are zero or have been rounded to zero.
| (a) | Excludes sales charge. |
| (b) | Not annualized for periods less than one year. |
| (c) | Annualized for periods less than one year. |
| (d) | During the period, certain fees may have been waived and/or reimbursed. If such waivers/reimbursements had not occurred, the ratios would have been as indicated. |
| (e) | Portfolio turnover is calculated on the basis of the Fund as a whole without distinguishing among the classes of shares. |
| (f) | Per share calculations were performed using average shares method. |
| (g) | Effective September 16, 2013, Fiduciary Shares were renamed Institutional Service Class Shares. |
| (h) | For the period from September 19, 2013 (commencement of operations) through January 31, 2014. Total return is calculated based on inception return from September 18, 2013 through January 31, 2014. |
The accompanying notes are an integral part of these financial statements.
49
| Fund Commentary | Nationwide Geneva Mid Cap Growth Fund |
For the semiannual period ended January 31, 2014, the Nationwide Geneva Mid Cap Growth Fund (Institutional Service Class) returned 6.91%* versus 8.99% for its benchmark, the Russell Midcap® Growth Index. For broader comparison, the median return for the Fund’s closest Lipper peer category of Mid-Cap Growth Funds (consisting of 382 funds as of January 31, 2014) was 9.87% for the same time period.
| * | Performance prior to the Fund’s inception on September 16, 2013, is based on the performance of the Fund’s predecessor fund. |
The sectors that contributed to relative Fund performance during the reporting period were financial services and consumer discretionary. Specific stocks contributing the most to Fund performance during the reporting period were Under Armour and Chipotle Mexican Grill, both in the consumer discretionary sector, Cognizant Technology Solutions in the technology sector, and Signature Bank in the financial services sector.
The Fund’s holdings in the health-care, materials and processing, and consumer staples sectors were the most significant detractors from relative Fund performance during the reporting period. Individual Fund holdings that detracted from the Fund’s performance during the reporting period were Chart Industries in the producer durables sector, Teradata Corp. in the technology sector, and Ulta Salon in the consumer discretionary sector. From a quality perspective, low-quality companies significantly out-performed their high-quality cohort, with stocks rated C and D by rating agency Standard & Poor’s up 11.12% for the reporting period and those rated B+ or better up 4.74% for the same period.
Subadviser:
Geneva Capital Management Ltd.
Portfolio Managers:
Amy S. Croen, Michelle J. Picard, William A. Priebe and William Scott Priebe
The Fund is subject to the risks of investing in equity securities and risks associated with investing in stocks of mid-sized companies. Growth funds may underperform other funds that use different investing styles. Please refer to the summary prospectus for a more detailed explanation of the Fund’s principal risks.
A description of the benchmarks can be found on the Market Index Definitions page at the back of this book.
50
| Fund Overview (Unaudited) | Nationwide Geneva Mid Cap Growth Fund |
Objective
The Fund seeks long-term capital appreciation.
Highlights
| Ÿ | For the semiannual period ended January 31, 2014, the Fund (Institutional Service Class) returned 6.91%, underperforming the benchmark by 2.08% and the Lipper peer category by 2.96%. |
| Ÿ | The sectors in which the Fund invested that contributed to relative Fund performance during the reporting period were financial services and consumer discretionary. |
| Ÿ | The Fund’s holdings in the health-care, materials and processing, and consumer staples sectors were the most significant detractors from relative Fund performance during the reporting period. |
Asset Allocation†
| Common Stocks | 98.0% | |||
| Mutual Fund | 2.9% | |||
| Repurchase Agreements | 0.3% | |||
| Liabilities in excess of other assets | (1.2)% | |||
| 100.0% |
Top Industries††
| Software | 12.0% | |||
| Specialty Retail | 8.3% | |||
| Machinery | 7.7% | |||
| Health Care Equipment & Supplies | 6.4% | |||
| Commercial Banks | 4.3% | |||
| Oil, Gas & Consumable Fuels | 4.3% | |||
| Information Technology Services | 4.0% | |||
| Electronic Equipment, Instruments & Components | 4.0% | |||
| Hotels, Restaurants & Leisure | 3.5% | |||
| Electrical Equipment | 3.4% | |||
| Other Industries* | 42.1% | |||
| 100.0% |
Top Holdings††
| Under Armour, Inc., Class A | 3.0% | |||
| Fidelity Institutional Money Market Fund — Institutional Class | 2.9% | |||
| Tractor Supply Co. | 2.5% | |||
| Signature Bank | 2.4% | |||
| O’Reilly Automotive, Inc. | 2.4% | |||
| Polaris Industries, Inc. | 2.4% | |||
| Perrigo Co. PLC | 2.2% | |||
| Cerner Corp. | 2.2% | |||
| Wabtec Corp. | 2.1% | |||
| Amphenol Corp., Class A | 2.1% | |||
| Other Holdings* | 75.8% | |||
| 100.0% |
| † | Percentages indicated are based upon net assets as of January 31, 2014. |
| †† | Percentages indicated are based upon total investments as of January 31, 2014. |
| * | For purposes of listing top industries and top holdings, the repurchase agreements are included as part of Other. |
51
| Fund Performance | Nationwide Geneva Mid Cap Growth Fund |
Average Annual Total Return
(For periods ended January 31, 2014)
| Six Months* | 1 Yr. | 5 Yr. | 10 Yr. | |||||||||||||||
| Class A | w/o SC1 | 6.73% | 18.55% | 21.20% | 9.82% | |||||||||||||
| w/SC2 | 0.88% | 12.04% | 19.84% | 9.20% | ||||||||||||||
| Class C | w/o SC1 | 6.47% | 17.88% | 20.48% | 9.08% | |||||||||||||
| w/SC3 | 5.47% | 16.88% | 20.48% | 9.08% | ||||||||||||||
| Institutional Service Class4,5 | w/o SC | 6.91% | 18.88% | 21.51% | 9.96% | |||||||||||||
| Institutional Class4 | w/o SC | 2.37% | 6 | — | — | — | ||||||||||||
All figures showing the effect of a sales charge (SC) reflect the maximum charge possible, because it has the most significant effect on performance data.
| * | Not annualized. |
| 1 | These returns do not reflect the effects of SCs. |
| 2 | For the period from September 16, 2013 through January 31, 2014 a front-end sales charge of 5.75% was deducted. Prior to September 16, 2013, a front-end sales charge of 5.50% was deducted. |
| 3 | A 1.00% CDSC was deducted from the one year return because it is charged when you sell Class C shares within the first year after purchase. |
| 4 | Not subject to any SCs. |
| 5 | Effective September 16, 2013 Fiduciary Shares were renamed Institutional Service Class Shares. |
| 6 | Since inception date of September 18, 2013. Not Annualized. |
Expense Ratios
| Expense Ratio* | ||
| Class A | 1.36% | |
| Class C | 1.86% | |
| Institutional Service Class | 1.11% | |
| Institutional Class | 0.86% |
| * | Current effective prospectus dated September 16, 2013. Please see the Fund’s most recent prospectus for details. |
52
| Fund Performance | Nationwide Geneva Mid Cap Growth Fund |
Performance of a $10,000 Investment
Investment return and principal value will fluctuate, and when redeemed, shares may be worth more or less than original cost. Past performance is no guarantee of future results and does not reflect the deduction of taxes that a shareholder would pay on fund distributions or the redemption of fund shares. Investing in mutual funds involves market risk, including loss of principal. Performance returns assume the reinvestment of all distributions.
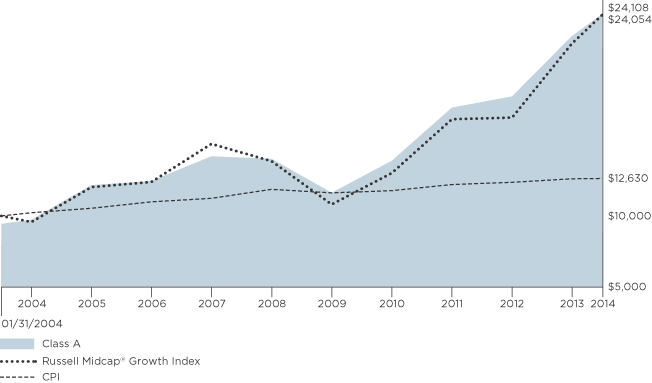
Comparative performance of $10,000 invested in Class A shares of the Nationwide Geneva Mid Cap Growth Fund versus the Russell Midcap® Growth Index and the Consumer Price Index (CPI) over the 10-year period ended 1/31/14. Fund performance prior to the Fund’s inception on 9/16/13 is based on the Fund’s predecessor Fund. Unlike the Fund, the performance for these unmanaged indexes does not reflect any fees, expenses, or sales charges. One cannot invest directly in a market index. A description of the benchmarks can be found on the Market Index Definitions page at the back of this book.
53
| Shareholder Expense Example | Nationwide Geneva Mid Cap Growth Fund |
As a shareholder of the Fund, you incur two types of costs: (1) transaction costs, including sales charges (loads) paid on purchase payments and redemption fees; and (2) ongoing costs, including investment advisory fees, administration fees, distribution fees and other Fund expenses. The examples below are intended to help you understand your ongoing costs (in dollars) of investing in the Fund and to compare these costs with the ongoing costs of investing in other mutual funds. Per Securities and Exchange Commission (“SEC”) requirements, the examples assume that you had a $1,000 investment in the Class at the beginning of the reporting period (August 1, 2013) and continued to hold your shares at the end of the reporting period (January 31, 2014).
Actual Expenses
For each Class of the Fund in the table below, the first line provides information about actual account values and actual expenses. You may use the information in this line, together with the amount you invested, to estimate the expenses that you paid from August 1, 2013 through January 31, 2014. Simply divide your account value by $1,000 (for example, an $8,600 account value divided by $1,000 = 8.6), then multiply the result by the number in the first line of each Class under the heading entitled “Expenses Paid During Period” to estimate the expenses you paid on your account during this period.
Hypothetical Expenses for Comparison Purposes
The second line of each Class in the table below provides information about hypothetical account values and hypothetical expenses based on the Class’ actual expense ratio and an assumed rate of return of 5% per year before expenses, which is not the Class’ actual return. The hypothetical account values and expenses may not be used to estimate the actual ending account balance or expenses you paid for the period from August 1, 2013 through January 31, 2014. You may use this information to compare the ongoing costs of investing in the Class of the Fund and other funds. To do so, compare this 5% hypothetical example with the 5% hypothetical examples that appear in the shareholder reports of the other funds.
Please note that the expenses shown in the table are meant to highlight your ongoing costs only and do not reflect any transaction costs, such as sales charges (loads) or redemption fees. If these transaction costs were included, your costs would have been higher. Therefore, the second line for each Class in the table is useful in comparing ongoing costs only, and will not help you determine the relative total costs of owning different funds. The examples also assume all dividends and distributions are reinvested.
Schedule of Shareholder Expenses
Expense Analysis of a $1,000 Investment
Nationwide Geneva Mid Cap January 31, 2014 | Beginning Account Value ($) 08/01/13 | Ending Account Value ($) 01/31/14 | Expenses Paid During Period ($) 08/01/13 - 01/31/14 | Expense Ratio During Period (%) 08/01/13 - 01/31/14 | ||||||||
| Class A Shares | Actual | a | 1,000.00 | 1,067.30 | 6.98 | 1.34 | ||||||
| Hypothetical | a,b | 1,000.00 | 1,018.45 | 6.82 | 1.34 | |||||||
| Class C Shares | Actual | a | 1,000.00 | 1,064.70 | 9.68 | 1.86 | ||||||
| Hypothetical | a,b | 1,000.00 | 1,015.83 | 9.45 | 1.86 | |||||||
| Institutional Service Class Sharesc | Actual | a | 1,000.00 | 1,069.10 | 5.68 | 1.09 | ||||||
| Hypothetical | a,b | 1,000.00 | 1,019.71 | 5.55 | 1.09 | |||||||
| Institutional Class Shares | Actual | d | 1,000.00 | 1,023.70 | 3.14 | 0.84 | ||||||
| Hypothetical | a,b | 1,000.00 | 1,020.97 | 4.28 | 0.84 | |||||||
| a | Expenses are equal to the Fund’s annualized expense ratio multiplied by the average account value from August 1, 2013 through January 31, 2014 multiplied to reflect one-half year period. The expense ratio presented represents a six-month, annualized ratio in accordance with Securities and Exchange Commission guidelines. |
| b | Represents the hypothetical 5% return before expenses. |
| c | Effective September 16, 2013, Fiduciary Shares were renamed Institutional Service Class Shares. |
| d | Actual expenses are equal to the Fund’s annualized expense ratio multiplied by the average account value from September 19, 2013 through January 31, 2014 to reflect the period from commencement of operations. |
54
Statement of Investments
January 31, 2014 (Unaudited)
Nationwide Geneva Mid Cap Growth Fund
| Common Stocks 98.0% | ||||||||||
| Shares | Market Value | |||||||||
| ||||||||||
Capital Markets 3.3% |
| |||||||||
Affiliated Managers Group, Inc.* | 162,748 | $ | 32,425,911 | |||||||
Raymond James Financial, Inc. | 349,758 | 17,806,180 | ||||||||
|
| |||||||||
| 50,232,091 | ||||||||||
|
| |||||||||
| ||||||||||
Chemicals 1.3% |
| |||||||||
Sigma-Aldrich Corp. | 205,320 | 19,088,600 | ||||||||
|
| |||||||||
| ||||||||||
Commercial Banks 4.4% |
| |||||||||
East West Bancorp, Inc. | 864,645 | 28,931,022 | ||||||||
Signature Bank* | 300,660 | 36,698,559 | ||||||||
|
| |||||||||
| 65,629,581 | ||||||||||
|
| |||||||||
| ||||||||||
Commercial Services & Supplies 3.4% |
| |||||||||
Copart, Inc.* | 683,587 | 23,433,362 | ||||||||
Stericycle, Inc.* | 238,508 | 27,919,747 | ||||||||
|
| |||||||||
| 51,353,109 | ||||||||||
|
| |||||||||
| ||||||||||
Distributors 2.0% |
| |||||||||
LKQ Corp.* | 1,086,124 | 29,401,377 | ||||||||
|
| |||||||||
| ||||||||||
Diversified Financial Services 2.0% |
| |||||||||
IntercontinentalExchange Group, Inc. | 143,922 | 30,049,474 | ||||||||
|
| |||||||||
| ||||||||||
Electrical Equipment 3.5% |
| |||||||||
AMETEK, Inc. | 623,101 | 30,793,651 | ||||||||
Roper Industries, Inc. | 154,040 | 21,140,450 | ||||||||
|
| |||||||||
| 51,934,101 | ||||||||||
|
| |||||||||
| ||||||||||
Electronic Equipment, Instruments & Components 4.0% |
| |||||||||
Amphenol Corp., Class A | 374,992 | 32,579,305 | ||||||||
Trimble Navigation Ltd.* | 856,154 | 27,679,459 | ||||||||
|
| |||||||||
| 60,258,764 | ||||||||||
|
| |||||||||
| ||||||||||
Energy Equipment & Services 0.8% |
| |||||||||
Oceaneering International, Inc. | 177,170 | 12,074,135 | ||||||||
|
| |||||||||
| ||||||||||
Food Products 2.6% |
| |||||||||
Hain Celestial Group, Inc. (The)* | 262,972 | 24,164,497 | ||||||||
J.M. Smucker Co. (The) | 152,407 | 14,690,511 | ||||||||
|
| |||||||||
| 38,855,008 | ||||||||||
|
| |||||||||
| ||||||||||
Health Care Equipment & Supplies 6.5% |
| |||||||||
Align Technology, Inc.* | 460,452 | 27,360,058 | ||||||||
C.R. Bard, Inc. | 146,581 | 18,995,432 | ||||||||
Sirona Dental Systems, Inc.* | 266,003 | 19,136,256 | ||||||||
Varian Medical Systems, Inc.* | 385,367 | 31,334,190 | ||||||||
|
| |||||||||
| 96,825,936 | ||||||||||
|
| |||||||||
| ||||||||||
Health Care Providers & Services 1.5% |
| |||||||||
Catamaran Corp.* | 465,553 | 22,635,187 | ||||||||
|
| |||||||||
| ||||||||||
Health Care Technology 2.2% |
| |||||||||
Cerner Corp.* | 575,084 | 32,716,529 | ||||||||
|
| |||||||||
| Common Stocks (continued) | ||||||||||
| Shares | Market Value | |||||||||
| ||||||||||
Hotels, Restaurants & Leisure 3.5% |
| |||||||||
Chipotle Mexican Grill, Inc.* | 58,720 | $ | 32,411,091 | |||||||
Panera Bread Co., Class A* | 123,053 | 20,804,571 | ||||||||
|
| |||||||||
| 53,215,662 | ||||||||||
|
| |||||||||
| ||||||||||
Household Products 1.6% |
| |||||||||
Church & Dwight Co., Inc. | 376,063 | 24,286,149 | ||||||||
|
| |||||||||
| ||||||||||
Information Technology Services 4.0% |
| |||||||||
Cognizant Technology Solutions Corp., Class A* | 304,489 | 29,511,074 | ||||||||
Fiserv, Inc.* | 551,567 | 30,915,330 | ||||||||
|
| |||||||||
| 60,426,404 | ||||||||||
|
| |||||||||
| ||||||||||
Insurance 1.3% |
| |||||||||
Brown & Brown, Inc. | 625,119 | 19,684,997 | ||||||||
|
| |||||||||
| ||||||||||
Internet Software & Services 1.5% |
| |||||||||
CoStar Group, Inc.* | 129,560 | 22,289,502 | ||||||||
|
| |||||||||
| ||||||||||
Leisure Equipment & Products 2.4% |
| |||||||||
Polaris Industries, Inc. | 287,071 | 35,941,289 | ||||||||
|
| |||||||||
| ||||||||||
Life Sciences Tools & Services 1.5% |
| |||||||||
PAREXEL International Corp.* | 454,997 | 22,208,404 | ||||||||
|
| |||||||||
| ||||||||||
Machinery 7.8% |
| |||||||||
Chart Industries, Inc.* | 213,632 | 18,252,718 | ||||||||
IDEX Corp. | 370,231 | 26,660,334 | ||||||||
Middleby Corp. (The)* | 89,587 | 22,090,363 | ||||||||
Pall Corp. | 225,039 | 18,025,624 | ||||||||
Wabtec Corp. | 441,488 | 32,586,229 | ||||||||
|
| |||||||||
| 117,615,268 | ||||||||||
|
| |||||||||
| ||||||||||
Oil, Gas & Consumable Fuels 4.4% |
| |||||||||
Concho Resources, Inc.* | 256,977 | 25,129,781 | ||||||||
Oasis Petroleum, Inc.* | 375,765 | 15,710,735 | ||||||||
Range Resources Corp. | 283,976 | 24,475,891 | ||||||||
|
| |||||||||
| 65,316,407 | ||||||||||
|
| |||||||||
| ||||||||||
Pharmaceuticals 2.2% |
| |||||||||
Perrigo Co. PLC | 211,569 | 32,932,831 | ||||||||
|
| |||||||||
| ||||||||||
Professional Services 1.8% |
| |||||||||
IHS, Inc., Class A* | 241,186 | 27,352,904 | ||||||||
|
| |||||||||
| ||||||||||
Road & Rail 2.8% |
| |||||||||
Genesee & Wyoming, Inc., Class A* | 214,902 | 19,414,247 | ||||||||
J.B. Hunt Transport Services, Inc. | 295,443 | 22,172,997 | ||||||||
|
| |||||||||
| 41,587,244 | ||||||||||
|
| |||||||||
| ||||||||||
Software 12.1% |
| |||||||||
ANSYS, Inc.* | 347,655 | 27,301,347 | ||||||||
CommVault Systems, Inc.* | 216,865 | 14,978,866 | ||||||||
FactSet Research Systems, Inc. (a) | 109,940 | 11,628,354 | ||||||||
55
Statement of Investments (Continued)
January 31, 2014 (Unaudited)
Nationwide Geneva Mid Cap Growth Fund (Continued)
| Common Stocks (continued) | ||||||||||
| Shares | Market Value | |||||||||
| ||||||||||
Software (continued) |
| |||||||||
Intuit, Inc. | 383,720 | $ | 28,107,490 | |||||||
Manhattan Associates, Inc.* | 417,984 | 14,094,420 | ||||||||
MICROS Systems, Inc.* | 491,161 | 27,274,170 | ||||||||
Red Hat, Inc.* | 493,184 | 27,864,896 | ||||||||
Tyler Technologies, Inc.* | 174,274 | 18,377,193 | ||||||||
Ultimate Software Group, Inc. | 75,546 | 12,331,374 | ||||||||
|
| |||||||||
| 181,958,110 | ||||||||||
|
| |||||||||
| ||||||||||
Specialty Retail 8.4% |
| |||||||||
Dick’s Sporting Goods, Inc. | 542,441 | 28,478,153 | ||||||||
DSW, Inc., Class A | 626,514 | 23,588,252 | ||||||||
O’Reilly Automotive, Inc.* | 278,382 | 36,462,474 | ||||||||
Tractor Supply Co. | 562,815 | 37,432,826 | ||||||||
|
| |||||||||
| 125,961,705 | ||||||||||
|
| |||||||||
| ||||||||||
Textiles, Apparel & Luxury Goods 3.0% |
| |||||||||
Under Armour, Inc., Class A* | 415,599 | 44,930,408 | ||||||||
|
| |||||||||
| ||||||||||
Trading Companies & Distributors 2.2% |
| |||||||||
Beacon Roofing Supply, Inc.* | 414,012 | 15,645,514 | ||||||||
Fastenal Co. | 387,271 | 17,012,815 | ||||||||
|
| |||||||||
| 32,658,329 | ||||||||||
|
| |||||||||
Total Common Stocks |
| 1,469,419,505 | ||||||||
|
| |||||||||
| Mutual Fund 2.9% | ||||||||||
Money Market Fund 2.9% |
| |||||||||
Fidelity Institutional Money Market Fund — Institutional Class, 0.08% (b) | 43,455,897 | 43,455,897 | ||||||||
|
| |||||||||
Total Mutual Fund |
| 43,455,897 | ||||||||
|
| |||||||||
| Repurchase Agreements 0.3% | ||||||||||
| Principal Amount | Market Value | |||||||||
| ||||||||||
Credit Suisse (USA) LLC, 0.03%, dated 01/31/14, due 02/03/14, repurchase price $3,244,408, collateralized by U.S. Government Agency Securities ranging from 1.63% - 5.00%, maturing 04/20/24 - 12/20/43; total market value $3,309,307. (c) | $3,244,400 | 3,244,400 | ||||||||
| Repurchase Agreements (continued) | ||||||||||
| Principal Amount | Market Value | |||||||||
| ||||||||||
Goldman Sachs & Co., 0.01%, dated 01/29/14, due 02/05/14, repurchase price $1,000,002, collateralized by U.S. Government Treasury Securities ranging from 0.00% - 4.38%, maturing 07/15/19 - 02/15/43; total market value $1,020,000. (c) | $ | 1,000,000 | $ | 1,000,000 | ||||||
|
| |||||||||
Total Repurchase Agreements |
| 4,244,400 | ||||||||
|
| |||||||||
Total Investments |
| 1,517,119,802 | ||||||||
Liabilities in excess of other |
| (18,268,529 | ) | |||||||
|
| |||||||||
NET ASSETS — 100.0% | $ | 1,498,851,273 | ||||||||
|
| |||||||||
| * | Denotes a non-income producing security. |
| (a) | The security or a portion of this security is on loan at January 31, 2014. The total value of securities on loan at January 31, 2014 was $4,156,761. |
| (b) | Represents 7-day effective yield as of January 31, 2014. |
| (c) | The security was purchased with cash collateral held from securities on loan. The total value of securities purchased with cash collateral as of January 31, 2014 was $4,244,400. Also, see Note 2 within the notes to financial statements for additional information. |
| (d) | See notes to financial statements for tax cost and unrealized appreciation/(depreciation) of securities. |
| LLC | Limited Liability Company |
| Ltd. | Limited |
| PLC | Public Limited Company |
The accompanying notes are an integral part of these financial statements.
56
Statement of Assets and Liabilities
January 31, 2014 (Unaudited)
| Nationwide Geneva Mid Cap Growth Fund | ||||||
Assets: | ||||||
Investments, at value* (cost $1,169,662,363) | $ | 1,512,875,402 | ||||
Repurchase agreements, at value and cost | 4,244,400 | |||||
|
| |||||
Total Investments (total cost $1,173,906,763) | 1,517,119,802 | |||||
|
| |||||
Dividends receivable | 254,118 | |||||
Security lending income receivable | 121 | |||||
Receivable for capital shares issued | 3,740,628 | |||||
Prepaid expenses | 22,840 | |||||
|
| |||||
Total Assets | 1,521,137,509 | |||||
|
| |||||
Liabilities: | ||||||
Payable for investments purchased | 13,535,890 | |||||
Payable for capital shares redeemed | 2,203,214 | |||||
Payable upon return of securities loaned (Note 2) | 4,244,400 | |||||
Accrued expenses and other payables: | ||||||
Investment advisory fees | 872,526 | |||||
Fund administration fees | 67,284 | |||||
Distribution fees | 192,839 | |||||
Administrative servicing fees | 919,155 | |||||
Accounting and transfer agent fees | 76,843 | |||||
Trustee fees | | 852 | | |||
Deferred compensation (Note 2) | 85,315 | |||||
Custodian fees | 9,003 | |||||
Compliance program costs (Note 3) | 326 | |||||
Professional fees | 22,097 | |||||
Printing fees | 54,481 | |||||
Other | 2,011 | |||||
|
| |||||
Total Liabilities | 22,286,236 | |||||
|
| |||||
Net Assets | $ | 1,498,851,273 | ||||
|
| |||||
Represented by: | ||||||
Capital | $ | 1,132,846,296 | ||||
Accumulated net investment loss | (13,936,049 | ) | ||||
Accumulated net realized gains from investment transactions | 36,727,987 | |||||
Net unrealized appreciation/(depreciation) from investments | 343,213,039 | |||||
|
| |||||
Net Assets | $ | 1,498,851,273 | ||||
|
| |||||
| * | Includes value of securities on loan of $4,156,761 (Note 2). |
57
Statement of Assets and Liabilities (Continued)
January 31, 2014 (Unaudited)
| Nationwide Geneva Mid Cap Growth Fund | ||||||
Net Assets: | ||||||
Class A Shares | $ | 491,829,217 | ||||
Class C Shares | 98,924,326 | |||||
Institutional Service Class Shares | 907,596,688 | |||||
Institutional Class Shares | 501,042 | |||||
|
| |||||
Total | $ | 1,498,851,273 | ||||
|
| |||||
Shares Outstanding (unlimited number of shares authorized): | ||||||
Class A Shares | 17,290,968 | |||||
Class C Shares | 3,859,762 | |||||
Institutional Service Class Shares | 31,483,972 | |||||
Institutional Class Shares | 17,359 | |||||
|
| |||||
Total | 52,652,061 | |||||
|
| |||||
Net asset value and redemption price per share (Net assets by class divided by shares outstanding by class, respectively): | ||||||
Class A Shares (a) | $ | 28.44 | ||||
Class C Shares (b) | $ | 25.63 | ||||
Institutional Service Class Shares | $ | 28.83 | ||||
Institutional Class Shares | $ | 28.86 | ||||
Maximum offering price per share (100%/(100%-maximum sales charge) of net asset value adjusted to the nearest cent): | ||||||
Class A Shares | $ | 30.18 | ||||
|
| |||||
Maximum Sales Charge: | ||||||
Class A Shares | 5.75 | % | ||||
|
| |||||
| (a) | For Class A Shares, the redemption price per share is reduced by 1.00% on sales of shares of original purchases of $1,000,000 or more or that were not subject to a front-end sales charge made with 18 months of the purchase date. |
| (b) | For Class C Shares, the redemption price per share is reduced by 1.00% for shares held less than 1 year. |
The accompanying notes are an integral part of these financial statements.
58
Statement of Operations
For the Six Months Ended January 31, 2014 (Unaudited)
| Nationwide Geneva Mid Cap Growth Fund | ||||||
INVESTMENT INCOME: | ||||||
Dividend income | $ | 3,105,475 | ||||
Income from securities lending (Note 2) | 121 | |||||
|
| |||||
Total Income | 3,105,596 | |||||
|
| |||||
EXPENSES: | ||||||
Investment advisory fees | 5,045,300 | |||||
Fund administration fees | 627,682 | |||||
Distribution fees Class A | 622,367 | |||||
Distribution fees Class B (a) | 2,013 | |||||
Distribution fees Class C | 507,513 | |||||
Administrative servicing fees Class A | 622,367 | |||||
Administrative servicing fees Class B (a) | 671 | |||||
Administrative servicing fees Institutional Service Class (b) | 1,117,837 | |||||
Registration and filing fees | 70,788 | |||||
Professional fees | 57,614 | |||||
Printing fees | 228,535 | |||||
Trustee fees | 28,612 | |||||
Custodian fees | 31,199 | |||||
Accounting and transfer agent fees | 243,394 | |||||
Compliance program costs (Note 3) | 3,120 | |||||
Recoupment fees (Note 3) | 45,468 | |||||
Other | 53,405 | |||||
|
| |||||
Total expenses before earnings credit and fees waived | 9,307,885 | |||||
|
| |||||
Earnings credit (Note 5) | (383 | ) | ||||
Administrative servicing fees voluntarily waived — Class A (Note 3) | (60,206 | ) | ||||
Administrative servicing fees voluntarily waived — Institutional Service Class (b) (Note 3) | (104,251 | ) | ||||
|
| |||||
Net Expenses | 9,143,045 | |||||
|
| |||||
NET INVESTMENT LOSS | (6,037,449 | ) | ||||
|
| |||||
REALIZED/UNREALIZED GAINS (LOSSES) FROM INVESTMENTS: | ||||||
Net realized gains from investment transactions | 37,282,740 | |||||
Net change in unrealized appreciation/(depreciation) from investments | 65,311,583 | |||||
|
| |||||
Net realized/unrealized gains from investments | 102,594,323 | |||||
|
| |||||
CHANGE IN NET ASSETS RESULTING FROM OPERATIONS | $ | 96,556,874 | ||||
|
| |||||
| (a) | Effective September 16, 2013, Class B Shares were converted to Class A Shares. |
| (b) | Effective September 16, 2013, Fiduciary Shares were renamed Institutional Service Class Shares. |
The accompanying notes are an integral part of these financial statements.
59
Statements of Changes in Net Assets
| Nationwide Geneva Mid Cap Growth Fund | ||||||||||||
| Six Months Ended January 31, 2014 (Unaudited) | Year Ended July 31, 2013 | |||||||||||
Operations: | ||||||||||||
Net investment loss | $ | (6,037,449 | ) | $ | (7,898,601 | ) | ||||||
Net realized gains from investment transactions | 37,282,740 | 88,815,733 | ||||||||||
Net change in unrealized appreciation/(depreciation) from investments | 65,311,583 | 157,419,685 | ||||||||||
|
|
|
| |||||||||
Change in net assets resulting from operations | 96,556,874 | 238,336,817 | ||||||||||
|
|
|
| |||||||||
Distributions to Shareholders From: | ||||||||||||
Net realized gains: | ||||||||||||
Class A | (25,361,042 | ) | (6,861,984 | ) | ||||||||
Class B (a) | – | (54,588 | ) | |||||||||
Class C | (5,688,359 | ) | (1,519,946 | ) | ||||||||
Institutional Service Class (b) | (46,021,008 | ) | (9,977,376 | ) | ||||||||
Institutional Class | (515 | )(c) | – | |||||||||
|
|
|
| |||||||||
Change in net assets from shareholder distributions | (77,070,924 | ) | (18,413,894 | ) | ||||||||
|
|
|
| |||||||||
Change in net assets from capital transactions | 86,907,793 | 323,508,195 | ||||||||||
|
|
|
| |||||||||
Change in net assets | 106,393,743 | 543,431,118 | ||||||||||
|
|
|
| |||||||||
Net Assets: | ||||||||||||
Beginning of period | 1,392,457,530 | 849,026,412 | ||||||||||
|
|
|
| |||||||||
End of period | $ | 1,498,851,273 | $ | 1,392,457,530 | ||||||||
|
|
|
| |||||||||
Accumulated net investment loss at end of period | $ | (13,936,049 | ) | $ | (7,898,600 | ) | ||||||
|
|
|
| |||||||||
CAPITAL TRANSACTIONS: | ||||||||||||
Class A Shares | ||||||||||||
Proceeds from shares issued | $ | 57,260,064 | $ | 148,745,590 | ||||||||
Dividends reinvested | 24,126,492 | 6,402,395 | ||||||||||
Cost of shares redeemed | (71,760,130 | ) | (104,626,362 | ) | ||||||||
|
|
|
| |||||||||
Total Class A Shares | 9,626,426 | 50,521,623 | ||||||||||
|
|
|
| |||||||||
Class B Shares (a) | ||||||||||||
Proceeds from shares issued | 1,748 | 3,668 | ||||||||||
Dividends reinvested | – | 51,653 | ||||||||||
Cost of shares redeemed | (2,327,121 | ) | (1,841,076 | ) | ||||||||
|
|
|
| |||||||||
Total Class B Shares | (2,325,373 | ) | (1,785,755 | ) | ||||||||
|
|
|
| |||||||||
Class C Shares | ||||||||||||
Proceeds from shares issued | 7,509,907 | 23,731,707 | ||||||||||
Dividends reinvested | 5,132,718 | 1,296,710 | ||||||||||
Cost of shares redeemed | (11,025,056 | ) | (10,901,080 | ) | ||||||||
|
|
|
| |||||||||
Total Class C Shares | 1,617,569 | 14,127,337 | ||||||||||
|
|
|
| |||||||||
| (a) | Effective September 16, 2013, Class B Shares were converted to Class A Shares. |
| (b) | Effective September 16, 2013, Fiduciary Shares were renamed Institutional Service Class Shares. |
| (c) | For the period September 19, 2013 (commencement of operations) through January 31, 2014. |
60
Statements of Changes in Net Assets (Continued)
| Nationwide Geneva Mid Cap Growth Fund | ||||||||||||
| Six Months Ended January 31, 2014 (Unaudited) | Year Ended July 31, 2013 | |||||||||||
CAPITAL TRANSACTIONS: (continued) | ||||||||||||
Institutional Service Class Shares (b) | ||||||||||||
Proceeds from shares issued | $ | 148,260,109 | $ | 407,746,116 | ||||||||
Dividends reinvested | 37,689,226 | 8,126,513 | ||||||||||
Cost of shares redeemed | (108,455,748 | ) | (155,227,639 | ) | ||||||||
|
|
|
| |||||||||
Total Institutional Service Class Shares | 77,493,587 | 260,644,990 | ||||||||||
|
|
|
| |||||||||
Institutional Class Shares | ||||||||||||
Proceeds from shares issued | 521,405 | (c) | – | |||||||||
Dividends reinvested | 515 | (c) | – | |||||||||
Cost of shares redeemed | (26,336 | )(c) | – | |||||||||
|
|
|
| |||||||||
Total Institutional Class Shares | 495,584 | (c) | – | |||||||||
|
|
|
| |||||||||
Change in net assets from capital transactions | $ | 86,907,793 | $ | 323,508,195 | ||||||||
|
|
|
| |||||||||
SHARE TRANSACTIONS: | ||||||||||||
Class A Shares | ||||||||||||
Issued | 1,965,475 | 5,904,464 | ||||||||||
Reinvested | 855,229 | 268,670 | ||||||||||
Redeemed | (2,457,782 | ) | (4,136,914 | ) | ||||||||
|
|
|
| |||||||||
Total Class A Shares | 362,922 | 2,036,220 | ||||||||||
|
|
|
| |||||||||
Class B Shares (a) | ||||||||||||
Issued | 70 | 165 | ||||||||||
Reinvested | – | 2,407 | ||||||||||
Redeemed | (90,045 | ) | (81,834 | ) | ||||||||
|
|
|
| |||||||||
Total Class B Shares | (89,975 | ) | (79,262 | ) | ||||||||
|
|
|
| |||||||||
Class C Shares | ||||||||||||
Issued | 284,647 | 1,042,254 | ||||||||||
Reinvested | 201,837 | 59,674 | ||||||||||
Redeemed | (416,663 | ) | (470,443 | ) | ||||||||
|
|
|
| |||||||||
Total Class C Shares | 69,821 | 631,485 | ||||||||||
|
|
|
| |||||||||
Institutional Service Class Shares (b) | ||||||||||||
Issued | 5,042,978 | 16,112,704 | ||||||||||
Reinvested | 1,318,727 | 337,620 | ||||||||||
Redeemed | (3,673,564 | ) | (6,065,193 | ) | ||||||||
|
|
|
| |||||||||
Total Institutional Service Class Shares | 2,688,141 | 10,385,131 | ||||||||||
|
|
|
| |||||||||
Institutional Class Shares | ||||||||||||
Issued | 18,229 | (c) | – | |||||||||
Reinvested | 18 | (c) | – | |||||||||
Redeemed | (888 | )(c) | – | |||||||||
|
|
|
| |||||||||
Total Institutional Class Shares | 17,359 | (c) | – | |||||||||
|
|
|
| |||||||||
Total change in shares | 3,048,268 | 12,973,574 | ||||||||||
|
|
|
| |||||||||
Amounts designated as “–” are zero or have been rounded to zero.
| (a) | Effective September 16, 2013, Class B Shares were converted to Class A Shares. |
| (b) | Effective September 16, 2013, Fiduciary Shares were renamed Institutional Service Class Shares. |
| (c) | For the period September 19, 2013 (commencement of operations) through January 31, 2014. |
The accompanying notes are an integral part of these financial statements.
61
Financial Highlights
Selected data for each share of capital outstanding throughout the periods indicated
Nationwide Geneva Mid Cap Growth Fund
| Operations | Distributions | Ratios/Supplemental Data | ||||||||||||||||||||||||||||||||||||||||||||||||||
| Net Asset Value, Beginning of Period | Net Investment Income (Loss) | Net Realized and Unrealized Gains (Losses) from Investments | Total from Operations | Net Realized Gains | Total Distributions | Net Asset Value, End of Period | Total Return (a)(b) | Net Assets at End of Period | Ratio of Expenses to Average Net Assets (c) | Ratio of Net Investment Income (Loss) to Average Net Assets (c) | Ratio of Expenses (Prior to Reimbursements) to Average Net Assets (c)(d) | Portfolio Turnover (e) | ||||||||||||||||||||||||||||||||||||||||
| Class A Shares | ||||||||||||||||||||||||||||||||||||||||||||||||||||
Six Months Ended January 31, 2014 (f) (Unaudited) | $ | 28.09 | (0.14 | ) | 2.02 | 1.88 | (1.53 | ) | (1.53 | ) | $ | 28.44 | 6.73% | $ | 491,829,217 | 1.34% | (0.92% | ) | 1.36% | 17.85% | ||||||||||||||||||||||||||||||||
Year Ended July 31, 2013 (f) | $ | 23.26 | (0.20 | ) | 5.46 | 5.26 | (0.43 | ) | (0.43 | ) | $ | 28.09 | 22.96% | $ | 475,430,830 | 1.38% | (0.79% | ) | 1.45% | 26.00% | ||||||||||||||||||||||||||||||||
Year Ended July 31, 2012 (f) | $ | 22.71 | (0.20 | ) | 1.20 | 1.00 | (0.45 | ) | (0.45 | ) | $ | 23.26 | 4.46% | $ | 346,311,494 | 1.38% | (0.88% | ) | 1.51% | 17.00% | ||||||||||||||||||||||||||||||||
Year Ended July 31, 2011 (f) | $ | 17.92 | (0.20 | ) | 5.02 | 4.82 | (0.03 | ) | (0.03 | ) | $ | 22.71 | 26.82% | $ | 195,872,031 | 1.38% | (0.92% | ) | 1.54% | 23.00% | ||||||||||||||||||||||||||||||||
Year Ended July 31, 2010 (f) | $ | 15.03 | (0.15 | ) | 3.04 | 2.89 | – | – | $ | 17.92 | 19.22% | $ | 176,923,831 | 1.38% | (0.90% | ) | 1.57% | 26.00% | ||||||||||||||||||||||||||||||||||
Period Ended July 31, 2009 (f)(g) | $ | 13.53 | (0.10 | ) | 1.60 | 1.50 | – | – | $ | 15.03 | 11.16% | $ | 148,670,303 | 1.70% | (h) | (1.07% | ) | 1.72% | (h) | 24.00% | ||||||||||||||||||||||||||||||||
Year Ended October 31, 2008 | $ | 21.80 | (0.17 | ) (i) | (6.94 | ) | (7.11 | ) | (1.16 | ) | (1.16 | ) | $ | 13.53 | (34.29% | ) | $ | 132,591,915 | 1.38% | (0.91% | ) | 1.38% | 22.00% | |||||||||||||||||||||||||||||
| Class C Shares | ||||||||||||||||||||||||||||||||||||||||||||||||||||
Six Months Ended January 31, 2014 (f) (Unaudited) | $ | 25.52 | (0.19 | ) | 1.83 | 1.64 | (1.53 | ) | (1.53 | ) | $ | 25.63 | 6.47% | $ | 98,924,326 | 1.86% | (1.45% | ) | 1.86% | 17.85% | ||||||||||||||||||||||||||||||||
Year Ended July 31, 2013 (f) | $ | 21.29 | (0.32 | ) | 4.98 | 4.66 | (0.43 | ) | (0.43 | ) | $ | 25.52 | 22.26% | $ | 96,702,988 | 1.98% | (1.39% | ) | 1.95% | 26.00% | ||||||||||||||||||||||||||||||||
Year Ended July 31, 2012 (f) | $ | 20.96 | (0.32 | ) | 1.10 | 0.78 | (0.45 | ) | (0.45 | ) | $ | 21.29 | 3.77% | $ | 67,244,463 | 1.98% | (1.48% | ) | 2.01% | 17.00% | ||||||||||||||||||||||||||||||||
Year Ended July 31, 2011 (f) | $ | 16.64 | (0.31 | ) | 4.66 | 4.35 | (0.03 | ) | (0.03 | ) | $ | 20.96 | 26.14% | $ | 32,580,381 | 1.98% | (1.52% | ) | 2.04% | 23.00% | ||||||||||||||||||||||||||||||||
Year Ended July 31, 2010 (f) | $ | 14.04 | (0.24 | ) | 2.84 | 2.60 | – | – | $ | 16.64 | 18.52% | $ | 18,896,175 | 1.98% | (1.50% | ) | 2.07% | 26.00% | ||||||||||||||||||||||||||||||||||
Period Ended July 31, 2009 (f)(g) | $ | 12.70 | (0.16 | ) | 1.50 | 1.34 | – | – | $ | 14.04 | 10.55% | $ | 14,708,050 | 2.42% | (h) | (1.79% | ) | 2.42% | (h) | 24.00% | ||||||||||||||||||||||||||||||||
Year Ended October 31, 2008 | $ | 20.69 | (0.28 | ) (i) | (6.55 | ) | (6.83 | ) | (1.16 | ) | (1.16 | ) | $ | 12.70 | (34.80% | ) | $ | 14,432,997 | 2.13% | (1.66% | ) | 2.13% | 22.00% | |||||||||||||||||||||||||||||
| Institutional Service Class Shares (j) | ||||||||||||||||||||||||||||||||||||||||||||||||||||
Six Months Ended January 31, 2014 (f) (Unaudited) | $ | 28.41 | (0.10 | ) | 2.05 | 1.95 | (1.53 | ) | (1.53 | ) | $ | 28.83 | 6.91% | $ | 907,596,688 | 1.09% | (0.67% | ) | 1.10% | 17.85% | ||||||||||||||||||||||||||||||||
Year Ended July 31, 2013 (f) | $ | 23.46 | (0.14 | ) | 5.52 | 5.38 | (0.43 | ) | (0.43 | ) | $ | 28.41 | 23.28% | $ | 818,056,645 | 1.13% | (0.54% | ) | 1.02% | 26.00% | ||||||||||||||||||||||||||||||||
Year Ended July 31, 2012 (f) | $ | 22.85 | (0.15 | ) | 1.21 | 1.06 | (0.45 | ) | (0.45 | ) | $ | 23.46 | 4.70% | $ | 431,911,298 | 1.13% | (0.63% | ) | 1.26% | 17.00% | ||||||||||||||||||||||||||||||||
Year Ended July 31, 2011 (f) | $ | 17.98 | (0.15 | ) | 5.05 | 4.90 | (0.03 | ) | (0.03 | ) | $ | 22.85 | 27.25% | $ | 215,698,880 | 1.13% | (0.67% | ) | 1.29% | 23.00% | ||||||||||||||||||||||||||||||||
Year Ended July 31, 2010 (f) | $ | 15.04 | (0.11 | ) | 3.05 | 2.94 | – | – | $ | 17.98 | 19.55% | $ | 19,588,342 | 1.11% | (0.63% | ) | 1.32% | 26.00% | ||||||||||||||||||||||||||||||||||
Period Ended July 31, 2009 (f)(k) | $ | 14.07 | (0.01 | ) | 0.98 | 0.97 | – | – | $ | 15.04 | 6.89% | $ | 1,458,576 | 1.13% | (h) | (0.50% | ) | 1.25% | (h) | 24.00% | ||||||||||||||||||||||||||||||||
| Institutional Class Shares | ||||||||||||||||||||||||||||||||||||||||||||||||||||
Period Ended January 31, 2014 (f)(l) (Unaudited) | $ | 29.70 | 0.01 | 0.68 | 0.69 | (1.53 | ) | (1.53 | ) | $ | 28.86 | 2.37% | $ | 501,042 | 0.84% | 0.07% | 0.84% | 17.85% | ||||||||||||||||||||||||||||||||||
Amounts designated as “–” are zero or have been rounded to zero.
| (a) | Excludes sales charge. |
| (b) | Not annualized for periods less than one year. |
| (c) | Annualized for periods less than one year. |
| (d) | During the period, certain fees may have been waived and/or reimbursed. If such waivers/reimbursements had not occurred, the ratios would have been as indicated. |
| (e) | Portfolio turnover is calculated on the basis of the Fund as a whole without distinguishing among the classes of shares. |
| (f) | Per share calculations were performed using average shares method. |
| (g) | For the period from October 31, 2008 (predecessor fund fiscal year end) through July 31, 2009. |
| (h) | Ratios of expenses to average net assets include interest expenses of less that 0.005% for the period ended July 31, 2009, which is not included in the contractual expenses limitation. The interest expense is from utilizing a line of credit. |
| (i) | Per share amounts calculated using SEC method. |
| (j) | Effective September 16, 2013, Fiduciary Shares were renamed Institutional Service Class Shares. |
| (k) | For the period from June 26, 2009 (commencement of operations) through July 31, 2009. |
| (l) | For the period from September 19, 2013 (commencement of operations) through January 31, 2014. Total return is calculated based on inception date of September 18, 2013 through January 31, 2014. |
The accompanying notes are an integral part of these financial statements.
62
| Fund Commentary | Nationwide Geneva Small Cap Growth Fund |
For the semiannual period ended January 31, 2014, the Nationwide Geneva Small Cap Growth Fund (Institutional Service Class) returned 12.79%* versus 11.48% for its benchmark, the Russell 2000® Growth Index. For broader comparison, the median return for the Fund’s closest Lipper peer category of Small-Cap Growth Funds (consisting of 536 funds as of January 31, 2014) was 11.52% for the same time period.
*Performance prior to the Fund’s inception on September 16, 2013, is based on the performance of the Fund’s predecessor fund.
The sectors that contributed to relative Fund performance during the reporting period were technology, financial services and energy. The greatest-contributing stocks to Fund performance during the reporting period were Tyler Technologies, Concur Technologies, Envestnet and Interactive Intelligence in the technology sector, Medidata Solutions in the health-care sector and Middleby Corp. in the producer durables sector.
The Fund’s holdings in the health-care and consumer discretionary sectors were the most significant detractors from relative Fund performance during the reporting period. Individual Fund holdings that detracted from the Fund’s performance during the reporting period were Chart Industries in the producer durables sector, Infoblox in the technology sector, and BJ’s Restaurant and Ulta Salon, both in the consumer discretionary sector. BJ’s Restaurant and Ulta Salon were sold from the Fund during the reporting period.
Subadviser:
Geneva Capital Management Ltd.
Portfolio Managers:
Amy S. Croen, Michelle J. Picard,
William A. Priebe and William Scott Priebe
The Fund is subject to the risks of investing in equity securities and risks associated with investing in stocks of smaller companies. Growth funds may underperform other funds that use different investing styles. Please refer to the summary prospectus for a more detailed explanation of the Fund’s principal risks.
A description of the benchmarks can be found on the Market Index Definitions page at the back of this book.
63
| Fund Overview (Unaudited) | Nationwide Geneva Small Cap Growth Fund |
Objective
The Fund seeks long-term capital appreciation.
Highlights
| Ÿ | For the semiannual period ended January 31, 2014, the Fund (Institutional Service Class) returned 12.79%, outperforming the benchmark by 1.31% and the Lipper peer category by 1.27%. |
| Ÿ | The sectors that contributed to relative Fund performance during the reporting period were technology, financial services and energy. |
| Ÿ | The Fund’s holdings in the health-care and consumer discretionary sectors were the most significant detractors from relative Fund performance during the reporting period. |
Asset Allocation†
| Common Stocks | 95.5% | |||
| Mutual Fund | 5.6% | |||
| Liabilities in excess of other assets | (1.1)% | |||
| 100.0% |
Top Industries††
| Software | 14.8% | |||
| Machinery | 11.4% | |||
| Health Care Equipment & Supplies | 7.0% | |||
| Specialty Retail | 5.1% | |||
| Oil, Gas & Consumable Fuels | 5.1% | |||
| Commercial Banks | 4.7% | |||
| Health Care Providers & Services | 4.7% | |||
| Life Sciences Tools & Services | 4.1% | |||
| Chemicals | 3.6% | |||
| Health Care Technology | 3.4% | |||
| Other Industries | 36.1% | |||
| 100.0% |
Top Holdings††
| Fidelity Institutional Money Market Fund — Institutional Class | 5.5% | |||
| Medidata Solutions, Inc. | 3.4% | |||
| Tyler Technologies, Inc. | 3.2% | |||
| MWI Veterinary Supply, Inc. | 3.1% | |||
| Middleby Corp. (The) | 3.0% | |||
| Ultimate Software Group, Inc. (The) | 2.7% | |||
| Concur Technologies, Inc. | 2.6% | |||
| Interactive Intelligence Group, Inc. | 2.6% | |||
| MarketAxess Holdings, Inc. | 2.6% | |||
| Bank of the Ozarks, Inc. | 2.5% | |||
| Other Holdings | 68.8% | |||
| 100.0% |
| † | Percentages indicated are based upon net assets as of January 31, 2014. |
| †† | Percentages indicated are based upon total investments as of January 31, 2014. |
64
| Fund Performance | Nationwide Geneva Small Cap Growth Fund |
Average Annual Total Return
(For periods ended January 31, 2014)
| Six Months* | 1 Yr. | Since Inception | ||||||||||||
| Class A | w/o SC1 | 12.66% | 32.75% | 22.05% | 6 | |||||||||
| w/SC2 | 6.47% | 25.44% | 20.58% | 6 | ||||||||||
| Class C | w/o SC1 | 12.29% | 31.93% | 21.34% | 6 | |||||||||
| w/SC3 | 11.29% | 30.93% | 21.34% | 6 | ||||||||||
| Institutional Service Class4,5 | w/o SC | 12.79% | 33.06% | 22.36% | 6 | |||||||||
| Institutional Class4 | w/o SC | — | — | 6.21% | 7 | |||||||||
All figures showing the effect of a sales charge (SC) reflect the maximum charge possible, because it has the most significant effect on performance data.
| * | Not annualized. |
| 1 | These returns do not reflect the effects of SCs. |
| 2 | For the period from September 16, 2013 through January 31, 2014 a front-end sales charge of 5.75% was deducted. Prior to September 16, 2013, a front-end sales charge of 5.50% was deducted. |
| 3 | A 1.00% CDSC was deducted from the one year return because it is charged when you sell Class C shares within the first year after purchase. |
| 4 | Not subject to any SCs. |
| 5 | Effective September 16, 2013 Fiduciary Shares were renamed Institutional Service Class Shares. |
| 6 | Since inception date of June 12, 2009. |
| 7 | Since inception date of September 18, 2013. Not Annualized. |
Expense Ratios
| Gross Expense Ratio* | Net Expense Ratio* | |||||
| Class A | 1.85% | 1.62% | ||||
| Class C | 2.35% | 2.22% | ||||
| Institutional Service Class | 1.60% | 1.37% | ||||
| Institutional Class | 1.35% | 1.22% | ||||
| * | Current effective prospectus dated September 16, 2013. The difference between gross and net operating expenses reflects contractual waivers in place through November 30, 2015. Please see the Fund’s most recent prospectus for details. |
65
| Fund Performance | Nationwide Geneva Small Cap Growth Fund |
Performance of a $10,000 Investment
Investment return and principal value will fluctuate, and when redeemed, shares may be worth more or less than original cost. Past performance is no guarantee of future results and does not reflect the deduction of taxes that a shareholder would pay on fund distributions or the redemption of fund shares. Investing in mutual funds involves market risk, including loss of principal. Performance returns assume the reinvestment of all distributions.
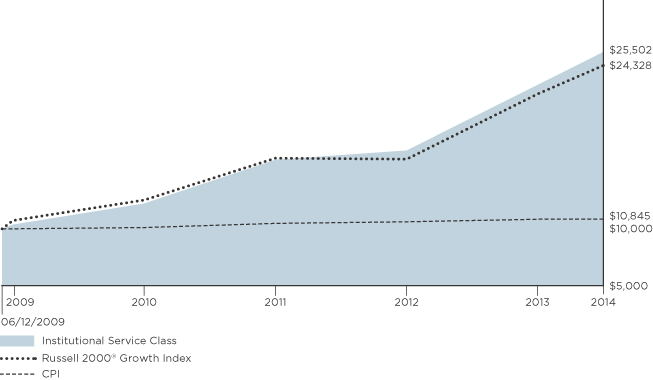
Comparative performance of $10,000 invested in Institutional Service Class shares of the Nationwide Geneva Small Cap Growth Fund since inception* through 1/31/14 versus the Russell 2000® Growth Index and the Consumer Price Index (CPI) for the same period. Fund performance prior to the Fund’s inception on 9/16/13 is based on the Fund’s predecessor Fund. Unlike the Fund, the performance for these unmanaged indexes does not reflect any fees, expenses, or sales charges. One cannot invest directly in a market index. A description of the benchmarks can be found on the Market Index Definitions page at the back of this book.
*The inception date for the Nationwide Geneva Small Cap Growth Fund is 9/16/13. Performance prior to that date is based on the since-inception performance of the Fund’s predecessor fund.
66
| Shareholder Expense Example | Nationwide Geneva Small Cap Growth Fund |
As a shareholder of the Fund, you incur two types of costs: (1) transaction costs, including sales charges (loads) paid on purchase payments and redemption fees; and (2) ongoing costs, including investment advisory fees, administration fees, distribution fees and other Fund expenses. The examples below are intended to help you understand your ongoing costs (in dollars) of investing in the Fund and to compare these costs with the ongoing costs of investing in other mutual funds. Per Securities and Exchange Commission (“SEC”) requirements, the examples assume that you had a $1,000 investment in the Class at the beginning of the reporting period (August 1, 2013) and continued to hold your shares at the end of the reporting period (January 31, 2014).
Actual Expenses
For each Class of the Fund in the table below, the first line provides information about actual account values and actual expenses. You may use the information in this line, together with the amount you invested, to estimate the expenses that you paid from August 1, 2013 through January 31, 2014. Simply divide your account value by $1,000 (for example, an $8,600 account value divided by $1,000 = 8.6), then multiply the result by the number in the first line of each Class under the heading entitled “Expenses Paid During Period” to estimate the expenses you paid on your account during this period.
Hypothetical Expenses for Comparison Purposes
The second line of each Class in the table below provides information about hypothetical account values and hypothetical expenses based on the Class’ actual expense ratio and an assumed rate of return of 5% per year before expenses, which is not the Class’ actual return. The hypothetical account values and expenses may not be used to estimate the actual ending account balance or expenses you paid for the period from August 1, 2013 through January 31, 2014. You may use this information to compare the ongoing costs of investing in the Class of the Fund and other funds. To do so, compare this 5% hypothetical example with the 5% hypothetical examples that appear in the shareholder reports of the other funds.
Please note that the expenses shown in the table are meant to highlight your ongoing costs only and do not reflect any transaction costs, such as sales charges (loads) or redemption fees. If these transaction costs were included, your costs would have been higher. Therefore, the second line for each Class in the table is useful in comparing ongoing costs only, and will not help you determine the relative total costs of owning different funds. The examples also assume all dividends and distributions are reinvested.
Schedule of Shareholder Expenses
Expense Analysis of a $1,000 Investment
Nationwide Geneva Small Cap January 31, 2014 | Beginning Account Value ($) 08/01/13 | Ending Account Value ($) 01/31/14 | Expenses Paid During Period ($) 08/01/13 - 01/31/14 | Expense Ratio During Period (%) 08/01/13 - 01/31/14 | ||||||||
| Class A Shares | Actual | a | 1,000.00 | 1,126.60 | 8.68 | 1.62 | ||||||
| Hypothetical | a,b | 1,000.00 | 1,017.04 | 8.24 | 1.62 | |||||||
| Class C Shares | Actual | a | 1,000.00 | 1,122.90 | 11.88 | 2.22 | ||||||
| Hypothetical | a,b | 1,000.00 | 1,014.01 | 11.27 | 2.22 | |||||||
| Institutional Service Class Sharesc | Actual | a | 1,000.00 | 1,127.90 | 7.35 | 1.37 | ||||||
| Hypothetical | a,b | 1,000.00 | 1,018.30 | 6.97 | 1.37 | |||||||
| Institutional Class Shares | Actual | d | 1,000.00 | 1,062.10 | 4.65 | 1.22 | ||||||
| Hypothetical | a,b | 1,000.00 | 1,019.06 | 6.21 | 1.22 | |||||||
| a | Expenses are equal to the Fund’s annualized expense ratio multiplied by the average account value from August 1, 2013 through January 31, 2014 multiplied to reflect one-half year period. The expense ratio presented represents a six-month, annualized ratio in accordance with Securities and Exchange Commission guidelines. |
| b | Represents the hypothetical 5% return before expenses. |
| c | Effective September 16, 2013, Fiduciary Shares were renamed Institutional Service Class Shares. Class Shares |
| d | Actual expenses are equal to the Fund’s annualized expense ratio multiplied by the average account value from September 19, 2013 through January 31, 2014 to reflect the period from commencement of operations. |
67
Statement of Investments
January 31, 2014 (Unaudited)
Nationwide Geneva Small Cap Growth Fund
| Common Stocks 95.5% | ||||||||||
| Shares | Market Value | |||||||||
| ||||||||||
Air Freight & Logistics 1.3% | ||||||||||
Echo Global Logistics, Inc.* | 97,524 | $ | 1,978,762 | |||||||
|
| |||||||||
| ||||||||||
Airlines 1.9% | ||||||||||
Allegiant Travel Co. | 31,294 | 2,849,945 | ||||||||
|
| |||||||||
| ||||||||||
Capital Markets 1.0% | ||||||||||
Affiliated Managers Group, Inc.* | 7,177 | 1,429,945 | ||||||||
|
| |||||||||
| ||||||||||
Chemicals 3.6% | ||||||||||
Balchem Corp. | 53,116 | 2,895,884 | ||||||||
Sensient Technologies Corp. | 51,185 | 2,503,970 | ||||||||
|
| |||||||||
| 5,399,854 | ||||||||||
|
| |||||||||
| ||||||||||
Commercial Banks 4.8% | ||||||||||
Bank of the Ozarks, Inc. | 59,309 | 3,760,191 | ||||||||
Texas Capital Bancshares, Inc.* | 56,613 | 3,366,775 | ||||||||
|
| |||||||||
| 7,126,966 | ||||||||||
|
| |||||||||
| ||||||||||
Commercial Services & Supplies 3.3% | ||||||||||
Healthcare Services Group, Inc. | 103,900 | 2,818,807 | ||||||||
Team, Inc.* | 48,125 | 2,037,131 | ||||||||
|
| |||||||||
| 4,855,938 | ||||||||||
|
| |||||||||
| ||||||||||
Distributors 0.9% | ||||||||||
LKQ Corp.* | 51,695 | 1,399,384 | ||||||||
|
| |||||||||
| ||||||||||
Diversified Financial Services 2.6% | ||||||||||
MarketAxess Holdings, Inc. | 61,021 | 3,828,458 | ||||||||
|
| |||||||||
| ||||||||||
Electrical Equipment 2.4% | ||||||||||
Acuity Brands, Inc. | 28,051 | 3,563,599 | ||||||||
|
| |||||||||
| ||||||||||
Electronic Equipment, Instruments & Components 1.4% |
| |||||||||
Cognex Corp.* | 53,953 | 2,128,446 | ||||||||
|
| |||||||||
| ||||||||||
Energy Equipment & Services 1.6% | ||||||||||
Dril-Quip, Inc.* | 23,534 | 2,366,579 | ||||||||
|
| |||||||||
| ||||||||||
Food Products 3.1% | ||||||||||
J&J Snack Foods Corp. | 31,949 | 2,814,707 | ||||||||
TreeHouse Foods, Inc.* | 27,869 | 1,834,895 | ||||||||
|
| |||||||||
| 4,649,602 | ||||||||||
|
| |||||||||
| ||||||||||
Health Care Equipment & Supplies 7.0% | ||||||||||
ABIOMED, Inc.* | 99,382 | 2,732,011 | ||||||||
Cantel Medical Corp. | 100,803 | 3,195,455 | ||||||||
Haemonetics Corp.* | 45,902 | 1,739,227 | ||||||||
Neogen Corp.* | 65,903 | 2,769,244 | ||||||||
|
| |||||||||
| 10,435,937 | ||||||||||
|
| |||||||||
| ||||||||||
Health Care Providers & Services 4.7% | ||||||||||
IPC The Hospitalist Co., Inc.* | 45,028 | 2,403,595 | ||||||||
MWI Veterinary Supply, Inc.* | 24,627 | 4,587,025 | ||||||||
|
| |||||||||
| 6,990,620 | ||||||||||
|
| |||||||||
| Common Stocks (continued) | ||||||||||
| Shares | Market Value | |||||||||
| ||||||||||
Health Care Technology 3.5% | ||||||||||
Medidata Solutions, Inc.* | 81,531 | $ | 5,144,606 | |||||||
|
| |||||||||
| ||||||||||
Hotels, Restaurants & Leisure 3.4% | ||||||||||
Chuy’s Holdings, Inc.* | 57,706 | 2,084,341 | ||||||||
Panera Bread Co., Class A* | 12,095 | 2,044,901 | ||||||||
Red Robin Gourmet Burgers, Inc.* | 13,844 | 891,969 | ||||||||
|
| |||||||||
| 5,021,211 | ||||||||||
|
| |||||||||
| ||||||||||
Internet Software & Services 2.9% | ||||||||||
Envestnet, Inc.* | 66,012 | 2,822,013 | ||||||||
NIC, Inc. | 64,445 | 1,401,034 | ||||||||
|
| |||||||||
| 4,223,047 | ||||||||||
|
| |||||||||
| ||||||||||
Life Sciences Tools & Services 4.2% | ||||||||||
PAREXEL International Corp.* | 69,691 | 3,401,618 | ||||||||
Techne Corp. | 31,075 | 2,823,785 | ||||||||
|
| |||||||||
| 6,225,403 | ||||||||||
|
| |||||||||
| ||||||||||
Machinery 11.5% | ||||||||||
Barnes Group, Inc. | 75,338 | 2,820,655 | ||||||||
Chart Industries, Inc.* | 28,343 | 2,421,626 | ||||||||
Donaldson Co., Inc. | 56,540 | 2,332,840 | ||||||||
Middleby Corp. (The)* | 18,069 | 4,455,454 | ||||||||
Proto Labs, Inc.* | 25,101 | 1,992,015 | ||||||||
RBC Bearings, Inc.* | 46,777 | 3,033,021 | ||||||||
|
| |||||||||
| 17,055,611 | ||||||||||
|
| |||||||||
| ||||||||||
Oil, Gas & Consumable Fuels 5.1% | ||||||||||
Bonanza Creek Energy, Inc.* | 45,137 | 1,837,527 | ||||||||
Gulfport Energy Corp.* | 48,744 | 2,970,947 | ||||||||
SM Energy Co. | 33,516 | 2,773,784 | ||||||||
|
| |||||||||
| 7,582,258 | ||||||||||
|
| |||||||||
| ||||||||||
Professional Services 1.5% | ||||||||||
Advisory Board Co. (The)* | 34,500 | 2,184,195 | ||||||||
|
| |||||||||
| ||||||||||
Road & Rail 2.4% | ||||||||||
Genesee & Wyoming, Inc., Class A* | 22,040 | 1,991,094 | ||||||||
Marten Transport Ltd. | 84,992 | 1,620,797 | ||||||||
|
| |||||||||
| 3,611,891 | ||||||||||
|
| |||||||||
| ||||||||||
Software 15.0% | ||||||||||
Bottomline Technologies de, Inc.* | 74,318 | 2,572,889 | ||||||||
Concur Technologies, Inc.* | 32,787 | 3,978,375 | ||||||||
FactSet Research Systems, Inc. | 10,237 | 1,082,768 | ||||||||
Infoblox, Inc.* | 52,460 | 1,840,297 | ||||||||
Interactive Intelligence Group, Inc.* | 51,549 | 3,914,631 | ||||||||
Tyler Technologies, Inc.* | 45,647 | 4,813,476 | ||||||||
Ultimate Software Group, Inc. (The)* | 24,958 | 4,073,894 | ||||||||
|
| |||||||||
| 22,276,330 | ||||||||||
|
| |||||||||
| ||||||||||
Specialty Retail 5.2% | ||||||||||
Hibbett Sports, Inc.* | 45,829 | 2,750,198 | ||||||||
68
Statement of Investments (Continued)
January 31, 2014 (Unaudited)
Nationwide Geneva Small Cap Growth Fund (Continued)
| Common Stocks (continued) | ||||||||||
| Shares | Market Value | |||||||||
| ||||||||||
Specialty Retail (continued) | ||||||||||
Monro Muffler Brake, Inc. | 57,050 | $ | 3,166,845 | |||||||
Vitamin Shoppe, Inc.* | 38,835 | 1,740,585 | ||||||||
|
| |||||||||
| 7,657,628 | ||||||||||
|
| |||||||||
| ||||||||||
Trading Companies & Distributors 1.2% |
| |||||||||
Beacon Roofing Supply, Inc.* | 48,635 | 1,837,917 | ||||||||
|
| |||||||||
Total Common Stocks |
| 141,824,132 | ||||||||
|
| |||||||||
| Mutual Fund 5.6% | ||||||||||
Money Market Fund 5.6% | ||||||||||
Fidelity Institutional Money Market Fund — Institutional Class, 0.08% (a) | 8,258,162 | 8,258,162 | ||||||||
|
| |||||||||
Total Mutual Fund |
| 8,258,162 | ||||||||
|
| |||||||||
Total Investments |
| 150,082,294 | ||||||||
Liabilities in excess of other assets — (1.1%) |
| (1,635,865 | ) | |||||||
|
| |||||||||
NET ASSETS — 100.0% | $ | 148,446,429 | ||||||||
|
| |||||||||
| * | Denotes a non-income producing security. |
| (a) | Represents 7-day effective yield as of January 31, 2014. |
| (b) | See notes to financial statements for tax cost and unrealized appreciation/(depreciation) of securities. |
| Ltd. | Limited |
The accompanying notes are an integral part of these financial statements.
69
Statement of Assets and Liabilities
January 31, 2014 (Unaudited)
| Nationwide Geneva Small Cap Growth Fund | ||||||
Assets: | ||||||
Investments, at value (cost $115,318,305) | $ | 150,082,294 | ||||
Dividends receivable | 3,870 | |||||
Receivable for capital shares issued | 824,122 | |||||
Prepaid expenses | 18,189 | |||||
|
| |||||
Total Assets | 150,928,475 | |||||
|
| |||||
Liabilities: | ||||||
Payable for investments purchased | 2,172,594 | |||||
Payable for capital shares redeemed | 66,942 | |||||
Accrued expenses and other payables: | ||||||
Investment advisory fees | 123,409 | |||||
Fund administration fees | 15,063 | |||||
Distribution fees | 22,115 | |||||
Administrative servicing fees | 46,862 | |||||
Accounting and transfer agent fees | 4,053 | |||||
Trustee fees | 869 | |||||
Deferred compensation (Note 2) | 5,466 | |||||
Custodian fees | 754 | |||||
Compliance program costs (Note 3) | 434 | |||||
Professional fees | 12,654 | |||||
Printing fees | 10,183 | |||||
Other | 648 | |||||
|
| |||||
Total Liabilities | 2,482,046 | |||||
|
| |||||
Net Assets | $ | 148,446,429 | ||||
|
| |||||
Represented by: | ||||||
Capital | $ | 114,101,411 | ||||
Accumulated net investment loss | (1,472,669 | ) | ||||
Accumulated net realized gains from investment transactions | 1,053,698 | |||||
Net unrealized appreciation/(depreciation) from investments | 34,763,989 | |||||
|
| |||||
Net Assets | $ | 148,446,429 | ||||
|
| |||||
70
Statement of Assets and Liabilities (Continued)
January 31, 2014 (Unaudited)
| Nationwide Geneva Small Cap Growth Fund | ||||||
Net Assets: | ||||||
Class A Shares | $ | 38,296,048 | ||||
Class C Shares | 16,806,792 | |||||
Institutional Service Class Shares | 93,281,665 | |||||
Institutional Class Shares | 61,924 | |||||
|
| |||||
Total | $ | 148,446,429 | ||||
|
| |||||
Shares Outstanding (unlimited number of shares authorized): | ||||||
Class A Shares | 876,535 | |||||
Class C Shares | 396,264 | |||||
Institutional Service Class Shares | 2,107,373 | |||||
Institutional Class Shares | 1,398 | |||||
|
| |||||
Total | 3,381,570 | |||||
|
| |||||
Net asset value and redemption price per share (Net assets by class divided by shares outstanding by | ||||||
Class A Shares (a) | $ | 43.69 | ||||
Class C Shares (b) | $ | 42.41 | ||||
Institutional Service Class Shares | $ | 44.26 | ||||
Institutional Class Shares | $ | 44.29 | ||||
Maximum offering price per share (100%/(100%-maximum sales charge) of net asset value adjusted to the nearest cent): | ||||||
Class A Shares | $ | 46.36 | ||||
|
| |||||
Maximum Sales Charge: | ||||||
Class A Shares | 5.75 | % | ||||
|
| |||||
| (a) | For Class A Shares, the redemption price per share is reduced by 1.00% on sales of shares of original purchases of $1,000,000 or more or that were not subject to a front-end sales charge made within 18 months of the purchase date. |
| (b) | For Class C Shares, the redemption price per share is reduced by 1.00% for shares held less than 1 year. |
The accompanying notes are an integral part of these financial statements.
71
Statement of Operations
For the Six Months Ended January 31, 2014 (Unaudited)
| Nationwide Geneva Small Cap Growth Fund | ||||||
INVESTMENT INCOME: | ||||||
Dividend income | $ | 270,821 | ||||
|
| |||||
Total Income | 270,821 | |||||
|
| |||||
EXPENSES: | ||||||
Investment advisory fees | 640,164 | |||||
Fund administration fees | 83,551 | |||||
Distribution fees Class A | 38,224 | |||||
Distribution fees Class C | 73,074 | |||||
Administrative servicing fees Class A | 26,043 | |||||
Administrative servicing fees Institutional Service Class (a) | 71,596 | |||||
Registration and filing fees | 29,365 | |||||
Professional fees | 16,803 | |||||
Printing fees | 19,371 | |||||
Trustee fees | 2,190 | |||||
Custodian fees | 2,572 | |||||
Accounting and transfer agent fees | 14,404 | |||||
Compliance program costs (Note 3) | 1,768 | |||||
Other | 6,930 | |||||
|
| |||||
Total expenses before earnings credit, fees waived, and expenses reimbursed | 1,026,055 | |||||
|
| |||||
Earnings credit (Note 5) | (37 | ) | ||||
Administrative servicing fees voluntarily waived — Class A (Note 3) | (3,108 | ) | ||||
Administrative servicing fees voluntarily waived — Institutional Service Class (a) (Note 3) | (9,476 | ) | ||||
Expenses reimbursed by adviser (Note 3) | (34,707 | ) | ||||
|
| |||||
Net Expenses | 978,727 | |||||
|
| |||||
NET INVESTMENT LOSS | (707,906 | ) | ||||
|
| |||||
REALIZED/UNREALIZED GAINS (LOSSES) FROM INVESTMENTS: | ||||||
Net realized gains from investment transactions | 2,670,824 | |||||
Net change in unrealized appreciation/(depreciation) from investments | 12,343,218 | |||||
|
| |||||
Net realized/unrealized gains from investments | 15,014,042 | |||||
|
| |||||
CHANGE IN NET ASSETS RESULTING FROM OPERATIONS | $ | 14,306,136 | ||||
|
| |||||
| (a) | Effective September 16, 2013, Fiduciary Shares were renamed Institutional Service Class Shares. |
The accompanying notes are an integral part of these financial statements.
72
Statements of Changes in Net Assets
| Nationwide Geneva Small Cap Growth Fund | ||||||||||||
| Six Months Ended January 31, 2014 (Unaudited) | Year Ended July 31, 2013 | |||||||||||
Operations: | ||||||||||||
Net investment loss | $ | (707,906 | ) | $ | (764,763 | ) | ||||||
Net realized gains from investment transactions | 2,670,824 | 4,210,112 | ||||||||||
Net change in unrealized appreciation/(depreciation) from investments | 12,343,218 | 18,438,559 | ||||||||||
|
|
|
| |||||||||
Change in net assets resulting from operations | 14,306,136 | 21,883,908 | ||||||||||
|
|
|
| |||||||||
Distributions to Shareholders From: | ||||||||||||
Net realized gains: | ||||||||||||
Class A | (1,065,380 | ) | (583,961 | ) | ||||||||
Class C | (502,214 | ) | (285,618 | ) | ||||||||
Institutional Service Class (a) | (2,586,446 | ) | (1,574,763 | ) | ||||||||
Institutional Class | (325 | )(b) | – | |||||||||
|
|
|
| |||||||||
Change in net assets from shareholder distributions | (4,154,365 | ) | (2,444,342 | ) | ||||||||
|
|
|
| |||||||||
Change in net assets from capital transactions | 28,618,575 | 51,141,945 | ||||||||||
|
|
|
| |||||||||
Change in net assets | 38,770,346 | 70,581,511 | ||||||||||
|
|
|
| |||||||||
Net Assets: | ||||||||||||
Beginning of period | 109,676,083 | 39,094,572 | ||||||||||
|
|
|
| |||||||||
End of period | $ | 148,446,429 | $ | 109,676,083 | ||||||||
|
|
|
| |||||||||
Accumulated net investment loss at end of period | $ | (1,472,669 | ) | $ | (764,763 | ) | ||||||
|
|
|
| |||||||||
CAPITAL TRANSACTIONS: | ||||||||||||
Class A Shares | ||||||||||||
Proceeds from shares issued | $ | 17,034,350 | $ | 15,711,087 | ||||||||
Dividends reinvested | 1,038,753 | 552,963 | ||||||||||
Cost of shares redeemed | (6,622,041 | ) | (6,057,104 | ) | ||||||||
|
|
|
| |||||||||
Total Class A Shares | 11,451,062 | 10,206,946 | ||||||||||
|
|
|
| |||||||||
Class C Shares | ||||||||||||
Proceeds from shares issued | 4,465,047 | 6,971,615 | ||||||||||
Dividends reinvested | 493,337 | 281,159 | ||||||||||
Cost of shares redeemed | (1,135,677 | ) | (1,075,169 | ) | ||||||||
|
|
|
| |||||||||
Total Class C Shares | 3,822,707 | 6,177,605 | ||||||||||
|
|
|
| |||||||||
Institutional Service Class Shares (a) | ||||||||||||
Proceeds from shares issued | 28,571,816 | 47,263,193 | ||||||||||
Dividends reinvested | 2,109,679 | 1,100,299 | ||||||||||
Cost of shares redeemed | (17,398,296 | ) | (13,606,098 | ) | ||||||||
|
|
|
| |||||||||
Total Institutional Service Class Shares | 13,283,199 | 34,757,394 | ||||||||||
|
|
|
| |||||||||
| (a) | Effective September 16, 2013, Fiduciary Shares were renamed Institutional Service Class Shares. |
(b) For the period from September 19, 2013 (commencement of operations) through January 31, 2014.
73
Statements of Changes in Net Assets (Continued)
Nationwide Geneva | ||||||||||||
| Six Months Ended January 31, 2014 (Unaudited) | Year Ended July 31, 2013 | |||||||||||
CAPITAL TRANSACTIONS: (continued) | ||||||||||||
Institutional Class Shares | ||||||||||||
Proceeds from shares issued | $ | 61,298 | (b) | $ | – | |||||||
Dividends reinvested | 325 | (b) | – | |||||||||
Cost of shares redeemed | (16 | )(b) | – | |||||||||
|
|
|
| |||||||||
Total Institutional Class Shares | 61,607 | (b) | – | |||||||||
|
|
|
| |||||||||
Change in net assets from capital transactions | $ | 28,618,575 | $ | 51,141,945 | ||||||||
|
|
|
| |||||||||
SHARE TRANSACTIONS: | ||||||||||||
Class A Shares | ||||||||||||
Issued | 389,828 | 457,436 | ||||||||||
Reinvested | 24,367 | 17,383 | ||||||||||
Redeemed | (152,603 | ) | (176,348 | ) | ||||||||
|
|
|
| |||||||||
Total Class A Shares | 261,592 | 298,471 | ||||||||||
|
|
|
| |||||||||
Class C Shares | ||||||||||||
Issued | 104,997 | 205,357 | ||||||||||
Reinvested | 11,911 | 9,035 | ||||||||||
Redeemed | (27,065 | ) | (31,379 | ) | ||||||||
|
|
|
| |||||||||
Total Class C Shares | 89,843 | 183,013 | ||||||||||
|
|
|
| |||||||||
Institutional Service Class Shares (a) | ||||||||||||
Issued | 651,290 | 1,350,672 | ||||||||||
Reinvested | 48,858 | 34,256 | ||||||||||
Redeemed | (396,872 | ) | (383,045 | ) | ||||||||
|
|
|
| |||||||||
Total Institutional Service Class Shares | 303,276 | 1,001,883 | ||||||||||
|
|
|
| |||||||||
Institutional Class Shares | ||||||||||||
Issued | 1,391 | (b) | – | |||||||||
Reinvested | 8 | (b) | – | |||||||||
Redeemed | (1 | )(b) | – | |||||||||
|
|
|
| |||||||||
Total Institutional Class Shares | 1,398 | (b) | – | |||||||||
|
|
|
| |||||||||
Total change in shares | 656,109 | 1,483,367 | ||||||||||
|
|
|
| |||||||||
Amounts designated as “–” are zero or have been rounded to zero.
| (a) | Effective September 16, 2013, Fiduciary Shares were renamed Institutional Service Class Shares. |
| (b) | For the period from (b) September 19, 2013 (commencement of operations) through January 31, 2014. |
The accompanying notes are an integral part of these financial statements.
74
Financial Highlights
Selected data for each share of capital outstanding throughout the periods indicated
Nationwide Geneva Small Cap Growth Fund
| Operations | Distributions | Ratios/Supplemental Data | ||||||||||||||||||||||||||||||||||||||||||||||||||||||
| Net Asset Value, Beginning of Period | Net Investment Loss | Net Realized Gains | Total from Operations | Net Realized Gains | Total Distributions | Redemption Fees | Net Asset Value, End of Period | Total Return(a)(b) | Net Assets at End of Period | Ratio of Expenses to Average Net Assets(c) | Ratio of Net Investment Loss to Average Net Assets(c) | Ratio of Expenses (Prior to Reimbursements) to Average Net Assets(c)(d) | Portfolio Turnover(e) | |||||||||||||||||||||||||||||||||||||||||||
| Class A Shares | ||||||||||||||||||||||||||||||||||||||||||||||||||||||||
Six Months Ended January 31, 2014(f) (Unaudited) | $ | 40.05 | (0.26 | ) | 5.30 | 5.04 | (1.40 | ) | (1.40 | ) | – | $ | 43.69 | 12.66% | $ | 38,296,048 | 1.62% | (1.20 | )% | 1.69% | 11.81% | |||||||||||||||||||||||||||||||||||
Year Ended July 31, 2013(f) | $ | 31.36 | (0.42 | ) | 10.63 | 10.21 | (1.52 | ) | (1.52 | ) | – | $ | 40.05 | 33.86% | $ | 24,629,215 | 1.62% | (1.21 | )% | 1.88% | 30.00% | |||||||||||||||||||||||||||||||||||
Year Ended July 31, 2012(f) | $ | 30.87 | (0.38 | ) | 1.80 | 1.42 | (0.93 | ) | (0.93 | ) | – | $ | 31.36 | 4.69% | $ | 9,925,067 | 1.62% | (1.26 | )% | 2.07% | 45.00% | |||||||||||||||||||||||||||||||||||
Year Ended July 31, 2011(f) | $ | 24.39 | (0.39 | ) | 7.90 | 7.51 | (1.03 | ) | (1.03 | ) | – | $ | 30.87 | 30.90% | $ | 9,000,251 | 1.62% | (1.30 | )% | 2.25% | 45.00% | |||||||||||||||||||||||||||||||||||
Year Ended July 31, 2010(f) | $ | 20.70 | (0.26 | ) | 3.95 | 3.69 | – | – | – | $ | 24.39 | 17.83% | $ | 3,220,168 | 1.62% | (1.15 | )% | 2.73% | 62.00% | |||||||||||||||||||||||||||||||||||||
Period Ended July 31, 2009(f)(g) | $ | 20.00 | (0.03 | ) | 0.73 | 0.70 | – | – | – | $ | 20.70 | 3.50% | $ | 1,987,979 | 1.62% | (0.98 | )% | 8.59% | 7.00% | |||||||||||||||||||||||||||||||||||||
| Class C Shares | ||||||||||||||||||||||||||||||||||||||||||||||||||||||||
Six Months Ended January 31, 2014(f) (Unaudited) | $ | 39.04 | (0.38 | ) | 5.15 | 4.77 | (1.40 | ) | (1.40 | ) | – | $ | 42.41 | 12.29% | $ | 16,806,792 | 2.22% | (1.79 | )% | 2.27% | 11.81% | |||||||||||||||||||||||||||||||||||
Year Ended July 31, 2013(f) | $ | 30.78 | (0.62 | ) | 10.40 | 9.78 | (1.52 | ) | (1.52 | ) | – | $ | 39.04 | 33.08% | $ | 11,961,250 | 2.22% | (1.81 | )% | 2.38% | 30.00% | |||||||||||||||||||||||||||||||||||
Year Ended July 31, 2012(f) | $ | 30.49 | (0.56 | ) | 1.78 | 1.22 | (0.93 | ) | (0.93 | ) | – | $ | 30.78 | 4.09% | $ | 3,798,576 | 2.22% | (1.86 | )% | 2.57% | 45.00% | |||||||||||||||||||||||||||||||||||
Year Ended July 31, 2011(f) | $ | 24.23 | (0.58 | ) | 7.87 | 7.29 | (1.03 | ) | (1.03 | ) | – | $ | 30.49 | 30.18% | $ | 2,133,507 | 2.22% | (1.90 | )% | 2.75% | 45.00% | |||||||||||||||||||||||||||||||||||
Year Ended July 31, 2010(f) | $ | 20.69 | (0.40 | ) | 3.94 | 3.54 | – | – | – | $ | 24.23 | 17.11% | $ | 259,851 | 2.22% | (1.75 | )% | 3.23% | 62.00% | |||||||||||||||||||||||||||||||||||||
Period Ended July 31, 2009(f)(g) | $ | 20.00 | (0.04 | ) | 0.73 | 0.69 | – | – | – | $ | 20.69 | 3.45% | $ | 36,280 | 2.22% | (1.58 | )% | 9.09% | 7.00% | |||||||||||||||||||||||||||||||||||||
| Institutional Service Class Shares(h) | ||||||||||||||||||||||||||||||||||||||||||||||||||||||||
Six Months Ended January 31, 2014(f) (Unaudited) | $ | 40.51 | (0.21 | ) | 5.36 | 5.15 | (1.40 | ) | (1.40 | ) | – | $ | 44.26 | 12.79% | $ | 93,281,665 | 1.37% | (0.95 | )% | 1.45% | 11.81% | |||||||||||||||||||||||||||||||||||
Year Ended July 31, 2013(f) | $ | 31.63 | (0.34 | ) | 10.74 | 10.40 | (1.52 | ) | (1.52 | ) | – | $ | 40.51 | 34.18% | $ | 73,085,618 | 1.36% | (0.95 | )% | 1.63% | 30.00% | |||||||||||||||||||||||||||||||||||
Year Ended July 31, 2012(f) | $ | 31.04 | (0.30 | ) | 1.82 | 1.52 | (0.93 | ) | (0.93 | ) | – | $ | 31.63 | 4.99% | $ | 25,370,929 | 1.35% | (0.99 | )% | 1.82% | 45.00% | |||||||||||||||||||||||||||||||||||
Year Ended July 31, 2011(f) | $ | 24.45 | (0.31 | ) | 7.93 | 7.62 | (1.03 | ) | (1.03 | ) | – | $ | 31.04 | 31.28% | $ | 12,477,289 | 1.35% | (1.03 | )% | 2.00% | 45.00% | |||||||||||||||||||||||||||||||||||
Year Ended July 31, 2010(f) | $ | 20.70 | (0.20 | ) | 3.95 | 3.75 | – | – | – | $ | 24.45 | 18.12% | $ | 6,252,291 | 1.37% | (0.89 | )% | 2.48% | 62.00% | |||||||||||||||||||||||||||||||||||||
Period Ended July 31, 2009(f)(g) | $ | 20.00 | (0.02 | ) | 0.72 | 0.70 | – | – | – | $ | 20.70 | 3.50% | $ | 1,597,847 | 1.37% | (0.73 | )% | 8.34% | 7.00% | |||||||||||||||||||||||||||||||||||||
| Institutional Class Shares | ||||||||||||||||||||||||||||||||||||||||||||||||||||||||
Period Ended January 31, 2014(f)(i) (Unaudited) | $ | 43.05 | (0.15 | ) | 2.78 | 2.63 | (1.40 | ) | (1.40 | ) | – | $ | 44.29 | 6.21% | $ | 61,924 | 1.22% | (0.89 | )% | 1.24% | 11.81% | |||||||||||||||||||||||||||||||||||
Amounts designated as “_” are zero or have been rounded to zero.
| (a) | Excludes sales charge. |
| (b) | Not annualized for periods less than one year. |
| (c) | Annualized for periods less than one year. |
| (d) | During the period, certain fees may have been waived and/or reimbursed. If such waivers/reimbursements had not occurred, the ratios would have been as indicated. |
| (e) | Portfolio turnover is calculated on the basis of the Fund as a whole without distinguishing among the classes of shares. |
| (f) | Per share calculations were performed using average shares method. |
| (g) | For the period from June 12, 2009 (commencement of operations) through July 31, 2009. |
| (h) | Effective September 16, 2013, Fiduciary Shares were renamed Institutional Service Class Shares. |
| (i) | For the period from September 19, 2013 (commencement of operations) through January 31, 2014. Total return is calculated based on inception date of September 18, 2013 through January 31, 2014 . |
The accompanying notes are an integral part of these financial statements.
75
| Fund Commentary | Nationwide HighMark Balanced Fund |
For the semiannual period ended January 31, 2014, the Nationwide HighMark Balanced Fund (Institutional Service Class) returned 3.03%* versus 4.88% for its composite benchmark, 60% S&P 500® Index and 40% Barclays U.S. Aggregate Bond Index. For broader comparison, the median return for the Fund’s closest Lipper peer category of Mixed-Asset Target Allocation Conservative Funds (consisting of 364 funds as of January 31, 2014) was 2.97% for the same time period.
| * | Performance prior to the Fund’s inception on September 16, 2013, is based on the performance of the Fund’s predecessor fund. |
Market Environment
The six months of the reporting period were characterized by the odd juxtaposition of stronger economic data and increased confidence in a continuation of the Federal Reserve’s accommodative monetary policy. This combination led to a strong market rally in the latter half of 2013 with a definite “risk on” flavor. The markets pulled back in January 2014 when trouble with emerging markets began to appear.
The rally began with the Fed’s “surprise” decision in September 2013 not to taper (gradually reduce) its bond purchases. Strong employment data and better-than-expected gross domestic product (GDP) growth added fuel to the fire and kept the rally going. By the end of 2013, sentiment was so positive that the Fed was able to announce a modest tapering without derailing the market. The January 2014 market pullback resulted from worries about emerging markets being affected by decreased stimulus from the Fed.
The fixed-income markets were volatile during the reporting period due to uncertainty about fiscal and monetary policy, particularly regarding the future of the Fed’s bond purchase program. The federal budget agreement is expected to have a slightly less negative impact on GDP in 2014, although the federal debt ceiling will need to be raised again, perhaps as early as March, providing another potential flashpoint. On December 18, 2013, the Federal Open Market Committee (FOMC) finally took the first step toward ending the Fed’s bond purchases,
deciding to “modestly reduce the pace of its asset purchases” from $85 billion per month to $75 billion, marking the beginning of the end of this previously unlimited program.
Portfolio Performance
The Fund benefited on the equity portion of its investments during the reporting period from being overweight in the industrials sector, which outperformed the benchmark during the reporting period. This overweight in the Fund was a byproduct of bottom-up stock selection rather than a decision based on management’s top-down view of the sector. The Fund also benefited from being underweight the utilities sector and the telecommunications sector, both of which underperformed the benchmark for the reporting period. As with the industrials sector, the underweights in these two sectors were a function of bottom-up stock selection rather than a specific bet on the overall sector based on macroeconomic or other top-down factors. Detractors from Fund performance during the reporting period included stock selection in technology, industrials and consumer discretionary.
In the fixed-income market, investment-grade corporate bond spreads ended the reporting period up 130 basis points, the tightest level since July 2007, while high-yield bond spreads finished up 421 basis points, below the long-term average of 600 basis points. New supply from both investment-grade and high-yield bond issuers was strong during the period , as companies attempted to lock in borrowing costs ahead of rising Treasury yields. Agency mortgage-backed securities returned 2.8% during the period, as option-adjusted spreads narrowed by 18 basis points. At 36 basis points, agency mortgage spreads remained below long-term averages, supported by the Fed’s low-interest-rate policy and agency mortgage bond buying mandate. The volume of mortgages issued at these low rates has kept the duration of the mortgage index near the longest in its history, 5.6 years at period end. The Fed continues to reinvest principal and interest payments from its existing portfolio into agency mortgage-backed securities in addition to those purchased under the quantitative easing (QE) program.
76
| Fund Commentary (cont’d) | Nationwide HighMark Balanced Fund |
In the equities area, during the past several years high-quality companies have traded at a persistent discount to lower-quality, high-octane stocks. This trend came to a head in 2013 as the performance spread between such styles was near 10%. Every time the gap threatens to close, the Fed engages in a fresh round of stimulus of some kind, refueling low-quality firms for another run. With the pace of the QE program beginning to abate and with interest rates having nowhere to go but up, we expect that this discount will close with more persistence than we have seen for some time, and companies with stable earnings and the ability to self-finance will lead the market.
Outlook and Positioning
In the fixed-income area our near-term outlook is for a gradual improvement in economic growth to put modest upward pressure on Treasury yields beyond two-year maturities. Short-term rates, however, most likely will continue to be anchored by the Fed’s commitment to “a highly accommodative stance of monetary policy…for a considerable time after the asset purchase program ends and the economic recovery strengthens.” Despite the announced reduction in bond purchases, the Fed continues to emphasize that there is no predetermined path for asset purchases and that future decisions regarding the pace remain dependent upon the Fed’s outlook for the labor market and inflation. Corporate bonds may continue to perform well in this environment as the economy slowly improves, valuations remain relatively attractive and the Fed continues to be supportive.
Subadviser:
HighMark Capital Management, Inc.
Portfolio Managers:
Derek Izuel; E. Jack Montgomery;
Kenneth Wemer; and David Wines
The Fund is subject to the risks of investing in equity securities and fixed-income securities. The Fund may invest in more-aggressive investments such as foreign securities (which are volatile, harder to price and less liquid than U.S. securities). Please refer to the summary prospectus for a more detailed explanation of the Fund’s principal risks.
A description of the benchmarks can be found on the Market Index Definitions page at the back of this book.
77
| Fund Overview (Unaudited) | Nationwide HighMark Balanced Fund |
Objective
The Fund seeks capital appreciation and income. Conservation of capital is a secondary consideration in selecting portfolio investments.
Highlights
| Ÿ | For the semiannual period ended January 31, 2014, the Fund (Institutional Service Class) returned 3.03%, underperforming the composite benchmark by 1.85% and outperforming the Lipper peer category by 0.06%. |
| Ÿ | The Fund benefited on the equity portion from being overweight in the industrials sector, which outperformed the composite benchmark during the reporting period. |
| Ÿ | Detractors from Fund performance during the reporting period included stock selection in technology, industrials and consumer discretionary. |
Asset Allocation†
| Common Stocks | 61.1% | |||
| Corporate Bonds | 22.2% | |||
| U.S. Treasury Notes | 4.6% | |||
| U.S. Government Mortgage Backed Agencies | 4.1% | |||
| Asset-Backed Securities | 2.0% | |||
| Mutual Fund | 2.0% | |||
| Commercial Mortgage Backed Securities | 1.9% | |||
| Municipal Bonds | 1.2% | |||
| Collateralized Mortgage Obligations | 0.4% | |||
| Bank Loan | 0.1% | |||
| Other assets in excess of liabilities | 0.4% | |||
| 100.0% |
Top Industries††
| Commercial Banks | 8.2% | |||
| Pharmaceuticals | 5.3% | |||
| Chemicals | 4.8% | |||
| Diversified Financial Services | 4.7% | |||
| Oil, Gas & Consumable Fuels | 4.3% | |||
| Specialty Retail | 3.6% | |||
| Computers & Peripherals | 2.9% | |||
| Food & Staples Retailing | 2.9% | |||
| Industrial Conglomerates | 2.8% | |||
| Biotechnology | 2.6% | |||
| Other Industries | 57.9% | |||
| 100.0% |
Top Holdings††
| Wells Fargo & Co. | 3.3% | |||
| Danaher Corp. | 2.8% | |||
| Ecolab, Inc. | 2.6% | |||
| U.S. Bancorp | 2.2% | |||
| Fidelity Institutional Money Market Fund — Institutional Class | 2.0% | |||
| Praxair, Inc. | 1.9% | |||
| American Tower Corp. | 1.6% | |||
| Analog Devices, Inc. | 1.6% | |||
| Microsoft Corp. | 1.5% | |||
| EMC Corp. | 1.5% | |||
| Other Holdings | 79.0% | |||
| 100.0% |
| † | Percentages indicated are based upon net assets as of January 31, 2014. |
| †† | Percentages indicated are based upon total investments as of January 31, 2014. |
78
| Fund Performance | Nationwide HighMark Balanced Fund |
Average Annual Total Return
(For periods ended January 31, 2014)
| Six Months* | 1 Yr. | 5 Yr. | 10 Yr. | |||||||||||||||
| Class A | w/o SC1 | 2.97% | 8.28% | 12.96% | 4.96% | |||||||||||||
| w/SC2 | -2.71% | 2.30% | 11.69% | 4.37% | ||||||||||||||
| Class C | w/o SC1 | 2.60% | 7.63% | 12.28% | 4.31% | |||||||||||||
| w/SC3 | 1.60% | 6.63% | 12.28% | 4.31% | ||||||||||||||
| Institutional Service Class4,5 | w/o SC | 3.03% | 8.53% | 13.22% | 5.22% | |||||||||||||
| Institutional Class4 | w/o SC | 1.67% | 6 | — | — | — | ||||||||||||
All figures showing the effect of a sales charge (SC) reflect the maximum charge possible, because it has the most significant effect on performance data.
| * | Not annualized. |
| 1 | These returns do not reflect the effects of SCs. |
| 2 | For the period from September 16, 2013 through January 31, 2014 a front-end sales charge of 5.75% was deducted. Prior to September 16, 2013, a front-end sales charge of 5.50% was deducted. |
| 3 | A 1.00% CDSC was deducted from the one year return because it is charged when you sell Class C shares within the first year after purchase. |
| 4 | Not subject to any SCs. |
| 5 | Effective September 16, 2013 Fiduciary Shares were renamed Institutional Service Class Shares. |
| 6 | Since inception date of September 18, 2013. Not Annualized. |
Expense Ratios
Gross Expense | Net Expense | |||||
| Class A | 1.96% | 1.24% | ||||
| Class C | 2.46% | 1.84% | ||||
| Institutional Service Class | 1.71% | 0.99% | ||||
| Institutional Class | 1.46% | 0.84% | ||||
| * | Current effective prospectus dated September 16, 2013. The difference between gross and net operating expenses reflects contractual waivers in place through November 30, 2015. Please see the Fund’s most recent prospectus for details. |
79
| Fund Performance | Nationwide HighMark Balanced Fund |
Performance of a $10,000 Investment
Investment return and principal value will fluctuate, and when redeemed, shares may be worth more or less than original cost. Past performance is no guarantee of future results and does not reflect the deduction of taxes that a shareholder would pay on fund distributions or the redemption of fund shares. Investing in mutual funds involves market risk, including loss of principal. Performance returns assume the reinvestment of all distributions.
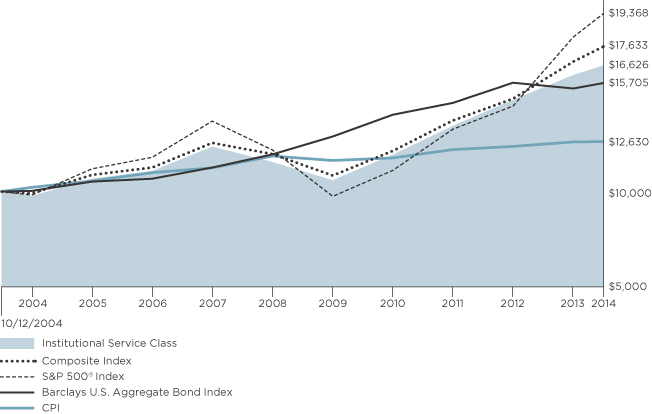
Comparative performance of $10,000 invested in Institutional Service Class shares of the Nationwide HighMark Balanced Fund versus the Composite Index*, the S&P 500® Index, the Barclays U.S. Aggregate Bond Index and the Consumer Price Index (CPI) over the 10-year period ended 1/31/14. Fund performance prior to the Fund’s inception on 9/16/13 is based on the Fund’s predecessor Fund. Unlike the Fund, the performance for these unmanaged indexes does not reflect any fees, expenses, or sales charges. One cannot invest directly in a market index. A description of the benchmarks can be found on the Market Index Definitions page at the back of this book.
*The Fund’s Composite Index comprises 60% S&P 500® Index and 40% Barclays U.S. Aggregate Bond Index.
80
| Shareholder Expense Example | Nationwide HighMark Balanced Fund |
As a shareholder of the Fund, you incur two types of costs: (1) transaction costs, including sales charges (loads) paid on purchase payments and redemption fees; and (2) ongoing costs, including investment advisory fees, administration fees, distribution fees and other Fund expenses. The examples below are intended to help you understand your ongoing costs (in dollars) of investing in the Fund and to compare these costs with the ongoing costs of investing in other mutual funds. Per Securities and Exchange Commission (“SEC”) requirements, the examples assume that you had a $1,000 investment in the Class at the beginning of the reporting period (August 1, 2013) and continued to hold your shares at the end of the reporting period (January 31, 2014).
Actual Expenses
For each Class of the Fund in the table below, the first line provides information about actual account values and actual expenses. You may use the information in this line, together with the amount you invested, to estimate the expenses that you paid from August 1, 2013 through January 31, 2014. Simply divide your account value by $1,000 (for example, an $8,600 account value divided by $1,000 = 8.6), then multiply the result by the number in the first line of each Class under the heading entitled “Expenses Paid During Period” to estimate the expenses you paid on your account during this period.
Hypothetical Expenses for Comparison Purposes
The second line of each Class in the table below provides information about hypothetical account values and hypothetical expenses based on the Class’ actual expense ratio and an assumed rate of return of 5% per year before expenses, which is not the Class’ actual return. The hypothetical account values and expenses may not be used to estimate the actual ending account balance or expenses you paid for the period from August 1, 2013 through January 31, 2014. You may use this information to compare the ongoing costs of investing in the Class of the Fund and other funds. To do so, compare this 5% hypothetical example with the 5% hypothetical examples that appear in the shareholder reports of the other funds.
Please note that the expenses shown in the table are meant to highlight your ongoing costs only and do not reflect any transaction costs, such as sales charges (loads) or redemption fees. If these transaction costs were included, your costs would have been higher. Therefore, the second line for each Class in the table is useful in comparing ongoing costs only, and will not help you determine the relative total costs of owning different funds. The examples also assume all dividends and distributions are reinvested.
Schedule of Shareholder Expenses
Expense Analysis of a $1,000 Investment
Nationwide HighMark Balanced January 31, 2014 | Beginning Account Value ($) 08/01/13 | Ending Account Value ($) 01/31/14 | Expenses Paid 08/01/13 - 01/31/14 | Expense Ratio During Period (%) 08/01/13 - 01/31/14 | ||||||||
| Class A Shares | Actual | a | 1,000.00 | 1,029.70 | 6.34 | 1.24 | ||||||
| Hypothetical | a,b | 1,000.00 | 1,018.95 | 6.31 | 1.24 | |||||||
| Class C Shares | Actual | a | 1,000.00 | 1,026.00 | 9.40 | 1.84 | ||||||
| Hypothetical | a,b | 1,000.00 | 1,015.93 | 9.35 | 1.84 | |||||||
| Institutional Service Class Sharesc | Actual | a | 1,000.00 | 1,030.30 | 5.07 | 0.99 | ||||||
| Hypothetical | a,b | 1,000.00 | 1,020.21 | 5.04 | 0.99 | |||||||
| Institutional Class Shares | Actual | d | 1,000.00 | 1,016.70 | 3.13 | 0.84 | ||||||
| Hypothetical | a,b | 1,000.00 | 1,020.97 | 4.28 | 0.84 | |||||||
| a | Expenses are equal to the Fund’s annualized expense ratio multiplied by the average account value from August 1, 2013 through January 31, 2014 multiplied to reflect one-half year period. The expense ratio presented represents a six-month, annualized ratio in accordance with Securities and Exchange Commission guidelines. |
| b | Represents the hypothetical 5% return before expenses. |
| c | Effective September 16, 2013, Fiduciary Shares were renamed Institutional Service Class Shares. |
| d | Actual expenses are equal to the Fund’s annualized expense ratio multiplied by the average account value from September 19, 2013 through January 31, 2014 to reflect the period from commencement of operations. |
81
Statement of Investments
January 31, 2014 (Unaudited)
Nationwide HighMark Balanced Fund
| Common Stocks 61.1% | ||||||||||
| Shares | Market Value | |||||||||
| ||||||||||
Aerospace & Defense 1.7% | ||||||||||
Boeing Co. (The) | 2,395 | $ | 299,998 | |||||||
Honeywell International, Inc. | 2,335 | 213,022 | ||||||||
|
| |||||||||
| 513,020 | ||||||||||
|
| |||||||||
| ||||||||||
Air Freight & Logistics 0.5% |
| |||||||||
United Parcel Service, Inc., Class B | 1,430 | 136,179 | ||||||||
|
| |||||||||
| ||||||||||
Beverages 1.1% |
| |||||||||
Anheuser-Busch InBev NV ADR-BE | 1,790 | 171,643 | ||||||||
Coca-Cola Co. (The) | 4,225 | 159,790 | ||||||||
|
| |||||||||
| 331,433 | ||||||||||
|
| |||||||||
| ||||||||||
Biotechnology 2.0% |
| |||||||||
Amgen, Inc. | 1,815 | 215,894 | ||||||||
Gilead Sciences, Inc.* | 3,275 | 264,129 | ||||||||
Vertex Pharmaceuticals, Inc.* | 1,270 | 100,381 | ||||||||
|
| |||||||||
| 580,404 | ||||||||||
|
| |||||||||
| ||||||||||
Capital Markets 0.7% |
| |||||||||
Charles Schwab Corp. (The) | 8,455 | 209,853 | ||||||||
|
| |||||||||
| ||||||||||
Chemicals 4.5% |
| |||||||||
Ecolab, Inc. | 7,525 | 756,564 | ||||||||
Praxair, Inc. | 4,435 | 553,133 | ||||||||
|
| |||||||||
| 1,309,697 | ||||||||||
|
| |||||||||
| ||||||||||
Commercial Banks 5.5% |
| |||||||||
U.S. Bancorp | 16,435 | 652,962 | ||||||||
Wells Fargo & Co. | 21,005 | 952,367 | ||||||||
|
| |||||||||
| 1,605,329 | ||||||||||
|
| |||||||||
| ||||||||||
Commercial Services & Supplies 1.0% |
| |||||||||
Stericycle, Inc.* | 2,615 | 306,112 | ||||||||
|
| |||||||||
| ||||||||||
Communications Equipment 1.3% |
| |||||||||
QUALCOMM, Inc. | 5,035 | 373,698 | ||||||||
|
| |||||||||
| ||||||||||
Computers & Peripherals 2.6% |
| |||||||||
Apple, Inc. | 690 | 345,414 | ||||||||
EMC Corp. | 17,435 | 422,624 | ||||||||
|
| |||||||||
| 768,038 | ||||||||||
|
| |||||||||
| ||||||||||
Diversified Financial Services 0.9% |
| |||||||||
Citigroup, Inc. | 5,840 | 276,991 | ||||||||
|
| |||||||||
| ||||||||||
Electric Utilities 0.7% |
| |||||||||
ITC Holdings Corp. | 1,920 | 198,720 | ||||||||
|
| |||||||||
| ||||||||||
Electronic Equipment, Instruments & Components 1.0% |
| |||||||||
FEI Co. | 3,285 | 307,870 | ||||||||
|
| |||||||||
| ||||||||||
Energy Equipment & Services 1.7% |
| |||||||||
Halliburton Co. | 6,515 | 319,300 | ||||||||
Schlumberger Ltd. | 2,080 | 182,146 | ||||||||
|
| |||||||||
| 501,446 | ||||||||||
|
| |||||||||
| Common Stocks (continued) | ||||||||||
| Shares | Market Value | |||||||||
| ||||||||||
Food & Staples Retailing 1.7% |
| |||||||||
Costco Wholesale Corp. | 2,285 | $ | 256,743 | |||||||
Walgreen Co. | 4,157 | 238,404 | ||||||||
|
| |||||||||
| 495,147 | ||||||||||
|
| |||||||||
| ||||||||||
Food Products 0.8% |
| |||||||||
Kraft Foods Group, Inc. | 1,701 | 89,047 | ||||||||
Mondelez International, Inc., Class A | 4,600 | 150,650 | ||||||||
|
| |||||||||
| 239,697 | ||||||||||
|
| |||||||||
| ||||||||||
Health Care Equipment & Supplies 1.0% |
| |||||||||
Covidien PLC | 4,220 | 287,973 | ||||||||
|
| |||||||||
| ||||||||||
Hotels, Restaurants & Leisure 0.8% |
| |||||||||
Yum! Brands, Inc. | 3,491 | 234,421 | ||||||||
|
| |||||||||
| ||||||||||
Household Products 0.9% |
| |||||||||
Procter & Gamble Co. (The) | 3,415 | 261,657 | ||||||||
|
| |||||||||
| ||||||||||
Industrial Conglomerates 2.8% |
| |||||||||
Danaher Corp. | 10,940 | 813,827 | ||||||||
|
| |||||||||
| ||||||||||
Information Technology Services 1.0% |
| |||||||||
Accenture PLC, Class A | 3,645 | 291,163 | ||||||||
|
| |||||||||
| ||||||||||
Insurance 0.9% |
| |||||||||
Arch Capital Group Ltd.* | 5,185 | 279,005 | ||||||||
|
| |||||||||
| ||||||||||
Internet Software & Services 1.2% |
| |||||||||
Google, Inc., Class A* | 295 | 348,386 | ||||||||
|
| |||||||||
| ||||||||||
Life Sciences Tools & Services 1.2% |
| |||||||||
Agilent Technologies, Inc. | 4,095 | 238,124 | ||||||||
Bruker Corp. * | 5,415 | 110,195 | ||||||||
|
| |||||||||
| 348,319 | ||||||||||
|
| |||||||||
| ||||||||||
Machinery 0.9% |
| |||||||||
Pall Corp. | 3,280 | 262,728 | ||||||||
|
| |||||||||
| ||||||||||
Media 0.6% |
| |||||||||
Discovery Communications, Inc., Class A* | 2,110 | 168,336 | ||||||||
|
| |||||||||
| ||||||||||
Multiline Retail 1.1% |
| |||||||||
Dollar Tree, Inc.* | 3,575 | 180,609 | ||||||||
Target Corp. | 2,675 | 151,512 | ||||||||
|
| |||||||||
| 332,121 | ||||||||||
|
| |||||||||
| ||||||||||
Oil, Gas & Consumable Fuels 2.7% |
| |||||||||
Anadarko Petroleum Corp. | 2,145 | 173,080 | ||||||||
Chevron Corp. | 1,045 | 116,653 | ||||||||
EOG Resources, Inc. | 1,505 | 248,686 | ||||||||
Exxon Mobil Corp. | 2,690 | 247,911 | ||||||||
|
| |||||||||
| 786,330 | ||||||||||
|
| |||||||||
82
Statement of Investments (Continued)
January 31, 2014 (Unaudited)
Nationwide HighMark Balanced Fund (Continued)
| Common Stocks (continued) | ||||||||||
| Shares | Market Value | |||||||||
| ||||||||||
Pharmaceuticals 4.7% |
| |||||||||
Allergan, Inc. | 2,380 | $ | 272,748 | |||||||
Johnson & Johnson | 4,400 | 389,268 | ||||||||
Merck & Co., Inc. | 5,815 | 308,020 | ||||||||
Pfizer, Inc. | 12,992 | 394,957 | ||||||||
|
| |||||||||
| 1,364,993 | ||||||||||
|
| |||||||||
| ||||||||||
Real Estate Investment Trusts (REITs) 1.6% |
| |||||||||
American Tower Corp. | 5,730 | 463,442 | ||||||||
|
| |||||||||
| ||||||||||
Road & Rail 1.9% |
| |||||||||
J.B. Hunt Transport Services, Inc. | 4,735 | 355,362 | ||||||||
Kansas City Southern | 1,935 | 204,316 | ||||||||
|
| |||||||||
| 559,678 | ||||||||||
|
| |||||||||
| ||||||||||
Semiconductors & Semiconductor Equipment 1.6% |
| |||||||||
Analog Devices, Inc. | 9,600 | 463,392 | ||||||||
|
| |||||||||
| ||||||||||
Software 2.4% |
| |||||||||
ANSYS, Inc.* | 3,325 | 261,112 | ||||||||
Microsoft Corp. | 11,445 | 433,193 | ||||||||
|
| |||||||||
| 694,305 | ||||||||||
|
| |||||||||
| ||||||||||
Specialty Retail 3.6% |
| |||||||||
Dick’s Sporting Goods, Inc. | 3,516 | 184,590 | ||||||||
PetSmart, Inc. | 2,510 | 158,130 | ||||||||
Ross Stores, Inc. | 1,855 | 125,973 | ||||||||
Sally Beauty Holdings, Inc.* | 7,252 | 205,812 | ||||||||
TJX Cos., Inc. | 6,445 | 369,685 | ||||||||
|
| |||||||||
| 1,044,190 | ||||||||||
|
| |||||||||
| ||||||||||
Tobacco 1.4% |
| |||||||||
Altria Group, Inc. | 2,450 | 86,289 | ||||||||
Philip Morris International, Inc. | 3,985 | 311,388 | ||||||||
|
| |||||||||
| 397,677 | ||||||||||
|
| |||||||||
| ||||||||||
Trading Companies & Distributors 1.1% |
| |||||||||
W.W. Grainger, Inc. | 1,400 | 328,272 | ||||||||
|
| |||||||||
Total Common Stocks (cost $13,999,547) |
| 17,883,849 | ||||||||
|
| |||||||||
| Asset-Backed Securities 2.0% | ||||||||||
| Principal Amount | ||||||||||
| ||||||||||
Automobiles 1.0% |
| |||||||||
ARI Fleet Lease Trust, | $ | 50,028 | 49,999 | |||||||
Enterprise Fleet Financing LLC, | 69,243 | 69,282 | ||||||||
| Asset-Backed Securities (continued) | ||||||||||
| Principal Amount | Market Value | |||||||||
| ||||||||||
Automobiles (continued) |
| |||||||||
Hertz Vehicle Financing LLC, | $ | 100,000 | $ | 101,319 | ||||||
World Omni Auto Receivables Trust, | 71,129 | 71,550 | ||||||||
|
| |||||||||
| 292,150 | ||||||||||
|
| |||||||||
| ||||||||||
Credit Card 0.2% |
| |||||||||
American Express Credit Account Secured Note Trust, | 75,000 | 74,833 | ||||||||
|
| |||||||||
| ||||||||||
Electric Utilities 0.4% |
| |||||||||
AEP Texas Central Transition Funding LLC, | 121,805 | 121,757 | ||||||||
|
| |||||||||
| ||||||||||
Other 0.2% |
| |||||||||
CAL Funding Ltd., | 48,125 | 47,817 | ||||||||
|
| |||||||||
| ||||||||||
Student Loan 0.2% |
| |||||||||
SLM Private Education Loan Trust, | 51,392 | 51,631 | ||||||||
|
| |||||||||
Total Asset-Backed Securities (cost $586,954) | 588,188 | |||||||||
|
| |||||||||
| Bank Loan 0.1% | ||||||||||
HJ Heinz Co., Term Loan, | 29,850 | 30,057 | ||||||||
|
| |||||||||
Total Bank Loan (cost $29,715) |
| 30,057 | ||||||||
|
| |||||||||
| Collateralized Mortgage Obligations 0.4% | ||||||||||
Chase Mortgage Finance Trust, | 19,656 | 19,879 | ||||||||
Sequoia Mortgage Trust | ||||||||||
Series 2012-1, Class 2A1, | 26,186 | 26,186 | ||||||||
Series 2012-2, Class A2, | 29,010 | 28,971 | ||||||||
Series 2013-1, Class 1A1, | 46,769 | 44,462 | ||||||||
83
Statement of Investments (Continued)
January 31, 2014 (Unaudited)
Nationwide HighMark Balanced Fund (Continued)
| Collateralized Mortgage Obligations (continued) | ||||||||||
| Principal Amount | Market Value | |||||||||
| ||||||||||
Wells Fargo Mortgage Backed Securities Trust, | $ | 9,969 | $ | 10,077 | ||||||
|
| |||||||||
Total Collateralized Mortgage Obligations |
| 129,575 | ||||||||
|
| |||||||||
| Commercial Mortgage Backed Securities 1.9% | ||||||||||
Credit Suisse First Boston Mortgage Securities Corp., | 134,024 | 137,730 | ||||||||
DBUBS Mortgage Trust, | 114,836 | 120,358 | ||||||||
JPMBB Commercial Mortgage Securities Trust, | 96,334 | 96,547 | ||||||||
Morgan Stanley Bank of America Merrill Lynch Trust, | 216,279 | 217,149 | ||||||||
|
| |||||||||
Total Commercial Mortgage Backed Securities (cost $562,152) |
| 571,784 | ||||||||
|
| |||||||||
| Corporate Bonds 22.2% | ||||||||||
Aerospace & Defense 0.1% |
| |||||||||
United Technologies Corp., | 25,000 | 24,862 | ||||||||
|
| |||||||||
| ||||||||||
Airlines 1.8% |
| |||||||||
British Airways PLC, | 120,000 | 127,200 | ||||||||
Continental Airlines Pass Through Trust, | 86,050 | 92,289 | ||||||||
Delta Air Lines Pass Through Trust, | 114,415 | 125,857 | ||||||||
U.S. Airways Pass Through Trust, | 120,000 | 120,000 | ||||||||
United Airlines Pass Through Trust, | 70,000 | 71,444 | ||||||||
|
| |||||||||
| 536,790 | ||||||||||
|
| |||||||||
| Corporate Bonds (continued) | ||||||||||
| Principal Amount | Market Value | |||||||||
| ||||||||||
Automobiles 0.4% |
| |||||||||
General Motors Co., | $ | 125,000 | $ | 127,500 | ||||||
|
| |||||||||
| ||||||||||
Beverages 0.3% |
| |||||||||
Anheuser-Busch InBev Worldwide, Inc., | 100,000 | 94,387 | ||||||||
|
| |||||||||
| ||||||||||
Biotechnology 0.6% |
| |||||||||
Warner Chilcott Co. LLC/Warner Chilcott Finance LLC, | 154,000 | 165,742 | ||||||||
|
| |||||||||
| ||||||||||
Capital Markets 0.1% |
| |||||||||
Lehman Brothers Holdings, Inc., | 125,000 | 27,031 | ||||||||
|
| |||||||||
| ||||||||||
Chemicals 0.3% |
| |||||||||
Dow Chemical Co. (The), | 75,000 | 79,918 | ||||||||
|
| |||||||||
| ||||||||||
Commercial Banks 2.7% |
| |||||||||
Bank of Montreal, | 150,000 | 151,924 | ||||||||
Bank of New York Mellon Corp. (The), | 75,000 | 74,212 | ||||||||
BB&T Corp., | 100,000 | 102,567 | ||||||||
Capital One Financial Corp. | ||||||||||
1.00%, 11/06/15 | 25,000 | 25,027 | ||||||||
4.75%, 07/15/21 | 125,000 | 135,452 | ||||||||
Fifth Third Bank, | 105,000 | 103,620 | ||||||||
Wells Fargo & Co. | ||||||||||
5.63%, 12/11/17 | 50,000 | 57,423 | ||||||||
1.50%, 01/16/18 | 70,000 | 69,848 | ||||||||
Westpac Banking Corp., | 75,000 | 76,070 | ||||||||
|
| |||||||||
| 796,143 | ||||||||||
|
| |||||||||
| ||||||||||
Computers & Peripherals 0.3% |
| |||||||||
Hewlett-Packard Co., | 90,000 | 92,218 | ||||||||
|
| |||||||||
| ||||||||||
Consumer Finance 0.5% |
| |||||||||
Ford Motor Credit Co. LLC, | 125,000 | 141,758 | ||||||||
|
| |||||||||
| ||||||||||
Containers & Packaging 0.5% |
| |||||||||
Ball Corp., | 125,000 | 135,625 | ||||||||
|
| |||||||||
| ||||||||||
Diversified Financial Services 3.0% |
| |||||||||
Bank of America Corp. | ||||||||||
5.65%, 05/01/18 | 100,000 | 113,683 | ||||||||
1.28%, 01/15/19 (a) | 50,000 | 50,341 | ||||||||
84
Statement of Investments (Continued)
January 31, 2014 (Unaudited)
Nationwide HighMark Balanced Fund (Continued)
| Corporate Bonds (continued) | ||||||||||
| Principal Amount | Market Value | |||||||||
| ||||||||||
Diversified Financial Services (continued) |
| |||||||||
Citigroup, Inc., | $ | 125,000 | $ | 122,996 | ||||||
General Electric Capital Corp., | 125,000 | 128,937 | ||||||||
JPMorgan Chase & Co. | ||||||||||
4.25%, 10/15/20 | 125,000 | 133,262 | ||||||||
3.20%, 01/25/23 | 150,000 | 143,809 | ||||||||
KE Export Leasing LLC, | 47,957 | 47,733 | ||||||||
MSN 41079 and 41084 Ltd., | 92,336 | 88,633 | ||||||||
NASDAQ OMX Group, Inc. (The), | 50,000 | 54,887 | ||||||||
|
| |||||||||
| 884,281 | ||||||||||
|
| |||||||||
| ||||||||||
Diversified Telecommunication Services 1.0% |
| |||||||||
AT&T, Inc., | 90,000 | 85,443 | ||||||||
Verizon Communications, Inc., | 35,000 | 42,012 | ||||||||
Verizon Maryland LLC, | 75,000 | 90,830 | ||||||||
Verizon New England, Inc., | 50,000 | 60,473 | ||||||||
|
| |||||||||
| 278,758 | ||||||||||
|
| |||||||||
| ||||||||||
Electric Utilities 0.3% |
| |||||||||
MidAmerican Energy Holdings Co., | 80,000 | 79,894 | ||||||||
|
| |||||||||
| ||||||||||
Food & Staples Retailing 1.2% |
| |||||||||
CVS Caremark Corp., | 125,000 | 117,155 | ||||||||
Kroger Co. (The), | 125,000 | 123,447 | ||||||||
Walgreen Co., | 125,000 | 119,994 | ||||||||
|
| |||||||||
| 360,596 | ||||||||||
|
| |||||||||
| ||||||||||
Food Products 0.5% |
| |||||||||
Unilever Capital Corp., | 75,000 | 75,661 | ||||||||
WM Wrigley Jr Co., | 60,000 | 60,408 | ||||||||
|
| |||||||||
| 136,069 | ||||||||||
|
| |||||||||
| ||||||||||
Gas Utilities 1.3% |
| |||||||||
El Paso Pipeline Partners Operating Co. LLC, | 60,000 | 63,653 | ||||||||
Energy Transfer Partners LP, | 100,000 | 130,271 | ||||||||
| Corporate Bonds (continued) | ||||||||||
| Principal Amount | Market Value | |||||||||
| ||||||||||
Gas Utilities (continued) |
| |||||||||
Kinder Morgan Energy Partners LP, | $ | 75,000 | $ | 74,643 | ||||||
Magellan Midstream Partners LP, | 100,000 | 119,725 | ||||||||
|
| |||||||||
| 388,292 | ||||||||||
|
| |||||||||
| ||||||||||
Health Care Providers & Services 0.2% |
| |||||||||
Laboratory Corp. of America Holdings, | 50,000 | 54,129 | ||||||||
|
| |||||||||
| ||||||||||
Household Products 0.4% |
| |||||||||
Clorox Co. (The), | 125,000 | 119,714 | ||||||||
|
| |||||||||
| ||||||||||
Information Technology Services 0.2% |
| |||||||||
International Business Machines Corp., | 50,000 | 63,657 | ||||||||
|
| |||||||||
| ||||||||||
Insurance 1.0% |
| |||||||||
American International Group, Inc., | 120,000 | 121,469 | ||||||||
Berkshire Hathaway Finance Corp., | 50,000 | 57,787 | ||||||||
Berkshire Hathaway, Inc., | 125,000 | 120,618 | ||||||||
|
| |||||||||
| 299,874 | ||||||||||
|
| |||||||||
| ||||||||||
Media 0.9% |
| |||||||||
Comcast Corp., | 50,000 | 58,354 | ||||||||
TCI Communications, Inc., | 100,000 | 125,818 | ||||||||
Time Warner Entertainment Co. LP, | 70,000 | 83,954 | ||||||||
|
| |||||||||
| 268,126 | ||||||||||
|
| |||||||||
| ||||||||||
Metals & Mining 0.1% |
| |||||||||
Rio Tinto Finance USA Ltd., | 25,000 | 29,718 | ||||||||
|
| |||||||||
| ||||||||||
Multiline Retail 0.5% |
| |||||||||
Macy’s Retail Holdings, Inc., | 125,000 | 129,139 | ||||||||
|
| |||||||||
| ||||||||||
Office Electronics 0.2% |
| |||||||||
Xerox Corp., | 50,000 | 51,932 | ||||||||
|
| |||||||||
| ||||||||||
Oil, Gas & Consumable Fuels 1.6% |
| |||||||||
BP Capital Markets PLC | ||||||||||
1.38%, 11/06/17 | 75,000 | 74,794 | ||||||||
2.24%, 09/26/18 | 50,000 | 50,739 | ||||||||
Cimarex Energy Co., | 35,000 | 37,362 | ||||||||
85
Statement of Investments (Continued)
January 31, 2014 (Unaudited)
Nationwide HighMark Balanced Fund (Continued)
| Corporate Bonds (continued) | ||||||||||
| Principal Amount | Market Value | |||||||||
| ||||||||||
Oil, Gas & Consumable Fuels (continued) |
| |||||||||
Petrobras International Finance Co., | $ | 125,000 | $ | 128,247 | ||||||
Petrohawk Energy Corp. | ||||||||||
7.88%, 06/01/15 | 61,000 | 62,202 | ||||||||
7.25%, 08/15/18 | 100,000 | 107,125 | ||||||||
|
| |||||||||
| 460,469 | ||||||||||
|
| |||||||||
| ||||||||||
Paper & Forest Products 0.7% |
| |||||||||
Georgia-Pacific LLC, | 150,000 | 198,452 | ||||||||
|
| |||||||||
| ||||||||||
Pharmaceuticals 0.6% |
| |||||||||
Mylan, Inc., | 160,000 | 180,600 | ||||||||
|
| |||||||||
| ||||||||||
Real Estate Investment Trusts (REITs) 0.5% |
| |||||||||
Boston Properties LP, | 125,000 | 130,829 | ||||||||
ERP Operating LP, | 25,000 | 26,854 | ||||||||
|
| |||||||||
| 157,683 | ||||||||||
|
| |||||||||
| ||||||||||
Road & Rail 0.4% |
| |||||||||
Burlington Northern Santa Fe LLC, | 125,000 | 126,960 | ||||||||
|
| |||||||||
Total Corporate Bonds (cost $6,406,985) |
| 6,490,317 | ||||||||
|
| |||||||||
| Municipal Bonds 1.2% | ||||||||||
California 1.2% |
| |||||||||
California State, GO, | 100,000 | 119,344 | ||||||||
Los Angeles, Department of Water & Power, RB, | 50,000 | 65,910 | ||||||||
Metropolitan Water District of Southern California, RB, | 150,000 | 170,522 | ||||||||
|
| |||||||||
Total Municipal Bonds (cost $325,838) |
| 355,776 | ||||||||
|
| |||||||||
| U.S. Government Mortgage Backed Agencies 4.1% | ||||||||||
Federal Home Loan Mortgage Corp. Gold Pool | 14,930 | 15,779 | ||||||||
Pool# B14038 | 8,117 | 8,670 | ||||||||
Pool# G11769 | 6,815 | 7,298 | ||||||||
Pool# G13201 | 12,701 | 13,646 | ||||||||
| U.S. Government Mortgage Backed Agencies (continued) | ||||||||||
| Principal Amount | Market Value | |||||||||
| ||||||||||
Federal Home Loan Mortgage Corp. Gold Pool (continued) | ||||||||||
Pool# C90698 | $ | 185,466 | $ | 201,614 | ||||||
Pool# G13868 | 100,186 | 107,574 | ||||||||
Federal National Mortgage Association Pool | 206 | 206 | ||||||||
Pool# 254196 | 16,667 | 17,542 | ||||||||
Pool# 254546 | 17,559 | 18,591 | ||||||||
Pool# 254919 | 5,510 | 5,877 | ||||||||
Pool# 555872 | 2,901 | 3,069 | ||||||||
Pool# 725168 | 22,868 | 24,482 | ||||||||
Pool# 725414 | 58,056 | 62,153 | ||||||||
Pool# 254800 | 97,106 | 106,813 | ||||||||
Pool# 311811 | 9,269 | 11,018 | ||||||||
Pool# AE3066 | 54,565 | 57,654 | ||||||||
Pool# AE0552 | 31,574 | 34,072 | ||||||||
Pool# AL0243 | 37,015 | 39,553 | ||||||||
Pool# 364588 | 11,347 | 13,105 | ||||||||
Pool# AJ4093 | 66,763 | 70,501 | ||||||||
Pool# 251335 | 7,074 | 8,195 | ||||||||
Pool# 251477 | 5,743 | 6,489 | ||||||||
Pool# 412654 | 8,883 | 9,855 | ||||||||
Pool# MA0428 | 198,939 | 215,328 | ||||||||
Pool# 725205 | 45,345 | 49,746 | ||||||||
Government National Mortgage Association I Pool | 7,206 | 8,379 | ||||||||
Pool# 412334 | 8,904 | 10,391 | ||||||||
Pool# 403847 | 9,330 | 10,530 | ||||||||
86
Statement of Investments (Continued)
January 31, 2014 (Unaudited)
Nationwide HighMark Balanced Fund (Continued)
| U.S. Government Mortgage Backed Agencies (continued) | ||||||||||
| Principal Amount | Market Value | |||||||||
| ||||||||||
Government National Mortgage Association I Pool (continued) | ||||||||||
Pool# 497505 | $ | 3,765 | $ | 4,349 | ||||||
Pool# 462109 | 13,340 | 15,695 | ||||||||
Pool# 506487 | 27,766 | 31,410 | ||||||||
|
| |||||||||
Total U.S. Government Mortgage Backed Agencies (cost $1,145,474) |
| 1,189,584 | ||||||||
|
| |||||||||
| U.S. Treasury Notes 4.6% | ||||||||||
U.S. Treasury Notes |
| |||||||||
0.50%, 06/15/16 | 200,000 | 200,188 | ||||||||
0.63%, 04/30/18 | 300,000 | 292,312 | ||||||||
1.38%, 05/31/20 | 400,000 | 385,938 | ||||||||
2.00%, 02/15/23 | 400,000 | 381,375 | ||||||||
2.75%, 11/15/23 | 75,000 | 75,539 | ||||||||
|
| |||||||||
Total U.S. Treasury Notes |
| 1,335,352 | ||||||||
|
| |||||||||
| Mutual Fund 2.0% | ||||||||||
| Shares | ||||||||||
| ||||||||||
Money Market Fund 2.0% |
| |||||||||
Fidelity Institutional Money Market | 587,267 | 587,267 | ||||||||
|
| |||||||||
Total Mutual Fund (cost $587,267) |
| 587,267 | ||||||||
|
| |||||||||
Total Investments |
| 29,161,749 | ||||||||
Other assets in excess of liabilities — 0.4% |
| 107,205 | ||||||||
|
| |||||||||
NET ASSETS — 100.0% |
| $ | 29,268,954 | |||||||
|
| |||||||||
| * | Denotes a non-income producing security. |
| (a) | Variable Rate Security. The rate reflected in the Statement of Investments is the rate in effect on January 31, 2014. The maturity date represents the actual maturity date. |
| (b) | Rule 144A, Section 4(2), or other security which is restricted as to sale to institutional investors. These securities were deemed liquid pursuant to procedures approved by the Board of Trustees. The aggregate value of these securities at January 31, 2014 was $1,016,008 which represents 3.47% of net assets. |
| (c) | Represents 7-day effective yield as of January 31, 2014. |
| (d) | See notes to financial statements for tax cost and unrealized appreciation/(depreciation) of securities. |
| ADR | American Depositary Receipt |
| BE | Belgium |
| GO | General Obligation |
| LLC | Limited Liability Company |
| LP | Limited Partnership |
| Ltd. | Limited |
| NV | Public Traded Company |
| PLC | Public Limited Company |
| RB | Revenue Bond |
| REIT | Real Estate Investment Trust |
The accompanying notes are an integral part of these financial statements.
87
Statement of Assets and Liabilities
January 31, 2014 (Unaudited)
Nationwide Balanced Fund | ||||||
Assets: | ||||||
Investments, at value (cost $25,114,669) | $ | 29,161,749 | ||||
Cash | 16 | |||||
Interest and dividends receivable | 89,226 | |||||
Receivable for investments sold | 862 | |||||
Receivable for capital shares issued | 106,237 | |||||
Reclaims receivable | 1,306 | |||||
Prepaid expenses | 18,174 | |||||
|
| |||||
Total Assets | 29,377,570 | |||||
|
| |||||
Liabilities: | ||||||
Payable for investments purchased | 32,147 | |||||
Payable for capital shares redeemed | 20,853 | |||||
Accrued expenses and other payables: | ||||||
Investment advisory fees | 134 | |||||
Fund administration fees | 7,222 | |||||
Distribution fees | 6,679 | |||||
Administrative servicing fees | 11,235 | |||||
Accounting and transfer agent fees | 1,810 | |||||
Trustee fees | 304 | |||||
Deferred compensation (Note 2) | 1,807 | |||||
Custodian fees | 155 | |||||
Compliance program costs (Note 3) | 939 | |||||
Professional fees | 19,144 | |||||
Printing fees | 5,955 | |||||
Other | 232 | |||||
|
| |||||
Total Liabilities | 108,616 | |||||
|
| |||||
Net Assets | $ | 29,268,954 | ||||
|
| |||||
Represented by: | ||||||
Capital | $ | 24,891,563 | ||||
Accumulated distributions in excess of net investment income | (11,429 | ) | ||||
Accumulated net realized gains from investment transactions | 341,740 | |||||
Net unrealized appreciation/(depreciation) from investments | 4,047,080 | |||||
|
| |||||
Net Assets | $ | 29,268,954 | ||||
|
| |||||
Net Assets: | ||||||
Class A Shares | $ | 10,757,052 | ||||
Class C Shares | 5,139,178 | |||||
Institutional Service Class Shares | 13,362,554 | |||||
Institutional Class Shares | 10,170 | |||||
|
| |||||
Total | $ | 29,268,954 | ||||
|
| |||||
Shares Outstanding (unlimited number of shares authorized): | ||||||
Class A Shares | 728,540 | |||||
Class C Shares | 350,536 | |||||
Institutional Service Class Shares | 902,722 | |||||
Institutional Class Shares | 686 | |||||
|
| |||||
Total | 1,982,484 | |||||
|
| |||||
88
Statement of Assets and Liabilities (Continued)
January 31, 2014 (Unaudited)
Nationwide Balanced Fund | ||||||
Net asset value and redemption price per share (Net assets by class divided by shares outstanding by class, respectively): | ||||||
Class A Shares (a) | $ | 14.77 | ||||
Class C Shares (b) | $ | 14.66 | ||||
Institutional Service Class Shares | $ | 14.80 | ||||
Institutional Class Shares | $ | 14.83 | ||||
Maximum offering price per share (100%/(100%-maximum sales charge) of net asset value adjusted to the nearest cent): | ||||||
Class A Shares | $ | 15.67 | ||||
|
| |||||
Maximum Sales Charge: | ||||||
Class A Shares | 5.75 | % | ||||
|
| |||||
| (a) | For Class A Shares, the redemption price per share is reduced by 1.00% on sales of shares of original purchases of $1,000,000 or more or that were not subject to a front-end sales charge made with 18 months of the purchase date. |
| (b) | For Class C Shares, the redemption price per share is reduced by 1.00% for shares held less than 1 year. |
The accompanying notes are an integral part of these financial statements.
89
Statement of Operations
For the Six Months Ended January 31, 2014 (Unaudited)
Nationwide Balanced Fund | ||||||
INVESTMENT INCOME: | ||||||
Interest income | $ | 170,661 | ||||
Dividend income | 147,290 | |||||
Foreign tax withholding | (166 | ) | ||||
|
| |||||
Total Income | 317,785 | |||||
|
| |||||
EXPENSES: | ||||||
Investment advisory fees | 93,645 | |||||
Fund administration fees | 49,771 | |||||
Distribution fees Class A | 14,223 | |||||
Distribution fees Class B (a) | 15 | |||||
Distribution fees Class C | 25,066 | |||||
Administrative servicing fees Class A | 9,965 | |||||
Administrative servicing fees Class B (a) | 5 | |||||
Administrative servicing fees Institutional Service Class (b) | 13,265 | |||||
Registration and filing fees | 28,893 | |||||
Professional fees | 19,614 | |||||
Printing fees | 9,146 | |||||
Trustee fees | 539 | |||||
Custodian fees | 682 | |||||
Accounting and transfer agent fees | 6,349 | |||||
Compliance program costs (Note 3) | 1,694 | |||||
Other | 6,303 | |||||
|
| |||||
Total expenses before earnings credit, fees waived, and expenses reimbursed | 279,175 | |||||
|
| |||||
Earnings credit (Note 5) | (51 | ) | ||||
Administrative servicing fees voluntarily waived — Class A (Note 3) | (1,431 | ) | ||||
Administrative servicing fees voluntarily waived — Institutional Service Class (b) (Note 3) | (2,157 | ) | ||||
Expenses reimbursed by adviser (Note 3) | (85,606 | ) | ||||
|
| |||||
Net Expenses | 189,930 | |||||
|
| |||||
NET INVESTMENT INCOME | 127,855 | |||||
|
| |||||
REALIZED/UNREALIZED GAINS (LOSSES) FROM INVESTMENTS: | ||||||
Net realized gains from investment transactions | 1,284,521 | |||||
Net change in unrealized appreciation/(depreciation) from investments | (510,928 | ) | ||||
|
| |||||
Net realized/unrealized gains from investments | 773,593 | |||||
|
| |||||
CHANGE IN NET ASSETS RESULTING FROM OPERATIONS | $ | 901,448 | ||||
|
| |||||
| (a) | Effective September 16, 2013, Class B Shares converted into Class A Shares. |
| (b) | Effective September 16, 2013, Fiduciary Shares were renamed Institutional Service Class Shares. |
The accompanying notes are an integral part of these financial statements.
90
Statements of Changes in Net Assets
| Nationwide HighMark Balanced Fund | ||||||||||||
| Six Months Ended January 31, 2014 (Unaudited) | Year Ended July 31, 2013 | |||||||||||
Operations: | ||||||||||||
Net investment income | $ | 127,855 | $ | 263,858 | ||||||||
Net realized gains from investment transactions | 1,284,521 | 2,056,942 | ||||||||||
Net change in unrealized appreciation/(depreciation) from investments | (510,928 | ) | (60,153 | ) | ||||||||
|
|
|
| |||||||||
Change in net assets resulting from operations | 901,448 | 2,260,647 | ||||||||||
|
|
|
| |||||||||
Distributions to Shareholders From: | ||||||||||||
Net investment income: | ||||||||||||
Class A | (54,031 | ) | (80,133 | ) | ||||||||
Class B (a) | – | (164 | ) | |||||||||
Class C | (8,973 | ) | (8,365 | ) | ||||||||
Institutional Service Class (b) | (79,475 | ) | (216,399 | ) | ||||||||
Institutional Class | (55 | )(c) | – | |||||||||
Net realized gains: | ||||||||||||
Class A | (941,399 | ) | (219,482 | ) | ||||||||
Class B (a) | – | (1,094 | ) | |||||||||
Class C | (415,313 | ) | (49,397 | ) | ||||||||
Institutional Service Class (b) | (1,100,257 | ) | (489,144 | ) | ||||||||
Institutional Class | (857 | )(c) | – | |||||||||
|
|
|
| |||||||||
Change in net assets from shareholder distributions | (2,600,360 | ) | (1,064,178 | ) | ||||||||
|
|
|
| |||||||||
Change in net assets from capital transactions | (2,778,639 | ) | 8,072,990 | |||||||||
|
|
|
| |||||||||
Change in net assets | (4,477,551 | ) | 9,269,459 | |||||||||
|
|
|
| |||||||||
Net Assets: | ||||||||||||
Beginning of period | 33,746,505 | 24,477,046 | ||||||||||
|
|
|
| |||||||||
End of period | $ | 29,268,954 | $ | 33,746,505 | ||||||||
|
|
|
| |||||||||
Accumulated undistributed (distributions in excess of) net investment income at end of period | $ | (11,429 | ) | $ | 3,250 | |||||||
|
|
|
| |||||||||
CAPITAL TRANSACTIONS: | ||||||||||||
Class A Shares | ||||||||||||
Proceeds from shares issued | $ | 865,476 | $ | 6,943,883 | ||||||||
Dividends reinvested | 979,741 | 280,741 | ||||||||||
Cost of shares redeemed | (1,932,001 | ) | (2,700,169 | ) | ||||||||
|
|
|
| |||||||||
Total Class A Shares | (86,784 | ) | 4,524,455 | |||||||||
|
|
|
| |||||||||
Class B Shares (a) | ||||||||||||
Proceeds from shares issued | – | – | ||||||||||
Dividends reinvested | – | 1,258 | ||||||||||
Cost of shares redeemed | (16,403 | ) | (24,355 | ) | ||||||||
|
|
|
| |||||||||
Total Class B Shares | (16,403 | ) | (23,097 | ) | ||||||||
|
|
|
| |||||||||
Class C Shares | ||||||||||||
Proceeds from shares issued | 787,970 | 3,974,799 | ||||||||||
Dividends reinvested | 411,444 | 55,438 | ||||||||||
Cost of shares redeemed | (667,765 | ) | (571,877 | ) | ||||||||
|
|
|
| |||||||||
Total Class C Shares | 531,649 | 3,458,360 | ||||||||||
|
|
|
| |||||||||
| (a) | Effective September 16, 2013, Class B Shares converted into Class A Shares. |
| (b) | Effective September 16, 2013, Fiduciary Shares were renamed Institutional Service Class Shares. |
| (c) | For the period from September 19, 2013 (commencement of operations) through January 31, 2014. |
91
Statements of Changes in Net Assets (Continued)
| Nationwide HighMark Balanced Fund | ||||||||||||
| Six Months Ended January 31, 2014 (Unaudited) | Year Ended July 31, 2013 | |||||||||||
CAPITAL TRANSACTIONS: (continued) | ||||||||||||
Institutional Service Class Shares (b) | ||||||||||||
Proceeds from shares issued | $ | 1,185,423 | $ | 3,637,134 | ||||||||
Dividends reinvested | 1,179,715 | 705,479 | ||||||||||
Cost of shares redeemed | (5,583,151 | ) | (4,229,341 | ) | ||||||||
|
|
|
| |||||||||
Total Institutional Service Class Shares | (3,218,013 | ) | 113,272 | |||||||||
|
|
|
| |||||||||
Institutional Class Shares | ||||||||||||
Proceeds from shares issued | 10,000 | (c) | – | |||||||||
Dividends reinvested | 912 | (c) | – | |||||||||
Cost of shares redeemed | – | (c) | – | |||||||||
|
|
|
| |||||||||
Total Institutional Class Shares | 10,912 | (c) | – | |||||||||
|
|
|
| |||||||||
Change in net assets from capital transactions | $ | (2,778,639 | ) | $ | 8,072,990 | |||||||
|
|
|
| |||||||||
SHARE TRANSACTIONS: | ||||||||||||
Class A Shares | ||||||||||||
Issued | 55,647 | 451,648 | ||||||||||
Reinvested | 66,559 | 18,899 | ||||||||||
Redeemed | (123,158 | ) | (177,068 | ) | ||||||||
|
|
|
| |||||||||
Total Class A Shares | (952 | ) | 293,479 | |||||||||
|
|
|
| |||||||||
Class B Shares (a) | ||||||||||||
Issued | – | – | ||||||||||
Reinvested | – | 85 | ||||||||||
Redeemed | (1,046 | ) | (1,644 | ) | ||||||||
|
|
|
| |||||||||
Total Class B Shares | (1,046 | ) | (1,559 | ) | ||||||||
|
|
|
| |||||||||
Class C Shares | ||||||||||||
Issued | 51,927 | 258,222 | ||||||||||
Reinvested | 28,123 | 3,774 | ||||||||||
Redeemed | (42,702 | ) | (37,355 | ) | ||||||||
|
|
|
| |||||||||
Total Class C Shares | 37,348 | 224,641 | ||||||||||
|
|
|
| |||||||||
Institutional Service Class Shares (b) | ||||||||||||
Issued | 76,675 | 235,903 | ||||||||||
Reinvested | 79,980 | 47,314 | ||||||||||
Redeemed | (350,995 | ) | (276,326 | ) | ||||||||
|
|
|
| |||||||||
Total Institutional Service Class Shares | (194,340 | ) | 6,891 | |||||||||
|
|
|
| |||||||||
Institutional Class Shares | ||||||||||||
Issued | 624 | (c) | – | |||||||||
Reinvested | 62 | (c) | – | |||||||||
Redeemed | – | (c) | – | |||||||||
|
|
|
| |||||||||
Total Institutional Class Shares | 686 | (c) | – | |||||||||
|
|
|
| |||||||||
Total change in shares | (158,304 | ) | 523,452 | |||||||||
|
|
|
| |||||||||
Amounts designated as “–” are zero or have been rounded to zero.
| (a) | Effective September 16, 2013, Class B Shares converted into Class A Shares. |
| (b) | Effective September 16, 2013, Fiduciary Shares were renamed Institutional Service Class Shares. |
| (c) | For the period from September 19, 2013 (commencement of operations) through January 31, 2014. |
The accompanying notes are an integral part of these financial statements.
92
Financial Highlights
Selected data for each share of capital outstanding throughout the periods indicated
Nationwide HighMark Balanced Fund
| Operations | Distributions | Ratios/Supplemental Data | ||||||||||||||||||||||||||||||||||||||||||||||||||||||
Net AssetValue, Beginning | Net Investment Income | Net Realized and Unrealized Gains (Losses) from Investments | Total from Operations | Net Investment Income | Net Realized Gains | Total Distributions | Net Asset Value, End of Period | Total Return (a)(b) | Net Assets at End of Period | Ratio of Net Assets (c) | Ratio of Net Net Assets (c) | Ratio of Expenses (Prior to Reimbursements) to Average Net Assets (c)(d) | Portfolio Turnover (e) | |||||||||||||||||||||||||||||||||||||||||||
| Class A Shares | ||||||||||||||||||||||||||||||||||||||||||||||||||||||||
Six Months Ended January 31, 2014 (f) (Unaudited) | $ | 15.76 | 0.06 | 0.40 | 0.46 | (0.08 | ) | (1.37 | ) | (1.45 | ) | $ | 14.77 | 2.97% | $ | 10,757,052 | 1.24% | 0.80% | 1.82% | 22.49% | ||||||||||||||||||||||||||||||||||||
Year Ended July 31, 2013 (f) | $ | 15.12 | 0.14 | 1.12 | 1.26 | (0.16 | ) | (0.46 | ) | (0.62 | ) | $ | 15.76 | 8.60% | $ | 11,496,106 | 1.24% | 0.87% | 1.81% | 44.00% | ||||||||||||||||||||||||||||||||||||
Year Ended July 31, 2012 (f) | $ | 13.90 | 0.16 | 1.21 | 1.37 | (0.15 | ) | – | (0.15 | ) | $ | 15.12 | 9.94% | $ | 6,590,640 | 1.24% | 1.10% | 1.88% | 46.00% | |||||||||||||||||||||||||||||||||||||
Year Ended July 31, 2011 (f) | $ | 12.53 | 0.13 | 1.43 | 1.56 | (0.19 | ) | – | (0.19 | ) | $ | 13.90 | 12.50% | $ | 6,341,488 | 1.24% | 0.96% | 1.79% | 50.00% | |||||||||||||||||||||||||||||||||||||
Year Ended July 31, 2010 (f) | $ | 11.29 | 0.19 | 1.19 | 1.38 | (0.14 | ) | – | (0.14 | ) | $ | 12.53 | 12.24% | $ | 5,656,999 | 1.23% | 1.56% | 1.85% | 31.00% | |||||||||||||||||||||||||||||||||||||
Year Ended July 31, 2009 (f) | $ | 12.56 | 0.19 | (1.27 | )(g) | (1.08 | ) | (0.19 | ) | – | (0.19 | ) | $ | 11.29 | (8.46% | ) | $ | 4,515,734 | 1.22% | 1.76% | 1.81% | 48.00% | ||||||||||||||||||||||||||||||||||
| Class C Shares | ||||||||||||||||||||||||||||||||||||||||||||||||||||||||
Six Months Ended January 31, 2014 (f) (Unaudited) | $ | 15.66 | 0.02 | 0.38 | 0.40 | (0.03 | ) | (1.37 | ) | (1.40 | ) | $ | 14.66 | 2.60% | $ | 5,139,178 | 1.84% | 0.19% | 2.39% | 22.49% | ||||||||||||||||||||||||||||||||||||
Year Ended July 31, 2013 (f) | $ | 15.02 | 0.04 | 1.13 | 1.17 | (0.07 | ) | (0.46 | ) | (0.53 | ) | $ | 15.66 | 8.03% | $ | 4,903,200 | 1.84% | 0.27% | 2.31% | 44.00% | ||||||||||||||||||||||||||||||||||||
Year Ended July 31, 2012 (f) | $ | 13.81 | 0.07 | 1.21 | 1.28 | (0.07 | ) | – | (0.07 | ) | $ | 15.02 | 9.27% | $ | 1,330,078 | 1.84% | 0.50% | 2.38% | 46.00% | |||||||||||||||||||||||||||||||||||||
Year Ended July 31, 2011 (f) | $ | 12.46 | 0.05 | 1.42 | 1.47 | (0.12 | ) | – | (0.12 | ) | $ | 13.81 | 11.80% | $ | 853,968 | 1.84% | 0.36% | 2.29% | 50.00% | |||||||||||||||||||||||||||||||||||||
Year Ended July 31, 2010 (f) | $ | 11.22 | 0.12 | 1.18 | 1.30 | (0.06 | ) | – | (0.06 | ) | $ | 12.46 | 11.61% | $ | 510,316 | 1.83% | 0.96% | 2.35% | 31.00% | |||||||||||||||||||||||||||||||||||||
Year Ended July 31, 2009 (f) | $ | 12.49 | 0.12 | (1.26 | )(g) | (1.14 | ) | (0.13 | ) | – | (0.13 | ) | $ | 11.22 | (9.03% | ) | $ | 333,018 | 1.82% | 1.16% | 2.31% | 48.00% | ||||||||||||||||||||||||||||||||||
| Institutional Service Class Shares (h) | ||||||||||||||||||||||||||||||||||||||||||||||||||||||||
Six Months Ended January 31, 2014 (f) (Unaudited) | $ | 15.80 | 0.08 | 0.39 | 0.47 | (0.10 | ) | (1.37 | ) | (1.47 | ) | $ | 14.80 | 3.03% | $ | 13,362,554 | 0.99% | 1.05% | 1.56% | 22.49% | ||||||||||||||||||||||||||||||||||||
Year Ended July 31, 2013 (f) | $ | 15.15 | 0.18 | 1.13 | 1.31 | (0.20 | ) | (0.46 | ) | (0.66 | ) | $ | 15.80 | 8.91% | $ | 17,330,766 | 0.99% | 1.12% | 1.56% | 44.00% | ||||||||||||||||||||||||||||||||||||
Year Ended July 31, 2012 (f) | $ | 13.93 | 0.19 | 1.21 | 1.40 | (0.18 | ) | – | (0.18 | ) | $ | 15.15 | 10.19% | $ | 16,517,048 | 0.99% | 1.35% | 1.63% | 46.00% | |||||||||||||||||||||||||||||||||||||
Year Ended July 31, 2011 (f) | $ | 12.56 | 0.16 | 1.43 | 1.59 | (0.22 | ) | – | (0.22 | ) | $ | 13.93 | 12.72% | $ | 18,267,117 | 0.99% | 1.21% | 1.54% | 50.00% | |||||||||||||||||||||||||||||||||||||
Year Ended July 31, 2010 (f) | $ | 11.31 | 0.22 | 1.20 | 1.42 | (0.17 | ) | – | (0.17 | ) | $ | 12.56 | 12.60% | $ | 17,551,594 | 0.98% | 1.81% | 1.60% | 31.00% | |||||||||||||||||||||||||||||||||||||
Year Ended July 31, 2009 (f) | $ | 12.58 | 0.21 | (1.27 | )(g) | (1.06 | ) | (0.21 | ) | – | (0.21 | ) | $ | 11.31 | (8.24% | ) | $ | 16,798,667 | 0.97% | 2.01% | 1.56% | 48.00% | ||||||||||||||||||||||||||||||||||
| Institutional Class Shares | ||||||||||||||||||||||||||||||||||||||||||||||||||||||||
Period Ended January 31, 2014 (f)(i) (Unaudited) | $ | 16.03 | 0.07 | 0.19 | 0.26 | (0.09 | ) | (1.37 | ) | (1.46 | ) | $ | 14.83 | 1.67% | $ | 10,170 | 0.84% | 1.19% | 1.45% | 22.49% | ||||||||||||||||||||||||||||||||||||
Amounts designated as “–” are zero or have been rounded to zero.
| (a) | Excludes sales charge. |
| (b) | Not annualized for periods less than one year. |
| (c) | Annualized for periods less than one year. |
| (d) | During the period, certain fees may have been waived and/or reimbursed. If such waivers/reimbursements had not occurred, the ratios would have been as indicated. |
| (e) | Portfolio turnover is calculated on the basis of the Fund as a whole without distinguishing among the classes of shares. |
| (f) | Per share calculations were performed using average shares method. |
| (g) | Includes $0.012 of Fair Funds Settlement. |
| (h) | Effective September 16, 2013, Fiduciary Shares were renamed Institutional Service Class Shares. |
| (i) | For the period from September 19, 2013 (commencement of operations) through January 31, 2014. Total return is calculated based on inception date of September 18, 2013 through January 31, 2014. |
The accompanying notes are an integral part of these financial statements.
93
| Fund Commentary | Nationwide HighMark Large Cap Core Equity Fund |
For the semiannual period ended January 31, 2014, the Nationwide HighMark Large Cap Core Equity Fund (Institutional Service Class) returned 5.53%* versus 6.85% for its benchmark, the S&P 500® Index. For broader comparison, the median return for the Fund’s closest Lipper peer category of Large-Cap Core Funds (consisting of 951 funds as of January 31, 2014) was 6.60% for the same time period.
*Performance prior to the Fund’s inception on September 16, 2013, is based on the performance of the Fund’s predecessor fund.
Market Environment
The reporting period started off ominously as an impasse in the U.S. Congress over the debt ceiling shut down the U.S. federal government for two weeks. Fortunately, before any actual debt payments were missed, the crisis was resolved, and the economy went right back to resuming its upward trend.
And upward it was: At 4.1% in the third quarter and 3.2% in the fourth quarter of 2013, gross domestic product (GDP) growth was higher than observers thought it would be. Housing improved, the rate of unemployment fell, the rate of consumption grew and, most important, the federal government passed its first budget in more than two years. This agreement removed the extension of sequestration and the threat of further policy impasse due to issues involving the debt ceiling.
All this good news led the domestic equities to extend their gains in the fourth quarter of 2013. The gains were primarily from expectations of future earnings growth. Earnings growth itself has been moderate since then, but the growth in the valuation multiples for the market have been anything but.
Portfolio Performance
The market activity for 2013 produced headwinds for the Fund. Much of the performance in the market was generated from the extremes of the style spectrum: either high-octane, high-valuation growth stocks or distressed value stocks. Given our position in the middle of this range in relation
to the Fund’s investments, these stocks are infrequent members of the Fund’s portfolio.
In addition, in the fourth quarter of 2013, market strength added to the challenge. Broad growth across the market muted the signals we get from our earnings-based models. The market rewarded the firms with weaker expectations under the premise that on the margin they would be helped more by the improving economy, working against the trends that we have found useful in our process. This reversal is a characteristic of a “junk” rally and occurs from time to time when lower-quality stocks lead the market.
During the reporting period, we maintained a fairly stable position in the Fund across industries and sectors. The Fund was overweight in the industrials sector behind positions in aerospace firms Boeing and Lockheed Martin. The Fund’s largest underweight was in consumer discretionary, due to a lack of attractive stocks in the retailing and media industries.
Outlook and Positioning
Stabilization in market conditions has improved the environment for active management. Correlations across stocks fell throughout 2013, indicating that the merit of individual stocks’ future returns will be determined more by the merit of individual companies than by overbearing macroeconomic concerns. Active management thrives in such an environment.
At the same time, the market activity that produced headwinds for the Fund’s strategy in 2013 should shift and become tailwinds in 2014. The strong returns that came from the extremes of the growth and value universes also stretched these asset classes’ valuations versus those of the rest of the market. If these trends were to reverse, we could have the type of market in which the Fund’s strategy excels. The Fund entered into financial futures contracts (“futures contracts”) to enable the Fund to more closely approximate the
performance of its benchmark indices or for tactical hedging purposes.
94
| Fund Commentary (con’t.) | Nationwide HighMark Large Cap Core Equity Fund |
Subadviser:
HighMark Capital Management, Inc.
Portfolio Managers:
Edward Herbert and Derek Izuel
The Fund is subject to the risks of investing in equity securities. The Fund may invest in more-aggressive investments such as derivatives (many of which create investment leverage and are highly volatile) and foreign securities (which are volatile, harder to price and less liquid than U.S. securities). Please refer to the summary prospectus for a more detailed explanation of the Fund’s principal risks.
A description of the benchmarks can be found on the Market Index Definitions page at the back of this book.
95
| Fund Overview (Unaudited) | Nationwide HighMark Large Cap Core Equity Fund |
Objective
The Fund seeks long-term capital appreciation.
Highlights
| Ÿ | For the semiannual period ended January 31, 2014, the Fund (Institutional Service Class) returned 5.53%, underperforming the benchmark by 1.32% and the Lipper peer category by 1.07%. |
| Ÿ | The Fund underperformed during the reporting period due to a rally in high-octane, high-valuation growth stocks or distressed value stocks; the Fund is underweight in both of these areas of investment. |
| Ÿ | The Fund was overweight the industrials sector and underweight the consumer discretionary sector during the reporting period. |
Asset Allocation†
| Common Stocks | 98.7% | |||
| Mutual Fund | 1.5% | |||
| Liabilities in excess of other assets | (0.2)% | |||
| 100.0% |
Top Industries††
| Oil, Gas & Consumable Fuels | 8.2% | |||
| Pharmaceuticals | 7.1% | |||
| Software | 5.7% | |||
| Chemicals | 5.4% | |||
| Commercial Banks | 5.2% | |||
| Insurance | 4.6% | |||
| Communications Equipment | 4.5% | |||
| Road & Rail | 4.2% | |||
| Aerospace & Defense | 4.2% | |||
| Health Care Providers & Services | 3.2% | |||
| Other Industries | 47.7% | |||
| 100.0% |
Top Holdings†
| Wells Fargo & Co. | 4.3% | |||
| QUALCOMM, Inc. | 3.5% | |||
| Union Pacific Corp. | 3.3% | |||
| Procter & Gamble Co. (The) | 3.0% | |||
| Coca-Cola Co. (The) | 3.0% | |||
| Pfizer, Inc. | 2.9% | |||
| Chevron Corp. | 2.8% | |||
| Boeing Co. (The) | 2.6% | |||
| General Electric Co. | 2.5% | |||
| Travelers Cos., Inc. (The) | 2.4% | |||
| Other Holdings | 69.7% | |||
| 100.0% |
| † | Percentages indicated are based upon net assets as of January 31, 2014. |
| †† | Percentages indicated are based upon total investments as of January 31, 2014. |
96
| Fund Performance | Nationwide HighMark Large Cap Core Equity Fund |
Average Annual Total Return
(For periods ended January 31, 2014)
| Six Months* | 1 Yr. | 5 Yr. | 10 Yr. | |||||||||||||||
| Class A | w/o SC1 | 5.44% | 18.71% | 19.04% | 6.01% | |||||||||||||
| w/SC2 | -0.40% | 12.22% | 17.68% | 5.42% | ||||||||||||||
| Class C | w/o SC1 | 5.13% | 17.96% | 18.28% | 5.34% | |||||||||||||
| w/SC3 | 4.13% | 16.96% | 18.28% | 5.34% | ||||||||||||||
| Institutional Service Class4,5 | w/o SC | 5.53% | 18.93% | 19.37% | 6.31% | |||||||||||||
| Institutional Class4 | w/o SC | 3.12% | 6 | — | — | — | ||||||||||||
All figures showing the effect of a sales charge (SC) reflect the maximum charge possible, because it has the most significant effect on performance data.
| * | Not annualized. |
| 1 | These returns do not reflect the effects of SCs. |
| 2 | For the period from September 16, 2013 through January 31, 2014 a front-end sales charge of 5.75% was deducted. Prior to September 16, 2013, a front-end sales charge of 5.50% was deducted. |
| 3 | A 1.00% CDSC was deducted from the one year return because it is charged when you sell Class C shares within the first year after purchase. |
| 4 | Not subject to any SCs. |
| 5 | Effective September 16, 2013 Fiduciary Shares were renamed Institutional Service Class Shares. |
| 6 | Since inception date of September 18, 2013. Not Annualized. |
Expense Ratios
| Gross Expense Ratio* | Net Expense Ratio* | |||||
| Class A | 1.46% | 1.22% | ||||
| Class C | 1.96% | 1.82% | ||||
| Institutional Service Class | 1.21% | 0.97% | ||||
| Institutional Class | 0.96% | 0.82% | ||||
| * | Current effective prospectus dated September 16, 2013. The difference between gross and net operating expenses reflects contractual waivers in place through November 30, 2015. Please see the Fund’s most recent prospectus for details. |
97
| Fund Performance | Nationwide HighMark Large Cap Core Equity Fund |
Performance of a $10,000 Investment
Investment return and principal value will fluctuate, and when redeemed, shares may be worth more or less than original cost. Past performance is no guarantee of future results and does not reflect the deduction of taxes that a shareholder would pay on fund distributions or the redemption of fund shares. Investing in mutual funds involves market risk, including loss of principal. Performance returns assume the reinvestment of all distributions.
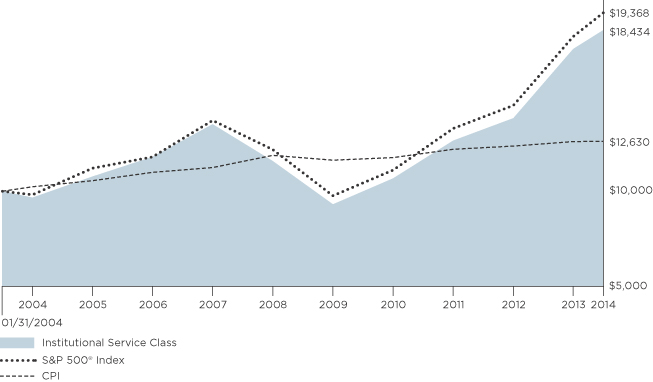
Comparative performance of $10,000 invested in Institutional Service Class shares of the Nationwide HighMark Large Cap Core Equity Fund versus the S&P 500® Index and the Consumer Price Index (CPI) over the 10-year period ended 1/31/14. Fund performance prior to the Fund’s inception on 9/16/13 is based on the Fund’s predecessor Fund. Unlike the Fund, the performance for these unmanaged indexes does not reflect any fees, expenses, or sales charges. One cannot invest directly in a market index. A description of the benchmarks can be found on the Market Index Definitions page at the back of this book.
98
| Shareholder Expense Example | Nationwide HighMark Large Cap Core Equity Fund |
As a shareholder of the Fund, you incur two types of costs: (1) transaction costs, including sales charges (loads) paid on purchase payments and redemption fees; and (2) ongoing costs, including investment advisory fees, administration fees, distribution fees and other Fund expenses. The examples below are intended to help you understand your ongoing costs (in dollars) of investing in the Fund and to compare these costs with the ongoing costs of investing in other mutual funds. Per Securities and Exchange Commission (“SEC”) requirements, the examples assume that you had a $1,000 investment in the Class at the beginning of the reporting period (August 1, 2013) and continued to hold your shares at the end of the reporting period (January 31, 2014).
Actual Expenses
For each Class of the Fund in the table below, the first line provides information about actual account values and actual expenses. You may use the information in this line, together with the amount you invested, to estimate the expenses that you paid from August 1, 2013 through January 31, 2014. Simply divide your account value by $1,000 (for example, an $8,600 account value divided by $1,000 = 8.6), then multiply the result by the number in the first line of each Class under the heading entitled “Expenses Paid During Period” to estimate the expenses you paid on your account during this period.
Hypothetical Expenses for Comparison Purposes
The second line of each Class in the table below provides information about hypothetical account values and hypothetical expenses based on the Class’ actual expense ratio and an assumed rate of return of 5% per year before expenses, which is not the Class’ actual return. The hypothetical account values and expenses may not be used to estimate the actual ending account balance or expenses you paid for the period from August 1, 2013 through January 31, 2014. You may use this information to compare the ongoing costs of investing in the Class of the Fund and other funds. To do so, compare this 5% hypothetical example with the 5% hypothetical examples that appear in the shareholder reports of the other funds.
Please note that the expenses shown in the table are meant to highlight your ongoing costs only and do not reflect any transaction costs, such as sales charges (loads) or redemption fees. If these transaction costs were included, your costs would have been higher. Therefore, the second line for each Class in the table is useful in comparing ongoing costs only, and will not help you determine the relative total costs of owning different funds. The examples also assume all dividends and distributions are reinvested.
Schedule of Shareholder Expenses
Expense Analysis of a $1,000 Investment
Nationwide HighMark Large Cap January 31, 2014 | Beginning Account Value ($) 08/01/13 | Ending Account Value ($) 01/31/14 | Expenses Paid During Period ($) 08/01/13 - 01/31/14 | Expense Ratio During Period (%) 08/01/13 - 01/31/14 | ||||||||
| Class A Shares | Actual | a | 1,000.00 | 1,054.40 | 6.32 | 1.22 | ||||||
| Hypothetical | a,b | 1,000.00 | 1,019.06 | 6.21 | 1.22 | |||||||
| Class C Shares | Actual | a | 1,000.00 | 1,051.30 | 9.41 | 1.82 | ||||||
| Hypothetical | a,b | 1,000.00 | 1,016.03 | 9.25 | 1.82 | |||||||
| Institutional Service Class Sharesc | Actual | a | 1,000.00 | 1,055.30 | 5.03 | 0.97 | ||||||
| Hypothetical | a,b | 1,000.00 | 1,020.32 | 4.94 | 0.97 | |||||||
| Institutional Class Shares | Actual | d | 1,000.00 | 1,031.20 | 3.08 | 0.82 | ||||||
| Hypothetical | a,b | 1,000.00 | 1,021.07 | 4.18 | 0.82 | |||||||
| a | Expenses are equal to the Fund’s annualized expense ratio multiplied by the average account value from August 1, 2013 through January 31, 2014 multiplied to reflect one-half year period. The expense ratio presented represents a six-month, annualized ratio in accordance with Securities and Exchange Commission guidelines. |
| b | Represents the hypothetical 5% return before expenses. |
| c | Effective September 16, 2013, Fiduciary Shares were renamed Institutional Class Shares. |
| d | Actual expenses are equal to the Fund’s annualized expense ratio multiplied by the average account value from September 19, 2013 through January 31, 2014 to reflect the period from commencement of operations. |
99
Statement of Investments
January 31, 2014 (Unaudited)
Nationwide HighMark Large Cap Core Equity Fund
| Common Stocks 98.7% | ||||||||||
| Shares | Market Value | |||||||||
| ||||||||||
Aerospace & Defense 4.2% |
| |||||||||
Boeing Co. (The) | 12,400 | $ | 1,553,224 | |||||||
Lockheed Martin Corp. | 4,500 | 679,095 | ||||||||
Spirit AeroSystems Holdings, Inc., Class A* | 7,200 | 244,152 | ||||||||
|
| |||||||||
| 2,476,471 | ||||||||||
|
| |||||||||
| ||||||||||
Auto Components 0.9% |
| |||||||||
Johnson Controls, Inc. | 11,800 | 544,216 | ||||||||
|
| |||||||||
| ||||||||||
Automobiles 0.7% |
| |||||||||
Ford Motor Co. | 28,500 | 426,360 | ||||||||
|
| |||||||||
| ||||||||||
Beverages 3.0% |
| |||||||||
Coca-Cola Co. (The) | 46,920 | 1,774,514 | ||||||||
|
| |||||||||
| ||||||||||
Biotechnology 2.5% |
| |||||||||
Biogen Idec, Inc.* | 2,400 | 750,336 | ||||||||
Celgene Corp.* | 1,400 | 212,702 | ||||||||
Pharmacyclics, Inc.* | 3,700 | 492,359 | ||||||||
|
| |||||||||
| 1,455,397 | ||||||||||
|
| |||||||||
| ||||||||||
Building Products 0.4% |
| |||||||||
Allegion PLC* | 4,366 | 215,462 | ||||||||
|
| |||||||||
| ||||||||||
Capital Markets 1.0% |
| |||||||||
Goldman Sachs Group, Inc. (The) | 3,400 | 558,008 | ||||||||
|
| |||||||||
| ||||||||||
Chemicals 5.4% |
| |||||||||
Huntsman Corp. | 13,200 | 289,344 | ||||||||
Monsanto Co. | 4,700 | 500,785 | ||||||||
PPG Industries, Inc. | 6,300 | 1,148,868 | ||||||||
Praxair, Inc. | 2,067 | 257,796 | ||||||||
Westlake Chemical Corp. | 8,100 | 984,474 | ||||||||
|
| |||||||||
| 3,181,267 | ||||||||||
|
| |||||||||
| ||||||||||
Commercial Banks 5.2% |
| |||||||||
Regions Financial Corp. | 53,900 | 548,163 | ||||||||
Wells Fargo & Co. | 55,045 | 2,495,740 | ||||||||
|
| |||||||||
| 3,043,903 | ||||||||||
|
| |||||||||
| ||||||||||
Commercial Services & Supplies 0.4% |
| |||||||||
Tyco International Ltd. | 6,400 | 259,136 | ||||||||
|
| |||||||||
| ||||||||||
Communications Equipment 4.5% |
| |||||||||
Cisco Systems, Inc. | 26,900 | 589,379 | ||||||||
QUALCOMM, Inc. | 27,875 | 2,068,883 | ||||||||
|
| |||||||||
| 2,658,262 | ||||||||||
|
| |||||||||
| ||||||||||
Computers & Peripherals 1.6% |
| |||||||||
Apple, Inc. | 1,815 | 908,589 | ||||||||
|
| |||||||||
| ||||||||||
Consumer Finance 1.2% |
| |||||||||
Discover Financial Services | 13,000 | 697,450 | ||||||||
|
| |||||||||
| Common Stocks (continued) | ||||||||||
| Shares | Market Value | |||||||||
| ||||||||||
Diversified Consumer Services 0.7% |
| |||||||||
Service Corp. International | 22,700 | $ | 401,790 | |||||||
|
| |||||||||
| ||||||||||
Diversified Financial Services 0.5% |
| |||||||||
Citigroup, Inc. | 6,400 | 303,552 | ||||||||
|
| |||||||||
| ||||||||||
Energy Equipment & Services 1.2% |
| |||||||||
Dril-Quip, Inc.* | 6,000 | 603,360 | ||||||||
Oceaneering International, Inc. | 1,800 | 122,670 | ||||||||
|
| |||||||||
| 726,030 | ||||||||||
|
| |||||||||
| ||||||||||
Food & Staples Retailing 0.3% |
| |||||||||
CVS Caremark Corp. | 2,440 | 165,237 | ||||||||
|
| |||||||||
| ||||||||||
Food Products 1.5% |
| |||||||||
Hillshire Brands Co. | 25,000 | 890,500 | ||||||||
|
| |||||||||
| ||||||||||
Health Care Equipment & Supplies 2.3% |
| |||||||||
Abbott Laboratories | 37,300 | 1,367,418 | ||||||||
|
| |||||||||
| ||||||||||
Health Care Providers & Services 3.2% |
| |||||||||
Aetna, Inc. | 8,400 | 573,972 | ||||||||
Cardinal Health, Inc. | 3,900 | 265,278 | ||||||||
McKesson Corp. | 6,000 | 1,046,460 | ||||||||
|
| |||||||||
| 1,885,710 | ||||||||||
|
| |||||||||
| ||||||||||
Hotels, Restaurants & Leisure 2.1% |
| |||||||||
McDonald’s Corp. | 5,800 | 546,186 | ||||||||
Starbucks Corp. | 5,400 | 384,048 | ||||||||
Starwood Hotels & Resorts Worldwide, Inc. | 3,879 | 289,800 | ||||||||
|
| |||||||||
| 1,220,034 | ||||||||||
|
| |||||||||
| ||||||||||
Household Durables 0.2% |
| |||||||||
Taylor Morrison Home Corp., Class A* | 6,200 | 131,130 | ||||||||
|
| |||||||||
| ||||||||||
Household Products 3.0% |
| |||||||||
Procter & Gamble Co. (The) | 23,200 | 1,777,584 | ||||||||
|
| |||||||||
| ||||||||||
Independent Power Producers & Energy Traders 0.6% |
| |||||||||
Calpine Corp.* | 17,800 | 337,844 | ||||||||
|
| |||||||||
| ||||||||||
Industrial Conglomerates 2.5% |
| |||||||||
General Electric Co. | 58,055 | 1,458,922 | ||||||||
|
| |||||||||
| ||||||||||
Information Technology Services 2.6% |
| |||||||||
Amdocs Ltd. | 15,000 | 648,900 | ||||||||
Computer Sciences Corp. | 10,200 | 616,182 | ||||||||
CoreLogic, Inc.* | 4,150 | 132,177 | ||||||||
FleetCor Technologies, Inc.* | 1,200 | 127,584 | ||||||||
|
| |||||||||
| 1,524,843 | ||||||||||
|
| |||||||||
| ||||||||||
Insurance 4.6% |
| |||||||||
Allstate Corp. (The) | 5,730 | 293,376 | ||||||||
Aspen Insurance Holdings Ltd. | 7,200 | 280,080 | ||||||||
HCC Insurance Holdings, Inc. | 3,250 | 139,458 | ||||||||
100
Statement of Investments (Continued)
January 31, 2014 (Unaudited)
Nationwide HighMark Large Cap Core Equity Fund (Continued)
| Common Stocks (continued) | ||||||||||
| Shares | Market Value | |||||||||
| ||||||||||
Insurance (continued) |
| |||||||||
PartnerRe Ltd. | 5,700 | $ | 559,569 | |||||||
Travelers Cos., Inc. (The) | 17,300 | 1,406,144 | ||||||||
|
| |||||||||
| 2,678,627 | ||||||||||
|
| |||||||||
| ||||||||||
Internet & Catalog Retail 0.5% |
| |||||||||
Amazon.com, Inc.* | 800 | 286,952 | ||||||||
|
| |||||||||
| ||||||||||
Internet Software & Services 2.9% |
| |||||||||
eBay, Inc.* | 16,300 | 867,160 | ||||||||
Google, Inc., Class A* | 700 | 826,679 | ||||||||
|
| |||||||||
| 1,693,839 | ||||||||||
|
| |||||||||
| ||||||||||
Machinery 1.3% |
| |||||||||
Ingersoll-Rand PLC | 13,100 | 770,149 | ||||||||
|
| |||||||||
| ||||||||||
Media 2.1% |
| |||||||||
Liberty Media Corp., Series A* | 2,500 | 328,975 | ||||||||
Madison Square Garden Co. (The), Class A* | 2,600 | 150,878 | ||||||||
Time Warner, Inc. | 8,100 | 508,923 | ||||||||
Viacom, Inc., Class B | 2,700 | 221,670 | ||||||||
|
| |||||||||
| 1,210,446 | ||||||||||
|
| |||||||||
| ||||||||||
Multi-Utilities 0.7% |
| |||||||||
DTE Energy Co. | 6,000 | 409,320 | ||||||||
|
| |||||||||
| ||||||||||
Office Electronics 1.7% |
| |||||||||
Xerox Corp. | 91,700 | 994,945 | ||||||||
|
| |||||||||
| ||||||||||
Oil, Gas & Consumable Fuels 8.2% |
| |||||||||
Anadarko Petroleum Corp. | 4,300 | 346,967 | ||||||||
Cabot Oil & Gas Corp. | 17,600 | 703,648 | ||||||||
Chevron Corp. | 14,900 | 1,663,287 | ||||||||
EOG Resources, Inc. | 3,900 | 644,436 | ||||||||
Occidental Petroleum Corp. | 7,171 | 627,964 | ||||||||
Phillips 66 | 8,700 | 635,883 | ||||||||
Southwestern Energy Co.* | 4,800 | 195,312 | ||||||||
|
| |||||||||
| 4,817,497 | ||||||||||
|
| |||||||||
| ||||||||||
Personal Products 0.2% |
| |||||||||
Nu Skin Enterprises, Inc., Class A | 1,200 | 102,180 | ||||||||
|
| |||||||||
| ||||||||||
Pharmaceuticals 7.1% |
| |||||||||
AbbVie, Inc. | 10,700 | 526,761 | ||||||||
Allergan, Inc. | 6,800 | 779,280 | ||||||||
Eli Lilly & Co. | 3,600 | 194,436 | ||||||||
Johnson & Johnson | 10,940 | 967,862 | ||||||||
Pfizer, Inc. | 55,717 | 1,693,797 | ||||||||
|
| |||||||||
| 4,162,136 | ||||||||||
|
| |||||||||
| ||||||||||
Real Estate Investment Trusts (REITs) 2.1% |
| |||||||||
Boston Properties, Inc. | 2,500 | 270,225 | ||||||||
Equity Lifestyle Properties, Inc. | 4,400 | 172,964 | ||||||||
General Growth Properties, Inc. | 9,300 | 187,302 | ||||||||
| Common Stocks (continued) | ||||||||||
| Shares | Market Value | |||||||||
| ||||||||||
Real Estate Investment Trusts (REITs) (continued) |
| |||||||||
Prologis, Inc. | 15,161 | $ | 587,640 | |||||||
|
| |||||||||
| 1,218,131 | ||||||||||
|
| |||||||||
| ||||||||||
Road & Rail 4.3% |
| |||||||||
AMERCO | 1,000 | 222,730 | ||||||||
Old Dominion Freight Line, Inc.* | 6,400 | 347,136 | ||||||||
Union Pacific Corp. | 11,000 | 1,916,640 | ||||||||
|
| |||||||||
| 2,486,506 | ||||||||||
|
| |||||||||
| ||||||||||
Software 5.8% |
| |||||||||
Activision Blizzard, Inc. | 18,200 | 311,766 | ||||||||
Adobe Systems, Inc.* | 7,900 | 467,601 | ||||||||
CA, Inc. | 13,630 | 437,251 | ||||||||
Citrix Systems, Inc.* | 3,200 | 173,024 | ||||||||
Compuware Corp. | 39,400 | 399,516 | ||||||||
Microsoft Corp. | 31,725 | 1,200,791 | ||||||||
Oracle Corp. | 10,138 | 374,092 | ||||||||
|
| |||||||||
| 3,364,041 | ||||||||||
|
| |||||||||
| ||||||||||
Specialty Retail 2.5% |
| |||||||||
Home Depot, Inc. (The) | 10,083 | 774,879 | ||||||||
Lowe’s Cos., Inc. | 8,900 | 411,981 | ||||||||
Signet Jewelers Ltd. | 3,800 | 302,290 | ||||||||
|
| |||||||||
| 1,489,150 | ||||||||||
|
| |||||||||
| ||||||||||
Textiles, Apparel & Luxury Goods 0.3% |
| |||||||||
NIKE, Inc., Class B | 2,200 | 160,270 | ||||||||
|
| |||||||||
| ||||||||||
Tobacco 2.0% |
| |||||||||
Philip Morris International, Inc. | 15,290 | 1,194,761 | ||||||||
|
| |||||||||
| ||||||||||
Wireless Telecommunication Services 0.7% |
| |||||||||
Telephone & Data Systems, Inc. | 14,600 | 394,492 | ||||||||
|
| |||||||||
Total Common Stocks (cost $45,825,722) |
| 57,823,071 | ||||||||
|
| |||||||||
| Mutual Fund 1.5% | ||||||||||
Money Market Fund 1.5% | ||||||||||
Fidelity Institutional Money Market Fund — Institutional Class, | 863,587 | 863,587 | ||||||||
|
| |||||||||
Total Mutual Fund (cost $863,587) |
| 863,587 | ||||||||
|
| |||||||||
Total Investments |
| 58,686,658 | ||||||||
Liabilities in excess of other assets — (0.2%) |
| (130,164 | ) | |||||||
|
| |||||||||
NET ASSETS — 100.0% |
| $ | 58,556,494 | |||||||
|
| |||||||||
101
Statement of Investments (Continued)
January 31, 2014 (Unaudited)
Nationwide HighMark Large Cap Core Equity Fund (Continued)
| * | Denotes a non-income producing security. |
| (a) | Represents 7-day effective yield as of January 31, 2014. |
| (b) | See notes to financial statements for tax cost and unrealized appreciation/(depreciation) of securities. |
| Ltd. | Limited |
| PLC | Public Limited Company |
| REIT | Real Estate Investment Trust |
At January 31, 2014, the Fund’s open futures contracts were as follows (Note 2):
| Number of Contracts | Long Contracts | Expiration | Notional Value Covered by Contracts | Unrealized Appreciation/ (Depreciation) | ||||||||||
| 10 | E-mini S&P 500 | 03/21/14 | $ | 888,300 | $ | (1,835 | ) | |||||||
|
|
|
|
|
| |||||||||
The accompanying notes are an integral part of these financial statements.
102
Statement of Assets and Liabilities
January 31, 2014 (Unaudited)
Nationwide Large Cap Core Equity Fund | ||||||
Assets: | ||||||
Investments, at value (cost $46,689,309) | $ | 58,686,658 | ||||
Dividends receivable | 35,367 | |||||
Receivable for capital shares issued | 75,166 | |||||
Reclaims receivable | 163 | |||||
Receivable for variation margin on futures contracts | 60,233 | |||||
Prepaid expenses | 20,547 | |||||
|
| |||||
Total Assets | 58,878,134 | |||||
|
| |||||
Liabilities: | ||||||
Payable for capital shares redeemed | 213,913 | |||||
Cash overdraft (Note 2) | 11,075 | |||||
Accrued expenses and other payables: | ||||||
Investment advisory fees | 25,397 | |||||
Fund administration fees | 10,117 | |||||
Distribution fees | 3,136 | |||||
Administrative servicing fees | 29,154 | |||||
Accounting and transfer agent fees | 1,582 | |||||
Trustee fees | 995 | |||||
Deferred compensation (Note 2) | 5,379 | |||||
Custodian fees | 282 | |||||
Compliance program costs (Note 3) | 819 | |||||
Professional fees | 13,910 | |||||
Printing fees | 5,772 | |||||
Other | 109 | |||||
|
| |||||
Total Liabilities | 321,640 | |||||
|
| |||||
Net Assets | $ | 58,556,494 | ||||
|
| |||||
Represented by: | ||||||
Capital | $ | 50,142,006 | ||||
Accumulated undistributed net investment income | 272,657 | |||||
Accumulated net realized losses from investment and futures transactions | (3,853,683 | ) | ||||
Net unrealized appreciation/(depreciation) from investments | 11,997,349 | |||||
Net unrealized appreciation/(depreciation) from futures contracts (Note 2) | (1,835 | ) | ||||
|
| |||||
Net Assets | $ | 58,556,494 | ||||
|
| |||||
Net Assets: | ||||||
Class A Shares | $ | 10,394,584 | ||||
Class C Shares | 955,873 | |||||
Institutional Service Class Shares | 47,195,726 | |||||
Institutional Class Shares | 10,311 | |||||
|
| |||||
Total | $ | 58,556,494 | ||||
|
| |||||
Shares Outstanding (unlimited number of shares authorized): | ||||||
Class A Shares | 862,869 | |||||
Class C Shares | 81,862 | |||||
Institutional Service Class Shares | 3,903,938 | |||||
Institutional Class Shares | 853 | |||||
|
| |||||
Total | 4,849,522 | |||||
|
| |||||
103
Statement of Assets and Liabilities (Continued)
January 31, 2014 (Unaudited)
Nationwide Large Cap Core Equity Fund | ||||||
Net asset value and redemption price per share (Net assets by class divided by shares outstanding by class, respectively): | ||||||
Class A Shares (a) | $ | 12.05 | ||||
Class C Shares (b) | $ | 11.68 | ||||
Institutional Service Class Shares | $ | 12.09 | ||||
Institutional Class Shares | $ | 12.09 | ||||
Maximum offering price per share (100%/(100%-maximum sales charge) of net asset value adjusted to the nearest cent): | ||||||
Class A Shares | $ | 12.79 | ||||
|
| |||||
Maximum Sales Charge: | ||||||
Class A Shares | 5.75 | % | ||||
|
| |||||
| (a) | For Class A Shares, the redemption price per share is reduced by 1.00% on sales of shares of original purchases of $1,000,000 or more or that were not subject to a front-end sales charge made within 18 months of the purchase date. |
| (b) | For Class C Shares, the redemption price per share is reduced by 1.00% for shares held less than 1 year. |
The accompanying notes are an integral part of these financial statements.
104
Statement of Operations
For the Six Months Ended January 31, 2014 (Unaudited)
Nationwide Large Cap Core Equity Fund | ||||||
INVESTMENT INCOME: | ||||||
Dividend income | $ | 581,702 | ||||
Interest income | 57 | |||||
|
| |||||
Total Income | 581,759 | |||||
|
| |||||
EXPENSES: | ||||||
Investment advisory fees | 180,325 | |||||
Fund administration fees | 52,912 | |||||
Distribution fees Class A | 12,843 | |||||
Distribution fees Class C | 5,032 | |||||
Administrative servicing fees Class A | 8,925 | |||||
Administrative servicing fees Institutional Service Class (a) | 42,773 | |||||
Registration and filing fees | 20,147 | |||||
Professional fees | 14,708 | |||||
Printing fees | 8,780 | |||||
Trustee fees | 1,350 | |||||
Custodian fees | 1,403 | |||||
Accounting and transfer agent fees | 4,782 | |||||
Compliance program costs (Note 3) | 1,597 | |||||
Other | 6,218 | |||||
|
| |||||
Total expenses before earnings credit, fees waived, and expenses reimbursed | 361,795 | |||||
|
| |||||
Earnings credit (Note 5) | (29 | ) | ||||
Administrative servicing fees voluntarily waived — Class A (Note 3) | (1,219 | ) | ||||
Administrative servicing fees voluntarily waived — Institutional Service Class (a) (Note 3) | (6,159 | ) | ||||
Expenses reimbursed by adviser (Note 3) | (45,707 | ) | ||||
|
| |||||
Net Expenses | 308,681 | |||||
|
| |||||
NET INVESTMENT INCOME | 273,078 | |||||
|
| |||||
REALIZED/UNREALIZED GAINS (LOSSES) FROM INVESTMENTS: | ||||||
Net realized gains from investment transactions | 2,786,954 | |||||
Net realized gains from futures transactions (Note 2) | 114,972 | |||||
|
| |||||
Net realized gains from investment and futures transactions | 2,901,926 | |||||
|
| |||||
Net change in unrealized appreciation/(depreciation) from investments | (57,185 | ) | ||||
Net change in unrealized appreciation/(depreciation) from futures contracts (Note 2) | 3,799 | |||||
|
| |||||
Net change in unrealized appreciation/(depreciation) from investments and futures contracts | (53,386 | ) | ||||
|
| |||||
Net realized/unrealized gains from investment and futures transactions | 2,848,540 | |||||
|
| |||||
CHANGE IN NET ASSETS RESULTING FROM OPERATIONS | $ | 3,121,618 | ||||
|
| |||||
| (a) | Effective September 16, 2013, Fiduciary Shares were renamed Institutional Service Class Shares. |
The accompanying notes are an integral part of these financial statements.
105
Statements of Changes in Net Assets
Nationwide HighMark Large Cap Core Equity Fund | ||||||||||||
| Six Months Ended January 31, 2014 (Unaudited) | Year Ended | |||||||||||
Operations: | ||||||||||||
Net investment income | $ | 273,078 | $ | 852,788 | ||||||||
Net realized gains from investment and futures transactions | 2,901,926 | 10,629,141 | ||||||||||
Net change in unrealized appreciation/(depreciation) from investments and futures contracts | (53,386 | ) | 4,812,139 | |||||||||
|
|
|
| |||||||||
Change in net assets resulting from operations | 3,121,618 | 16,294,068 | ||||||||||
|
|
|
| |||||||||
Distributions to Shareholders From: | ||||||||||||
Net investment income: | ||||||||||||
Class A | (1,462 | ) | (52,788 | ) | ||||||||
Class C | – | (3,112 | ) | |||||||||
Institutional Service Class (a) | (16,382 | ) | (779,460 | ) | ||||||||
Institutional Class | (5 | )(b) | – | |||||||||
|
|
|
| |||||||||
Change in net assets from shareholder distributions | (17,849 | ) | (835,360 | ) | ||||||||
|
|
|
| |||||||||
Change in net assets from capital transactions | (5,334,386 | ) | (18,016,074 | ) | ||||||||
|
|
|
| |||||||||
Change in net assets | (2,230,617 | ) | (2,557,366 | ) | ||||||||
|
|
|
| |||||||||
Net Assets: | ||||||||||||
Beginning of period | 60,787,111 | 63,344,477 | ||||||||||
|
|
|
| |||||||||
End of period | $ | 58,556,494 | $ | 60,787,111 | ||||||||
|
|
|
| |||||||||
Accumulated undistributed net investment income at end of period | $ | 272,657 | $ | 17,428 | ||||||||
|
|
|
| |||||||||
CAPITAL TRANSACTIONS: | ||||||||||||
Class A Shares | ||||||||||||
Proceeds from shares issued | $ | 859,252 | $ | 6,029,593 | ||||||||
Dividends reinvested | 1,441 | 51,016 | ||||||||||
Cost of shares redeemed | (792,181 | ) | (1,153,545 | ) | ||||||||
|
|
|
| |||||||||
Total Class A Shares | 68,512 | 4,927,064 | ||||||||||
|
|
|
| |||||||||
Class C Shares | ||||||||||||
Proceeds from shares issued | 63,966 | 175,860 | ||||||||||
Dividends reinvested | – | 1,826 | ||||||||||
Cost of shares redeemed | (154,979 | ) | (136,248 | ) | ||||||||
|
|
|
| |||||||||
Total Class C Shares | (91,013 | ) | 41,438 | |||||||||
|
|
|
| |||||||||
Institutional Service Class Shares (a) | ||||||||||||
Proceeds from shares issued | 472,846 | 9,027,736 | ||||||||||
Dividends reinvested | 1,014 | 271,828 | ||||||||||
Cost of shares redeemed | (5,795,750 | ) | (32,284,140 | ) | ||||||||
|
|
|
| |||||||||
Total Institutional Service Class Shares | (5,321,890 | ) | (22,984,576 | ) | ||||||||
|
|
|
| |||||||||
| (a) | Effective September 16, 2013, Fiduciary Shares were renamed Institutional Service Class Shares. |
| (b) | For the period from September 19, 2013 (commencement of operations) through January 31, 2014. |
106
Statements of Changes in Net Assets (Continued)
Nationwide HighMark Large Cap Core Equity Fund | ||||||||||||
| Six Months Ended January 31, 2014 (Unaudited) | Year Ended | |||||||||||
CAPITAL TRANSACTIONS: (continued) | ||||||||||||
Institutional Class Shares | ||||||||||||
Proceeds from shares issued | $ | 10,000 | (b) | $ | – | |||||||
Dividends reinvested | 5 | (b) | – | |||||||||
Cost of shares redeemed | – | (b) | – | |||||||||
|
|
|
| |||||||||
Total Institutional Class Shares | 10,005 | (b) | – | |||||||||
|
|
|
| |||||||||
Change in net assets from capital transactions | $ | (5,334,386 | ) | $ | (18,016,074 | ) | ||||||
|
|
|
| |||||||||
SHARE TRANSACTIONS: | ||||||||||||
Class A Shares | ||||||||||||
Issued | 72,090 | 577,813 | ||||||||||
Reinvested | 120 | 4,869 | ||||||||||
Redeemed | (66,780 | ) | (111,058 | ) | ||||||||
|
|
|
| |||||||||
Total Class A Shares | 5,430 | 471,624 | ||||||||||
|
|
|
| |||||||||
Class C Shares | ||||||||||||
Issued | 5,827 | 17,857 | ||||||||||
Reinvested | – | 182 | ||||||||||
Redeemed | (13,616 | ) | (14,178 | ) | ||||||||
|
|
|
| |||||||||
Total Class C Shares | (7,789 | ) | 3,861 | |||||||||
|
|
|
| |||||||||
Institutional Service Class Shares (a) | ||||||||||||
Issued | 39,701 | 927,552 | ||||||||||
Reinvested | 84 | 26,611 | ||||||||||
Redeemed | (499,226 | ) | (3,014,582 | ) | ||||||||
|
|
|
| |||||||||
Total Institutional Service Class Shares | (459,441 | ) | (2,060,419 | ) | ||||||||
|
|
|
| |||||||||
Institutional Class Shares | ||||||||||||
Issued | 853 | (b) | – | |||||||||
Reinvested | – | (b) | – | |||||||||
Redeemed | – | (b) | – | |||||||||
|
|
|
| |||||||||
Total Institutional Class Shares | 853 | (b) | – | |||||||||
|
|
|
| |||||||||
Total change in shares | (460,947 | ) | (1,584,934 | ) | ||||||||
|
|
|
| |||||||||
Amounts designated as “–” are zero or have been rounded to zero.
| (a) | Effective September 16, 2013, Fiduciary Shares were renamed Institutional Service Class Shares. |
| (b) | For the period from September 19, 2013 (commencement of operations) through January 31, 2014. |
The accompanying notes are an integral part of these financial statements.
107
Financial Highlights
Selected data for each share of capital outstanding throughout the periods indicated
Nationwide HighMark Large Cap Core Equity Fund
| Operations | Distributions | Ratios/Supplemental Data | ||||||||||||||||||||||||||||||||||||||||||||||||||
| Net Asset Value, Beginning of Period | Net Investment Income | Net Realized and Unrealized Gains (Losses) from Investments | Total from Operations | Net Investment Income | Total Distributions | Net Asset Value, End of Period | Total Return (a)(b) | Net Assets at End of Period | Ratio of Expenses to Average Net Assets (c) | Ratio of Net Investment Income to Average Net Assets (c) | Ratio of Expenses (Prior to Reimbursements) to Average Net Assets (c)(d) | Portfolio Turnover (e) | ||||||||||||||||||||||||||||||||||||||||
| Class A Shares | ||||||||||||||||||||||||||||||||||||||||||||||||||||
Six Months Ended January 31, 2014 (f) (Unaudited) | $ | 11.43 | 0.04 | 0.58 | 0.62 | – | – | $ | 12.05 | 5.44% | $ | 10,394,584 | 1.22% | 0.70% | 1.40% | 18.50% | ||||||||||||||||||||||||||||||||||||
Year Ended July 31, 2013 (f) | $ | 9.17 | 0.10 | 2.25 | 2.35 | (0.09 | ) | (0.09 | ) | $ | 11.43 | 25.80% | $ | 9,799,235 | 1.22% | 0.96% | 1.45% | 63.00% | ||||||||||||||||||||||||||||||||||
Year Ended July 31, 2012 (f) | $ | 8.47 | 0.06 | 0.71 | 0.77 | (0.07 | ) | (0.07 | ) | $ | 9.17 | 9.12% | $ | 3,537,695 | 1.23% | 0.72% | 1.53% | 78.00% | (g) | |||||||||||||||||||||||||||||||||
Year Ended July 31, 2011 (f) | $ | 7.23 | 0.07 | 1.24 | 1.31 | (0.07 | ) | (0.07 | ) | $ | 8.47 | 18.15% | $ | 3,027,452 | 1.25% | 0.79% | 1.48% | 68.00% | ||||||||||||||||||||||||||||||||||
Year Ended July 31, 2010 (f) | $ | 6.38 | 0.06 | 0.85 | 0.91 | (0.06 | ) | (0.06 | ) | $ | 7.23 | 14.27% | $ | 2,640,213 | 1.23% | 0.85% | 1.47% | 93.00% | ||||||||||||||||||||||||||||||||||
Year Ended July 31, 2009 (f) | $ | 8.10 | 0.10 | (1.72 | ) | (1.62 | ) | (0.10 | ) | (0.10 | ) | $ | 6.38 | (19.83% | ) | $ | 2,003,580 | 1.20% | 1.72% | 1.44% | 42.00% | |||||||||||||||||||||||||||||||
| Class C Shares | ||||||||||||||||||||||||||||||||||||||||||||||||||||
Six Months Ended January 31, 2014 (f) (Unaudited) | $ | 11.11 | 0.01 | 0.56 | 0.57 | – | – | $ | 11.68 | 5.13% | $ | 955,873 | 1.82% | 0.12% | 1.97% | 18.50% | ||||||||||||||||||||||||||||||||||||
Year Ended July 31, 2013 (f) | $ | 8.92 | 0.04 | 2.19 | 2.23 | (0.04 | ) | (0.04 | ) | $ | 11.11 | 25.01% | $ | 995,957 | 1.82% | 0.36% | 1.95% | 63.00% | ||||||||||||||||||||||||||||||||||
Year Ended July 31, 2012 (f) | $ | 8.24 | 0.01 | 0.69 | 0.70 | (0.02 | ) | (0.02 | ) | $ | 8.92 | 8.47% | $ | 765,173 | 1.83% | 0.12% | 2.03% | 78.00% | (g) | |||||||||||||||||||||||||||||||||
Year Ended July 31, 2011 (f) | $ | 7.03 | 0.02 | 1.21 | 1.23 | (0.02 | ) | (0.02 | ) | $ | 8.24 | 17.48% | $ | 639,507 | 1.85% | 0.19% | 1.98% | 68.00% | ||||||||||||||||||||||||||||||||||
Year Ended July 31, 2010 (f) | $ | 6.21 | 0.02 | 0.82 | 0.84 | (0.02 | ) | (0.02 | ) | $ | 7.03 | 13.50% | $ | 440,991 | 1.83% | 0.25% | 1.97% | 93.00% | ||||||||||||||||||||||||||||||||||
Year Ended July 31, 2009 (f) | $ | 7.92 | 0.07 | (1.70 | ) | (1.63 | ) | (0.08 | ) | (0.08 | ) | $ | 6.21 | (20.52% | ) | $ | 445,742 | 1.80% | 1.12% | 1.94% | 42.00% | |||||||||||||||||||||||||||||||
| Institutional Service Class Shares (h) | ||||||||||||||||||||||||||||||||||||||||||||||||||||
Six Months Ended January 31, 2014 (f) (Unaudited) | $ | 11.46 | 0.06 | 0.57 | 0.63 | – | – | $ | 12.09 | 5.53% | $ | 47,195,726 | 0.97% | 0.97% | 1.15% | 18.50% | ||||||||||||||||||||||||||||||||||||
Year Ended July 31, 2013 (f) | $ | 9.19 | 0.13 | 2.26 | 2.39 | (0.12 | ) | (0.12 | ) | $ | 11.46 | 26.21% | $ | 49,991,919 | 0.93% | 1.25% | 1.20% | 63.00% | ||||||||||||||||||||||||||||||||||
Year Ended July 31, 2012 (f) | $ | 8.49 | 0.09 | 0.70 | 0.79 | (0.09 | ) | (0.09 | ) | $ | 9.19 | 9.39% | $ | 59,041,609 | 0.93% | 1.02% | 1.28% | 78.00% | (g) | |||||||||||||||||||||||||||||||||
Year Ended July 31, 2011 (f) | $ | 7.24 | 0.09 | 1.25 | 1.34 | (0.09 | ) | (0.09 | ) | $ | 8.49 | 18.63% | $ | 53,369,484 | 0.96% | 1.09% | 1.23% | 68.00% | ||||||||||||||||||||||||||||||||||
Year Ended July 31, 2010 (f) | $ | 6.39 | 0.08 | 0.85 | 0.93 | (0.08 | ) | (0.08 | ) | $ | 7.24 | 14.56% | $ | 55,593,087 | 0.95% | 1.13% | 1.22% | 93.00% | ||||||||||||||||||||||||||||||||||
Year Ended July 31, 2009 (f) | $ | 8.12 | 0.12 | (1.73 | ) | (1.61 | ) | (0.12 | ) | (0.12 | ) | $ | 6.39 | (19.59% | ) | $ | 60,454,131 | 0.92% | 2.00% | 1.19% | 42.00% | |||||||||||||||||||||||||||||||
| Institutional Class Shares | ||||||||||||||||||||||||||||||||||||||||||||||||||||
Period Ended January 31, 2014 (f)(i) (Unaudited) | $ | 11.73 | 0.04 | 0.33 | 0.37 | (0.01 | ) | (0.01 | ) | $ | 12.09 | 3.12% | $ | 10,311 | 0.82% | 0.93% | 0.96% | 18.50% | ||||||||||||||||||||||||||||||||||
Amounts designated as “–” are zero or have been rounded to zero.
| (a) | Excludes sales charge. |
| (b) | Not annualized for periods less than one year. |
| (c) | Annualized for periods less than one year. |
| (d) | During the period, certain fees may have been waived and/or reimbursed. If such waivers/reimbursements had not occurred, the ratios would have been as indicated. |
| (e) | Portfolio turnover is calculated on the basis of the Fund as a whole without distinguishing among the classes of shares. |
| (f) | Per share calculations were performed using average shares method. |
| (g) | Excludes merger activity. |
| (h) | Effective September 16, 2013, Fiduciary Shares were renamed Institutional Service Class Shares. |
| (i) | For the period from September 19, 2013 (commencement of operations) through January 31, 2014. Total return is calculated based on inception date of September 18, 2013 through January 31, 2014. |
The accompanying notes are an integral part of these financial statements.
108
| Fund Commentary | Nationwide HighMark Large Cap Growth Fund |
For the semiannual period ended January 31, 2014, the Nationwide HighMark Large Cap Growth Fund (Institutional Service Class) returned 4.86%* versus 10.15 % for its benchmark, the Russell 1000® Growth Index. For broader comparison, the median return for the Fund’s closest Lipper peer category of Large-Cap Growth Funds (consisting of 745 funds as of January 31, 2014) was 11.68% for the same time period.
*Performance prior to the Fund’s inception on September 16, 2013, is based on the performance of the Fund’s predecessor fund.
Market Environment
The six months of the reporting period were characterized by the odd juxtaposition of stronger economic data and increased confidence in a continuation of the Federal Reserve’s accommodative monetary policy. This combination led to a strong market rally in the latter half of 2013 with a definite “risk on” flavor. The markets pulled back in January 2014 when trouble with emerging markets began to appear.
The rally began with the Fed’s “surprise” decision in September 2013 not to taper (gradually reduce) its bond purchases. Strong employment data and better-than-expected gross domestic product (GDP) growth added fuel to the fire and kept the rally going. By the end of 2013, sentiment was so positive that the Fed was able to announce a modest tapering without derailing the market. The January 2014 market pullback resulted from worries about emerging markets being affected by decreased stimulus from the Fed.
Portfolio Performance
The Fund’s performance was negatively affected during the reporting period by the Fund’s underweight in the information technology sector as well as overweights in both the materials and utilities sectors. Other detractors from Fund performance during the reporting period included overweights in trading companies and distributors, specialty retail and REIT industries. These active weights were the result of identifying compelling investments in these
industries rather than overall industry bets based on top-down factors.
The Fund benefited from being overweight in the industrials sector, which outperformed the benchmark during the reporting period. Another benefit came from the Fund’s underweights in the energy and telecommunications sectors, which both underperformed the benchmark for the reporting period. As with the industrials sector, the underweights were a function of bottom-up stock selection rather than a specific bet on the overall sector based on macroeconomic or other top-down factors.
Outlook and Positioning
The Fund’s over/underweights at the sector level are largely the result of bottom-up stock selection subject to risk management guidelines. Such is the case for overweights in the materials, industrials and utilities sectors as well as underweights in the consumer discretionary, information technology and telecommunication sectors. Secular concerns about the attractiveness of the telecommunication space have generally made us more cautious in this area. These secular concerns include intense competition, commodity products and aggressive capital investment.
During the past several years, high-quality growth companies have traded at a persistent discount to lower-quality, high-octane growth stocks. This trend came to a head in 2013 as the performance spread between such styles was near 10%. Every time the gap threatens to close, the Fed engages in a fresh round of stimulus of some kind, refueling low-quality firms for another run. With quantitative easing (QE) beginning to abate and interest rates with nowhere to go but up, we expect that this discount will close with more persistence than we have seen for some time, and growth companies with stable earnings and the ability to self-finance may lead the market. The Fund entered into financial futures contracts (“futures contracts”) to enable the Fund to more closely approximate indices or for tactical hedging purposes.
109
| Fund Commentary (con’t.) | Nationwide HighMark Large Cap Growth Fund |
Subadviser:
HighMark Capital Management, Inc.
Portfolio Managers:
Derek Izuel; George Rokas; and Kenneth Wemer
The Fund is subject to the risks of investing in equity securities. Growth funds may underperform other funds that use different investing styles. The Fund may invest in more-aggressive investments such as foreign securities (which are volatile, harder to price and less liquid than U.S. securities). Please refer to the summary prospectus for a more detailed explanation of the Fund’s principal risks.
A description of the benchmarks can be found on the Market Index Definitions page at the back of this book.
110
| Fund Overview (Unaudited) | Nationwide HighMark Large Cap Growth Fund |
Objective
The Fund seeks long-term capital appreciation through investments in U.S. equity securities; current income is incidental.
Highlights
| Ÿ | For the semiannual period ended January 31, 2014, the Fund (Institutional Service Class) returned 4.86%, underperforming the benchmark by 5.29% and the Lipper peer category by 6.82%. |
| Ÿ | The Fund’s performance was negatively affected during the reporting period by the Fund’s underweight in the information technology sector as well as overweights in both the materials and utilities sectors. |
| Ÿ | The Fund benefited from being overweight in the industrials sector, which outperformed the benchmark during the reporting period. |
Asset Allocation†
| Common Stocks | 98.8% | |||
| Mutual Fund | 0.8% | |||
| Other assets in excess of liabilities | 0.4% | |||
| 100.0% |
Top Industries††
| Chemicals | 9.3% | |||
| Pharmaceuticals | 6.1% | |||
| Specialty Retail | 5.8% | |||
| Software | 5.3% | |||
| Computers & Peripherals | 5.3% | |||
| Semiconductors & Semiconductor Equipment | 4.6% | |||
| Internet Software & Services | 4.0% | |||
| Industrial Conglomerates | 3.9% | |||
| Hotels, Restaurants & Leisure | 3.8% | |||
| Road & Rail | 3.7% | |||
| Other Industries | 48.2% | |||
| 100.0% |
Top Holdings††
| Ecolab, Inc. | 4.7% | |||
| Google, Inc., Class A | 4.0% | |||
| Danaher Corp. | 3.9% | |||
| Microsoft Corp. | 3.6% | |||
| Praxair, Inc. | 3.4% | |||
| Apple, Inc. | 3.1% | |||
| Analog Devices, Inc. | 3.1% | |||
| QUALCOMM, Inc. | 3.1% | |||
| American Tower Corp. | 3.0% | |||
| Stericycle, Inc. | 3.0% | |||
| Other Holdings | 65.1% | |||
| 100.0% |
| † | Percentages indicated are based upon net assets as of January 31, 2014. |
| †† | Percentages indicated are based upon total investments as of January 31, 2014. |
111
| Fund Performance | Nationwide HighMark Large Cap Growth Fund |
Average Annual Total Return
(For periods ended January 31, 2014)
| Six Months* | 1 Yr. | 5 Yr. | 10 Yr. | |||||||||||||||
| Class A | w/o SC1 | 4.73% | 13.36% | 16.48% | 5.46% | |||||||||||||
| w/SC2 | -1.00% | 7.11% | 15.19% | 4.87% | ||||||||||||||
| Class C | w/o SC1 | 4.48% | 12.66% | 15.80% | 4.82% | |||||||||||||
| w/SC3 | 3.38% | 11.66% | 15.80% | 4.82% | ||||||||||||||
| Institutional Service Class4,5 | w/o SC | 4.86% | 13.62% | 16.82% | 5.73% | |||||||||||||
| Institutional Class4 | w/o SC | 1.48% | 6 | — | — | — | ||||||||||||
All figures showing the effect of a sales charge (SC) reflect the maximum charge possible, because it has the most significant effect on performance data.
| * | Not annualized. |
| 1 | These returns do not reflect the effects of SCs. |
| 2 | For the period from September 16, 2013 through January 31, 2014 a front-end sales charge of 5.75% was deducted. Prior to September 16, 2013, a front-end sales charge of 5.50% was deducted. |
| 3 | A 1.00% CDSC was deducted from the one year return because it is charged when you sell Class C shares within the first year after purchase. |
| 4 | Not subject to any SCs. |
| 5 | Effective September 16, 2013 Fiduciary Shares were renamed Institutional Service Class Shares. |
| 6 | Since inception date of September 18, 2013. Not Annualized. |
Expense Ratios
| Gross Expense Ratio* | Net Expense Ratio* | |||||
| Class A | 1.46% | 1.27% | ||||
| Class C | 1.96% | 1.87% | ||||
| Institutional Service Class | 1.21% | 1.02% | ||||
| Institutional Class | 0.96% | 0.87% | ||||
| * | Current effective prospectus dated September 16, 2013. The difference between gross and net operating expenses reflects contractual waivers in place through November 30, 2015. Please see the Fund’s most recent prospectus for details. |
112
| Fund Performance | Nationwide HighMark Large Cap Growth Fund |
Performance of a $10,000 Investment
Investment return and principal value will fluctuate, and when redeemed, shares may be worth more or less than original cost. Past performance is no guarantee of future results and does not reflect the deduction of taxes that a shareholder would pay on fund distributions or the redemption of fund shares. Investing in mutual funds involves market risk, including loss of principal. Performance returns assume the reinvestment of all distributions.
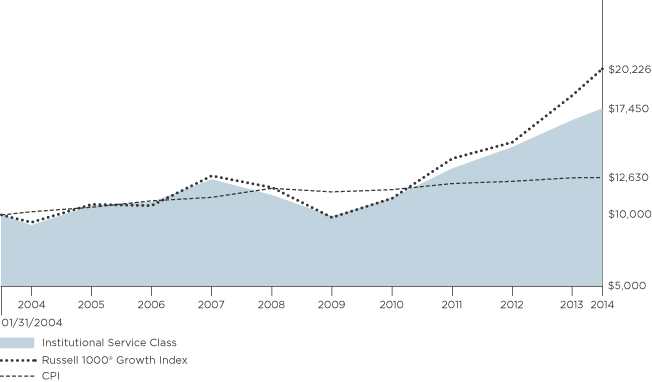
Comparative performance of $10,000 invested in Institutional Service Class shares of the Nationwide HighMark Large Cap Growth Fund versus the Russell 1000® Growth Index and the Consumer Price Index (CPI) over the 10-year period ended 1/31/14. Fund performance prior to the Fund’s inception on 9/16/13 is based on the Fund’s predecessor Fund. Unlike the Fund, the performance for these unmanaged indexes does not reflect any fees, expenses, or sales charges. One cannot invest directly in a market index. A description of the benchmarks can be found on the Market Index Definitions page at the back of this book.
113
| Shareholder Expense Example | Nationwide HighMark Large Cap Growth Fund |
As a shareholder of the Fund, you incur two types of costs: (1) transaction costs, including sales charges (loads) paid on purchase payments and redemption fees; and (2) ongoing costs, including investment advisory fees, administration fees, distribution fees and other Fund expenses. The examples below are intended to help you understand your ongoing costs (in dollars) of investing in the Fund and to compare these costs with the ongoing costs of investing in other mutual funds. Per Securities and Exchange Commission (“SEC”) requirements, the examples assume that you had a $1,000 investment in the Class at the beginning of the reporting period (August 1, 2013) and continued to hold your shares at the end of the reporting period (January 31, 2014).
Actual Expenses
For each Class of the Fund in the table below, the first line provides information about actual account values and actual expenses. You may use the information in this line, together with the amount you invested, to estimate the expenses that you paid from August 1, 2013 through January 31, 2014. Simply divide your account value by $1,000 (for example, an $8,600 account value divided by $1,000 = 8.6), then multiply the result by the number in the first line of each Class under the heading entitled “Expenses Paid During Period” to estimate the expenses you paid on your account during this period.
Hypothetical Expenses for Comparison Purposes
The second line of each Class in the table below provides information about hypothetical account values and hypothetical expenses based on the Class’ actual expense ratio and an assumed rate of return of 5% per year before expenses, which is not the Class’ actual return. The hypothetical account values and expenses may not be used to estimate the actual ending account balance or expenses you paid for the period from August 1, 2013 through January 31, 2014. You may use this information to compare the ongoing costs of investing in the Class of the Fund and other funds. To do so, compare this 5% hypothetical example with the 5% hypothetical examples that appear in the shareholder reports of the other funds.
Please note that the expenses shown in the table are meant to highlight your ongoing costs only and do not reflect any transaction costs, such as sales charges (loads) or redemption fees. If these transaction costs were included, your costs would have been higher. Therefore, the second line for each Class in the table is useful in comparing ongoing costs only, and will not help you determine the relative total costs of owning different funds. The examples also assume all dividends and distributions are reinvested.
Schedule of Shareholder Expenses
Expense Analysis of a $1,000 Investment
Nationwide HighMark Large Cap January 31, 2014 | Beginning Account Value ($) | Ending Account Value ($) 01/31/14 | Expenses Paid During Period ($) 08/01/13 - 01/31/14 | Expense Ratio During Period (%) 08/01/13 - 01/31/14 | ||||||||
| Class A Shares | Actual | a | 1,000.00 | 1,047.30 | 6.55 | 1.27 | ||||||
| Hypothetical | a,b | 1,000.00 | 1,018.80 | 6.46 | 1.27 | |||||||
| Class C Shares | Actual | a | 1,000.00 | 1,044.80 | 9.64 | 1.87 | ||||||
| Hypothetical | a,b | 1,000.00 | 1,015.78 | 9.50 | 1.87 | |||||||
| Institutional Service Class Sharesc | Actual | a | 1,000.00 | 1,048.60 | 5.27 | 1.02 | ||||||
| Hypothetical | a,b | 1,000.00 | 1,020.06 | 5.19 | 1.02 | |||||||
| Institutional Class Shares | Actual | d | 1,000.00 | 1,014.80 | 3.24 | 0.87 | ||||||
| Hypothetical | a,b | 1,000.00 | 1,020.82 | 4.43 | 0.87 | |||||||
| a | Expenses are equal to the Fund’s annualized expense ratio multiplied by the average account value from August 1, 2013 through January 31, 2014 multiplied to reflect one-half year period. The expense ratio presented represents a six-month, annualized ratio in accordance with Securities and Exchange Commission guidelines. |
| b | Represents the hypothetical 5% return before expenses. |
| c | Effective September 16, 2013, Fiduciary Shares were renamed Institutional Service Class Shares. |
| d | Actual expenses are equal to the Fund’s annualized expense ratio multiplied by the average account value from September 19, 2013 through January 31, 2014 to reflect the period from commencement of operations. |
114
Statement of Investments
January 31, 2014 (Unaudited)
Nationwide HighMark Large Cap Growth Fund
| Common Stocks 98.8% | ||||||||||
| Shares | Market Value | |||||||||
| ||||||||||
Aerospace & Defense 2.8% |
| |||||||||
Boeing Co. (The) | 9,123 | $ | 1,142,747 | |||||||
Honeywell International, Inc. | 8,544 | 779,469 | ||||||||
|
| |||||||||
| 1,922,216 | ||||||||||
|
| |||||||||
| ||||||||||
Air Freight & Logistics 1.1% | ||||||||||
United Parcel Service, Inc., Class B | 7,743 | 737,366 | ||||||||
|
| |||||||||
| ||||||||||
Beverages 1.3% | ||||||||||
Anheuser-Busch InBev NV, ADR-BE | 9,049 | 867,709 | ||||||||
|
| |||||||||
| ||||||||||
Biotechnology 3.4% | ||||||||||
Amgen, Inc. | 6,749 | 802,794 | ||||||||
Gilead Sciences, Inc.* | 12,216 | 985,220 | ||||||||
Vertex Pharmaceuticals, Inc.* | 6,403 | 506,093 | ||||||||
|
| |||||||||
| 2,294,107 | ||||||||||
|
| |||||||||
| ||||||||||
Capital Markets 1.2% | ||||||||||
Charles Schwab Corp. (The) | 32,657 | 810,547 | ||||||||
|
| |||||||||
| ||||||||||
Chemicals 9.3% | ||||||||||
Ecolab, Inc. | 31,507 | 3,167,714 | ||||||||
Monsanto Co. | 7,653 | 815,427 | ||||||||
Praxair, Inc. | 18,615 | 2,321,663 | ||||||||
|
| |||||||||
| 6,304,804 | ||||||||||
|
| |||||||||
| ||||||||||
Commercial Services & Supplies 3.0% | ||||||||||
Stericycle, Inc.* | 17,123 | 2,004,418 | ||||||||
|
| |||||||||
| ||||||||||
Communications Equipment 3.0% | ||||||||||
QUALCOMM, Inc. | 27,806 | 2,063,761 | ||||||||
|
| |||||||||
| ||||||||||
Computers & Peripherals 5.3% | ||||||||||
Apple, Inc. | 4,161 | 2,082,997 | ||||||||
EMC Corp. | 61,505 | 1,490,881 | ||||||||
|
| |||||||||
| 3,573,878 | ||||||||||
|
| |||||||||
| ||||||||||
Diversified Financial Services 0.5% | ||||||||||
Citigroup, Inc. | 7,803 | 370,096 | ||||||||
|
| |||||||||
| ||||||||||
Electric Utilities 1.3% | ||||||||||
ITC Holdings Corp. | 8,776 | 908,316 | ||||||||
|
| |||||||||
| ||||||||||
Electronic Equipment, Instruments & Components 2.0% |
| |||||||||
FEI Co. | 14,542 | 1,362,876 | ||||||||
|
| |||||||||
| ||||||||||
Energy Equipment & Services 1.4% | ||||||||||
Halliburton Co. | 19,569 | 959,077 | ||||||||
|
| |||||||||
| ||||||||||
Food & Staples Retailing 3.6% | ||||||||||
Costco Wholesale Corp. | 9,265 | 1,041,016 | ||||||||
Walgreen Co. | 24,052 | 1,379,382 | ||||||||
|
| |||||||||
| 2,420,398 | ||||||||||
|
| |||||||||
| Common Stocks (continued) | ||||||||||
| Shares | Market Value | |||||||||
| ||||||||||
Food Products 1.1% | ||||||||||
Mondelez International, Inc., Class A | 22,819 | $ | 747,322 | |||||||
|
| |||||||||
| ||||||||||
Health Care Equipment & Supplies 1.8% |
| |||||||||
Covidien PLC | 17,447 | 1,190,583 | ||||||||
|
| |||||||||
| ||||||||||
Hotels, Restaurants & Leisure 3.7% | ||||||||||
Marriott International, Inc., Class A | 13,919 | 686,207 | ||||||||
Starbucks Corp. | 16,209 | 1,152,784 | ||||||||
Yum! Brands, Inc. | 10,349 | 694,935 | ||||||||
|
| |||||||||
| 2,533,926 | ||||||||||
|
| |||||||||
| ||||||||||
Industrial Conglomerates 3.9% | ||||||||||
Danaher Corp. | 35,204 | 2,618,825 | ||||||||
|
| |||||||||
| ||||||||||
Information Technology Services 2.4% |
| |||||||||
Accenture PLC, Class A | 20,162 | 1,610,540 | ||||||||
Visa, Inc., Class A | 100 | 21,543 | ||||||||
|
| |||||||||
| 1,632,083 | ||||||||||
|
| |||||||||
| ||||||||||
Internet & Catalog Retail 1.7% | ||||||||||
priceline.com, Inc.* | 711 | 814,017 | ||||||||
TripAdvisor, Inc.* | 4,404 | 339,944 | ||||||||
|
| |||||||||
| 1,153,961 | ||||||||||
|
| |||||||||
| ||||||||||
Internet Software & Services 4.0% | ||||||||||
Google, Inc., Class A* | 2,295 | 2,710,326 | ||||||||
|
| |||||||||
| ||||||||||
Life Sciences Tools & Services 1.9% | ||||||||||
Agilent Technologies, Inc. | 15,882 | 923,538 | ||||||||
Bruker Corp.* | 19,419 | 395,177 | ||||||||
|
| |||||||||
| 1,318,715 | ||||||||||
|
| |||||||||
| ||||||||||
Machinery 1.5% | ||||||||||
Pall Corp. | 12,780 | 1,023,678 | ||||||||
|
| |||||||||
| ||||||||||
Media 1.5% | ||||||||||
Discovery Communications, Inc., Class A* | 12,636 | 1,008,100 | ||||||||
|
| |||||||||
| ||||||||||
Multiline Retail 1.5% | ||||||||||
Dollar Tree, Inc.* | 20,575 | 1,039,449 | ||||||||
|
| |||||||||
| ||||||||||
Oil, Gas & Consumable Fuels 2.1% | ||||||||||
Anadarko Petroleum Corp. | 8,116 | 654,880 | ||||||||
EOG Resources, Inc. | 4,795 | 792,326 | ||||||||
|
| |||||||||
| 1,447,206 | ||||||||||
|
| |||||||||
| ||||||||||
Pharmaceuticals 6.1% | ||||||||||
Allergan, Inc. | 8,977 | 1,028,764 | ||||||||
Johnson & Johnson | 20,586 | 1,821,243 | ||||||||
Novartis AG, ADR-CH | 15,923 | 1,259,032 | ||||||||
|
| |||||||||
| 4,109,039 | ||||||||||
|
| |||||||||
| ||||||||||
Real Estate Investment Trusts (REITs) 3.0% |
| |||||||||
American Tower Corp. | 24,795 | 2,005,420 | ||||||||
|
| |||||||||
115
Statement of Investments (Continued)
January 31, 2014 (Unaudited)
Nationwide HighMark Large Cap Growth Fund (Continued)
| Common Stocks (continued) | ||||||||||
| Shares | Market Value | |||||||||
| ||||||||||
Road & Rail 3.6% |
| |||||||||
J.B. Hunt Transport Services, Inc. | 22,607 | $ | 1,696,655 | |||||||
Kansas City Southern | 7,372 | 778,410 | ||||||||
|
| |||||||||
| 2,475,065 | ||||||||||
|
| |||||||||
| ||||||||||
Semiconductors & Semiconductor Equipment 4.6% |
| |||||||||
Analog Devices, Inc. | 42,945 | 2,072,955 | ||||||||
Linear Technology Corp. | 23,516 | 1,047,403 | ||||||||
|
| |||||||||
| 3,120,358 | ||||||||||
|
| |||||||||
| ||||||||||
Software 5.3% |
| |||||||||
ANSYS, Inc.* | 14,440 | 1,133,973 | ||||||||
Microsoft Corp. | 64,516 | 2,441,931 | ||||||||
|
| |||||||||
| 3,575,904 | ||||||||||
|
| |||||||||
| ||||||||||
Specialty Retail 5.8% | ||||||||||
Dick’s Sporting Goods, Inc. | 12,847 | 674,467 | ||||||||
Home Depot, Inc. (The) | 13,316 | 1,023,335 | ||||||||
Ross Stores, Inc. | 7,048 | 478,630 | ||||||||
Sally Beauty Holdings, Inc.* | 29,850 | 847,143 | ||||||||
TJX Cos., Inc. | 15,494 | 888,736 | ||||||||
|
| |||||||||
| 3,912,311 | ||||||||||
|
| |||||||||
| ||||||||||
Textiles, Apparel & Luxury Goods 1.7% |
| |||||||||
NIKE, Inc., Class B | 15,802 | 1,151,176 | ||||||||
|
| |||||||||
| ||||||||||
Trading Companies & Distributors 2.4% |
| |||||||||
W.W. Grainger, Inc. | 6,889 | 1,615,333 | ||||||||
|
| |||||||||
Total Common Stocks (cost $51,903,495) |
| 66,988,349 | ||||||||
|
| |||||||||
| Mutual Fund 0.8% | ||||||||||
Money Market Fund 0.8% | ||||||||||
Fidelity Institutional Money Market Fund — Institutional Class, 0.08% (a) | 566,030 | 566,030 | ||||||||
|
| |||||||||
Total Mutual Fund (cost $566,030) |
| 566,030 | ||||||||
|
| |||||||||
Total Investments | 67,554,379 | |||||||||
Other assets in excess of liabilities — 0.4% |
| 302,078 | ||||||||
|
| |||||||||
NET ASSETS — 100.0% |
| $ | 67,856,457 | |||||||
|
| |||||||||
| * | Denotes a non-income producing security. |
| (a) | Represents 7-day effective yield as of January 31, 2014. |
| (b) | See notes to financial statements for tax cost and unrealized appreciation/(depreciation) of securities. |
| ADR | American Depositary Receipt |
| AG | Stock Corporation |
| BE | Belgium |
| CH | Switzerland |
| NV | Public Traded Company |
| PLC | Public Limited Company |
| REIT | Real Estate Investment Trust |
The accompanying notes are an integral part of these financial statements.
116
Statement of Assets and Liabilities
January 31, 2014 (Unaudited)
Nationwide Large Cap Growth Fund | ||||||
Assets: | ||||||
Investments, at value (cost $52,469,525) | $ | 67,554,379 | ||||
Dividends receivable | 13,970 | |||||
Receivable for investments sold | 6,434,444 | |||||
Receivable for capital shares issued | 16,024 | |||||
Reclaims receivable | 14,826 | |||||
Prepaid expenses | 17,198 | |||||
|
| |||||
Total Assets | 74,050,841 | |||||
|
| |||||
Liabilities: | ||||||
Payable for investments purchased | 5,985,113 | |||||
Payable for capital shares redeemed | 101,706 | |||||
Accrued expenses and other payables: | ||||||
Investment advisory fees | 25,532 | |||||
Fund administration fees | 10,262 | |||||
Distribution fees | 5,991 | |||||
Administrative servicing fees | 30,766 | |||||
Accounting and transfer agent fees | 4,813 | |||||
Trustee fees | 1,014 | |||||
Deferred compensation (Note 2) | 5,346 | |||||
Custodian fees | 339 | |||||
Compliance program costs (Note 3) | 1,333 | |||||
Professional fees | 13,455 | |||||
Printing fees | 7,862 | |||||
Other | 852 | |||||
|
| |||||
Total Liabilities | 6,194,384 | |||||
|
| |||||
Net Assets | $ | 67,856,457 | ||||
|
| |||||
Represented by: | ||||||
Capital | $ | 47,302,155 | ||||
Accumulated undistributed net investment income | 99,352 | |||||
Accumulated net realized gains from investment transactions | 5,370,096 | |||||
Net unrealized appreciation/(depreciation) from investments | 15,084,854 | |||||
|
| |||||
Net Assets | $ | 67,856,457 | ||||
|
| |||||
Net Assets: | ||||||
Class A Shares | $ | 16,316,227 | ||||
Class C Shares | 2,713,512 | |||||
Institutional Service Class Shares | 48,816,547 | |||||
Institutional Class Shares | 10,171 | |||||
|
| |||||
Total | $ | 67,856,457 | ||||
|
| |||||
Shares Outstanding (unlimited number of shares authorized): | ||||||
Class A Shares | 1,256,822 | |||||
Class C Shares | 228,103 | |||||
Institutional Service Class Shares | 3,689,556 | |||||
Institutional Class Shares | 769 | |||||
|
| |||||
Total | 5,175,250 | |||||
|
| |||||
117
Statement of Assets and Liabilities (Continued)
January 31, 2014 (Unaudited)
Nationwide Large Cap Growth Fund | ||||||
Net asset value and redemption price per share (Net assets by class divided by shares outstanding by class, respectively): | ||||||
Class A Shares (a) | $ | 12.98 | ||||
Class C Shares (b) | $ | 11.90 | ||||
Institutional Service Class Shares | $ | 13.23 | ||||
Institutional Class Shares | $ | 13.23 | ||||
Maximum offering price per share (100%/(100%-maximum sales charge) of net asset value adjusted to the nearest cent): | ||||||
Class A Shares | $ | 13.77 | ||||
|
| |||||
Maximum Sales Charge: | ||||||
Class A Shares | 5.75 | % | ||||
|
| |||||
| (a) | For Class A Shares, the redemption price per share is reduced by 1.00% on sales of shares of original purchases of $1,000,000 or more or that were not subject to a front-end sales charge made with 18 months of the purchase date. |
| (b) | For Class C Shares, the redemption price per share is reduced by 1.00% for shares held less than 1 year. |
The accompanying notes are an integral part of these financial statements.
118
Statement of Operations
For the Six Months Ended January 31, 2014 (Unaudited)
| Nationwide HighMark Large Cap Growth Fund | ||||||
INVESTMENT INCOME: | ||||||
Dividend income | $ | 501,982 | ||||
Foreign tax withholding | (1,648 | ) | ||||
|
| |||||
Total Income | 500,334 | |||||
|
| |||||
EXPENSES: | ||||||
Investment advisory fees | 215,867 | |||||
Fund administration fees | 66,007 | |||||
Distribution fees Class A | 21,507 | |||||
Distribution fees Class B (a) | 405 | |||||
Distribution fees Class C | 14,269 | |||||
Administrative servicing fees Class A | 14,991 | |||||
Administrative servicing fees Class B (a) | 135 | |||||
Administrative servicing fees Institutional Service Class (b) | 45,399 | |||||
Registration and filing fees | 29,283 | |||||
Professional fees | 14,786 | |||||
Printing fees | 12,202 | |||||
Trustee fees | 1,364 | |||||
Custodian fees | 1,756 | |||||
Accounting and transfer agent fees | 13,396 | |||||
Compliance program costs (Note 3) | 1,720 | |||||
Other | 6,989 | |||||
|
| |||||
Total expenses before earnings credit, fees waived, and expenses reimbursed | 460,076 | |||||
|
| |||||
Earnings credit (Note 5) | (19 | ) | ||||
Administrative servicing fees voluntarily waived — Class A (Note 3) | (2,088 | ) | ||||
Administrative servicing fees voluntarily waived — Institutional Service Class (b) (Note 3) | (6,565 | ) | ||||
Expenses reimbursed by adviser (Note 3) | (50,433 | ) | ||||
|
| |||||
Net Expenses | 400,971 | |||||
|
| |||||
NET INVESTMENT INCOME | 99,363 | |||||
|
| |||||
REALIZED/UNREALIZED GAINS (LOSSES) FROM INVESTMENTS: | ||||||
Net realized gains from investment transactions | 5,402,618 | |||||
Net change in unrealized appreciation/(depreciation) from investments | (2,100,516 | ) | ||||
|
| |||||
Net realized/unrealized gains from investments | 3,302,102 | |||||
|
| |||||
CHANGE IN NET ASSETS RESULTING FROM OPERATIONS | $ | 3,401,465 | ||||
|
| |||||
| (a) | Effective September 16, 2013, Class B Shares were converted to Class A Shares. |
| (b) | Effective September 16, 2013, Fiduciary Shares were renamed Institutional Service Class Shares. |
The accompanying notes are an integral part of these financial statements.
119
Statements of Changes in Net Assets
Nationwide HighMark Large Cap Growth Fund | ||||||||||||
| Six Months Ended January 31, 2014 (Unaudited) | Year Ended July 31, 2013 | |||||||||||
Operations: | ||||||||||||
Net investment income | $ | 99,363 | $ | 569,850 | ||||||||
Net realized gains from investment transactions | 5,402,618 | 11,021,133 | ||||||||||
Net change in unrealized appreciation/(depreciation) from investments | (2,100,516 | ) | (2,517,102 | ) | ||||||||
|
|
|
| |||||||||
Change in net assets resulting from operations | 3,401,465 | 9,073,881 | ||||||||||
|
|
|
| |||||||||
Distributions to Shareholders From: | ||||||||||||
Net investment income: | ||||||||||||
Class A | (109,609 | ) | (23,724 | ) | ||||||||
Class B (a) | – | – | ||||||||||
Class C | (11,474 | ) | – | |||||||||
Institutional Service Class (b) | (391,864 | ) | (277,645 | ) | ||||||||
Institutional Class | (88 | )(c) | – | |||||||||
Net realized gains: | ||||||||||||
Class A | (178,380 | ) | – | |||||||||
Class B (a) | – | – | ||||||||||
Class C | (32,946 | ) | – | |||||||||
Institutional Service Class (b) | (525,075 | ) | – | |||||||||
Institutional Class | (106 | )(c) | – | |||||||||
|
|
|
| |||||||||
Change in net assets from shareholder distributions | (1,249,542 | ) | (301,369 | ) | ||||||||
|
|
|
| |||||||||
Change in net assets from capital transactions | (7,213,480 | ) | (8,939,605 | ) | ||||||||
|
|
|
| |||||||||
Change in net assets | (5,061,557 | ) | (167,093 | ) | ||||||||
|
|
|
| |||||||||
Net Assets: | ||||||||||||
Beginning of period | 72,918,014 | 73,085,107 | ||||||||||
|
|
|
| |||||||||
End of period | $ | 67,856,457 | $ | 72,918,014 | ||||||||
|
|
|
| |||||||||
Accumulated undistributed net investment income at end of period | $ | 99,352 | $ | 513,024 | ||||||||
|
|
|
| |||||||||
CAPITAL TRANSACTIONS: | ||||||||||||
Class A Shares | ||||||||||||
Proceeds from shares issued | $ | 663,086 | $ | 2,765,078 | ||||||||
Dividends reinvested | 264,721 | 21,570 | ||||||||||
Cost of shares redeemed | (1,981,470 | ) | (4,618,218 | ) | ||||||||
|
|
|
| |||||||||
Total Class A Shares | (1,053,663 | ) | (1,831,570 | ) | ||||||||
|
|
|
| |||||||||
Class B Shares (a) | ||||||||||||
Proceeds from shares issued | 1,880 | – | ||||||||||
Dividends reinvested | – | – | ||||||||||
Cost of shares redeemed | (454,453 | ) | (274,550 | ) | ||||||||
|
|
|
| |||||||||
Total Class B Shares | (452,573 | ) | (274,550 | ) | ||||||||
|
|
|
| |||||||||
| (a) | Effective September 16, 2013, Class B Shares were converted to Class A Shares. |
| (b) | Effective September 16, 2013, Fiduciary Shares were renamed Institutional Service Class Shares. |
| (c) | For the period from September 19, 2013 (commencement of operations) through January 31, 2014. |
120
Statements of Changes in Net Assets (Continued)
Nationwide HighMark Large Cap Growth Fund | ||||||||||||
| Six Months Ended January 31, 2014 (Unaudited) | Year Ended July 31, 2013 | |||||||||||
CAPITAL TRANSACTIONS: (continued) | ||||||||||||
Class C Shares | ||||||||||||
Proceeds from shares issued | $ | 104,107 | $ | 202,314 | ||||||||
Dividends reinvested | 38,213 | – | ||||||||||
Cost of shares redeemed | (296,978 | ) | (349,735 | ) | ||||||||
|
|
|
| |||||||||
Total Class C Shares | (154,658 | ) | (147,421 | ) | ||||||||
|
|
|
| |||||||||
Institutional Service Class Shares (b) | ||||||||||||
Proceeds from shares issued | 2,119,624 | 9,884,756 | ||||||||||
Dividends reinvested | 702,990 | 159,942 | ||||||||||
Cost of shares redeemed | (8,385,414 | ) | (16,730,762 | ) | ||||||||
|
|
|
| |||||||||
Total Institutional Service Class Shares | (5,562,800 | ) | (6,686,064 | ) | ||||||||
|
|
|
| |||||||||
Institutional Class Shares | ||||||||||||
Proceeds from shares issued | 10,020 | (c) | – | |||||||||
Dividends reinvested | 194 | (c) | – | |||||||||
Cost of shares redeemed | – | (c) | – | |||||||||
|
|
|
| |||||||||
Total Institutional Class Shares | 10,214 | (c) | – | |||||||||
|
|
|
| |||||||||
Change in net assets from capital transactions | $ | (7,213,480 | ) | $ | (8,939,605 | ) | ||||||
|
|
|
| |||||||||
SHARE TRANSACTIONS: | ||||||||||||
Class A Shares | ||||||||||||
Issued | 51,600 | 240,066 | ||||||||||
Reinvested | 20,332 | 1,916 | ||||||||||
Redeemed | (150,744 | ) | (395,886 | ) | ||||||||
|
|
|
| |||||||||
Total Class A Shares | (78,812 | ) | (153,904 | ) | ||||||||
|
|
|
| |||||||||
Class B Shares (a) | ||||||||||||
Issued | 153 | – | ||||||||||
Reinvested | – | – | ||||||||||
Redeemed | (38,482 | ) | (25,260 | ) | ||||||||
|
|
|
| |||||||||
Total Class B Shares | (38,329 | ) | (25,260 | ) | ||||||||
|
|
|
| |||||||||
Class C Shares | ||||||||||||
Issued | 8,791 | 19,005 | ||||||||||
Reinvested | 3,200 | – | ||||||||||
Redeemed | (24,775 | ) | (32,252 | ) | ||||||||
|
|
|
| |||||||||
Total Class C Shares | (12,784 | ) | (13,247 | ) | ||||||||
|
|
|
| |||||||||
Institutional Service Class Shares (b) | ||||||||||||
Issued | 158,903 | 831,934 | ||||||||||
Reinvested | 53,016 | 13,957 | ||||||||||
Redeemed | (635,709 | ) | (1,367,544 | ) | ||||||||
|
|
|
| |||||||||
Total Institutional Service Class Shares | (423,790 | ) | (521,653 | ) | ||||||||
|
|
|
| |||||||||
| (a) | Effective September 16, 2013, Class B Shares were converted to Class A Shares. |
| (b) | Effective September 16, 2013, Fiduciary Shares were renamed Institutional Service Class Shares. |
| (c) | For the period from September 19, 2013 (commencement of operations) through January 31, 2014. |
121
Statements of Changes in Net Assets (Continued)
Nationwide HighMark Large Cap Growth Fund | ||||||||||||
| Six Months Ended January 31, 2014 (Unaudited) | Year Ended July 31, 2013 | |||||||||||
SHARE TRANSACTIONS: (continued) | ||||||||||||
Institutional Class Shares | ||||||||||||
Issued | 754 | (c) | – | |||||||||
Reinvested | 15 | (c) | – | |||||||||
Redeemed | – | (c) | – | |||||||||
|
|
|
| |||||||||
Total Institutional Class Shares | 769 | (c) | – | |||||||||
|
|
|
| |||||||||
Total change in shares | (552,946 | ) | (714,064 | ) | ||||||||
|
|
|
| |||||||||
Amounts designated as “–” are zero or have been rounded to zero.
| (c) | For the period from September 19, 2013 (commencement of operations) through January 31, 2014. |
The accompanying notes are an integral part of these financial statements.
122
Financial Highlights
Selected data for each share of capital outstanding throughout the periods indicated
Nationwide HighMark Large Cap Growth Fund
| Operations | Distributions | Ratios/Supplemental Data | ||||||||||||||||||||||||||||||||||||||||||||||||||||||
| Net Asset Value, Beginning of Period | Net Investment Income (Loss) | Net Realized and Unrealized Gains (Losses) from Investments | Total from Operations | Net Investment Income | Net Realized Gains | Total Distributions | Net Asset Value, End of Period | Total Return (a)(b) | Net Assets at End of Period | Ratio of Expenses to Average Net Assets (c) | Ratio of Net Investment Income (Loss) to Average Net Assets (c) | Ratio of Expenses (Prior to Reimbursements) to Average Net Assets (c)(d) | Portfolio Turnover (e) | |||||||||||||||||||||||||||||||||||||||||||
| Class A Shares | ||||||||||||||||||||||||||||||||||||||||||||||||||||||||
Six Months Ended January 31, 2014 (f) (Unaudited) | $ | 12.61 | 0.01 | 0.59 | 0.60 | (0.09 | ) | (0.14 | ) | (0.23 | ) | $ | 12.98 | 4.73% | $ | 16,316,227 | 1.27% | 0.11% | 1.43% | 17.05% | ||||||||||||||||||||||||||||||||||||
Year Ended July 31, 2013 (f) | $ | 11.23 | 0.07 | 1.33 | 1.40 | (0.02 | ) | – | (0.02 | ) | $ | 12.61 | 12.45% | $ | 16,839,693 | 1.27% | 0.58% | 1.49% | 41.00% | |||||||||||||||||||||||||||||||||||||
Year Ended July 31, 2012 (f) | $ | 10.12 | 0.02 | 1.09 | 1.11 | – | – | – | $ | 11.23 | 10.97% | $ | 16,721,772 | 1.27% | 0.17% | 1.52% | 53.00% | |||||||||||||||||||||||||||||||||||||||
Year Ended July 31, 2011 (f) | $ | 8.64 | – | 1.57 | 1.57 | (0.09 | ) | – | (0.09 | ) | $ | 10.12 | 18.16% | $ | 16,620,770 | 1.27% | (0.05% | ) | 1.49% | 41.00% | ||||||||||||||||||||||||||||||||||||
Year Ended July 31, 2010 (f) | $ | 7.74 | 0.08 | 0.89 | 0.97 | (0.07 | ) | – | (0.07 | ) | $ | 8.64 | 12.48% | $ | 19,881,394 | 1.25% | 0.89% | 1.46% | 34.00% | |||||||||||||||||||||||||||||||||||||
Year Ended July 31, 2009 (f) | $ | 8.95 | 0.05 | (1.24 | )(g) | (1.19 | ) | (0.02 | ) | – | (0.02 | ) | $ | 7.74 | (13.21% | ) | $ | 17,543,311 | 1.21% | 0.72% | 1.42% | 60.00% | ||||||||||||||||||||||||||||||||||
| Class C Shares | ||||||||||||||||||||||||||||||||||||||||||||||||||||||||
Six Months Ended January 31, 2014 (f) (Unaudited) | $ | 11.57 | (0.03 | ) | 0.55 | 0.52 | (0.05 | ) | (0.14 | ) | (0.19 | ) | $ | 11.90 | 4.48% | $ | 2,713,512 | 1.87% | (0.48% | ) | 2.01% | 17.05% | ||||||||||||||||||||||||||||||||||
Year Ended July 31, 2013 (f) | $ | 10.35 | – | 1.22 | 1.22 | – | – | – | $ | 11.57 | 11.79% | $ | 2,787,128 | 1.87% | (0.02% | ) | 1.99% | 41.00% | ||||||||||||||||||||||||||||||||||||||
Year Ended July 31, 2012 (f) | $ | 9.38 | (0.04 | ) | 1.01 | 0.97 | – | – | – | $ | 10.35 | 10.34% | $ | 2,629,339 | 1.87% | (0.43% | ) | 2.02% | 53.00% | |||||||||||||||||||||||||||||||||||||
Year Ended July 31, 2011 (f) | $ | 8.02 | (0.06 | ) | 1.45 | 1.39 | (0.03 | ) | – | (0.03 | ) | $ | 9.38 | 17.36% | $ | 2,860,809 | 1.87% | (0.65% | ) | 1.99% | 41.00% | |||||||||||||||||||||||||||||||||||
Year Ended July 31, 2010 (f) | $ | 7.21 | 0.02 | 0.84 | 0.86 | (0.05 | ) | – | (0.05 | ) | $ | 8.02 | 11.88% | $ | 3,250,012 | 1.85% | 0.29% | 1.96% | 34.00% | |||||||||||||||||||||||||||||||||||||
Year Ended July 31, 2009 (f) | $ | 8.36 | 0.01 | (1.16 | )(g) | (1.15 | ) | – | – | – | $ | 7.21 | (13.76% | ) | $ | 3,481,034 | 1.81% | 0.12% | 1.92% | 60.00% | ||||||||||||||||||||||||||||||||||||
| Institutional Service Class Shares(h) | ||||||||||||||||||||||||||||||||||||||||||||||||||||||||
Six Months Ended January 31, 2014 (f) (Unaudited) | $ | 12.85 | 0.02 | 0.60 | 0.62 | (0.10 | ) | (0.14 | ) | (0.24 | ) | $ | 13.23 | 4.86% | $ | 48,816,547 | 1.02% | 0.37% | 1.19% | 17.05% | ||||||||||||||||||||||||||||||||||||
Year Ended July 31, 2013 (f) | $ | 11.45 | 0.10 | 1.36 | 1.46 | (0.06 | ) | – | (0.06 | ) | $ | 12.85 | 12.80% | $ | 52,843,472 | 1.01% | 0.84% | 1.24% | 41.00% | |||||||||||||||||||||||||||||||||||||
Year Ended July 31, 2012 (f) | $ | 10.31 | 0.05 | 1.11 | 1.16 | (0.02 | ) | – | (0.02 | ) | $ | 11.45 | 11.25% | $ | 53,069,738 | 1.01% | 0.43% | 1.27% | 53.00% | |||||||||||||||||||||||||||||||||||||
Year Ended July 31, 2011 (f) | $ | 8.81 | 0.02 | 1.60 | 1.62 | (0.12 | ) | – | (0.12 | ) | $ | 10.31 | 18.41% | $ | 57,206,982 | 1.01% | 0.21% | 1.24% | 41.00% | |||||||||||||||||||||||||||||||||||||
Year Ended July 31, 2010 (f) | $ | 7.87 | 0.10 | 0.91 | 1.01 | (0.07 | ) | – | (0.07 | ) | $ | 8.81 | 12.82% | $ | 60,078,249 | 0.99% | 1.16% | 1.21% | 34.00% | |||||||||||||||||||||||||||||||||||||
Year Ended July 31, 2009 (f) | $ | 9.11 | 0.07 | (1.26 | )(g) | (1.19 | ) | (0.05 | ) | – | (0.05 | ) | $ | 7.87 | (12.97% | ) | $ | 67,051,343 | 0.93% | 0.99% | 1.17% | 60.00% | ||||||||||||||||||||||||||||||||||
| Institutional Class Shares | ||||||||||||||||||||||||||||||||||||||||||||||||||||||||
Period Ended January 31, 2014 (f)(i) (Unaudited) | $ | 13.29 | 0.02 | 0.18 | 0.20 | (0.12 | ) | (0.14 | ) | (0.26 | ) | $ | 13.23 | 1.48% | $ | 10,171 | 0.87% | 0.36% | 1.01% | 17.05% | ||||||||||||||||||||||||||||||||||||
Amounts designated as “–” are zero or have been rounded to zero.
| (a) | Excludes sales charge. |
| (b) | Not annualized for periods less than one year. |
| (c) | Annualized for periods less than one year. |
| (d) | During the period, certain fees may have been waived and/or reimbursed. If such waivers/reimbursements had not occurred, the ratios would have been as indicated. |
| (e) | Portfolio turnover is calculated on the basis of the Fund as a whole without distinguishing among the classes of shares. |
| (f) | Per share calculations were performed using average shares method. |
| (g) | Includes $0.017 of Fair Funds Settlement. |
| (h) | Effective September 16, 2013, Fiduciary Shares were renamed Institutional Service Class Shares. |
| (i) | For the period from September 19, 2013 (commencement of operations) through January 31, 2014. Total return is calculated based on inception date of September 18, 2013 through January 31, 2014. |
The accompanying notes are an integral part of these financial statements.
123
| Fund Commentary | Nationwide HighMark Small Cap Core Fund |
For the semiannual period ended January 31, 2014, the Nationwide HighMark Small Cap Core Fund (Institutional Service Class) returned 10.18%* versus 8.88% for its benchmark, the Russell 2000® Index. For broader comparison, the median return for the Fund’s closest Lipper peer category of Small-Cap Core Funds (consisting of 733 funds as of January 31, 2014) was 8.17% for the same time period.
*Performance prior to the Fund’s inception on September 16, 2013, is based on the performance of the Fund’s predecessor fund.
Market Environment
Small-capitalization stocks were the best-performing asset class of 2013, returning more than 38% as measured by the Russell 2000 Index and exceeding their large- and mid-cap brethren by more than 6%. In January 2014, however, these stocks gave back some of their lead, registering -2.8% for the month. Overall, for the reporting period, small-cap stocks returned 8.9%, outperforming large- and mid-cap stocks by 1.5%.
Many economic factors that drive small-cap returns were favorable during the reporting period. Credit spreads fell, fueling capital into smaller, more highly leveraged stocks. Improvement in U.S. markets and weakness in international markets fueled performance of U.S.-focused small-cap firms.
Portfolio Performance
In addition, the overall strength of the market overwhelmed some of the criteria the team monitors to select positions. Earnings signals exhibited mixed results as the improving economic conditions provided support for firms with weak earnings outlook as much or sometimes more than those with improving earnings outlook. Short traders were challenged by the market strength, and the information content of their activity moderated.
The Fund’s overweights in industrials and materials during the reporting period contributed to Fund returns as cyclical stocks advanced. The Fund’s underweight in energy also paid off as emerging market weakness drove down
expectations for oil prices and in turn, energy company valuations.
The three best contributors to the Fund’s industry allocation performance were in health-care equipment, biotechnology and consumer finance. Also, continuing a pattern we have seen throughout the years, the positions the Fund held in biotechnology performed well.
The largest detractors from Fund performance during the reporting period included sector selection in health care and stock selection in financials and consumer staples.
Outlook and Positioning
Stabilization in market conditions has improved the environment for active management. Correlations across stocks fell throughout 2013, indicating that the merit of individual stocks’ future returns will be determined more by the merit of individual companies than by overbearing macroeconomic concerns. Active management thrives in such an environment. The Fund entered into financial futures contracts (“futures contracts”) to enable the Fund to more closely approximate the performance of its benchmark indices or for tactical hedging purposes.
Subadviser:
HighMark Capital Management, Inc.
Portfolio Managers:
Edward Herbert and Derek Izuel
The Fund is subject to the risks of investing in equity securities and risks associated with investing in stocks of smaller companies. The Fund may invest in more-aggressive investments such as derivatives (many of which create investment leverage and are highly volatile), exchange-traded funds (ETFs) (shareholders will bear additional costs) and foreign securities (which are volatile, harder to price and less liquid than U.S. securities). Please refer to the summary prospectus for a more detailed explanation of the Fund’s principal risks.
A description of the benchmarks can be found on the Market Index Definitions page at the back of this book.
124
| Fund Overview (Unaudited) | Nationwide HighMark Small Cap Core Fund |
Objective
The Fund seeks long-term capital appreciation.
Highlights
| Ÿ | For the semiannual period ended January 31, 2014, the Fund (Institutional Service Class) returned 10.18%, outperforming the benchmark by 1.30% and the Lipper peer category by 2.01%. |
| Ÿ | The Fund’s overweights in industrials and materials contributed to the Fund’s returns during the reporting period as cyclical stocks advanced. |
| Ÿ | The largest detractors from Fund performance during the reporting period included sector selection in health care and stock selection in financials and consumer staples. |
Asset Allocation†
| Common Stocks | 94.5% | |||
| Mutual Fund | 5.4% | |||
| Other assets in excess of liabilities | 0.1% | |||
| 100.0% |
Top Industries††
| Real Estate Investment Trusts (REITs) | 9.0% | |||
| Software | 7.8% | |||
| Health Care Equipment & Supplies | 6.0% | |||
| Semiconductors & Semiconductor Equipment | 5.3% | |||
| Commercial Banks | 4.8% | |||
| Professional Services | 4.5% | |||
| Machinery | 4.3% | |||
| Communications Equipment | 3.4% | |||
| Energy Equipment & Services | 3.0% | |||
| Hotels, Restaurants & Leisure | 2.8% | |||
| Other Industries | 49.1% | |||
| 100.0% |
Top Holdings††
| Fidelity Institutional Money Market Fund — Institutional Class | 5.4% | |||
| Aspen Technology, Inc. | 2.1% | |||
| West Pharmaceutical Services, Inc. | 2.0% | |||
| Graphic Packaging Holding Co. | 2.0% | |||
| Mueller Industries, Inc. | 1.9% | |||
| Korn/Ferry International | 1.9% | |||
| Tyler Technologies, Inc. | 1.8% | |||
| PNM Resources, Inc. | 1.7% | |||
| DCT Industrial Trust, Inc. | 1.6% | |||
| Papa John’s International, Inc. | 1.5% | |||
| Other Holdings | 78.1% | |||
| 100.0% |
| † | Percentages indicated are based upon net assets as of January 31, 2014. |
| †† | Percentages indicated are based upon total investments as of January 31, 2014. |
125
| Fund Performance | Nationwide HighMark Small Cap Core Fund |
Average Annual Total Return
(For periods ended January 31, 2014)
| Six Months* | 1 Yr. | 5 Yr. | ||||||||||||
| Class A | w/o SC1 | 10.03% | 26.52% | 23.12% | ||||||||||
| w/SC2 | 3.97% | 19.54% | 21.73% | |||||||||||
| Class C | w/o SC1 | 9.73% | 25.78% | 22.38% | ||||||||||
| w/SC3 | 8.73% | 24.78% | 22.38% | |||||||||||
| Institutional Service Class4,5 | w/o SC | 10.18% | 26.84% | 23.49% | ||||||||||
| Institutional Class4 | w/o SC | 6.44% | 6 | — | — | |||||||||
All figures showing the effect of a sales charge (SC) reflect the maximum charge possible, because it has the most significant effect on performance data.
| * | Not annualized. |
| 1 | These returns do not reflect the effects of SCs. |
| 2 | For the period from September 16, 2013 through January 31, 2014 a front-end sales charge of 5.75% was deducted. Prior to September 16, 2013, a front-end sales charge of 5.50% was deducted. |
| 3 | A 1.00% CDSC was deducted from the one year return because it is charged when you sell Class C shares within the first year after purchase. |
| 4 | Not subject to any SCs. |
| 5 | Effective September 16, 2013 Fiduciary Shares were renamed Institutional Service Class Shares. |
| 6 | Since inception date of September 18, 2013. Not Annualized. |
Expense Ratios
| Gross Expense Ratio* | Net Expense Ratio* | |||||
| Class A | 1.83% | 1.62% | ||||
| Class C | 2.33% | 2.22% | ||||
| Institutional Service Class | 1.58% | 1.37% | ||||
| Institutional Class | 1.33% | 1.22% | ||||
| * | Current effective prospectus dated September 16, 2013. The difference between gross and net operating expenses reflects contractual waivers in place through November 30, 2015. Please see the Fund’s most recent prospectus for details. |
126
| Fund Performance | Nationwide HighMark Small Cap Core Fund |
Performance of a $10,000 Investment
Investment return and principal value will fluctuate, and when redeemed, shares may be worth more or less than original cost. Past performance is no guarantee of future results and does not reflect the deduction of taxes that a shareholder would pay on fund distributions or the redemption of fund shares. Investing in mutual funds involves market risk, including loss of principal. Performance returns assume the reinvestment of all distributions.
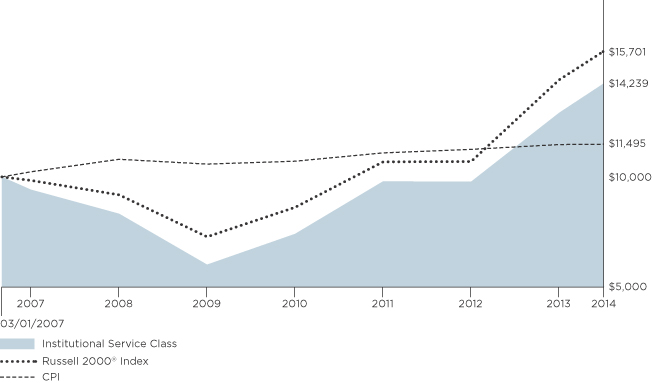
Comparative performance of $10,000 invested in Institutional Service Class shares of the Nationwide HighMark Small Cap Core Fund since inception* through 1/31/14 versus the Russell 2000® Index and the Consumer Price Index (CPI) for the same period. Unlike the Fund, the performance for these unmanaged indexes does not reflect any fees, expenses, or sales charges. One cannot invest directly in a market index. A description of the benchmarks can be found on the Market Index Definitions page at the back of this book.
*The inception date for the Nationwide HighMark Small Cap Core Fund is 9/16/13. Performance prior to that date is based on the since-inception performance of the Fund’s predecessor fund.
127
| Shareholder Expense Example | Nationwide HighMark Small Cap Core Fund |
As a shareholder of the Fund, you incur two types of costs: (1) transaction costs, including sales charges (loads) paid on purchase payments and redemption fees; and (2) ongoing costs, including investment advisory fees, administration fees, distribution fees and other Fund expenses. The examples below are intended to help you understand your ongoing costs (in dollars) of investing in the Fund and to compare these costs with the ongoing costs of investing in other mutual funds. Per Securities and Exchange Commission (“SEC”) requirements, the examples assume that you had a $1,000 investment in the Class at the beginning of the reporting period (August 1, 2013) and continued to hold your shares at the end of the reporting period (January 31, 2014).
Actual Expenses
For each Class of the Fund in the table below, the first line provides information about actual account values and actual expenses. You may use the information in this line, together with the amount you invested, to estimate the expenses that you paid from August 1, 2013 through January 31, 2014. Simply divide your account value by $1,000 (for example, an $8,600 account value divided by $1,000 = 8.6), then multiply the result by the number in the first line of each Class under the heading entitled “Expenses Paid During Period” to estimate the expenses you paid on your account during this period.
Hypothetical Expenses for Comparison Purposes
The second line of each Class in the table below provides information about hypothetical account values and hypothetical expenses based on the Class’ actual expense ratio and an assumed rate of return of 5% per year before expenses, which is not the Class’ actual return. The hypothetical account values and expenses may not be used to estimate the actual ending account balance or expenses you paid for the period from August 1, 2013 through January 31, 2014. You may use this information to compare the ongoing costs of investing in the Class of the Fund and other funds. To do so, compare this 5% hypothetical example with the 5% hypothetical examples that appear in the shareholder reports of the other funds.
Please note that the expenses shown in the table are meant to highlight your ongoing costs only and do not reflect any transaction costs, such as sales charges (loads) or redemption fees. If these transaction costs were included, your costs would have been higher. Therefore, the second line for each Class in the table is useful in comparing ongoing costs only, and will not help you determine the relative total costs of owning different funds. The examples also assume all dividends and distributions are reinvested.
Schedule of Shareholder Expenses
Expense Analysis of a $1,000 Investment
Nationwide HighMark Small January 31, 2014 | Beginning Account Value ($) 08/01/13 | Ending Account Value ($) 01/31/14 | Expenses Paid During Period ($) 08/01/13 - 01/31/14 | Expense Ratio During Period (%) 08/01/13 - 01/31/14 | ||||||||
| Class A Shares | Actual | a | 1,000.00 | 1,100.30 | 8.58 | 1.62 | ||||||
| Hypothetical | a,b | 1,000.00 | 1,017.04 | 8.24 | 1.62 | |||||||
| Class C Shares | Actual | a | 1,000.00 | 1,097.30 | 11.74 | 2.22 | ||||||
| Hypothetical | a,b | 1,000.00 | 1,014.01 | 11.27 | 2.22 | |||||||
| Institutional Service Class Sharesc | Actual | a | 1,000.00 | 1,101.80 | 7.26 | 1.37 | ||||||
| Hypothetical | a,b | 1,000.00 | 1,018.30 | 6.97 | 1.37 | |||||||
| Institutional Class Shares | Actual | d | 1,000.00 | 1,064.40 | 4.63 | 1.22 | ||||||
| Hypothetical | a,b | 1,000.00 | 1,019.06 | 6.21 | 1.22 | |||||||
| a | Expenses are equal to the Fund’s annualized expense ratio multiplied by the average account value from August 1, 2013 through January 31, 2014 multiplied to reflect one-half year period. The expense ratio presented represents a six-month, annualized ratio in accordance with Securities and Exchange Commission guidelines. |
| b | Represents the hypothetical 5% return before expenses. |
| c | Effective September 16, 2013, Fiduciary Shares were renamed Institutional Service Class Shares. |
| d | Actual expenses are equal to the Fund’s annualized expense ratio multiplied by the average account value from September 19, 2013 through January 31, 2014 to reflect the period from commencement of operations. |
128
Statement of Investments
January 31, 2014 (Unaudited)
Nationwide HighMark Small Cap Core Fund
| Common Stocks 94.5% | ||||||||||
| Shares | Market Value | |||||||||
| ||||||||||
Aerospace & Defense 2.3% |
| |||||||||
American Science & Engineering, Inc. | 12,750 | $ | 871,972 | |||||||
Taser International, Inc.* | 64,000 | 1,027,840 | ||||||||
|
| |||||||||
| 1,899,812 | ||||||||||
|
| |||||||||
| ||||||||||
Airlines 0.6% |
| |||||||||
Republic Airways Holdings, Inc.* | 53,000 | 519,930 | ||||||||
|
| |||||||||
| ||||||||||
Auto Components 1.4% |
| |||||||||
Superior Industries International, Inc. | 38,650 | 703,817 | ||||||||
Tenneco, Inc.* | 3,950 | 224,518 | ||||||||
Tower International, Inc.* | 8,700 | 193,401 | ||||||||
|
| |||||||||
| 1,121,736 | ||||||||||
|
| |||||||||
| ||||||||||
Automobiles 0.4% |
| |||||||||
Winnebago Industries, Inc.* | 13,150 | 315,074 | ||||||||
|
| |||||||||
| ||||||||||
Biotechnology 1.7% |
| |||||||||
Alkermes PLC* | 17,700 | 861,636 | ||||||||
Puma Biotechnology, Inc.* | 4,450 | 526,034 | ||||||||
|
| |||||||||
| 1,387,670 | ||||||||||
|
| |||||||||
| ||||||||||
Building Products 0.2% |
| |||||||||
A.O. Smith Corp. | 4,300 | 203,046 | ||||||||
|
| |||||||||
| ||||||||||
Capital Markets 0.9% |
| |||||||||
Fifth Street Finance Corp. | 26,421 | 248,622 | ||||||||
Investment Technology Group, Inc.* | 17,100 | 282,150 | ||||||||
MCG Capital Corp. | 42,400 | 189,528 | ||||||||
|
| |||||||||
| 720,300 | ||||||||||
|
| |||||||||
| ||||||||||
Chemicals 2.2% |
| |||||||||
American Vanguard Corp. | 7,450 | 173,138 | ||||||||
Ferro Corp.* | 25,250 | 317,645 | ||||||||
FutureFuel Corp. | 53,600 | 876,896 | ||||||||
Minerals Technologies, Inc. | 4,450 | 229,976 | ||||||||
Rockwood Holdings, Inc. | 900 | 61,677 | ||||||||
Stepan Co. | 2,450 | 155,305 | ||||||||
|
| |||||||||
| 1,814,637 | ||||||||||
|
| |||||||||
| ||||||||||
Commercial Banks 4.8% |
| |||||||||
First Interstate BancSystem, Inc. | 10,850 | 278,411 | ||||||||
Huntington Bancshares, Inc. | 53,200 | 482,524 | ||||||||
International Bancshares Corp. | 35,150 | 822,861 | ||||||||
PrivateBancorp, Inc. | 30,350 | 867,707 | ||||||||
United Community Banks, Inc.* | 19,450 | 324,426 | ||||||||
Webster Financial Corp. | 24,850 | 753,949 | ||||||||
Wilshire Bancorp, Inc. | 38,450 | 382,962 | ||||||||
|
| |||||||||
| 3,912,840 | ||||||||||
|
| |||||||||
| ||||||||||
Commercial Services & Supplies 1.4% |
| |||||||||
EnerNOC, Inc.* | 47,900 | 1,072,960 | ||||||||
Ennis, Inc. | 6,150 | 88,991 | ||||||||
|
| |||||||||
| 1,161,951 | ||||||||||
|
| |||||||||
| Common Stocks (continued) | ||||||||||
| Shares | Market Value | |||||||||
| ||||||||||
Communications Equipment 3.4% |
| |||||||||
Bel Fuse, Inc., Class B | 14,650 | $ | 280,840 | |||||||
Comtech Telecommunications Corp. | 30,800 | 936,936 | ||||||||
Emulex Corp.* | 65,800 | 484,288 | ||||||||
Extreme Networks, Inc.* | 124,800 | 913,536 | ||||||||
ShoreTel, Inc.* | 27,500 | 211,750 | ||||||||
|
| |||||||||
| 2,827,350 | ||||||||||
|
| |||||||||
| ||||||||||
Computers & Peripherals 1.3% |
| |||||||||
Avid Technology, Inc.* | 21,250 | 147,475 | ||||||||
Novatel Wireless, Inc.* | 46,900 | 125,223 | ||||||||
QLogic Corp.* | 65,900 | 762,463 | ||||||||
|
| |||||||||
| 1,035,161 | ||||||||||
|
| |||||||||
| ||||||||||
Construction & Engineering 0.7% |
| |||||||||
Dycom Industries, Inc.* | 10,000 | 278,300 | ||||||||
EMCOR Group, Inc. | 5,500 | 233,805 | ||||||||
Pike Corp.* | 10,000 | 105,400 | ||||||||
|
| |||||||||
| 617,505 | ||||||||||
|
| |||||||||
| ||||||||||
Construction Materials 0.7% |
| |||||||||
Eagle Materials, Inc. | 4,000 | 315,000 | ||||||||
United States Lime & Minerals, Inc.* | 4,550 | 248,203 | ||||||||
|
| |||||||||
| 563,203 | ||||||||||
|
| |||||||||
| ||||||||||
Containers & Packaging 2.0% |
| |||||||||
Graphic Packaging Holding Co.* | 169,200 | 1,607,400 | ||||||||
|
| |||||||||
| ||||||||||
Diversified Consumer Services 0.6% |
| |||||||||
Capella Education Co. | 7,950 | 496,000 | ||||||||
|
| |||||||||
| ||||||||||
Electric Utilities 2.4% |
| |||||||||
El Paso Electric Co. | 14,750 | 537,343 | ||||||||
PNM Resources, Inc. | 57,800 | 1,424,770 | ||||||||
|
| |||||||||
| 1,962,113 | ||||||||||
|
| |||||||||
| ||||||||||
Electrical Equipment 0.3% |
| |||||||||
Powell Industries, Inc. | 4,250 | 260,993 | ||||||||
|
| |||||||||
| ||||||||||
Energy Equipment & Services 3.0% |
| |||||||||
Dawson Geophysical Co.* | 6,150 | 199,076 | ||||||||
Dril-Quip, Inc.* | 9,400 | 945,264 | ||||||||
Helix Energy Solutions Group, Inc.* | 45,400 | 925,706 | ||||||||
Tesco Corp.* | 18,350 | 387,552 | ||||||||
|
| |||||||||
| 2,457,598 | ||||||||||
|
| |||||||||
| ||||||||||
Food & Staples Retailing 0.7% |
| |||||||||
SUPERVALU, Inc.* | 101,900 | 588,982 | ||||||||
|
| |||||||||
| ||||||||||
Food Products 0.4% |
| |||||||||
Seaboard Corp.* | 120 | 306,000 | ||||||||
|
| |||||||||
| ||||||||||
Health Care Equipment & Supplies 6.0% |
| |||||||||
Align Technology, Inc.* | 6,150 | 365,433 | ||||||||
AngioDynamics, Inc.* | 12,100 | 192,511 | ||||||||
129
Statement of Investments (Continued)
January 31, 2014 (Unaudited)
Nationwide HighMark Small Cap Core Fund (Continued)
| Common Stocks (continued) | ||||||||||
| Shares | Market Value | |||||||||
| ||||||||||
Health Care Equipment & Supplies (continued) |
| |||||||||
Lumenis Ltd.* (a) | 13 | $ | 0 | |||||||
NuVasive, Inc.* | 24,950 | 934,128 | ||||||||
OraSure Technologies, Inc.* | 23,950 | 140,586 | ||||||||
Sirona Dental Systems, Inc.* | 3,300 | 237,402 | ||||||||
SurModics, Inc.* | 40,200 | 980,076 | ||||||||
Thoratec Corp.* | 13,500 | 471,690 | ||||||||
West Pharmaceutical Services, Inc. | 34,400 | 1,632,280 | ||||||||
|
| |||||||||
| 4,954,106 | ||||||||||
|
| |||||||||
| ||||||||||
Health Care Providers & Services 1.5% |
| |||||||||
Corvel Corp.* | 12,950 | 613,312 | ||||||||
Cross Country Healthcare, Inc.* | 31,750 | 342,900 | ||||||||
Magellan Health Services, Inc.* | 4,550 | 272,227 | ||||||||
|
| |||||||||
| 1,228,439 | ||||||||||
|
| |||||||||
| ||||||||||
Health Care Technology 1.4% |
| |||||||||
MedAssets, Inc.* | 38,450 | 847,438 | ||||||||
Omnicell, Inc.* | 11,250 | 290,475 | ||||||||
|
| |||||||||
| 1,137,913 | ||||||||||
|
| |||||||||
| ||||||||||
Hotels, Restaurants & Leisure 2.8% |
| |||||||||
DineEquity, Inc. | 5,100 | 396,831 | ||||||||
Multimedia Games Holding Co., Inc.* | 13,400 | 425,584 | ||||||||
Papa John’s International, Inc. | 25,700 | 1,236,941 | ||||||||
Six Flags Entertainment Corp. | 6,600 | 236,874 | ||||||||
|
| |||||||||
| 2,296,230 | ||||||||||
|
| |||||||||
| ||||||||||
Household Durables 1.3% |
| |||||||||
Libbey, Inc.* | 13,700 | 295,098 | ||||||||
M.D.C. Holdings, Inc.* | 23,900 | 738,271 | ||||||||
|
| |||||||||
| 1,033,369 | ||||||||||
|
| |||||||||
| ||||||||||
Household Products 0.9% |
| |||||||||
Spectrum Brands Holdings, Inc. | 9,450 | 711,113 | ||||||||
|
| |||||||||
| ||||||||||
Information Technology Services 0.4% |
| |||||||||
Acxiom Corp.* | 8,400 | 302,064 | ||||||||
|
| |||||||||
| ||||||||||
Insurance 1.7% |
| |||||||||
Navigators Group, Inc. (The)* | 12,850 | 766,245 | ||||||||
OneBeacon Insurance Group Ltd., Class A | 29,100 | 409,146 | ||||||||
United Fire Group, Inc. | 10,300 | 258,530 | ||||||||
|
| |||||||||
| 1,433,921 | ||||||||||
|
| |||||||||
| ||||||||||
Internet Software & Services 1.6% |
| |||||||||
comScore, Inc.* | 13,400 | 367,294 | ||||||||
Cornerstone OnDemand, Inc.* | 4,350 | 248,168 | ||||||||
Stamps.com, Inc.* | 6,550 | 258,463 | ||||||||
XO Group, Inc.* | 39,600 | 480,348 | ||||||||
|
| |||||||||
| 1,354,273 | ||||||||||
|
| |||||||||
| ||||||||||
Life Sciences Tools & Services 0.9% |
| |||||||||
Pacific Biosciences of California, Inc.* | 99,900 | 717,282 | ||||||||
|
| |||||||||
| Common Stocks (continued) | ||||||||||
| Shares | Market Value | |||||||||
| ||||||||||
Machinery 4.3% |
| |||||||||
Columbus McKinnon Corp.* | 12,000 | $ | 296,640 | |||||||
Middleby Corp. (The)* | 1,380 | 340,280 | ||||||||
Mueller Industries, Inc. | 24,950 | 1,552,888 | ||||||||
Mueller Water Products, Inc., Class A | 37,610 | 326,455 | ||||||||
Rexnord Corp.* | 22,400 | 581,952 | ||||||||
Xerium Technologies, Inc.* | 24,300 | 407,268 | ||||||||
|
| |||||||||
| 3,505,483 | ||||||||||
|
| |||||||||
| ||||||||||
Media 2.1% |
| |||||||||
E.W. Scripps Co. (The), Class A* | 17,750 | 326,778 | ||||||||
Entravision Communications Corp., Class A | 38,277 | 230,810 | ||||||||
Live Nation Entertainment, Inc.* | 43,900 | 933,753 | ||||||||
MDC Partners, Inc., Class A | 8,750 | 210,262 | ||||||||
|
| |||||||||
| 1,701,603 | ||||||||||
|
| |||||||||
| ||||||||||
Metals & Mining 1.0% |
| |||||||||
SunCoke Energy, Inc.* | 18,050 | 400,349 | ||||||||
Worthington Industries, Inc. | 10,000 | 405,400 | ||||||||
|
| |||||||||
| 805,749 | ||||||||||
|
| |||||||||
| ||||||||||
Oil, Gas & Consumable Fuels 0.8% |
| |||||||||
Clayton Williams Energy, Inc.* | 4,250 | 293,335 | ||||||||
REX American Resources Corp.* | 8,900 | 364,544 | ||||||||
|
| |||||||||
| 657,879 | ||||||||||
|
| |||||||||
| ||||||||||
Paper & Forest Products 1.5% |
| |||||||||
Deltic Timber Corp. | 5,000 | 321,550 | ||||||||
Louisiana-Pacific Corp.* | 30,550 | 535,542 | ||||||||
Neenah Paper, Inc. | 8,900 | 386,616 | ||||||||
|
| |||||||||
| 1,243,708 | ||||||||||
|
| |||||||||
| ||||||||||
Personal Products 0.9% |
| |||||||||
Inter Parfums, Inc. | 7,100 | 231,034 | ||||||||
Revlon, Inc., Class A* | 20,400 | 478,992 | ||||||||
|
| |||||||||
| 710,026 | ||||||||||
|
| |||||||||
| ||||||||||
Pharmaceuticals 1.5% |
| |||||||||
Impax Laboratories, Inc.* | 8,700 | 201,318 | ||||||||
Lannett Co., Inc.* | 18,250 | 644,590 | ||||||||
Nektar Therapeutics* | 18,600 | 252,960 | ||||||||
XenoPort, Inc.* | 29,850 | 171,638 | ||||||||
|
| |||||||||
| 1,270,506 | ||||||||||
|
| |||||||||
| ||||||||||
Professional Services 4.5% |
| |||||||||
Barrett Business Services, Inc. | 10,950 | 858,589 | ||||||||
Huron Consulting Group, Inc.* | 4,800 | 317,952 | ||||||||
Insperity, Inc. | 5,500 | 181,610 | ||||||||
Korn/Ferry International* | 65,200 | 1,529,592 | ||||||||
Resources Connection, Inc. | 56,600 | 762,968 | ||||||||
|
| |||||||||
| 3,650,711 | ||||||||||
|
| |||||||||
130
Statement of Investments (Continued)
January 31, 2014 (Unaudited)
Nationwide HighMark Small Cap Core Fund (Continued)
| Common Stocks (continued) | ||||||||||
| Shares | Market Value | |||||||||
| ||||||||||
Real Estate Investment Trusts (REITs) 9.0% |
| |||||||||
Anworth Mortgage Asset Corp. | 40,200 | $ | 188,538 | |||||||
CBL & Associates Properties, Inc. | 31,300 | 531,787 | ||||||||
Cedar Realty Trust, Inc. | 33,650 | 212,331 | ||||||||
DCT Industrial Trust, Inc. | 178,600 | 1,285,920 | ||||||||
Extra Space Storage, Inc. | 25,050 | 1,143,783 | ||||||||
First Industrial Realty Trust, Inc. | 58,300 | 1,000,428 | ||||||||
Healthcare Realty Trust, Inc. | 8,600 | 197,112 | ||||||||
Post Properties, Inc. | 1,500 | 70,395 | ||||||||
Potlatch Corp. | 24,500 | 980,000 | ||||||||
Sovran Self Storage, Inc. | 5,200 | 353,132 | ||||||||
Strategic Hotels & Resorts, Inc.* | 60,800 | 566,048 | ||||||||
Sunstone Hotel Investors, Inc. | 65,000 | 833,950 | ||||||||
|
| |||||||||
| 7,363,424 | ||||||||||
|
| |||||||||
| ||||||||||
Real Estate Management & Development 0.7% |
| |||||||||
Altisource Residential Corp. | 20,150 | 604,500 | ||||||||
|
| |||||||||
| ||||||||||
Road & Rail 1.5% |
| |||||||||
Old Dominion Freight Line, Inc.* | 8,000 | 433,920 | ||||||||
Saia, Inc.* | 22,750 | 765,765 | ||||||||
|
| |||||||||
| 1,199,685 | ||||||||||
|
| |||||||||
| ||||||||||
Semiconductors & Semiconductor Equipment 5.3% |
| |||||||||
Advanced Energy Industries, Inc.* | 15,400 | 420,420 | ||||||||
FormFactor, Inc.* | 55,646 | 358,360 | ||||||||
Intermolecular, Inc.* | 21,950 | 88,459 | ||||||||
Intersil Corp., Class A | 51,298 | 581,719 | ||||||||
Kulicke & Soffa Industries, Inc.* | 51,500 | 599,460 | ||||||||
Lattice Semiconductor Corp.* | 57,332 | 331,379 | ||||||||
M/A-COM Technology Solutions Holdings, Inc.* | 23,250 | 395,250 | ||||||||
RF Micro Devices, Inc.* | 212,100 | 1,130,493 | ||||||||
Ultra Clean Holdings, Inc.* | 35,150 | 401,765 | ||||||||
|
| |||||||||
| 4,307,305 | ||||||||||
|
| |||||||||
| ||||||||||
Software 7.8% |
| |||||||||
Aspen Technology, Inc.* | 37,050 | 1,688,368 | ||||||||
CommVault Systems, Inc.* | 7,850 | 542,199 | ||||||||
Infoblox, Inc.* | 7,950 | 278,886 | ||||||||
NetSuite, Inc.* | 7,800 | 820,404 | ||||||||
Pegasystems, Inc. | 14,100 | 640,704 | ||||||||
Rosetta Stone, Inc.* | 11,550 | 127,974 | ||||||||
Telenav, Inc.* | 51,100 | 332,150 | ||||||||
TIBCO Software, Inc.* | 13,900 | 295,931 | ||||||||
TiVo, Inc.* | 19,450 | 240,986 | ||||||||
Tyler Technologies, Inc.* | 13,600 | 1,434,120 | ||||||||
|
| |||||||||
| 6,401,722 | ||||||||||
|
| |||||||||
| Common Stocks (continued) | ||||||||||
| Shares | Market Value | |||||||||
| ||||||||||
Specialty Retail 1.2% |
| |||||||||
Brown Shoe Co., Inc. | 9,650 | $ | 228,512 | |||||||
Citi Trends, Inc.* | 4,550 | 72,800 | ||||||||
New York & Co., Inc.* | 53,700 | 243,261 | ||||||||
Pier 1 Imports, Inc. | 14,250 | 272,317 | ||||||||
Stein Mart, Inc. | 13,400 | 165,892 | ||||||||
|
| |||||||||
| 982,782 | ||||||||||
|
| |||||||||
| ||||||||||
Textiles, Apparel & Luxury Goods 0.9% |
| |||||||||
Skechers U.S.A., Inc., Class A* | 24,650 | 712,139 | ||||||||
|
| |||||||||
| ||||||||||
Thrifts & Mortgage Finance 1.6% |
| |||||||||
Northfield Bancorp, Inc. | 64,700 | 804,221 | ||||||||
Tree.com, Inc.* | 9,450 | 306,652 | ||||||||
WSFS Financial Corp. | 2,956 | 212,241 | ||||||||
|
| |||||||||
| 1,323,114 | ||||||||||
|
| |||||||||
Total Common Stocks | 77,388,347 | |||||||||
|
| |||||||||
| Mutual Fund 5.4% | ||||||||||
Money Market Fund 5.4% | ||||||||||
Fidelity Institutional Money Market Fund — Institutional Class, 0.08% (b) | 4,452,702 | 4,452,702 | ||||||||
|
| |||||||||
Total Mutual Fund | 4,452,702 | |||||||||
|
| |||||||||
Total Investments | 81,841,049 | |||||||||
Other assets in excess of | 108,721 | |||||||||
|
| |||||||||
NET ASSETS — 100.0% |
| $ | 81,949,770 | |||||||
|
| |||||||||
| * | Denotes a non-income producing security. |
| (a) | Fair value security. |
| (b) | Represents 7-day effective yield as of January 31, 2014. |
| (c) | See notes to financial statements for tax cost and unrealized appreciation/(depreciation) of securities. |
| Ltd. | Limited |
| PLC | Public Limited Company |
| REIT | Real Estate Investment Trust |
131
Statement of Investments (Continued)
January 31, 2014 (Unaudited)
Nationwide HighMark Small Cap Core Fund (Continued)
At January 31, 2014, the Fund’s open futures contracts were as follows (Note 2):
| Number of Contracts | Long Contracts | Expiration | Notional Value Covered by Contracts | Unrealized Appreciation/ (Depreciation) | ||||||||||
| 40 | Russell 2000 Mini Future | 03/21/14 | $ | 4,513,200 | $ | 47,567 | ||||||||
|
|
|
|
|
| |||||||||
The accompanying notes are an integral part of these financial statements.
132
Statement of Assets and Liabilities
January 31, 2014 (Unaudited)
| Nationwide HighMark Small Cap Core Fund | ||||||
Assets: | ||||||
Investments, at value (cost $63,422,890) | $ | 81,841,049 | ||||
Dividends receivable | 26,239 | |||||
Receivable for capital shares issued | 71,618 | |||||
Reclaims receivable | 251 | |||||
Receivable for variation margin on futures contracts | 186,576 | |||||
Prepaid expenses | 12,273 | |||||
|
| |||||
Total Assets | 82,138,006 | |||||
|
| |||||
Liabilities: | ||||||
Payable for capital shares redeemed | 7,115 | |||||
Cash overdraft (Note 2) | 31,740 | |||||
Accrued expenses and other payables: | ||||||
Investment advisory fees | 65,170 | |||||
Fund administration fees | 9,946 | |||||
Distribution fees | 6,287 | |||||
Administrative servicing fees | 35,579 | |||||
Accounting and transfer agent fees | 2,802 | |||||
Trustee fees | 1,098 | |||||
Deferred compensation (Note 2) | | 5,625 | | |||
Custodian fees | 363 | |||||
Compliance program costs (Note 3) | 931 | |||||
Professional fees | 13,785 | |||||
Printing fees | 7,222 | |||||
Other | 573 | |||||
|
| |||||
Total Liabilities | 188,236 | |||||
|
| |||||
Net Assets | $ | 81,949,770 | ||||
|
| |||||
Represented by: | ||||||
Capital | $ | 83,884,189 | ||||
Accumulated distributions in excess of net investment loss | (167,898 | ) | ||||
Accumulated net realized losses from investment and futures transactions | (20,232,247 | ) | ||||
Net unrealized appreciation/(depreciation) from investments | 18,418,159 | |||||
Net unrealized appreciation/(depreciation) from futures contracts (Note 2) | 47,567 | |||||
|
| |||||
Net Assets | $ | 81,949,770 | ||||
|
| |||||
133
Statement of Assets and Liabilities (Continued)
January 31, 2014 (Unaudited)
| Nationwide HighMark Small Cap Core Fund | ||||||
Net Assets: | ||||||
Class A Shares | $ | 11,844,174 | ||||
Class C Shares | 4,317,909 | |||||
Institutional Service Class Shares | 65,777,039 | |||||
Institutional Class Shares | 10,648 | |||||
|
| |||||
Total | $ | 81,949,770 | ||||
|
| |||||
Shares Outstanding (unlimited number of shares authorized): | ||||||
Class A Shares | 430,201 | |||||
Class C Shares | 163,003 | |||||
Institutional Service Class Shares | 2,354,752 | |||||
Institutional Class Shares | 381 | |||||
|
| |||||
Total | 2,948,337 | |||||
|
| |||||
Net asset value and redemption price per share (Net assets by class divided by shares outstanding by class, respectively): | ||||||
Class A Shares (a) | $ | 27.53 | ||||
Class C Shares (b) | $ | 26.49 | ||||
Institutional Service Class Shares | $ | 27.93 | ||||
Institutional Class Shares | $ | 27.95 | ||||
Maximum offering price per share (100%/(100%-maximum sales charge) of net asset value adjusted to the nearest cent): | ||||||
Class A Shares | $ | 29.21 | ||||
|
| |||||
Maximum Sales Charge: | ||||||
Class A Shares | 5.75 | % | ||||
|
| |||||
| (a) | For Class A Shares, the redemption price per share is reduced by 1.00% on sales of shares of original purchases of $1,000,000 or more or that were not subject to a front-end sales charge made with 18 months of the purchase date. |
| (b) | For Class C Shares, the redemption price per share is reduced by 1.00% for shares held less than 1 year. |
The accompanying notes are an integral part of these financial statements.
134
Statement of Operations
For the Six Months Ended January 31, 2014 (Unaudited)
| Nationwide HighMark Small Cap Core Fund | ||||||
INVESTMENT INCOME: | ||||||
Dividend income | $ | 405,619 | ||||
Interest income | 55 | |||||
Foreign tax withholding | (79 | ) | ||||
|
| |||||
Total Income | 405,595 | |||||
|
| |||||
EXPENSES: | ||||||
Investment advisory fees | 362,134 | |||||
Fund administration fees | 62,013 | |||||
Distribution fees Class A | 14,709 | |||||
Distribution fees Class C | 22,095 | |||||
Administrative servicing fees Class A | 10,252 | |||||
Administrative servicing fees Institutional Service Class (a) | 52,179 | |||||
Registration and filing fees | 21,520 | |||||
Professional fees | 15,102 | |||||
Printing fees | 11,654 | |||||
Trustee fees | 1,567 | |||||
Custodian fees | 1,669 | |||||
Accounting and transfer agent fees | 9,596 | |||||
Compliance program costs (Note 3) | 1,420 | |||||
Other | 6,764 | |||||
|
| |||||
Total expenses before earnings credit, fees waived, and expenses reimbursed | 592,674 | |||||
|
| |||||
Earnings credit (Note 5) | (35 | ) | ||||
Administrative servicing fees voluntarily waived — Class A (Note 3) | (1,426 | ) | ||||
Administrative servicing fees voluntarily waived — Institutional Service Class (a) (Note 3) | (7,145 | ) | ||||
Expenses reimbursed by adviser (Note 3) | (27,905 | ) | ||||
|
| |||||
Net Expenses | 556,163 | |||||
|
| |||||
NET INVESTMENT LOSS | (150,568 | ) | ||||
|
| |||||
REALIZED/UNREALIZED GAINS (LOSSES) FROM INVESTMENTS: | ||||||
Net realized gains from investment transactions | 4,094,266 | |||||
Net realized gains from futures transactions (Note 2) | 81,365 | |||||
|
| |||||
Net realized gains from investment and futures transactions | 4,175,631 | |||||
|
| |||||
Net change in unrealized appreciation/(depreciation) from investments | 3,081,044 | |||||
Net change in unrealized appreciation/(depreciation) from futures contracts (Note 2) | 31,737 | |||||
|
| |||||
Net change in unrealized appreciation/(depreciation) from investments and futures contracts | 3,112,781 | |||||
|
| |||||
Net realized/unrealized gains from investments and futures transactions | 7,288,412 | |||||
|
| |||||
CHANGE IN NET ASSETS RESULTING FROM OPERATIONS | $ | 7,137,844 | ||||
|
| |||||
| (a) | Effective September 16, 2013, Fiduciary Shares were renamed Institutional Service Class Shares. |
The accompanying notes are an integral part of these financial statements.
135
Statements of Changes in Net Assets
| Nationwide HighMark Small Cap Core Fund | ||||||||||||
| Six Months Ended January 31, 2014 (Unaudited) | Year Ended July 31, 2013 | |||||||||||
Operations: | ||||||||||||
Net investment loss | $ | (150,568 | ) | $ | (20,351 | ) | ||||||
Net realized gains from investment and futures transactions | 4,175,631 | 12,871,094 | ||||||||||
Net change in unrealized appreciation/(depreciation) from investments and futures contracts | 3,112,781 | 8,055,058 | ||||||||||
|
|
|
| |||||||||
Change in net assets resulting from operations | 7,137,844 | 20,905,801 | ||||||||||
|
|
|
| |||||||||
Distributions to Shareholders From: | ||||||||||||
Net investment income: | ||||||||||||
Class A | – | – | ||||||||||
Class C | – | – | ||||||||||
Institutional Service Class (a) | – | (18,837 | ) | |||||||||
Institutional Class | – | (b) | – | |||||||||
|
|
|
| |||||||||
Change in net assets from shareholder distributions | – | (18,837 | ) | |||||||||
|
|
|
| |||||||||
Change in net assets from capital transactions | 968,636 | (8,116,338 | ) | |||||||||
|
|
|
| |||||||||
Change in net assets | 8,106,480 | 12,770,626 | ||||||||||
|
|
|
| |||||||||
Net Assets: | ||||||||||||
Beginning of period | 73,843,290 | 61,072,664 | ||||||||||
|
|
|
| |||||||||
End of period | $ | 81,949,770 | $ | 73,843,290 | ||||||||
|
|
|
| |||||||||
Accumulated distributions in excess of net investment loss at end of period | $ | (167,898 | ) | $ | (17,330 | ) | ||||||
|
|
|
| |||||||||
CAPITAL TRANSACTIONS: | ||||||||||||
Class A Shares | ||||||||||||
Proceeds from shares issued | $ | 206,160 | $ | 630,988 | (c) | |||||||
Dividends reinvested | – | – | ||||||||||
Cost of shares redeemed | (1,026,656 | ) | (2,928,406 | ) | ||||||||
|
|
|
| |||||||||
Total Class A Shares | (820,496 | ) | (2,297,418 | ) | ||||||||
|
|
|
| |||||||||
Class C Shares | ||||||||||||
Proceeds from shares issued | 53,433 | 364,794 | (c) | |||||||||
Dividends reinvested | – | – | ||||||||||
Cost of shares redeemed | (537,534 | ) | (858,039 | ) | ||||||||
|
|
|
| |||||||||
Total Class C Shares | (484,101 | ) | (493,245 | ) | ||||||||
|
|
|
| |||||||||
Institutional Service Class Shares (a) | ||||||||||||
Proceeds from shares issued | 9,816,537 | 23,986,569 | (c) | |||||||||
Dividends reinvested | – | 9,042 | ||||||||||
Cost of shares redeemed | (7,553,304 | ) | (29,321,286 | ) | ||||||||
|
|
|
| |||||||||
Total Institutional Service Class Shares | 2,263,233 | (5,325,675 | ) | |||||||||
|
|
|
| |||||||||
| (a) | Effective September 16, 2013, Fiduciary Shares were renamed Institutional Service Class Shares. |
| (b) | For the period from September 19, 2013 (commencement of operations) through January 31, 2014. |
| (c) | Includes redemption fees. See Note 4 for further information. |
136
Statements of Changes in Net Assets (Continued)
| Nationwide HighMark Small Cap Core Fund | ||||||||||||
| Six Months Ended January 31, 2014 (Unaudited) | Year Ended July 31, 2013 | |||||||||||
CAPITAL TRANSACTIONS: (continued) | ||||||||||||
Institutional Class Shares | ||||||||||||
Proceeds from shares issued | $ | 10,000 | (b) | $ | – | |||||||
Dividends reinvested | – | (b) | – | |||||||||
Cost of shares redeemed | – | (b) | – | |||||||||
|
|
|
| |||||||||
Total Institutional Class Shares | 10,000 | (b) | – | |||||||||
|
|
|
| |||||||||
Change in net assets from capital transactions | $ | 968,636 | $ | (8,116,338 | ) | |||||||
|
|
|
| |||||||||
SHARE TRANSACTIONS: | ||||||||||||
Class A Shares | ||||||||||||
Issued | 7,742 | 28,038 | ||||||||||
Reinvested | – | – | ||||||||||
Redeemed | (39,216 | ) | (138,488 | ) | ||||||||
|
|
|
| |||||||||
Total Class A Shares | (31,474 | ) | (110,450 | ) | ||||||||
|
|
|
| |||||||||
Class C Shares | ||||||||||||
Issued | 2,067 | 17,247 | ||||||||||
Reinvested | – | – | ||||||||||
Redeemed | (21,135 | ) | (41,869 | ) | ||||||||
|
|
|
| |||||||||
Total Class C Shares | (19,068 | ) | (24,622 | ) | ||||||||
|
|
|
| |||||||||
Institutional Service Class Shares (a) | ||||||||||||
Issued | 358,807 | 1,145,861 | ||||||||||
Reinvested | – | 447 | ||||||||||
Redeemed | (288,099 | ) | (1,277,868 | ) | ||||||||
|
|
|
| |||||||||
Total Institutional Service Class Shares | 70,708 | (131,560 | ) | |||||||||
|
|
|
| |||||||||
Institutional Class Shares | ||||||||||||
Issued | 381 | (b) | – | |||||||||
Reinvested | – | (b) | – | |||||||||
Redeemed | – | (b) | – | |||||||||
|
|
|
| |||||||||
Total Institutional Class Shares | 381 | (b) | – | |||||||||
|
|
|
| |||||||||
Total change in shares | 20,547 | (266,632 | ) | |||||||||
|
|
|
| |||||||||
Amounts designated as “–” are zero or have been rounded to zero.
| (a) | Effective September 16, 2013, Fiduciary Shares were renamed Institutional Service Class Shares. |
| (b) | For the period from September 19, 2013 (commencement of operations) through January 31, 2014. |
The accompanying notes are an integral part of these financial statements.
137
Financial Highlights
Selected data for each share of capital outstanding throughout the periods indicated
Nationwide HighMark Small Cap Core Fund
| Operations | Distributions | Ratios/Supplemental Data | ||||||||||||||||||||||||||||||||||||||||||||||||||||||
| Net Asset Value, Beginning of Period | Net Investment Income (Loss) | Net Realized and Unrealized Gains (Losses) from Investments | Total from Operations | Net Investment Income | Total Distributions | Redemption Fees | Net Asset Value, End of Period | Total Return (a)(b) | Net Assets at End of Period | Ratio of Expenses to Average Net Assets (c) | Ratio of Net Investment Income (Loss) to Average Net Assets (c) | Ratio of Expenses (Prior to Reimbursements) to Average Net Assets (c)(d) | Portfolio Turnover (e) | |||||||||||||||||||||||||||||||||||||||||||
| Class A Shares | ||||||||||||||||||||||||||||||||||||||||||||||||||||||||
Six Months Ended January 31, 2014 (f) (Unaudited) | $ | 25.02 | (0.07 | ) | 2.58 | 2.51 | – | – | – | $ | 27.53 | 10.03% | $ | 11,844,174 | 1.62% | (0.55% | ) | 1.72% | 19.51% | |||||||||||||||||||||||||||||||||||||
Year Ended July 31, 2013 (f) | $ | 19.00 | (0.05 | ) | 6.07 | 6.02 | – | – | – | $ | 25.02 | 31.69% | $ | 11,549,088 | 1.62% | (0.22% | ) | 1.80% | 77.00% | |||||||||||||||||||||||||||||||||||||
Year Ended July 31, 2012 (f) | $ | 19.09 | (0.05 | ) | (0.04 | ) | (0.09 | ) | – | – | – | $ | 19.00 | (0.52% | ) | $ | 10,869,386 | 1.62% | (0.27% | ) | 1.96% | 106.00% | (g) | |||||||||||||||||||||||||||||||||
Year Ended July 31, 2011 (f) | $ | 14.47 | (0.11 | ) | 4.73 | 4.62 | – | – | – | $ | 19.09 | 32.00% | $ | 536,163 | 1.62% | (0.62% | ) | 2.01% | 67.00% | |||||||||||||||||||||||||||||||||||||
Year Ended July 31, 2010 (f) | $ | 11.80 | (0.08 | ) | 2.78 | 2.70 | (0.03 | ) | (0.03 | ) | – | $ | 14.47 | 22.86% | $ | 309,823 | 1.60% | (0.61% | ) | 2.04% | 78.00% | |||||||||||||||||||||||||||||||||||
Year Ended July 31, 2009 (f) | $ | 16.43 | 0.02 | (4.63 | ) | (4.61 | ) | (0.02 | ) | (0.02 | ) | – | $ | 11.80 | (28.08% | ) | $ | 226,761 | 1.57% | 0.18% | 2.10% | 61.00% | ||||||||||||||||||||||||||||||||||
| Class C Shares | ||||||||||||||||||||||||||||||||||||||||||||||||||||||||
Six Months Ended January 31, 2014 (f) (Unaudited) | $ | 24.14 | (0.15 | ) | 2.50 | 2.35 | – | – | – | $ | 26.49 | 9.73% | $ | 4,317,909 | 2.22% | (1.15% | ) | 2.30% | 19.51% | |||||||||||||||||||||||||||||||||||||
Year Ended July 31, 2013 (f) | $ | 18.45 | (0.17 | ) | 5.86 | 5.69 | – | – | – | $ | 24.14 | 30.84% | $ | 4,395,523 | 2.22% | (0.82% | ) | 2.30% | 77.00% | |||||||||||||||||||||||||||||||||||||
Year Ended July 31, 2012 (f) | $ | 18.65 | (0.16 | ) | (0.04 | ) | (0.20 | ) | – | – | – | $ | 18.45 | (1.07% | ) | $ | 3,812,858 | 2.22% | (0.87% | ) | 2.46% | 106.00% | (g) | |||||||||||||||||||||||||||||||||
Year Ended July 31, 2011 (f) | $ | 14.22 | (0.22 | ) | 4.65 | 4.43 | – | – | – | $ | 18.65 | 31.15% | $ | 216,583 | 2.22% | (1.22% | ) | 2.51% | 67.00% | |||||||||||||||||||||||||||||||||||||
Year Ended July 31, 2010 (f) | $ | 11.65 | (0.16 | ) | 2.73 | 2.57 | – | – | – | $ | 14.22 | 22.17% | $ | 77,175 | 2.20% | (1.21% | ) | 2.54% | 78.00% | |||||||||||||||||||||||||||||||||||||
Year Ended July 31, 2009 (f) | $ | 16.36 | (0.05 | ) | (4.66 | ) | (4.71 | ) | – | – | – | $ | 11.65 | (28.85% | ) | $ | 87,084 | 2.17% | (0.42% | ) | 2.60% | 61.00% | ||||||||||||||||||||||||||||||||||
| Institutional Service Class Shares (i) | ||||||||||||||||||||||||||||||||||||||||||||||||||||||||
Six Months Ended January 31, 2014 (f) (Unaudited) | $ | 25.35 | (0.04 | ) | 2.62 | 2.58 | – | – | – | $ | 27.93 | 10.18% | $ | 65,777,039 | 1.37% | (0.31% | ) | 1.47% | 19.51% | |||||||||||||||||||||||||||||||||||||
Year Ended July 31, 2013 (f) | $ | 19.20 | 0.01 | 6.15 | 6.16 | (0.01 | ) | (0.01 | ) | – | $ | 25.35 | 32.07% | $ | 57,898,679 | 1.34% | 0.06% | 1.56% | 77.00% | |||||||||||||||||||||||||||||||||||||
Year Ended July 31, 2012 (f) | $ | 19.24 | 0.01 | (0.05 | ) | (0.04 | ) | – | – | – | $ | 19.20 | (0.21% | ) | $ | 46,390,420 | 1.33% | 0.03% | 1.71% | 106.00% | (g) | |||||||||||||||||||||||||||||||||||
Year Ended July 31, 2011 (f) | $ | 14.54 | (0.06 | ) | 4.76 | 4.70 | – | – | – | $ | 19.24 | 32.33% | $ | 27,136,559 | 1.31% | (0.31% | ) | 1.76% | 67.00% | |||||||||||||||||||||||||||||||||||||
Year Ended July 31, 2010 (f) | $ | 11.85 | (0.04 | ) | 2.79 | 2.75 | (0.06 | ) | (0.06 | ) | – | $ | 14.54 | 23.32% | $ | 23,527,050 | 1.30% | (0.30% | ) | 1.79% | 78.00% | |||||||||||||||||||||||||||||||||||
Year Ended July 31, 2009 (f) | $ | 16.45 | 0.06 | (4.64 | ) | (4.58 | ) | (0.02 | ) | (0.02 | ) | – | $ | 11.85 | (27.90% | ) | $ | 22,084,240 | 1.27% | 0.48% | 1.85% | 61.00% | ||||||||||||||||||||||||||||||||||
| Institutional Class Shares | ||||||||||||||||||||||||||||||||||||||||||||||||||||||||
Period Ended January 31, 2014 (f)(h) (Unaudited) | $ | 26.26 | (0.02 | ) | 1.71 | 1.69 | – | – | – | $ | 27.95 | 6.44% | $ | 10,648 | 1.22% | (0.20% | ) | 1.29% | 19.51% | |||||||||||||||||||||||||||||||||||||
Amounts designated as “–” are zero or have been rounded to zero.
| (a) | Excludes sales charge. |
| (b) | Not annualized for periods less than one year. |
| (c) | Annualized for periods less than one year. |
| (d) | During the period, certain fees may have been waived and/or reimbursed. If such waivers/reimbursements had not occurred, the ratios would have been as indicated. |
| (e) | Portfolio turnover is calculated on the basis of the Fund as a whole without distinguishing among the classes of shares. |
| (f) | Per share calculations were performed using average shares method. |
| (g) | Excludes merger activity. |
| (h) | For the period from September 19, 2013 (commencement of operations) through January 31, 2014. Total return is calculated based on inception date of September 18, 2013 through January 31, 2014. |
| (i) | Effective September 16, 2013, Fiduciary Shares were renamed Institutional Service Class Shares. |
The accompanying notes are an integral part of these financial statements.
138
| Fund Commentary | Nationwide HighMark Value Fund |
For the semiannual period ended January 31, 2014, the Nationwide HighMark Value Fund (Institutional Service Class) returned 5.14%* versus 6.85 % for its primary benchmark, the S&P 500® Index and 4.63% for its secondary benchmark, the Russell 1000® Value Index. For broader comparison, the median return for the Fund’s closest Lipper peer category of Large-Cap Core Funds (consisting of 951 funds as of January 31, 2014) was 6.60% for the same time period.
*Performance prior to the Fund’s inception on September 16, 2013, is based on the performance of the Fund’s predecessor fund.
The market continues to experience a change in leadership in which yield-oriented “safe” sectors have given way to cyclical sectors. The Federal Reserve’s talk of a reduction in the quantitative easing (QE) program has been instrumental in ushering in the change in leadership as has a generally stronger macroeconomic environment. This dynamic has been coupled with investors crowding into high-dividend-producing equities, forcing these securities and sectors to unreasonable valuations.
Portfolio Performance
The Fund benefited during the six-month reporting period from a sector leadership change in the market to the less-expensive cyclical sectors of consumer discretionary and industrials, which we overweighted in the portfolio. We shifted the portfolio away from relatively expensive securities and sectors in the telecommunication services and utilities sectors due to weak fundamentals, low growth prospects and high valuations.
The largest detractors from Fund performance for the reporting period included sector selection in financials and stock selection in financials and energy. Although financials are listed as a top underweight, the industry within the financials sector driving the underweight is REITs, which are underweight by 400 basis points due to the high valuations being awarded to REITs. REITs are discounting very low interest rates and appear to be another area distorted by historically low interest rates.
We believe that investors, seeking yield in a low-interest-rate and slow-growth environment, drove historically stable, safe and yield-rich sectors to unreasonable valuations during the reporting period. Artificially low interest rates have caused a scarcity value for yield. Consequently, investors have sought high-dividend-producing equities, favoring fixed-income alternatives. Due to weak fundamentals, low growth prospects and high valuations, the Fund continued to underweight these sectors during the reporting period, having very low exposure to telecommunication services and utilities. The Fund shifted away from expensive securities during the reporting period to better opportunities, taking advantage of the market’s quest for yield. Rather than looking solely at dividend yield, we also sought companies with high and rising free cash flow yields to potentially drive future outperformance for the Fund.
Outlook and Positioning
The focus of the Fund is on long-term fundamentals and buying the best risk-reward opportunities available. This approach, we believe, will help us navigate market cycles, macroeconomic volatility and policy uncertainty. We believe business fundamentals and valuations ultimately determine investor returns, and this appears to be occurring as market leadership shifts. Therefore, investors expected to take advantage of macroeconomically driven volatility, focusing on long-term business fundamentals and seeking to buy undervalued assets in order to maximize long-term returns.
The Fund continues to be actively positioned in a “barbell” type of strategy — in other words, owning companies that are well positioned for a low growth environment on one end of the barbell and companies well positioned to take advantage of higher growth regions on the other end. Companies positioned for low growth typically have a controllable opportunity to drive shareholder returns. These returns can be generated through restructuring to drive operating margins; portfolio optimization through divestitures, spinoffs, and selective mergers and acquisitions (M&As); and increasing cash returns to shareholders through buybacks and dividends.
139
| Fund Commentary (con’t.) | Nationwide HighMark Value Fund |
Companies positioned for higher growth typically are multinational firms poised to take advantage of emerging markets growth. In managing the Fund, however, we do not chase or even count on macroeconomic growth, instead focusing on companies trading at low valuations with exposure to these higher-growth areas. This enables us to take advantage of a market that puts companies into buckets such as developed and emerging, assigning valuations accordingly. As a result, we find compelling opportunities in U.S. and foreign companies with exposure to higher-growth markets, which has taken the Fund’s exposure to American Depositary Receipts (ADRs) and local ordinary shares up to about 16% of the Fund’s holdings. We strive to buy companies offering high and improving returns on capital, strong free cash flow yields and clean balance sheets to provide financial flexibility in times of stress. All of these decisions are made to position the Fund with the opportunity to outperform regardless of the macroeconomic environment. When volatile and highly correlated markets experience macroeconomic conditions
that dominate over microeconomic company fundamentals, we try to be opportunistic and capitalize on market inefficiencies and mispricing that may occur. The Fund entered into financial futures contracts (“futures contracts”) to enable the Fund to more closely approximate the performance of its benchmark indices or for tactical hedging purposes.
Subadviser:
HighMark Capital Management, Inc.
Portfolio Managers:
Derek Izuel, Todd Lowenstein and Keith Stribling
The Fund is subject to the risks of investing in equity securities and risks associated with investing in stocks of mid-sized companies. Value funds may underperform other funds that use different investing styles. The Fund may invest in more-aggressive investments such as foreign securities (which are volatile, harder to price and less liquid than U.S. securities). Please refer to the summary prospectus for a more detailed explanation of the Fund’s principal risks.
A description of the benchmarks can be found on the Market Index Definitions page at the back of this book.
140
| Fund Overview (Unaudited) | Nationwide HighMark Value Fund |
Objective
The Fund seeks long-term capital growth; current income is a secondary objective.
Highlights
| Ÿ | The Fund (Institutional Service Class) returned 5.14% for the six-month reporting period ended January 31, 2014, underperforming the benchmark by 1.71% and the Lipper peer group by 1.46%. |
| Ÿ | The Fund benefited during the reporting period from a sector leadership change in the market to the less-expensive cyclical sectors of consumer discretionary and industrials, which we overweighted in the portfolio. |
| Ÿ | The largest detractors from Fund performance during the reporting period included sector selection in financials and stock selection in financials and energy. |
Asset Allocation†
| Common Stocks | 97.9% | |||
| Mutual Fund | 1.0% | |||
| Preferred Stock | 0.9% | |||
| Other assets in excess of liabilities | 0.2% | |||
| 100.0% |
Top Holdings††
| JPMorgan Chase & Co. | 4.2% | |||
| Procter & Gamble Co. (The) | 3.1% | |||
| Citigroup, Inc. | 3.0% | |||
| Microsoft Corp. | 2.8% | |||
| Baxter International, Inc. | 2.5% | |||
| UBS AG | 2.2% | |||
| Berkshire Hathaway, Inc., Class B | 2.2% | |||
| Roche Holding AG, ADR | 2.1% | |||
| Novartis AG, ADR | 2.1% | |||
| Comcast Corp., Class A | 2.0% | |||
| Other Holdings | 73.8% | |||
| 100.0% |
Top Industries††
| Diversified Financial Services | 9.9% | |||
| Oil, Gas & Consumable Fuels | 9.0% | |||
| Capital Markets | 5.7% | |||
| Insurance | 5.6% | |||
| Media | 5.0% | |||
| Software | 4.7% | |||
| Health Care Providers & Services | 4.2% | |||
| Pharmaceuticals | 4.1% | |||
| Health Care Equipment & Supplies | 4.0% | |||
| Household Products | 3.9% | |||
| Other Industries | 43.9% | |||
| 100.0% |
| † | Percentages indicated are based upon net assets as of January 31, 2014. |
| †† | Percentages indicated are based upon total investments as of January 31, 2014. |
141
| Fund Performance | Nationwide HighMark Value Fund |
Average Annual Total Return
(For periods ended January 31, 2014)
| Six Months* | 1 Yr. | 5 Yr. | 10 Yr. | |||||||||||||||
| Class A | w/o SC1 | 5.01% | 17.51% | 17.73% | 6.30% | |||||||||||||
| w/SC2 | -0.74% | 11.02% | 16.41% | 5.70% | ||||||||||||||
| Class C | w/o SC1 | 4.76% | 16.88% | 17.05% | 5.67% | |||||||||||||
| w/SC3 | 3.76% | 15.88% | 17.05% | 5.67% | ||||||||||||||
| Class U4 | w/o SC | 5.25% | 18.03% | 18.11% | 6.62% | |||||||||||||
| Institutional Service Class4,5 | w/o SC | 5.14% | 17.83% | 18.02% | 6.58% | |||||||||||||
| Institutional Class4 | w/o SC | 1.52% | 6 | — | — | — | ||||||||||||
All figures showing the effect of a sales charge (SC) reflect the maximum charge possible, because it has the most significant effect on performance data.
| * | Not annualized. |
| 1 | These returns do not reflect the effects of SCs. |
| 2 | For the period from September 16, 2013 through January 31, 2014 a front-end sales charge of 5.75% was deducted. Prior to September 16, 2013, a front-end sales charge of 5.50% was deducted. |
| 3 | A 1.00% CDSC was deducted from the one year return because it is charged when you sell Class C shares within the first year after purchase. |
| 4 | Not subject to any SCs. |
| 5 | Effective September 16, 2013 Fiduciary Shares were renamed Institutional Service Class Shares. |
| 6 | Since inception date of September 18, 2013. Not Annualized. |
Expense Ratios
| Expense Ratio* | ||
| Class A | 1.25% | |
| Class C | 1.75% | |
| Class U | 0.75% | |
| Institutional Service Class | 1.00% | |
| Institutional Class | 0.75% |
| * | Current effective prospectus dated September 16, 2013. Please see the Fund’s most recent prospectus for details. |
142
| Fund Performance | Nationwide HighMark Value Fund |
Performance of a $10,000 Investment
Investment return and principal value will fluctuate, and when redeemed, shares may be worth more or less than original cost. Past performance is no guarantee of future results and does not reflect the deduction of taxes that a shareholder would pay on fund distributions or the redemption of fund shares. Investing in mutual funds involves market risk, including loss of principal. Performance returns assume the reinvestment of all distributions.
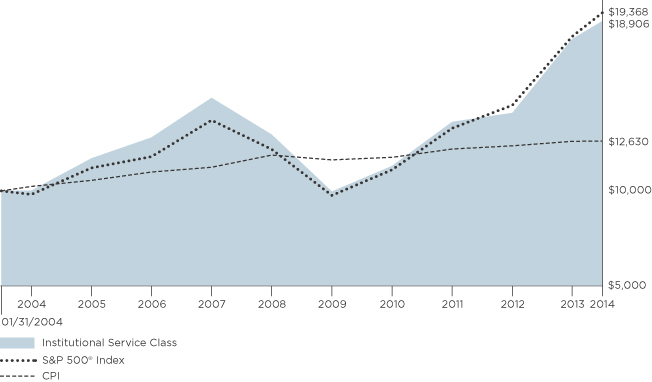
Comparative performance of $10,000 invested in Institutional Service Class shares of the Nationwide HighMark Value Fund versus the S&P 500® Index and the Consumer Price Index (CPI) over the 10-year period ended 1/31/14. Fund performance prior to the Fund’s inception on 9/16/13 is based on the Fund’s predecessor Fund. Unlike the Fund, the performance for these unmanaged indexes does not reflect any fees, expenses, or sales charges. One cannot invest directly in a market index. A description of the benchmarks can be found on the Market Index Definitions page at the back of this book.
143
| Shareholder Expense Example | Nationwide HighMark Value Fund |
As a shareholder of the Fund, you incur two types of costs: (1) transaction costs, including sales charges (loads) paid on purchase payments and redemption fees; and (2) ongoing costs, including investment advisory fees, administration fees, distribution fees and other Fund expenses. The examples below are intended to help you understand your ongoing costs (in dollars) of investing in the Fund and to compare these costs with the ongoing costs of investing in other mutual funds. Per Securities and Exchange Commission (“SEC”) requirements, the examples assume that you had a $1,000 investment in the Class at the beginning of the reporting period (August 1, 2013) and continued to hold your shares at the end of the reporting period (January 31, 2014).
Actual Expenses
For each Class of the Fund in the table below, the first line provides information about actual account values and actual expenses. You may use the information in this line, together with the amount you invested, to estimate the expenses that you paid from August 1, 2013 through January 31, 2014. Simply divide your account value by $1,000 (for example, an $8,600 account value divided by $1,000 = 8.6), then multiply the result by the number in the first line of each Class under the heading entitled “Expenses Paid During Period” to estimate the expenses you paid on your account during this period.
Hypothetical Expenses for Comparison Purposes
The second line of each Class in the table below provides information about hypothetical account values and hypothetical expenses based on the Class’ actual expense ratio and an assumed rate of return of 5% per year before expenses, which is not the Class’ actual return. The hypothetical account values and expenses may not be used to estimate the actual ending account balance or expenses you paid for the period from August 1, 2013 through January 31, 2014. You may use this information to compare the ongoing costs of investing in the Class of the Fund and other funds. To do so, compare this 5% hypothetical example with the 5% hypothetical examples that appear in the shareholder reports of the other funds.
Please note that the expenses shown in the table are meant to highlight your ongoing costs only and do not reflect any transaction costs, such as sales charges (loads) or redemption fees. If these transaction costs were included, your costs would have been higher. Therefore, the second line for each Class in the table is useful in comparing ongoing costs only, and will not help you determine the relative total costs of owning different funds. The examples also assume all dividends and distributions are reinvested.
Schedule of Shareholder Expenses
Expense Analysis of a $1,000 Investment
Nationwide HighMark Value Fund January 31, 2014 | Beginning Account Value ($) 08/01/13 | Ending Account Value ($) 01/31/14 | Expenses Paid During Period ($) 08/01/13 - 01/31/14 | Expense Ratio During Period (%) 08/01/13 - 01/31/14 | ||||||||
| Class A Shares | Actual | a | 1,000.00 | 1,050.10 | 6.41 | 1.24 | ||||||
| Hypothetical | a,b | 1,000.00 | 1,018.95 | 6.31 | 1.24 | |||||||
| Class C Shares | Actual | a | 1,000.00 | 1,047.60 | 9.14 | 1.77 | ||||||
| Hypothetical | a,b | 1,000.00 | 1,016.28 | 9.00 | 1.77 | |||||||
| Class U Shares | Actual | a | 1,000.00 | 1,052.50 | 3.98 | 0.77 | ||||||
| Hypothetical | a,b | 1,000.00 | 1,021.32 | 3.92 | 0.77 | |||||||
| Institutional Service Class Sharesc | Actual | a | 1,000.00 | 1,051.40 | 5.12 | 0.99 | ||||||
| Hypothetical | a,b | 1,000.00 | 1,020.21 | 5.04 | 0.99 | |||||||
| Institutional Class Shares | Actual | d | 1,000.00 | 1,015.20 | 2.76 | 0.74 | ||||||
| Hypothetical | a,b | 1,000.00 | 1,021.48 | 3.77 | 0.74 | |||||||
| a | Expenses are equal to the Fund’s annualized expense ratio multiplied by the average account value from August 1, 2013 through January 31, 2014 multiplied to reflect one-half year period. The expense ratio presented represents a six-month, annualized ratio in accordance with Securities and Exchange Commission guidelines. |
| b | Represents the hypothetical 5% return before expenses. |
| c | Effective September 16, 2013, Fiduciary Shares were renamed Institutional Service Class Shares. |
| d | Actual expenses are equal to the Fund’s annualized expense ratio multiplied by the average account value from September 19, 2013 through January 31, 2014 to reflect the period from commencement of operations. |
144
Statement of Investments
January 31, 2014 (Unaudited)
Nationwide HighMark Value Fund
| Common Stocks 97.9% | ||||||||||
| Shares | Market Value | |||||||||
| ||||||||||
Aerospace & Defense 3.2% |
| |||||||||
Airbus Group NV | 47,650 | $ | 3,375,780 | |||||||
Rockwell Collins, Inc. | 45,050 | 3,403,978 | ||||||||
United Technologies Corp. | 36,450 | 4,156,029 | ||||||||
|
| |||||||||
| 10,935,787 | ||||||||||
|
| |||||||||
| ||||||||||
Air Freight & Logistics 1.7% |
| |||||||||
United Parcel Service, Inc., Class B | 61,200 | 5,828,076 | ||||||||
|
| |||||||||
| ||||||||||
Auto Components 1.0% |
| |||||||||
TRW Automotive Holdings Corp.* | 47,500 | 3,522,125 | ||||||||
|
| |||||||||
| ||||||||||
Beverages 1.5% |
| |||||||||
Carlsberg A/S, ADR-DK | 264,725 | 5,157,372 | ||||||||
|
| |||||||||
| ||||||||||
Capital Markets 5.7% |
| |||||||||
Goldman Sachs Group, Inc. (The) | 40,750 | 6,687,890 | ||||||||
Lazard Ltd., Class A | 123,775 | 5,292,619 | ||||||||
UBS AG REG* | 380,225 | 7,555,071 | ||||||||
|
| |||||||||
| 19,535,580 | ||||||||||
|
| |||||||||
| ||||||||||
Chemicals 0.9% |
| |||||||||
Mosaic Co. (The) | 72,450 | 3,235,617 | ||||||||
|
| |||||||||
| ||||||||||
Commercial Banks 3.8% |
| |||||||||
BB&T Corp. | 149,575 | 5,595,601 | ||||||||
CIT Group, Inc. | 92,275 | 4,295,401 | ||||||||
First Republic Bank | 62,850 | 3,050,110 | ||||||||
|
| |||||||||
| 12,941,112 | ||||||||||
|
| |||||||||
| ||||||||||
Communications Equipment 1.3% |
| |||||||||
QUALCOMM, Inc. | 61,975 | 4,599,785 | ||||||||
|
| |||||||||
| ||||||||||
Computers & Peripherals 2.6% |
| |||||||||
EMC Corp. | 205,100 | 4,971,624 | ||||||||
Western Digital Corp. | 44,500 | 3,834,565 | ||||||||
|
| |||||||||
| 8,806,189 | ||||||||||
|
| |||||||||
| ||||||||||
Construction & Engineering 1.7% |
| |||||||||
Chicago Bridge & Iron Co. NV | 43,950 | 3,295,811 | ||||||||
Vinci SA | 39,650 | 2,592,685 | ||||||||
|
| |||||||||
| 5,888,496 | ||||||||||
|
| |||||||||
| ||||||||||
Construction Materials 1.0% |
| |||||||||
Holcim Ltd. REG* | 45,650 | 3,313,392 | ||||||||
|
| |||||||||
| ||||||||||
Consumer Finance 1.4% |
| |||||||||
Capital One Financial Corp. | 67,475 | 4,764,410 | ||||||||
|
| |||||||||
| ||||||||||
Diversified Financial Services 9.9% |
| |||||||||
Citigroup, Inc. | 214,350 | 10,166,621 | ||||||||
IntercontinentalExchange Group, Inc. | 26,700 | 5,574,693 | ||||||||
JPMorgan Chase & Co. | 260,650 | 14,429,584 | ||||||||
Pargesa Holding SA | 46,000 | 3,701,024 | ||||||||
|
| |||||||||
| 33,871,922 | ||||||||||
|
| |||||||||
| Common Stocks (continued) | ||||||||||
| Shares | Market Value | |||||||||
| ||||||||||
Electric Utilities 0.7% |
| |||||||||
Edison International | 52,500 | $ | 2,528,400 | |||||||
|
| |||||||||
| ||||||||||
Electrical Equipment 1.3% |
| |||||||||
Eaton Corp. PLC | 59,550 | 4,352,509 | ||||||||
|
| |||||||||
| ||||||||||
Electronic Equipment, Instruments & Components 1.1% |
| |||||||||
Hitachi Ltd., ADR-JP | 49,150 | 3,767,348 | ||||||||
|
| |||||||||
| ||||||||||
Energy Equipment & Services 1.5% |
| |||||||||
Ensco PLC, Class A | 46,950 | 2,364,871 | ||||||||
National Oilwell Varco, Inc. | 39,175 | 2,938,517 | ||||||||
|
| |||||||||
| 5,303,388 | ||||||||||
|
| |||||||||
| ||||||||||
Food Products 1.8% |
| |||||||||
Mondelez International, Inc., Class A | 192,175 | 6,293,731 | ||||||||
|
| |||||||||
| ||||||||||
Health Care Equipment & Supplies 4.0% |
| |||||||||
Baxter International, Inc. | 126,375 | 8,631,412 | ||||||||
St. Jude Medical, Inc. | 82,100 | 4,985,933 | ||||||||
|
| |||||||||
| 13,617,345 | ||||||||||
|
| |||||||||
| ||||||||||
Health Care Providers & Services 4.2% |
| |||||||||
Express Scripts Holding Co.* | 53,900 | 4,025,791 | ||||||||
HCA Holdings, Inc.* | 84,000 | 4,222,680 | ||||||||
UnitedHealth Group, Inc. | 84,425 | 6,102,239 | ||||||||
|
| |||||||||
| 14,350,710 | ||||||||||
|
| |||||||||
| ||||||||||
Household Products 3.9% |
| |||||||||
Henkel AG & Co. KGaA, ADR-DE | 28,650 | 2,787,931 | ||||||||
Procter & Gamble Co. (The) | 138,675 | 10,625,279 | ||||||||
|
| |||||||||
| 13,413,210 | ||||||||||
|
| |||||||||
| ||||||||||
Industrial Conglomerates 0.9% |
| |||||||||
Jardine Matheson Holdings Ltd., ADR-HK | 55,400 | 2,972,210 | ||||||||
|
| |||||||||
| ||||||||||
Information Technology Services 1.4% |
| |||||||||
International Business Machines Corp. | 28,200 | 4,982,376 | ||||||||
|
| |||||||||
| ||||||||||
Insurance 5.6% |
| |||||||||
American International Group, Inc. | 144,100 | 6,911,036 | ||||||||
Berkshire Hathaway, Inc., Class B* | 66,550 | 7,426,980 | ||||||||
MetLife, Inc. | 97,425 | 4,778,696 | ||||||||
|
| |||||||||
| 19,116,712 | ||||||||||
|
| |||||||||
| ||||||||||
Internet & Catalog Retail 0.9% |
| |||||||||
Liberty Interactive Corp., Series A* | 114,400 | 3,055,624 | ||||||||
|
| |||||||||
| ||||||||||
Machinery 3.6% |
| |||||||||
CNH Industrial NV* | 232,487 | 2,450,413 | ||||||||
Joy Global, Inc. | 63,000 | 3,325,770 | ||||||||
Stanley Black & Decker, Inc. | 48,000 | 3,715,200 | ||||||||
Timken Co. | 51,500 | 2,900,995 | ||||||||
|
| |||||||||
| 12,392,378 | ||||||||||
|
| |||||||||
145
Statement of Investments (Continued)
January 31, 2014 (Unaudited)
Nationwide HighMark Value Fund (Continued)
| Common Stocks (continued) | ||||||||||
| Shares | Market Value | |||||||||
| ||||||||||
Media 5.0% |
| |||||||||
Comcast Corp., Class A | 133,700 | $ | 6,999,195 | |||||||
DIRECTV* | 61,000 | 4,235,230 | ||||||||
Liberty Media Corp., Series A* | 22,500 | 2,960,775 | ||||||||
News Corp., Class A* | 177,950 | 2,840,082 | ||||||||
|
| |||||||||
| 17,035,282 | ||||||||||
|
| |||||||||
| ||||||||||
Metals & Mining 0.6% |
| |||||||||
BHP Billiton PLC, ADR-UK | 34,900 | 2,057,704 | ||||||||
|
| |||||||||
| ||||||||||
Multiline Retail 1.1% |
| |||||||||
Target Corp. | 64,725 | 3,666,024 | ||||||||
|
| |||||||||
| ||||||||||
Multi-Utilities 1.1% |
| |||||||||
PG&E Corp. | 92,200 | 3,886,230 | ||||||||
|
| |||||||||
| ||||||||||
Office Electronics 1.1% |
| |||||||||
Xerox Corp. | 345,850 | 3,752,473 | ||||||||
|
| |||||||||
| ||||||||||
Oil, Gas & Consumable Fuels 8.9% |
| |||||||||
Apache Corp. | 48,750 | 3,912,675 | ||||||||
Chevron Corp. | 57,475 | 6,415,934 | ||||||||
Occidental Petroleum Corp. | 69,150 | 6,055,465 | ||||||||
Royal Dutch Shell PLC, ADR-NL | 70,950 | 5,167,289 | ||||||||
Suncor Energy, Inc. | 201,050 | 6,600,472 | ||||||||
WPX Energy, Inc.* | 137,725 | 2,623,661 | ||||||||
|
| |||||||||
| 30,775,496 | ||||||||||
|
| |||||||||
| ||||||||||
Pharmaceuticals 4.1% |
| |||||||||
Novartis AG, ADR-CH | 89,625 | 7,086,649 | ||||||||
Roche Holding AG, ADR-CH | 103,350 | 7,089,810 | ||||||||
|
| |||||||||
| 14,176,459 | ||||||||||
|
| |||||||||
| ||||||||||
Real Estate Investment Trusts (REITs) 0.9% |
| |||||||||
Weyerhaeuser Co. | 105,500 | 3,152,340 | ||||||||
|
| |||||||||
| ||||||||||
Road & Rail 1.2% |
| |||||||||
Hertz Global Holdings, Inc.* | 156,475 | 4,071,479 | ||||||||
|
| |||||||||
| ||||||||||
Semiconductors & Semiconductor Equipment 0.7% |
| |||||||||
Marvell Technology Group Ltd. | 171,400 | 2,559,002 | ||||||||
|
| |||||||||
| ||||||||||
Software 4.7% |
| |||||||||
Microsoft Corp. | 255,882 | 9,685,134 | ||||||||
Oracle Corp. | 178,500 | 6,586,650 | ||||||||
|
| |||||||||
| 16,271,784 | ||||||||||
|
| |||||||||
| ||||||||||
Tobacco 1.9% |
| |||||||||
Philip Morris International, Inc. | 84,525 | 6,604,784 | ||||||||
|
| |||||||||
Total Common Stocks (cost $295,669,114) |
| 336,554,861 | ||||||||
|
| |||||||||
| Preferred Stock 0.9% | ||||||||||
| Shares | Market Value | |||||||||
| ||||||||||
Automobiles 0.9% |
| |||||||||
Porsche Automobil Holding SE | 33,750 | $ | 3,292,676 | |||||||
|
| |||||||||
Total Preferred Stock (cost $2,902,767) |
| 3,292,676 | ||||||||
|
| |||||||||
| Mutual Fund 1.0% | ||||||||||
Money Market Fund 1.0% | ||||||||||
Fidelity Institutional Money Market Fund — Institutional Class, 0.08% (a) | 3,404,520 | 3,404,520 | ||||||||
|
| |||||||||
Total Mutual Fund (cost $3,404,520) |
| 3,404,520 | ||||||||
|
| |||||||||
Total Investments |
| 343,252,057 | ||||||||
Other assets in excess of liabilities — 0.2% |
| 607,544 | ||||||||
|
| |||||||||
NET ASSETS — 100.0% |
| $ | 343,859,601 | |||||||
|
| |||||||||
| * | Denotes a non-income producing security. |
| (a) | Represents 7-day effective yield as of January 31, 2014. |
| (b) | See notes to financial statements for tax cost and unrealized appreciation/(depreciation) of securities. |
| ADR | American Depositary Receipt |
| AG | Stock Corporation |
| A/S | Minimum Capital Public Traded Company |
| CH | Switzerland |
| DE | Germany |
| DK | Denmark |
| HK | Hong Kong |
| JP | Japan |
| KGaA | Limited Partnership with shares |
| Ltd. | Limited |
| NL | Netherlands |
| NV | Public Traded Company |
| PLC | Public Limited Company |
| REG | Registered Shares |
| REIT | Real Estate Investment Trust |
| SA | Stock Company |
| SE | European Public Limited Liability Company |
| UK | United Kingdom |
The accompanying notes are an integral part of these financial statements.
146
Statement of Assets and Liabilities
January 31, 2014 (Unaudited)
| Nationwide HighMark Value Fund | ||||||
Assets: | ||||||
Investments, at value (cost $301,976,401) | $ | 343,252,057 | ||||
Dividends receivable | 103,183 | |||||
Receivable for investments sold | 2,899,541 | |||||
Receivable for capital shares issued | 282,625 | |||||
Reclaims receivable | 208,112 | |||||
Prepaid expenses | 14,203 | |||||
|
| |||||
Total Assets | 346,759,721 | |||||
|
| |||||
Liabilities: | ||||||
Payable for investments purchased | 1,897,748 | |||||
Payable for capital shares redeemed | 544,977 | |||||
Accrued expenses and other payables: | ||||||
Investment advisory fees | 180,832 | |||||
Fund administration fees | 11,432 | |||||
Distribution fees | 22,350 | |||||
Administrative servicing fees | 171,154 | |||||
Accounting and transfer agent fees | 14,884 | |||||
Trustee fees | 4,781 | |||||
Deferred compensation (Note 2) | 23,975 | |||||
Custodian fees | 1,904 | |||||
Compliance program costs (Note 3) | 1,559 | |||||
Professional fees | 15,803 | |||||
Printing fees | 8,113 | |||||
Other | 608 | |||||
|
| |||||
Total Liabilities | 2,900,120 | |||||
|
| |||||
Net Assets | $ | 343,859,601 | ||||
|
| |||||
Represented by: | ||||||
Capital | $ | 306,111,025 | ||||
Accumulated distributions in excess of net investment income | (3,417,202 | ) | ||||
Accumulated net realized losses from investment and foreign currency transactions | (108,745 | ) | ||||
Net unrealized appreciation/(depreciation) from investments | 41,275,656 | |||||
Net unrealized appreciation/(depreciation) from translation of assets and liabilities denominated in foreign currencies | (1,133 | ) | ||||
|
| |||||
Net Assets | $ | 343,859,601 | ||||
|
| |||||
Net Assets: | ||||||
Class A Shares | $ | 86,349,098 | ||||
Class C Shares | 3,706,220 | |||||
Class U Shares | 127,059,931 | |||||
Institutional Service Class Shares | 126,732,595 | |||||
Institutional Class Shares | 11,757 | |||||
|
| |||||
Total | $ | 343,859,601 | ||||
|
| |||||
147
Statement of Assets and Liabilities (Continued)
January 31, 2014 (Unaudited)
| Nationwide HighMark Value Fund | ||||||
Shares Outstanding (unlimited number of shares authorized): | ||||||
Class A Shares | 5,684,055 | |||||
Class C Shares | 253,557 | |||||
Class U Shares | 8,326,218 | |||||
Institutional Service Class Shares | 8,309,547 | |||||
Institutional Class Shares | 771 | |||||
|
| |||||
Total | 22,574,148 | |||||
|
| |||||
Net asset value and redemption price per share (Net assets by class divided by shares outstanding by class, respectively): | ||||||
Class A Shares (a) | $ | 15.19 | ||||
Class C Shares (b) | $ | 14.62 | ||||
Class U Shares | $ | 15.26 | ||||
Institutional Service Class Shares | $ | 15.25 | ||||
Institutional Class Shares | $ | 15.25 | ||||
Maximum offering price per share (100%/(100%-maximum sales charge) of net asset value adjusted to the nearest cent): | ||||||
Class A Shares | $ | 16.12 | ||||
|
| |||||
Maximum Sales Charge: | ||||||
Class A Shares | 5.75 | % | ||||
|
| |||||
| (a) | For Class A Shares, the redemption price per share is reduced by 1.00% on sales of shares of original purchases of $1,000,000 or more or that were not subject to a front-end sales charge made with 18 months of the purchase date. |
| (b) | For Class C Shares, the redemption price per share is reduced by 1.00% for shares held less than 1 year. |
The accompanying notes are an integral part of these financial statements.
148
Statement of Operations
For the Six Months Ended January 31, 2014 (Unaudited)
| Nationwide HighMark Value Fund | ||||||
INVESTMENT INCOME: | ||||||
Dividend income | $ | 2,929,626 | ||||
Foreign tax withholding | (14,762 | ) | ||||
|
| |||||
Total Income | 2,914,864 | |||||
|
| |||||
EXPENSES: | ||||||
Investment advisory fees | 1,042,729 | |||||
Fund administration fees | 160,149 | |||||
Distribution fees Class A | 112,965 | |||||
Distribution fees Class B (a) | 831 | |||||
Distribution fees Class C | 19,226 | |||||
Administrative servicing fees Class A | 112,965 | |||||
Administrative servicing fees Class B (a) | 277 | |||||
Administrative servicing fees Institutional Service Class (b) | 156,187 | |||||
Registration and filing fees | 29,255 | |||||
Professional fees | 23,784 | |||||
Printing fees | 20,622 | |||||
Trustee fees | 6,609 | |||||
Custodian fees | 7,910 | |||||
Accounting and transfer agent fees | 37,074 | |||||
Compliance program costs (Note 3) | 1,957 | |||||
Other | 19,690 | |||||
|
| |||||
Total expenses before earnings credit, fees waived, and expenses reimbursed | 1,752,230 | |||||
|
| |||||
Earnings credit (Note 5) | (51 | ) | ||||
Administrative servicing fees voluntarily waived — Class A (Note 3) | (11,137 | ) | ||||
Administrative servicing fees voluntarily waived — Institutional Service Class (b) (Note 3) | (16,216 | ) | ||||
Expenses reimbursed by adviser (Note 3) | (18,823 | ) | ||||
|
| |||||
Net Expenses | 1,706,003 | |||||
|
| |||||
NET INVESTMENT INCOME | 1,208,861 | |||||
|
| |||||
REALIZED/UNREALIZED GAINS (LOSSES) FROM INVESTMENTS: | ||||||
Net realized gains from investment transactions | 25,609,795 | |||||
Net realized losses from foreign currency transactions (Note 2) | (6,260 | ) | ||||
|
| |||||
Net realized gains from investment and foreign currency transactions | 25,603,535 | |||||
|
| |||||
Net change in unrealized appreciation/(depreciation) from investments | (10,011,606 | ) | ||||
Net change in unrealized appreciation/(depreciation) from translation of assets and liabilities denominated in foreign currencies | (4,341 | ) | ||||
|
| |||||
Net change in unrealized appreciation/(depreciation) from investments and translation of assets and liabilities denominated in foreign currencies | (10,015,947 | ) | ||||
|
| |||||
Net realized/unrealized gains from investments, foreign currency transactions, and translation of assets and liabilities denominated in foreign currencies | 15,587,588 | |||||
|
| |||||
CHANGE IN NET ASSETS RESULTING FROM OPERATIONS | $ | 16,796,449 | ||||
|
| |||||
| (a) | Effective September 16, 2013, Class B Shares were converted into Class A Shares. |
| (b) | Effective September 16, 2013, Fiduciary Shares were renamed Institutional Service Class Shares. |
The accompanying notes are an integral part of these financial statements.
149
Statements of Changes in Net Assets
| Nationwide HighMark Value Fund | ||||||||||||
| Six Months Ended January 31, 2014 (Unaudited) | Year Ended | |||||||||||
Operations: | ||||||||||||
Net investment income | $ | 1,208,861 | $ | 4,221,800 | ||||||||
Net realized gains from investment and foreign currency transactions | 25,603,535 | 64,996,092 | ||||||||||
Net change in unrealized appreciation/(depreciation) from investments and translation of assets and liabilities denominated in foreign currencies | (10,015,947 | ) | 15,236,336 | |||||||||
|
|
|
| |||||||||
Change in net assets resulting from operations | 16,796,449 | 84,454,228 | ||||||||||
|
|
|
| |||||||||
Distributions to Shareholders From: | ||||||||||||
Net investment income: | ||||||||||||
Class A | (1,111,182 | ) | (868,709 | ) | ||||||||
Class B (a) | – | (4,739 | ) | |||||||||
Class C | (38,056 | ) | (18,375 | ) | ||||||||
Class U | (1,868,788 | ) | (1,503,776 | ) | ||||||||
Institutional Service Class (b) | (1,607,865 | ) | (1,859,523 | ) | ||||||||
Institutional Class | (172 | )(c) | – | |||||||||
Net realized gains: | ||||||||||||
Class A | (16,926,608 | ) | (6,894,754 | ) | ||||||||
Class B (a) | – | (82,018 | ) | |||||||||
Class C | (739,307 | ) | (303,289 | ) | ||||||||
Class U | (24,016,009 | ) | (8,404,072 | ) | ||||||||
Institutional Service Class (b) | (22,294,154 | ) | (12,447,024 | ) | ||||||||
Institutional Class | (2,209 | )(c) | – | |||||||||
|
|
|
| |||||||||
Change in net assets from shareholder distributions | (68,604,350 | ) | (32,386,279 | ) | ||||||||
|
|
|
| |||||||||
Change in net assets from capital transactions | 46,602,599 | (38,328,884 | ) | |||||||||
|
|
|
| |||||||||
Change in net assets | (5,205,302 | ) | 13,739,065 | |||||||||
|
|
|
| |||||||||
Net Assets: | ||||||||||||
Beginning of period | 349,064,903 | 335,325,838 | ||||||||||
|
|
|
| |||||||||
End of period | $ | 343,859,601 | $ | 349,064,903 | ||||||||
|
|
|
| |||||||||
Accumulated distributions in excess of net investment income at end of period | $ | (3,417,202 | ) | $ | – | |||||||
|
|
|
| |||||||||
CAPITAL TRANSACTIONS: | ||||||||||||
Class A Shares | ||||||||||||
Proceeds from shares issued | $ | 1,352,176 | $ | 1,347,842 | ||||||||
Dividends reinvested | 16,978,066 | 7,275,918 | ||||||||||
Cost of shares redeemed | (7,565,073 | ) | (15,745,647 | ) | ||||||||
|
|
|
| |||||||||
Total Class A Shares | 10,765,169 | (7,121,887 | ) | |||||||||
|
|
|
| |||||||||
Class B Shares (a) | ||||||||||||
Proceeds from shares issued | – | – | ||||||||||
Dividends reinvested | – | 83,105 | ||||||||||
Cost of shares redeemed | (913,887 | ) | (493,107 | ) | ||||||||
|
|
|
| |||||||||
Total Class B Shares | (913,887 | ) | (410,002 | ) | ||||||||
|
|
|
| |||||||||
| (a) | Effective September 16, 2013, Class B Shares were converted into Class A Shares. |
| (b) | Effective September 16, 2013, Fiduciary Shares were renamed Institutional Service Class Shares. |
| (c) | For the period from September 19, 2013 (commencement of operations) through January 31, 2014. |
150
Statements of Changes in Net Assets (Continued)
| Nationwide HighMark Value Fund | ||||||||||||
| Six Months Ended January 31, 2014 (Unaudited) | Year Ended | |||||||||||
CAPITAL TRANSACTIONS: (continued) | ||||||||||||
Class C Shares | ||||||||||||
Proceeds from shares issued | $ | 217,897 | $ | 187,337 | ||||||||
Dividends reinvested | 757,325 | 308,590 | ||||||||||
Cost of shares redeemed | (527,605 | ) | (977,349 | ) | ||||||||
|
|
|
| |||||||||
Total Class C Shares | 447,617 | (481,422 | ) | |||||||||
|
|
|
| |||||||||
Class U Shares | ||||||||||||
Proceeds from shares issued | 5,377,912 | 16,337,730 | ||||||||||
Dividends reinvested | 25,884,797 | 9,907,841 | ||||||||||
Cost of shares redeemed | (8,572,549 | ) | (19,448,653 | ) | ||||||||
|
|
|
| |||||||||
Total Class U Shares | 22,690,160 | 6,796,918 | ||||||||||
|
|
|
| |||||||||
Institutional Service Class Shares (b) | ||||||||||||
Proceeds from shares issued | 18,846,396 | 14,668,770 | ||||||||||
Dividends reinvested | 21,556,338 | 12,856,808 | ||||||||||
Cost of shares redeemed | (26,803,127 | ) | (64,638,069 | ) | ||||||||
|
|
|
| |||||||||
Total Institutional Service Class Shares | 13,599,607 | (37,112,491 | ) | |||||||||
|
|
|
| |||||||||
Institutional Class Shares | ||||||||||||
Proceeds from shares issued | 11,552 | (c) | – | |||||||||
Dividends reinvested | 2,381 | (c) | – | |||||||||
Cost of shares redeemed | – | (c) | – | |||||||||
|
|
|
| |||||||||
Total Institutional Class Shares | 13,933 | (c) | – | |||||||||
|
|
|
| |||||||||
Change in net assets from capital transactions | $ | 46,602,599 | $ | (38,328,884 | ) | |||||||
|
|
|
| |||||||||
SHARE TRANSACTIONS: | ||||||||||||
Class A Shares | ||||||||||||
Issued | 75,558 | 80,730 | ||||||||||
Reinvested | 1,114,778 | 475,129 | ||||||||||
Redeemed | (431,967 | ) | (947,843 | ) | ||||||||
|
|
|
| |||||||||
Total Class A Shares | 758,369 | (391,984 | ) | |||||||||
|
|
|
| |||||||||
Class B Shares (a) | ||||||||||||
Issued | – | – | ||||||||||
Reinvested | – | 5,587 | ||||||||||
Redeemed | (51,071 | ) | (30,498 | ) | ||||||||
|
|
|
| |||||||||
Total Class B Shares | (51,071 | ) | (24,911 | ) | ||||||||
|
|
|
| |||||||||
Class C Shares | ||||||||||||
Issued | 12,693 | 11,314 | ||||||||||
Reinvested | 51,659 | 20,853 | ||||||||||
Redeemed | (30,601 | ) | (61,093 | ) | ||||||||
|
|
|
| |||||||||
Total Class C Shares | 33,751 | (28,926 | ) | |||||||||
|
|
|
| |||||||||
| (a) | Effective September 16, 2013, Class B Shares were converted into Class A Shares. |
| (b) | Effective September 16, 2013, Fiduciary Shares were renamed Institutional Service Class Shares. |
| (c) | For the period from September 19, 2013 (commencement of operations) through January 31, 2014. |
151
Statements of Changes in Net Assets (Continued)
| Nationwide HighMark Value Fund | ||||||||||||
| Six Months Ended January 31, 2014 (Unaudited) | Year Ended | |||||||||||
SHARE TRANSACTIONS: (continued) | ||||||||||||
Class U Shares | ||||||||||||
Issued | 304,270 | 980,824 | ||||||||||
Reinvested | 1,692,923 | 642,770 | ||||||||||
Redeemed | (484,634 | ) | (1,167,646 | ) | ||||||||
|
|
|
| |||||||||
Total Class U Shares | 1,512,559 | 455,948 | ||||||||||
|
|
|
| |||||||||
Institutional Service Class Shares (b) | ||||||||||||
Issued | 1,162,939 | 887,082 | ||||||||||
Reinvested | 1,410,755 | 837,907 | ||||||||||
Redeemed | (1,499,550 | ) | (3,850,323 | ) | ||||||||
|
|
|
| |||||||||
Total Institutional Service Class Shares | 1,074,144 | (2,125,334 | ) | |||||||||
|
|
|
| |||||||||
Institutional Class Shares | ||||||||||||
Issued | 615 | (c) | – | |||||||||
Reinvested | 156 | (c) | – | |||||||||
Redeemed | – | (c) | – | |||||||||
|
|
|
| |||||||||
Total Institutional Class Shares | 771 | (c) | – | |||||||||
|
|
|
| |||||||||
Total change in shares | 3,328,523 | (2,115,207 | ) | |||||||||
|
|
|
| |||||||||
Amounts designated as “–” are zero or have been rounded to zero.
| (b) | Effective September 16, 2013, Fiduciary Shares were renamed Institutional Service Class Shares. |
| (c) | For the period from September 19, 2013 (commencement of operations) through January 31, 2014. |
The accompanying notes are an integral part of these financial statements.
152
Financial Highlights
Selected data for each share of capital outstanding throughout the periods indicated
Nationwide HighMark Value Fund
| Operations | Distributions | Ratios/Supplemental Data | ||||||||||||||||||||||||||||||||||||||||||||||||||||||
| Net Asset Value, Beginning of Period | Net Investment Income (Loss) | Net Realized and Unrealized Gains (Losses) from Investments | Total from Operations | Net Investment Income | Net Realized Gains | Total Distributions | Net Asset Value, End of Period | Total Return (a)(b) | Net Assets at End of Period | Ratio of Expenses to Average Net Assets (c) | Ratio of Net Investment Income (Loss) to Average Net Assets (c) | Ratio of Expenses (Prior to Reimbursements) to Average Net Assets (c)(d) | Portfolio Turnover (e) | |||||||||||||||||||||||||||||||||||||||||||
| Class A Shares | ||||||||||||||||||||||||||||||||||||||||||||||||||||||||
Six Months Ended January 31, 2014 (f) (Unaudited) | $ | 18.10 | 0.04 | 0.88 | 0.92 | (0.24 | ) | (3.59 | ) | (3.83 | ) | $ | 15.19 | 5.01% | $ | 86,349,098 | 1.24% | 0.44% | 1.28% | 31.50% | ||||||||||||||||||||||||||||||||||||
Year Ended July 31, 2013 (f) | $ | 15.67 | 0.16 | 3.80 | 3.96 | (0.16 | ) | (1.37 | ) | (1.53 | ) | $ | 18.10 | 27.18% | $ | 89,153,591 | 1.25% | 0.98% | 1.36% | 55.00% | ||||||||||||||||||||||||||||||||||||
Year Ended July 31, 2012 (f) | $ | 16.05 | 0.18 | 0.27 | 0.45 | (0.18 | ) | (0.65 | ) | (0.83 | ) | $ | 15.67 | 3.28% | $ | 83,338,902 | 1.26% | 1.20% | 1.39% | 44.00% | (g) | |||||||||||||||||||||||||||||||||||
Year Ended July 31, 2011 (f) | $ | 13.61 | 0.15 | 2.57 | 2.72 | (0.28 | ) | – | (0.28 | ) | $ | 16.05 | 20.12% | $ | 71,163,994 | 1.27% | 0.99% | 1.38% | 26.00% | |||||||||||||||||||||||||||||||||||||
Year Ended July 31, 2010 (f) | $ | 12.14 | 0.23 | 1.37 | 1.60 | (0.13 | ) | – | (0.13 | ) | $ | 13.61 | 13.18% | $ | 72,131,888 | 1.25% | 1.70% | 1.36% | 12.00% | |||||||||||||||||||||||||||||||||||||
Year Ended July 31, 2009 (f) | $ | 17.50 | 0.19 | (4.40 | ) | (4.21 | ) | (0.19 | ) | (0.96 | ) | (1.15 | ) | $ | 12.14 | (23.30% | ) | $ | 75,156,038 | 1.21% | 1.57% | 1.34% | 20.00% | |||||||||||||||||||||||||||||||||
| Class C Shares | ||||||||||||||||||||||||||||||||||||||||||||||||||||||||
Six Months Ended January 31, 2014 (f) (Unaudited) | $ | 17.55 | (0.01 | ) | 0.85 | 0.84 | (0.18 | ) | (3.59 | ) | (3.77 | ) | $ | 14.62 | 4.76% | $ | 3,706,220 | 1.77% | (0.09% | ) | 1.78% | 31.50% | ||||||||||||||||||||||||||||||||||
Year Ended July 31, 2013 (f) | $ | 15.25 | 0.06 | 3.69 | 3.75 | (0.08 | ) | (1.37 | ) | (1.45 | ) | $ | 17.55 | 26.37% | $ | 3,857,499 | 1.85% | 0.38% | 1.86% | 55.00% | ||||||||||||||||||||||||||||||||||||
Year Ended July 31, 2012 (f) | $ | 15.63 | 0.09 | 0.27 | 0.36 | (0.09 | ) | (0.65 | ) | (0.74 | ) | $ | 15.25 | 2.70% | $ | 3,792,235 | 1.86% | 0.60% | 1.89% | 44.00% | (g) | |||||||||||||||||||||||||||||||||||
Year Ended July 31, 2011 (f) | $ | 13.26 | 0.06 | 2.51 | 2.57 | (0.20 | ) | – | (0.20 | ) | $ | 15.63 | 19.48% | $ | 2,503,285 | 1.87% | 0.39% | 1.88% | 26.00% | |||||||||||||||||||||||||||||||||||||
Year Ended July 31, 2010 (f) | $ | 11.84 | 0.15 | 1.32 | 1.47 | (0.05 | ) | – | (0.05 | ) | $ | 13.26 | 12.50% | $ | 2,547,983 | 1.85% | 1.10% | 1.86% | 12.00% | |||||||||||||||||||||||||||||||||||||
Year Ended July 31, 2009 (f) | $ | 17.10 | 0.11 | (4.29 | ) | (4.18 | ) | (0.12 | ) | (0.96 | ) | (1.08 | ) | $ | 11.84 | (23.76% | ) | $ | 3,058,026 | 1.81% | 0.97% | 1.84% | 20.00% | |||||||||||||||||||||||||||||||||
| Class U Shares | ||||||||||||||||||||||||||||||||||||||||||||||||||||||||
Six Months Ended January 31, 2014 (f) (Unaudited) | $ | 18.17 | 0.08 | 0.88 | 0.96 | (0.28 | ) | (3.59 | ) | (3.87 | ) | $ | 15.26 | 5.25% | $ | 127,059,931 | 0.77% | 0.91% | 0.78% | 31.50% | ||||||||||||||||||||||||||||||||||||
Year Ended July 31, 2013 (f) | $ | 15.72 | 0.23 | 3.81 | 4.04 | (0.22 | ) | (1.37 | ) | (1.59 | ) | $ | 18.17 | 27.69% | $ | 123,771,869 | 0.85% | 1.38% | 0.86% | 55.00% | ||||||||||||||||||||||||||||||||||||
Period Ended July 31, 2012 (f)(h) | $ | 14.85 | 0.14 | 0.85 | 0.99 | (0.12 | ) | – | (0.12 | ) | $ | 15.72 | 6.70% | $ | 99,929,775 | 0.86% | 1.60% | 0.89% | 44.00% | (g) | ||||||||||||||||||||||||||||||||||||
| Institutional Service Class Shares (i) | ||||||||||||||||||||||||||||||||||||||||||||||||||||||||
Six Months Ended January 31, 2014 (f) (Unaudited) | $ | 18.16 | 0.06 | 0.88 | 0.94 | (0.26 | ) | (3.59 | ) | (3.85 | ) | $ | 15.25 | 5.14% | $ | 126,732,595 | 0.99% | 0.69% | 1.03% | 31.50% | ||||||||||||||||||||||||||||||||||||
Year Ended July 31, 2013 (f) | $ | 15.71 | 0.21 | 3.81 | 4.02 | (0.20 | ) | (1.37 | ) | (1.57 | ) | $ | 18.16 | 27.54% | $ | 131,380,766 | 0.99% | 1.24% | 1.11% | 55.00% | ||||||||||||||||||||||||||||||||||||
Year Ended July 31, 2012 (f) | $ | 16.09 | 0.22 | 0.27 | 0.49 | (0.22 | ) | (0.65 | ) | (0.87 | ) | $ | 15.71 | 3.50% | $ | 147,100,903 | 1.00% | 1.46% | 1.14% | 44.00% | (g) | |||||||||||||||||||||||||||||||||||
Year Ended July 31, 2011 (f) | $ | 13.64 | 0.19 | 2.57 | 2.76 | (0.31 | ) | – | (0.31 | ) | $ | 16.09 | 20.50% | $ | 234,784,893 | 1.02% | 1.24% | 1.13% | 26.00% | |||||||||||||||||||||||||||||||||||||
Year Ended July 31, 2010 (f) | $ | 12.17 | 0.26 | 1.37 | 1.63 | (0.16 | ) | – | (0.16 | ) | $ | 13.64 | 13.43% | $ | 228,162,137 | 1.00% | 1.95% | 1.11% | 12.00% | |||||||||||||||||||||||||||||||||||||
Year Ended July 31, 2009 (f) | $ | 17.53 | 0.22 | (4.40 | ) | (4.18 | ) | (0.22 | ) | (0.96 | ) | (1.18 | ) | $ | 12.17 | (23.11% | ) | $ | 229,770,927 | 0.96% | 1.82% | 1.09% | 20.00% | |||||||||||||||||||||||||||||||||
| Institutional Class Shares | ||||||||||||||||||||||||||||||||||||||||||||||||||||||||
Period Ended January 31, 2014 (f)(j) (Unaudited) | $ | 18.83 | 0.05 | 0.24 | 0.29 | (0.28 | ) | (3.59 | ) | (3.87 | ) | $ | 15.25 | 1.52% | $ | 11,757 | 0.74% | 0.80% | 0.74% | 31.50% | ||||||||||||||||||||||||||||||||||||
Amounts designated as “–” are zero or have been rounded to zero.
| (a) | Excludes sales charge. |
| (b) | Not annualized for periods less than one year. |
| (c) | Annualized for periods less than one year. |
| (d) | During the period, certain fees may have been waived and/or reimbursed. If such waivers/reimbursements had not occurred, the ratios would have been as indicated. |
| (e) | Portfolio turnover is calculated on the basis of the Fund as a whole without distinguishing among the classes of shares. |
| (f) | Per share calculations were performed using average shares method. |
| (g) | Excludes merger activity. |
| (h) | For the period from January 4, 2012 (commencement of operations) through July 31, 2012. |
| (i) | Effective September 16, 2013, Fiduciary Shares were renamed Institutional Service Class Shares. |
| (j) | For the period from September 19, 2013 (commencement of operations) through January 31, 2014. Total return is calculated based on inception date of September 18, 2013 through January 31, 2014. |
The accompanying notes are an integral part of these financial statements.
153
| Fund Commentary | Nationwide Ziegler Equity Income Fund |
For the semiannual period ended January 31, 2014, the Nationwide Ziegler Equity Income Fund (Class A) returned 3.68%* versus 4.63% for its benchmark, the Russell 1000® Value Index. For broader comparison, the median return for the Fund’s closest Lipper peer category of Equity Income Funds (consisting of 443 funds as of January 31, 2014) was 4.08% for the same time period.
*Performance prior to the Fund’s inception on September 16, 2013, is based on the performance of the Fund’s predecessor fund.
U.S. economic data suggested an overall improvement in economic conditions, and U.S. equities performed well during the six-month reporting period ended January 31, 2014, with the Russell 1000 Index, a broad market indicator, returning 7.38% for the same time period. Growth-oriented strategies generally outperformed value approaches, as evidenced by the 10.15% return of the Russell 1000 Growth Index for the reporting period. Stocks exhibiting high beta, high volatility and strong growth characteristics produced relatively strong performance in the second half of 2013, while stocks with more exposure to value factors such as high dividend, earnings and cash flow yields underperformed. The Fund carried an even more conservative exposure to lower-beta, higher-earnings-quality stocks, which hurt Fund performance relative to the Fund’s benchmark.
The Fund began its fiscal year with an allocation to utilities stocks that was about 1.0% greater than that of the benchmark, but that exposure was reduced to a neutral position by year-end in recognition of the improving economy. Nevertheless, the overweight to utilities cost the Fund 0.17% of relative performance against its benchmark.
An overweight to Real Estate Investment Trusts (REITs) detracted from Fund performance as REITs underperformed along with other interest-rate-sensitive sectors such as utilities and telecommunication services. Two REITs in particular underperformed: Rayonier Inc. (RYN) and Home Properties Inc. (HME). Timberland manager Rayonier declined 17.1% after missing
earnings and cost the Fund 0.34% of total return before the holding was removed from the portfolio. Home Properties fell 10.5% during the reporting period and cost the Fund 0.17% of relative performance, but the stock was retained and has rebounded recently. The portfolio’s exposure to REITs provides higher yield and serves as an important defensive play in a market downturn such as we saw in January 2014.
The Fund carried an allocation to health-care stocks that was similar to that of the benchmark but underperformed by 0.46%, primarily driven by the Fund’s lack of exposure to stocks in the life sciences tools and services sector; these stocks appreciated more than 23% on a weighted average basis during the reporting period.
Industrials was the second-best-performing sector during the reporting period, and the Fund’s allocation and stock selection in industrials added 0.89% to relative Fund performance. During the reporting period, the Fund was overweight aerospace and defense industry stocks that returned 27.1% versus 25.4% for the industry within the Russell 1000 Value Index. The portfolio benefited from large positions in Boeing (BA) and Lockheed Martin (LMT), which are not held in the benchmark, as well as holdings in Northrop Grumman Corp. and Raytheon Co., which are benchmark constituents. In addition, a position in commercial printer Deluxe Corp. appreciated 19.7% during the reporting period.
The Fund began the reporting period with a large underweight to information technology stocks but added to the sector during the reporting period in anticipation of an improving economy. Two top contributors to the Fund’s performance were Fund holdings Hewlett Packard (HPQ), which was up 37% since its purchase by the Fund in early October, and Lexmark International (LXK), which appreciated 10% since being added to the portfolio in late December. These two companies contributed 0.50% of relative outperformance to the Fund.
Looking ahead, we feel that dividends will remain an important contributor to total return, although the market will likely continue to move away from very high yielding, bond-like equities and focus
154
| Fund Commentary (con’t.) | Nationwide Ziegler Equity Income Fund |
more on companies that exhibit strong dividend growth and benefit from an improving economy.
Subadviser:
Ziegler Capital Management, LLC
Portfolio Managers:
Mikhail I. Alkhazov and David J. Nesbitt
The Fund is subject to the risks of investing in equity securities and fixed-income securities. Funds that concentrate on specific sectors may be subject to greater volatility than that of other mutual funds. The Fund may invest in more-aggressive investments such as derivatives (many of which create investment leverage and are highly volatile), exchange-traded funds (ETFs) (shareholders will bear additional costs) and foreign securities (which are volatile, harder to price and less liquid than U.S. securities). Please refer to the summary prospectus for a more detailed explanation of the Fund’s principal risks.
A description of the benchmarks can be found on the Market Index Definitions page at the back of this book.
155
| Fund Overview (Unaudited) | Nationwide Ziegler Equity Income Fund |
Objective
The Fund seeks total return from income and capital appreciation.
Highlights
| Ÿ | For the semiannual period ended January 31, 2014, the Fund (Class A) returned 3.68%, underperforming the benchmark by 0.95% and the Lipper peer category by 0.40%. |
| Ÿ | An overweight to Real Estate Investment Trusts (REITs) detracted from Fund performance during the reporting period as REITs underperformed along with other interest-rate-sensitive sectors such as utilities and telecommunication services. |
| Ÿ | Industrials was the second-best-performing sector during the reporting period, and the Fund’s allocation and stock selection in industrials added 0.89% to relative Fund performance. |
Asset Allocation†
| Common Stocks | 98.7% | |||
| Exchange Traded Fund | 0.8% | |||
| Mutual Fund | 0.3% | |||
| Other assets in excess of liabilities | 0.2% | |||
| 100.0% |
Top Industries††
| Oil, Gas & Consumable Fuels | 10.8% | |||
| Insurance | 10.5% | |||
| Commercial Banks | 10.2% | |||
| Pharmaceuticals | 8.8% | |||
| Aerospace & Defense | 7.1% | |||
| Real Estate Investment Trusts (REITs) | 6.5% | |||
| Computers & Peripherals | 3.9% | |||
| Health Care Equipment & Supplies | 3.9% | |||
| Diversified Telecommunication Services | 3.3% | |||
| Diversified Financial Services | 3.2% | |||
| Other Industries | 31.8% | |||
| 100.0% |
Top Holdings††
| Wells Fargo & Co. | 4.0% | |||
| Johnson & Johnson | 3.4% | |||
| Pfizer, Inc. | 3.4% | |||
| Exxon Mobil Corp. | 3.3% | |||
| JPMorgan Chase & Co. | 3.2% | |||
| Chevron Corp. | 3.1% | |||
| ConocoPhillips | 3.0% | |||
| General Electric Co. | 2.8% | |||
| Allstate Corp. (The) | 2.4% | |||
| Travelers Cos., Inc. (The) | 2.3% | |||
| Other Holdings | 69.1% | |||
| 100.0% |
| † | Percentages indicated are based upon net assets as of January 31, 2014. |
| †† | Percentages indicated are based upon total investments as of January 31, 2014. |
156
| Fund Performance | Nationwide Ziegler Equity Income Fund |
Average Annual Total Return
(For periods ended January 31, 2014)
| Six Months* | 1 Yr. | 5 Yr. | ||||||||||||
| Class A | w/o SC1 | 3.68% | 18.55% | 18.11% | ||||||||||
| w/SC2 | -2.03% | 12.00% | 16.77% | |||||||||||
| Class C | w/o SC1 | 3.33% | 17.83% | 17.38% | ||||||||||
| w/SC3 | 2.33% | 16.83% | 17.38% | |||||||||||
| Institutional Service Class4,5 | w/o SC | 3.86% | 18.86% | 18.27% | ||||||||||
| Institutional Class4 | w/o SC | 2.99% | 6 | — | — | |||||||||
All figures showing the effect of a sales charge (SC) reflect the maximum charge possible, because it has the most significant effect on performance data.
| * | Not annualized. |
| 1 | These returns do not reflect the effects of SCs. |
| 2 | For the period from September 16, 2013 through January 31, 2014 a front-end sales charge of 5.75% was deducted. Prior to September 16, 2013, a front-end sales charge of 5.50% was deducted. |
| 3 | A 1.00% CDSC was deducted from the one year return because it is charged when you sell Class C shares within the first year after purchase. |
| 4 | Not subject to any SCs. |
| 5 | Effective September 16, 2013 Fiduciary Shares were renamed Institutional Service Class Shares. |
| 6 | Since inception date of September 18, 2013. Not Annualized. |
Expense Ratios
| Gross Expense Ratio* | Net Expense Ratio* | |||||
| Class A | 1.97% | 1.15% | ||||
| Class C | 2.47% | 1.75% | ||||
| Institutional Service Class | 1.72% | 0.90% | ||||
| Institutional Class | 1.47% | 0.75% | ||||
| * | Current effective prospectus dated September 16, 2013. The difference between gross and net operating expenses reflects contractual waivers in place through November 30, 2015. Please see the Fund’s most recent prospectus for details. |
157
| Fund Performance | Nationwide Ziegler Equity Income Fund |
Performance of a $10,000 Investment
Investment return and principal value will fluctuate, and when redeemed, shares may be worth more or less than original cost. Past performance is no guarantee of future results and does not reflect the deduction of taxes that a shareholder would pay on fund distributions or the redemption of fund shares. Investing in mutual funds involves market risk, including loss of principal. Performance returns assume the reinvestment of all distributions.
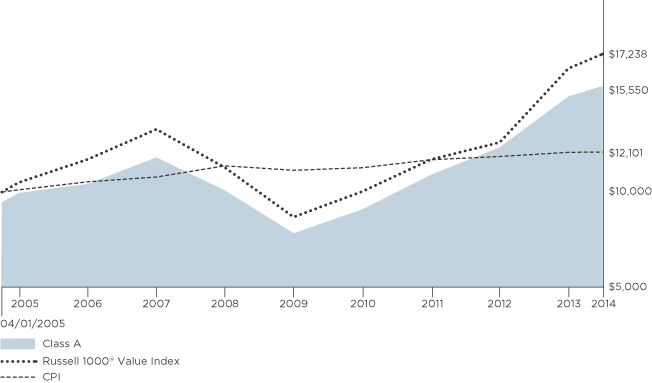
Comparative performance of $10,000 invested in Class A shares of the Nationwide Ziegler Equity Income Fund since inception* through 1/31/14 versus the Russell 1000® Value Index and the Consumer Price Index (CPI) for the same period. Unlike the Fund, the performance for these unmanaged indexes does not reflect any fees, expenses, or sales charges. One cannot invest directly in a market index. A description of the benchmarks can be found on the Market Index Definitions page at the back of this book.
*The inception date for the Nationwide Ziegler Equity Income Fund is 9/16/13. Performance prior to that date is based on the since-inception performance of the Fund’s predecessor fund.
158
| Shareholder Expense Example | Nationwide Ziegler Equity Income Fund |
As a shareholder of the Fund, you incur two types of costs: (1) transaction costs, including sales charges (loads) paid on purchase payments and redemption fees; and (2) ongoing costs, including investment advisory fees, administration fees, distribution fees and other Fund expenses. The examples below are intended to help you understand your ongoing costs (in dollars) of investing in the Fund and to compare these costs with the ongoing costs of investing in other mutual funds. Per Securities and Exchange Commission (“SEC”) requirements, the examples assume that you had a $1,000 investment in the Class at the beginning of the reporting period (August 1, 2013) and continued to hold your shares at the end of the reporting period (January 31, 2014).
Actual Expenses
For each Class of the Fund in the table below, the first line provides information about actual account values and actual expenses. You may use the information in this line, together with the amount you invested, to estimate the expenses that you paid from August 1, 2013 through January 31, 2014. Simply divide your account value by $1,000 (for example, an $8,600 account value divided by $1,000 = 8.6), then multiply the result by the number in the first line of each Class under the heading entitled “Expenses Paid During Period” to estimate the expenses you paid on your account during this period.
Hypothetical Expenses for Comparison Purposes
The second line of each Class in the table below provides information about hypothetical account values and hypothetical expenses based on the Class’ actual expense ratio and an assumed rate of return of 5% per year before expenses, which is not the Class’ actual return. The hypothetical account values and expenses may not be used to estimate the actual ending account balance or expenses you paid for the period from August 1, 2013 through January 31, 2014. You may use this information to compare the ongoing costs of investing in the Class of the Fund and other funds. To do so, compare this 5% hypothetical example with the 5% hypothetical examples that appear in the shareholder reports of the other funds.
Please note that the expenses shown in the table are meant to highlight your ongoing costs only and do not reflect any transaction costs, such as sales charges (loads) or redemption fees. If these transaction costs were included, your costs would have been higher. Therefore, the second line for each Class in the table is useful in comparing ongoing costs only, and will not help you determine the relative total costs of owning different funds. The examples also assume all dividends and distributions are reinvested.
Schedule of Shareholder Expenses
Expense Analysis of a $1,000 Investment
Nationwide Ziegler Equity January 31, 2014 | Beginning Account Value ($) 08/01/13 | Ending Account Value ($) 01/31/14 | Expenses Paid During Period ($) 08/01/13 - 01/31/14 | Expense Ratio During Period (%) 08/01/13 - 01/31/14 | ||||||||
| Class A Shares | Actual | a | 1,000.00 | 1,036.80 | 5.90 | 1.15 | ||||||
| Hypotheticala,b | 1,000.00 | 1,019.41 | 5.85 | 1.15 | ||||||||
| Class C Shares | Actual | a | 1,000.00 | 1,033.30 | 8.97 | 1.75 | ||||||
| Hypothetical | a,b | 1,000.00 | 1,016.38 | 8.89 | 1.75 | |||||||
| Institutional Service Class Sharesc | Actual | a | 1,000.00 | 1,038.60 | 4.62 | 0.90 | ||||||
| Hypothetical | a,b | 1,000.00 | 1,020.67 | 4.58 | 0.90 | |||||||
| Institutional Class Shares | Actual | d | 1,000.00 | 1,029.90 | 2.78 | 0.74 | ||||||
| Hypothetical | a,b | 1,000.00 | 1,021.48 | 3.77 | 0.74 | |||||||
| a | Expenses are equal to the Fund’s annualized expense ratio multiplied by the average account value from August 1, 2013 through January 31, 2014 multiplied to reflect one-half year period. The expense ratio presented represents a six-month, annualized ratio in accordance with Securities and Exchange Commission guidelines. |
| b | Represents the hypothetical 5% return before expenses. |
| c | Effective September 16, 2013, Fiduciary Shares were renamed Institutional Service Class Shares. |
| d | Actual expenses are equal to the Fund’s annualized expense ratio multiplied by the average account value from September 19, 2013 through January 31, 2014 to reflect the period from commencement of operations. |
159
Statement of Investments
January 31, 2014 (Unaudited)
Nationwide Ziegler Equity Income Fund
| Common Stocks 98.7% | ||||||||||
| Shares | Market Value | |||||||||
| ||||||||||
Aerospace & Defense 7.0% |
| |||||||||
Boeing Co. (The) | 19,313 | $ | 2,419,146 | |||||||
Lockheed Martin Corp. | 14,129 | 2,132,208 | ||||||||
Northrop Grumman Corp. | 17,136 | 1,980,065 | ||||||||
Raytheon Co. | 25,343 | 2,409,359 | ||||||||
|
| |||||||||
| 8,940,778 | ||||||||||
|
| |||||||||
| ||||||||||
Automobiles 1.5% |
| |||||||||
Ford Motor Co. | 124,287 | 1,859,333 | ||||||||
|
| |||||||||
| ||||||||||
Capital Markets 1.4% |
| |||||||||
Goldman Sachs Group, Inc. (The) | 10,856 | 1,781,687 | ||||||||
|
| |||||||||
| ||||||||||
Commercial Banks 10.2% |
| |||||||||
Fifth Third Bancorp | 99,058 | 2,082,199 | ||||||||
FirstMerit Corp. | 117,294 | 2,386,933 | ||||||||
PNC Financial Services Group, Inc. (The) | 19,463 | 1,554,704 | ||||||||
U.S. Bancorp | 48,546 | 1,928,733 | ||||||||
Wells Fargo & Co. | 110,712 | 5,019,682 | ||||||||
|
| |||||||||
| 12,972,251 | ||||||||||
|
| |||||||||
| ||||||||||
Commercial Services & Supplies 2.4% |
| |||||||||
Deluxe Corp. | 35,846 | 1,740,323 | ||||||||
Pitney Bowes, Inc. | 51,726 | 1,302,461 | ||||||||
|
| |||||||||
| 3,042,784 | ||||||||||
|
| |||||||||
| ||||||||||
Communications Equipment 1.4% |
| |||||||||
Harris Corp. | 24,987 | 1,732,599 | ||||||||
|
| |||||||||
| ||||||||||
Computers & Peripherals 3.9% |
| |||||||||
Apple, Inc. | 3,023 | 1,513,314 | ||||||||
Hewlett-Packard Co. | 67,851 | 1,967,679 | ||||||||
Lexmark International, Inc., Class A | 38,718 | 1,517,358 | ||||||||
|
| |||||||||
| 4,998,351 | ||||||||||
|
| |||||||||
| ||||||||||
Containers & Packaging 1.7% |
| |||||||||
Avery Dennison Corp. | 44,065 | 2,171,083 | ||||||||
|
| |||||||||
| ||||||||||
Diversified Financial Services 3.2% |
| |||||||||
JPMorgan Chase & Co. | 73,500 | 4,068,960 | ||||||||
|
| |||||||||
| ||||||||||
Diversified Telecommunication Services 3.3% |
| |||||||||
AT&T, Inc. | 49,502 | 1,649,407 | ||||||||
Verizon Communications, Inc. | 53,065 | 2,548,181 | ||||||||
|
| |||||||||
| 4,197,588 | ||||||||||
|
| |||||||||
| ||||||||||
Electric Utilities 2.6% |
| |||||||||
Edison International | 41,949 | 2,020,264 | ||||||||
Westar Energy, Inc. | 37,995 | 1,260,294 | ||||||||
|
| |||||||||
| 3,280,558 | ||||||||||
|
| |||||||||
| ||||||||||
Gas Utilities 1.8% |
| |||||||||
Southwest Gas Corp. | 43,448 | 2,334,461 | ||||||||
|
| |||||||||
| Common Stocks (continued) | ||||||||||
| Shares | Market Value | |||||||||
| ||||||||||
Health Care Equipment & Supplies 3.8% |
| |||||||||
Baxter International, Inc. | 19,870 | $ | 1,357,121 | |||||||
Becton, Dickinson and Co. | 17,215 | 1,861,286 | ||||||||
St. Jude Medical, Inc. | 27,510 | 1,670,682 | ||||||||
|
| |||||||||
| 4,889,089 | ||||||||||
|
| |||||||||
| ||||||||||
Hotels, Restaurants & Leisure 1.0% |
| |||||||||
DineEquity, Inc. | 15,971 | 1,242,703 | ||||||||
|
| |||||||||
| ||||||||||
Household Durables 1.5% |
| |||||||||
Newell Rubbermaid, Inc. | 61,361 | 1,896,055 | ||||||||
|
| |||||||||
| ||||||||||
Household Products 1.1% |
| |||||||||
Kimberly-Clark Corp. | 12,705 | 1,389,546 | ||||||||
|
| |||||||||
| ||||||||||
Industrial Conglomerates 2.8% |
| |||||||||
General Electric Co. | 140,333 | 3,526,568 | ||||||||
|
| |||||||||
| ||||||||||
Insurance 10.5% |
| |||||||||
ACE Ltd. | 19,325 | 1,812,878 | ||||||||
Allstate Corp. (The) | 58,243 | 2,982,042 | ||||||||
Assurant, Inc. | 21,149 | 1,382,087 | ||||||||
Chubb Corp. (The) | 27,479 | 2,323,075 | ||||||||
PartnerRe Ltd. | 19,443 | 1,908,719 | ||||||||
Travelers Cos., Inc. (The) | 35,690 | 2,900,883 | ||||||||
|
| |||||||||
| 13,309,684 | ||||||||||
|
| |||||||||
| ||||||||||
Leisure Equipment & Products 1.1% |
| |||||||||
Hasbro, Inc. | 29,142 | 1,431,455 | ||||||||
|
| |||||||||
| ||||||||||
Machinery 1.0% |
| |||||||||
Deere & Co. | 15,077 | 1,296,019 | ||||||||
|
| |||||||||
| ||||||||||
Media 2.5% |
| |||||||||
Thomson Reuters Corp. | 33,094 | 1,193,369 | ||||||||
Time Warner, Inc. | 31,478 | 1,977,763 | ||||||||
|
| |||||||||
| 3,171,132 | ||||||||||
|
| |||||||||
| ||||||||||
Oil, Gas & Consumable Fuels 10.8% |
| |||||||||
Chevron Corp. | 35,009 | 3,908,055 | ||||||||
ConocoPhillips | 57,640 | 3,743,718 | ||||||||
Exxon Mobil Corp. | 45,958 | 4,235,489 | ||||||||
Williams Cos., Inc. (The) | 44,812 | 1,814,438 | ||||||||
|
| |||||||||
| 13,701,700 | ||||||||||
|
| |||||||||
| ||||||||||
Paper & Forest Products 1.4% |
| |||||||||
International Paper Co. | 37,177 | 1,774,830 | ||||||||
|
| |||||||||
| ||||||||||
Pharmaceuticals 8.8% |
| |||||||||
Eli Lilly & Co. | 45,673 | 2,466,799 | ||||||||
Johnson & Johnson | 49,420 | 4,372,187 | ||||||||
Pfizer, Inc. | 141,167 | 4,291,477 | ||||||||
|
| |||||||||
| 11,130,463 | ||||||||||
|
| |||||||||
160
Statement of Investments (Continued)
January 31, 2014 (Unaudited)
Nationwide Ziegler Equity Income Fund (Continued)
| Common Stocks (continued) | ||||||||||
| Shares | Market Value | |||||||||
| ||||||||||
Real Estate Investment Trusts (REITs) 6.5% |
| |||||||||
Annaly Capital Management, Inc. | 150,742 | $ | 1,623,491 | |||||||
Chimera Investment Corp. | 663,224 | 2,069,259 | ||||||||
Home Properties, Inc. | 21,672 | 1,208,214 | ||||||||
Macerich Co. (The) | 28,018 | 1,585,819 | ||||||||
Weingarten Realty Investors | 60,823 | 1,763,259 | ||||||||
|
| |||||||||
| 8,250,042 | ||||||||||
|
| |||||||||
| ||||||||||
Road & Rail 1.6% |
| |||||||||
CSX Corp. | 33,403 | 898,875 | ||||||||
Norfolk Southern Corp. | 12,040 | 1,114,783 | ||||||||
|
| |||||||||
| 2,013,658 | ||||||||||
|
| |||||||||
| ||||||||||
Semiconductors & Semiconductor Equipment 1.4% |
| |||||||||
Texas Instruments, Inc. | 41,522 | 1,760,533 | ||||||||
|
| |||||||||
| ||||||||||
Software 1.5% |
| |||||||||
CA, Inc. | 58,895 | 1,889,352 | ||||||||
|
| |||||||||
| ||||||||||
Tobacco 1.0% |
| |||||||||
Altria Group, Inc. | 36,816 | 1,296,659 | ||||||||
|
| |||||||||
Total Common Stocks |
| 125,349,921 | ||||||||
|
| |||||||||
| Exchange Traded Fund 0.8% | ||||||||||
Equity Fund 0.8% | ||||||||||
Vanguard Value ETF | 13,074 | 961,854 | ||||||||
|
| |||||||||
Total Exchange Traded Fund |
| 961,854 | ||||||||
|
| |||||||||
| Mutual Fund 0.3% | ||||||||||
Money Market Fund 0.3% | ||||||||||
Fidelity Institutional Money Market Fund — Institutional Class, 0.08% (a) | 383,210 | 383,210 | ||||||||
|
| |||||||||
Total Mutual Fund (cost $383,210) |
| 383,210 | ||||||||
|
| |||||||||
Total Investments | 126,694,985 | |||||||||
Other assets in excess of liabilities — 0.2% |
| 312,955 | ||||||||
|
| |||||||||
NET ASSETS — 100.0% |
| $ | 127,007,940 | |||||||
|
| |||||||||
| (a) | Represents 7-day effective yield as of January 31, 2014. |
| (b) | See notes to financial statements for tax cost and unrealized appreciation/(depreciation) of securities. |
| ETF | Exchange Traded Fund |
| Ltd. | Limited |
| REIT | Real Estate Investment Trust |
The accompanying notes are an integral part of these financial statements.
161
Statement of Assets and Liabilities
January 31, 2014 (Unaudited)
| Nationwide Ziegler Equity Income Fund | ||||||
Assets: | ||||||
Investments, at value (cost $116,358,038) | $ | 126,694,985 | ||||
Cash | 132,645 | |||||
Dividends receivable | 113,074 | |||||
Receivable for capital shares issued | 166,756 | |||||
Prepaid expenses | 16,025 | |||||
|
| |||||
Total Assets | 127,123,485 | |||||
|
| |||||
Liabilities: | ||||||
Payable for capital shares redeemed | 5,305 | |||||
Accrued expenses and other payables: | ||||||
Investment advisory fees | 58,027 | |||||
Fund administration fees | 5,284 | |||||
Distribution fees | 9,481 | |||||
Administrative servicing fees | 10,256 | |||||
Accounting and transfer agent fees | 3,281 | |||||
Trustee fees | 326 | |||||
Deferred compensation (Note 2) | 1,868 | |||||
Custodian fees | 590 | |||||
Compliance program costs (Note 3) | 764 | |||||
Professional fees | 13,950 | |||||
Printing fees | 5,812 | |||||
Other | 601 | |||||
|
| |||||
Total Liabilities | 115,545 | |||||
|
| |||||
Net Assets | $ | 127,007,940 | ||||
|
| |||||
Represented by: | ||||||
Capital | $ | 122,201,563 | ||||
Accumulated undistributed net investment income | 226,793 | |||||
Accumulated net realized losses from investment transactions | (5,757,363 | ) | ||||
Net unrealized appreciation/(depreciation) from investments | 10,336,947 | |||||
|
| |||||
Net Assets | $ | 127,007,940 | ||||
|
| |||||
Net Assets: | ||||||
Class A Shares | $ | 22,391,670 | ||||
Class C Shares | 5,293,561 | |||||
Institutional Service Class Shares | 8,637,476 | |||||
Institutional Class Shares | 90,685,233 | |||||
|
| |||||
Total | $ | 127,007,940 | ||||
|
| |||||
Shares Outstanding (unlimited number of shares authorized): | ||||||
Class A Shares | 1,809,373 | |||||
Class C Shares | 430,317 | |||||
Institutional Service Class Shares | 695,621 | |||||
Institutional Class Shares | 7,303,617 | |||||
|
| |||||
Total | 10,238,928 | |||||
|
| |||||
162
Statement of Assets and Liabilities (Continued)
January 31, 2014 (Unaudited)
| Nationwide Ziegler Equity Income Fund | ||||||
Net asset value and redemption price per share (Net assets by class divided by shares outstanding by class, respectively): | ||||||
Class A Shares (a) | $ | 12.38 | ||||
Class C Shares (b) | $ | 12.30 | ||||
Institutional Service Class Shares | $ | 12.42 | ||||
Institutional Class Shares | $ | 12.42 | ||||
Maximum offering price per share (100%/(100%-maximum sales charge) of net asset value adjusted to the nearest cent): | ||||||
Class A Shares | $ | 13.14 | ||||
|
| |||||
Maximum Sales Charge: | ||||||
Class A Shares | 5.75 | % | ||||
|
| |||||
| (a) | For Class A Shares, the redemption price per share is reduced by 1.00% on sales of shares of original purchases of $1,000,000 or more or that were not subject to a front-end sales charge made with 18 months of the purchase date. |
| (b) | For Class C Shares, the redemption price per share is reduced by 1.00% for shares held less than 1 year. |
The accompanying notes are an integral part of these financial statements.
163
Statement of Operations
For the Six Months Ended January 31, 2014 (Unaudited)
| Nationwide Ziegler Equity Income Fund | ||||||
INVESTMENT INCOME: | ||||||
Dividend income | $ | 1,514,184 | ||||
|
| |||||
Total Income | 1,514,184 | |||||
|
| |||||
EXPENSES: | ||||||
Investment advisory fees | 262,802 | |||||
Fund administration fees | 53,397 | |||||
Distribution fees Class A | 26,526 | |||||
Distribution fees Class B (a) | 1,001 | |||||
Distribution fees Class C | 25,910 | |||||
Administrative servicing fees Class A | 18,312 | |||||
Administrative servicing fees Class B (a) | 334 | |||||
Administrative servicing fees Institutional Service Class (b) | 7,394 | |||||
Registration and filing fees | 27,120 | |||||
Professional fees | 15,603 | |||||
Printing fees | 10,246 | |||||
Trustee fees | 903 | |||||
Custodian fees | 1,783 | |||||
Accounting and transfer agent fees | 9,125 | |||||
Compliance program costs (Note 3) | 1,544 | |||||
Other | 4,837 | |||||
|
| |||||
Total expenses before earnings credit, fees waived, and expenses reimbursed | 466,837 | |||||
|
| |||||
Earnings credit (Note 5) | (4 | ) | ||||
Administrative servicing fees voluntarily waived — Class A (Note 3) | (2,395 | ) | ||||
Administrative servicing fees voluntarily waived — Institutional Service Class (b)(Note 3) | (1,063 | ) | ||||
Expenses reimbursed by adviser (Note 3) | (22,837 | ) | ||||
|
| |||||
Net Expenses | 440,538 | |||||
|
| |||||
NET INVESTMENT INCOME | 1,073,646 | |||||
|
| |||||
REALIZED/UNREALIZED GAINS (LOSSES) FROM INVESTMENTS: | ||||||
Net realized gains from investment transactions | 1,576,314 | |||||
Net change in unrealized appreciation/(depreciation) from investments | 3,124,185 | |||||
|
| |||||
Net realized/unrealized gains from investments | 4,700,499 | |||||
|
| |||||
CHANGE IN NET ASSETS RESULTING FROM OPERATIONS | $ | 5,774,145 | ||||
|
| |||||
| (a) | Effective September 16, 2013, Class B Shares were converted to Class A Shares. |
| (b) | Effective September 16, 2013, Fiduciary Shares were renamed Institutional Service Class Shares. |
The accompanying notes are an integral part of these financial statements.
164
Statements of Changes in Net Assets
| Nationwide Ziegler Equity Income Fund | ||||||||||||
| Six Months Ended January 31, 2014 (Unaudited) | Year Ended July 31, 2013 | |||||||||||
Operations: | ||||||||||||
Net investment income | $ | 1,073,646 | $ | 560,037 | ||||||||
Net realized gains from investment transactions | 1,576,314 | 1,256,886 | ||||||||||
Net change in unrealized appreciation/(depreciation) from investments | 3,124,185 | 3,250,723 | ||||||||||
|
|
|
| |||||||||
Change in net assets resulting from operations | 5,774,145 | 5,067,646 | ||||||||||
|
|
|
| |||||||||
Distributions to Shareholders From: | ||||||||||||
Net investment income: | ||||||||||||
Class A | (124,461 | ) | (328,753 | ) | ||||||||
Class B (a) | – | (20,580 | ) | |||||||||
Class C | (16,159 | ) | (54,983 | ) | ||||||||
Institutional Service Class (b) | (55,008 | ) | (188,098 | ) | ||||||||
Institutional Class | (679,914 | )(c) | – | |||||||||
|
|
|
| |||||||||
Change in net assets from shareholder distributions | (875,542 | ) | (592,414 | ) | ||||||||
|
|
|
| |||||||||
Change in net assets from capital transactions | 88,572,670 | 6,814,801 | ||||||||||
|
|
|
| |||||||||
Change in net assets | 93,471,273 | 11,290,033 | ||||||||||
|
|
|
| |||||||||
Net Assets: | ||||||||||||
Beginning of period | 33,536,667 | 22,246,634 | ||||||||||
|
|
|
| |||||||||
End of period | $ | 127,007,940 | $ | 33,536,667 | ||||||||
|
|
|
| |||||||||
Accumulated undistributed net investment income at end of period | $ | 226,793 | $ | 28,689 | ||||||||
|
|
|
| |||||||||
CAPITAL TRANSACTIONS: | ||||||||||||
Class A Shares | ||||||||||||
Proceeds from shares issued | $ | 3,890,134 | $ | 7,541,853 | ||||||||
Dividends reinvested | 100,893 | 275,320 | ||||||||||
Cost of shares redeemed | (1,454,493 | ) | (2,591,284 | ) | ||||||||
|
|
|
| |||||||||
Total Class A Shares | 2,536,534 | 5,225,889 | ||||||||||
|
|
|
| |||||||||
Class B Shares (a) | ||||||||||||
Proceeds from shares issued | – | 20,609 | ||||||||||
Dividends reinvested | – | 19,786 | ||||||||||
Cost of shares redeemed | (1,097,631 | ) | (398,226 | ) | ||||||||
|
|
|
| |||||||||
Total Class B Shares | (1,097,631 | ) | (357,831 | ) | ||||||||
|
|
|
| |||||||||
Class C Shares | ||||||||||||
Proceeds from shares issued | 969,333 | 1,818,705 | ||||||||||
Dividends reinvested | 14,765 | 47,853 | ||||||||||
Cost of shares redeemed | (372,744 | ) | (568,401 | ) | ||||||||
|
|
|
| |||||||||
Total Class C Shares | 611,354 | 1,298,157 | ||||||||||
|
|
|
| |||||||||
| (a) | Effective September 16, 2013, Class B Shares were converted to Class A Shares. |
| (b) | Effective September 16, 2013, Fiduciary Shares were renamed Institutional Service Class Shares. |
| (c) | For the period September 19, 2013 (commencement of operations) through January 31, 2014. |
165
Statements of Changes in Net Assets (Continued)
| Nationwide Ziegler Equity Income Fund | ||||||||||||
| Six Months Ended January 31, 2014 (Unaudited) | Year Ended July 31, 2013 | |||||||||||
CAPITAL TRANSACTIONS: (continued) | ||||||||||||
Institutional Service Class Shares (b) | ||||||||||||
Proceeds from shares issued | $ | 1,199,301 | $ | 2,075,494 | ||||||||
Dividends reinvested | 47,101 | 157,453 | ||||||||||
Cost of shares redeemed | (1,529,479 | ) | (1,584,361 | ) | ||||||||
|
|
|
| |||||||||
Total Institutional Service Class Shares | (283,077 | ) | 648,586 | |||||||||
|
|
|
| |||||||||
Institutional Class Shares | ||||||||||||
Proceeds from shares issued | 89,339,017 | (c) | – | |||||||||
Dividends reinvested | 679,914 | (c) | – | |||||||||
Cost of shares redeemed | (3,213,441 | )(c) | – | |||||||||
|
|
|
| |||||||||
Total Institutional Class Shares | 86,805,490 | (c) | – | |||||||||
|
|
|
| |||||||||
Change in net assets from capital transactions | $ | 88,572,670 | $ | 6,814,801 | ||||||||
|
|
|
| |||||||||
SHARE TRANSACTIONS: | ||||||||||||
Class A Shares | ||||||||||||
Issued | 318,954 | 675,181 | ||||||||||
Reinvested | 8,183 | 25,768 | ||||||||||
Redeemed | (118,609 | ) | (237,901 | ) | ||||||||
|
|
|
| |||||||||
Total Class A Shares | 208,528 | 463,048 | ||||||||||
|
|
|
| |||||||||
Class B Shares (a) | ||||||||||||
Issued | – | 1,935 | ||||||||||
Reinvested | – | 1,867 | ||||||||||
Redeemed | (92,606 | ) | (37,017 | ) | ||||||||
|
|
|
| |||||||||
Total Class B Shares | (92,606 | ) | (33,215 | ) | ||||||||
|
|
|
| |||||||||
Class C Shares | ||||||||||||
Issued | 82,802 | 159,501 | ||||||||||
Reinvested | 1,203 | 4,503 | ||||||||||
Redeemed | (30,992 | ) | (52,124 | ) | ||||||||
|
|
|
| |||||||||
Total Class C Shares | 53,013 | 111,880 | ||||||||||
|
|
|
| |||||||||
Institutional Service Class Shares (b) | ||||||||||||
Issued | 96,683 | 186,993 | ||||||||||
Reinvested | 3,808 | 14,697 | ||||||||||
Redeemed | (127,075 | ) | (146,919 | ) | ||||||||
|
|
|
| |||||||||
Total Institutional Service Class Shares | (26,584 | ) | 54,771 | |||||||||
|
|
|
| |||||||||
Institutional Class Shares | ||||||||||||
Issued | 7,507,594 | (c) | – | |||||||||
Reinvested | 54,965 | (c) | – | |||||||||
Redeemed | (258,942 | )(c) | – | |||||||||
|
|
|
| |||||||||
Total Institutional Class Shares | 7,303,617 | (c) | – | |||||||||
|
|
|
| |||||||||
Total change in shares | 7,445,968 | 596,484 | ||||||||||
|
|
|
| |||||||||
Amounts designated as “–” are zero or have been rounded to zero.
| (a) | Effective September 16, 2013, Class B Shares were converted to Class A Shares. |
| (b) | Effective September 16, 2013, Fiduciary Shares were renamed Institutional Service Class Shares. |
| (c) | For the period September 19, 2013 (commencement of operations) through January 31, 2014. |
The accompanying notes are an integral part of these financial statements.
166
Financial Highlights
Selected data for each share of capital outstanding throughout the periods indicated
Nationwide Ziegler Equity Income Fund
| Operations | Distributions | Ratios/Supplemental Data | ||||||||||||||||||||||||||||||||||||||||||||||||||||||
| Net Asset Value, Beginning of Period | Net Investment Income | Net Realized and Unrealized Gains (Losses) from Investments | Total from Operations | Net Investment Income | Capital Gains | Total Distributions | Net Asset Value, End of Period | Total Return (a)(b) | Net Assets at End of Period | Ratio of Expenses to Average Net Assets (c) | Ratio of Net Investment Income to Average Net Assets (c) | Ratio of Expenses (Prior to Reimbursements) to Average Net Assets (c)(d) | Portfolio Turnover (e) | |||||||||||||||||||||||||||||||||||||||||||
| Class A Shares | ||||||||||||||||||||||||||||||||||||||||||||||||||||||||
Six Months Ended January 31, 2014 (f) (Unaudited) | $ | 12.01 | 0.13 | 0.31 | 0.44 | (0.07 | ) | – | (0.07 | ) | $ | 12.38 | 3.68% | $ | 22,391,670 | 1.15% | 2.05% | 1.30% | 31.95% | |||||||||||||||||||||||||||||||||||||
Year Ended July 31, 2013 (f) | $ | 10.12 | 0.24 | 1.91 | 2.15 | (0.26 | ) | – | (0.26 | ) | $ | 12.01 | 21.57% | $ | 19,218,955 | 1.15% | 2.23% | 1.76% | 69.00% | |||||||||||||||||||||||||||||||||||||
Year Ended July 31, 2012 (f) | $ | 9.18 | 0.24 | 0.94 | 1.18 | (0.24 | ) | – | (0.24 | ) | $ | 10.12 | 13.12% | $ | 11,518,605 | 1.15% | 2.60% | 1.90% | 79.00% | |||||||||||||||||||||||||||||||||||||
Year Ended July 31, 2011 (f) | $ | 7.89 | 0.25 | 1.31 | 1.56 | (0.27 | ) | – | (0.27 | ) | $ | 9.18 | 19.98% | $ | 9,259,221 | 1.15% | 2.79% | 2.00% | 78.00% | |||||||||||||||||||||||||||||||||||||
Year Ended July 31, 2010 (f) | $ | 6.97 | 0.24 | 0.88 | 1.12 | (0.20 | ) | – | (0.20 | ) | $ | 7.89 | 16.06% | $ | 9,975,601 | 1.15% | 3.03% | 2.05% | 46.00% | |||||||||||||||||||||||||||||||||||||
Period Ended July 31, 2009 (f)(g) | $ | 7.37 | 0.15 | (0.39 | ) | (0.24 | ) | (0.16 | ) | – | (0.16 | ) | $ | 6.97 | (2.93% | ) | $ | 11,793,250 | 1.16% | (h) | 3.17% | 2.47% | (h) | 32.00% | ||||||||||||||||||||||||||||||||
Year Ended October 31, 2008 | $ | 12.01 | 0.30 | (i) | (4.31 | ) | (4.01 | ) | (0.28 | ) | (0.35 | ) | (0.63 | ) | $ | 7.37 | (34.84% | ) | $ | 13,298,305 | 1.15% | 2.95% | 1.68% | 83.00% | ||||||||||||||||||||||||||||||||
| Class C Shares | ||||||||||||||||||||||||||||||||||||||||||||||||||||||||
Six Months Ended January 31, 2014 (f) (Unaudited) | $ | 11.94 | 0.09 | 0.31 | 0.40 | (0.04 | ) | – | (0.04 | ) | $ | 12.30 | 3.33% | $ | 5,293,561 | 1.75% | 1.45% | 1.87% | 31.95% | |||||||||||||||||||||||||||||||||||||
Year Ended July 31, 2013 (f) | $ | 10.07 | 0.18 | 1.89 | 2.07 | (0.20 | ) | – | (0.20 | ) | $ | 11.94 | 20.79% | $ | 4,504,018 | 1.75% | 1.63% | 2.26% | 69.00% | |||||||||||||||||||||||||||||||||||||
Year Ended July 31, 2012 (f) | $ | 9.14 | 0.19 | 0.93 | 1.12 | (0.19 | ) | – | (0.19 | ) | $ | 10.07 | 12.40% | $ | 2,673,144 | 1.75% | 2.00% | 2.40% | 79.00% | |||||||||||||||||||||||||||||||||||||
Year Ended July 31, 2011 (f) | $ | 7.85 | 0.19 | 1.32 | 1.51 | (0.22 | ) | – | (0.22 | ) | $ | 9.14 | 19.37% | $ | 2,431,052 | 1.75% | 2.19% | 2.50% | 78.00% | |||||||||||||||||||||||||||||||||||||
Year Ended July 31, 2010 (f) | $ | 6.94 | 0.19 | 0.87 | 1.06 | (0.15 | ) | – | (0.15 | ) | $ | 7.85 | 15.22% | $ | 2,193,955 | 1.75% | 2.43% | 2.55% | 46.00% | |||||||||||||||||||||||||||||||||||||
Period Ended July 31, 2009 (f)(g) | $ | 7.33 | 0.12 | (0.38 | ) | (0.26 | ) | (0.12 | ) | – | (0.12 | ) | $ | 6.95 | (3.39% | ) | $ | 2,831,931 | 1.87% | (h) | 2.45% | 3.17% | (h) | 32.00% | ||||||||||||||||||||||||||||||||
Year Ended October 31, 2008 | $ | 11.95 | 0.21 | (i) | (4.28 | ) | (4.07 | ) | (0.20 | ) | (0.35 | ) | (0.55 | ) | $ | 7.33 | (35.38% | ) | $ | 4,056,918 | 1.90% | 2.18% | 2.44% | 83.00% | ||||||||||||||||||||||||||||||||
| Institutional Service Class Shares (j) | ||||||||||||||||||||||||||||||||||||||||||||||||||||||||
Six Months Ended January 31, 2014 (f) (Unaudited) | $ | 12.04 | 0.14 | 0.32 | 0.46 | (0.08 | ) | – | (0.08 | ) | $ | 12.42 | 3.86% | $ | 8,637,476 | 0.90% | 2.32% | 1.06% | 31.95% | |||||||||||||||||||||||||||||||||||||
Year Ended July 31, 2013 (f) | $ | 10.15 | 0.27 | 1.90 | 2.17 | (0.28 | ) | – | (0.28 | ) | $ | 12.04 | 21.80% | $ | 8,697,861 | 0.90% | 2.48% | 1.51% | 69.00% | |||||||||||||||||||||||||||||||||||||
Year Ended July 31, 2012 (f) | $ | 9.21 | 0.27 | 0.94 | 1.21 | (0.27 | ) | – | (0.27 | ) | $ | 10.15 | 13.38% | $ | 6,777,074 | 0.88% | 2.87% | 1.65% | 79.00% | |||||||||||||||||||||||||||||||||||||
Year Ended July 31, 2011 (f) | $ | 7.88 | 0.28 | 1.33 | 1.61 | (0.28 | ) | – | (0.28 | ) | $ | 9.21 | 20.68% | $ | 5,532,039 | 0.90% | 3.04% | 1.75% | 78.00% | |||||||||||||||||||||||||||||||||||||
Year Ended July 31, 2010 (f) | $ | 6.97 | 0.25 | 0.83 | 1.08 | (0.17 | ) | – | (0.17 | ) | $ | 7.88 | 15.50% | $ | 9,253 | 0.90% | 3.28% | 1.80% | 46.00% | |||||||||||||||||||||||||||||||||||||
Period Ended July 31, 2009 (f)(k) | $ | 6.89 | – | 0.08 | 0.08 | – | – | – | $ | 6.97 | 1.16% | $ | 75,923 | 0.90% | (h) | 3.43% | 2.53% | (h) | 32.00% | |||||||||||||||||||||||||||||||||||||
| Institutional Class Shares | ||||||||||||||||||||||||||||||||||||||||||||||||||||||||
Period Ended January 31, 2014 (f)(l) (Unaudited) | $ | 12.15 | 0.11 | 0.25 | 0.36 | (0.09 | ) | – | (0.09 | ) | $ | 12.42 | 2.99% | $ | 90,685,233 | 0.74% | 2.29% | 0.74% | 31.95% | |||||||||||||||||||||||||||||||||||||
Amounts designated as “–” are zero or have been rounded to zero.
| (a) | Excludes sales charge. |
| (b) | Not annualized for periods less than one year. |
| (c) | Annualized for periods less than one year. |
| (d) | During the period, certain fees may have been waived and/or reimbursed. If such waivers/reimbursements had not occurred, the ratios would have been as indicated. |
| (e) | Portfolio turnover is calculated on the basis of the Fund as a whole without distinguishing among the classes of shares. |
| (f) | Per share calculations were performed using average shares method. |
| (g) | For the period from October 31, 2008 (predecessor fund fiscal year end) through July 31, 2009. |
| (h) | Ratios of expenses to average net assets include interest expenses of less than 0.005% for the period ended July 31, 2009, which is not included in the contractual expense limitations. The interest expense is from utilizing a line of credit. |
| (i) | Per share amounts calculated using SEC method. |
| (j) | Effective September 16, 2013, Fiduciary Shares were renamed Institutional Service Class Shares. |
| (k) | For the period from July 24, 2009 (commencement of operations) through July 31, 2009. |
| (l) | For the period from September 19, 2013 (commencement of operations) through January 31, 2014. Total return is calculated based on inception date of September 18, 2013 through January 31, 2014. |
The accompanying notes are an integral part of these financial statements.
167
| Fund Commentary | Nationwide Ziegler NYSE Arca Tech 100 Index Fund |
For the semiannual period ended January 31, 2014, the Nationwide Ziegler NYSE Arca Tech 100 Index Fund (Class A) returned 13.95%* versus 13.88 % for its benchmark, the NYSE Arca Tech 100 Index®. For broader comparison, the median return for the Fund’s closest Lipper peer category of Science & Technology Funds (consisting of 155 funds as of January 31, 2014) was 14.94% for the same time period.
*Performance prior to the Fund’s inception on September 16, 2013, is based on the performance of the Fund’s predecessor fund.
U.S. economic data suggested an overall improvement in economic conditions, and U.S. equities performed well during the six-month reporting period ended January 31, 2014, with the S&P 500 Index, a broad market indicator, returning 6.8% for the same time period. The information technology sector within the S&P 500 Index performed even better, appreciating 13.0% for the same period, as investors were drawn to the sector by its attractive prospects for future earnings growth. The information technology sector continues to appear attractive versus others sectors in the market; the Fund, with two-thirds of its holdings in technology, is well positioned to take advantage of gains. The Fund also provides diversification through other sectors such as health care, which utilizes important technology to achieve growth.
The Fund is passively managed to the NYSE Arca Tech 100 Index, so performance differences between the Fund and its benchmark are primarily the result of Fund expenses and investor capital flows. Because the Fund is passively managed, it makes no active industry or security-selection bets as an investment strategy; therefore, the Fund’s performance reflects the NYSE Arca Tech 100 Index’s exposure to various industries and the individual stocks in the index.
The New York Stock Exchange maintains the Index and determines any addition or deletion of constituents, which generally are driven by an annual rebalance or member corporate actions. There were several corporate actions affecting the portfolio’s composition during the reporting period. A consortium of private investors bought
BMC Software (BMC) in mid-September and it was replaced in the Index by Informatica Corp. (INFA), a global provider of enterprise data integration and data quality software and services. Dell Computer (DELL) was removed from the Fund at the end of October, when it also was taken private, and was replaced with Fusion-io Inc. (FIO), a global provider of storage memory platforms. At the end of January, biotechnology company ViroPharma Inc. (VPHM) was acquired by Shire plc. and replaced with MasterCard Inc. (MA), a global transaction processing and payment-related services company.
Specific stocks that detracted from Fund performance during the reporting period included a 1.02% portfolio holding in Teradata Corp. (TDC), which provides data warehousing solutions. The stock declined 30.5% during the reporting period and detracted 0.40% from the Fund’s total return. A 1.30% position within the Fund in Citrix Systems, a global provider of enterprise and online services for cloud computing, declined 24.9% and detracted 0.39% from the Fund’s total return during the reporting period.
The Fund carried a 67% exposure to stocks in the information technology sector during the reporting period, with its largest industry exposure being an 18.6% allocation to software companies. The 21 stocks in that industry produced a weighted average return of 13.9% for the reporting period and contributed 2.36% to the Fund’s total return for the period. A 1.05% Fund holding in enterprise cloud computing solutions provider Salesforce.com (CRM) appreciated 38.35% and added 0.37% to the Fund’s total return for the period.
The Fund’s holdings are well diversified across numerous sectors and industries, with almost 25% of the Fund’s assets invested across 17 companies among 4 industries within the health-care sector. These investments outside of the “traditional” information technology sector have provided an effective diversification feature that has lowered the historical volatility of the Fund relative to its peers. The Fund’s allocation to the health-care sector contributed 2.66% to the Fund’s total return for the reporting period, led by the Fund’s
168
| Fund Commentary (con’t.) | Nationwide Ziegler NYSE Arca Tech 100 Index Fund |
5.1% position in Biogen Idec Inc. (BIIB) that contributed 2.0% to the Fund’s total return for the period. The provider of therapies for autoimmune diseases and cancer appreciated 43.3% during the reporting period, bolstered by positive revenue and earnings growth.
The Fund carried a 4.4% exposure to the aerospace and defense industry within the industrials sector during the reporting period, invested between two stocks: Lockheed Martin Corp. (LMT), which appreciated 28.0%, and Raytheon Co. (RTN), which returned 34.1% for the reporting period. These stocks had fallen out of favor with investors in past years, and these investors had discounted them in anticipation of defense spending cuts, but the stocks have been showing surprisingly strong relative earnings growth during recent quarters.
We continue to believe that the technology sector has attractive valuations and strong relative growth as companies look to increase their capital spending in the coming year.
Subadviser:
Ziegler Capital Management, LLC
Portfolio Managers:
Mikhail I. Alkhazov and David J. Nesbitt
The Fund seeks to match the performance of an index. Correlation between Fund performance and index performance may be affected by Fund expenses, index composition changes, and the timing of Fund share purchases and redemptions. Funds that concentrate on specific sectors may be subject to greater volatility than that of other mutual funds. The Fund may invest in more-aggressive investments such as derivatives (many of which create investment leverage and are highly volatile) and exchange-traded funds (ETFs) (shareholders will bear additional costs). Please refer to the summary prospectus for a more detailed explanation of the Fund’s principal risks.
“Archipelago®”, “ARCA®”, “ARCAEX®”, “NYSE®”, “NYSE ARCASM” and “NYSE Arca Tech 100SM” are trademarks of the NYSE Group, Inc. and Archipelago Holdings, Inc. and have been licensed for use by the Nationwide Funds. This Fund is not sponsored, endorsed, sold or promoted by Archipelago Holdings, Inc. (“ARCA”). ARCA makes no representation or warranty regarding the advisability of investing in securities generally, in the Fund particularly, or the ability of the NYSE Arca Tech 100 Index to track general stock market performance.
A description of the benchmarks can be found on the Market Index Definitions page at the back of this book.
169
| Fund Overview (Unaudited) | Nationwide Ziegler NYSE Arca Tech 100 Index Fund |
Objective
The Fund seeks to track the total return of the NYSE Arca Tech 100 Index before deducting Fund expenses.
Highlights
| Ÿ | For the semiannual period ended January 31, 2014, the Nationwide Ziegler NYSE Arca Tech 100 Index Fund (Class A) returned 13.95%, outperforming the benchmark by 0.07% and underperforming the peer category by 0.99%. |
Asset Allocation†
| Common Stocks | 98.8% | |||
| Exchange Traded Fund | 0.9% | |||
| Mutual Fund | 0.5% | |||
| Liabilities in excess of other assets | (0.2)% | |||
| 100.0% |
Top Industries††
| Software | 18.1% | |||
| Information Technology Services | 14.4% | |||
| Communications Equipment | 10.0% | |||
| Semiconductors & Semiconductor Equipment | 9.8% | |||
| Biotechnology | 9.5% | |||
| Pharmaceuticals | 6.1% | |||
| Computers & Peripherals | 6.0% | |||
| Internet Software & Services | 4.8% | |||
| Life Sciences Tools & Services | 4.6% | |||
| Aerospace & Defense | 4.5% | |||
| Other Industries | 12.2% | |||
| 100.0% |
Top Holdings††
| Biogen Idec, Inc. | 5.8% | |||
| Visa, Inc., Class A | 4.0% | |||
| International Business Machines Corp. | 3.3% | |||
| Lockheed Martin Corp. | 2.8% | |||
| Valeant Pharmaceuticals International, Inc. | 2.5% | |||
| Amgen, Inc. | 2.2% | |||
| Thermo Fisher Scientific, Inc. | 2.1% | |||
| F5 Networks, Inc. | 2.0% | |||
| Open Text Corp. | 1.8% | |||
| Raytheon Co. | 1.8% | |||
| Other Holdings | 71.7% | |||
| 100.0% |
| † | Percentages indicated are based upon net assets as of January 31, 2014. |
| †† | Percentages indicated are based upon total investments as of January 31, 2014. |
170
| Fund Performance | Nationwide Ziegler NYSE Arca Tech 100 Index Fund |
Average Annual Total Return
(For periods ended January 31, 2014)
| Six Months* | 1 Yr. | 5 Yr. | 10 Yr. | |||||||||||||||
| Class A | w/o SC1 | 13.95% | �� | 27.84% | 23.42% | 8.65% | ||||||||||||
| w/SC2 | 7.68% | 20.80% | 22.04% | 8.04% | ||||||||||||||
| Class C | w/o SC1 | 13.61% | 27.10% | 22.66% | 7.91% | |||||||||||||
| w/SC3 | 12.61% | 26.10% | 22.66% | 7.91% | ||||||||||||||
| Institutional Service Class4,5 | w/o SC | 14.07% | 28.15% | 23.73% | 8.78% | |||||||||||||
| Institutional Class4 | w/o SC | 8.46% | 6 | — | — | — | ||||||||||||
All figures showing the effect of a sales charge (SC) reflect the maximum charge possible, because it has the most significant effect on performance data.
| * | Not annualized. |
| 1 | These returns do not reflect the effects of SCs. |
| 2 | For the period from September 16, 2013 through January 31, 2014 a front-end sales charge of 5.75% was deducted. Prior to September 16, 2013, a front-end sales charge of 5.50% was deducted. |
| 3 | A 1.00% CDSC was deducted from the one year return because it is charged when you sell Class C shares within the first year after purchase. |
| 4 | Not subject to any SCs. |
| 5 | Effective September 16, 2013 Fiduciary Shares were renamed Institutional Service Class Shares. |
| 6 | Since inception date of September 18, 2013. Not Annualized. |
Expense Ratios
| Gross Expense Ratio* | Net Expense Ratio* | |||||
| Class A | 1.10% | 1.08% | ||||
| Class C | 1.60% | 1.60% | ||||
| Institutional Service Class | 0.85% | 0.83% | ||||
| Institutional Class | 0.60% | 0.60% | ||||
| * | Current effective prospectus dated September 16, 2013. The difference between gross and net operating expenses reflects contractual waivers in place through November 30, 2015. Please see the Fund’s most recent prospectus for details. |
171
| Fund Performance | Nationwide Ziegler NYSE Arca Tech 100 Index Fund |
Performance of a $10,000 Investment
Investment return and principal value will fluctuate, and when redeemed, shares may be worth more or less than original cost. Past performance is no guarantee of future results and does not reflect the deduction of taxes that a shareholder would pay on fund distributions or the redemption of fund shares. Investing in mutual funds involves market risk, including loss of principal. Performance returns assume the reinvestment of all distributions.
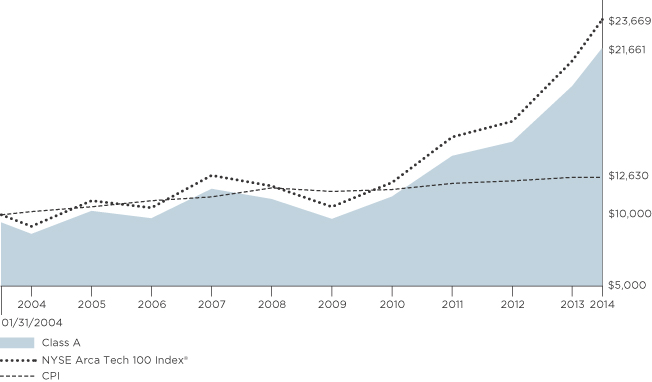
Comparative performance of $10,000 invested in Class A shares of the Nationwide Ziegler NYSE Arca Tech 100 Index Fund versus the NYSE Arca Tech 100 Index® and the Consumer Price Index (CPI) over the 10-year period ended 1/31/14. Fund performance prior to the Fund’s inception on 9/16/13 is based on the Fund’s predecessor Fund. Unlike the Fund, the performance for these unmanaged indexes does not reflect any fees, expenses, or sales charges. One cannot invest directly in a market index. A description of the benchmarks can be found on the Market Index Definitions page at the back of this book.
172
| Shareholder Expense Example | Nationwide Ziegler NYSE Arca Tech 100 Index Fund |
As a shareholder of the Fund, you incur two types of costs: (1) transaction costs, including sales charges (loads) paid on purchase payments and redemption fees; and (2) ongoing costs, including investment advisory fees, administration fees, distribution fees and other Fund expenses. The examples below are intended to help you understand your ongoing costs (in dollars) of investing in the Fund and to compare these costs with the ongoing costs of investing in other mutual funds. Per Securities and Exchange Commission (“SEC”) requirements, the examples assume that you had a $1,000 investment in the Class at the beginning of the reporting period (August 1, 2013) and continued to hold your shares at the end of the reporting period (January 31, 2014).
Actual Expenses
For each Class of the Fund in the table below, the first line provides information about actual account values and actual expenses. You may use the information in this line, together with the amount you invested, to estimate the expenses that you paid from August 1, 2013 through January 31, 2014. Simply divide your account value by $1,000 (for example, an $8,600 account value divided by $1,000 = 8.6), then multiply the result by the number in the first line of each Class under the heading entitled “Expenses Paid During Period” to estimate the expenses you paid on your account during this period.
Hypothetical Expenses for Comparison Purposes
The second line of each Class in the table below provides information about hypothetical account values and hypothetical expenses based on the Class’ actual expense ratio and an assumed rate of return of 5% per year before expenses, which is not the Class’ actual return. The hypothetical account values and expenses may not be used to estimate the actual ending account balance or expenses you paid for the period from August 1, 2013 through January 31, 2014. You may use this information to compare the ongoing costs of investing in the Class of the Fund and other funds. To do so, compare this 5% hypothetical example with the 5% hypothetical examples that appear in the shareholder reports of the other funds.
Please note that the expenses shown in the table are meant to highlight your ongoing costs only and do not reflect any transaction costs, such as sales charges (loads) or redemption fees. If these transaction costs were included, your costs would have been higher. Therefore, the second line for each Class in the table is useful in comparing ongoing costs only, and will not help you determine the relative total costs of owning different funds. The examples also assume all dividends and distributions are reinvested.
Schedule of Shareholder Expenses
Expense Analysis of a $1,000 Investment
Nationwide Ziegler NYSE Arca January 31, 2014 | Beginning Account Value ($) 08/01/13 | Ending Account Value ($) 01/31/14 | Expenses Paid During Period ($) 08/01/13 - 01/31/14 | Expense Ratio During Period (%) 08/01/13 - 01/31/14 | ||||||||
| Class A Shares | Actual | a | 1,000.00 | 1,139.50 | 5.61 | 1.04 | ||||||
| Hypothetical | a,b | 1,000.00 | 1,019.96 | 5.30 | 1.04 | |||||||
| Class C Shares | Actual | a | 1,000.00 | 1,136.10 | 8.61 | 1.60 | ||||||
| Hypothetical | a,b | 1,000.00 | 1,017.14 | 8.13 | 1.60 | |||||||
| Institutional Service Class Sharesc | Actual | a | 1,000.00 | 1,140.70 | 4.26 | 0.79 | ||||||
| Hypothetical | a,b | 1,000.00 | 1,021.22 | 4.02 | 0.79 | |||||||
| Institutional Class Shares | Actual | d | 1,000.00 | 1,084.60 | 2.27 | 0.59 | ||||||
| Hypothetical | a,b | 1,000.00 | 1,022.23 | 3.01 | 0.59 | |||||||
| a | Expenses are equal to the Fund’s annualized expense ratio multiplied by the average account value from August 1, 2013 through January 31, 2014 multiplied to reflect one-half year period. The expense ratio presented represents a six-month, annualized ratio in accordance with Securities and Exchange Commission guidelines. |
| b | Represents the hypothetical 5% return before expenses. |
| c | Effective September 16, 2013, Fiduciary Shares were renamed Institutional Service Class Shares. |
| d | Actual expenses are equal to the Fund’s annualized expense ratio multiplied by the average account value from September 19, 2013 through January 31, 2014 to reflect the period from commencement of operations. |
173
Statement of Investments
January 31, 2014 (Unaudited)
Nationwide Ziegler NYSE Arca Tech 100 Index Fund
| Common Stocks 98.8% | ||||||||||
| Shares | Market Value | |||||||||
| ||||||||||
Aerospace & Defense 4.6% |
| |||||||||
Lockheed Martin Corp. | 52,100 | $ | 7,862,411 | |||||||
Raytheon Co. | 52,100 | 4,953,147 | ||||||||
|
| |||||||||
| 12,815,558 | ||||||||||
|
| |||||||||
| ||||||||||
Biotechnology 9.5% |
| |||||||||
Amgen, Inc. | 52,100 | 6,197,295 | ||||||||
Biogen Idec, Inc.* | 52,100 | 16,288,544 | ||||||||
Gilead Sciences, Inc.* | 52,100 | 4,201,865 | ||||||||
|
| |||||||||
| 26,687,704 | ||||||||||
|
| |||||||||
| ||||||||||
Communications Equipment 10.0% |
| |||||||||
ARRIS Group, Inc.* | 52,100 | 1,349,390 | ||||||||
Ciena Corp.* | 52,100 | 1,215,493 | ||||||||
Cisco Systems, Inc. | 52,100 | 1,141,511 | ||||||||
Comtech Telecommunications Corp. | 52,100 | 1,584,882 | ||||||||
F5 Networks, Inc.* | 52,100 | 5,574,700 | ||||||||
Harmonic, Inc.* | 52,100 | 341,776 | ||||||||
Harris Corp. | 52,100 | 3,612,614 | ||||||||
InterDigital, Inc. | 52,100 | 1,497,875 | ||||||||
Ixia* | 52,100 | 666,359 | ||||||||
JDS Uniphase Corp.* | 52,100 | 692,409 | ||||||||
Juniper Networks, Inc.* | 52,100 | 1,386,381 | ||||||||
Motorola Solutions, Inc. | 52,100 | 3,323,980 | ||||||||
Nokia OYJ, ADR-FI* | 52,100 | 360,532 | ||||||||
Polycom, Inc.* | 52,100 | 621,553 | ||||||||
QUALCOMM, Inc. | 52,100 | 3,866,862 | ||||||||
Riverbed Technology, Inc.* | 52,100 | 1,027,412 | ||||||||
|
| |||||||||
| 28,263,729 | ||||||||||
|
| |||||||||
| ||||||||||
Computers & Peripherals 6.0% |
| |||||||||
EMC Corp. | 52,100 | 1,262,904 | ||||||||
Fusion-io, Inc.* | 52,100 | 573,100 | ||||||||
Hewlett-Packard Co. | 52,100 | 1,510,900 | ||||||||
NetApp, Inc. | 52,100 | 2,205,914 | ||||||||
QLogic Corp.* | 52,100 | 602,797 | ||||||||
SanDisk Corp. | 52,100 | 3,623,555 | ||||||||
Seagate Technology PLC | 52,100 | 2,754,006 | ||||||||
Western Digital Corp. | 52,100 | 4,489,457 | ||||||||
|
| |||||||||
| 17,022,633 | ||||||||||
|
| |||||||||
| ||||||||||
Diversified Telecommunication Services 0.6% |
| |||||||||
AT&T, Inc. | 52,100 | 1,735,972 | ||||||||
|
| |||||||||
| ||||||||||
Electronic Equipment, Instruments & Components 2.5% |
| |||||||||
Amphenol Corp., Class A | 52,100 | 4,526,448 | ||||||||
Corning, Inc. | 52,100 | 896,641 | ||||||||
FLIR Systems, Inc. | 52,100 | 1,652,612 | ||||||||
|
| |||||||||
| 7,075,701 | ||||||||||
|
| |||||||||
| ||||||||||
Energy Equipment & Services 2.5% |
| |||||||||
Halliburton Co. | 52,100 | 2,553,421 | ||||||||
Schlumberger Ltd. | 52,100 | 4,562,397 | ||||||||
|
| |||||||||
| 7,115,818 | ||||||||||
|
| |||||||||
| Common Stocks (continued) | ||||||||||
| Shares | Market Value | |||||||||
| ||||||||||
Health Care Equipment & Supplies 4.5% |
| |||||||||
Baxter International, Inc. | 52,100 | $ | 3,558,430 | |||||||
Boston Scientific Corp.* | 52,100 | 704,913 | ||||||||
CONMED Corp. | 52,100 | 2,185,595 | ||||||||
Medtronic, Inc. | 52,100 | 2,946,776 | ||||||||
St. Jude Medical, Inc. | 52,100 | 3,164,033 | ||||||||
|
| |||||||||
| 12,559,747 | ||||||||||
|
| |||||||||
| ||||||||||
Information Technology Services 14.4% |
| |||||||||
Amdocs Ltd. | 52,100 | 2,253,846 | ||||||||
Automatic Data Processing, Inc. | 52,100 | 3,990,860 | ||||||||
Computer Sciences Corp. | 52,100 | 3,147,361 | ||||||||
DST Systems, Inc. | 52,100 | 4,741,100 | ||||||||
International Business Machines Corp. | 52,100 | 9,205,028 | ||||||||
MasterCard, Inc., Class A | 52,100 | 3,942,928 | ||||||||
Teradata Corp.* | 52,100 | 2,142,352 | ||||||||
Visa, Inc., Class A | 52,100 | 11,223,903 | ||||||||
|
| |||||||||
| 40,647,378 | ||||||||||
|
| |||||||||
| ||||||||||
Internet Software & Services 4.8% |
| |||||||||
Akamai Technologies, Inc.* | 52,100 | 2,484,128 | ||||||||
Digital River, Inc.* | 52,100 | 915,918 | ||||||||
eBay, Inc.* | 52,100 | 2,771,720 | ||||||||
j2 Global, Inc. | 52,100 | 2,362,735 | ||||||||
VeriSign, Inc.* | 52,100 | 3,060,875 | ||||||||
Yahoo!, Inc.* | 52,100 | 1,876,642 | ||||||||
|
| |||||||||
| 13,472,018 | ||||||||||
|
| |||||||||
| ||||||||||
Life Sciences Tools & Services 4.6% |
| |||||||||
Agilent Technologies, Inc. | 52,100 | 3,029,615 | ||||||||
Life Technologies Corp.* | 52,100 | 3,963,247 | ||||||||
Thermo Fisher Scientific, Inc. | 52,100 | 5,998,794 | ||||||||
|
| |||||||||
| 12,991,656 | ||||||||||
|
| |||||||||
| ||||||||||
Office Electronics 0.2% |
| |||||||||
Xerox Corp. | 52,100 | 565,285 | ||||||||
|
| |||||||||
| ||||||||||
Pharmaceuticals 6.1% | ||||||||||
AstraZeneca PLC, ADR-UK | 52,100 | 3,308,350 | ||||||||
Bristol-Myers Squibb Co. | 52,100 | 2,603,437 | ||||||||
Novartis AG, ADR-CH | 52,100 | 4,119,547 | ||||||||
Valeant Pharmaceuticals International, Inc.* | 52,100 | 7,066,844 | ||||||||
|
| |||||||||
| 17,098,178 | ||||||||||
|
| |||||||||
| ||||||||||
Semiconductors & Semiconductor Equipment 9.8% |
| |||||||||
Altera Corp. | 52,100 | 1,741,703 | ||||||||
Analog Devices, Inc. | 52,100 | 2,514,867 | ||||||||
Applied Materials, Inc. | 52,100 | 876,322 | ||||||||
Broadcom Corp., Class A | 52,100 | 1,550,496 | ||||||||
Cypress Semiconductor Corp.* | 52,100 | 523,084 | ||||||||
Intel Corp. | 52,100 | 1,278,534 | ||||||||
KLA-Tencor Corp. | 52,100 | 3,202,587 | ||||||||
Lam Research Corp.* | 52,100 | 2,636,781 | ||||||||
Linear Technology Corp. | 52,100 | 2,320,534 | ||||||||
174
Statement of Investments (Continued)
January 31, 2014 (Unaudited)
Nationwide Ziegler NYSE Arca Tech 100 Index Fund (Continued)
| Common Stocks (continued) | ||||||||||
| Shares | Market Value | |||||||||
| ||||||||||
Semiconductors & Semiconductor Equipment (continued) |
| |||||||||
LSI Corp. | 52,100 | $ | 574,663 | |||||||
Microchip Technology, Inc. | 52,100 | 2,337,206 | ||||||||
NVIDIA Corp. | 52,100 | 817,970 | ||||||||
SunEdison, Inc.* | 52,100 | 724,711 | ||||||||
Teradyne, Inc.* | 52,100 | 980,001 | ||||||||
Tessera Technologies, Inc. | 52,100 | 1,034,185 | ||||||||
Texas Instruments, Inc. | 52,100 | 2,209,040 | ||||||||
Xilinx, Inc. | 52,100 | 2,418,482 | ||||||||
|
| |||||||||
| 27,741,166 | ||||||||||
|
| |||||||||
| ||||||||||
Software 18.2% |
| |||||||||
Activision Blizzard, Inc. | 52,100 | 892,473 | ||||||||
Adobe Systems, Inc.* | 52,100 | 3,083,799 | ||||||||
Autodesk, Inc.* | 52,100 | 2,670,125 | ||||||||
CA, Inc. | 52,100 | 1,671,368 | ||||||||
Check Point Software Technologies Ltd.* | 52,100 | 3,408,903 | ||||||||
Citrix Systems, Inc.* | 52,100 | 2,817,047 | ||||||||
Compuware Corp. | 52,100 | 528,294 | ||||||||
Informatica Corp.* | 52,100 | 2,102,756 | ||||||||
Intuit, Inc. | 52,100 | 3,816,325 | ||||||||
Microsoft Corp. | 52,100 | 1,971,985 | ||||||||
Open Text Corp. | 52,100 | 5,152,690 | ||||||||
Oracle Corp. | 52,100 | 1,922,490 | ||||||||
Progress Software Corp.* | 52,100 | 1,259,257 | ||||||||
PTC, Inc.* | 52,100 | 1,858,928 | ||||||||
Red Hat, Inc.* | 52,100 | 2,943,650 | ||||||||
Salesforce.com, Inc.* | 52,100 | 3,153,613 | ||||||||
SAP AG, ADR-DE | 52,100 | 3,981,482 | ||||||||
Symantec Corp. | 52,100 | 1,115,461 | ||||||||
Synopsys, Inc.* | 52,100 | 2,076,706 | ||||||||
VMware, Inc., Class A* | 52,100 | 4,696,294 | ||||||||
|
| |||||||||
| 51,123,646 | ||||||||||
|
| |||||||||
| ||||||||||
Wireless Telecommunication Services 0.5% |
| |||||||||
Telephone & Data Systems, Inc. | 52,100 | 1,407,742 | ||||||||
|
| |||||||||
Total Common Stocks | 278,323,931 | |||||||||
|
| |||||||||
| Exchange Traded Fund 0.9% | ||||||||||
Equity Fund 0.9% |
| |||||||||
Powershares QQQ Trust | 28,799 | 2,484,489 | ||||||||
|
| |||||||||
Total Exchange Traded Fund | 2,484,489 | |||||||||
|
| |||||||||
| Mutual Fund 0.5% | ||||||||||
| Shares | Market Value | |||||||||
| ||||||||||
Money Market Fund 0.5% |
| |||||||||
Fidelity Institutional Money Market Fund — Institutional Class, 0.08% (a) | 1,515,711 | $ | 1,515,711 | |||||||
|
| |||||||||
Total Mutual Fund |
| 1,515,711 | ||||||||
|
| |||||||||
Total Investments |
| 282,324,131 | ||||||||
Liabilities in excess of other |
| (608,251 | ) | |||||||
|
| |||||||||
NET ASSETS — 100.0% |
| $ | 281,715,880 | |||||||
|
| |||||||||
| * | Denotes a non-income producing security. |
| (a) | Represents 7-day effective yield as of January 31, 2014. |
| (b) | See notes to financial statements for tax cost and unrealized appreciation/(depreciation) of securities. |
| ADR | American Depositary Receipt |
| AG | Stock Corporation |
| CH | Switzerland |
| DE | Germany |
| FI | Finland |
| Ltd. | Limited |
| OYJ | Public Traded Company |
| PLC | Public Limited Company |
| UK | United Kingdom |
175
The accompanying notes are an integral part of these financial statements.
Statement of Assets and Liabilities
January 31, 2014 (Unaudited)
| Nationwide Ziegler NYSE Arca Tech 100 Index Fund | ||||||
Assets: | ||||||
Investments, at value (cost $156,198,973) | $ | 282,324,131 | ||||
Dividends receivable | 113,449 | |||||
Receivable for capital shares issued | 652,813 | |||||
Reclaims receivable | 39,476 | |||||
Prepaid expenses | 19,935 | |||||
|
| |||||
Total Assets | 283,149,804 | |||||
|
| |||||
Liabilities: | ||||||
Payable for investments purchased | 661,873 | |||||
Payable for capital shares redeemed | 392,838 | |||||
Accrued expenses and other payables: | ||||||
Investment advisory fees | 78,885 | |||||
Fund administration fees | 33,865 | |||||
Distribution fees | 65,517 | |||||
Administrative servicing fees | 122,131 | |||||
Accounting and transfer agent fees | 21,848 | |||||
Trustee fees | 2,966 | |||||
Deferred compensation (Note 2) | 15,288 | |||||
Custodian fees | 1,377 | |||||
Compliance program costs (Note 3) | 558 | |||||
Professional fees | 14,444 | |||||
Printing fees | 21,540 | |||||
Other | 794 | |||||
|
| |||||
Total Liabilities | 1,433,924 | |||||
|
| |||||
Net Assets | $ | 281,715,880 | ||||
|
| |||||
Represented by: | ||||||
Capital | $ | 234,765,174 | ||||
Accumulated distributions in excess of net investment income | (135,839 | ) | ||||
Accumulated net realized losses from investment transactions | (79,038,613 | ) | ||||
Net unrealized appreciation/(depreciation) from investments | 126,125,158 | |||||
|
| |||||
Net Assets | $ | 281,715,880 | ||||
|
| |||||
176
Statement of Assets and Liabilities (Continued)
January 31, 2014 (Unaudited)
| Nationwide Ziegler NYSE Arca Tech 100 Index Fund | ||||||
Net Assets: | ||||||
Class A Shares | $ | 239,018,730 | ||||
Class C Shares | 17,244,680 | |||||
Institutional Service Class Shares | 25,319,312 | |||||
Institutional Class Shares | 133,158 | |||||
|
| |||||
Total | $ | 281,715,880 | ||||
|
| |||||
Shares Outstanding (unlimited number of shares authorized): | ||||||
Class A Shares | 4,873,389 | |||||
Class C Shares | 385,409 | |||||
Institutional Service Class Shares | 511,785 | |||||
Institutional Class Shares | 2,693 | |||||
|
| |||||
Total | 5,773,276 | |||||
|
| |||||
Net asset value and redemption price per share (Net assets by class divided by shares outstanding by class, respectively): | ||||||
Class A Shares (a) | $ | 49.05 | ||||
Class C Shares (b) | $ | 44.74 | ||||
Institutional Service Class Shares | $ | 49.47 | ||||
Institutional Class Shares | $ | 49.45 | ||||
Maximum offering price per share (100%/(100%-maximum sales charge) of net asset value adjusted to the nearest cent): | ||||||
Class A Shares | $ | 52.04 | ||||
|
| |||||
Maximum Sales Charge: | ||||||
Class A Shares | 5.75 | % | ||||
|
| |||||
| (a) | For Class A Shares, the redemption price per share is reduced by 1.00% on sales of shares of original purchases of $1,000,000 or more or that were not subject to a front-end sales charge made with 18 months of the purchase date. |
| (b) | For Class C Shares, the redemption price per share is reduced by 1.00% for shares held less than 1 year. |
The accompanying notes are an integral part of these financial statements.
177
Statement of Operations
For the Six Months Ended January 31, 2014 (Unaudited)
| Nationwide Ziegler NYSE Arca Tech 100 Index Fund | ||||||
INVESTMENT INCOME: | ||||||
Dividend income | $ | 1,651,490 | ||||
Foreign tax withholding | (7,391 | ) | ||||
|
| |||||
Total Income | 1,644,099 | |||||
|
| |||||
EXPENSES: | ||||||
Investment advisory fees | 440,947 | |||||
Fund administration fees | 186,274 | |||||
Distribution fees Class A | 280,989 | |||||
Distribution fees Class B (a) | 2,535 | |||||
Distribution fees Class C | 78,117 | |||||
Administrative servicing fees Class A | 238,070 | |||||
Administrative servicing fees Class B (a) | 845 | |||||
Administrative servicing fees Institutional Service Class (b) | 22,287 | |||||
Registration and filing fees | 29,126 | |||||
Professional fees | 20,737 | |||||
Printing fees | 38,251 | |||||
Trustee fees | 4,713 | |||||
Custodian fees | 6,162 | |||||
Accounting and transfer agent fees | 54,229 | |||||
Compliance program costs (Note 3) | 1,893 | |||||
Other | 26,844 | |||||
|
| |||||
Total expenses before earnings credit, fees waived, and expenses reimbursed | 1,432,019 | |||||
|
| |||||
Earnings credit (Note 5) | (196 | ) | ||||
Investment advisory fees waived (Note 3) | (12,386 | ) | ||||
Administrative servicing fees voluntarily waived — Class A (Note 3) | (26,555 | ) | ||||
Administrative servicing fees voluntarily waived — Institutional Service Class (b) (Note 3) | (2,309 | ) | ||||
Expenses reimbursed by adviser (Note 3) | (4,903 | ) | ||||
|
| |||||
Net Expenses | 1,385,670 | |||||
|
| |||||
NET INVESTMENT INCOME | 258,429 | |||||
|
| |||||
REALIZED/UNREALIZED GAINS (LOSSES) FROM INVESTMENTS: | ||||||
Net realized gains from investment transactions | 2,812,681 | |||||
Net change in unrealized appreciation/(depreciation) from investments | 30,962,467 | |||||
|
| |||||
Net realized/unrealized gains from investments | 33,775,148 | |||||
|
| |||||
CHANGE IN NET ASSETS RESULTING FROM OPERATIONS | $ | 34,033,577 | ||||
|
| |||||
| (a) | Effective September 16, 2013, Class B Shares converted into Class A Shares. |
| (b) | Effective September 16, 2013, Fiduciary Shares were renamed Institutional Service Class Shares. |
The accompanying notes are an integral part of these financial statements.
178
Statements of Changes in Net Assets
| Nationwide Ziegler NYSE Arca Tech 100 Index Fund | ||||||||||||
| Six Months Ended January 31, 2014 (Unaudited) | Year Ended July 31, 2013 | |||||||||||
Operations: | ||||||||||||
Net investment income | $ | 258,429 | $ | 743,106 | ||||||||
Net realized gains from investment transactions | 2,812,681 | 3,953,136 | ||||||||||
Net change in unrealized appreciation/(depreciation) from investments | 30,962,467 | 44,583,754 | ||||||||||
|
|
|
| |||||||||
Change in net assets resulting from operations | 34,033,577 | 49,279,996 | ||||||||||
|
|
|
| |||||||||
Distributions to Shareholders From: | ||||||||||||
Net investment income: | ||||||||||||
Class A | (536,399 | ) | (242,613 | ) | ||||||||
Class B (a) | – | – | ||||||||||
Class C | – | – | ||||||||||
Institutional Service Class (b) | (110,524 | ) | (28,571 | ) | ||||||||
Institutional Class | (62 | )(c) | – | |||||||||
|
|
|
| |||||||||
Change in net assets from shareholder distributions | (646,985 | ) | (271,184 | ) | ||||||||
|
|
|
| |||||||||
Change in net assets from capital transactions | 3,024,316 | 3,236,202 | ||||||||||
|
|
|
| |||||||||
Change in net assets | 36,410,908 | 52,245,014 | ||||||||||
|
|
|
| |||||||||
Net Assets: | ||||||||||||
Beginning of period | 245,304,972 | 193,059,958 | ||||||||||
|
|
|
| |||||||||
End of period | $ | 281,715,880 | $ | 245,304,972 | ||||||||
|
|
|
| |||||||||
Accumulated undistributed (distributions in excess of) net investment income at end of period | $ | (135,839 | ) | $ | 252,717 | |||||||
|
|
|
| |||||||||
CAPITAL TRANSACTIONS: | ||||||||||||
Class A Shares | ||||||||||||
Proceeds from shares issued | $ | 24,185,419 | $ | 46,342,546 | (d) | |||||||
Dividends reinvested | 504,578 | 226,311 | ||||||||||
Cost of shares redeemed | (24,755,032 | ) | (48,959,110 | ) | ||||||||
|
|
|
| |||||||||
Total Class A Shares | (65,035 | ) | (2,390,253 | ) | ||||||||
|
|
|
| |||||||||
Class B Shares (a) | ||||||||||||
Proceeds from shares issued | – | 200 | (d) | |||||||||
Dividends reinvested | – | – | ||||||||||
Cost of shares redeemed | (2,873,846 | ) | (1,773,895 | ) | ||||||||
|
|
|
| |||||||||
Total Class B Shares | (2,873,846 | ) | (1,773,695 | ) | ||||||||
|
|
|
| |||||||||
Class C Shares | ||||||||||||
Proceeds from shares issued | 2,762,726 | 1,987,025 | (d) | |||||||||
Dividends reinvested | – | – | ||||||||||
Cost of shares redeemed | (1,441,864 | ) | (1,913,649 | ) | ||||||||
|
|
|
| |||||||||
Total Class C Shares | 1,320,862 | 73,376 | ||||||||||
|
|
|
| |||||||||
| (a) | Effective September 16, 2013, Class B Shares converted into Class A Shares. |
| (b) | Effective September 16, 2013, Fiduciary Shares were renamed Institutional Service Class Shares. |
| (c) | For the period from September 19, 2013 (commencement of operations) through January 31, 2014. |
| (d) | Includes redemption fees. See Note 4 for further information. |
179
Statements of Changes in Net Assets (Continued)
| Nationwide Ziegler NYSE Arca Tech 100 Index Fund | ||||||||||||
| Six Months Ended January 31, 2014 (Unaudited) | Year Ended July 31, 2013 | |||||||||||
CAPITAL TRANSACTIONS: (continued) | ||||||||||||
Institutional Service Class Shares (b) | ||||||||||||
Proceeds from shares issued | $ | 7,569,064 | $ | 14,768,987 | (d) | |||||||
Dividends reinvested | 105,119 | 28,036 | ||||||||||
Cost of shares redeemed | (3,164,315 | ) | (7,470,249 | ) | ||||||||
|
|
|
| |||||||||
Total Institutional Service Class Shares | 4,509,868 | 7,326,774 | ||||||||||
|
|
|
| |||||||||
Institutional Class Shares | ||||||||||||
Proceeds from shares issued | 132,405 | (c) | – | |||||||||
Dividends reinvested | 62 | (c) | – | |||||||||
Cost of shares redeemed | – | (c) | – | |||||||||
|
|
|
| |||||||||
Total Institutional Class Shares | 132,467 | (c) | – | |||||||||
|
|
|
| |||||||||
Change in net assets from capital transactions | $ | 3,024,316 | $ | 3,236,202 | ||||||||
|
|
|
| |||||||||
SHARE TRANSACTIONS: | ||||||||||||
Class A Shares | ||||||||||||
Issued | 527,940 | 1,198,597 | ||||||||||
Reinvested | 10,882 | 6,211 | ||||||||||
Redeemed | (543,377 | ) | (1,292,345 | ) | ||||||||
|
|
|
| |||||||||
Total Class A Shares | (4,555 | ) | (87,537 | ) | ||||||||
|
|
|
| |||||||||
Class B Shares (a) | ||||||||||||
Issued | – | 5 | ||||||||||
Reinvested | – | – | ||||||||||
Redeemed | (72,245 | ) | (52,513 | ) | ||||||||
|
|
|
| |||||||||
Total Class B Shares | (72,245 | ) | (52,508 | ) | ||||||||
|
|
|
| |||||||||
Class C Shares | ||||||||||||
Issued | 66,025 | 56,354 | ||||||||||
Reinvested | – | – | ||||||||||
Redeemed | (34,350 | ) | (55,512 | ) | ||||||||
|
|
|
| |||||||||
Total Class C Shares | 31,675 | 842 | ||||||||||
|
|
|
| |||||||||
Institutional Service Class Shares (b) | ||||||||||||
Issued | 162,678 | 385,422 | ||||||||||
Reinvested | 2,248 | 763 | ||||||||||
Redeemed | (68,655 | ) | (189,452 | ) | ||||||||
|
|
|
| |||||||||
Total Institutional Service Class Shares | 96,271 | 196,733 | ||||||||||
|
|
|
| |||||||||
Institutional Class Shares | ||||||||||||
Issued | 2,692 | (c) | – | |||||||||
Reinvested | 1 | (c) | – | |||||||||
Redeemed | – | (c) | – | |||||||||
|
|
|
| |||||||||
Total Institutional Class Shares | 2,693 | (c) | – | |||||||||
|
|
|
| |||||||||
Total change in shares | 53,839 | 57,530 | ||||||||||
|
|
|
| |||||||||
Amounts designated as “–” are zero or have been rounded to zero.
| (a) | Effective September 16, 2013, Class B Shares converted into Class A Shares. |
| (b) | Effective September 16, 2013, Fiduciary Shares were renamed Institutional Service Class Shares. |
| (c) | For the period from September 19, 2013 (commencement of operations) through January 31, 2014. |
The accompanying notes are an integral part of these financial statements.
180
Financial Highlights
Selected data for each share of capital outstanding throughout the periods indicated
Nationwide Ziegler NYSE Arca Tech 100 Index Fund
| Operations | Distributions | Ratios/Supplemental Data | ||||||||||||||||||||||||||||||||||||||||||||||||||
| Net Asset Value, Beginning of Period | Net Investment Income (Loss) | Net Realized and Unrealized Gains (Losses) from Investments | Total from Operations | Net Investment Income | Total Distributions | Net Asset Value, End of Period | Total Return (a)(b) | Net Assets at End of Period | Ratio of Expenses to Average Net Assets (c) | Ratio of Net Investment Income (Loss) to Average Net Assets (c) | Ratio of Expenses (Prior to Reimbursements) to Average Net Assets (c)(d) | Portfolio Turnover (e) | ||||||||||||||||||||||||||||||||||||||||
| Class A Shares | ||||||||||||||||||||||||||||||||||||||||||||||||||||
Six Months Ended January 31, 2014 (f) (Unaudited) | $ | 43.15 | 0.05 | 5.96 | 6.01 | (0.11 | ) | (0.11 | ) | $ | 49.05 | 13.95% | $ | 239,018,730 | 1.04% | 0.21% | 1.08% | 10.25% | ||||||||||||||||||||||||||||||||||
Year Ended July 31, 2013 (f) | $ | 34.34 | 0.14 | 8.72 | 8.86 | (0.05 | ) | (0.05 | ) | $ | 43.15 | 25.83% | $ | 210,474,970 | 1.08% | 0.37% | 1.22% | 33.00% | ||||||||||||||||||||||||||||||||||
Year Ended July 31, 2012 (f) | $ | 32.07 | (0.02 | ) | 2.29 | 2.27 | – | – | $ | 34.34 | 7.05% | $ | 170,515,922 | 1.08% | (0.07% | ) | 1.27% | 30.00% | ||||||||||||||||||||||||||||||||||
Year Ended July 31, 2011 (f) | $ | 25.62 | (0.05 | ) | 6.50 | 6.45 | – | – | $ | 32.07 | 25.17% | $ | 182,410,113 | 1.08% | (0.15% | ) | 1.27% | 11.00% | ||||||||||||||||||||||||||||||||||
Year Ended July 31, 2010 (f) | $ | 22.06 | (0.06 | ) | 3.62 | 3.56 | – | – | $ | 25.62 | 16.18% | $ | 162,266,663 | 1.08% | (0.26% | ) | 1.25% | 9.00% | ||||||||||||||||||||||||||||||||||
Period Ended July 31, 2009 (f)(g) | $ | 18.53 | (0.03 | ) | 3.56 | 3.53 | – | – | $ | 22.06 | 19.05% | $ | 166,899,338 | 1.27% | (h)(i) | (0.21% | ) (i) | 1.42% | (h)(i) | 10.00% | ||||||||||||||||||||||||||||||||
Year Ended October 31, 2008 | $ | 29.13 | (0.10 | ) (j) | (10.50 | ) | (10.60 | ) | – | – | $ | 18.53 | (36.39% | ) | $ | 157,075,914 | 1.08% | (k) | (0.37% | ) (k) | 1.08% | 19.00% | ||||||||||||||||||||||||||||||
| Class C Shares | ||||||||||||||||||||||||||||||||||||||||||||||||||||
Six Months Ended January 31, 2014 (f) (Unaudited) | $ | 39.38 | (0.08 | ) | 5.44 | 5.36 | – | – | $ | 44.74 | 13.61% | $ | 17,244,680 | 1.60% | (0.36% | ) | 1.61% | 10.25% | ||||||||||||||||||||||||||||||||||
Year Ended July 31, 2013 (f) | $ | 31.49 | (0.08 | ) | 7.97 | 7.89 | – | – | $ | 39.38 | 25.06% | $ | 13,930,080 | 1.68% | (0.23% | ) | 1.72% | 33.00% | ||||||||||||||||||||||||||||||||||
Year Ended July 31, 2012 (f) | $ | 29.58 | (0.20 | ) | 2.11 | 1.91 | – | – | $ | 31.49 | 6.42% | $ | 11,111,107 | 1.68% | (0.67% | ) | 1.77% | 30.00% | ||||||||||||||||||||||||||||||||||
Year Ended July 31, 2011 (f) | $ | 23.78 | (0.21 | ) | 6.01 | 5.80 | – | – | $ | 29.58 | 24.43% | $ | 11,269,283 | 1.68% | (0.75% | ) | 1.77% | 11.00% | ||||||||||||||||||||||||||||||||||
Year Ended July 31, 2010 (f) | $ | 20.59 | (0.20 | ) | 3.39 | 3.19 | – | – | $ | 23.78 | 15.49% | $ | 10,679,964 | 1.68% | (0.86% | ) | 1.75% | 9.00% | ||||||||||||||||||||||||||||||||||
Period Ended July 31, 2009 (f)(g) | $ | 17.39 | (0.12 | ) | 3.32 | 3.20 | – | – | $ | 20.59 | 18.40% | $ | 10,620,406 | 1.99% | (h)(i) | (0.92% | ) (i) | 2.11% | (h)(i) | 10.00% | ||||||||||||||||||||||||||||||||
Year Ended October 31, 2008 | $ | 27.55 | (0.30 | ) (j) | (9.86 | ) | (10.16 | ) | – | – | $ | 17.39 | (36.88% | ) | $ | 12,839,217 | 1.82% | (k) | (1.12% | ) (k) | 1.82% | 19.00% | ||||||||||||||||||||||||||||||
| Institutional Service Class Shares (l) | ||||||||||||||||||||||||||||||||||||||||||||||||||||
Six Months Ended January 31, 2014 (f) (Unaudited) | $ | 43.58 | 0.10 | 6.02 | 6.12 | (0.23 | ) | (0.23 | ) | $ | 49.47 | 14.07% | $ | 25,319,312 | 0.79% | 0.44% | 0.82% | 10.25% | ||||||||||||||||||||||||||||||||||
Year Ended July 31, 2013 (f) | $ | 34.63 | 0.25 | 8.80 | 9.05 | (0.10 | ) | (0.10 | ) | $ | 43.58 | 26.19% | $ | 18,106,198 | 0.81% | 0.64% | 0.97% | 33.00% | ||||||||||||||||||||||||||||||||||
Year Ended July 31, 2012 (f) | $ | 32.26 | 0.06 | 2.31 | 2.37 | – | – | $ | 34.63 | 7.35% | $ | 7,575,853 | 0.81% | 0.20% | 1.02% | 30.00% | ||||||||||||||||||||||||||||||||||||
Year Ended July 31, 2011 (f) | $ | 25.69 | 0.05 | 6.52 | 6.57 | – | – | $ | 32.26 | 25.58% | $ | 5,989,789 | 0.77% | 0.16% | 1.02% | 11.00% | ||||||||||||||||||||||||||||||||||||
Year Ended July 31, 2010 (f) | $ | 22.06 | – | 3.63 | 3.63 | – | – | $ | 25.69 | 16.46% | $ | 311,833 | 0.83% | (0.01% | ) | 1.00% | 9.00% | |||||||||||||||||||||||||||||||||||
Period Ended July 31, 2009 (f)(m) | $ | 22.04 | – | 0.02 | 0.02 | – | – | $ | 22.06 | 0.09% | $ | 20,318 | 0.83% | (h)(i) | 0.24% | (i) | 0.97% | (h)(i) | 10.00% | |||||||||||||||||||||||||||||||||
| Institutional Class Shares | ||||||||||||||||||||||||||||||||||||||||||||||||||||
Period Ended January 31, 2014 (f)(n) (Unaudited) | $ | 45.87 | 0.06 | 3.80 | 3.86 | (0.28 | ) | (0.28 | ) | $ | 49.45 | 8.46% | $ | 133,158 | 0.59% | 0.35% | 0.59% | 10.25% | ||||||||||||||||||||||||||||||||||
Amounts designated as “–” are zero or have been rounded to zero.
| (a) | Excludes sales charge. |
| (b) | Not annualized for periods less than one year. |
| (c) | Annualized for periods less than one year. |
| (d) | During the period, certain fees may have been waived and/or reimbursed. If such waivers/reimbursements had not occurred, the ratios would have been as indicated. |
| (e) | Portfolio turnover is calculated on the basis of the Fund as a whole without distinguishing among the classes of shares. |
| (f) | Per share calculations were performed using average shares method. |
| (g) | For the period from October 31, 2008 (prececessor fund fiscal year end) through July 31, 2009. |
| (h) | Ratios of expenses to average net assets include interest expenses of less than 0.005% for the period ended July 31, 2009, which is not included in the contractual expenses limitation. The interest expense is from utilizing a line of credit. |
| (i) | Does not reflect vendor reimbursement of 0.08%. |
| (j) | Per share amounts calculated using SEC method. |
| (k) | Does not reflect vendor reimbursement of 0.03%. |
| (l) | Effective September 16, 2013, Fiduciary Shares were renamed Institutional Service Class Shares. |
| (m) | For the period from July 23, 2009 (commencement of operations) through July 31, 2009. |
| (n) | For the period from September 19, 2013 (commencement of operations) through January 31, 2014. Total return is calculated based on inception date of September 18, 2013 through January 31, 2014. |
The accompanying notes are an integral part of these financial statements.
181
January 31, 2014 (Unaudited)
1. Organization
Nationwide Mutual Funds (the “Trust”) is registered under the Investment Company Act of 1940, as amended (the “1940 Act”), as an open-end management investment company, organized as a statutory trust under the laws of the State of Delaware. The Trust has authorized an unlimited number of shares of beneficial interest (“shares”), without par value. As of January 31, 2014, the Trust operates fifty-three (53) separate series, or mutual funds, each with its own investment objective(s) and strategies. This report contains the financial statements and financial highlights of the twelve (12) series listed below (each, a “Fund”; collectively, the “Funds”).
-Nationwide Bailard Cognitive Value Fund (“Cognitive Value”)
-Nationwide Bailard International Equities Fund (“International Equities”)
-Nationwide Bailard Technology & Science Fund (“Technology & Science”)
-Nationwide Geneva Mid Cap Growth Fund (“Mid Cap Growth”)
-Nationwide Geneva Small Cap Growth Fund (“Small Cap Growth”)
-Nationwide HighMark Balanced Fund (“Balanced”)
-Nationwide HighMark Large Cap Core Equity Fund (“Large Cap Core Equity”)
-Nationwide HighMark Large Cap Growth Fund (“Large Cap Growth”)
-Nationwide HighMark Small Cap Core Fund (“Small Cap Core”)
-Nationwide HighMark Value Fund (“Value”)
-Nationwide Ziegler Equity Income Fund (“Equity Income”)
-Nationwide Ziegler NYSE Arca Tech 100 Index Fund (“NYSE Arca Tech 100 Index”)
Each Fund commenced operations on September 16, 2013 as a result of a reorganization in which Cognitive Value, International Equities, Technology & Science, Mid Cap Growth, Small Cap Growth, Balanced, Large Cap Core Equity, Large Cap Growth, Small Cap Core, Value, Equity Income, and NYSE Arca Tech 100 Index acquired all of the assets, subject to all liabilities and obligations, of the HighMark Cognitive Value Fund, HighMark International Opportunities Fund, HighMark Enhanced Growth Fund, HighMark Geneva Mid Cap Growth Fund, HighMark Geneva Small Cap Growth Fund, HighMark Balanced Fund, HighMark Large Cap Core Equity Fund, HighMark Large Cap Growth Fund, HighMark Small Cap Core Fund, HighMark Value Fund, HighMark Equity Income Fund, and HighMark NYSE Arca Tech 100 Index Fund, respectively, each a former series of HighMark Funds (each a “Predecessor Fund,” and collectively the “Predecessor Funds”). Each Fund has adopted the historical performance of its corresponding Predecessor Fund. Each Fund and its corresponding Predecessor Fund have substantially similar investment goals and strategies.
Each of the Funds is a diversified fund, as defined in the 1940 Act.
2. Summary of Significant Accounting Policies
The following is a summary of significant accounting policies followed by the Funds in the preparation of their financial statements. The policies are in conformity with accounting principles generally accepted in the United States of America (“U.S. GAAP”). The preparation of financial statements requires Fund management to make estimates and assumptions that affect the reported amounts of assets and liabilities, the disclosure of contingent assets and liabilities at the date of the financial statements, and the reported amounts of income and expenses for the period. The Funds utilize various methods to measure the value of their investments on a recurring basis. Amounts received upon the sale of such investments could differ from those estimated values and those differences could be material.
| (a) | Security Valuation |
The fair market value of the Funds’ portfolio securities is determined in accordance with the procedures described below. U.S. GAAP defines fair value as the price that a Fund would receive to sell an asset or pay to transfer a liability in an orderly transaction between market participants at the measurement date. The Trust’s investment adviser to the Funds, Nationwide Fund Advisors (“NFA”), assigns a fair value to Fund investments in accordance with a hierarchy that prioritizes the various types of inputs used to measure fair value. The hierarchy gives the highest priority to readily available unadjusted quoted prices in active markets for identical assets (Level 1 measurements)
182
Notes to Financial Statements (Continued)
January 31, 2014 (Unaudited)
and the lowest priority to unobservable inputs (Level 3 measurements) when market prices are not readily available or reliable.
The three levels of the hierarchy are summarized below.
| — | Level 1 — Quoted prices in active markets for identical assets |
| — | Level 2 — Other significant observable inputs (including quoted prices of similar securities, interest rates, prepayment speeds, credit risk, etc.) |
| — | Level 3 — Significant unobservable inputs (including the Fund’s own assumptions in determining the fair value of investments) |
Changes in valuation techniques may result in transfers into or out of an investment’s assigned level within the hierarchy.
An investment’s categorization within the hierarchy is based on the lowest level of any input that is significant to the fair valuation in its entirety. The inputs or methodology used to value investments are not intended to indicate the risk associated with investing in those investments.
Securities for which market quotations are readily available are valued at the current market value as of “Valuation Time.” Valuation Time is as of the close of regular trading on the New York Stock Exchange (usually 4:00 p.m. Eastern time). Equity securities are generally valued at the last quoted sale price or official closing price, or, if there is no such price, the last quoted bid price provided by an independent pricing service approved by the Trust’s Board of Trustees (the “Board of Trustees”). Prices are taken from the primary market or exchange on which each security trades. Shares of registered open-end management investment companies are valued at net asset value (“NAV”) as reported by such company. Exchange-traded funds are valued at their last reported sale price. Investments valued in this manner are generally categorized as Level 1 investments within the hierarchy.
The Board of Trustees has delegated authority to NFA, and the Trust’s administrator, Nationwide Fund Management LLC (“NFM”), to assign fair value. NFA and NFM have established a Fair Valuation Committee (“FVC”) to assign these fair valuations.
The FVC follows guidelines approved by the Board of Trustees to assign the fair value. The fair value of a security may differ from its quoted or published price. Fair valuation of portfolio securities may occur on a daily basis.
Securities may be fair valued in a variety of circumstances, such as where (i) market quotations are not readily available; (ii) an independent pricing service does not provide a value or the value provided by an independent pricing service is determined to be unreliable in the judgment of NFA or its designee; (iii) a significant event has occurred that affects the value of the Funds’ securities after trading has stopped (e.g., earnings announcements or news relating to natural disasters affecting an issuer’s operations); (iv) the securities are illiquid; (v) the securities have defaulted or been delisted from an exchange and are no longer trading; or (vi) any other circumstance in which the FVC believes that market quotations do not accurately reflect the value of a security.
The fair valuation of securities takes into account relevant factors and surrounding circumstances, including, but not limited to, the prices of related or comparable assets or liabilities, recent transactions, market multiples, anticipated cash flows, the nature and duration of any restrictions on transfer, book values, and other information relevant to the investment. Methods utilized to determine fair value may include, among others, the following: (i) a multiple of earnings; (ii) the discount from market value of a similar, freely traded security; (iii) the yield-to-maturity for debt issues; or (iv) a combination of these and other methods. Fair valuations may also take into account significant events that occur before Valuation Time but after the close of the principal market on which a security trades that materially affect the value of such security. The FVC monitors the results of fair valuation determinations and regularly reports the results to the Board of Trustees.
183
Notes to Financial Statements (Continued)
January 31, 2014 (Unaudited)
Securities listed on a foreign exchange are valued at the last sale price at the close of the exchange on which the security is principally traded and are categorized as Level 1 investments within the hierarchy. Securities utilizing a fair value factor provided by an independent fair value pricing service provider are categorized as Level 2 investments within the hierarchy. When fair valuation factors are utilized, the value assigned to securities may not be the same as quoted or published prices of the securities on their primary markets. Values of foreign securities, currencies, and other assets and liabilities denominated in foreign currencies are translated into U.S. dollars at the exchange rate of said currencies against the U.S. dollar, as of Valuation Time, as provided by an independent pricing service approved by the Board of Trustees.
Debt and other fixed-income securities are generally valued at the bid evaluation price provided by an independent pricing service as approved by the Board of Trustees. Evaluations provided by independent pricing service providers may be determined without exclusive reliance on quoted prices and may use broker-dealer quotations, individual trading characteristics and other market data, reported trades or valuation estimates from their internal pricing models. The independent pricing service providers’ internal models use inputs that are observable such as issuer details, interest rates, yield curves, prepayment speeds, credit risks/spreads, default rates and quoted prices for similar assets and are generally categorized as Level 2 investments within the hierarchy. All debt obligations involve some risk of default with respect to interest and/or principal payments.
Bank loans are valued using an average bid price provided by an independent pricing service. Evaluated quotes provided by the pricing service may reflect appropriate factors such as ratings, tranche type, industry, company performance, spread, individual trading characteristics, institution-size trading in similar groups of securities and other market data.
At January 31, 2014, 100% of the market value of Cognitive Value, Small Cap Growth, Large Cap Core Equity, Large Cap Growth, Equity Income, and NYSE Arca Tech 100 Index were determined based on Level 1 inputs.
The following tables provide a summary of the inputs used to value the Funds’ net assets as of January 31, 2014. Please refer to the Statements of Investments for additional information on portfolio holdings.
International Equities
| Level 1 | Level 2 | Level 3 | Total | |||||||||||||
Assets: | ||||||||||||||||
Common Stocks | ||||||||||||||||
Aerospace & Defense | $ | — | $ | 4,483,951 | $ | — | $ | 4,483,951 | ||||||||
Air Freight & Logistics | — | 3,318,551 | — | 3,318,551 | ||||||||||||
Airlines | — | 2,820,812 | — | 2,820,812 | ||||||||||||
Auto Components | — | 10,461,178 | — | 10,461,178 | ||||||||||||
Automobiles | — | 5,469,944 | — | 5,469,944 | ||||||||||||
Capital Markets | — | 5,859,795 | — | 5,859,795 | ||||||||||||
Chemicals | — | 4,788,610 | — | 4,788,610 | ||||||||||||
Commercial Banks | 1,524,700 | 23,711,353 | — | 25,236,053 | ||||||||||||
Commercial Services & Supplies | — | 726,515 | — | 726,515 | ||||||||||||
Computers & Peripherals | — | 5,371,244 | — | 5,371,244 | ||||||||||||
Construction & Engineering | — | 5,947,000 | — | 5,947,000 | ||||||||||||
Containers & Packaging | — | 4,615,775 | — | 4,615,775 | ||||||||||||
Diversified Consumer Services | 611,292 | — | — | 611,292 | ||||||||||||
Diversified Financial Services | — | 4,075,219 | — | 4,075,219 | ||||||||||||
Diversified Telecommunication Services | — | 7,318,584 | — | 7,318,584 | ||||||||||||
Electric Utilities | 603,611 | 3,483,758 | — | 4,087,369 | ||||||||||||
Electrical Equipment | — | 2,056,191 | — | 2,056,191 | ||||||||||||
Energy Equipment & Services | — | 771,896 | — | 771,896 | ||||||||||||
Food & Staples Retailing | — | 4,158,336 | — | 4,158,336 | ||||||||||||
184
Notes to Financial Statements (Continued)
January 31, 2014 (Unaudited)
| Level 1 | Level 2 | Level 3 | Total | |||||||||||||
Food Products | $ | — | $ | 7,165,370 | $ | — | $ | 7,165,370 | ||||||||
Gas Utilities | — | 1,853,519 | — | 1,853,519 | ||||||||||||
Health Care Providers & Services | — | 1,673,765 | — | 1,673,765 | ||||||||||||
Hotels, Restaurants & Leisure | — | 10,328,372 | — | 10,328,372 | ||||||||||||
Household Durables | — | 1,930,934 | — | 1,930,934 | ||||||||||||
Household Products | — | 853,061 | — | 853,061 | ||||||||||||
Industrial Conglomerates | — | 1,610,390 | — | 1,610,390 | ||||||||||||
Information Technology Services | — | 6,080,236 | — | 6,080,236 | ||||||||||||
Insurance | — | 16,086,652 | — | 16,086,652 | ||||||||||||
Leisure Equipment & Products | — | 2,070,393 | — | 2,070,393 | ||||||||||||
Life Sciences Tools & Services | — | 1,504,597 | — | 1,504,597 | ||||||||||||
Machinery | — | 5,298,255 | — | 5,298,255 | ||||||||||||
Media | — | 4,416,133 | — | 4,416,133 | ||||||||||||
Metals & Mining | 816,000 | 1,790,933 | — | 2,606,933 | ||||||||||||
Multi-Utilities | — | 1,103,674 | — | 1,103,674 | ||||||||||||
Office Electronics | — | 1,050,830 | — | 1,050,830 | ||||||||||||
Oil, Gas & Consumable Fuels | 1,825,200 | 11,595,419 | — | 13,420,619 | ||||||||||||
Paper & Forest Products | — | 4,765,769 | — | 4,765,769 | ||||||||||||
Pharmaceuticals | — | 19,177,550 | — | 19,177,550 | ||||||||||||
Professional Services | — | 2,839,266 | — | 2,839,266 | ||||||||||||
Real Estate Management & Development | — | 4,258,899 | — | 4,258,899 | ||||||||||||
Road & Rail | — | 2,618,980 | — | 2,618,980 | ||||||||||||
Software | — | 826,131 | — | 826,131 | ||||||||||||
Specialty Retail | — | 2,055,026 | — | 2,055,026 | ||||||||||||
Textiles, Apparel & Luxury Goods | — | 639,148 | — | 639,148 | ||||||||||||
Tobacco | — | 2,526,298 | — | 2,526,298 | ||||||||||||
Trading Companies & Distributors | — | 4,399,138 | — | 4,399,138 | ||||||||||||
Transportation Infrastructure | — | 1,115,757 | — | 1,115,757 | ||||||||||||
Wireless Telecommunication Services | — | 5,660,101 | — | 5,660,101 | ||||||||||||
Total Common Stocks | $ | 5,380,803 | $ | 226,733,308 | $ | — | $ | 232,114,111 | ||||||||
Exchange Traded Funds | 4,842,500 | — | — | 4,842,500 | ||||||||||||
Mutual Fund | 8,276,892 | — | — | 8,276,892 | ||||||||||||
Total Assets | $ | 18,500,195 | $ | 226,733,308 | $ | — | $ | 245,233,503 | ||||||||
Liabilities: | ||||||||||||||||
Forward Foreign Currency Contracts | — | (65,849 | ) | — | (65,849 | ) | ||||||||||
Total Liabilities | $ | — | $ | (65,849 | ) | $ | — | $ | (65,849 | ) | ||||||
Total | $ | 18,500,195 | $ | 226,667,459 | $ | — | $ | 245,167,654 | ||||||||
185
Notes to Financial Statements (Continued)
January 31, 2014 (Unaudited)
Technology & Science
| Level 1 | Level 2 | Level 3 | Total | |||||||||||||
Assets: | ||||||||||||||||
Common Stocks | ||||||||||||||||
Automobiles | $ | 272,115 | $ | — | $ | — | $ | 272,115 | ||||||||
Biotechnology | 7,266,697 | — | — | 7,266,697 | ||||||||||||
Communications Equipment | 8,042,624 | — | — | 8,042,624 | ||||||||||||
Computers & Peripherals | 15,157,016 | — | — | 15,157,016 | ||||||||||||
Diversified Telecommunication Services | 122,920 | — | — | 122,920 | ||||||||||||
Electrical Equipment | 149,292 | — | — | 149,292 | ||||||||||||
Electronic Equipment, Instruments & Components | 3,705,850 | — | — | 3,705,850 | ||||||||||||
Information Technology Services | 12,980,531 | — | — | 12,980,531 | ||||||||||||
Internet & Catalog Retail | 4,060,321 | — | — | 4,060,321 | ||||||||||||
Internet Software & Services | 15,746,290 | — | — | 15,746,290 | ||||||||||||
Life Sciences Tools & Services | 522,610 | — | — | 522,610 | ||||||||||||
Media | 1,089,000 | — | — | 1,089,000 | ||||||||||||
Pharmaceuticals | 945,970 | — | — | 945,970 | ||||||||||||
Semiconductors & Semiconductor Equipment | 13,329,631 | 1,376,061 | — | 14,705,692 | ||||||||||||
Software | 16,263,457 | — | — | 16,263,457 | ||||||||||||
Total Common Stocks | $ | 99,654,324 | $ | 1,376,061 | $ | — | $ | 101,030,385 | ||||||||
Exchange Traded Fund | 431,350 | — | — | 431,350 | ||||||||||||
Mutual Fund | 868,317 | — | — | 868,317 | ||||||||||||
Total | $ | 100,953,991 | $ | 1,376,061 | $ | — | $ | 102,330,052 | ||||||||
Mid Cap Growth
| Level 1 | Level 2 | Level 3 | Total | |||||||||||||
Assets: | ||||||||||||||||
Common Stocks | $ | 1,469,419,505 | $ | — | $ | — | $ | 1,469,419,505 | ||||||||
Mutual Fund | 43,455,897 | — | — | 43,455,897 | ||||||||||||
Repurchase Agreements | — | 4,244,400 | — | 4,244,400 | ||||||||||||
Total | $ | 1,512,875,402 | $ | 4,244,400 | $ | — | $ | 1,517,119,802 | ||||||||
186
Notes to Financial Statements (Continued)
January 31, 2014 (Unaudited)
Balanced
| Level 1 | Level 2 | Level 3 | Total | |||||||||||||
Assets: | ||||||||||||||||
Asset-Backed Securities | $ | — | $ | 588,188 | $ | — | $ | 588,188 | ||||||||
Bank Loan | — | 30,057 | — | 30,057 | ||||||||||||
Collateralized Mortgage Obligations | — | 129,575 | — | 129,575 | ||||||||||||
Commercial Mortgage Backed Securities | — | 571,784 | — | 571,784 | ||||||||||||
Common Stocks | 17,883,849 | — | — | 17,883,849 | ||||||||||||
Corporate Bonds | — | 6,490,317 | — | 6,490,317 | ||||||||||||
Municipal Bonds | — | 355,776 | — | 355,776 | ||||||||||||
Mutual Fund | 587,267 | — | — | 587,267 | ||||||||||||
U.S. Government Mortgage Backed Agencies | — | 1,189,584 | — | 1,189,584 | ||||||||||||
U.S. Treasury Notes | — | 1,335,352 | — | 1,335,352 | ||||||||||||
Total | $ | 18,471,116 | $ | 10,690,633 | $ | — | $ | 29,161,749 | ||||||||
Small Cap Core
| Level 1 | Level 2 | Level 3 | Total | |||||||||||||
Assets: | ||||||||||||||||
Common Stocks | ||||||||||||||||
Aerospace & Defense | $ | 1,899,812 | $ | — | $ | — | $ | 1,899,812 | ||||||||
Airlines | 519,930 | — | — | 519,930 | ||||||||||||
Auto Components | 1,121,736 | — | — | 1,121,736 | ||||||||||||
Automobiles | 315,074 | — | — | 315,074 | ||||||||||||
Biotechnology | 1,387,670 | — | — | 1,387,670 | ||||||||||||
Building Products | 203,046 | — | — | 203,046 | ||||||||||||
Capital Markets | 720,300 | — | — | 720,300 | ||||||||||||
Chemicals | 1,814,637 | — | — | 1,814,637 | ||||||||||||
Commercial Banks | 3,912,840 | — | — | 3,912,840 | ||||||||||||
Commercial Services & Supplies | 1,161,951 | — | — | 1,161,951 | ||||||||||||
Communications Equipment | 2,827,350 | — | — | 2,827,350 | ||||||||||||
Computers & Peripherals | 1,035,161 | — | — | 1,035,161 | ||||||||||||
Construction & Engineering | 617,505 | — | — | 617,505 | ||||||||||||
Construction Materials | 563,203 | — | — | 563,203 | ||||||||||||
Containers & Packaging | 1,607,400 | — | — | 1,607,400 | ||||||||||||
Diversified Consumer Services | 496,000 | — | — | 496,000 | ||||||||||||
Electric Utilities | 1,962,113 | — | — | 1,962,113 | ||||||||||||
Electrical Equipment | 260,993 | — | — | 260,993 | ||||||||||||
Energy Equipment & Services | 2,457,598 | — | — | 2,457,598 | ||||||||||||
Food & Staples Retailing | 588,982 | — | — | 588,982 | ||||||||||||
Food Products | 306,000 | — | — | 306,000 | ||||||||||||
Health Care Equipment & Supplies | 4,954,106 | — | — | 4,954,106 | ||||||||||||
Health Care Providers & Services | 1,228,439 | — | — | 1,228,439 | ||||||||||||
Health Care Technology | 1,137,913 | — | — | 1,137,913 | ||||||||||||
Hotels, Restaurants & Leisure | 2,296,230 | — | — | 2,296,230 | ||||||||||||
Household Durables | 1,033,369 | — | — | 1,033,369 | ||||||||||||
Household Products | 711,113 | — | — | 711,113 | ||||||||||||
Information Technology Services | 302,064 | — | — | 302,064 | ||||||||||||
Insurance | 1,433,921 | — | — | 1,433,921 | ||||||||||||
Internet Software & Services | 1,354,273 | — | — | 1,354,273 | ||||||||||||
Life Sciences Tools & Services | 717,282 | — | — | 717,282 | ||||||||||||
Machinery | 3,505,483 | — | — | 3,505,483 | ||||||||||||
Media | 1,701,603 | — | — | 1,701,603 | ||||||||||||
187
Notes to Financial Statements (Continued)
January 31, 2014 (Unaudited)
| Level 1 | Level 2 | Level 3 | Total | |||||||||||||
Assets: (continued) | ||||||||||||||||
Common Stocks (continued) | ||||||||||||||||
Metals & Mining | $ | 805,749 | $ | — | $ | — | $ | 805,749 | ||||||||
Oil, Gas & Consumable Fuels | 657,879 | — | — | 657,879 | ||||||||||||
Paper & Forest Products | 1,243,708 | — | — | 1,243,708 | ||||||||||||
Personal Products | 710,026 | — | — | 710,026 | ||||||||||||
Pharmaceuticals | 1,270,506 | — | — | 1,270,506 | ||||||||||||
Professional Services | 3,650,711 | — | — | 3,650,711 | ||||||||||||
Real Estate Investment Trusts (REITs) | 7,363,424 | — | — | 7,363,424 | ||||||||||||
Real Estate Management & Development | 604,500 | — | — | 604,500 | ||||||||||||
Road & Rail | 1,199,685 | — | — | 1,199,685 | ||||||||||||
Semiconductors & Semiconductor Equipment | 4,307,305 | — | — | 4,307,305 | ||||||||||||
Software | 6,401,722 | — | — | 6,401,722 | ||||||||||||
Specialty Retail | 982,782 | — | — | 982,782 | ||||||||||||
Textiles, Apparel & Luxury Goods | 712,139 | — | — | 712,139 | ||||||||||||
Thrifts & Mortgage Finance | 1,323,114 | — | — | 1,323,114 | ||||||||||||
Total Common Stocks | $ | 77,388,347 | $ | — | $ | — | $ | 77,388,347 | ||||||||
Futures Contracts | 47,567 | — | — | 47,567 | ||||||||||||
Mutual Fund | 4,452,702 | — | — | 4,452,702 | ||||||||||||
Total | $ | 81,888,616 | $ | — | $ | — | $ | 81,888,616 | ||||||||
Value
| Level 1 | Level 2 | Level 3 | Total | |||||||||||||
Assets: | ||||||||||||||||
Common Stocks | ||||||||||||||||
Aerospace & Defense | $ | 7,560,007 | $ | 3,375,780 | $ | — | $ | 10,935,787 | ||||||||
Air Freight & Logistics | 5,828,076 | – | — | 5,828,076 | ||||||||||||
Auto Components | 3,522,125 | – | — | 3,522,125 | ||||||||||||
Beverages | 5,157,372 | – | — | 5,157,372 | ||||||||||||
Capital Markets | 19,535,580 | – | — | 19,535,580 | ||||||||||||
Chemicals | 3,235,617 | – | — | 3,235,617 | ||||||||||||
Commercial Banks | 12,941,112 | – | — | 12,941,112 | ||||||||||||
Communications Equipment | 4,599,785 | – | — | 4,599,785 | ||||||||||||
Computers & Peripherals | 8,806,189 | – | — | 8,806,189 | ||||||||||||
Construction & Engineering | 3,295,811 | 2,592,685 | — | 5,888,496 | ||||||||||||
Construction Materials | — | 3,313,392 | — | 3,313,392 | ||||||||||||
Consumer Finance | 4,764,410 | — | — | 4,764,410 | ||||||||||||
Diversified Financial Services | 30,170,898 | 3,701,024 | — | 33,871,922 | ||||||||||||
Electric Utilities | 2,528,400 | — | — | 2,528,400 | ||||||||||||
Electrical Equipment | 4,352,509 | — | — | 4,352,509 | ||||||||||||
Electrical Equipment, Instruments & Components | 3,767,348 | — | — | 3,767,348 | ||||||||||||
Energy Equipment & Services | 5,303,388 | — | — | 5,303,388 | ||||||||||||
Food Products | 6,293,731 | — | — | 6,293,731 | ||||||||||||
Health Care Equipment & Supplies | 13,617,345 | — | — | 13,617,345 | ||||||||||||
Health Care Providers & Services | 14,350,710 | — | — | 14,350,710 | ||||||||||||
Household Products | 13,413,210 | — | — | 13,413,210 | ||||||||||||
Industrial Conglomerates | 2,972,210 | — | — | 2,972,210 | ||||||||||||
Information Technology Services | 4,982,376 | — | — | 4,982,376 | ||||||||||||
Insurance | 19,116,712 | — | — | 19,116,712 | ||||||||||||
Internet & Catalog Retail | 3,055,624 | — | — | 3,055,624 | ||||||||||||
Machinery | 12,392,378 | — | — | 12,392,378 | ||||||||||||
188
Notes to Financial Statements (Continued)
January 31, 2014 (Unaudited)
| Level 1 | Level 2 | Level 3 | Total | |||||||||||||
Assets: (continued) | ||||||||||||||||
Common Stocks (continued) | ||||||||||||||||
Media | $ | 17,035,282 | $ | — | $ | — | $ | 17,035,282 | ||||||||
Metals & Mining | 2,057,704 | — | — | 2,057,704 | ||||||||||||
Multiline Retail | 3,666,024 | — | — | 3,666,024 | ||||||||||||
Multi-Utilities | 3,886,230 | — | — | 3,886,230 | ||||||||||||
Office Electronics | 3,752,473 | — | — | 3,752,473 | ||||||||||||
Oil, Gas & Consumable Fuels | 30,775,496 | — | — | 30,775,496 | ||||||||||||
Pharmaceuticals | 14,176,459 | — | — | 14,176,459 | ||||||||||||
Real Estate Investment Trusts (REITs) | 3,152,340 | — | — | 3,152,340 | ||||||||||||
Road & Rail | 4,071,479 | — | — | 4,071,479 | ||||||||||||
Semiconductors & Semiconductor Equipment | 2,559,002 | — | — | 2,559,002 | ||||||||||||
Software | 16,271,784 | — | — | 16,271,784 | ||||||||||||
Tobacco | 6,604,784 | — | — | 6,604,784 | ||||||||||||
Total Common Stocks | $ | 323,571,980 | $ | 12,982,881 | $ | — | $ | 336,554,861 | ||||||||
Mutual Fund | 3,404,520 | — | — | 3,404,520 | ||||||||||||
Preferred Stock | — | 3,292,676 | — | 3,292,676 | ||||||||||||
Total | $ | 326,976,500 | $ | 16,275,557 | $ | — | $ | 343,252,057 | ||||||||
Amounts designated as “—”, which may include fair valued securities, are zero or have been rounded to zero.
During the six months ended January 31, 2014, there were no transfers into or out of Level 1, Level 2 or Level 3.
During the six months ended January 31, 2014, Small Cap Core held 1 common stock investment that was categorized as a Level 3 investment which was valued at $0.
The FVC continues to evaluate any information that could cause an adjustment to the fair value for this investment, such as market news, the progress of judicial and regulatory proceedings, and subadviser recommendations.
| (b) | Cash Overdraft |
As of January 31, 2014, Cognitive Value, Large Cap Core Equity, and Small Cap Core each had overdrawn balances of $12, $11,075, and $31,740, respectively, with the Funds’ custodian bank, JPMorgan Chase Bank, N.A. (“JPMorgan”). To offset the overdraft, JPMorgan advanced an amount equal to each overdraft. Consistent with the Funds’ borrowing policy, the advances are deemed a temporary loan to each Fund. Such loans are payable upon demand and bear interest from the date of such advance to the date of payment at the rate agreed upon with JPMorgan under the custody agreement. These advances are separate from, and were not made pursuant to, the credit agreement discussed in Note 5.
| (c) | Foreign Currency Transactions |
The accounting records of the Funds are maintained in U.S. dollars. The Funds may, nevertheless, engage in foreign currency transactions. In those instances, a Fund will convert foreign currency amounts into U.S. dollars at the current rate of exchange between the foreign currency and the U.S. dollar in order to determine the value of the Fund’s investments, assets, and liabilities.
Purchases and sales of securities, receipts of income, and payments of expenses are converted at the prevailing rate of exchange on the respective date of such transactions. The accounting records of a Fund do not differentiate that portion of the results of operations resulting from changes in foreign exchange rates from those resulting from changes in the market prices of the relevant securities. Each portion contributes to the net realized gain or loss from investment transactions and net change in unrealized appreciation/ (depreciation) from investments. Net currency gains or losses, realized and unrealized, that are a result of differences between interest or dividends, receivables and payables for investments sold or purchased, forward foreign currency contracts and foreign cash recorded on a
189
Notes to Financial Statements (Continued)
January 31, 2014 (Unaudited)
Fund’s accounting records, and the U.S. dollar equivalent amount actually received or paid, are included in net realized gain or loss from foreign currency transactions and net change in unrealized appreciation/(depreciation) from the translation of assets and liabilities denominated in foreign currencies.
| (d) | Forward Foreign Currency Contracts |
International Equities is subject to foreign currency exchange risk in the normal course of pursuing its objectives. International Equities entered into forward foreign currency contracts in connection with planned purchases or sales of securities denominated in a foreign currency and/or to hedge the U.S. dollar value of portfolio securities denominated in a foreign currency. A forward foreign currency contract involves an obligation to purchase or sell a specific currency at a future date, which may be any fixed number of days from the date of the contract agreed upon by the parties, at a price set at the time of the contract. Forward foreign currency contracts are generally valued at the mean of the last quoted bid and ask prices, as provided by an independent pricing service approved by the Board of Trustees, and are generally categorized as Level 2 investments within the hierarchy. The market value of a forward foreign currency contract fluctuates with changes in foreign currency exchange rates. All commitments are marked to market daily at the applicable exchange rates and any resulting unrealized appreciation or depreciation is recorded. Realized gains or losses are recorded at the time the forward foreign currency contract matures or by delivery of the currency. Forward foreign currency contracts entail the risk of unanticipated movements in the value of the foreign currency relative to the U.S. dollar, and the risk that the counterparties to the contracts may be unable to meet their obligations under the contract.
International Equities’ forward foreign currency contracts are reflected in the Statement of Assets and Liabilities under “Unrealized appreciation/(depreciation) on forward foreign currency contracts,” and in the Statement of Operations under “Net realized gains/losses from forward and foreign currency transactions” and “Net change in unrealized appreciation/(depreciation) from forward foreign currency contracts.”
| (e) | Futures Contracts |
International Equities, Large Cap Core Equity, and Small Cap Core are subject to equity price risk in the normal course of pursuing their investment objectives. International Equities, Large Cap Core Equity, and Small Cap Core entered into financial futures contracts (“futures contracts”) to enable the Funds to more closely approximate the performance of their benchmark indices or for tactical hedging purposes. Futures contracts are contracts for delayed delivery of securities or currencies at a specific future date and at a specific price or currency amount.
Upon entering into a futures contract, a Fund is required to pledge to the broker an initial margin deposit of cash and/or other assets equal to a certain percentage of the futures contract’s notional value. Under a futures contract, a Fund agrees to receive from or pay to a broker an amount of cash equal to the daily fluctuation in value of the futures contract. Subsequent receipts or payments, known as “variation margin” receipts or payments, are made each day, depending on the fluctuation in the fair value of the futures contract, and are recognized by a Fund as unrealized gains or losses. Futures contracts are generally valued daily at their settlement price as provided by an independent pricing service approved by the Board of Trustees, and are generally categorized as Level 1 investments within the hierarchy.
A “sale” of a futures contract means a contractual obligation to deliver the securities or foreign currency called for by the contract at a fixed price or amount at a specified time in the future. A “purchase” of a futures contract means a contractual obligation to acquire the securities or foreign currency at a fixed price at a specified time in the future. When a futures contract is closed, a Fund records a realized gain or loss equal to the difference between the value of the futures contract at the time it was opened and its value at the time it was closed.
Should market conditions change unexpectedly, a Fund may not achieve the anticipated benefits of futures contracts and may realize a loss. The use of futures contracts for hedging purposes involves the risk of imperfect correlation in the movements in the price of the futures contracts and the underlying assets. A Fund’s investments in futures contracts entail limited counterparty credit risk because the Fund invests only in exchange-traded futures
190
Notes to Financial Statements (Continued)
January 31, 2014 (Unaudited)
contracts, which are settled through the exchange and whose fulfillment is guaranteed by the credit of the exchange.
A Fund’s futures contracts are reflected in the Statement of Assets and Liabilities under “Net unrealized appreciation/(depreciation) from futures contracts,” and in the Statement of Operations under “Net realized gains/losses from futures transactions” and “Net change in unrealized appreciation/(depreciation) from futures contracts.”
At January 31, 2014, International Equities had no open futures contracts.
The following tables provide a summary of the Funds’ derivative instruments categorized by risk exposure as of January 31, 2014:
Fair Values of Derivatives not Accounted for as Hedging Instruments as of January 31, 2014
International Equities
| Liabilities: | Statement of Assets & Liabilities | |||||
Forward Foreign Currency Contracts | ||||||
Currency risk | Unrealized depreciation on forward foreign currency contracts | $ | (65,849 | ) | ||
Total | $ | (65,849 | ) | |||
Large Cap Core Equity
| Liabilities: | Statement of Assets & Liabilities | |||||
Futures Contracts* | ||||||
Equity risk | Unrealized depreciation from futures contracts | $ | (1,835 | ) | ||
Total | $ | (1,835 | ) | |||
Small Cap Core
| Assets: | Statement of Assets & Liabilities | Fair Value | ||||
Futures Contracts* | ||||||
Equity risk | Unrealized appreciation from futures contracts | $ | 47,567 | |||
Total | $ | 47,567 | ||||
| * | Includes cumulative appreciation/(depreciation) of futures contracts as reported in the Statement of Investments. Only current day’s variation margin is reported within the Statement of Assets & Liabilities. |
The Effect of Derivative Instruments on the Statement of Operations for the Six Months Ended January 31, 2014
International Equities
| Realized Gain/(Loss): | Total | |||
Forward Foreign Currency Contracts | ||||
Currency risk | $ | 995,024 | ||
| ||||
Futures Contracts | ||||
Equity risk | 114,341 | |||
| ||||
Total | $ | 1,109,365 | ||
| ||||
191
Notes to Financial Statements (Continued)
January 31, 2014 (Unaudited)
Large Cap Core Equity
| Realized Gain/(Loss): | Total | |||
Futures Contracts | ||||
Equity risk | $ | 114,972 | ||
| ||||
Total | $ | 114,972 | ||
| ||||
Small Cap Core
| Realized Gain/(Loss): | Total | |||
Futures Contracts | ||||
Equity risk | $ | 81,365 | ||
| ||||
Total | $ | 81,365 | ||
| ||||
Change in Unrealized Appreciation/(Depreciation) on Derivatives Recognized in the Statement of Operations for the Six Months Ended January 31, 2014
International Equities
| Unrealized Appreciation/(Depreciation): | Total | |||
Forward Foreign Currency Contracts | ||||
Currency risk | $ | 217,199 | ||
| ||||
Futures Contracts | ||||
Equity risk | (84,595 | ) | ||
| ||||
Total | $ | 132,604 | ||
| ||||
Large Cap Core Equity
| Unrealized Appreciation/(Depreciation): | Total | |||
Futures Contracts | ||||
Equity risk | $ | 3,799 | ||
| ||||
Total | $ | 3,799 | ||
| ||||
Small Cap Core
| Unrealized Appreciation/(Depreciation): | Total | |||
Futures Contracts | ||||
Equity risk | $ | 31,737 | ||
| ||||
Total | $ | 31,737 | ||
| ||||
Information about derivative instruments reflected as of the date of this report is generally indicative of the type and volume of derivative activity for International Equities (forward foreign currency contracts), Large Cap Core Equity (futures contracts), and Small Cap Core (futures contracts) during the six months ended January 31, 2014.
192
Notes to Financial Statements (Continued)
January 31, 2014 (Unaudited)
The table below discloses the volume of the International Equities futures contracts activity during the six months ended January 31, 2014.
| Futures Contracts | ||||
Average Notional Balance | $ | 4,202,076 | ||
Ending Notional Balance | $ | — | ||
For financial reporting purposes, International Equities, Large Cap Core Equity, and Small Cap Core present all financial assets and financial liabilities on a gross basis that are subject to master netting arrangements or similar agreements on the Statement of Assets and Liabilities. At January 31, 2014, the futures contracts agreements do not permit Large Cap Core Equity or Small Cap Core to enforce netting arrangements.
The following tables set forth International Equities’ net exposure by counterparty for derivative instruments that are subject to enforceable master netting arrangements or similar agreements as of January 31, 2014:
Offsetting of Financial Liabilities and Derivative Liabilities:
| Description | Gross Amounts of Recognized Derivative Liabilities | Gross Amounts Offset in the Statement of Assets and Liabilities | Net Amounts of Derivative Liabilities Presented in the Statement of Assets and Liabilities | |||||||
Forward Foreign Currency Contracts | $(65,849) | $ | — | $ | (65,849 | ) | ||||
Total | $(65,849) | $ | — | $ | (65,849 | ) | ||||
Amounts designated as “—” are zero.
Financial Liabilities, Derivative Liabilities and Collateral Pledged to Counterparty:
Gross Amounts not Offset in the Statement of Assets and Liabilities | ||||||||||||||
| Counterparty | Net Amounts of Derivative Liabilities Presented in the Statement of Assets and Liabilities | Derivatives Available for Offset | Collateral Pledged | Net Amount of Derivative Liabilities | ||||||||||
Brown Brothers Harriman & Co. | $(65,849) | $ | — | $ | — | $ | (65,849 | ) | ||||||
Total | $(65,849) | $ | — | $ | — | $ | (65,849 | ) | ||||||
Amounts designated as “—” are zero.
| (g) | Securities Lending |
During the six months ended January 31, 2014, Mid Cap Growth entered into securities lending transactions. To generate additional income, the Fund lent its portfolio securities, up to 33 1/3% of the total assets of the Fund, to brokers, dealers, and other financial institutions. The collateral that the Fund receives may be included in calculating the Fund’s total assets. The Fund’s securities lending standards and guidelines require that the borrower (1) deliver cash or U.S. Government securities as collateral with respect to each new loan of U.S. securities, equal to at least 102% of the value of the portfolio securities loaned, and with respect to each new loan on non-U.S. securities, collateral of at least 105% of the value of the portfolio securities loaned; and (2) at all times thereafter mark to market the collateral on a daily basis so that the market value of such collateral does not fall below 100% of the value of securities loaned. The Fund receives payments from borrowers equivalent to the dividends and interest that would have been earned on the securities loaned while simultaneously seeking to earn income on the investment of cash collateral. There may be risks of delay or restrictions in recovery of the securities or disposal of
193
Notes to Financial Statements (Continued)
January 31, 2014 (Unaudited)
collateral should the borrower of the securities fail financially. Loans are made, however, only to borrowers deemed by NFA or its designee to be of good standing and creditworthy under guidelines established by the Board of Trustees and when, in the judgment of NFA or its designee, the consideration which can be earned currently from these securities loans justifies the attendant risks. Loans are subject to termination by the Fund or the borrower at any time, and, therefore, are not considered to be illiquid investments. JPMorgan serves as securities lending agent for the securities lending program of the Fund. JPMorgan receives a fee based on the value of the collateral received from borrowers. Information on the investment of cash collateral is shown in the Statement of Investments.
In the event of a default by a borrower with respect to any loan, JPMorgan will exercise any and all remedies provided under the applicable borrower agreement to make a Fund whole. These remedies include purchasing replacement securities by applying the collateral held from the defaulting broker against the purchase cost of the replacement securities. If, despite such efforts by JPMorgan to exercise these remedies, the Fund sustains losses as a result of a borrower’s default, JPMorgan indemnifies the Fund by purchasing replacement securities at its expense, or paying the Fund an amount equal to the market value of the replacement securities, subject to certain limitations which are set forth in detail in the Securities Lending Agency Agreement between the Fund and JPMorgan.
At January 31, 2014, the Securities Lending Agreement does not permit the Fund to enforce a netting arrangement.
| (h) | Repurchase Agreements |
During the period from September 16, 2013 through January 31, 2014, Mid Cap Growth along with other series of the Trust, pursuant to procedures adopted by the Board of Trustees and applicable guidance from the Securities and Exchange Commission (“SEC”), transferred cash collateral received from securities lending transactions, through a joint account at JPMorgan, the Mid Cap Growth’s custodian and securities lending agent, the daily aggregate balance of which is invested in one or more repurchase agreements collateralized by U.S. Treasury or federal agency obligations. In a repurchase agreement, the seller of a security agrees to repurchase the security at a mutually agreed-upon time and price, which reflects the effective rate of return for the term of the agreement. For repurchase agreements and joint repurchase agreements, The Bank of New York Mellon or JPMorgan take possession of the collateral pledged for investments in such repurchase agreements (“repo” or collectively “repos”). The underlying collateral is valued daily on a marked to market basis, plus accrued interest to ensure that the value is equal to or greater than the repurchase price, including accrued interest. In the event of default of the obligation to repurchase, a Fund has the right to liquidate the collateral and apply the proceeds in satisfaction of the obligation. If the seller defaults and the value of the collateral declines or if bankruptcy proceedings are commenced with respect to the seller of the security, realization of the collateral by a Fund may be delayed or limited.
Mid Cap Growth
At January 31, 2014, the repos on a gross basis were as follows:
Credit Suisse (USA) LLC, 0.03%, dated 01/31/14, due 02/03/14, repurchase price $ 300,000,750, collateralized by U.S. Government Agency Securities ranging 1.63% — 5.00%, maturing 04/20/24 — 12/20/43; total market value $306,001,764.
Goldman Sachs & Co., 0.01%, dated 01/29/14, due 02/05/14, repurchase price $ 250,000,486, collateralized by U.S. Government Treasury Securities ranging 0.00% — 4.38%, maturing 07/15/19 — 02/15/43; total market value $255,000,001.
Please refer to the Statement of Investments for Mid Cap Growth’s undivided interest in each joint repurchase agreement and related collateral.
At January 31, 2014, the Repurchase Agreement does not permit Mid Cap Growth to enforce a netting arrangement.
194
Notes to Financial Statements (Continued)
January 31, 2014 (Unaudited)
At January 31, 2014, Cognitive Value, Technology & Science, Balanced, Large Cap Core Equity, and Small Cap Core held no repurchase agreements.
| (i) | Security Transactions and Investment Income |
Security transactions are accounted for on the date the security is purchased or sold. Security gains and losses are calculated on the identified cost basis. Interest income is recognized on the accrual basis and includes, where applicable, the amortization of premiums or accretion of discounts, and is recorded as such on a Fund’s Statement of Operations. Dividend income is recorded on the ex-dividend date and is recorded as such on a Fund’s Statement of Operations, except for certain dividends from foreign securities, which are recorded as soon as the Trust is informed on or after the ex-dividend date.
Foreign income and capital gains may be subject to foreign withholding taxes and capital gains taxes at various rates. Under applicable foreign law, a withholding of tax may be imposed on interest and dividends paid by a foreign security and capital gains from the sale of a foreign security. Foreign income or capital gains subject to foreign withholding taxes are recorded net of the applicable withholding tax.
For certain securities, including a real estate investment trust (“REIT”), a Fund records distributions received in excess of earnings and profits of such security as a reduction of cost of investments and/or realized gain (referred to as a return of capital). Additionally, a REIT may characterize distributions it pays as long-term capital gains. Such distributions are based on estimates if actual amounts are not available. Actual distributions of income, long-term capital gain and return of capital may differ from the estimated amounts. A Fund will recharacterize the estimated amounts of the components of distributions as necessary, once the issuers provide information about the actual composition of the distributions. Any portion of a distribution deemed a return of capital is generally not taxable to a Fund.
A Fund records as dividend income the amount characterized as ordinary income and records as realized gain the amount characterized by a REIT as long-term capital gain in the Statement of Operations. The amount characterized as return of capital is a reduction to the cost of investments in the Statement of Assets and Liabilities. These characterizations are reflected in the accompanying financial statements.
| (j) | Distributions to Shareholders |
Effective September 16, 2013, distributions from net investment income, if any, are declared and paid quarterly. Distributions from net realized capital gains, if any, are declared and distributed at least annually. All distributions are recorded on the ex-dividend date.
Dividends and distributions to shareholders are determined in accordance with federal income tax regulations, which may differ from U.S. GAAP. These “book/tax” differences are considered either permanent or temporary. Permanent differences are reclassified within the capital accounts based on their nature for federal income tax purposes; temporary differences do not require reclassification. These reclassifications have no effect upon the NAV of a Fund. Any distribution in excess of current and accumulated earnings and profits for federal income tax purposes is reported as a return of capital distribution.
Prior to September 16, 2013, each of the Funds declared and paid dividends from net investment income periodically. None of the Funds had a targeted dividend rate, and none of the Funds guaranteed that it would pay any dividends or other distributions. Any net realized capital gains, if any, were distributed at least annually by each of the Funds.
| (k) | Deferred Compensation Plan |
On April 17, 2013, the Predecessor Funds terminated a deferred compensation plan that had previously been established for the benefit of certain members of the Predecessor Funds’ Board. Effective September 16, 2013, the Funds assumed the deferred compensation liability of their corresponding Predecessor Funds. At January 31, 2014, the deferred compensation payable by the Funds to the Predecessor Funds’ Board was $177,452.
195
Notes to Financial Statements (Continued)
January 31, 2014 (Unaudited)
| (l) | Federal Income Taxes |
Each Fund elected to be treated as, and intends to qualify each year as, a “Regulated Investment Company” (“RIC”) by complying with the provisions available to certain investment companies under Subchapter M of the U.S. Internal Revenue Code of 1986, as amended, and to make distributions of net investment income and net realized capital gains sufficient to relieve a Fund from all, or substantially all, federal income taxes. Therefore, no federal income tax provision is required.
A Fund recognizes a tax benefit from an uncertain position only if it is more likely than not that the position is sustainable, based solely on its technical merits and consideration of the relevant taxing authorities’ widely understood administrative practices and precedents. A Fund undertakes an affirmative evaluation of tax positions taken or expected to be taken in the course of preparing tax returns to determine whether it is more likely than not (i.e., greater than 50 percent) that each tax position will be sustained upon examination by a taxing authority based on the technical merits of the position. If such a tax position taken by a Fund is not sustained upon examination by a taxing authority, that Fund could incur taxes and penalties related to that position, and those amounts could be material. A tax position that meets the more likely than not recognition threshold is measured to determine the amount of benefits to recognize in the financial statements. Differences result in an increase in a liability for taxes payable (or a reduction of a tax refund receivable) and an increase in a deferred tax liability (or a reduction in a deferred tax asset). The Funds file U.S. federal income tax returns and, if applicable, returns in various foreign jurisdictions in which they invest. The last four tax year ends, or since inception (if shorter), and any interim tax period since then generally remain open for examination by taxing authorities.
Each Fund engages in ongoing monitoring and analysis; future conclusions reached by management could be different and result in adjustments to a Fund’s NAV and financial statements. The Funds are not aware of any tax positions for which it is reasonably possible that the total amounts of unrecognized tax benefits will significantly change in the next twelve months.
| (m) | Allocation of Expenses, Income and Gains and Losses |
Expenses directly attributable to a Fund are charged to that Fund. Expenses not directly attributable to a Fund are allocated proportionally among various or all series of the Trust. Income, fund level expenses, and realized and unrealized gains or losses are allocated to each class of shares of a Fund based on the value of the outstanding shares of that class relative to the total value of the outstanding shares of that Fund. Expenses specific to a class (such as Rule 12b-1 and administrative services fees) are charged to that specific class.
3. Transactions with Affiliates
Effective September 16, 2013 under the terms of the Trust’s Investment Advisory Agreement, NFA manages the investments of the assets and supervises the daily business affairs of the Funds in accordance with policies and procedures established by the Board of Trustees. NFA is a wholly owned subsidiary of Nationwide Financial Services, Inc. (“NFS”), a holding company which is a direct wholly owned subsidiary of Nationwide Corporation. NFA provides investment management evaluation services in monitoring, on an ongoing basis, the performance of the subadvisers.
196
Notes to Financial Statements (Continued)
January 31, 2014 (Unaudited)
As of January 31, 2014, the subadvisers for each Fund are as follows:
| Fund | Subadviser | |
Cognitive Value | Bailard, Inc. | |
International Equities | Bailard, Inc. | |
Technology & Science | Bailard, Inc. | |
Mid Cap Growth | Geneva Capital Management Ltd. | |
Small Cap Growth | Geneva Capital Management Ltd. | |
Balanced | HighMark Capital Management, Inc. (“HighMark”) | |
Large Cap Core Equity | HighMark | |
Large Cap Growth | HighMark | |
Small Cap Core | HighMark | |
Value | HighMark | |
Equity Income | Ziegler Lotsoff Capital Management, LLC | |
NYSE Arca Tech 100 Index | Ziegler Lotsoff Capital Management, LLC |
Effective September 16, 2013, under the terms of the Investment Advisory Agreement, each Fund pays NFA an investment advisory fee based on that Fund’s average daily net assets. The Funds paid investment advisory fees to NFA according to the schedule below.
| Fund | Fee Schedule | Advisory Fee (annual rate) | ||||
Cognitive Value | Up to $500 million | 0.75 | % | |||
| On $500 million and more | 0.70 | % | ||||
International Equities | Up to $1 billion | 0.75 | % | |||
| On $1 billion and more | 0.70 | % | ||||
Technology & Science | Up to $500 million | 0.75 | % | |||
| On $500 million up to $1 billion | 0.70 | % | ||||
| On $1 billion and more | 0.65 | % | ||||
Mid Cap Growth | Up to $250 million | 0.75 | % | |||
| On $250 million up to $500 million | 0.70 | % | ||||
| On $500 million and more | 0.65 | % | ||||
Small Cap Growth | Up to $250 million | 1.00 | % | |||
| On $250 million up to $500 million | 0.95 | % | ||||
| On $500 million and more | 0.90 | % | ||||
Balanced | All Assets | 0.60 | % | |||
Large Cap Core Equity | ||||||
Large Cap Growth | ||||||
Value | ||||||
Small Cap Core | All Assets | 0.95 | % | |||
Equity Income | Up to $100 million | 0.55 | % | |||
| $100 million up to $500 million | 0.50 | % | ||||
| On $500 million and more | 0.45 | % | ||||
NYSE Arca Tech 100 Index | Up to $50 million | 0.50 | % | |||
| $50 million up to $250 million | 0.30 | % | ||||
| $250 million up to $500 million | 0.25 | % | ||||
| On $500 million and more | 0.20 | % | ||||
From these fees, pursuant to the subadvisory agreements, NFA pays fees to the unaffiliated subadvisers.
197
Notes to Financial Statements (Continued)
January 31, 2014 (Unaudited)
For the period from September 16, 2013 through January 31, 2014, the Funds paid investment management fees to NFA in the amounts listed below.
| Fund | Amount | |||
Cognitive Value | $ | 301,904 | ||
International Equities | 680,261 | |||
Technology & Science | 279,224 | |||
Mid Cap Growth | 3,847,643 | |||
Small Cap Growth | 498,732 | |||
Balanced | 68,389 | |||
Large Cap Core Equity | 135,319 | |||
Large Cap Growth | 161,550 | |||
Small Cap Core | 275,511 | |||
Value | 781,713 | |||
Equity Income | 239,898 | |||
NYSE Arca Tech 100 Index | 335,448 | |||
Prior to September 16, 2013, the Funds were managed by, and paid investment management fees to, HighMark. For the period from August 1, 2013 through September 15, 2013, the Funds paid investment management fees to HighMark in the amounts listed below.
| Fund | Amount | |||
Cognitive Value | $ | 89,546 | ||
International Equities | 205,895 | |||
Technology & Science | 85,794 | |||
Mid Cap Growth | 1,197,657 | |||
Small Cap Growth | 141,432 | |||
Balanced | 25,256 | |||
Large Cap Core Equity | 45,006 | |||
Large Cap Growth | 54,317 | |||
Small Cap Core | 86,623 | |||
Value | 261,016 | |||
Equity Income | 22,904 | |||
NYSE Arca Tech 100 Index | 105,499 | |||
Effective September 16, 2013, the Funds and NFA have entered into a written Expense Limitation Agreement that limits the Funds’ operating expenses (excluding acquired fund fees and expenses, and certain other expenses) from exceeding the following amounts until February 28, 2015:
| Fund | Class A | Class C | Institutional Service Class | Institutional Class | Class U | Class M | ||||||||||||||||||
Cognitive Value | 1.47 | % | 2.07 | % | 1.22 | % | 1.07 | N/A | 1.07 | % | ||||||||||||||
International Equities | 1.42 | 2.10 | 1.27 | 1.10 | N/A | 1.10 | ||||||||||||||||||
Technology & Science | 1.45 | 2.05 | 1.20 | 1.05 | N/A | 1.05 | ||||||||||||||||||
Mid Cap Growth | 1.38 | 1.98 | 1.13 | 0.98 | N/A | N/A | ||||||||||||||||||
Small Cap Growth | 1.62 | 2.22 | 1.37 | 1.22 | N/A | N/A | ||||||||||||||||||
198
Notes to Financial Statements (Continued)
January 31, 2014 (Unaudited)
| Fund | Class A | Class C | Institutional Service Class | Institutional Class | Class U | Class M | ||||||||||||||||||
Balanced | 1.24 | 1.84 | 0.99 | 0.84 | N/A | N/A | ||||||||||||||||||
Large Cap Core Equity | 1.22 | 1.82 | 0.97 | 0.82 | N/A | N/A | ||||||||||||||||||
Large Cap Growth | 1.27 | 1.87 | 1.02 | 0.87 | N/A | N/A | ||||||||||||||||||
Small Cap Core | 1.62 | 2.22 | 1.37 | 1.22 | N/A | N/A | ||||||||||||||||||
Value | 1.25 | 1.85 | 1.00 | 0.85 | 0.87 | N/A | ||||||||||||||||||
Equity Income | 1.15 | 1.75 | 0.90 | 0.75 | N/A | N/A | ||||||||||||||||||
NYSE Arca Tech 100 Index | 1.08 | 1.68 | 0.83 | 0.68 | N/A | N/A | ||||||||||||||||||
| N/A | – Not Applicable. |
NFA may request and receive reimbursement from a Fund for advisory fees waived and other expenses reimbursed by NFA pursuant to the Expense Limitation Agreement at a date not to exceed three years from the month in which the corresponding waiver or reimbursement to a Fund was made. However, no reimbursement may be made unless: (i) a Fund’s assets exceed $100 million and (ii) the total annual expense ratio of the class making such reimbursement is no higher than the amount of the expense limitation that was in place at the time NFA waived the fees or reimbursed the expenses and does not cause the expense ratio to exceed the current expense limitation. Reimbursement by a Fund of amounts previously waived or assumed by NFA is not permitted except as provided for in the Expense Limitation Agreement. The Expense Limitation Agreement may be changed or eliminated only with the consent of the Board of Trustees.
As of January 31, 2014, the cumulative potential reimbursements for the Funds, listed by the period in which NFA waived fees or reimbursed expenses to the Funds, are:
| Fund | Period Ended January 31, 2014 (a) | |||
Cognitive Value | $ | — | ||
International Equities | — | |||
Technology & Science | — | |||
Mid Cap Growth | — | |||
Small Cap Growth | 14,506 | |||
Balanced | 68,956 | |||
Large Cap Core Equity | 29,638 | |||
Large Cap Growth | 35,889 | |||
Small Cap Core | 18,458 | |||
Value | — | |||
Equity Income | 4,730 | |||
NYSE Arca Tech 100 Index | — | |||
| (a) | For the period from September 16, 2013 through January 31, 2014. |
Amounts designated as “—” are zero or have been rounded to zero.
During the period from September 16, 2013 through January 31, 2014, no amounts were reimbursed to NFA by the Funds pursuant to the Expense Limitation Agreement.
Pursuant to a similar expense limitation agreement, prior to September 16, 2013, Mid Cap Growth reimbursed HighMark in the amount of $45,468.
199
Notes to Financial Statements (Continued)
January 31, 2014 (Unaudited)
Prior to September 16, 2013, HighMark contractually agreed to reduce its fees (excluding portfolio brokerage and transaction costs, taxes relating to transacting in foreign securities, if any, extraordinary expenses and any expenses indirectly incurred by a Fund through investments in pooled investment vehicles), and to the extent necessary to reimburse the Funds in order to limit the Funds from exceeding certain expense limitations. For the period from August 1, 2013 through September 15, 2013, expenses reimbursed under the terms of that agreement were as follows:
| Fund | Amount | |||
Cognitive Value | $ | 3,943 | ||
International Equities | 5,050 | |||
Technology & Science | 5,440 | |||
Mid Cap Growth | — | |||
Small Cap Growth | 20,201 | |||
Balanced | 16,650 | |||
Large Cap Core Equity | 16,069 | |||
Large Cap Growth | 14,544 | |||
Small Cap Core | 9,447 | |||
Value | 18,823 | |||
Equity Income | 18,107 | |||
NYSE Arca Tech 100 Index | 4,903 | |||
Amount designated as “—” is zero or has been rounded to zero.
Effective September 16, 2013, NFM, a wholly owned subsidiary of NFS Distributors, Inc. (“NFSDI”) (a wholly owned subsidiary of NFS), provides various administrative and accounting services for the Funds and serves as Transfer and Dividend Disbursing Agent for the Funds. NFM has entered into an agreement with a third-party service provider to provide certain sub-administration and sub-transfer agency services to the Funds. NFM pays the service provider a fee for these services.
Effective September 16, 2013, under the terms of a Joint Fund Administration and Transfer Agency Agreement, the fees for such services are based on the sum of the following: (i) the amount payable by NFM to its sub-administrator and sub-transfer agent; and (ii) a percentage of the combined average daily net assets of the Trust and Nationwide Variable Insurance Trust, a Delaware statutory trust and registered investment company that is affiliated with the Trust, according to the fee schedule below.
| Combined Fee Schedule | ||||
Up to $25 billion | 0.025 | % | ||
$25 billion and more | 0.020 | % | ||
During the period from September 16, 2013 through January 31, 2014, NFM earned $856,191 in fees from the Funds under the Joint Fund Administration and Transfer Agency Agreement.
Prior to September 16, 2013, the Funds were series of an investment trust that was a party to an Administration Agreement with HighMark (the “Administrator”) under which the Administrator provided administrative services to such investment trust for an annual fee of 0.15% of the first $8 billion of the average daily net assets of the Funds and 0.14% of such average daily net assets in excess of $8 billion allocated to each Fund based on its respective net assets. For the period from August 1, 2013 through September 15, 2013, the Administrator received fees from the Funds in the amounts listed below.
| Fund | Amount | |||
Cognitive Value | $ | 21,782 | ||
International Equities | 47,839 | |||
200
Notes to Financial Statements (Continued)
January 31, 2014 (Unaudited)
| Fund | Amount | |||
Technology & Science | $ | 20,469 | ||
Mid Cap Growth | 361,349 | |||
Small Cap Growth | 30,489 | |||
Balanced | 10,030 | |||
Large Cap Core Equity | 16,259 | |||
Large Cap Growth | 20,555 | |||
Small Cap Core | 17,238 | |||
Value | 84,464 | |||
Equity Income | 11,194 | |||
NYSE Arca Tech 100 Index | 75,021 | |||
Effective September 16, 2013, the Trust pays out-of-pocket expenses reasonably incurred by NFM in providing services to the Funds and the Trust, including, but not limited to, the cost of pricing services that NFM utilizes and networking fees paid to broker-dealers that provide sub-accounting and sub-transfer agency services to their customers who are Fund shareholders. Such services, which are not otherwise provided by NFM, generally include individual account maintenance and recordkeeping, dividend disbursement, responding to shareholder calls and inquiries, providing statements and transaction confirmations, tax reporting, and other shareholder services. Depending on the nature and quality of the services provided, fees for these services may range from $6 to $21 per customer per year.
Effective September 16, 2013, under the terms of the Joint Fund Administration and Transfer Agency Agreement and a letter agreement between NFM and the Trust, the Trust has agreed to reimburse NFM for certain costs related to the Funds’ portion of ongoing administration, monitoring and annual (compliance audit) testing of the Trust’s Rule 38a-1 Compliance Program subject to the pre-approval of the Trust’s Audit Committee. These costs are allocated among the series of the Trust based upon their relative net assets. For the period from September 16, 2013 through January 31, 2014, the Funds’ aggregate portion of such costs amounted to $2,755. For the period from August 1, 2013, through September 15, 2013, the Funds paid $19,319 to HighMark.
Effective September 16, 2013, under the terms of a Distribution Plan pursuant to Rule 12b-1 under the 1940 Act, Nationwide Fund Distributors LLC (“NFD”), the Funds’ principal underwriter, is compensated by the Funds for expenses associated with the distribution of certain classes of shares of the Funds. NFD is a wholly owned subsidiary of NFSDI. These fees are based on average daily net assets of the respective class of the Funds at an annual rate as follows:
| — | 0.25% of the average daily net assets of Class A shares of each Fund (distribution or service fee) |
| — | 1.00% of the average daily net assets of Class C shares of each Fund (0.75% of which may be a distribution fee and 0.25% service fee) |
Prior to September 16, 2013, HighMark Funds Distributors, LLC (the “Distributor”), a wholly owned subsidiary of Foreside Funds Distributors LLC, and the Funds were parties to an underwriting agreement. HighMark adopted 12b-1 Plans (the “Plans”) with respect to Class A, Class B, and Class C Shares that allowed each Fund to pay distribution and service fees to the Distributor as compensation for its services under the Plans. The Distributor received a distribution fee computed daily and paid monthly, at the annual rate of 0.25% of the daily net assets attributable to each Fund’s Class A Shares, 0.75% of the daily net assets attributable to each Fund’s Class B Shares and 1.00% of the daily net assets attributable to each Fund’s Class C Shares, which was used by the Distributor to provide compensation for sales support and distribution activities.
Effective September 16, 2013, pursuant to an Underwriting Agreement, NFD serves as principal underwriter of the Funds in the continuous distribution of their shares and receives commissions in the form of a front-end sales charge on Class A shares. These fees are deducted from, and are not included in, proceeds from sales of Class A shares of the Funds. From these fees, NFD pays sales commissions, salaries and other expenses in connection with generating new
201
Notes to Financial Statements (Continued)
January 31, 2014 (Unaudited)
sales of Class A shares of the Funds. The Funds’ Class A sales charges ranged from 0.00% to 5.75% based on the amount of the purchase. For the period from September 16, 2013 through January 31, 2014, the Funds imposed front-end sales charges of $345,627. For the period from August 1, 2013 through September 15, 2013, the Funds imposed front-end sales charges of $84,246.
Effective September 16, 2013, NFD also receives fees in the form of contingent deferred sales charges (“CDSCs”) on Class A and Class C shares. These fees may cause the redeemed value of a shareholder’s account to fall below the total purchase payments. A CDSC is imposed on Class A shares for certain redemptions, and Class C shares made within 1 year of purchase. Class A CDSCs were 1.00% for the Funds. Class C CDSCs were 1.00% for the Funds. For the period from September 16, 2013 through January 31, 2014, the Funds imposed CDSCs of $4,543. For the period from August 1, 2013 through September 15, 2013, the Funds imposed CDSCs of $1,760.
Effective September 16, 2013, under the terms of an Administrative Services Plan, the Funds pay fees to servicing organizations, such as broker-dealers, including NFS, and financial institutions that agree to provide administrative support services to the shareholders of certain classes. These services may include, but are not limited to, the following: (i) establishing and maintaining shareholder accounts; (ii) processing purchase and redemption transactions; (iii) arranging bank wires; (iv) performing shareholder sub-accounting; (v) answering inquiries regarding the Funds; and (vi) other such services. These fees are calculated at an annual rate of up to 0.25% of the average daily net assets of Class A and Institutional Class shares of each Fund.
For the period from September 16, 2013 through January 31, 2014, NFS earned the following amounts in administrative services fees from each Fund:
| Fund | Amount | |||
Cognitive Value | $ | 2,015 | ||
International Equities | 67,938 | |||
Technology & Science | 1,728 | |||
Mid Cap Growth | 1,329,059 | |||
Small Cap Growth | 66,178 | |||
Balanced | 14,260 | |||
Large Cap Core Equity | 33,254 | |||
Large Cap Growth | 38,760 | |||
Small Cap Core | 41,003 | |||
Value | 200,768 | |||
Equity Income | 17,060 | |||
NYSE Arca Tech 100 Index | 188,198 | |||
Prior to September 16, 2013, HighMark had similar administrative servicing plans permitting payment of compensation to service providers, which may have included HighMark or its affiliates that had agreed to provide certain shareholder support services for its customers who owned Fiduciary, Class A or Class B Shares. In consideration for such services, a service provider was entitled to receive compensation at the annual rate of up to 0.25% of the average daily net assets of the applicable class or classes of shares of the Funds. The service providers had agreed to waive a portion of their fees for certain classes of all Funds for the period from August 1, 2013 through September 15, 2013. The administrative servicing fee waivers by HighMark, or its affiliates, were voluntary and not subject to recoupment.
202
Notes to Financial Statements (Continued)
January 31, 2014 (Unaudited)
For the period from August 1, 2013 through September 15, 2013, HighMark, or its affiliates earned the following amounts in administrative servicing fees, net of waivers, from each Fund:
| Fund | Amount | |||
Cognitive Value | $ | 564 | ||
International Equities | 11,863 | |||
Technology & Science | 573 | |||
Mid Cap Growth | 247,359 | |||
Small Cap Growth | 18,877 | |||
Balanced | 5,387 | |||
Large Cap Core Equity | 11,066 | |||
Large Cap Growth | 13,112 | |||
Small Cap Core | 12,857 | |||
Value | 41,308 | |||
Equity Income | 5,522 | |||
NYSE Arca Tech 100 Index | 44,140 | |||
As of January 31, 2014, NFA or its affiliates directly held the percentage indicated below of the shares outstanding of the applicable Fund.
| Fund | % of Shares Outstanding Owned | |||
Cognitive Value | — | |||
International Equities | — | |||
Technology & Science | — | |||
Mid Cap Growth | — | |||
Small Cap Growth | — | |||
Balanced | — | |||
Large Cap Core Equity | — | |||
Large Cap Growth | — | |||
Small Cap Core | — | |||
Value | — | |||
Equity Income | 71.40 | % | ||
NYSE Arca Tech 100 Index | — | |||
Amounts designated as “—” are zero or have been rounded to zero.
4. Redemption Fees
Effective September 16, 2013, the Funds do not impose redemption fees.
Prior to September 16, 2013, certain of the Funds imposed 2% redemption and exchange fees 30 days or less after purchase, and were designed to discourage short-term trading. A Fund’s redemption fees are allocated to all classes in that Fund based on relative net assets and are included in proceeds from shares issued on the Statements of Changes in Net Assets. For the period from August 1, 2013 through September 15, 2013, Cognitive Value received redemption fees of $3.
For the year ended July 31, 2013, Cognitive Value, International Equities, Small Cap Growth, and Small Cap Core received redemption fees of $801, $124, $1,503 and $192, respectively.
203
Notes to Financial Statements (Continued)
January 31, 2014 (Unaudited)
5. Earnings Credit
JPMorgan provides earnings credits for cash balances maintained in a Fund’s custody accounts, which are used to offset custody fees of the Fund.
6. Investment Transactions
For the six months ended January 31, 2014, purchases of and sales of securities (excluding short-term securities) were as follows:
| Fund | Purchases | Sales | ||||||
Cognitive Value | $ | 184,093,425 | $ | 178,999,426 | ||||
International Equities | 96,695,012 | 88,894,373 | ||||||
Technology & Science | 19,785,432 | 20,656,125 | ||||||
Mid Cap Growth | 259,010,459 | 264,121,981 | ||||||
Small Cap Growth | 36,661,881 | 14,568,653 | ||||||
Balanced | 6,760,831 | 9,813,809 | ||||||
Large Cap Core Equity | 10,771,301 | 14,814,297 | ||||||
Large Cap Growth | 12,018,224 | 20,662,657 | ||||||
Small Cap Core | 14,376,915 | 16,687,465 | ||||||
Value | 106,247,918 | 127,342,055 | ||||||
Equity Income | 116,451,482 | 27,953,955 | ||||||
NYSE Arca Tech 100 Index | 28,732,347 | 26,555,144 | ||||||
7. Portfolio Investment Risks
Risks Associated with Foreign Securities and Currencies
Investments in securities of foreign issuers carry certain risks not ordinarily associated with investments in securities of U.S. issuers. These risks include foreign currency fluctuations, future disruptive political and economic developments and the possible imposition of exchange controls or other unfavorable foreign government laws and restrictions. In addition, investments in certain countries may carry risks of expropriation of assets, confiscatory taxation, political or social instability, or diplomatic developments that adversely affect investments in those countries.
Certain countries also may impose substantial restrictions on investments in their capital markets by foreign entities, including restrictions on investments in issuers in industries deemed sensitive to relevant national interests. These factors may limit the investment opportunities available and result in a lack of liquidity and high price volatility with respect to securities of issuers from developing countries.
Risks Associated with REIT and Real Estate Investments
Investments in REITs and in real estate securities carry certain risks associated with direct ownership of real estate and with the real estate industry in general. These risks include possible declines in the value of real estate, possible lack of availability of mortgage funds, unexpected vacancies of properties, and the relative lack of liquidity associated with investments in real estate.
Other
The Trust along with certain funds in Nationwide Variable Insurance Trust invests through an omnibus account at the Funds’ custodian, JPMorgan, any un-invested cash on a daily basis in the Fidelity Institutional Money Market Fund, Institutional Class. As with investments in any money market fund, the Trust’s investments of cash in the Fidelity Institutional Money Market Fund, Institutional Class are neither guaranteed nor insured, and shares of the Fidelity Institutional Money Market Fund, Institutional Class may decline in value, causing losses to the Trust.
204
Notes to Financial Statements (Continued)
January 31, 2014 (Unaudited)
8. Indemnifications
Under the Trust’s organizational documents, the Trust’s Officers and Trustees are indemnified by the Trust against certain liabilities arising out of the performance of their duties to the Trust. In addition, the Trust has entered into indemnification agreements with its Trustees and certain of its Officers. Trust Officers receive no compensation from the Trust for serving as its Officers. In addition, in the normal course of business, the Trust enters into contracts with its vendors and others that provide for general indemnifications. The Trust’s maximum liability under these arrangements is unknown, as this would involve future claims made against the Trust. Based on experience, however, the Trust expects the risk of loss to be remote.
9. Other
As of January 31, 2014, the Funds had individual shareholder accounts and/or omnibus shareholder accounts (comprising a group of individual shareholders), which held more than 10% of the total shares outstanding of the Funds as detailed below.
| Fund | % of Shares | Number of Accounts | ||||||
Cognitive Value | 59.09 | % | 2 | |||||
International Equities | 64.88 | 3 | ||||||
Technology & Science | 67.15 | 2 | ||||||
Mid Cap Growth | 24.42 | 2 | ||||||
Small Cap Growth | 32.50 | 2 | ||||||
Balanced | 43.46 | 2 | ||||||
Large Cap Core Equity | 76.25 | 2 | ||||||
Large Cap Growth | 47.31 | 2 | ||||||
Small Cap Core | 58.72 | 2 | ||||||
Value | 36.89 | 1 | ||||||
Equity Income | 71.40 | 4 | (a) | |||||
NYSE Arca Tech 100 Index | 18.04 | 1 | ||||||
| (a) | Each such account is the account of an affiliated fund. |
10. Recaptured Brokerage Commissions
The Funds have entered into agreements with brokers whereby the brokers will return a portion of a Fund’s brokerage commissions on the Fund’s behalf. Such amounts, under such agreements, are included in net realized gain/(loss) on the sale of investments presented in a Fund’s Statement of Operations. For the period from September 16, 2013 through January 31, 2014, the Funds recaptured the following amounts of brokerage commissions:
| Fund | Amount | |||
Cognitive Value | $ | — | ||
International Equities | — | |||
Technology & Science | — | |||
Mid Cap Growth | 13,116 | |||
Small Cap Growth | 3,683 | |||
Balanced | 334 | |||
Large Cap Core Equity | 2,414 | |||
Large Cap Growth | 200 | |||
Small Cap Core | 1,944 | |||
205
Notes to Financial Statements (Continued)
January 31, 2014 (Unaudited)
| Fund | Amount | |||
Value | $ | 26,588 | ||
Equity Income | 7,520 | |||
NYSE Arca Tech 100 Index | — | |||
Amounts designated as “—” are zero or have been rounded to zero.
11. Federal Tax Information
As of January 31, 2014, the tax cost of securities (excluding derivative contracts) and the breakdown of unrealized appreciation/(depreciation) was as follows:
| Fund | Tax Cost of Securities | Unrealized Appreciation | Unrealized Depreciation | Net Unrealized Appreciation/ (Depreciation) | ||||||||||||
Cognitive Value | $ | 99,673,194 | $ | 8,554,734 | $ | (2,983,461 | ) | $ | 5,571,273 | |||||||
International Equities | 199,383,388 | 50,858,467 | (5,008,352 | ) | 45,850,115 | |||||||||||
Technology & Science | 58,064,581 | 44,818,392 | (552,921 | ) | 44,265,471 | |||||||||||
Mid Cap Growth | 1,174,221,010 | 350,388,484 | (7,489,692 | ) | 342,898,792 | |||||||||||
Small Cap Growth | 115,384,685 | 35,602,738 | (905,129 | ) | 34,697,609 | |||||||||||
Balanced | 25,129,869 | 4,222,842 | (190,962 | ) | 4,031,880 | |||||||||||
Large Cap Core Equity | 47,024,615 | 12,408,249 | (746,206 | ) | 11,662,043 | |||||||||||
Large Cap Growth | 52,516,709 | 15,328,123 | (290,453 | ) | 15,037,670 | |||||||||||
Small Cap Core | 63,432,943 | 19,996,481 | (1,588,375 | ) | 18,408,106 | |||||||||||
Value | 302,403,170 | 44,032,908 | (3,184,021 | ) | 40,848,887 | |||||||||||
Equity Income | 116,644,486 | 11,079,323 | (1,028,824 | ) | 10,050,499 | |||||||||||
NYSE Arca Tech 100 Index | 165,520,687 | 119,356,250 | (2,552,806 | ) | 116,803,444 | |||||||||||
12. Subsequent Events
Management has evaluated the impact of subsequent events on the Funds and has determined that there are no subsequent events requiring recognition or disclosure in the financial statements.
206
January 31, 2014 (Unaudited)
Nationwide Bailard Cognitive Value Fund
Approval of Advisory and Subadvisory Agreements
At the March 28, 2013 meeting of the Board of Trustees, the Board, including the Independent Trustees, discussed and unanimously approved, for the Nationwide Bailard Cognitive Value Fund (the “Fund”), the Investment Advisory Agreement with Nationwide Fund Advisors (“NFA”) and the Subadvisory Agreement with Bailard, Inc. (“Bailard,” and, together with NFA, the “Advisers”) (each, an “Advisory Agreement,” and together, the “Advisory Agreements”). The Trustees were provided with detailed materials relating to Bailard in advance of the meeting. The material factors and conclusions that formed the basis for the approval are discussed below.
The Trustees met in person with Nationwide Fund Advisors (“NFA”), the investment adviser to the Fund, Trust counsel, Independent Legal Counsel, and others. The Trustees also reviewed the proposed subadvisory relationship with representatives of Bailard.
In making their determinations, the Trustees noted that Bailard is currently the sub-adviser to the HighMark Cognitive Value Fund, and that the new Fund is intended to be the successor to that fund. The Trustees took into account information provided by the Advisers as to management style and investment philosophy and process, and the financial position, of Bailard. The Trustees considered Bailard’s past performance and Bailard’s personnel that would be serving the Fund. The Trustees considered the terms of the Advisory Agreements and information regarding fee arrangements, including the structure of the sub-advisory fees, and the fact that NFA pays Bailard out of its advisory fees.
The Trustees noted that the proposed advisory fees to be paid by the Fund to NFA were below the median of the fees paid by the peer funds presented at the meeting. They also considered pro forma performance information provided by NFA (actual performance of the HighMark Cognitive Value Fund adjusted to reflect the Fund’s expense and load structure) showing that three-year pro forma Class A performance of the Fund through a recent date exceeded the median performance of a Lipper peer universe identified by NFA.
After discussion and consideration among themselves, and with NFA, Trust counsel, and Independent Legal Counsel, the Trustees concluded the following:
| — | The nature and extent of the investment advisory services to be provided to the Fund by the Advisers were appropriate and consistent with the terms of the Advisory Agreements; |
| — | The prospects for satisfactory investment performance were reasonable; |
| — | The cost of services to be provided by the Advisers to the Fund appeared reasonable in relation to the services and benefits to be provided to the Fund; and |
| — | Profitability should be assessed after a reasonable period of Fund operations. |
Based on all relevant information and factors, none of which was individually determinative of the outcome, the Trustees, including all of the Independent Trustees, concluded that the approval of the Advisory Agreements was in the best interests of the Fund and its shareholders and unanimously approved the Advisory Agreements for a two-year period commencing from the execution of the Advisory Agreements.
207
Supplemental Information (Continued)
January 31, 2014 (Unaudited)
Nationwide Bailard International Equities Fund
Approval of Advisory and Subadvisory Agreements
At the March 28, 2013 meeting of the Board of Trustees, the Board, including the Independent Trustees, discussed and unanimously approved, for the Nationwide Bailard International Equities Fund (the “Fund”), the Investment Advisory Agreement with Nationwide Fund Advisors (“NFA”) and the Subadvisory Agreement with Bailard, Inc. (“Bailard,” and, together with NFA, the “Advisers”) (each, an “Advisory Agreement,” and together, the “Advisory Agreements”). The Trustees were provided with detailed materials relating to Bailard in advance of the meeting. The material factors and conclusions that formed the basis for the approval are discussed below.
The Trustees met in person with Nationwide Fund Advisors (“NFA”), the investment adviser to the Fund, Trust counsel, Independent Legal Counsel, and others. The Trustees also reviewed the proposed subadvisory relationship with representatives of Bailard.
In making their determinations, the Trustees noted that Bailard is currently the sub-adviser to the HighMark International Opportunities Fund, and that the new Fund is intended to be the successor to that fund. The Trustees took into account information provided by the Advisers as to management style and investment philosophy and process, and the financial position, of Bailard. The Trustees considered Bailard’s past performance and Bailard’s personnel that would be serving the Fund. The Trustees considered the terms of the Advisory Agreements and information regarding fee arrangements, including the structure of the sub-advisory fees, and the fact that NFA pays Bailard out of its advisory fees.
The Trustees noted that the proposed advisory fees to be paid by the Fund to NFA were below the median of the fees paid by the peer funds presented at the meeting. They also considered pro forma performance information provided by NFA (actual performance of the HighMark International Opportunities Fund adjusted to reflect the Fund’s expense and load structure) showing that three-year pro forma Class A performance of the Fund through a recent date exceeded the median performance of a Lipper peer universe identified by NFA.
After discussion and consideration among themselves, and with NFA, Trust counsel, and Independent Legal Counsel, the Trustees concluded the following:
| — | The nature and extent of the investment advisory services to be provided to the Fund by the Advisers were appropriate and consistent with the terms of the Advisory Agreements; |
| — | The prospects for satisfactory investment performance were reasonable; |
| — | The cost of services to be provided by the Advisers to the Fund appeared reasonable in relation to the services and benefits to be provided to the Fund; and |
| — | Profitability should be assessed after a reasonable period of Fund operations. |
Based on all relevant information and factors, none of which was individually determinative of the outcome, the Trustees, including all of the Independent Trustees, concluded that the approval of the Advisory Agreements was in the best interests of the Fund and its shareholders and unanimously approved the Advisory Agreements for a two-year period commencing from the execution of the Advisory Agreements.
208
Supplemental Information (Continued)
January 31, 2014 (Unaudited)
Nationwide Bailard Technology & Science Fund
Approval of Advisory and Subadvisory Agreements
At the March 28, 2013 meeting of the Board of Trustees, the Board, including the Independent Trustees, discussed and unanimously approved, for the Nationwide Bailard Technology & Science Fund (the “Fund”), the Investment Advisory Agreement with Nationwide Fund Advisors (“NFA”) and the Subadvisory Agreement with Bailard, Inc. (“Bailard,” and, together with NFA, the “Advisers”) (each, an “Advisory Agreement,” and together, the “Advisory Agreements”). The Trustees were provided with detailed materials relating to Bailard in advance of the meeting. The material factors and conclusions that formed the basis for the approval are discussed below.
The Trustees met in person with Nationwide Fund Advisors (“NFA”), the investment adviser to the Fund, Trust counsel, Independent Legal Counsel, and others. The Trustees also reviewed the proposed subadvisory relationship with representatives of Bailard.
In making their determinations, the Trustees noted that Bailard is currently the sub-adviser to the HighMark Enhanced Growth Fund, and that the new Fund is intended to be the successor to that fund. The Trustees took into account information provided by the Advisers as to management style and investment philosophy and process, and the financial position, of Bailard. The Trustees considered Bailard’s past performance and Bailard’s personnel that would be serving the Fund. The Trustees considered the terms of the Advisory Agreements and information regarding fee arrangements, including the structure of the sub-advisory fees, and the fact that NFA pays Bailard out of its advisory fees.
The Trustees noted that the proposed advisory fees to be paid by the Fund to NFA were below the median of the fees paid by the peer funds presented at the meeting. They also considered pro forma performance information provided by NFA (actual performance of the HighMark Enhanced Growth Fund adjusted to reflect the Fund’s expense and load structure) showing that three-year pro forma Class A performance of the Fund through a recent date was below the median, but within the third quintile of the performance of a Lipper peer universe identified by NFA.
After discussion and consideration among themselves, and with NFA, Trust counsel, and Independent Legal Counsel, the Trustees concluded the following:
| — | The nature and extent of the investment advisory services to be provided to the Fund by the Advisers were appropriate and consistent with the terms of the Advisory Agreements; |
| — | The prospects for satisfactory investment performance were reasonable; |
| — | The cost of services to be provided by the Advisers to the Fund appeared reasonable in relation to the services and benefits to be provided to the Fund; and |
| — | Profitability should be assessed after a reasonable period of Fund operations. |
Based on all relevant information and factors, none of which was individually determinative of the outcome, the Trustees, including all of the Independent Trustees, concluded that the approval of the Advisory Agreements was in the best interests of the Fund and its shareholders and unanimously approved the Advisory Agreements for a two-year period commencing from the execution of the Advisory Agreements.
209
Supplemental Information (Continued)
January 31, 2014 (Unaudited)
Nationwide Geneva Mid Cap Growth Fund
Approval of Advisory and Subadvisory Agreements
At the March 28, 2013 meeting of the Board of Trustees, the Board, including the Independent Trustees, discussed and unanimously approved, for the Nationwide Geneva Mid Cap Growth Fund (the “Fund”), the Investment Advisory Agreement with Nationwide Fund Advisors (“NFA”) and the Subadvisory Agreement with Geneva Capital Management, Ltd. (“Geneva,” and, together with NFA, the “Advisers”) (each, an “Advisory Agreement,” and together, the “Advisory Agreements”). The Trustees were provided with detailed materials relating to Geneva in advance of the meeting. The material factors and conclusions that formed the basis for the approval are discussed below.
The Trustees met in person with Nationwide Fund Advisors (“NFA”), the investment adviser to the Fund, Trust counsel, Independent Legal Counsel, and others. The Trustees also reviewed the proposed subadvisory relationship with representatives of Geneva.
In making their determinations, the Trustees noted that Geneva is currently the sub-adviser to the HighMark Geneva Mid Cap Growth Fund, and that the new Fund is intended to be the successor to that fund. The Trustees took into account information provided by the Advisers as to management style and investment philosophy and process, and the financial position, of Geneva. The Trustees considered Geneva’s past performance and Geneva’s personnel that would be serving the Fund. The Trustees considered the terms of the Advisory Agreements and information regarding fee arrangements, including the structure of the sub-advisory fees, and the fact that NFA pays Geneva out of its advisory fees.
The Trustees noted that the proposed advisory fees to be paid by the Fund to NFA were below the median of the fees paid by the peer funds presented at the meeting. They also considered pro forma performance information provided by NFA (actual performance of the HighMark Geneva Mid Cap Growth Fund adjusted to reflect the Fund’s expense and load structure) showing that the three-year pro forma Class A performance of the Fund exceeded the median performance of a Lipper peer universe identified by NFA.
After discussion and consideration among themselves, and with NFA, Trust counsel, and Independent Legal Counsel, the Trustees concluded the following:
| — | The nature and extent of the investment advisory services to be provided to the Fund by the Advisers were appropriate and consistent with the terms of the Advisory Agreements; |
| — | The prospects for satisfactory investment performance were reasonable; |
| — | The cost of services to be provided by the Advisers to the Fund appeared reasonable in relation to the services and benefits to be provided to the Fund; and |
| — | Profitability should be assessed after a reasonable period of Fund operations. |
Based on all relevant information and factors, none of which was individually determinative of the outcome, the Trustees, including all of the Independent Trustees, concluded that the approval of the Advisory Agreements was in the best interests of the Fund and its shareholders and unanimously approved the Advisory Agreements for a two-year period commencing from the execution of the Advisory Agreements.
210
Supplemental Information (Continued)
January 31, 2014 (Unaudited)
Nationwide Geneva Small Cap Growth Fund
Approval of Advisory and Subadvisory Agreements
At the March 28, 2013 meeting of the Board of Trustees, the Board, including the Independent Trustees, discussed and unanimously approved, for the Nationwide Geneva Small Cap Growth Fund (the “Fund”), the Investment Advisory Agreement with Nationwide Fund Advisors (“NFA”) and the Subadvisory Agreement with Geneva Capital Management, Ltd. (“Geneva,” and, together with NFA, the “Advisers”) (each, an “Advisory Agreement,” and together, the “Advisory Agreements”). The Trustees were provided with detailed materials relating to Geneva in advance of the meeting. The material factors and conclusions that formed the basis for the approval are discussed below.
The Trustees met in person with Nationwide Fund Advisors (“NFA”), the investment adviser to the Fund, Trust counsel, Independent Legal Counsel, and others. The Trustees also reviewed the proposed subadvisory relationship with representatives of Geneva.
In making their determinations, the Trustees noted that Geneva is currently the sub-adviser to the HighMark Geneva Small Cap Growth Fund, and that the new Fund is intended to be the successor to that fund. The Trustees took into account information provided by the Advisers as to management style and investment philosophy and process, and the financial position, of Geneva. The Trustees considered Geneva’s past performance and Geneva’s personnel that would be serving the Fund. The Trustees considered the terms of the Advisory Agreements and information regarding fee arrangements, including the structure of the sub-advisory fees, and the fact that NFA pays Geneva out of its advisory fees.
The Trustees noted that the proposed advisory fees to be paid by the Fund to NFA were above the median of the fees paid by the peer funds presented at the meeting, but within the range of fees paid by its peers. They also considered pro forma performance information provided by NFA (actual performance of the HighMark Geneva Mid Cap Growth Fund adjusted to reflect the Fund’s expense and load structure) showing that the three-year pro forma Class A performance of the Fund significantly exceeded the median performance of a Lipper peer universe identified by NFA.
After discussion and consideration among themselves, and with NFA, Trust counsel, and Independent Legal Counsel, the Trustees concluded the following:
| — | The nature and extent of the investment advisory services to be provided to the Fund by the Advisers were appropriate and consistent with the terms of the Advisory Agreements; |
| — | The prospects for satisfactory investment performance were reasonable; |
| — | The cost of services to be provided by the Advisers to the Fund appeared reasonable in relation to the services and benefits to be provided to the Fund; and |
| — | Profitability should be assessed after a reasonable period of Fund operations. |
Based on all relevant information and factors, none of which was individually determinative of the outcome, the Trustees, including all of the Independent Trustees, concluded that the approval of the Advisory Agreements was in the best interests of the Fund and its shareholders and unanimously approved the Advisory Agreements for a two-year period commencing from the execution of the Advisory Agreements.
211
Supplemental Information (Continued)
January 31, 2014 (Unaudited)
Nationwide HighMark Balanced Fund
Approval of Advisory and Subadvisory Agreements
At the March 28, 2013 meeting of the Board of Trustees, the Board, including the Independent Trustees, discussed and unanimously approved, for the Nationwide HighMark Balanced Fund (the “Fund”), the Investment Advisory Agreement with Nationwide Fund Advisors (“NFA”) and the Subadvisory Agreement with HighMark Capital Management, Inc. (“HighMark,” and, together with NFA, the “Advisers”) (each, an “Advisory Agreement,” and together, the “Advisory Agreements”). The Trustees were provided with detailed materials relating to HighMark in advance of the meeting. The material factors and conclusions that formed the basis for the approval are discussed below.
The Trustees met in person with Nationwide Fund Advisors (“NFA”), the investment adviser to the Fund, Trust counsel, Independent Legal Counsel, and others. The Trustees also reviewed the proposed subadvisory relationship with representatives of HighMark.
In making their determinations, the Trustees noted that HighMark is currently the adviser to the HighMark Balanced Fund, and that the new Fund is intended to be the successor to that fund. The Trustees took into account information provided by the Advisers as to management style and investment philosophy and process, and the financial position, of HighMark. The Trustees considered HighMark’s past performance and HighMark’s personnel that would be serving the Fund. The Trustees considered the terms of the Advisory Agreements and information regarding fee arrangements, including the structure of the sub-advisory fees, and the fact that NFA pays HighMark out of its advisory fees.
The Trustees noted that the proposed advisory fees to be paid by the Fund to NFA were below the median of the fees paid by the peer funds presented at the meeting. They also considered pro forma performance information provided by NFA (actual performance of the HighMark Balanced Fund adjusted to reflect the Fund’s expense and load structure) showing that three-year pro forma Class A performance of the Fund through a recent date exceeded the median performance of a Lipper peer universe identified by NFA. The Trustees also considered that HighMark is the investment adviser to a number of mutual funds being “adopted” by the Nationwide organization and that the adoption transaction contemplated that HighMark would serve as subadviser to the Fund after the adoption; the Trustees took into account the potential conflicts of interest posed by those arrangements.
After discussion and consideration among themselves, and with NFA, Trust counsel, and Independent Legal Counsel, the Trustees concluded the following:
| — | The nature and extent of the investment advisory services to be provided to the Fund by the Advisers were appropriate and consistent with the terms of the Advisory Agreements; |
| — | The prospects for satisfactory investment performance were reasonable; |
| — | The cost of services to be provided by the Advisers to the Fund appeared reasonable in relation to the services and benefits to be provided to the Fund; and |
| — | Profitability should be assessed after a reasonable period of Fund operations. |
Based on all relevant information and factors, none of which was individually determinative of the outcome, the Trustees, including all of the Independent Trustees, concluded that the approval of the Advisory Agreements was in the best interests of the Fund and its shareholders and unanimously approved the Advisory Agreements for a two-year period commencing from the execution of the Advisory Agreements.
212
Supplemental Information (Continued)
January 31, 2014 (Unaudited)
Nationwide HighMark Large Cap Growth Fund
Approval of Advisory and Subadvisory Agreements
At the March 28, 2013 meeting of the Board of Trustees, the Board, including the Independent Trustees, discussed and unanimously approved, for the Nationwide HighMark Large Cap Growth Fund (the “Fund”), the Investment Advisory Agreement with Nationwide Fund Advisors (“NFA”) and the Subadvisory Agreement with HighMark Capital Management, Inc. (“HighMark,” and, together with NFA, the “Advisers”) (each, an “Advisory Agreement,” and together, the “Advisory Agreements”). The Trustees were provided with detailed materials relating to HighMark in advance of the meeting. The material factors and conclusions that formed the basis for the approval are discussed below.
The Trustees met in person with Nationwide Fund Advisors (“NFA”), the investment adviser to the Fund, Trust counsel, Independent Legal Counsel, and others. The Trustees also reviewed the proposed subadvisory relationship with representatives of HighMark.
In making their determinations, the Trustees noted that HighMark is currently the sub-adviser to the HighMark Large Cap Growth Fund, and that the new Fund is intended to be the successor to that fund. The Trustees took into account information provided by the Advisers as to management style and investment philosophy and process, and the financial position, of HighMark. The Trustees considered HighMark’s past performance and HighMark’s personnel that would be serving the Fund. The Trustees considered the terms of the Advisory Agreements and information regarding fee arrangements, including the structure of the sub-advisory fees, and the fact that NFA pays HighMark out of its advisory fees.
The Trustees noted that the proposed advisory fees to be paid by the Fund to NFA were below the median of the fees paid by the peer funds presented at the meeting. They also considered pro forma performance information provided by NFA (actual performance of the HighMark Large Cap Growth Fund adjusted to reflect the Fund’s expense and load structure) showing that three-year pro forma Class A performance of the Fund through a recent date exceeded the median performance of a Lipper peer universe identified by NFA. The Trustees also considered that HighMark is the investment adviser to a number of mutual funds being “adopted” by the Nationwide organization and that the adoption transaction contemplated that HighMark would serve as subadviser to the Fund after the adoption; the Trustees took into account the potential conflicts of interest posed by those arrangements.
After discussion and consideration among themselves, and with NFA, Trust counsel, and Independent Legal Counsel, the Trustees concluded the following:
| — | The nature and extent of the investment advisory services to be provided to the Fund by the Advisers were appropriate and consistent with the terms of the Advisory Agreements; |
| — | The prospects for satisfactory investment performance were reasonable; |
| — | The cost of services to be provided by the Advisers to the Fund appeared reasonable in relation to the services and benefits to be provided to the Fund; and |
| — | Profitability should be assessed after a reasonable period of Fund operations. |
Based on all relevant information and factors, none of which was individually determinative of the outcome, the Trustees, including all of the Independent Trustees, concluded that the approval of the Advisory Agreements was in the best interests of the Fund and its shareholders and unanimously approved the Advisory Agreements for a two-year period commencing from the execution of the Advisory Agreements.
213
Supplemental Information (Continued)
January 31, 2014 (Unaudited)
Nationwide HighMark Large Cap Core Equity Fund
Approval of Advisory and Subadvisory Agreements
At the March 28, 2013 meeting of the Board of Trustees, the Board, including the Independent Trustees, discussed and unanimously approved, for the Nationwide HighMark Large Cap Core Equity Fund (the “Fund”), the Investment Advisory Agreement with Nationwide Fund Advisors (“NFA”) and the Subadvisory Agreement with HighMark Capital Management, Inc. (“HighMark,” and, together with NFA, the “Advisers”) (each, an “Advisory Agreement,” and together, the “Advisory Agreements”). The Trustees were provided with detailed materials relating to HighMark in advance of the meeting. The material factors and conclusions that formed the basis for the approval are discussed below.
The Trustees met in person with Nationwide Fund Advisors (“NFA”), the investment adviser to the Fund, Trust counsel, Independent Legal Counsel, and others. The Trustees also reviewed the proposed subadvisory relationship with representatives of HighMark.
In making their determinations, the Trustees noted that HighMark is currently the sub-adviser to the HighMark Large Cap Core Equity Fund, and that the new Fund is intended to be the successor to that fund. The Trustees took into account information provided by the Advisers as to management style and investment philosophy and process, and the financial position, of HighMark. The Trustees considered HighMark’s past performance and HighMark’s personnel that would be serving the Fund. The Trustees considered the terms of the Advisory Agreements and information regarding fee arrangements, including the structure of the sub-advisory fees, and the fact that NFA pays HighMark out of its advisory fees.
The Trustees noted that the proposed advisory fees to be paid by the Fund to NFA were below the median of the fees paid by the peer funds presented at the meeting. They also considered pro forma performance information provided by NFA (actual performance of the HighMark Balanced Fund adjusted to reflect the Fund’s expense and load structure) showing that three-year pro forma Class A performance of the Fund through a recent date exceeded the median performance of a Lipper peer universe identified by NFA. The Trustees also considered that HighMark is the investment adviser to a number of mutual funds being “adopted” by the Nationwide organization and that the adoption transaction contemplated that HighMark would serve as subadviser to the Fund after the adoption; the Trustees took into account the potential conflicts of interest posed by those arrangements.
After discussion and consideration among themselves, and with NFA, Trust counsel, and Independent Legal Counsel, the Trustees concluded the following:
| — | The nature and extent of the investment advisory services to be provided to the Fund by the Advisers were appropriate and consistent with the terms of the Advisory Agreements; |
| — | The prospects for satisfactory investment performance were reasonable; |
| — | The cost of services to be provided by the Advisers to the Fund appeared reasonable in relation to the services and benefits to be provided to the Fund; and |
| — | Profitability should be assessed after a reasonable period of Fund operations. |
Based on all relevant information and factors, none of which was individually determinative of the outcome, the Trustees, including all of the Independent Trustees, concluded that the approval of the Advisory Agreements was in the best interests of the Fund and its shareholders and unanimously approved the Advisory Agreements for a two-year period commencing from the execution of the Advisory Agreements.
214
Supplemental Information (Continued)
January 31, 2014 (Unaudited)
Nationwide HighMark Small Cap Core Fund
Approval of Advisory and Subadvisory Agreements
At the March 28, 2013 meeting of the Board of Trustees, the Board, including the Independent Trustees, discussed and unanimously approved, for the Nationwide HighMark Small Cap Core Fund (the “Fund”), the Investment Advisory Agreement with Nationwide Fund Advisors (“NFA”) and the Subadvisory Agreement with HighMark Capital Management, Inc. (“HighMark,” and, together with NFA, the “Advisers”) (each, an “Advisory Agreement,” and together, the “Advisory Agreements”). The Trustees were provided with detailed materials relating to HighMark in advance of the meeting. The material factors and conclusions that formed the basis for the approval are discussed below.
The Trustees met in person with Nationwide Fund Advisors (“NFA”), the investment adviser to the Fund, Trust counsel, Independent Legal Counsel, and others. The Trustees also reviewed the proposed subadvisory relationship with representatives of HighMark.
In making their determinations, the Trustees noted that HighMark is currently the sub-adviser to the HighMark Small Cap Core Fund, and that the new Fund is intended to be the successor to that fund. The Trustees took into account information provided by the Advisers as to management style and investment philosophy and process, and the financial position, of HighMark. The Trustees considered HighMark’s past performance and HighMark’s personnel that would be serving the Fund. The Trustees considered the terms of the Advisory Agreements and information regarding fee arrangements, including the structure of the sub-advisory fees, and the fact that NFA pays HighMark out of its advisory fees.
The Trustees noted that the Fund’s proposed advisory fees to be paid by the Fund to NFA were above the median of the fees paid by the peer funds presented at the meeting. The Trustees considered NFA’s statement that, when compared to the Lipper peer universe, the Fund’s proposed advisory fee exceeded the median by 4 basis points, but that, when compared to a sub-group of funds with less than $100 million in assets under management within the Lipper small cap universe, the Fund’s proposed advisory fee was 10 basis points lower than the median management fee for that sub-group. They also considered pro forma performance information provided by NFA (actual performance of the HighMark Small Cap Core Fund adjusted to reflect the Fund’s expense and load structure) showing that three-year pro forma Class A performance of the Fund had substantially exceeded the median performance of a Lipper peer universe identified by NFA. The Trustees also considered that HighMark is the investment adviser to a number of mutual funds being “adopted” by the Nationwide organization and that the adoption transaction contemplated that HighMark would serve as subadviser to the Fund after the adoption; the Trustees took into account the potential conflicts of interest posed by those arrangements.
After discussion and consideration among themselves, and with NFA, Trust counsel, and Independent Legal Counsel, the Trustees concluded the following:
| — | The nature and extent of the investment advisory services to be provided to the Fund by the Advisers were appropriate and consistent with the terms of the Advisory Agreements; |
| — | The prospects for satisfactory investment performance were reasonable; |
| — | The cost of services to be provided by the Advisers to the Fund appeared reasonable in relation to the services and benefits to be provided to the Fund; and |
| — | Profitability should be assessed after a reasonable period of Fund operations. |
Based on all relevant information and factors, none of which was individually determinative of the outcome, the Trustees, including all of the Independent Trustees, concluded that the approval of the Advisory Agreements was in the best interests of the Fund and its shareholders and unanimously approved the Advisory Agreements for a two-year period commencing from the execution of the Advisory Agreements.
215
Supplemental Information (Continued)
January 31, 2014 (Unaudited)
Nationwide HighMark Value Fund
Approval of Advisory and Subadvisory Agreements
At the March 28, 2013 meeting of the Board of Trustees, the Board, including the Independent Trustees, discussed and unanimously approved, for the Nationwide HighMark Value Fund (the “Fund”), the Investment Advisory Agreement with Nationwide Fund Advisors (“NFA”) and the Subadvisory Agreement with HighMark Capital Management, Inc. (“HighMark,” and, together with NFA, the “Advisers”) (each, an “Advisory Agreement,” and together, the “Advisory Agreements”). The Trustees were provided with detailed materials relating to HighMark in advance of the meeting. The material factors and conclusions that formed the basis for the approval are discussed below.
The Trustees met in person with Nationwide Fund Advisors (“NFA”), the investment adviser to the Fund, Trust counsel, Independent Legal Counsel, and others. The Trustees also reviewed the proposed subadvisory relationship with representatives of HighMark.
In making their determinations, the Trustees noted that HighMark is currently the sub-adviser to the HighMark Value Fund, and that the new Fund is intended to be the successor to that fund. The Trustees took into account information provided by the Advisers as to management style and investment philosophy and process, and the financial position, of HighMark. The Trustees considered HighMark’s past performance and HighMark’s personnel that would be serving the Fund. The Trustees considered the terms of the Advisory Agreements and information regarding fee arrangements, including the structure of the sub-advisory fees, and the fact that NFA pays HighMark out of its advisory fees.
The Trustees noted that the proposed advisory fees to be paid by the Fund to NFA were below the median of the fees paid by the peer funds presented at the meeting. They also considered pro forma performance information provided by NFA (actual performance of the HighMark Large Cap Growth Fund adjusted to reflect the Fund’s expense and load structure) showing that three-year pro forma Class A performance of the Fund through a recent date exceeded the median performance of a Lipper peer universe identified by NFA. The Trustees also considered that HighMark is the investment adviser to a number of mutual funds being “adopted” by the Nationwide organization and that the adoption transaction contemplated that HighMark would serve as subadviser to the Fund after the adoption; the Trustees took into account the potential conflicts of interest posed by those arrangements.
After discussion and consideration among themselves, and with NFA, Trust counsel, and Independent Legal Counsel, the Trustees concluded the following:
| — | The nature and extent of the investment advisory services to be provided to the Fund by the Advisers were appropriate and consistent with the terms of the Advisory Agreements; |
| — | The prospects for satisfactory investment performance were reasonable; |
| — | The cost of services to be provided by the Advisers to the Fund appeared reasonable in relation to the services and benefits to be provided to the Fund; and |
| — | Profitability should be assessed after a reasonable period of Fund operations. |
Based on all relevant information and factors, none of which was individually determinative of the outcome, the Trustees, including all of the Independent Trustees, concluded that the approval of the Advisory Agreements was in the best interests of the Fund and its shareholders and unanimously approved the Advisory Agreements for a two-year period commencing from the execution of the Advisory Agreements.
216
Supplemental Information (Continued)
January 31, 2014 (Unaudited)
Nationwide Ziegler Equity Income Fund
Approval of Advisory and Subadvisory Agreements
At the March 28, 2013 meeting of the Board of Trustees, the Board, including the Independent Trustees, discussed and unanimously approved, for the Nationwide Ziegler Equity Income Fund (the “Fund”), the Investment Advisory Agreement with Nationwide Fund Advisors (“NFA”) and the Subadvisory Agreement with Ziegler Lotsoff Capital Management, LLC (“Ziegler,” and, together with NFA, the “Advisers”) (each, an “Advisory Agreement,” and together, the “Advisory Agreements”). The Trustees were provided with detailed materials relating to Ziegler in advance of the meeting. The material factors and conclusions that formed the basis for the approval are discussed below.
The Trustees met in person with Nationwide Fund Advisors (“NFA”), the investment adviser to the Fund, Trust counsel, Independent Legal Counsel, and others. The Trustees also reviewed the proposed subadvisory relationship with representatives of Ziegler.
In making their determinations, the Trustees noted that Ziegler is currently the sub-adviser to the HighMark Equity Income Fund, and that the new Fund is intended to be the successor to that fund. The Trustees took into account information provided by the Advisers as to management style and investment philosophy and process, and the financial position, of Ziegler. The Trustees considered Ziegler’s past performance and Ziegler’s personnel that would be serving the Fund. The Trustees considered the terms of the Advisory Agreements and information regarding fee arrangements, including the structure of the sub-advisory fees, and the fact that NFA pays Ziegler out of its advisory fees.
The Trustees noted that the proposed advisory fees to be paid by the Fund to NFA were below the median of the fees paid by the peer funds presented at the meeting. They also considered pro forma performance information provided by NFA (actual performance of the HighMark Equity Income Fund adjusted to reflect the Fund’s expense and load structure) showing that three-year pro forma Class A performance of the Fund through a recent date exceeded the median performance of a Lipper peer universe identified by NFA.
After discussion and consideration among themselves, and with NFA, Trust counsel, and Independent Legal Counsel, the Trustees concluded the following:
| — | The nature and extent of the investment advisory services to be provided to the Fund by the Advisers were appropriate and consistent with the terms of the Advisory Agreements; |
| — | The prospects for satisfactory investment performance were reasonable; |
| — | The cost of services to be provided by the Advisers to the Fund appeared reasonable in relation to the services and benefits to be provided to the Fund; and |
| — | Profitability should be assessed after a reasonable period of Fund operations. |
Based on all relevant information and factors, none of which was individually determinative of the outcome, the Trustees, including all of the Independent Trustees, concluded that the approval of the Advisory Agreements was in the best interests of the Fund and its shareholders and unanimously approved the Advisory Agreements for a two-year period commencing from the execution of the Advisory Agreements.
217
Supplemental Information (Continued)
January 31, 2014 (Unaudited)
Nationwide Ziegler NYSE Arca Tech 100 Index Fund
Approval of Advisory and Subadvisory Agreements
At the March 28, 2013 meeting of the Board of Trustees, the Board, including the Independent Trustees, discussed and unanimously approved, for the Nationwide Ziegler NYSE Arca Tech 100 Index Fund (the “Fund”), the Investment Advisory Agreement with Nationwide Fund Advisors (“NFA”) and the Subadvisory Agreement with Ziegler Lotsoff Capital Management, LLC (“Ziegler,” and, together with NFA, the “Advisers”) (each, an “Advisory Agreement,” and together, the “Advisory Agreements”). The Trustees were provided with detailed materials relating to Ziegler in advance of the meeting. The material factors and conclusions that formed the basis for the approval are discussed below.
The Trustees met in person with Nationwide Fund Advisors (“NFA”), the investment adviser to the Fund, Trust counsel, Independent Legal Counsel, and others. The Trustees also reviewed the proposed subadvisory relationship with representatives of Ziegler.
In making their determinations, the Trustees noted that Ziegler is currently the sub-adviser to the HighMark NYSE Arca Tech 100 Index Fund, and that the new Fund is intended to be the successor to that fund. The Trustees took into account information provided by the Advisers as to management style and investment philosophy and process, and the financial position, of Ziegler. The Trustees considered Ziegler’s past performance and Ziegler’s personnel that would be serving the Fund. The Trustees considered the terms of the Advisory Agreements and information regarding fee arrangements, including the structure of the sub-advisory fees, and the fact that NFA pays Ziegler out of its advisory fees.
The Trustees noted that the proposed advisory fees to be paid by the Fund to NFA were below the median of the fees paid by the peer funds presented at the meeting. They also considered pro forma performance information provided by NFA (actual performance of the HighMark NYSE Arca Tech 100 Index Fund adjusted to reflect the Fund’s expense and load structure) showing that three-year pro forma Class A performance of the Fund through a recent date exceeded the median performance of a Lipper peer universe identified by NFA.
After discussion and consideration among themselves, and with NFA, Trust counsel, and Independent Legal Counsel, the Trustees concluded the following:
| — | The nature and extent of the investment advisory services to be provided to the Fund by the Advisers were appropriate and consistent with the terms of the Advisory Agreements; |
| — | The prospects for satisfactory investment performance were reasonable; |
| — | The cost of services to be provided by the Advisers to the Fund appeared reasonable in relation to the services and benefits to be provided to the Fund; and |
| — | Profitability should be assessed after a reasonable period of Fund operations. |
Based on all relevant information and factors, none of which was individually determinative of the outcome, the Trustees, including all of the Independent Trustees, concluded that the approval of the Advisory Agreements was in the best interests of the Fund and its shareholders and unanimously approved the Advisory Agreements for a two-year period commencing from the execution of the Advisory Agreements.
218
January 31, 2014
Trustees and Officers of the Trust
The address for each Trustee is: c/o Nationwide Funds Group, 1000 Continental Drive, Suite 400, King of Prussia, PA 19406.
| Name and Year of Birth | Position(s) Held with the Trust and Length of Time Served1,2 | Principal Occupation(s) During Past Five Years (or longer)3 | Number of Portfolios in the Nationwide Fund Complex Overseen by Trustee | Other Directorships Held by Trustee During Past Five Years4 | ||||||
Charles E. Allen 1948 | Trustee since July 2000 | Mr. Allen was Chairman, Chief Executive Officer and President of Graimark Realty Advisors, Inc. (real estate development, investment and asset management) from its founding in 1987 to 2012. | 112 | None | ||||||
Paula H.J. Cholmondeley 1947 | Trustee since July 2000 | Ms. Cholmondeley focuses full time on corporate governance. She sits on public company boards and is also on the faculty of the National Association of Corporate Directors. She has served as a Chief Executive Officer of Sorrel Group (management consulting company) since January 2004. From April 2000 through December 2003, Ms. Cholmondeley was Vice President and General Manager of Sappi Fine Paper North America. | 112 | Director of Dentsply International, Inc. (dental products) from 2002 to present, Ultralife Batteries, Inc. from 2004 to 2010, Albany International Corp. (paper industry) from 2005 to 2013, Terex Corporation (construction equipment) from 2004 to present, and Minerals Technology, Inc. (specialty chemicals) from 2005 to present. | ||||||
Phyllis Kay Dryden 1947 | Trustee since December 2004 | Ms. Dryden became CEO and President of Energy Dispute Solutions, LLC in January 2013, leading a company providing strategy consulting, arbitration and mediation services. She has been a management consultant since 1996, first as a partner of Mitchell Madison Group, then as a managing partner and head of west coast business development for marchFIRST, returning to Mitchell Madison Group in 2003 as an associated partner until January 2010 and thereafter as an independent strategy consultant through December 2012. Ms. Dryden was VP and General Counsel of Lucasfilm, Ltd. from 1981 to 1984, SVP and General Counsel of Charles Schwab and Co., Inc. from 1984 to 1992, and EVP and General Counsel of Del Monte Foods from 1992 to 1995. | 112 | None | ||||||
219
Management Information (Continued)
January 31, 2014
The address for each Trustee is: c/o Nationwide Funds Group, 1000 Continental Drive, Suite 400, King of Prussia, PA 19406.
| Name and Year of Birth | Position(s) Held with the Trust and Length of Time Served1,2 | Principal Occupation(s) During Past Five Years (or longer)3 | Number of Portfolios in the Nationwide Fund Complex Overseen by Trustee | Other Directorships Held by Trustee During Past Five Years4 | ||||||
Barbara L. Hennigar 1935 | Trustee since July 2000 | Ms. Hennigar was Executive Vice President of Oppenheimer Funds (an asset management company) from October 1992 until June 2000; Chairman of Oppenheimer Funds Services from October 1999 until June 2000; and President and CEO of Oppenheimer Funds Services from June 1992 until October 1999. She was previously Board Chair of a non-profit independent school, and is currently an independent trustee and endowment chair of St. Mary’s Academy, an independent school in Denver, CO. | 112 | None | ||||||
Barbara I. Jacobs 1950 | Trustee since December 2004 | Ms. Jacobs served as Chairman of the Board of Directors of KICAP Network Fund, a European (United Kingdom) hedge fund, from January 2001 through January 2006. From 1988 through 2003, Ms. Jacobs was also a Managing Director and European Portfolio Manager of CREF Investments (Teachers Insurance and Annuity Association-College Retirement Equities Fund). | 112 | None | ||||||
Keith F. Karlawish 1964 | Trustee since March 2012 | Mr. Karlawish has been a partner of Park Ridge Asset Management, LLC since December 2008, at which he also serves as a portfolio manager. From May 2002 until October 2008, Mr. Karlawish was the President of BB&T Asset Management, Inc., and was President of the BB&T Mutual Funds and BB&T Variable Insurance Funds from February 2005 until October 2008. | 112 | Trustee of the BB&T Mutual Funds and BB&T Variable Insurance Funds from June 2006 until December 2008. | ||||||
Carol A. Kosel 1963 | Trustee since March 2013 | Ms. Kosel was a consultant to the Evergreen Funds Board of Trustees from October 2005 to December 2007. She was Senior Vice President, Treasurer, and Head of Fund Administration of the Evergreen Funds from April 1997 to October 2005. | 112 | Trustee of Sun Capital Advisers Trust from April 2011 to December 2012 and Trustee of Evergreen Funds from January 2008 to July 2010. | ||||||
Douglas F. Kridler 1955 | Trustee since September 1997 | Mr. Kridler is the President and Chief Executive Officer of The Columbus Foundation, a $1.5 billion community foundation with 2,000 funds in 55 Ohio counties and 37 states in the U.S. | 112 | None | ||||||
220
Management Information (Continued)
January 31, 2014
The address for each Trustee is: c/o Nationwide Funds Group, 1000 Continental Drive, Suite 400, King of Prussia, PA 19406.
Name and Year of Birth | Position(s) Held with the Trust and Length of Time Served1,2 | Principal Occupation(s) During Past Five Years (or longer)3 | Number of Portfolios in the Nationwide Fund Complex Overseen by Trustee | Other Directorships Held by Trustee During Past Five Years4 | ||||||
David C. Wetmore 1948 | Trustee since 1995 and Chairman since February 2005 | Mr. Wetmore was a Managing Director of Updata Capital, Inc. (a technology-oriented investment banking and venture capital firm) from 1995 through 2000. Prior to 1995, Mr. Wetmore served as the Chief Operating Officer, Chief Executive Officer and Chairman of the Board of several publicly-held software and services companies, and as the managing partner of a “big 8” public accounting firm. | 112 | None | ||||||
| 1 | Length of time served includes time served with predecessor of the Trust. |
| 2 | Each Trustee holds office for the lifetime of the Trust or until such Trustee’s earlier death, resignation, removal, retirement or inability otherwise to serve, or the election and qualification of his or her successor. |
| 3 | Unless otherwise noted, the information presented is the principal occupation of the Trustee during the past five years. |
| 4 | Directorships held in (i) any other investment companies registered under the 1940 Act, (ii) any company with a class of securities registered pursuant to Section 12 of the Securities Exchange Act of 1934, as amended (the “Exchange Act”) or (iii) any company subject to the requirements of Section 15(d) of the Exchange Act. |
221
Management Information (Continued)
January 31, 2014
The address for each Officer is: c/o Nationwide Funds Group, 1000 Continental Drive, Suite 400, King of Prussia, PA 19406.
| Name and Year of Birth | Position(s) Held with Fund and Length of Time Served1 | Principal Occupation(s) During Past Five Years2 | ||
Michael S. Spangler 1966 | President and Chief Executive Officer since June 2008 | Mr. Spangler is President and Chief Executive Officer of Nationwide Funds Group, which includes NFA3, Nationwide Fund Management LLC3 and Nationwide Fund Distributors LLC3, and is a Senior Vice President of NFS3. From May 2004 through May 2008, Mr. Spangler was Managing Director, Head of Americas Retail and Intermediary Product Management for Morgan Stanley Investment Management. | ||
Stephen T. Grugeon 1950 | Executive Vice President and Chief Operating Officer since June 2008 | Mr. Grugeon has been Executive Vice President and Chief Operating Officer of Nationwide Funds Group since May 20073. From February 2008 through June 2008, he also served as the acting President and Chief Executive Officer of the Trust and of Nationwide Funds Group. From December 2006 until January 2008, he was Executive Vice President of NWD Investments3. | ||
Joseph Finelli 1957 | Treasurer since September 2007 | Mr. Finelli is the Principal Financial Officer and Senior Vice President for Nationwide Funds Group3. From July 2001 until September 2007, he was Assistant Treasurer and Vice President of Investment Accounting and Operations of NWD Investments3. | ||
Brian Hirsch 1956 | Chief Compliance Officer since January 2012 | Mr. Hirsch is Vice President of NFA and Chief Compliance Officer of NFA and the Trust. From January 2003 through January 2012, Mr. Hirsch was the Senior Vice President for Compliance and Fund Administration at IFS Financial Services, Inc., a subsidiary of the Western Southern Financial Group. | ||
Eric E. Miller 1953 | Secretary since December 2002 | Mr. Miller is Senior Vice President, General Counsel, and Assistant Secretary for Nationwide Funds Group and NWD Investments3. | ||
Doff Meyer 1950 | Vice President and Chief Marketing Officer since January 2008 | Ms. Meyer is Senior Vice President and Chief Marketing Officer of Nationwide Funds Group (since August 2007)3. From September 2004 until August 2007, Ms. Meyer was Director of Finance and Marketing, Principal of Piedmont Real Estate Associates LLC. |
| 1 | Length of time served includes time served with the Trust’s predecessors. |
| 2 | Unless otherwise noted, the information presented is the principal occupation of the Officer during the past five years. |
| 3 | These positions are held with an affiliated person or principal underwriter of the Funds. |
Additional information regarding the Trustees and Officers may be found in the Trust’s Statement of Additional Information, which is available without charge upon request, by calling 800-848-0920.
Federal law requires the Trust and each of its investment advisers and subadvisers to adopt procedures for voting proxies (“Proxy Voting Guidelines”) and to provide a summary of those Proxy Voting Guidelines used to vote the securities held by the Fund. The Fund’s proxy voting policies and procedures are available without charge (i) upon request, by calling 800-848-0920, (ii) on the Trust’s website at nationwide.com/mutualfunds, and (iii) on the Securities and Exchange Commission’s website at www.sec.gov.
222
| Market Index Definitions |
Barclays 7-Year Municipal Bond Index: An unmanaged index that consists of a broad selection of investment-grade general obligation and revenue bonds with maturities of approximately seven years.
Barclays Emerging Markets USD Aggregate Bond Index: An unmanaged index comprising fixed-rate and floating-rate U.S. dollar-denominated bonds from sovereign, quasi-sovereign and corporate emerging market issuers; the countries considered to be emerging markets are determined by annual review using rules-based classifications from the World Bank income group and the International Monetary Fund (IMF).
Barclays Municipal Bond Index: An unmanaged, market value-weighted index of investment-grade municipal bonds with a minimum credit rating of Baa and maturities of one year or more; serves as a broad market performance index for the tax-exempt bond market.
Barclays U.S. 1-3 Year Government/Credit Bond Index: An unmanaged index of U.S. dollar-denominated, investment-grade, fixed-rate, publicly issued, taxable bond market issues (including Treasury, government and corporate securities) with a remaining maturity of one to three years.
Barclays U.S. 10-20 Year Treasury Bond Index: An unmanaged index that measures the performance of U.S. Treasury securities with a remaining maturity of 10 to 20 years.
Barclays U.S. Aggregate Bond Index: An unmanaged, market value-weighted index of investment-grade, fixed-rate debt issues (including government, corporate, asset-backed, and mortgage-backed securities with maturities of one year or more) that is generally representative of the bond market as a whole.
Barclays U.S. Corporate High Yield Index: An unmanaged index that reflects the performance of fixed-rate, non-investment-grade, U.S. dollar-denominated taxable corporate bonds with at least $150 million par value outstanding, a maximum credit rating of Ba1 and a maturity of one year or more; gives a broad look at how high-yield (“junk”) bonds have performed.
Consumer Price Index (CPI): Calculated by the U.S. Department of Labor’s Bureau of Labor Statistics, the CPI represents changes in prices of a basket of goods and services purchased for consumption by urban households.
Lipper Analytical Services, Inc. (Lipper) is an industry research firm whose rankings are based on total return performance and do not reflect the effect of sales charges. Each fund is ranked within a universe of funds similar in investment objective as determined by Lipper.
MSCI ACWI ex USA: An unmanaged, market capitalization-weighted index that is designed to measure the performance of the stocks in the global developed and emerging markets, excluding U.S.-based companies.
MSCI Emerging Markets® Index: An unmanaged, free float-adjusted, market capitalization-weighted index that is designed to measure the performance of the stocks in emerging-country markets.
MSCI World ex USA Index: An unmanaged index that measures the equity market performance of developed-market countries excluding the United States; covers approximately 85% of the free float-adjusted market capitalization in each country, capturing large- and mid-cap representation.
NASDAQ-100 Index: An unmanaged index that includes 100 of the largest domestic and international nonfinancial securities listed on the Nasdaq Stock Market, based on market capitalization.
223
| Market Index Definitions (con’t.) |
NYSE Arca Tech 100 Index®: An unmanaged, price-weighted index of at least 100 individual technology-related securities, consisting of stocks of companies from various industries that produce or deploy innovative technologies to conduct their business.
Russell 1000® Growth Index: An unmanaged index that measures the performance of the large-capitalization growth segment of the U.S. equity universe; includes those Russell 1000® Index companies with higher price-to-book ratios and higher forecasted growth values.
Russell 1000® Value Index: An unmanaged index that measures the performance of the large-capitalization value segment of the U.S. equity universe; includes those Russell 1000® Index companies with lower price-to-book ratios and lower forecasted growth values.
Russell 2000® Index: An unmanaged index that measures the performance of the small-capitalization segment of the U.S. equity universe.
Russell 2000® Growth Index: An unmanaged index that measures the performance of the large-capitalization growth segment of the U.S. equity universe; includes those Russell 2000® Index companies with higher price-to-book ratios and higher forecasted growth values.
Russell Midcap® Growth Index: An unmanaged index that measures the performance of the mid-capitalization growth segment of the U.S. equity universe; includes those Russell Midcap® Index companies with higher price-to-book ratios and higher forecasted growth values.
Note about Russell Indexes
Russell Investment Group is the source and owner of the trademarks, service marks and copyrights related to the Russell Indexes. Russell® is a trademark of Russell Investment Group.
S&P 500® Index: An unmanaged, market capitalization-weighted index of 500 stocks of leading large-cap U.S. companies in leading industries; gives a broad look at the U.S. equities market and those companies’ stock price performance.
S&P North American Technology Sector Index™: An unmanaged, modified, market capitalization-weighted index that measures the performance of the technology sector of the U.S. equity market.
S&P SmallCap 600® Value Index: An unmanaged index comprising small-capitalization value stocks included in the S&P SmallCap 600® Index. Performance is measured based on the ratios of book value, earnings, and sales to price.
224
| Glossary |
Definitions of some commonly used investment terms
Benchmark index: A broad-based securities index used as a comparison tool to measure the performance of a mutual fund.
Coefficient of correlation: a measure that determines the degree to which the movements of two variables are associated.
Derivative: A contract, security or investment with its value based on the performance of an underlying financial asset, index or economic measure.
Duration: A measure of how much the price of a bond would change compared to a change in market interest rates, based on the remaining time until a bond’s maturity together with other factors. A bond’s value drops when interest rates rise, and vice versa. Bonds with longer durations have higher risk and volatility.
Emerging market countries: Developing and low- or middle-income countries as identified by the International Finance Corporation or the World Bank. Emerging market countries may be found in regions such as Asia, Latin America, Eastern Europe, the Middle East and Africa.
Equity securities: Securities that represent an ownership interest in the issuer. Common stocks are the most common type of equity securities.
Expense ratio: The percentage of fees paid by a fund to its adviser for management and operational costs. A fund’s expense ratio includes all administrative expenses and 12b-1 fees but excludes sales charges.
Fixed-income securities: Securities, including bonds and other debt securities, that represent an obligation by the issuer to pay a specified rate of interest or dividend at specified times and eventually return the principal at maturity.
Futures: Contracts that obligate the buyer to buy and the seller to sell a specified quantity of an underlying asset (or settle for cash the value of a contract based on the underlying asset) at a specified price on the contract’s maturity date.
Growth style: Investing in equity securities of companies that the Fund’s subadviser believes have above-average rates of earnings growth and which therefore may experience above-average increases in stock price.
High-yield bonds: Fixed-income securities that are rated below investment grade by nationally recognized statistical rating organizations. These bonds generally offer investors higher interest rates as a way to help compensate for the fact that the issuer is at greater risk of default.
Market capitalization: A common way of measuring the size of a company based on the price of its common stock multiplied by the number of outstanding shares.
Preferred stock: A class of stock that often pays dividends at a specified rate and has preference over common stocks in dividend payments and liquidation of assets.
Quantitative techniques: Mathematical and statistical methods used in the investment process to identify securities of issuers for possible purchase or sale by a mutual fund.
Value style: Investing in equity securities that a fund’s manager believes are undervalued, i.e., their stock prices are less than the manager believes they are intrinsically worth, based on such factors as a company’s stock price relative to its book value, earnings and cash flow.
Yield curve: A plotted graph line showing the interest rates of bonds, at a set point in time, that have equal credit quality but different maturity dates.
225
P.O. Box 701
Milwaukee, WI 53201-0701
nationwide.com/mutualfunds


Investors should carefully consider a fund’s (and, if applicable, each of its underlying funds’) investment objectives, risks, fees, charges and expenses before investing any money. To obtain this and other information on Nationwide Funds, please call 1-800-848-0920 to request a summary prospectus and/or a prospectus, or download a summary prospectus and/or a prospectus at nationwide.com/mutualfunds. Please read it carefully before investing any money.
About Nationwide Funds Group (NFG)
NFG comprises Nationwide Fund Advisors, Nationwide Fund Distributors LLC and Nationwide Fund Management LLC. Together they provide advisory, distribution and administration services, respectively, to Nationwide Funds. Nationwide Fund Advisors (NFA) is the investment adviser to Nationwide Funds. NFA is a wholly owned subsidiary of Nationwide Financial Services, Inc. (NFS).
Distributor
Nationwide Funds distributed by Nationwide Fund Distributors LLC (NFD), member FINRA, King of Prussia, Pa. NFD is not an affiliate of any subadviser discussed in this material.
Nationwide, Nationwide Financial, the Nationwide framemark, Nationwide Funds, Nationwide Funds Group and On Your Side are service marks of Nationwide Mutual Insurance Company.
© 2014 Nationwide Funds Group. All rights reserved.
SAR-HM-CEQ 3/14

Semiannual Report
January 31, 2014
Nationwide Mutual Funds
Fixed-Income Funds
Nationwide HighMark Bond Fund
Nationwide HighMark California Intermediate Tax Free Bond Fund
Nationwide HighMark National Intermediate Tax Free Bond Fund
Nationwide HighMark Short Term Bond Fund
Nationwide Ziegler Wisconsin Tax Exempt Fund

| Nationwide Funds® |
Commentary in this report is provided by the portfolio manager(s) of each Fund as of the date of this report and is subject to change at any time based on market or other conditions.
Third-party information has been obtained from sources that Nationwide Fund Advisors (NFA), the investment adviser to the Funds, deems reliable. This report and the holdings provided are for informational purposes only and are not intended to be relied on as investment advice. Portfolio composition is accurate as of the date of this report and is subject to change at any time and without notice. NFA, one of its affiliated advisers or its employees may hold a position in the securities in this report.
Statement Regarding Availability of Quarterly Portfolio Holdings.
The Trust files complete schedules of portfolio holdings for each Fund with the Securities and Exchange Commission (SEC) for the first and third quarters of each fiscal year on Form N-Q. Additionally, the Trust files a schedule of portfolio holdings monthly for the Nationwide Money Market Fund on Form N-MFP. Forms N-Q and Forms N-MFP are available on the SEC’s website at http://www.sec.gov. Forms N-Q and Forms N-MFP may be reviewed and copied at the SEC’s Public Reference Room in Washington, DC, and information on the operation of the Public Reference Room may be obtained by calling 800-SEC-0330. The Trust also makes this information available to shareholders on nationwide.com/mutualfunds or upon request without charge.
Statement Regarding Availability of Proxy Voting Record.
Information regarding how the Funds voted proxies relating to portfolio securities held during the most recent 12-month period ended June 30 is available without charge, upon request, by calling 800-848-0920, and on the SEC’s website at http://www.sec.gov.
| Nationwide Funds® Semiannual Report |
| Nationwide Funds® |
January 31, 2014
Dear Shareholder,
I am pleased to write this message to you for the mutual fund reports covering the six-month period ended January 31, 2014. Perhaps you recently became a Nationwide Funds shareholder through our 2013 acquisition of 17 HighMark Funds. Or maybe you have been a Nationwide Funds shareholder for a long time and are now invested in one of our newer solutions. Either way, we sincerely value your business. You can be assured that we are dedicated to your success and look forward to providing you and your advisor with timely information and service.
This is an exciting time to be a Nationwide Funds shareholder. The HighMark acquisition expanded the breadth of our fund lineup by adding exposure to eight new asset classes, giving us the ability to offer our shareholders more diverse investment options.
As a Nationwide Funds shareholder you understand that planning and preparation are essential steps to reaching future goals. When I think about smart planning I think about Abraham Lincoln, who said “Give me six hours to chop down a tree and I will spend the first four sharpening the ax.” By working with your advisor and taking a considered, disciplined, long-term approach to investing, you are taking the time to sharpen your ax. Doing so can enable you to be well positioned, even during periods of market volatility and economic downturns.
After several years of tepid economic recovery, many investors are casting a wary eye toward the future. While we have seen progress across economic indicators quarter to quarter, we understand that for many Americans it still does not feel like things are getting better. Domestically, economic progress has been evident as the unemployment rate, gross domestic product (GDP) and the housing market showed modest indications of improvement throughout the six months of the reporting period. Broad U.S. stock market performance increased for the reporting period, with gains for the S&P 500® Index at 6.85%. Still, many investors’ portfolio returns were tempered during the reporting period by low-yielding fixed-income investments, as evidenced by the Barclays U.S. Aggregate Bond Index, which returned 1.78%. More market mending is still needed.
Yet, with preparation, poise and a patient forward-looking perspective, you may confidently pursue your goals no matter what the current economic or market climate. Nationwide has the wisdom and perspective that come from a long history of caring for our customers. For more than 80 years, we have nurtured our customers’ assets through all phases of market cycles. We are honored to now work with you.
Thank you for investing with Nationwide Funds.
Sincerely,

Michael S. Spangler
President & CEO
Nationwide Funds
1
| Economic Review |
During the six-month reporting period ended January 31, 2014, the level of investment return in the markets varied greatly by asset class. U.S. equities experienced a broad-based rally, with the S&P 500® Index delivering a 6.85% return, and nearly all sectors and capitalization ranges showing strong performance for the reporting period. International equities results were mixed, with positive developed market performance offset by negative returns in emerging markets. Fixed-income returns were positive, primarily in the long-term and credit-sensitive segments.
In the United States, investment performance during the reporting period was affected by news from Washington and reports of uncertainty regarding emerging market economies. Equity market returns and bond yields reacted to actions by the Federal Reserve Board to decrease (taper) the asset purchase program, also known as Quantitative Easing (QE).
The S&P 500 Index registered negative performance in the first and last months of the reporting period (August 2013 and January 2014), but delivered strong performance from September through December 2013.
The best-performing sectors for the S&P 500 Index during the reporting period were technology, up 13.2%; industrials, up 11.7%; and health care, up 10.7%. Technology and industrials benefited from a strong earnings environment, while health care rallied in reaction to excitement surrounding new products. The weakest sectors during the reporting period were telecommunications, with -2.6%; consumer staples, with -0.2%; and utilities, with 1.1%. These three sectors were affected by investors’ move away from dividend-focused sectors as rates rose and cyclical exposure was preferred.
The strong performance in U.S. equities was broad based during the reporting period, with small-capitalization stocks outperforming large-cap stocks, and growth outperforming value.
U.S. economic activity was strong during the reporting period; third-quarter 2013 gross domestic product (GDP) growth of 4.1% was the second-highest quarterly result since March 2006. GDP growth decelerated to 3.2% in the fourth quarter of 2013 but remained above average in relation to other post-recession quarters. Inflation remained well controlled throughout the reporting period, with the U.S. Consumer Price Index (CPI) and the core CPI (excluding the volatile food and energy categories) remaining below 2%. Despite job-creation levels coming in lower than during many past recoveries, the unemployment rate continued to decline during the reporting period, falling from 7.2% to 6.6%.
Throughout the reporting period, the performance of international stocks continued to be positive, but weaker relative to U.S. stocks. Europe was reminded of the fragile state of the banking systems of its weaker members, this time with Cyprus. Continued political tensions in Greece, sluggish European economic growth and worries about a U.S. tapering depressed relative returns through mid-2013 before the market rallied in response to the stabilization of political and banking system risk. Returns in Asia were mixed, with relative strength exhibited in Japan due to the prospect of renewed stimulus by Japan’s central bank and a beneficial exchange rate offset by weakness in the developing economies. Emerging market stocks were weak on concerns about slowing economic growth in China, political tensions in Brazil, Turkey, North Korea and the Middle East, and steadily declining commodity prices.
2
| Economic Review (con’t.) |
Performance in the fixed-income markets was driven by stabilization in interest rates during the reporting period. Long-term Treasury yields rose from 1.63% to 2.71% in the three months prior to the reporting period (May 1 through August 1), but showed little volatility during the reporting period, ending at 2.65%. Fixed-income returns were positive, as investors absorbed the news that the Fed will begin to taper the QE program. Long-term and credit-sensitive bonds delivered the strongest performance during the reporting period.
| Index |
| Six-Month Total Return (as of 1/31/14) |
| |
| Barclays Emerging Markets USD Aggregate Bond | 1.16% | |||
| Barclays Municipal Bond | 2.99% | |||
| Barclays U.S. 1-3 Year Government/Credit Bond | 0.55% | |||
| Barclays U.S. 10-20 Year Treasury Bond | 1.69% | |||
| Barclays U.S. Aggregate Bond | 1.78% | |||
| Barclays U.S. Corporate High Yield | 4.70% | |||
| MSCI Emerging Markets® | -0.33% | |||
| MSCI World ex USA | 6.44% | |||
| Russell 1000® Growth | 10.15% | |||
| Russell 1000® Value | 4.63% | |||
| Russell 2000® | 8.88% | |||
| S&P 500® | 6.85% |
3
| Fund Commentary | Nationwide HighMark Bond Fund |
For the semiannual period ended January 31, 2014, the Nationwide HighMark Bond Fund (Institutional Service Class) returned 2.13%* versus 1.78 % for its benchmark, the Barclays U.S. Aggregate Bond Index. For broader comparison, the median return for the Fund’s closest Lipper peer category of Corporate Debt Funds BBB-Rated (consisting of 199 funds as of January 31, 2014) was 2.77% for the same time period.
| * | Performance prior to the Fund’s inception on September 16, 2013, is based on the performance of the Fund’s predecessor fund. |
Market Environment
The fixed-income markets were volatile during the reporting period due to uncertainty about fiscal and monetary policy, particularly regarding the future of the Federal Reserve’s bond purchase program. After months of hints from the Fed that it would begin to moderate its monthly bond purchases, the Fed ultimately decided at the September 2013 Federal Open Market Committee (FOMC) meeting not to make any changes. Since Treasury rates had risen more than 100 basis points on the expectation that monetary policy was about to be tightened, this came as a surprise to the markets, and interest rates reversed course and began falling. Treasury yields, which reached two-year highs in early September, fell rapidly as investors reassessed the timing of the Fed’s exit, reaching the period low in late October. Equities, high-yield bonds and emerging markets, having sold off in anticipation of reduced support from the central bank, also began substantial recoveries. It wasn’t long, however, until indications of firmer economic growth began to cause interest rates to rise once more. In addition, after a politically damaging government shutdown in October, the U.S. Congress managed to quickly pass a budget agreement in December 2013 to avoid another government shutdown. The resulting federal budget agreement is expected to have a slightly less negative impact on gross domestic product (GDP) in 2014, although the federal debt ceiling will need to be raised again, perhaps as soon as March, providing another potential flashpoint. On December 18, 2013, the FOMC finally took the first step toward ending the Fed’s bond purchases, deciding to “modestly reduce the pace of its
asset purchases” from $85 billion per month to $75 billion, marking the beginning of the end of this previously unlimited program.
The Fed’s decision to scale back its bond purchases, along with stronger job growth, caused interest rates to begin rising once again in November 2013. Although the 10-year Treasury yield traded between 2.5% and 3.0% during the reporting period, most Treasury yields ended the reporting period at about the same level at which they began. The most significant changes occurred in the intermediate portion of the yield curve (a plotted graph line of the yields, or interest rates, on long-term and short-term maturity bonds), but even there rates increased only 10 to 12 basis points for the reporting period. Short-term Treasury bills fell by a few basis points during the reporting period and continue to be anchored by the Fed’s commitment to keep the federal funds rate unchanged until the labor market shows substantial improvement. While the yield on the two-year Treasury climbed 2 basis points, the 10-year yield increased 7 basis points, and the 30-year bond yield declined 4 basis points during the reporting period.
Portfolio Performance
Risk assets staged a strong rally during the reporting period as improving U.S. economic data and solid company earnings, along with improved market sentiment and the continued search for yield, boosted market valuations. Investment-grade corporate bond spreads ended the period at 130 basis points, the tightest level since July 2007, while high-yield bond spreads finished at 421 basis points, below the long-term average of 600 basis points.
The Fund outperformed the benchmark index during the reporting period primarily as a result of the Fund’s overweight to corporate bonds, which outperformed Treasurys by 183 basis points. Individual issuers that contributed positively to Fund performance during the reporting period included the State of California, Los Angeles Department of Water and Power, British Air, Hewlett Packard and Ford, while issues that detracted from Fund performance included Verizon, CVS Caremark, Berkshire Hathaway,
4
| Fund Commentary (cont’d) | Nationwide HighMark Bond Fund |
Clorox and Transcontinental Gas. Duration positioning was a neutral factor during the reporting period as interest rates were little changed; however, rates increased approximately 10 to 12 basis points near the 5-year to 7-year area of the yield curve, which had a slightly negative impact on Fund performance.
Agency mortgage-backed securities rose during the period as option-adjusted spreads narrowed by 18 basis points. Agency mortgage spreads remained below long-term averages, supported by the Fed’s low-interest-rate policy and agency mortgage bond-buying mandate. The volume of mortgages issued at these low rates has kept the duration of the mortgage index near the longest in its history, 5.6 years at period end. The Fed continues to reinvest principal and interest payments from its existing portfolio into agency mortgage-backed securities in addition to those purchased under the quantitative easing (QE) program.
Outlook and Positioning
Our near-term outlook is for a gradual improvement in economic growth to put modest upward pressure on Treasury yields beyond two-year maturities. Short-term rates, however, are likely to continue to be anchored by the Fed’s commitment to “a highly accommodative stance of monetary policy…for a considerable time after the asset purchase program ends and the economic recovery strengthens.” Despite the announced reduction in bond purchases, the Fed continues to emphasize that there is no predetermined path for asset purchases and that future decisions regarding the pace remain dependent upon the Fed’s outlook for the labor market and inflation. Corporate bonds should continue to perform well in this environment as the economy slowly improves, valuations remain relatively attractive and the Fed continues to be supportive.
Subadviser:
HighMark Capital Management, Inc.
Portfolio Managers:
Jeffrey Klein, Gregory Lugosi,
E. Jack Montgomery and David Wines
The Fund is subject to the risks of investing in fixed-income securities, including high-yield bonds (which are more volatile and at a greater risk of default). The Fund may invest in more-aggressive investments such as foreign securities (which are volatile, harder to price and less liquid than U.S. securities). Please refer to the summary prospectus for a more detailed explanation of the Fund’s principal risks.
A description of the benchmarks can be found on the Market Index Definitions page at the back of this book.
5
| Fund Overview (Unaudited) | Nationwide HighMark Bond Fund |
Objective
The Fund seeks total return through investments in fixed-income securities.
Highlights
| Ÿ | For the semiannual period ended January 31, 2014, the Nationwide HighMark Bond Fund (Institutional Service Class) returned 2.13%, outperforming the benchmark by 0.35% and underperforming the Lipper peer category by 0.64%. |
| Ÿ | Risk assets staged a strong rally during the reporting period as improving U.S. economic data and solid company earnings, along with improved market sentiment and the continued search for yield, boosted market valuations. |
| Ÿ | Our near-term outlook is for a gradual improvement in economic growth to put modest upward pressure on Treasury yields beyond two-year maturities. |
Asset Allocation†
| Corporate Bonds | 59.1% | |||
| U.S. Government Mortgage Backed Agencies | 9.5% | |||
| Asset-Backed Securities | 9.4% | |||
| Commercial Mortgage Backed Securities | 6.5% | |||
| U.S. Treasury Notes | 5.1% | |||
| Municipal Bonds | 4.5% | |||
| Collateralized Mortgage Obligations | 3.0% | |||
| Mutual Fund | 1.6% | |||
| Yankee Dollar | 0.5% | |||
| Sovereign Bond | 0.4% | |||
| Bank Loan | 0.3% | |||
| Other assets in excess of liabilities | 0.1% | |||
| 100.0% |
Top Industries††
| Diversified Financial Services | 8.0% | |||
| Commercial Banks | 7.7% | |||
| Automobiles | 6.7% | |||
| Airlines | 4.7% | |||
| Diversified Telecommunication Services | 4.1% | |||
| Food & Staples Retailing | 3.8% | |||
| Gas Utilities | 3.7% | |||
| Electric Utilities | 3.7% | |||
| Oil, Gas & Consumable Fuels | 3.4% | |||
| Media | 2.7% | |||
| Other Industries | 51.5% | |||
| 100.0% |
Top Holdings††
| U.S. Treasury Notes, 2.00%, 02/15/23 | 3.0% | |||
| Morgan Stanley Bank of America Merrill Lynch Trust, 1.31%, 08/15/46 | 2.1% | |||
| Verizon New England, Inc., 7.88%, 11/15/29 | 1.9% | |||
| Georgia-Pacific LLC, 8.00%, 01/15/24 | 1.9% | |||
| Metropolitan Water District of Southern California, RB, 6.95%, 07/01/40 | 1.8% | |||
| Mylan, Inc., 7.88%, 07/15/20 | 1.8% | |||
| Fidelity Institutional Money Market Fund — Institutional Class | 1.6% | |||
| U.S. Treasury Notes, 1.00%, 05/31/18 | 1.5% | |||
| Petrohawk Energy Corp., 7.25%, 08/15/18 | 1.5% | |||
| California State, GO, 6.20%, 10/01/19 | 1.5% | |||
| Other Holdings | 81.4% | |||
| 100.0% |
| † | Percentages indicated are based upon net assets as of January 31, 2014. |
| †† | Percentages indicated are based upon total investments as of January 31, 2014. |
6
| Fund Performance | Nationwide HighMark Bond Fund |
Average Annual Total Return
(For periods ended January 31, 2014)
| Six Months* | 1 Yr. | 5 Yr. | 10 Yr. | |||||||||||||||
| Class A | w/o SC1 | 2.04% | 0.34% | 6.05% | 4.58% | |||||||||||||
| w/ SC2 | (0.24)% | (1.93)% | 5.58% | 4.34% | ||||||||||||||
| Class C | w/o SC1 | 1.84% | (0.08)% | 5.61% | 4.14% | |||||||||||||
| w/ SC3 | 0.84% | (1.08)% | 5.61% | 4.14% | ||||||||||||||
| Institutional Service Class4,5 | w/o SC | 2.13% | 0.57% | 6.31% | 4.84% | |||||||||||||
| Institutional Class4 | w/o SC | 2.45% | 6 | — | — | — | ||||||||||||
All figures showing the effect of a sales charge (SC) reflect the maximum charge possible, because it has the most significant effect on performance data.
| * | Not annualized. |
| 1 | These returns do not reflect the effects of SCs. |
| 2 | A 2.25% front-end sales charge was deducted. Prior to December 1, 2005, the front-end sales charge was 3.25%. |
| 3 | A 1.00% CDSC was deducted from the one year return because it is charged when you sell Class C shares within the first year after purchase. |
| 4 | Not subject to any SCs. |
| 5 | Effective September 16, 2013 Fiduciary Shares were renamed Institutional Service Class Shares. |
| 6 | Since inception date of September 18, 2013. Not Annualized. |
Expense Ratios
| Gross Expense Ratio* | Net Expense Ratio* | |||||||
| Class A | 1.15% | 0.97% | ||||||
| Class C | 1.40% | 1.40% | ||||||
| Institutional Service Class | 0.90% | 0.72% | ||||||
| Institutional Class | 0.65% | 0.65% | ||||||
| * | Current effective prospectus dated September 16, 2013. The difference between gross and net operating expenses reflects contractual waivers in place through November 30, 2015. Please see the Fund's most recent prospectus for details. |
7
| Fund Performance | Nationwide HighMark Bond Fund |
Performance of a $10,000 Investment
Investment return and principal value will fluctuate, and when redeemed, shares may be worth more or less than original cost. Past performance is no guarantee of future results and does not reflect the deduction of taxes that a shareholder would pay on fund distributions or the redemption of fund shares. Investing in mutual funds involves market risk, including loss of principal. Performance returns assume the reinvestment of all distributions.
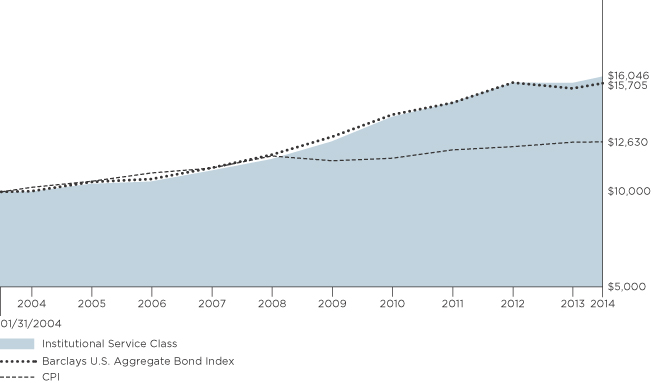
Comparative performance of $10,000 invested in Institutional Service Class shares of the Nationwide HighMark Bond Fund versus the Barclays U.S. Aggregate Bond Index and the Consumer Price Index (CPI) over the 10-year period ended 1/31/14. Fund performance prior to the Fund’s inception on 9/16/13 is based on the Fund’s predecessor Fund. Unlike the Fund, the performance for these unmanaged indexes does not reflect any fees, expenses, or sales charges. One cannot invest directly in a market index. A description of the benchmarks can be found on the Market Index Definitions page at the back of this book.
8
| Shareholder Expense Example | Nationwide HighMark Bond Fund |
As a shareholder of the Fund, you incur two types of costs: (1) transaction costs, including sales charges (loads) paid on purchase payments and redemption fees; and (2) ongoing costs, including investment advisory fees, administration fees, distribution fees and other Fund expenses. The examples below are intended to help you understand your ongoing costs (in dollars) of investing in the Fund and to compare these costs with the ongoing costs of investing in other mutual funds. Per Securities and Exchange Commission (“SEC”) requirements, the examples assume that you had a $1,000 investment in the Class at the beginning of the reporting period (August 1, 2013) and continued to hold your shares at the end of the reporting period (January 31, 2014).
Actual Expenses
For each Class of the Fund in the table below, the first line provides information about actual account values and actual expenses. You may use the information in this line, together with the amount you invested, to estimate the expenses that you paid from August 1, 2013 through January 31, 2014. Simply divide your account value by $1,000 (for example, an $8,600 account value divided by $1,000 = 8.6), then multiply the result by the number in the first line of each Class under the heading entitled “Expenses Paid During Period” to estimate the expenses you paid on your account during this period.
Hypothetical Expenses for Comparison Purposes
The second line of each Class in the table below provides information about hypothetical account values and hypothetical expenses based on the Class’ actual expense ratio and an assumed rate of return of 5% per year before expenses, which is not the Class’ actual return. The hypothetical account values and expenses may not be used to estimate the actual ending account balance or expenses you paid for the period from August 1, 2013 through January 31, 2014. You may use this information to compare the ongoing costs of investing in the Class of the Fund and other funds. To do so, compare this 5% hypothetical example with the 5% hypothetical examples that appear in the shareholder reports of the other funds.
Please note that the expenses shown in the table are meant to highlight your ongoing costs only and do not reflect any transaction costs, such as sales charges (loads) or redemption fees. If these transaction costs were included, your costs would have been higher. Therefore, the second line for each Class in the table is useful in comparing ongoing costs only, and will not help you determine the relative total costs of owning different funds. The examples also assume all dividends and distributions are reinvested.
Schedule of Shareholder Expenses
Expense Analysis of a $1,000 Investment
Nationwide HighMark Bond Fund January 31, 2014 | Beginning Account Value ($) 08/01/13 | Ending Account Value ($) 01/31/14 | Expenses Paid During Period ($) 08/01/13 - 01/31/14 | Expense Ratio During Period (%) 08/01/13 - 01/31/14 | ||||||||
| Class A Shares | Actual | a | 1,000.00 | 1,020.40 | 4.94 | 0.97 | ||||||
| Hypotheticala,b | 1,000.00 | 1,020.32 | 4.94 | 0.97 | ||||||||
| Class C Shares | Actual | a | 1,000.00 | 1,018.40 | 7.07 | 1.39 | ||||||
| Hypotheticala,b | 1,000.00 | 1,018.20 | 7.07 | 1.39 | ||||||||
| Institutional Service Class Sharesc | Actual | a | 1,000.00 | 1,021.30 | 3.67 | 0.72 | ||||||
| Hypotheticala,b | 1,000.00 | 1,021.58 | 3.67 | 0.72 | ||||||||
| Institutional Class Shares | Actual | d | 1,000.00 | 1,024.50 | 2.28 | 0.61 | ||||||
| Hypotheticala,b | 1,000.00 | 1,022.13 | 3.11 | 0.61 | ||||||||
| a | Expenses are equal to the Fund’s annualized expense ratio multiplied by the average account value from August 1, 2013 through January 31, 2014 multiplied to reflect one-half year period. The expense ratio presented represents a six-month, annualized ratio in accordance with Securities and Exchange Commission guidelines. |
| b | Represents the hypothetical 5% return before expenses. |
| c | Effective September 16, 2013, Fiduciary Shares were renamed Institutional Service Class Shares. |
| d | Actual expenses are equal to the Fund’s annualized expense ratio multiplied by the average account value from September 19, 2013 through January 31, 2014 to reflect the period from commencement of operations. |
9
Statement of Investments
January 31, 2014 (Unaudited)
Nationwide HighMark Bond Fund
| Asset-Backed Securities 9.4% | ||||||||||
| Principal Amount | Market Value | |||||||||
| ||||||||||
Automobiles 5.5% |
| |||||||||
ARI Fleet Lease Trust, | $ | 2,501,413 | $ | 2,499,949 | ||||||
Avis Budget Rental Car Funding AESOP LLC, | 3,000,000 | 3,030,183 | ||||||||
Enterprise Fleet Financing LLC, | 2,720,265 | 2,721,807 | ||||||||
Hertz Vehicle Financing LLC, | 3,500,000 | 3,546,169 | ||||||||
Volkswagen Auto Loan Enhanced Trust, | 2,425,000 | 2,446,324 | ||||||||
World Omni Auto Receivables Trust, | 3,603,858 | 3,625,182 | ||||||||
|
| |||||||||
| 17,869,614 | ||||||||||
|
| |||||||||
| ||||||||||
Electric Utilities 1.3% |
| |||||||||
AEP Texas Central Transition Funding LLC, | 4,176,158 | 4,174,541 | ||||||||
|
| |||||||||
| ||||||||||
Other 1.4% |
| |||||||||
CAL Funding Ltd., | 1,750,000 | 1,738,789 | ||||||||
CenterPoint Energy Transition Bond Co. LLC, | 325,106 | 325,106 | ||||||||
Oncor Electric Delivery Transition Bond Co. LLC, | 2,206,762 | 2,340,866 | ||||||||
|
| |||||||||
| 4,404,761 | ||||||||||
|
| |||||||||
| ||||||||||
Student Loan 1.2% |
| |||||||||
SLM Student Loan Trust, | 3,738,629 | 3,762,710 | ||||||||
|
| |||||||||
Total Asset-Backed Securities |
| 30,211,626 | ||||||||
|
| |||||||||
| Bank Loan 0.3% | ||||||||||
| Principal Amount | Market Value | |||||||||
| ||||||||||
Food Products 0.3% |
| |||||||||
HJ Heinz Co., Term Loan, | $ | 995,000 | $ | 1,001,905 | ||||||
|
| |||||||||
Total Bank Loans |
| 1,001,905 | ||||||||
|
| |||||||||
| Collateralized Mortgage Obligations 3.0% | ||||||||||
Banc of America Mortgage Trust, | 1,212,211 | 1,221,870 | ||||||||
Chase Mortgage Finance Trust, | 570,034 | 576,481 | ||||||||
Federal Home Loan Mortgage Corp. REMICS , | 1,003,907 | 1,111,561 | ||||||||
RFMSI Trust, | 778,827 | 786,332 | ||||||||
Sequoia Mortgage Trust | 935,202 | 935,219 | ||||||||
Series 2012-2, Class A2, 3.50%, 04/25/42 (a) | 1,643,877 | 1,641,686 | ||||||||
Series 2013-1, Class 1A1, 1.45%, 02/25/43 (a) | 2,813,364 | 2,674,558 | ||||||||
Wells Fargo Mortgage Backed Securities Trust, | 534,767 | 540,572 | ||||||||
|
| |||||||||
Total Collateralized Mortgage Obligations (cost $9,573,574) |
| 9,488,279 | ||||||||
|
| |||||||||
| Commercial Mortgage Backed Securities 6.5% | ||||||||||
Credit Suisse First Boston Mortgage Securities Corp., | 4,467,475 | 4,591,006 | ||||||||
DBUBS Mortgage Trust, | 3,123,540 | 3,273,732 | ||||||||
JP Morgan Chase Commercial Mortgage Securities Trust, | 4,312,821 | 4,354,605 | ||||||||
JPMBB Commercial Mortgage Securities Trust, | 1,926,683 | 1,930,939 | ||||||||
10
Statement of Investments (Continued)
January 31, 2014 (Unaudited)
Nationwide HighMark Bond Fund (Continued)
| Commercial Mortgage Backed Securities (continued) | ||||||||||
| Principal Amount | Market Value | |||||||||
| ||||||||||
Morgan Stanley Bank of America Merrill Lynch Trust, | $ | 6,676,425 | $ | 6,703,287 | ||||||
|
| |||||||||
Total Commercial Mortgage Backed Securities (cost $19,748,709) |
| 20,853,569 | ||||||||
|
| |||||||||
| Corporate Bonds 59.1% | ||||||||||
Aerospace & Defense 0.5% | ||||||||||
United Technologies Corp., | 1,500,000 | 1,491,705 | ||||||||
|
| |||||||||
| ||||||||||
Airlines 4.6% |
| |||||||||
British Airways PLC, | 3,600,000 | 3,816,000 | ||||||||
Continental Airlines Pass Through Trust | 418,933 | 448,258 | ||||||||
Series 2010-1, Class A, 4.75%, 01/12/21 | 2,581,511 | 2,768,670 | ||||||||
Delta Air Lines Pass Through Trust, | 2,528,572 | 2,781,429 | ||||||||
U.S. Airways Pass Through Trust, | 3,250,000 | 3,250,000 | ||||||||
United Airlines Pass Through Trust, | 1,850,000 | 1,888,166 | ||||||||
|
| |||||||||
| 14,952,523 | ||||||||||
|
| |||||||||
| ||||||||||
Automobiles 1.1% |
| |||||||||
General Motors Co., | 3,500,000 | 3,570,000 | ||||||||
|
| |||||||||
| ||||||||||
Biotechnology 1.3% |
| |||||||||
Warner Chilcott Co. LLC/Warner Chilcott Finance LLC, | 3,750,000 | 4,035,938 | ||||||||
|
| |||||||||
| ||||||||||
Capital Markets 0.3% |
| |||||||||
Lehman Brothers Holdings, Inc., | 4,000,000 | 865,000 | ||||||||
|
| |||||||||
| ||||||||||
Commercial Banks 7.7% |
| |||||||||
Bank of New York Mellon Corp. (The), | 4,250,000 | 4,205,347 | ||||||||
BB&T Corp., | 1,750,000 | 1,794,918 | ||||||||
Branch Banking & Trust Co., | 2,750,000 | 2,777,285 | ||||||||
Capital One Financial Corp. | ||||||||||
1.00%, 11/06/15 | 2,500,000 | 2,502,699 | ||||||||
4.75%, 07/15/21 | 3,500,000 | 3,792,648 | ||||||||
| Corporate Bonds (continued) | ||||||||||
| Principal Amount | Market Value | |||||||||
| ||||||||||
Commercial Banks (continued) |
| |||||||||
Fifth Third Bank, | $ | 3,250,000 | $ | 3,207,284 | ||||||
Wells Fargo & Co. | ||||||||||
5.63%, 12/11/17 | 3,000,000 | 3,445,383 | ||||||||
1.50%, 01/16/18 | 1,000,000 | 997,837 | ||||||||
Westpac Banking Corp., | 2,125,000 | 2,155,308 | ||||||||
|
| |||||||||
| 24,878,709 | ||||||||||
|
| |||||||||
| ||||||||||
Computers & Peripherals 0.9% |
| |||||||||
Hewlett-Packard Co., | 2,750,000 | 2,817,762 | ||||||||
|
| |||||||||
| ||||||||||
Consumer Finance 1.4% |
| |||||||||
Ford Motor Credit Co. LLC, | 3,900,000 | 4,422,852 | ||||||||
|
| |||||||||
| ||||||||||
Containers & Packaging 1.4% |
| |||||||||
Ball Corp. | ||||||||||
6.75%, 09/15/20 | 3,636,000 | 3,945,060 | ||||||||
4.00%, 11/15/23 | 500,000 | 455,000 | ||||||||
|
| |||||||||
| 4,400,060 | ||||||||||
|
| |||||||||
| ||||||||||
Diversified Financial Services 8.0% |
| |||||||||
Bank of America Corp. | ||||||||||
5.65%, 05/01/18 | 3,250,000 | 3,694,720 | ||||||||
1.28%, 01/15/19 (a) | 1,150,000 | 1,157,838 | ||||||||
Citigroup, Inc., | 3,600,000 | 3,542,289 | ||||||||
General Electric Capital Corp., | 4,000,000 | 4,125,969 | ||||||||
JPMorgan Chase & Co. | ||||||||||
4.25%, 10/15/20 | 4,400,000 | 4,690,824 | ||||||||
3.20%, 01/25/23 | 4,500,000 | 4,314,280 | ||||||||
NASDAQ OMX Group, Inc. (The), | 2,750,000 | 3,018,780 | ||||||||
Osprey Aircraft Leasing US-Three LLC, | 1,300,554 | 1,280,208 | ||||||||
|
| |||||||||
| 25,824,908 | ||||||||||
|
| |||||||||
| ||||||||||
Diversified Telecommunication Services 4.1% |
| |||||||||
AT&T, Inc., | 2,700,000 | 2,563,288 | ||||||||
Verizon Communications, Inc., | 950,000 | 1,140,323 | ||||||||
Verizon Maryland LLC, | 2,980,000 | 3,608,985 | ||||||||
Verizon New England, Inc., | 4,925,000 | 5,956,613 | ||||||||
|
| |||||||||
| 13,269,209 | ||||||||||
|
| |||||||||
| ||||||||||
11
Statement of Investments (Continued)
January 31, 2014 (Unaudited)
Nationwide HighMark Bond Fund (Continued)
| Corporate Bonds (continued) | ||||||||||
| Principal Amount | Market Value | |||||||||
| ||||||||||
Electric Utilities 1.9% |
| |||||||||
MidAmerican Energy Holdings Co. | ||||||||||
5.00%, 02/15/14 | $ | 400,000 | $ | 400,558 | ||||||
3.75%, 11/15/23 (b) | 2,600,000 | 2,596,543 | ||||||||
Oklahoma Gas & Electric Co., | 2,500,000 | 3,093,388 | ||||||||
|
| |||||||||
| 6,090,489 | ||||||||||
|
| |||||||||
| ||||||||||
Food & Staples Retailing 3.8% |
| |||||||||
CVS Caremark Corp., | 5,000,000 | 4,686,202 | ||||||||
Kroger Co. (The), | 3,750,000 | 3,703,407 | ||||||||
Walgreen Co., | 4,000,000 | 3,839,806 | ||||||||
|
| |||||||||
| 12,229,415 | ||||||||||
|
| |||||||||
| ||||||||||
Gas Utilities 3.7% |
| |||||||||
Energy Transfer Partners LP, | 2,000,000 | 2,605,419 | ||||||||
Kinder Morgan Energy Partners LP, | 3,750,000 | 3,732,174 | ||||||||
Magellan Midstream Partners LP | ||||||||||
6.55%, 07/15/19 | 3,000,000 | 3,591,738 | ||||||||
4.25%, 02/01/21 | 500,000 | 535,694 | ||||||||
Transcontinental Gas Pipe Line Co. LLC, | 1,200,000 | 1,504,578 | ||||||||
|
| |||||||||
| 11,969,603 | ||||||||||
|
| |||||||||
| ||||||||||
Health Care Providers & Services 1.0% |
| |||||||||
Laboratory Corp. of America Holdings, | 3,000,000 | 3,247,727 | ||||||||
|
| |||||||||
| ||||||||||
Household Products 1.1% |
| |||||||||
Clorox Co. (The), | 3,750,000 | 3,591,435 | ||||||||
|
| |||||||||
| ||||||||||
Information Technology Services 0.6% |
| |||||||||
International Business Machines Corp., | 1,500,000 | 1,909,712 | ||||||||
|
| |||||||||
| ||||||||||
Insurance 2.5% |
| |||||||||
American International Group, Inc., | 2,700,000 | 2,733,045 | ||||||||
Berkshire Hathaway Finance Corp., | 850,000 | 982,379 | ||||||||
Berkshire Hathaway, Inc., | 4,350,000 | 4,197,511 | ||||||||
|
| |||||||||
| 7,912,935 | ||||||||||
|
| |||||||||
| ||||||||||
Media 2.7% |
| |||||||||
Comcast Corp., | 3,500,000 | 4,084,761 | ||||||||
| Corporate Bonds (continued) | ||||||||||
| Principal Amount | Market Value | |||||||||
| ||||||||||
Media (continued) |
| |||||||||
News America, Inc., | $ | 1,000,000 | $ | 1,199,682 | ||||||
TCI Communications, Inc., | 125,000 | 157,273 | ||||||||
Time Warner Entertainment Co. LP, | 2,750,000 | 3,298,200 | ||||||||
|
| |||||||||
| 8,739,916 | ||||||||||
|
| |||||||||
| ||||||||||
Metals & Mining 0.8% |
| |||||||||
Rio Tinto Finance USA Ltd., | 2,250,000 | 2,674,631 | ||||||||
|
| |||||||||
| ||||||||||
Multiline Retail 1.3% |
| |||||||||
Macy’s Retail Holdings, Inc., | 4,000,000 | 4,132,457 | ||||||||
|
| |||||||||
| ||||||||||
Oil, Gas & Consumable Fuels 3.4% |
| |||||||||
Cimarex Energy Co., | 1,700,000 | 1,814,750 | ||||||||
Petrobras International Finance Co., | 4,000,000 | 4,103,896 | ||||||||
Petrohawk Energy Corp., | 4,550,000 | 4,874,188 | ||||||||
|
| |||||||||
| 10,792,834 | ||||||||||
|
| |||||||||
| ||||||||||
Paper & Forest Products 1.8% |
| |||||||||
Georgia-Pacific LLC, | 4,500,000 | 5,953,550 | ||||||||
|
| |||||||||
| ||||||||||
Pharmaceuticals 1.8% |
| |||||||||
Mylan, Inc., | 5,000,000 | 5,643,750 | ||||||||
|
| |||||||||
| ||||||||||
Real Estate Investment Trusts (REITs) 1.4% |
| |||||||||
Boston Properties LP, | 3,200,000 | 3,349,222 | ||||||||
ERP Operating LP, | 1,210,000 | 1,299,720 | ||||||||
|
| |||||||||
| 4,648,942 | ||||||||||
|
| |||||||||
Total Corporate Bonds |
| 190,066,062 | ||||||||
|
| |||||||||
| Municipal Bonds 4.5% | ||||||||||
California 4.5% |
| |||||||||
California State, GO, | 4,000,000 | 4,773,760 | ||||||||
Los Angeles, Department of Water & Power, RB, | 2,900,000 | 3,822,809 | ||||||||
Metropolitan Water District of Southern California, RB, | 5,000,000 | 5,684,050 | ||||||||
|
| |||||||||
Total Municipal Bonds |
| 14,280,619 | ||||||||
|
| |||||||||
12
Statement of Investments (Continued)
January 31, 2014 (Unaudited)
Nationwide HighMark Bond Fund (Continued)
| Sovereign Bond 0.4% | ||||||||||
| Principal Amount | Market Value | |||||||||
| ||||||||||
CANADA 0.4% |
| |||||||||
Province of Saskatchewan Canada, | ||||||||||
9.38%, 12/15/20 | $ | 1,000,000 | $ | 1,363,816 | ||||||
|
| |||||||||
Total Sovereign Bond |
| 1,363,816 | ||||||||
|
| |||||||||
| U.S. Government Mortgage Backed Agencies 9.5% | ||||||||||
Federal Home Loan Mortgage Corp. Gold Pool | 87,805 | 92,092 | ||||||||
Pool# G11401 | 337,690 | 356,875 | ||||||||
Pool# E01252 | 129,904 | 138,078 | ||||||||
Pool# B14038 | 253,370 | 270,630 | ||||||||
Pool# B15759 | 933,548 | 997,146 | ||||||||
Pool# G11678 | 108,912 | 116,331 | ||||||||
Pool# G11769 | 210,294 | 225,200 | ||||||||
Pool# G13201 | 657,551 | 706,457 | ||||||||
Pool# J15482 | 1,904,018 | 2,029,415 | ||||||||
Federal Home Loan Mortgage Corp. Non Gold Pool | 1,460,596 | 1,542,024 | ||||||||
Pool# 848134 | 454,296 | 480,729 | ||||||||
Federal National Mortgage Association Pool | 709 | 710 | ||||||||
Pool# 357119 | 79,432 | 82,752 | ||||||||
Pool# 254003 | 123,532 | 129,522 | ||||||||
Pool# 566881 | 59,967 | 63,013 | ||||||||
Pool# 623489 | 32,024 | 33,493 | ||||||||
Pool# 555170 | 235,328 | 247,374 | ||||||||
Pool# 254546 | 377,056 | 399,216 | ||||||||
Pool# 555872 | 92,704 | 98,086 | ||||||||
Pool# 735521 | 2,079,702 | 2,226,751 | ||||||||
| U.S. Government Mortgage Backed Agencies (continued) | ||||||||||
| Principal Amount | Market Value | |||||||||
| ||||||||||
Federal National Mortgage Association Pool (continued) | ||||||||||
Pool# 292234 | $ | 1,617 | $ | 1,903 | ||||||
Pool# 931892 | 1,478,610 | 1,591,296 | ||||||||
Pool# 293495 | 355 | 418 | ||||||||
Pool# AD6156 | 582,763 | 623,079 | ||||||||
Pool# 303300 | 11,232 | 13,441 | ||||||||
Pool# AE3066 | 3,009,350 | 3,179,684 | ||||||||
Pool# AE0552 | 1,768,137 | 1,908,038 | ||||||||
Pool# AE5487 | 1,336,068 | 1,412,526 | ||||||||
Pool# 342718 | 54,542 | 61,601 | ||||||||
Pool# AJ4093 | 3,741,420 | 3,950,852 | ||||||||
Pool# 250764 | 76,915 | 89,916 | ||||||||
Pool# 251497 | 447 | 497 | ||||||||
Pool# 402854 | 10,740 | 11,878 | ||||||||
Pool# 415652 | 5,564 | 6,264 | ||||||||
Pool# 421427 | 54,780 | 62,157 | ||||||||
Pool# 432037 | 100,515 | 111,592 | ||||||||
Pool# 437979 | 36,186 | 40,197 | ||||||||
Pool# 444861 | 44,338 | 49,374 | ||||||||
Pool# 446099 | 22,678 | 25,109 | ||||||||
Pool# 440738 | 158,607 | 176,242 | ||||||||
Pool# 450653 | 109,691 | 121,694 | ||||||||
Pool# 453865 | 49,569 | 55,195 | ||||||||
Pool# 252212 | 217,249 | 246,301 | ||||||||
Pool# 484939 | 49,515 | 56,268 | ||||||||
Pool# 504076 | 95,262 | 108,038 | ||||||||
Pool# 252570 | 101,975 | 115,387 | ||||||||
13
Statement of Investments (Continued)
January 31, 2014 (Unaudited)
Nationwide HighMark Bond Fund (Continued)
| U.S. Government Mortgage Backed Agencies (continued) | ||||||||||
| Principal Amount | Market Value | |||||||||
| ||||||||||
Federal National Mortgage Association Pool (continued) | ||||||||||
Pool# 506638 | $ | 46,308 | $ | 52,375 | ||||||
Pool# 535300 | 120,379 | 136,156 | ||||||||
Pool# 539932 | 35,511 | 41,326 | ||||||||
Pool# 524343 | 5,331 | 6,444 | ||||||||
Pool# 725027 | 1,828,686 | 2,006,223 | ||||||||
Pool# 725205 | 623,493 | 684,002 | ||||||||
Pool# 829431 | 2,192,979 | 2,328,797 | ||||||||
Government National Mortgage Association I Pool | 631 | 641 | ||||||||
Pool# 348637 | 39,062 | 44,752 | ||||||||
Pool# 354696 | 15,007 | 16,997 | ||||||||
Pool# 369270 | 3,498 | 3,976 | ||||||||
Pool# 368335 | 5,503 | 6,261 | ||||||||
Pool# 359986 | 942 | 1,102 | ||||||||
Pool# 362734 | 526 | 610 | ||||||||
Pool# 368677 | 18,728 | 21,814 | ||||||||
Pool# 371909 | 40,138 | 45,519 | ||||||||
Pool# 392055 | 11,884 | 13,489 | ||||||||
Pool# 442138 | 86,107 | 102,749 | ||||||||
Pool# 439463 | 34,203 | 40,024 | ||||||||
Pool# 399109 | 14,157 | 16,783 | ||||||||
Pool# 435777 | 4,082 | 4,839 | ||||||||
Pool# 445661 | 10,774 | 12,792 | ||||||||
Pool# 443887 | 7,019 | 8,346 | ||||||||
Pool# 450591 | 1,029 | 1,223 | ||||||||
Pool# 453295 | 570 | 676 | ||||||||
| U.S. Government Mortgage Backed Agencies (continued) | ||||||||||
| Principal Amount | Market Value | |||||||||
| ||||||||||
Government National Mortgage Association I Pool (continued) | ||||||||||
Pool# 455381 | $ | 7,436 | $ | 8,807 | ||||||
Pool# 446699 | 56,445 | 64,456 | ||||||||
Pool# 460906 | 45,852 | 52,243 | ||||||||
Pool# 482748 | 122,511 | 139,910 | ||||||||
Pool# 476969 | 136,038 | 155,858 | ||||||||
Pool# 781029 | 248,322 | 286,134 | ||||||||
Pool# 503106 | 17,068 | 19,679 | ||||||||
|
| |||||||||
Total U.S. Government Mortgage Backed Agencies |
| $ | 30,579,844 | |||||||
|
| |||||||||
| U.S. Treasury Notes 5.1% | ||||||||||
U.S. Treasury Notes |
| |||||||||
1.00%, 05/31/18 | 5,000,000 | 4,940,625 | ||||||||
2.00%, 02/15/23 | 10,000,000 | 9,534,375 | ||||||||
2.75%, 11/15/23 | 2,000,000 | 2,014,375 | ||||||||
|
| |||||||||
Total U.S. Treasury Notes |
| 16,489,375 | ||||||||
|
| |||||||||
| Yankee Dollar 0.5% | ||||||||||
Electric Utilities 0.5% |
| |||||||||
Hydro Quebec, | 1,125,000 | 1,531,424 | ||||||||
|
| |||||||||
Total Yankee Dollar |
| 1,531,424 | ||||||||
|
| |||||||||
| Mutual Fund 1.6% | ||||||||||
| Shares | Market Value | |||||||||
| ||||||||||
Money Market Fund 1.6% |
| |||||||||
Fidelity Institutional Money Market Fund — Institutional Class, 0.08% (c) | 5,190,171 | 5,190,171 | ||||||||
|
| |||||||||
Total Mutual Fund |
| 5,190,171 | ||||||||
|
| |||||||||
Total Investments |
| 321,056,690 | ||||||||
Other assets in excess of liabilities — 0.1% |
| 307,226 | ||||||||
|
| |||||||||
NET ASSETS — 100.0% |
| $ | 321,363,916 | |||||||
|
| |||||||||
14
Statement of Investments (Continued)
January 31, 2014 (Unaudited)
Nationwide HighMark Bond Fund (Continued)
| (a) | Variable Rate Security. The rate reflected in the Statement of Investments is the rate in effect on January 31, 2014. The maturity date represents the actual maturity date. |
| (b) | Rule 144A, Section 4(2), or other security which is restricted as to sale to institutional investors. These securities were deemed liquid pursuant to procedures approved by the Board of Trustees. The aggregate value of these securities at January 31, 2014 was $32,436,922 which represents 10.09% of net assets. |
| (c) | Represents 7-day effective yield as of January 31, 2014. |
| (d) | See notes to financial statements for tax cost and unrealized appreciation/(depreciation) of securities. |
| GO | General Obligation |
| LLC | Limited Liability Company |
| LP | Limited Partnership |
| Ltd. | Limited |
| PLC | Public Limited Company |
| RB | Revenue Bond |
| REIT | Real Estate Investment Trust |
| REMICS | Real Estate Mortgage Investment Conduits |
The accompanying notes are an integral part of these financial statements.
15
Statement of Assets and Liabilities
January 31, 2014 (Unaudited)
| Nationwide HighMark Bond Fund | ||||||
Assets: | ||||||
Investments, at value (cost $311,855,679) | $ | 321,056,690 | ||||
Interest and dividends receivable | 2,528,872 | |||||
Receivable for investments sold | 34,654 | |||||
Receivable for capital shares issued | 662,322 | |||||
Prepaid expenses | 20,524 | |||||
|
| |||||
Total Assets | 324,303,062 | |||||
|
| |||||
Liabilities: | ||||||
Payable for investments purchased | 2,113,828 | |||||
Distributions payable | 307,304 | |||||
Payable for capital shares redeemed | 222,142 | |||||
Accrued expenses and other payables: | ||||||
Investment advisory fees | 140,382 | |||||
Fund administration fees | 18,210 | |||||
Distribution fees | 11,258 | |||||
Administrative servicing fees | 49,412 | |||||
Accounting and transfer agent fees | 11,376 | |||||
Trustee fees | 5,477 | |||||
Deferred compensation (Note 2) | 26,333 | |||||
Custodian fees | 1,931 | |||||
Compliance program costs (Note 3) | 1,610 | |||||
Professional fees | 21,270 | |||||
Printing fees | 8,293 | |||||
Other | 320 | |||||
|
| |||||
Total Liabilities | 2,939,146 | |||||
|
| |||||
Net Assets | $ | 321,363,916 | ||||
|
| |||||
Represented by: | ||||||
Capital | $ | 312,055,648 | ||||
Accumulated distributions in excess of net investment income | (43,589 | ) | ||||
Accumulated net realized gains from investment transactions | 150,846 | |||||
Net unrealized appreciation/(depreciation) from investments | 9,201,011 | |||||
|
| |||||
Net Assets | $ | 321,363,916 | ||||
|
| |||||
Net Assets: | ||||||
Class A Shares | $ | 22,230,949 | ||||
Class C Shares | 9,686,173 | |||||
Institutional Service Class Shares | 289,436,548 | |||||
Institutional Class Shares | 10,246 | |||||
|
| |||||
Total | $ | 321,363,916 | ||||
|
| |||||
Shares Outstanding (unlimited number of shares authorized): | ||||||
Class A Shares | 2,067,831 | |||||
Class C Shares | 906,116 | |||||
Institutional Service Class Shares | 26,427,443 | |||||
Institutional Class Shares | 936 | |||||
|
| |||||
Total | 29,402,326 | |||||
|
| |||||
16
Statement of Assets and Liabilities (Continued)
January 31, 2014 (Unaudited)
| Nationwide HighMark Bond Fund | ||||||
Net asset value and redemption price per share (Net assets by class divided by shares outstanding by class, respectively): | ||||||
Class A Shares (a) | $ | 10.75 | ||||
Class C Shares (b) | $ | 10.69 | ||||
Institutional Service Class Shares | $ | 10.95 | ||||
Institutional Class Shares | $ | 10.95 | ||||
Maximum offering price per share (100%/(100%-maximum sales charge) of net asset value adjusted to the nearest cent): | ||||||
Class A Shares | $ | 11.00 | ||||
|
| |||||
Maximum Sales Charge: | ||||||
Class A Shares | 2.25 | % | ||||
|
| |||||
| (a) | For Class A Shares, the redemption price per share is reduced by 0.75% on sales of shares of original purchases of $500,000 or more or that were not subject to a front-end sales charge made within 18 months of the purchase date. |
| (b) | For Class C Shares, the redemption price per share is reduced by 1.00% for shares held less than one year. |
The accompanying notes are an integral part of these financial statements.
17
Statement of Operations
For the Six Months Ended January 31, 2014 (Unaudited)
| Nationwide HighMark Bond Fund | ||||||
INVESTMENT INCOME: | ||||||
Interest income | $ | 5,930,336 | ||||
Dividend income | 1,401 | |||||
|
| |||||
Total Income | 5,931,737 | |||||
|
| |||||
EXPENSES: | ||||||
Investment advisory fees | 830,179 | |||||
Fund administration fees | 144,114 | |||||
Distribution fees Class A | 30,648 | |||||
Distribution fees Class B (a) | 74 | |||||
Distribution fees Class C | 45,485 | |||||
Administrative servicing fees Class A | 17,122 | |||||
Administrative servicing fees Class B (a) | 25 | |||||
Administrative servicing fees Institutional Service Class (b) | 207,412 | |||||
Registration and filing fees | 28,657 | |||||
Professional fees | 29,078 | |||||
Printing fees | 16,820 | |||||
Trustee fees | 6,726 | |||||
Custodian fees | 7,162 | |||||
Accounting and transfer agent fees | 20,833 | |||||
Compliance program costs (Note 3) | 1,991 | |||||
Other | 24,021 | |||||
|
| |||||
Total expenses before earnings credit, fees waived, and expenses reimbursed | 1,410,347 | |||||
|
| |||||
Earnings credit (Note 4) | (224 | ) | ||||
Administrative servicing fees voluntarily waived – Class A (Note 3) | (5,835 | ) | ||||
Administrative servicing fees voluntarily waived – Institutional Service Class (b) (Note 3) | (69,913 | ) | ||||
Expenses reimbursed by adviser (Note 3) | (57,249 | ) | ||||
|
| |||||
Net Expenses | 1,277,126 | |||||
|
| |||||
NET INVESTMENT INCOME | 4,654,611 | |||||
|
| |||||
REALIZED/UNREALIZED GAINS (LOSSES) FROM INVESTMENTS: | ||||||
Net realized gains from investment transactions | 272,016 | |||||
Net change in unrealized appreciation/(depreciation) from investments | 1,703,587 | |||||
|
| |||||
Net realized/unrealized gains from investments | 1,975,603 | |||||
|
| |||||
CHANGE IN NET ASSETS RESULTING FROM OPERATIONS | $ | 6,630,214 | ||||
|
| |||||
| (a) | Effective September 16, 2013, Class B Shares were converted into Class A Shares. |
| (b) | Effective September 16, 2013, Fiduciary Shares were renamed Institutional Service Class Shares. |
The accompanying notes are an integral part of these financial statements.
18
Statements of Changes in Net Assets
| Nationwide HighMark Bond Fund | ||||||||||||
| Six Months Ended January 31, 2014 (Unaudited) | Year Ended July 31, 2013 | |||||||||||
Operations: | ||||||||||||
Net investment income | $ | 4,654,611 | $ | 9,849,670 | ||||||||
Net realized gains from investment transactions | 272,016 | 9,617,231 | ||||||||||
Net change in unrealized appreciation/(depreciation) from investments | 1,703,587 | (20,179,034 | ) | |||||||||
|
|
|
| |||||||||
Change in net assets resulting from operations | 6,630,214 | (712,133 | ) | |||||||||
|
|
|
| |||||||||
Distributions to Shareholders From: | ||||||||||||
Net investment income: | ||||||||||||
Class A | (333,764 | ) | (970,780 | ) | ||||||||
Class B (a) | (125 | ) | (2,623 | ) | ||||||||
Class C | (139,721 | ) | (388,979 | ) | ||||||||
Institutional Service Class (b) | (4,332,031 | ) | (9,320,669 | ) | ||||||||
Institutional Class | (116 | )(c) | – | |||||||||
Net realized gains: | ||||||||||||
Class A | (556,524 | ) | (510,196 | ) | ||||||||
Class B (a) | – | (1,648 | ) | |||||||||
Class C | (253,730 | ) | (237,798 | ) | ||||||||
Institutional Service Class (b) | (6,797,971 | ) | (4,233,165 | ) | ||||||||
Institutional Class | (235 | )(c) | – | |||||||||
|
|
|
| |||||||||
Change in net assets from shareholder distributions | (12,414,217 | ) | (15,665,858 | ) | ||||||||
|
|
|
| |||||||||
Change in net assets from capital transactions | (24,457,098 | ) | (18,007,338 | ) | ||||||||
|
|
|
| |||||||||
Change in net assets | (30,241,101 | ) | (34,385,329 | ) | ||||||||
|
|
|
| |||||||||
Net Assets: | ||||||||||||
Beginning of period | 351,605,017 | 385,990,346 | ||||||||||
|
|
|
| |||||||||
End of period | $ | 321,363,916 | $ | 351,605,017 | ||||||||
|
|
|
| |||||||||
Accumulated undistributed (distributions in excess of) net investment income at end of period | $ | (43,589 | ) | $ | 107,557 | |||||||
|
|
|
| |||||||||
CAPITAL TRANSACTIONS: | ||||||||||||
Class A Shares | ||||||||||||
Proceeds from shares issued | $ | 560,953 | $ | 5,284,159 | ||||||||
Dividends reinvested | 719,600 | 1,175,363 | ||||||||||
Cost of shares redeemed | (5,151,596 | ) | (23,227,122 | ) | ||||||||
|
|
|
| |||||||||
Total Class A Shares | (3,871,043 | ) | (16,767,600 | ) | ||||||||
|
|
|
| |||||||||
Class B Shares (a) | ||||||||||||
Proceeds from shares issued | 3 | 4,083 | ||||||||||
Dividends reinvested | 93 | 3,700 | ||||||||||
Cost of shares redeemed | (78,241 | ) | (141,856 | ) | ||||||||
|
|
|
| |||||||||
Total Class B Shares | (78,145 | ) | (134,073 | ) | ||||||||
|
|
|
| |||||||||
Class C Shares | ||||||||||||
Proceeds from shares issued | $ | 128,919 | $ | 6,097,969 | ||||||||
Dividends reinvested | 260,679 | 385,574 | ||||||||||
Cost of shares redeemed | (5,607,596 | ) | (6,245,598 | ) | ||||||||
|
|
|
| |||||||||
Total Class C Shares | (5,217,998 | ) | 237,945 | |||||||||
|
|
|
| |||||||||
| (a) | Effective September 16, 2013, Class B Shares were converted into Class A Shares. |
| (b) | Effective September 16, 2013, Fiduciary Shares were renamed Institutional Service Class Shares. |
| (c) | For the period from September 19, 2013 (commencement of operations) through January 31, 2014. |
19
Statements of Changes in Net Assets (Continued)
| Nationwide HighMark Bond Fund | ||||||||||||
| Six Months Ended January 31, 2014 (Unaudited) | Year Ended July 31, 2013 | |||||||||||
CAPITAL TRANSACTIONS: (continued) | ||||||||||||
Institutional Service Class Shares (b) | ||||||||||||
Proceeds from shares issued | $ | 19,707,825 | $ | 77,556,706 | ||||||||
Dividends reinvested | 8,685,778 | 9,435,633 | ||||||||||
Cost of shares redeemed | (43,693,866 | ) | (88,335,949 | ) | ||||||||
|
|
|
| |||||||||
Total Institutional Service Class Shares | (15,300,263 | ) | (1,343,610 | ) | ||||||||
|
|
|
| |||||||||
Institutional Class Shares | ||||||||||||
Proceeds from shares issued | 10,000 | (c) | – | |||||||||
Dividends reinvested | 351 | (c) | – | |||||||||
Cost of shares redeemed | – | (c) | – | |||||||||
|
|
|
| |||||||||
Total Institutional Class Shares | 10,351 | (c) | – | |||||||||
|
|
|
| |||||||||
Change in net assets from capital transactions | $ | (24,457,098 | ) | $ | (18,007,338 | ) | ||||||
|
|
|
| |||||||||
SHARE TRANSACTIONS: | ||||||||||||
Class A Shares | ||||||||||||
Issued | 51,584 | 465,233 | ||||||||||
Reinvested | 67,159 | 103,825 | ||||||||||
Redeemed | (475,545 | ) | (2,053,587 | ) | ||||||||
|
|
|
| |||||||||
Total Class A Shares | (356,802 | ) | (1,484,529 | ) | ||||||||
|
|
|
| |||||||||
Class B Shares (a) | ||||||||||||
Issued | – | 356 | ||||||||||
Reinvested | 9 | 328 | ||||||||||
Redeemed | (7,277 | ) | (12,533 | ) | ||||||||
|
|
|
| |||||||||
Total Class B Shares | (7,268 | ) | (11,849 | ) | ||||||||
|
|
|
| |||||||||
Class C Shares | ||||||||||||
Issued | 12,023 | 539,509 | ||||||||||
Reinvested | 24,467 | 34,278 | ||||||||||
Redeemed | (519,517 | ) | (560,950 | ) | ||||||||
|
|
|
| |||||||||
Total Class C Shares | (483,027 | ) | 12,837 | |||||||||
|
|
|
| |||||||||
Institutional Service Class Shares (b) | ||||||||||||
Issued | 1,783,584 | 6,723,082 | ||||||||||
Reinvested | 796,572 | 819,418 | ||||||||||
Redeemed | (3,973,676 | ) | (7,721,823 | ) | ||||||||
|
|
|
| |||||||||
Total Institutional Service Class Shares | (1,393,520 | ) | (179,323 | ) | ||||||||
|
|
|
| |||||||||
Institutional Class Shares | ||||||||||||
Issued | 903 | (c) | – | |||||||||
Reinvested | 33 | (c) | – | |||||||||
Redeemed | – | (c) | – | |||||||||
|
|
|
| |||||||||
Total Institutional Class Shares | 936 | (c) | – | |||||||||
|
|
|
| |||||||||
Total change in shares | (2,239,681 | ) | (1,662,864 | ) | ||||||||
|
|
|
| |||||||||
Amounts designated as “–“are zero or have been rounded to zero.
| (a) | Effective September 16, 2013, Class B Shares were converted into Class A Shares. |
| (b) | Effective September 16, 2013, Fiduciary Shares were renamed Institutional Service Class Shares. |
| (c) | For the period from September 19, 2013 (commencement of operations) through January 31, 2014. |
The accompanying notes are an integral part of these financial statements.
20
Financial Highlights
Selected data for each share of capital outstanding throughout the periods indicated
Nationwide HighMark Bond Fund
| Operations | Distributions | Ratios/Supplemental Data | ||||||||||||||||||||||||||||||||||||||||||||||||||||||
| Net Asset Value, Beginning of Period | Net Investment Income | Net Realized and Unrealized Gains (Losses) from Investments | Total from Operations | Net Investment Income | Net Realized Gains | Total Distributions | Net Asset Value, End of Period | Total Return (a)(b) | Net Assets at End of Period | Ratio of Expenses to Average Net Assets (c) | Ratio of Net Investment Income to Average Net Assets (c) | Ratio of Expenses (Prior to Reimbursements) to Average Net Assets (c)(d) | Portfolio Turnover (e) | |||||||||||||||||||||||||||||||||||||||||||
| Class A Shares | ||||||||||||||||||||||||||||||||||||||||||||||||||||||||
Six Months Ended January 31, 2014 (f) (Unaudited) | $ | 10.94 | 0.14 | 0.08 | 0.22 | (0.15 | ) | (0.26 | ) | (0.41 | ) | $ | 10.75 | 2.04 | % | $ | 22,230,949 | 0.97% | 2.61% | 1.06% | 19.68% | |||||||||||||||||||||||||||||||||||
Year Ended July 31, 2013 (f) | $ | 11.42 | 0.27 | (0.31 | ) | (0.04 | ) | (0.29 | ) | (0.15 | ) | (0.44 | ) | $ | 10.94 | (0.41 | %) | $ | 26,524,432 | 0.97% | 2.35% | 1.24% | 53.00% | |||||||||||||||||||||||||||||||||
Year Ended July 31, 2012 (f) | $ | 11.28 | 0.34 | 0.40 | 0.74 | (0.36 | ) | (0.24 | ) | (0.60 | ) | $ | 11.42 | 6.87 | % | $ | 44,658,869 | 0.99% | 3.05% | 1.25% | 44.00% | |||||||||||||||||||||||||||||||||||
Year Ended July 31, 2011 (f) | $ | 11.21 | 0.38 | 0.18 | 0.56 | (0.40 | ) | (0.09 | ) | (0.49 | ) | $ | 11.28 | 5.09 | % | $ | 29,448,806 | 1.04% | 3.45% | 1.26% | 58.00% | |||||||||||||||||||||||||||||||||||
Year Ended July 31, 2010 (f) | $ | 10.61 | 0.43 | 0.62 | 1.05 | (0.45 | ) | – | (0.45 | ) | $ | 11.21 | 10.08 | % | $ | 28,951,830 | 1.03% | 3.97% | 1.25% | 32.00% | ||||||||||||||||||||||||||||||||||||
Year Ended July 31, 2009 (f) | $ | 10.31 | 0.44 | 0.31 | 0.75 | (0.45 | ) | – | (0.45 | ) | $ | 10.61 | 7.58 | % | $ | 22,725,897 | 1.02% | 4.32% | 1.24% | 41.00% | ||||||||||||||||||||||||||||||||||||
| Class C Shares | ||||||||||||||||||||||||||||||||||||||||||||||||||||||||
Six Months Ended January 31, 2014 (f) (Unaudited) | $ | 10.88 | 0.12 | 0.08 | 0.20 | (0.13 | ) | (0.26 | ) | (0.39 | ) | $ | 10.69 | 1.84 | % | $ | 9,686,173 | 1.39% | 2.18% | 1.43% | 19.68% | |||||||||||||||||||||||||||||||||||
Year Ended July 31, 2013 (f) | $ | 11.36 | 0.21 | (0.30 | ) | (0.09 | ) | (0.24 | ) | (0.15 | ) | (0.39 | ) | $ | 10.88 | (0.84 | %) | $ | 15,111,946 | 1.40% | 1.92% | 1.49% | 53.00% | |||||||||||||||||||||||||||||||||
Year Ended July 31, 2012 (f) | $ | 11.22 | 0.29 | 0.40 | 0.69 | (0.31 | ) | (0.24 | ) | (0.55 | ) | $ | 11.36 | 6.36 | % | $ | 15,638,520 | 1.42% | 2.62% | 1.50% | 44.00% | |||||||||||||||||||||||||||||||||||
Year Ended July 31, 2011 (f) | $ | 11.15 | 0.33 | 0.18 | 0.51 | (0.35 | ) | (0.09 | ) | (0.44 | ) | $ | 11.22 | 4.77 | % | $ | 7,773,796 | 1.47% | 3.02% | 1.51% | 58.00% | |||||||||||||||||||||||||||||||||||
Year Ended July 31, 2010 (f) | $ | 10.56 | 0.38 | 0.61 | 0.99 | (0.40 | ) | – | (0.40 | ) | $ | 11.15 | 9.58 | % | $ | 4,164,326 | 1.46% | 3.54% | 1.50% | 32.00% | ||||||||||||||||||||||||||||||||||||
Year Ended July 31, 2009 (f) | $ | 10.25 | 0.40 | 0.32 | 0.72 | (0.41 | ) | – | (0.41 | ) | $ | 10.56 | 7.29 | % | $ | 1,309,168 | 1.45% | 3.89% | 1.49% | 41.00% | ||||||||||||||||||||||||||||||||||||
| Institutional Service Class Shares (g) | ||||||||||||||||||||||||||||||||||||||||||||||||||||||||
Six Months Ended January 31, 2014 (f) (Unaudited) | $ | 11.14 | 0.16 | 0.07 | 0.23 | (0.16 | ) | (0.26 | ) | (0.42 | ) | $ | 10.95 | 2.13 | % | $ | 289,436,548 | 0.72% | 2.82% | 0.80% | 19.68% | |||||||||||||||||||||||||||||||||||
Year Ended July 31, 2013 (f) | $ | 11.62 | 0.30 | (0.31 | ) | (0.01 | ) | (0.32 | ) | (0.15 | ) | (0.47 | ) | $ | 11.14 | (0.15 | %) | $ | 309,889,434 | 0.72% | 2.60% | 0.99% | 53.00% | |||||||||||||||||||||||||||||||||
Year Ended July 31, 2012 (f) | $ | 11.46 | 0.38 | 0.41 | 0.79 | (0.39 | ) | (0.24 | ) | (0.63 | ) | $ | 11.62 | 7.11 | % | $ | 325,475,420 | 0.74% | 3.30% | 1.00% | 44.00% | |||||||||||||||||||||||||||||||||||
Year Ended July 31, 2011 (f) | $ | 11.38 | 0.42 | 0.18 | 0.60 | (0.43 | ) | (0.09 | ) | (0.52 | ) | $ | 11.46 | 5.45 | % | $ | 337,142,952 | 0.79% | 3.70% | 1.01% | 58.00% | |||||||||||||||||||||||||||||||||||
Year Ended July 31, 2010 (f) | $ | 10.77 | 0.47 | 0.62 | 1.09 | (0.48 | ) | – | (0.48 | ) | $ | 11.38 | 10.29 | % | $ | 330,317,720 | 0.78% | 4.23% | 1.00% | 32.00% | ||||||||||||||||||||||||||||||||||||
Year Ended July 31, 2009 (f) | $ | 10.45 | 0.47 | 0.33 | 0.80 | (0.48 | ) | – | (0.48 | ) | $ | 10.77 | 7.93 | % | $ | 307,013,876 | 0.77% | 4.57% | 0.99% | 41.00% | ||||||||||||||||||||||||||||||||||||
| Institutional Class Shares | ||||||||||||||||||||||||||||||||||||||||||||||||||||||||
Period Ended January 31, 2014 (f)(h) (Unaudited) | $ | 11.07 | 0.13 | 0.14 | 0.27 | (0.13 | ) | (0.26 | ) | (0.39 | ) | $ | 10.95 | 2.45 | % | $ | 10,246 | 0.61% | 3.09% | 0.61% | 19.68% | |||||||||||||||||||||||||||||||||||
Amounts designated as “–” are zero or have been rounded to zero.
| (a) | Excludes sales charge. |
| (b) | Not annualized for periods less than one year. |
| (c) | Annualized for periods less than one year. |
| (d) | During the period, certain fees may have been waived and/or reimbursed. If such waivers/reimbursements had not occurred, the ratios would have been as indicated. |
| (e) | Portfolio turnover is calculated on the basis of the Fund as a whole without distinguishing among the classes of shares. |
| (f) | Per share calculations were performed using average shares method. |
| (g) | Effective September 16, 2013, Fiduciary Shares were renamed Institutional Service Class Shares. |
| (h) | For the period from September 19, 2013 (commencement of operations) through January 31, 2014. Total return is calculated based on inception date of September 18, 2013 through January 31, 2014. |
The accompanying notes are an integral part of these financial statements.
21
| Fund Commentary | Nationwide HighMark California Intermediate Tax Free Bond Fund |
For the semiannual period ended January 31, 2014, the Nationwide HighMark California Intermediate Tax Free Bond Fund (Institutional Service Class) returned 2.88%* versus 2.61% for its benchmark, the Barclays 7-Year Municipal Bond Index. For broader comparison, the median return for the Fund’s closest Lipper peer category of California Intermediate Municipal Debt Funds (consisting of 40 funds as of January 31, 2014) was 2.74% for the same time period.
| * | Performance prior to the Fund’s inception on September 16, 2013, is based on the performance of the Fund’s predecessor fund. |
Market Environment
Throughout the reporting period, the market continued to brace for the eventual tapering (gradual reduction) of the Federal Reserve’s accommodative monetary policy known as qualitative easing (QE). The effect of this sentiment was to cause a steepening of the municipal bond yield curve (a plotted graph line of the yields, or interest rates, on long-term and short-term maturity bonds). While long yields rose approximately 9 basis points, shorter yields fell 7 basis points during the reporting period as investors shortened their portfolio duration in an effort to be more defensive.
As the yield curve steepened, investors continued to experience losses during the reporting period. This resulted in additional mutual fund redemptions, forcing fund managers to sell bonds to raise cash, which caused additional losses and then additional redemptions.
Credit spreads stabilized following a considerable widening, as the City of Detroit’s bankruptcy and a panic over Puerto Rico’s financial situation shook the market for much of 2013.
Puerto Rico was a consistent underperformer throughout the reporting period as news of budget deficits, a slowing economy and the island’s massive debt load spooked investors. These factors caused both mutual fund portfolio managers and individual investors to dump their Puerto Rican exposure, pushing yields to more than 10% for the reporting period.
The Fund’s lack of exposure to investments in Puerto Rico, shorter-than-benchmark duration
and high average coupon positioning supported Fund performance for the reporting period.
Portfolio Performance
The Fund’s positioning on the yield curve during the reporting period, laddered with an average duration shorter than its benchmark index provided protection in a rising-interest-rate environment, coupled with a steepening yield curve. The Fund’s premium coupon position also provided protection in this environment, as the position served to lower the Fund’s duration for a given maturity.
The Fund’s high credit quality provided outperformance during the reporting period as bonds rated AAA and AA outperformed lower-quality securities, especially those rated BBB and lower. In addition, the Fund’s lack of exposure to Puerto Rico, which was the worst performer of all the U.S. states and territories, registering -13.83% for the reporting period per the Fund’s benchmark index, provided strong relative performance for the Fund.
Outlook and Positioning
While it’s likely that rising yields and a steepening yield curve will hurt the Fund on an absolute basis during the next 12 months, the Fund’s current positioning may provide positive relative performance versus the benchmark index and Lipper peer category.
The Fund did not hold any derivatives at period end.
Subadviser:
HighMark Capital Management, Inc.
Portfolio Managers:
Robert Bigelow, Raymond Mow and David Wines
The Fund is subject to the risks of investing in fixed-income securities. By concentrating its investments in bonds issued in California, the Fund’s credit risk is dependent on the ability of the state and its cities and municipalities to make timely payments on their obligations. The Fund may invest in more-aggressive investments such as derivatives (many of which create investment leverage and are highly volatile). The Fund may invest in municipal securities that generate interest that is subject to alternative minimum tax (“AMT”). As a result, taxpayers who are subject to the AMT potentially could earn a lower after-tax return. Please refer to the summary prospectus for a more detailed explanation of the Fund’s principal risks.
A description of the benchmarks can be found on the Market Index Definitions page at the back of this book.
22
| Fund Overview (Unaudited) | Nationwide HighMark California Intermediate Tax Free Bond Fund |
Objective
The Fund seeks to provide high current income that is exempt from federal income tax and California personal income tax.
Highlights
| Ÿ | For the semiannual period ended January 31, 2014, the Nationwide HighMark California Intermediate Tax Free Bond Fund (Institutional Service Class) returned 2.88%, outperforming the benchmark by 0.27% and the Lipper peer category by 0.14%. |
| Ÿ | The Fund’s lack of exposure to investments in Puerto Rico, shorter-than-benchmark duration and high average coupon positioning supported Fund performance for the reporting period. |
Asset Allocation†
| Municipal Bonds | 98.2% | |||
| Other assets in excess of liabilities | 1.8% | |||
| 100.0% |
Top Holdings††
| California State, Economic Recovery, Refunding, GO, 5.25%, 07/01/21 | 2.4% | |||
| San Diego, Public Facilities Financing Authority, Sewer Revenue, Refunding, RB, 5.50%, 05/15/23 | 2.1% | |||
| California State, Department of Water Resources, Central Valley Project, Refunding, RB, 5.00%, 12/01/22 | 1.8% | |||
| Southern California, Public Power Authority, Power Project Revenue, Canyon Power, Refunding, RB, 5.00%, 07/01/25 | 1.7% | |||
| Los Angeles, Refunding, GO, 5.00%, 09/01/23 | 1.5% | |||
| Orange County, Sanitation District, COP, AGM Insured, 5.00%, 02/01/23 | 1.5% | |||
| Los Angeles, Water & Power Department Revenue, Power System, Refunding, RB, 5.00%, 07/01/22 | 1.4% | |||
| Peralta, Community College District, Refunding, GO, 5.00%, 08/01/20 | 1.3% | |||
| University of California, Limited Project Revenue, Refunding, RB, 5.00%, 05/15/24 | 1.3% | |||
| San Francisco City & County, Airport Commission, International Airport Revenue, Second Series, Issue 32F, Refunding, RB, National-RE FGIC Insured, 5.25%, 05/01/19 | 1.3% | |||
| Other Holdings | 83.7% | |||
| 100.0% |
| † | Percentages indicated are based upon net assets as of January 31, 2014. |
| †† | Percentages indicated are based upon total investments as of January 31, 2014. |
23
| Fund Performance | Nationwide HighMark California Intermediate Tax Free Bond Fund |
Average Annual Total Return
(For periods ended January 31, 2014)
| Six Months* | 1 Yr. | 5 Yr. | 10 Yr. | |||||||||||||||
| Class A | w/o SC1 | 2.87% | 0.36% | 3.27% | 3.15% | |||||||||||||
| w/ SC2 | 0.60% | (1.87)% | 2.80% | 2.92% | ||||||||||||||
| Class C | w/o SC1 | 2.55% | (0.18)% | 2.81% | 2.67% | |||||||||||||
| w/ SC3 | 1.55% | (1.18)% | 2.81% | 2.67% | ||||||||||||||
| Institutional Service Class4,5 | w/o SC | 2.88% | 0.51% | 3.51% | 3.40% | |||||||||||||
| Institutional Class4 | w/o SC | 2.44% | 6 | — | — | — | ||||||||||||
All figures showing the effect of a sales charge (SC) reflect the maximum charge possible, because it has the most significant effect on performance data.
| * | Not annualized. |
| 1 | These returns do not reflect the effects of SCs. |
| 2 | A 2.25% front-end sales charge was deducted. |
| 3 | A 1.00% CDSC was deducted from the one year return because it is charged when you sell Class C shares within the first year after purchase. |
| 4 | Not subject to any SCs. |
| 5 | Effective September 16, 2013 Fiduciary Shares were renamed Institutional Service Class Shares. |
| 6 | Since inception date of September 18, 2013. Not Annualized. |
Expense Ratios
| Gross Expense Ratio* | Net Expense Ratio* | |||||||
| Class A | 1.15% | 0.79% | ||||||
| Class C | 1.40% | 1.24% | ||||||
| Institutional Service Class | 0.90% | 0.54% | ||||||
| Institutional Class | 0.65% | 0.49% | ||||||
| * | Current effective prospectus dated September 16, 2013. The difference between gross and net operating expenses reflects contractual waivers in place through November 30, 2015. Please see the Fund's most recent prospectus for details. |
24
| Fund Performance | Nationwide HighMark California Intermediate Tax Free Bond Fund |
Performance of a $10,000 Investment
Investment return and principal value will fluctuate, and when redeemed, shares may be worth more or less than original cost. Past performance is no guarantee of future results and does not reflect the deduction of taxes that a shareholder would pay on fund distributions or the redemption of fund shares. Investing in mutual funds involves market risk, including loss of principal. Performance returns assume the reinvestment of all distributions.
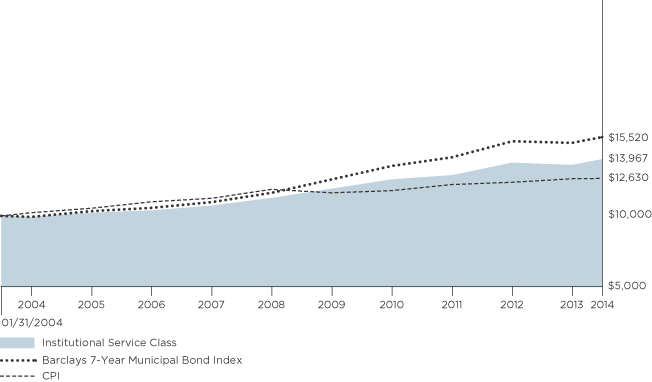
Comparative performance of $10,000 invested in Institutional Service Class shares of the Nationwide HighMark California Intermediate Tax Free Bond Fund versus the Barclays 7-Year Municipal Bond Index and the Consumer Price Index (CPI) over the 10-year period ended 1/31/14. Fund performance prior to the Fund’s inception on 9/16/13 is based on the Fund’s predecessor Fund. Unlike the Fund, the performance for these unmanaged indexes does not reflect any fees, expenses, or sales charges. One cannot invest directly in a market index. A description of the benchmarks can be found on the Market Index Definitions page at the back of this book.
25
| Shareholder Expense Example | Nationwide HighMark California Intermediate Tax Free Bond Fund |
As a shareholder of the Fund, you incur two types of costs: (1) transaction costs, including sales charges (loads) paid on purchase payments and redemption fees; and (2) ongoing costs, including investment advisory fees, administration fees, distribution fees and other Fund expenses. The examples below are intended to help you understand your ongoing costs (in dollars) of investing in the Fund and to compare these costs with the ongoing costs of investing in other mutual funds. Per Securities and Exchange Commission (“SEC”) requirements, the examples assume that you had a $1,000 investment in the Class at the beginning of the reporting period (August 1, 2013) and continued to hold your shares at the end of the reporting period (January 31, 2014).
Actual Expenses
For each Class of the Fund in the table below, the first line provides information about actual account values and actual expenses. You may use the information in this line, together with the amount you invested, to estimate the expenses that you paid from August 1, 2013 through January 31, 2014. Simply divide your account value by $1,000 (for example, an $8,600 account value divided by $1,000 = 8.6), then multiply the result by the number in the first line of each Class under the heading entitled “Expenses Paid During Period” to estimate the expenses you paid on your account during this period.
Hypothetical Expenses for Comparison Purposes
The second line of each Class in the table below provides information about hypothetical account values and hypothetical expenses based on the Class’ actual expense ratio and an assumed rate of return of 5% per year before expenses, which is not the Class’ actual return. The hypothetical account values and expenses may not be used to estimate the actual ending account balance or expenses you paid for the period from August 1, 2013 through January 31, 2014. You may use this information to compare the ongoing costs of investing in the Class of the Fund and other funds. To do so, compare this 5% hypothetical example with the 5% hypothetical examples that appear in the shareholder reports of the other funds.
Please note that the expenses shown in the table are meant to highlight your ongoing costs only and do not reflect any transaction costs, such as sales charges (loads) or redemption fees. If these transaction costs were included, your costs would have been higher. Therefore, the second line for each Class in the table is useful in comparing ongoing costs only, and will not help you determine the relative total costs of owning different funds. The examples also assume all dividends and distributions are reinvested.
Schedule of Shareholder Expenses
Expense Analysis of a $1,000 Investment
Nationwide HighMark California January 31, 2014 | Beginning Account Value ($) 08/01/13 | Ending Account Value ($) 01/31/14 | Expenses Paid During Period ($) 08/01/13 - 01/31/14 | Expense Ratio During Period (%) 08/01/13 - 01/31/14 | ||||||||
| Class A Shares | Actual | a | 1,000.00 | 1,028.70 | 4.04 | 0.79 | ||||||
| Hypothetical | a,b | 1,000.00 | 1,021.22 | 4.02 | 0.79 | |||||||
| Class C Shares | Actual | a | 1,000.00 | 1,025.50 | 6.33 | 1.24 | ||||||
| Hypothetical | a,b | 1,000.00 | 1,018.95 | 6.31 | 1.24 | |||||||
| Institutional Service | Actual | a | 1,000.00 | 1,028.80 | 2.76 | 0.54 | ||||||
| Class Sharesc | Hypothetical | a,b | 1,000.00 | 1,022.48 | 2.75 | 0.54 | ||||||
| Institutional | Actual | d | 1,000.00 | 1,024.40 | 1.83 | 0.49 | ||||||
| Class Shares | Hypothetical | a,b | 1,000.00 | 1,022.74 | 2.50 | 0.49 | ||||||
| a | Expenses are equal to the Fund’s annualized expense ratio multiplied by the average account value from August 1, 2013 through January 31, 2014 multiplied to reflect one-half year period. The expense ratio presented represents a six-month, annualized ratio in accordance with Securities and Exchange Commission guidelines. |
| b | Represents the hypothetical 5% return before expenses. |
| c | Effective September 16, 2013, Fiduciary Shares were renamed Institutional Service Class Shares. |
| d | Actual expenses are equal to the Fund’s annualized expense ratio multiplied by the average account value from September 19, 2013 through January 31, 2014 to reflect the period from commencement of operations. |
26
Statement of Investments
January 31, 2014 (Unaudited)
Nationwide HighMark California Intermediate Tax Free Bond Fund
| Municipal Bonds 98.2% | ||||||||||
| Principal Amount | Market Value | |||||||||
| ||||||||||
California 98.2% | ||||||||||
Alhambra, Unified School District, | $ | 495,000 | $ | 579,061 | ||||||
Series A, 5.00%, 08/01/21 | 450,000 | 524,754 | ||||||||
Alhambra, Unified School District, | 1,150,000 | 1,277,121 | ||||||||
Atascadero, Unified School District, | 345,000 | 388,829 | ||||||||
Bay Area Toll Authority, San Francisco Bay Area, Refunding, RB | 1,695,000 | 1,953,487 | ||||||||
Series F-1, 5.00%, 04/01/24 | 665,000 | 769,804 | ||||||||
Bay Area Water Supply & Conservation Agency, Capital Cost Recovery Prepayment Program, RB, | 845,000 | 965,497 | ||||||||
Burlingame, Elementary School District, Refunding, GO, AGM Insured, | 795,000 | 889,859 | ||||||||
California Educational Facilities Authority, Pepperdine University, Refunding, RB, | 405,000 | 467,755 | ||||||||
California State, Department of Water Resources, Central Valley Project, Prerefunded Balance, RB, National-RE Insured, | 85,000 | 88,433 | ||||||||
California State, Department of Water Resources, Central Valley Project, Refunding, ETM, RB, AGM Insured, | 10,000 | 10,445 | ||||||||
California State, Department of Water Resources, Central Valley Project, Refunding, RB, | 3,085,000 | 3,552,532 | ||||||||
California State, Department of Water Resources, Power Supply Revenue, RB, | 1,325,000 | 1,522,703 | ||||||||
California State, Department of Water Resources, Power Supply Revenue, Refunding, RB, AGM Insured | 1,485,000 | 1,719,897 | ||||||||
Series H, 5.00%, 05/01/22 | 1,770,000 | 2,035,695 | ||||||||
California State, Economic Recovery, | 1,250,000 | 1,275,700 | ||||||||
California State, Economic Recovery, Refunding, GO | 555,000 | 656,959 | ||||||||
Series A, 5.25%, 07/01/21 | 4,000,000 | 4,745,520 | ||||||||
| Municipal Bonds (continued) | ||||||||||
| Principal Amount | Market Value | |||||||||
| ||||||||||
California (continued) | ||||||||||
California State, Educational Facilities Authority Revenue, Santa Clara University, RB | $ | 250,000 | $ | 277,718 | ||||||
5.25%, 04/01/24 | 695,000 | 765,313 | ||||||||
California State, GO, | 2,000,000 | 2,297,740 | ||||||||
California State, Public Works Board, Lease Revenue, Regents of the University of California, ETM, RB | 1,525,000 | 1,774,246 | ||||||||
Series G, 5.00%, 12/01/21 | 1,000,000 | 1,213,850 | ||||||||
California State, Refunding, GO, | 1,545,000 | 1,726,877 | ||||||||
California State, Refunding, GO, AMBAC Insured, | 1,000,000 | 1,154,690 | ||||||||
California State, University, Systemwide, RB, | 255,000 | 290,251 | ||||||||
California State, University, Systemwide, Refunding, RB | 945,000 | 1,049,460 | ||||||||
Series A, 5.00%, 11/01/26 | 1,500,000 | 1,654,890 | ||||||||
California State, Various Purposes, GO | 1,000,000 | 1,185,640 | ||||||||
5.63%, 04/01/25 | 2,030,000 | 2,346,254 | ||||||||
Campbell, Unified High School District, Refunding, GO, | 695,000 | 790,632 | ||||||||
Cerritos, Community College District, Election 2004, GO | 450,000 | 514,404 | ||||||||
Series C, 5.25%, 08/01/25 | 750,000 | 853,200 | ||||||||
Chaffey, Community College District, Election 2002, GO, | 1,000,000 | 1,175,350 | ||||||||
Chaffey, Unified High School District, Refunding, GO, National-RE FGIC Insured, | 1,100,000 | 1,178,639 | ||||||||
Chino Valley, Unified School District, Election 2002, Refunding, GO, | 975,000 | 1,126,027 | ||||||||
Citrus, Community College District, Election 2004, GO, | 545,000 | 618,542 | ||||||||
Corona-Norco, Unified School District, Election 2006, GO, | 920,000 | 1,022,240 | ||||||||
Desert Sands, Unified School District, Election 2001, GO | 865,000 | 1,029,436 | ||||||||
5.25%, 08/01/20 | 610,000 | 703,428 | ||||||||
27
Statement of Investments (Continued)
January 31, 2014 (Unaudited)
Nationwide HighMark California Intermediate Tax Free Bond Fund (Continued)
| Municipal Bonds (continued) | ||||||||||
| Principal Amount | Market Value | |||||||||
| ||||||||||
California (continued) | ||||||||||
5.25%, 08/01/22 | $ | 800,000 | $ | 914,464 | ||||||
5.50%, 08/01/25 | 590,000 | 675,267 | ||||||||
El Camino, Community College District, Refunding, GO, | 1,250,000 | 1,496,925 | ||||||||
El Camino, Community College District, Refunding, GO, AGM Insured, | 1,000,000 | 1,070,250 | ||||||||
Fallbrook, Union Elementary School District, San Diego County, Election 2002, Refunding, GO, | 720,000 | 843,941 | ||||||||
Fontana, Unified School District, Unrefunded Balance, GO, AGM Insured, | 40,000 | 41,001 | ||||||||
Gavilan, Joint Community College District, Refunding, GO, | 1,000,000 | 1,192,190 | ||||||||
Gilroy, Unified School District, Election 2008, GO, AGM Insured | 1,945,000 | 2,235,350 | ||||||||
Series A, 6.00%, 08/01/25 | 1,400,000 | 1,638,378 | ||||||||
Grant, Joint Union High School District, Election 2006, GO, AGM Insured, | 975,000 | 1,088,451 | ||||||||
Hayward, Unified School District, Election 2008, GO, | 1,000,000 | 1,081,300 | ||||||||
Imperial, Irrigation District, Electric Revenue, Refunding, RB | 2,600,000 | 2,821,390 | ||||||||
Kern, High School District, Refunding, GO | 430,000 | 484,898 | ||||||||
4.00%, 08/01/19 | 740,000 | 839,049 | ||||||||
5.00%, 08/01/22 | 575,000 | 680,524 | ||||||||
Long Beach, Community College District, Election 2008, Refunding, GO, | 465,000 | 521,298 | ||||||||
Long Beach, Harbor Revenue, Refunding, RB, | 1,845,000 | 2,074,444 | ||||||||
Long Beach, Unified School District, Election 2008, GO | 180,000 | 183,416 | ||||||||
Series A, 5.25%, 08/01/24 | 200,000 | 229,844 | ||||||||
Series A, 5.25%, 08/01/25 | 1,640,000 | 1,884,721 | ||||||||
Long Beach, Unified School District, Refunding, GO, | 1,570,000 | 1,794,698 | ||||||||
Los Angeles County, Public Works Financing Authority Revenue, Regional Park & Open Space, Refunding, AGM Insured, | 445,000 | 479,977 | ||||||||
| Municipal Bonds (continued) | ||||||||||
| Principal Amount | Market Value | |||||||||
| ||||||||||
California (continued) | ||||||||||
Los Angeles, Airport Department Revenue, Los Angeles International Airport, RB | $ | 1,000,000 | $ | 1,137,850 | ||||||
Series D, 5.00%, 05/15/24 | 1,100,000 | 1,252,471 | ||||||||
Los Angeles, Airport Department Revenue, Los Angeles International Airport, Refunding, RB | 500,000 | 569,775 | ||||||||
Series A, 5.00%, 05/15/23 | 1,000,000 | 1,153,870 | ||||||||
Los Angeles, Community College District, Election 2001, GO, | 500,000 | 562,355 | ||||||||
Los Angeles, Community College District, Election 2003, GO, AGM Insured | 1,000,000 | 1,110,330 | ||||||||
Series E, 5.00%, 08/01/23 | 1,360,000 | 1,502,079 | ||||||||
Los Angeles, Community College District, Election 2008, GO | 1,695,000 | 1,975,387 | ||||||||
Series A, 5.50%, 08/01/24 | 1,200,000 | 1,391,100 | ||||||||
Los Angeles, GO, | 950,000 | 1,102,665 | ||||||||
Los Angeles, GO, National-RE Insured, | 1,430,000 | 1,571,713 | ||||||||
Los Angeles, Harbor Department Revenue, RB | 2,090,000 | 2,441,413 | ||||||||
Series A, 5.25%, 08/01/21 | 350,000 | 406,595 | ||||||||
Los Angeles, Refunding, GO, | 2,515,000 | 2,952,509 | ||||||||
Los Angeles, Refunding, GO, AGM Insured, | 1,080,000 | 1,161,248 | ||||||||
Los Angeles, Unified School District, Elcetion 2002, GO, | 1,000,000 | 1,163,430 | ||||||||
Los Angeles, Unified School District, Elcetion 2004, GO, | 1,910,000 | 2,169,053 | ||||||||
Los Angeles, Unified School District, Election 2008, GO, FGIC Insured, | 680,000 | 752,359 | ||||||||
Los Angeles, Waste Water System Revenue, Senior Lien, Refunding, RB, | 1,535,000 | 1,797,347 | ||||||||
Los Angeles, Water & Power Department Revenue, Power System, RB, | 575,000 | 614,704 | ||||||||
Los Angeles, Water & Power Department Revenue, Power System, RB, AGM Insured, | 2,000,000 | 2,118,240 | ||||||||
28
Statement of Investments (Continued)
January 31, 2014 (Unaudited)
Nationwide HighMark California Intermediate Tax Free Bond Fund (Continued)
| Municipal Bonds (continued) | ||||||||||
| Principal Amount | Market Value | |||||||||
| ||||||||||
California (continued) | ||||||||||
Los Angeles, Water & Power Department Revenue, Power System, Refunding, RB | ||||||||||
Series A, 5.00%, 07/01/18 | $ | 1,425,000 | $ | 1,681,486 | ||||||
Series A, 5.00%, 07/01/22 | 2,380,000 | 2,822,156 | ||||||||
Manteca, Sewer Revenue, Refunding, RB, | 1,580,000 | 1,820,334 | ||||||||
Modesto, Irrigation District, Capital Improvements, COP, | 1,500,000 | 1,664,715 | ||||||||
Modesto, Irrigation District, Electric Revenue, Refunding, RB | ||||||||||
Series A, 5.00%, 07/01/20 | 535,000 | 631,915 | ||||||||
Series A, 5.00%, 07/01/21 | 750,000 | 885,412 | ||||||||
Series A, 5.00%, 07/01/22 | 1,525,000 | 1,765,447 | ||||||||
Mount Diablo, Unified School District, Election 2002, Refunding, GO | ||||||||||
Series B, 5.00%, 07/01/20 | 1,145,000 | 1,363,809 | ||||||||
Series B-2, 5.00%, 07/01/24 | 2,000,000 | 2,297,960 | ||||||||
Mount Diablo, Unified School District, Refunding, GO | ||||||||||
5.00%, 08/01/23 | 2,125,000 | 2,438,012 | ||||||||
5.00%, 08/01/26 | 300,000 | 332,871 | ||||||||
North Orange County, Community College District, Refunding, Prerefunded Balance, GO, National-RE Insured, | 2,295,000 | 2,459,368 | ||||||||
Northern California Transmission Agency Revenue, California-Oregon Project, Refunding, RB, | 1,175,000 | 1,325,012 | ||||||||
Ohlone, Community College District, Refunding, GO, | 720,000 | 863,071 | ||||||||
Orange County, Sanitation District, COP, AGM Insured | ||||||||||
Series B, 5.00%, 02/01/17 | 530,000 | 600,639 | ||||||||
Series B, 5.00%, 02/01/21 | 500,000 | 559,430 | ||||||||
Series B, 5.00%, 02/01/23 | 2,615,000 | 2,925,008 | ||||||||
Series B, 5.00%, 02/01/25 | 1,200,000 | 1,335,564 | ||||||||
Orange County, Water District Revenue, COP, National-RE Insured, | 750,000 | 784,958 | ||||||||
Pajaro Valley, Unified School District, Refunding, GO, | 500,000 | 564,895 | ||||||||
Paramount, Unified School District, Refunding, GO, AGM Insured, | 1,000,000 | 1,071,590 | ||||||||
Peralta, Community College District, Refunding, GO, | 2,240,000 | 2,643,200 | ||||||||
| Municipal Bonds (continued) | ||||||||||
| Principal Amount | Market Value | |||||||||
| ||||||||||
California (continued) | ||||||||||
Port of Oakland, Intermediate Lien, Refunding, RB, National-RE Insured, | $ | 1,875,000 | $ | 2,117,756 | ||||||
Redding, Electric System Revenue, Refunding, COP, AGM Insured | ||||||||||
Series A, 5.25%, 06/01/19 | 370,000 | 428,697 | ||||||||
Series A, 5.00%, 06/01/22 | 1,525,000 | 1,715,701 | ||||||||
Series A, 5.00%, 06/01/24 | 1,160,000 | 1,295,337 | ||||||||
Riverside, Community College District, Refunding, GO, AGM Insured, | 1,750,000 | 1,871,678 | ||||||||
Sacramento, Municipal Utility District, Electric Revenue, Refunding, RB, | 1,000,000 | 1,179,280 | ||||||||
Sacramento, Municipal Utility District, Electric Revenue, Refunding, RB, AGM Insured | ||||||||||
Series U, 5.00%, 08/15/23 | 1,690,000 | 1,908,838 | ||||||||
Series U, 5.00%, 08/15/24 | 595,000 | 672,047 | ||||||||
Sacramento, Unified School District, Refunding, GO, | 1,140,000 | 1,335,157 | ||||||||
San Bernardino, Community College District, Election 2002, Prerefunded Balance, GO, | 1,055,000 | 1,301,691 | ||||||||
San Bernardino, Community College District, Refunding, GO | ||||||||||
Series A, 4.00%, 08/01/18 | 405,000 | 457,087 | ||||||||
Series A, 5.00%, 08/01/20 | 1,000,000 | 1,194,110 | ||||||||
San Diego County, Water Authority Revenue, Refunding, COP, AGM Insured, | 1,030,000 | 1,171,059 | ||||||||
San Diego County, Water Authority Revenue, Refunding, COP, National-RE FGIC Insured, | 1,325,000 | 1,465,212 | ||||||||
San Diego County, Water Authority Revenue, Unrefunded Balance, COP, AGM Insured, | 365,000 | 383,352 | ||||||||
San Diego, Community College District, Refunding, GO | ||||||||||
5.00%, 08/01/20 | 560,000 | 673,266 | ||||||||
5.00%, 08/01/21 | 400,000 | 481,780 | ||||||||
5.00%, 08/01/24 | 1,000,000 | 1,170,820 | ||||||||
San Diego, Public Facilities Financing Authority, Sewer Revenue, Refunding, RB | ||||||||||
Series B, 5.50%, 05/15/23 | 3,725,000 | 4,282,781 | ||||||||
Series A, 5.25%, 05/15/26 | 1,675,000 | 1,945,379 | ||||||||
29
Statement of Investments (Continued)
January 31, 2014 (Unaudited)
Nationwide HighMark California Intermediate Tax Free Bond Fund (Continued)
| Municipal Bonds (continued) | ||||||||||
| Principal Amount | Market Value | |||||||||
| ||||||||||
California (continued) | ||||||||||
San Diego, Public Facilities Financing Authority, Water revenue, Refunding, RB, | $ | 1,000,000 | $ | 1,156,200 | ||||||
San Francisco City & County, Airport Commission, International Airport Revenue, Second Series, Issue 32F, Refunding, RB, National-RE FGIC Insured | ||||||||||
5.25%, 05/01/19 | 2,150,000 | 2,574,002 | ||||||||
5.00%, 05/01/22 | 2,000,000 | 2,167,720 | ||||||||
San Francisco City & County, Earthquake Saftey, GO, | 1,000,000 | 1,169,670 | ||||||||
San Francisco City & County, General Hospital Improvement, GO, | 250,000 | 286,870 | ||||||||
San Francisco City & County, Public Utilities Commission, Water Revenue, RB, AGM Insured, | 1,000,000 | 1,093,530 | ||||||||
San Francisco City & County, Refunding, GO, | 755,000 | 881,727 | ||||||||
San Francisco City & County, Unified School District, Prop A, Election 2006, GO, | 950,000 | 1,098,685 | ||||||||
San Francisco, Bay Area Rapid Transit, District Sales Tax Revenue, Refunding, RB, | 500,000 | 588,125 | ||||||||
San Francisco, Community College District, Election 2001, GO, National-RE Insured, | 2,085,000 | 2,113,856 | ||||||||
San Joaquin County, Delta Community College District, Election 2004, Refunding, GO, AGM Insured, | 1,050,000 | 1,115,898 | ||||||||
San Jose, Unified School District, Santa Clara County, Election 2002, GO, National-RE FGIC Insured, | 835,000 | 922,892 | ||||||||
San Mateo Union High School District, Election 2006, GO | ||||||||||
Series 2013-A, 5.00%, 09/01/20 | 400,000 | 483,252 | ||||||||
Series 2013-A, 5.00%, 09/01/22 | 1,000,000 | 1,215,850 | ||||||||
San Mateo, Joint Powers Financing Authority, Lease Revenue, San Mateo County, Capital Projects, Refunding, RB, | 1,000,000 | 1,132,660 | ||||||||
| Municipal Bonds (continued) | ||||||||||
| Principal Amount | Market Value | |||||||||
| ||||||||||
California (continued) | ||||||||||
Santa Clara, Valley Transportation Authority, Sales Tax Revenue, Measure A, Refunding, RB, AMBAC Insured, | $ | 400,000 | $ | 443,248 | ||||||
Santa Maria, Joint Unified High School District, Election 2000, ETM, GO, AGM Insured, | 510,000 | 550,341 | ||||||||
Santa Maria, Joint Unified High School District, Refunding, GO, AMBAC Insured, | 500,000 | 552,635 | ||||||||
Santa Rosa, High School District, Refunding, GO, AGM Insured, | 1,090,000 | 1,202,019 | ||||||||
Southern California, Public Power Authority, Power Project Revenue, Canyon Power, Refunding, RB, | 3,065,000 | 3,457,627 | ||||||||
Southern California, Public Power Authority, Transmission Project Revenue, Sub-Southern Transmission, Refunding, RB, | 1,200,000 | 1,362,936 | ||||||||
State Center, Community College District, Refunding, GO, | 1,000,000 | 1,184,680 | ||||||||
Stockton, Unified School District, Election 2005, GO, AGM Insured, | 645,000 | 709,377 | ||||||||
The Regents of the University of California Ltd. Project, Refunding, RB, | 935,000 | 1,119,821 | ||||||||
Torrance, Unified School District, Election 2008, Measure Z, GO, | 1,000,000 | 1,153,680 | ||||||||
University of California, Generated Revenue, RB, | 2,000,000 | 2,345,400 | ||||||||
University of California, Limited Project Revenue, Refunding, RB, | 2,270,000 | 2,630,317 | ||||||||
Upland, Unified School District, Refunding, GO, | 500,000 | 561,070 | ||||||||
Vista, Unified School District, Refunding, GO | ||||||||||
5.00%, 08/01/21 | 500,000 | 589,285 | ||||||||
5.00%, 08/01/22 | 500,000 | 589,255 | ||||||||
5.00%, 08/01/24 | 300,000 | 345,594 | ||||||||
30
Statement of Investments (Continued)
January 31, 2014 (Unaudited)
Nationwide HighMark California Intermediate Tax Free Bond Fund (Continued)
| Municipal Bonds (continued) | ||||||||||
| Principal Amount | Market Value | |||||||||
| ||||||||||
California (continued) | ||||||||||
West Valley-Mission, Community College District, Election 2012, GO, | $ | 1,615,000 | $ | 1,881,540 | ||||||
|
| |||||||||
Total Municipal Bonds |
| 199,918,789 | ||||||||
|
| |||||||||
Total Investments |
| 199,918,789 | ||||||||
Other assets in excess of |
| 3,595,377 | ||||||||
|
| |||||||||
NET ASSETS — 100.0% |
| $ | 203,514,166 | |||||||
|
| |||||||||
| (a) | See notes to financial statements for tax cost and unrealized appreciation/(depreciation) of securities. |
| AGM | Assured Guaranty Municipal Corporation |
| AMBAC | American Municipal Bond Assurance Corporation |
| COP | Certificates of Participation |
| ETM | Escrowed to Maturity |
| FGIC | Financial Guaranty Insurance Corporation |
| GO | General Obligation |
| Ltd. | Limited |
| RB | Revenue Bond |
| RE | Reinsured |
The accompanying notes are an integral part of these financial statements.
31
Statement of Assets and Liabilities
January 31, 2014 (Unaudited)
| Nationwide HighMark California Intermediate Tax Free Bond Fund | ||||||
Assets: | ||||||
Investments, at value (cost $190,319,959) | $ | 199,918,789 | ||||
Cash | 991,999 | |||||
Interest and dividends receivable | 2,811,325 | |||||
Receivable for capital shares issued | 397,975 | |||||
Prepaid expenses | 2,155 | |||||
|
| |||||
Total Assets | 204,122,243 | |||||
|
| |||||
Liabilities: | ||||||
Distributions payable | 193,498 | |||||
Payable for capital shares redeemed | 209,195 | |||||
Accrued expenses and other payables: | ||||||
Investment advisory fees | 64,529 | |||||
Fund administration fees | 13,712 | |||||
Distribution fees | 36,317 | |||||
Administrative servicing fees | 23,944 | |||||
Accounting and transfer agent fees | 4,631 | |||||
Trustee fees | 3,741 | |||||
Deferred compensation (Note 2) | 18,304 | |||||
Custodian fees | 1,257 | |||||
Compliance program costs (Note 3) | 835 | |||||
Professional fees | 21,229 | |||||
Printing fees | 12,894 | |||||
Other | 3,991 | |||||
|
| |||||
Total Liabilities | 608,077 | |||||
|
| |||||
Net Assets | $ | 203,514,166 | ||||
|
| |||||
Represented by: | ||||||
Capital | $ | 193,623,489 | ||||
Accumulated distributions in excess of net investment income | (220,274 | ) | ||||
Accumulated net realized gains from investment transactions | 512,121 | |||||
Net unrealized appreciation/(depreciation) from investments | 9,598,830 | |||||
|
| |||||
Net Assets | $ | 203,514,166 | ||||
|
| |||||
32
Statement of Assets and Liabilities (Continued)
January 31, 2014 (Unaudited)
| Nationwide HighMark California Intermediate Tax Free Bond Fund | ||||||
Net Assets: | ||||||
Class A Shares | $ | 66,519,289 | ||||
Class C Shares | 33,821,943 | |||||
Institutional Service Class Shares | 103,162,686 | |||||
Institutional Class Shares | 10,248 | |||||
|
| |||||
Total | $ | 203,514,166 | ||||
|
| |||||
Shares Outstanding (unlimited number of shares authorized): | ||||||
Class A Shares | 6,451,974 | |||||
Class C Shares | 3,292,871 | |||||
Institutional Service Class Shares | 9,955,783 | |||||
Institutional Class Shares | 989 | |||||
|
| |||||
Total | 19,701,617 | |||||
|
| |||||
Net asset value and redemption price per share (Net assets by class divided by shares outstanding by class, respectively): | ||||||
Class A Shares (a) | $ | 10.31 | ||||
Class C Shares (b) | $ | 10.27 | ||||
Institutional Service Class Shares | $ | 10.36 | ||||
Institutional Class Shares | $ | 10.36 | ||||
Maximum offering price per share (100%/(100%-maximum sales charge) of net asset value adjusted to the nearest cent): | ||||||
Class A Shares | $ | 10.55 | ||||
|
| |||||
Maximum Sales Charge: | ||||||
Class A Shares | 2.25 | % | ||||
|
| |||||
| (a) | For Class A Shares, the redemption price per share is reduced by 0.75% on sales of shares of original purchases of $500,000 or more or that were not subject to a front-end sales charge made within 18 months of the purchase date |
| (b) | For Class C Shares, the redemption price per share is reduced by 1.00% for shares held less than 1 year. |
The accompanying notes are an integral part of these financial statements.
33
Statement of Operations
For the Six Months Ended January 31, 2014 (Unaudited)
| Nationwide HighMark California Intermediate Tax Free Bond Fund | ||||||
INVESTMENT INCOME: | ||||||
Interest income | $ | 3,320,659 | ||||
Dividend income | 66 | |||||
|
| |||||
Total Income | 3,320,725 | |||||
|
| |||||
EXPENSES: | ||||||
Investment advisory fees | 537,889 | |||||
Fund administration fees | 102,498 | |||||
Distribution fees Class A | 88,143 | |||||
Distribution fees Class C | 134,701 | |||||
Administrative servicing fees Class A | 36,318 | |||||
Administrative servicing fees Institutional Service Class (a) | 55,611 | |||||
Registration and filing fees | 6,312 | |||||
Professional fees | 26,188 | |||||
Printing fees | 14,645 | |||||
Trustee fees | 4,385 | |||||
Custodian fees | 4,611 | |||||
Accounting and transfer agent fees | 16,487 | |||||
Compliance program costs (Note 3) | 1,867 | |||||
Other | 19,490 | |||||
|
| |||||
Total expenses before earnings credit, fees waived, and expenses reimbursed | 1,049,145 | |||||
|
| |||||
Earnings credit (Note 4) | (137 | ) | ||||
Administrative servicing fees voluntarily waived — Class A (Note 3) | (18,689 | ) | ||||
Administrative servicing fees voluntarily waived — Institutional Service Class (a) (Note 3) | (28,433 | ) | ||||
Expenses reimbursed by adviser (Note 3) | (207,343 | ) | ||||
|
| |||||
Net Expenses | 794,543 | |||||
|
| |||||
NET INVESTMENT INCOME | 2,526,182 | |||||
|
| |||||
REALIZED/UNREALIZED GAINS (LOSSES) FROM INVESTMENTS: | ||||||
Net realized gains from investment transactions | 998,509 | |||||
Net change in unrealized appreciation/(depreciation) from investments | 2,258,664 | |||||
|
| |||||
Net realized/unrealized gains from investments | 3,257,173 | |||||
|
| |||||
CHANGE IN NET ASSETS RESULTING FROM OPERATIONS | $ | 5,783,355 | ||||
|
| |||||
| (a) | Effective September 16, 2013, Fiduciary Shares were renamed Institutional Service Class Shares. |
The accompanying notes are an integral part of these financial statements.
34
Statements of Changes in Net Assets
| Nationwide HighMark California Intermediate Tax Free Bond Fund | ||||||||||||
| Six Months Ended January 31, 2014 (Unaudited) | Year Ended July 31, 2013 | |||||||||||
Operations: | ||||||||||||
Net investment income | $ | 2,526,182 | $ | 5,979,705 | ||||||||
Net realized gains from investment transactions | 998,509 | 150,196 | ||||||||||
Net change in unrealized appreciation/(depreciation) from investments | 2,258,664 | (9,210,247 | ) | |||||||||
|
|
|
| |||||||||
Change in net assets resulting from operations | 5,783,355 | (3,080,346 | ) | |||||||||
|
|
|
| |||||||||
Distributions to Shareholders From: | ||||||||||||
Net investment income: | ||||||||||||
Class A | (891,932 | ) | (2,024,600 | ) | ||||||||
Class C | (375,553 | ) | (689,179 | ) | ||||||||
Institutional Service Class (a) | (1,498,927 | ) | (3,289,031 | ) | ||||||||
Institutional Class | (107 | )(b) | – | |||||||||
Net realized gains: | ||||||||||||
Class A | (130,280 | ) | – | |||||||||
Class C | (66,279 | ) | – | |||||||||
Institutional Service Class (a) | (203,718 | ) | – | |||||||||
Institutional Class | (19 | )(b) | – | |||||||||
|
|
|
| |||||||||
Change in net assets from shareholder distributions | (3,166,815 | ) | (6,002,810 | ) | ||||||||
|
|
|
| |||||||||
Change in net assets from capital transactions | (29,739,461 | ) | (21,511,423 | ) | ||||||||
|
|
|
| |||||||||
Change in net assets | (27,122,921 | ) | (30,594,579 | ) | ||||||||
|
|
|
| |||||||||
Net Assets: | ||||||||||||
Beginning of period | 230,637,087 | 261,231,666 | ||||||||||
|
|
|
| |||||||||
End of period | $ | 203,514,166 | $ | 230,637,087 | ||||||||
|
|
|
| |||||||||
Accumulated undistributed (distributions in excess of) net investment income at end of period | $ | (220,274 | ) | $ | 20,063 | |||||||
|
|
|
| |||||||||
CAPITAL TRANSACTIONS: | ||||||||||||
Class A Shares | ||||||||||||
Proceeds from shares issued | $ | 12,225,434 | $ | 31,490,036 | ||||||||
Dividends reinvested | 766,624 | 1,519,633 | ||||||||||
Cost of shares redeemed | (23,808,330 | ) | (46,078,095 | ) | ||||||||
|
|
|
| |||||||||
Total Class A Shares | (10,816,272 | ) | (13,068,426 | ) | ||||||||
|
|
|
| |||||||||
Class C Shares | ||||||||||||
Proceeds from shares issued | 3,554,769 | 15,323,206 | ||||||||||
Dividends reinvested | 375,701 | 521,271 | ||||||||||
Cost of shares redeemed | (8,790,498 | ) | (11,632,434 | ) | ||||||||
|
|
|
| |||||||||
Total Class C Shares | (4,860,028 | ) | 4,212,043 | |||||||||
|
|
|
| |||||||||
| (a) | Effective September 16, 2013, Fiduciary Shares were renamed Institutional Service Class Shares. |
| (b) | For the period from September 19, 2013 (commencement of operations) through January 31, 2014. |
35
Statements of Changes in Net Assets (Continued)
| Nationwide HighMark California Intermediate Tax Free Bond Fund | ||||||||||||
| Six Months Ended January 31, 2014 (Unaudited) | Year Ended July 31, 2013 | |||||||||||
CAPITAL TRANSACTIONS: (continued) | ||||||||||||
Institutional Service Class Shares (a) | ||||||||||||
Proceeds from shares issued | $ | 11,857,723 | $ | 34,674,779 | ||||||||
Dividends reinvested | 669,349 | 1,295,602 | ||||||||||
Cost of shares redeemed | (26,600,359 | ) | (48,625,421 | ) | ||||||||
|
|
|
| |||||||||
Total Institutional Service Class Shares | (14,073,287 | ) | (12,655,040 | ) | ||||||||
|
|
|
| |||||||||
Institutional Class Shares | – | – | ||||||||||
Proceeds from shares issued | 10,000 | (b) | – | |||||||||
Dividends reinvested | 126 | (b) | – | |||||||||
Cost of shares redeemed | – | (b) | – | |||||||||
|
|
|
| |||||||||
Total Institutional Class Shares | 10,126 | (b) | – | |||||||||
|
|
|
| |||||||||
Change in net assets from capital transactions | $ | (29,739,461 | ) | $ | (21,511,423 | ) | ||||||
|
|
|
| |||||||||
SHARE TRANSACTIONS: | ||||||||||||
Class A Shares | ||||||||||||
Issued | 1,195,794 | 2,994,460 | ||||||||||
Reinvested | 74,974 | 144,930 | ||||||||||
Redeemed | (2,335,818 | ) | (4,403,602 | ) | ||||||||
|
|
|
| |||||||||
Total Class A Shares | (1,065,050 | ) | (1,264,212 | ) | ||||||||
|
|
|
| |||||||||
Class C Shares | ||||||||||||
Issued | 348,971 | 1,460,144 | ||||||||||
Reinvested | 36,858 | 49,913 | ||||||||||
Redeemed | (865,344 | ) | (1,118,976 | ) | ||||||||
|
|
|
| |||||||||
Total Class C Shares | (479,515 | ) | 391,081 | |||||||||
|
|
|
| |||||||||
Institutional Service Class Shares (a) | ||||||||||||
Issued | 1,153,542 | 3,275,945 | ||||||||||
Reinvested | 65,132 | 122,883 | ||||||||||
Redeemed | (2,595,944 | ) | (4,630,981 | ) | ||||||||
|
|
|
| |||||||||
Total Institutional Service Class Shares | (1,377,270 | ) | (1,232,153 | ) | ||||||||
|
|
|
| |||||||||
Institutional Class Shares | ||||||||||||
Issued | 977 | (b) | – | |||||||||
Reinvested | 12 | (b) | – | |||||||||
Redeemed | – | (b) | – | |||||||||
|
|
|
| |||||||||
Total Institutional Class Shares | 989 | (b) | – | |||||||||
|
|
|
| |||||||||
Total change in shares | (2,920,846 | ) | (2,105,284 | ) | ||||||||
|
|
|
| |||||||||
Amounts designated as “–” are zero or have been rounded to zero.
| (a) | Effective September 16, 2013, Fiduciary Shares were renamed Institutional Service Class Shares. |
| (b) | For the period from September 19, 2013 (commencement of operations) through January 31, 2014. |
The accompanying notes are an integral part of these financial statements.
36
Financial Highlights
Selected data for each share of capital outstanding throughout the periods indicated
Nationwide HighMark California Intermediate Tax Free Bond Fund
Operations | Distributions | Ratios/Supplemental Data | ||||||||||||||||||||||||||||||||||||||||||||||||||||||
| Net Asset Value, Beginning of Period | Net Investment Income | Net Realized and Unrealized Gains (Losses) from Investments | Total from Operations | Net Investment Income | Net Realized Gains | Total Distributions | Net Asset Value, End of Period | Total Return (a)(b) | Net Assets at End of Period | Ratio of Expenses to Average Net Assets (c) | Ratio of Net Investment Income to Average Net Assets (c) | Ratio of Expenses (Prior to Reimbursements) to Average Net Assets (c)(d) | Portfolio Turnover (e) | |||||||||||||||||||||||||||||||||||||||||||
| Class A Shares | ||||||||||||||||||||||||||||||||||||||||||||||||||||||||
Six Months Ended January 31, 2014 (f) (Unaudited) | $ | 10.17 | 0.12 | 0.17 | 0.29 | (0.13 | ) | (0.02 | ) | (0.15 | ) | $ | 10.31 | 2.87% | $ | 66,519,289 | 0.79% | 2.30% | 1.04% | 3.15% | ||||||||||||||||||||||||||||||||||||
Year Ended July 31, 2013 (f) | $ | 10.54 | 0.23 | (0.37 | ) | (0.14 | ) | (0.23 | ) | – | (0.23 | ) | $ | 10.17 | (1.38% | ) | $ | 76,478,399 | 0.79% | 2.17% | 1.25% | 20.00% | ||||||||||||||||||||||||||||||||||
Year Ended July 31, 2012 (f) | $ | 10.14 | 0.24 | 0.40 | 0.64 | (0.24 | ) | – | (0.24 | ) | $ | 10.54 | 6.40% | $ | 92,569,680 | 0.79% | 2.30% | 1.27% | 34.00% | |||||||||||||||||||||||||||||||||||||
Year Ended July 31, 2011 (f) | $ | 10.18 | 0.25 | (0.04 | ) | 0.21 | (0.25 | ) | – | (0.25 | ) | $ | 10.14 | 2.13% | $ | 78,038,152 | 0.79% | 2.54% | 1.27% | 32.00% | ||||||||||||||||||||||||||||||||||||
Year Ended July 31, 2010 (f) | $ | 9.98 | 0.30 | 0.22 | 0.52 | (0.30 | ) | (0.02 | ) | (0.32 | ) | $ | 10.18 | 5.26% | $ | 76,111,437 | 0.78% | 2.97% | 1.27% | 17.00% | ||||||||||||||||||||||||||||||||||||
Year Ended July 31, 2009 (f) | $ | 9.78 | 0.32 | 0.22 | 0.54 | (0.32 | ) | (0.02 | ) | (0.34 | ) | $ | 9.98 | 5.57% | $ | 48,832,867 | 0.77% | 3.22% | 1.28% | 12.00% | ||||||||||||||||||||||||||||||||||||
| Class C Shares | ||||||||||||||||||||||||||||||||||||||||||||||||||||||||
Six Months Ended January 31, 2014 (f) (Unaudited) | $ | 10.14 | 0.10 | 0.16 | 0.26 | (0.11 | ) | (0.02 | ) | (0.13 | ) | $ | 10.27 | 2.55% | $ | 33,821,943 | 1.24% | 1.86% | 1.44% | 3.15% | ||||||||||||||||||||||||||||||||||||
Year Ended July 31, 2013 (f) | $ | 10.50 | 0.18 | (0.36 | ) | (0.18 | ) | (0.18 | ) | – | (0.18 | ) | $ | 10.14 | (1.72% | ) | $ | 38,244,483 | 1.24% | 1.72% | 1.50% | 20.00% | ||||||||||||||||||||||||||||||||||
Year Ended July 31, 2012 (f) | $ | 10.10 | 0.19 | 0.41 | 0.60 | (0.20 | ) | – | (0.20 | ) | $ | 10.50 | 5.96% | $ | 35,519,408 | 1.24% | 1.85% | 1.52% | 34.00% | |||||||||||||||||||||||||||||||||||||
Year Ended July 31, 2011 (f) | $ | 10.15 | 0.21 | (0.05 | ) | 0.16 | (0.21 | ) | – | (0.21 | ) | $ | 10.10 | 1.59% | $ | 22,805,903 | 1.24% | 2.09% | 1.52% | 32.00% | ||||||||||||||||||||||||||||||||||||
Year Ended July 31, 2010 (f) | $ | 9.95 | 0.25 | 0.22 | 0.47 | (0.25 | ) | (0.02 | ) | (0.27 | ) | $ | 10.15 | 4.82% | $ | 14,859,778 | 1.23% | 2.52% | 1.52% | 17.00% | ||||||||||||||||||||||||||||||||||||
Year Ended July 31, 2009 (f) | $ | 9.76 | 0.27 | 0.21 | 0.48 | (0.27 | ) | (0.02 | ) | (0.29 | ) | $ | 9.95 | 5.03% | $ | 4,937,909 | 1.22% | 2.77% | 1.53% | 12.00% | ||||||||||||||||||||||||||||||||||||
| Institutional Service Class Shares (g) | ||||||||||||||||||||||||||||||||||||||||||||||||||||||||
Six Months Ended January 31, 2014 (f) (Unaudited) | $ | 10.23 | 0.13 | 0.16 | 0.29 | (0.14 | ) | (0.02 | ) | (0.16 | ) | $ | 10.36 | 2.88% | $ | 103,162,686 | 0.54% | 2.54% | 0.78% | 3.15% | ||||||||||||||||||||||||||||||||||||
Year Ended July 31, 2013 (f) | $ | 10.60 | 0.26 | (0.37 | ) | (0.11 | ) | (0.26 | ) | – | (0.26 | ) | $ | 10.23 | (1.12% | ) | $ | 115,914,205 | 0.54% | 2.42% | 1.00% | 20.00% | ||||||||||||||||||||||||||||||||||
Year Ended July 31, 2012 (f) | $ | 10.19 | 0.27 | 0.41 | 0.68 | (0.27 | ) | – | (0.27 | ) | $ | 10.60 | 6.73% | $ | 133,142,578 | 0.54% | 2.55% | 1.02% | 34.00% | |||||||||||||||||||||||||||||||||||||
Year Ended July 31, 2011 (f) | $ | 10.23 | 0.28 | (0.04 | ) | 0.24 | (0.28 | ) | – | (0.28 | ) | $ | 10.19 | 2.38% | $ | 123,643,818 | 0.54% | 2.79% | 1.02% | 32.00% | ||||||||||||||||||||||||||||||||||||
Year Ended July 31, 2010 (f) | $ | 10.03 | 0.33 | 0.21 | 0.54 | (0.32 | ) | (0.02 | ) | (0.34 | ) | $ | 10.23 | 5.49% | $ | 112,406,697 | 0.53% | 3.22% | 1.02% | 17.00% | ||||||||||||||||||||||||||||||||||||
Year Ended July 31, 2009 (f) | $ | 9.83 | 0.34 | 0.22 | 0.56 | (0.34 | ) | (0.02 | ) | (0.36 | ) | $ | 10.03 | 5.80% | $ | 96,419,849 | 0.52% | 3.47% | 1.03% | 12.00% | ||||||||||||||||||||||||||||||||||||
| Institutional Class Shares | ||||||||||||||||||||||||||||||||||||||||||||||||||||||||
Period Ended January 31, 2014 (f)(h) (Unaudited) | $ | 10.24 | 0.10 | 0.15 | 0.25 | (0.11 | ) | (0.02 | ) | (0.13 | ) | $ | 10.36 | 2.44% | $ | 10,248 | 0.49% | 2.55% | 0.65% | 3.15% | ||||||||||||||||||||||||||||||||||||
Amounts designated as “–” are zero or have been rounded to zero.
| (a) | Excludes sales charge. |
| (b) | Not annualized for periods less than one year. |
| (c) | Annualized for periods less than one year. |
| (d) | During the period, certain fees may have been waived and/or reimbursed. If such waivers/reimbursements had not occurred, the ratios would have been as indicated. |
| (e) | Portfolio turnover is calculated on the basis of the Fund as a whole without distinguishing among the classes of shares. |
| (f) | Per share calculations were performed using average shares method. |
| (g) | Effective September 16, 2013, Fiduciary Shares were renamed Institutional Service Class Shares. |
| (h) | For the period from September 19, 2013 (commencement of operations) through January 31, 2014. Total return is calculated based on inception date of September 18, 2013 through January 31, 2014. |
The accompanying notes are an integral part of these financial statements.
37
| Fund Commentary | Nationwide HighMark National Intermediate Tax Free Bond Fund |
For the semiannual period ended January 31, 2014, the Nationwide HighMark National Intermediate Tax Free Bond Fund (Institutional Service Class) returned 2.56%* versus 2.61% for its benchmark, the Barclays 7-Year Municipal Bond Index. For broader comparison, the median return for the Fund’s closest Lipper peer category of Intermediate Municipal Debt Funds (consisting of 287 funds as of January 31, 2014) was 2.30% for the same time period.
| * | Performance prior to the Fund’s inception on September 16, 2013, is based on the performance of the Fund’s predecessor fund. |
Market Environment
Throughout the reporting period, the market continued to brace for the eventual tapering (gradual reduction) of the Federal Reserve’s accommodative monetary policy known as quantitative easing (QE). The effect of this sentiment was to cause a steepening of the municipal bond yield curve (a plotted graph line of the yields, or interest rates, on long-term and short-term maturity bonds). While long yields rose approximately 9 basis points, shorter yields fell 7 basis points during the reporting period as investors shortened their portfolio duration in an effort to be more defensive.
As the yield curve steepened, investors continued to experience losses during the reporting period. This resulted in additional mutual fund redemptions, forcing fund managers to sell bonds to raise cash, which caused additional losses, and then additional redemptions.
Credit spreads stabilized following a considerable widening, as the City of Detroit’s bankruptcy and a panic over Puerto Rico’s financial situation shook the market for much of 2013.
Puerto Rico was a consistent underperformer throughout the reporting period as news of budget deficits, a slowing economy and the island’s massive debt load spooked investors. These factors caused both mutual fund portfolio managers and individual investors to dump their Puerto Rican exposure, pushing yields to more than 10% for the reporting period.
The Fund’s lack of exposure to investments in Puerto Rico, shorter-than-benchmark duration
and high average coupon positioning supported Fund performance for the reporting period.
Portfolio Performance
The Fund’s positioning on the yield curve during the reporting period, laddered with an average duration shorter than its benchmark index provided protection in a rising-interest-rate environment, coupled with a steepening yield curve. The Fund’s premium coupon position also provided protection in this environment, as the position served to lower the Fund’s duration for a given maturity.
The Fund’s high credit quality provided outperformance during the reporting period as bonds rated AAA and AA outperformed lower-quality securities, especially those rated BBB and lower. In addition, the Fund’s lack of exposure to Puerto Rico, which was the worst performer of all the U.S. states and territories, registering -13.83% for the reporting period per the Fund’s benchmark index, provided strong relative performance for the Fund.
Outlook and Positioning
While it’s likely that rising yields and a steepening yield curve will hurt the Fund on an absolute basis during the next 12 months, the Fund’s current positioning may provide positive relative performance versus the benchmark index and Lipper peer category.
The Fund did not hold any derivatives at period end.
Subadviser:
HighMark Capital Management, Inc.
Portfolio Managers:
Robert Bigelow, Raymond Mow; and David Wines
The Fund is subject to the risks of investing in fixed-income securities. The Fund may invest in more-aggressive investments such as derivatives (many of which create investment leverage and are highly volatile). The Fund may invest in municipal securities that generate interest that is subject to alternative minimum tax (“AMT”). As a result, taxpayers who are subject to the AMT potentially could earn a lower after-tax return. Please refer to the summary prospectus for a more detailed explanation of the Fund’s principal risks.
A description of the benchmarks can be found on the Market Index Definitions page at the back of this book.
38
| Fund Overview (Unaudited) | Nationwide HighMark National Intermediate Tax Free Bond Fund |
Objective
The Fund seeks to provide high current income that is exempt from federal income tax.
Highlights
| Ÿ | For the semiannual period ended January 31, 2014, the Nationwide HighMark National Intermediate Tax Free Bond Fund (Institutional Service Class) returned 2.56%, underperforming the benchmark by 0.05% and outperforming the Lipper peer category by 0.26%. |
| Ÿ | The Fund’s lack of exposure to investments in Puerto Rico, shorter-than-benchmark duration and high average coupon positioning supported Fund performance for the reporting period. |
Asset Allocation†
| Municipal Bonds | 99.2% | |||
| Mutual Fund | 0.5% | |||
| Other assets in excess of liabilities | 0.3% | |||
| 100.0% |
Top Holdings††
| Clark County, Limited Tax-Bond Bank, GO, 5.00%, 06/01/25 | 3.8% | |||
| Connecticut State, GO, 5.00%, 11/01/19 | 3.4% | |||
| Florida State, Board of Education, Public Education, Refunding, TA, 5.00%, 06/01/22 | 3.1% | |||
| Alaska State, International Airports Revenue, Refunding, RB, National-RE Insured, 5.00%, 10/01/22 | 2.9% | |||
| Houston, Utility System Revenue, Refunding, RB, Combined First Lien, 5.00%, 11/15/19 | 2.8% | |||
| Chicago, O’Hare International Airport Revenue, General Apartment-Third Lien, RB, AGM Insured, 5.00%, 01/01/19 | 2.8% | |||
| Idaho State, Housing & Finance Association, Grant & Revenue Anticipation, Federal Highway Trust, RB, 5.25%, 07/15/24 | 2.6% | |||
| Massachusetts State Development Finance Agency, Harvard University, Refunding, RB, 5.00%, 10/15/20 | 2.5% | |||
| Chico, Unified School District, Election 1998, GO, AGM Insured, 5.00%, 08/01/25 | 2.4% | |||
| Washington State, Various Purpose, GO, 5.00%, 07/01/19 | 2.1% | |||
| Other Holdings | 71.6% | |||
| 100.0% |
| † | Percentages indicated are based upon net assets as of January 31, 2014. |
| †† | Percentages indicated are based upon total investments as of January 31, 2014. |
39
| Fund Performance | Nationwide HighMark National Intermediate Tax Free Bond |
Average Annual Total Return
(For periods ended January 31, 2014)
| Six Months* | 1 Yr. | 5 Yr. | 10 Yr. | |||||||||||||||
| Class A | w/o SC1 | 2.43% | 0.27% | 3.02% | 3.14% | |||||||||||||
| w/ SC2 | 0.13% | (1.99)% | 2.55% | 2.91% | ||||||||||||||
| Class C | w/o SC1 | 2.28% | (0.18)% | 2.64% | 2.60% | |||||||||||||
| w/ SC3 | 1.28% | (1.18)% | 2.64% | 2.60% | ||||||||||||||
| Institutional Service Class4,5 | w/o SC | 2.56% | 0.53% | 3.29% | 3.40% | |||||||||||||
| Institutional Class4 | w/o SC | 2.40% | 6 | — | — | — | ||||||||||||
All figures showing the effect of a sales charge (SC) reflect the maximum charge possible, because it has the most significant effect on performance data.
| * | Not annualized. |
| 1 | These returns do not reflect the effects of SCs. |
| 2 | A 2.25% front-end sales charge was deducted. |
| 3 | A 1.00% CDSC was deducted from the one year return because it is charged when you sell Class C shares within the first year after purchase. |
| 4 | Not subject to any SCs. |
| 5 | Effective September 16, 2013 Fiduciary Shares were renamed Institutional Service Class Shares. |
| 6 | Since inception date of September 18, 2013. Not Annualized. |
Expense Ratios
| Gross Expense Ratio* | Net Expense Ratio* | |||||||
| Class A | 1.26% | 0.77% | ||||||
| Class C | 1.51% | 1.22% | ||||||
| Institutional Service Class | 1.01% | 0.52% | ||||||
| Institutional Class | 0.76% | 0.47% | ||||||
| * | Current effective prospectus dated September 16, 2013. The difference between gross and net operating expenses reflects contractual waivers in place through November 30, 2015. Please see the Fund's most recent prospectus for details. |
40
| Fund Performance | Nationwide HighMark National Intermediate Tax Free Bond Fund |
Performance of a $10,000 Investment
Investment return and principal value will fluctuate, and when redeemed, shares may be worth more or less than original cost. Past performance is no guarantee of future results and does not reflect the deduction of taxes that a shareholder would pay on fund distributions or the redemption of fund shares. Investing in mutual funds involves market risk, including loss of principal. Performance returns assume the reinvestment of all distributions.
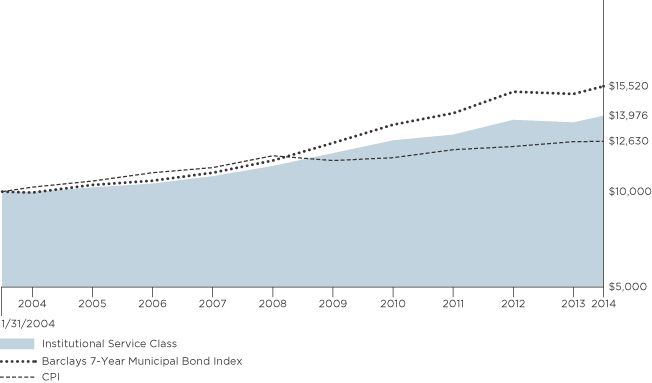
Comparative performance of $10,000 invested in Institutional Service Class shares of the Nationwide HighMark National Intermediate Tax Free Bond Fund versus the Barclays 7-Year Municipal Bond Index and the Consumer Price Index (CPI) over the 10-year period ended 1/31/14. Fund performance prior to the Fund’s inception on 9/16/13 is based on the Fund’s predecessor Fund. Unlike the Fund, the performance for these unmanaged indexes does not reflect any fees, expenses, or sales charges. One cannot invest directly in a market index. A description of the benchmarks can be found on the Market Index Definitions page at the back of this book.
41
| Shareholder Expense Example | Nationwide HighMark National Intermediate Tax Free Bond Fund |
As a shareholder of the Fund, you incur two types of costs: (1) transaction costs, including sales charges (loads) paid on purchase payments and redemption fees; and (2) ongoing costs, including investment advisory fees, administration fees, distribution fees and other Fund expenses. The examples below are intended to help you understand your ongoing costs (in dollars) of investing in the Fund and to compare these costs with the ongoing costs of investing in other mutual funds. Per Securities and Exchange Commission (“SEC”) requirements, the examples assume that you had a $1,000 investment in the Class at the beginning of the reporting period (August 1, 2013) and continued to hold your shares at the end of the reporting period (January 31, 2014).
Actual Expenses
For each Class of the Fund in the table below, the first line provides information about actual account values and actual expenses. You may use the information in this line, together with the amount you invested, to estimate the expenses that you paid from August 1, 2013 through January 31, 2014. Simply divide your account value by $1,000 (for example, an $8,600 account value divided by $1,000 = 8.6), then multiply the result by the number in the first line of each Class under the heading entitled “Expenses Paid During Period” to estimate the expenses you paid on your account during this period.
Hypothetical Expenses for Comparison Purposes
The second line of each Class in the table below provides information about hypothetical account values and hypothetical expenses based on the Class’ actual expense ratio and an assumed rate of return of 5% per year before expenses, which is not the Class’ actual return. The hypothetical account values and expenses may not be used to estimate the actual ending account balance or expenses you paid for the period from August 1, 2013 through January 31, 2014. You may use this information to compare the ongoing costs of investing in the Class of the Fund and other funds. To do so, compare this 5% hypothetical example with the 5% hypothetical examples that appear in the shareholder reports of the other funds.
Please note that the expenses shown in the table are meant to highlight your ongoing costs only and do not reflect any transaction costs, such as sales charges (loads) or redemption fees. If these transaction costs were included, your costs would have been higher. Therefore, the second line for each Class in the table is useful in comparing ongoing costs only, and will not help you determine the relative total costs of owning different funds. The examples also assume all dividends and distributions are reinvested.
Schedule of Shareholder Expenses
Expense Analysis of a $1,000 Investment
Nationwide HighMark National January 31, 2014 | Beginning Account Value ($) 08/01/13 | Ending Account Value ($) 01/31/14 | Expenses Paid During Period ($) 08/01/13 - 01/31/14 | Expense Ratio During Period (%) 08/01/13 - 01/31/14 | ||||||||
| Class A Shares | Actual | a | 1,000.00 | 1,024.30 | 3.93 | 0.77 | ||||||
| Hypotheticala,b | 1,000.00 | 1,021.32 | 3.92 | 0.77 | ||||||||
| Class C Shares | Actual | a | 1,000.00 | 1,022.80 | 6.22 | 1.22 | ||||||
| Hypotheticala,b | 1,000.00 | 1,019.06 | 6.21 | 1.22 | ||||||||
| Institutional Service Class Sharesc | Actual | a | 1,000.00 | 1,025.60 | 2.65 | 0.52 | ||||||
| Hypotheticala,b | 1,000.00 | 1,022.58 | 2.65 | 0.52 | ||||||||
| Institutional Class Shares | Actual | d | 1,000.00 | 1,024.00 | 1.76 | 0.47 | ||||||
| Hypotheticala,b | 1,000.00 | 1,022.84 | 2.40 | 0.47 | ||||||||
| a | Expenses are equal to the Fund’s annualized expense ratio multiplied by the average account value from August 1, 2013 through January 31, 2014 multiplied to reflect one-half year period. The expense ratio presented represents a six-month, annualized ratio in accordance with Securities and Exchange Commission guidelines. |
| b | Represents the hypothetical 5% return before expenses. |
| c | Effective September 16, 2013, Fiduciary Shares were renamed Institutional Service Class Shares. |
| d | Actual expenses are equal to the Fund’s annualized expense ratio multiplied by the average account value from September 19, 2013 through January 31, 2014 to reflect the period from commencement of operations. |
42
Statement of Investments
January 31, 2014 (Unaudited)
Nationwide HighMark National Intermediate Tax Free Bond Fund
| Municipal Bonds 99.2% | ||||||||||
| Principal Amount | Market Value | |||||||||
| ||||||||||
Alaska 5.3% |
| |||||||||
Alaska State, International Airports Revenue, Refunding, RB, National-RE Insured, | $ | 2,055,000 | $ | 2,244,553 | ||||||
Anchorage Alaska Schools, GO, | 1,000,000 | 1,127,750 | ||||||||
Anchorage Alaska Schools, Refunding, GO, National-RE FGIC Insured, | 580,000 | 667,940 | ||||||||
|
| |||||||||
| 4,040,243 | ||||||||||
|
| |||||||||
| ||||||||||
Arizona 2.7% | ||||||||||
Phoenix, Refunding, GO, | 1,025,000 | 1,217,106 | ||||||||
Tucson Arizona, Water System Revenue, RB, | 775,000 | 882,066 | ||||||||
|
| |||||||||
| 2,099,172 | ||||||||||
|
| |||||||||
| ||||||||||
California 16.9% | ||||||||||
Apple Valley Unified School District, California State, Refunding, GO, BAM Insured, | 425,000 | 471,006 | ||||||||
California State, Department of Water Resources, Power Supply Revenue, Refunding, RB, AGM insured, | 1,000,000 | 1,150,110 | ||||||||
California State, Various Purposes, GO, | 1,250,000 | 1,444,737 | ||||||||
Chico, Unified School District, Election 1998, GO, AGM Insured, | 1,625,000 | 1,817,790 | ||||||||
Long Beach, Unified School District, Election 2008, GO | ||||||||||
Series A, 5.25%, 08/01/24 | 525,000 | 603,341 | ||||||||
Series A, 5.25%, 08/01/25 | 1,000,000 | 1,149,220 | ||||||||
Los Angeles, Refunding, GO, | 1,000,000 | 1,173,960 | ||||||||
Los Angeles, Unified School District, Election 2004, GO, | 1,000,000 | 1,135,630 | ||||||||
Redding, Electric System Revenue, Refunding, COP, AGM Insured, | 1,000,000 | 1,125,050 | ||||||||
San Francisco City & County, Airports Commission, International Airport Revenue, Second Series, Issue 32F, Refunding, RB, National-RE FGIC Insured, | 1,000,000 | 1,197,210 | ||||||||
San Jose, Redevelopment Agency, TA, National-RE Insured, | 775,000 | 826,197 | ||||||||
| Municipal Bonds (continued) | ||||||||||
| Principal Amount | Market Value | |||||||||
| ||||||||||
California (continued) | ||||||||||
Torrance, Unified School District, Election 2008, Measure Y, GO, | $ | 775,000 | $ | 894,102 | ||||||
|
| |||||||||
| 12,988,353 | ||||||||||
|
| |||||||||
| ||||||||||
Colorado 0.6% | ||||||||||
Denver Colorado City & County School District No. 1, Refunding, GO, National-RE FGIC Insured, | 350,000 | 424,445 | ||||||||
|
| |||||||||
| ||||||||||
Connecticut 4.8% | ||||||||||
Connecticut State, GO | ||||||||||
Series D, 5.00%, 11/01/19 | 2,220,000 | 2,643,687 | ||||||||
Series F, 5.00%, 12/01/20 | 905,000 | 1,010,993 | ||||||||
|
| |||||||||
| 3,654,680 | ||||||||||
|
| |||||||||
| ||||||||||
Florida 7.6% | ||||||||||
Florida State, Board of Education, Public Education, Refunding, TA | ||||||||||
Series A, 5.00%, 06/01/18 | 525,000 | 613,909 | ||||||||
Series C, 5.00%, 06/01/19 | 525,000 | 622,781 | ||||||||
Series D, 5.00%, 06/01/22 | 2,000,000 | 2,359,640 | ||||||||
Orlando, Utilities Commission, Utility System Revenue, Refunding, RB, | 1,050,000 | 1,250,519 | ||||||||
Tampa Bay, Water Utility System Revenue and Improvement, Refunding, RB, National-RE FGIC Insured, | 830,000 | 1,020,269 | ||||||||
|
| |||||||||
| 5,867,118 | ||||||||||
|
| |||||||||
| ||||||||||
Hawaii 7.6% | ||||||||||
Hawaii State, Refunding, GO | ||||||||||
Series EA, 5.00%, 12/01/19 | 1,330,000 | 1,588,472 | ||||||||
Series EF, 5.00%, 11/01/23 | 1,140,000 | 1,342,088 | ||||||||
Honolulu City and County, Refunding, GO, | 1,080,000 | 1,221,534 | ||||||||
Honolulu City and County, Wastewater System Revenue, Refunding, RB, | 425,000 | 507,497 | ||||||||
University of Hawaii Revenue, RB | ||||||||||
Series A, 5.50%, 10/01/22 | 500,000 | 575,850 | ||||||||
Series A, 5.50%, 10/01/23 | 500,000 | 589,060 | ||||||||
|
| |||||||||
| 5,824,501 | ||||||||||
|
| |||||||||
| ||||||||||
Idaho 4.9% | ||||||||||
Idaho State, Housing & Finance Association, Grant & Revenue Anticipation, Federal Highway Trust, RB | ||||||||||
Series A, 5.00%, 07/15/22 | 580,000 | 643,481 | ||||||||
Series A, 5.25%, 07/15/24 | 1,780,000 | 1,965,156 | ||||||||
43
Statement of Investments (Continued)
January 31, 2014 (Unaudited)
Nationwide HighMark National Intermediate Tax Free Bond Fund (Continued)
| Municipal Bonds (continued) | ||||||||||
| Principal Amount | Market Value | |||||||||
| ||||||||||
Idaho (continued) | ||||||||||
Twin Falls County, School District No. 411, GO, National-RE Insured, | $ | 1,000,000 | $ | 1,117,940 | ||||||
|
| |||||||||
| 3,726,577 | ||||||||||
|
| |||||||||
| ||||||||||
Illinois 6.1% | ||||||||||
Chicago Project, Refunding, GO, AGM Insured, | 1,075,000 | 1,115,947 | ||||||||
Chicago, Board of Education, Dedicated Revenues, Refunding, Special Tax Revenue, AMBAC Insured, | 1,375,000 | 1,421,117 | ||||||||
Chicago, O’Hare International Airport Revenue, General Apartment-Third Lien, RB, AGM Insured, | 1,930,000 | 2,116,824 | ||||||||
|
| |||||||||
| 4,653,888 | ||||||||||
|
| |||||||||
| ||||||||||
Maryland 0.8% | ||||||||||
Maryland State, State & Local Facilities-3rd, GO, | 500,000 | 591,080 | ||||||||
|
| |||||||||
| ||||||||||
Massachusetts 6.5% | ||||||||||
Massachusetts State Development Finance Agency, Harvard University, Refunding, RB, | 1,620,000 | 1,952,505 | ||||||||
Massachusetts Bay Transportation Authority, Refunding, RB, | 300,000 | 363,168 | ||||||||
Massachusetts State, Bay Transportation Authority, Massachusetts Sales Tax Revenue, Refunding, RB, Senior | 600,000 | 709,332 | ||||||||
Massachusetts State, Water Resources Authority, Refunding, RB, | 415,000 | 494,460 | ||||||||
Massachusetts State, Water Resources Authority, Refunding, RB, National-RE Insured, | 1,310,000 | 1,467,829 | ||||||||
|
| |||||||||
| 4,987,294 | ||||||||||
|
| |||||||||
| ||||||||||
Minnesota 1.3% | ||||||||||
Minnesota State, GO, | 855,000 | 1,027,761 | ||||||||
|
| |||||||||
| ||||||||||
Nevada 3.8% | ||||||||||
Clark County, Limited Tax-Bond Bank, GO, | 2,620,000 | 2,939,509 | ||||||||
|
| |||||||||
| Municipal Bonds (continued) | ||||||||||
| Principal Amount | Market Value | |||||||||
| ||||||||||
New Jersey 3.7% | ||||||||||
New Jersey State, Transportation Trust Fund Authority, Refunding, RB, | ||||||||||
Series A, 5.25%, 12/15/21 | $ | 760,000 | $ | 895,364 | ||||||
Series A, 5.50%, 12/15/22 | 1,020,000 | 1,215,330 | ||||||||
New Jersey State, Transportation Trust Fund Authority, Refunding, RB, AGM Insured, | 625,000 | 733,412 | ||||||||
|
| |||||||||
| 2,844,106 | ||||||||||
|
| |||||||||
| ||||||||||
New York 4.0% | ||||||||||
New York City, GO, AGM Insured, Fiscal 2008, Sub-Series C-1, 5.00%, 10/01/24 | 1,205,000 | 1,359,252 | ||||||||
New York State, Thruway Authority Second Highway and Bridge Trust Fund, RB, | 1,075,000 | 1,230,434 | ||||||||
New York State, Thruway Authority, State Personal Transportation, Special Tax Revenue, | 430,000 | 498,598 | ||||||||
|
| |||||||||
| 3,088,284 | ||||||||||
|
| |||||||||
| ||||||||||
Oregon 2.0% |
| |||||||||
Portland, Sewer System Revenue, Second Lien, Refunding, RB, AGM Insured, | 1,360,000 | 1,547,748 | ||||||||
|
| |||||||||
| ||||||||||
Pennsylvania 2.1% | ||||||||||
Pennsylvania State, GO, | 1,050,000 | 1,203,342 | ||||||||
Pennsylvania State, Refunding, GO, | 385,000 | 441,214 | ||||||||
|
| |||||||||
| 1,644,556 | ||||||||||
|
| |||||||||
| ||||||||||
Texas 12.2% | ||||||||||
Houston, Utility System Revenue, Refunding, RB, Combined First Lien, | 1,800,000 | 2,137,608 | ||||||||
Lamar Consolidated Independent School District Schoolhouse, GO, PSF Insured, | 800,000 | 905,776 | ||||||||
Lower Colorado River Authority, Prerefunded Balance, RB | ||||||||||
5.00%, 05/15/21 | 65,000 | 76,964 | ||||||||
5.00%, 05/15/22 | 40,000 | 47,363 | ||||||||
5.00%, 05/15/23 | 15,000 | 17,761 | ||||||||
Lower Colorado River Authority, Unrefunded Balance, RB | ||||||||||
5.00%, 05/15/21 | 1,100,000 | 1,236,147 | ||||||||
5.00%, 05/15/22 | 805,000 | 893,864 | ||||||||
5.00%, 05/15/23 | 90,000 | 98,887 | ||||||||
44
Statement of Investments (Continued)
January 31, 2014 (Unaudited)
Nationwide HighMark National Intermediate Tax Free Bond Fund (Continued)
| Municipal Bonds (continued) | ||||||||||
| Principal Amount | Market Value | |||||||||
| ||||||||||
Texas (continued) | ||||||||||
North East Independent School District, Texas School Building, GO, PSF Insured, | $ | 650,000 | $ | 747,728 | ||||||
San Antonio, Water Revenue, Refunding, RB, | 500,000 | 590,405 | ||||||||
San Antonio, Water Revenue, Refunding, RB, National-RE FGIC Insured, | 1,000,000 | 1,141,700 | ||||||||
Texas State, University Systems Financing Revenue, Refunding, RB, | 1,280,000 | 1,466,944 | ||||||||
|
| |||||||||
| 9,361,147 | ||||||||||
|
| |||||||||
| ||||||||||
Virginia 1.9% | ||||||||||
Fairfax County, Public Improvements, GO, | 500,000 | 578,430 | ||||||||
Newport News, General Improvement, GO, | 785,000 | 887,254 | ||||||||
|
| |||||||||
| 1,465,684 | ||||||||||
|
| |||||||||
| ||||||||||
Washington 4.4% | ||||||||||
King & Pierce County, School District No. 408, Refunding, GO, | 1,000,000 | 1,160,160 | ||||||||
Washington State, Various Purpose, GO, | 1,425,000 | 1,609,153 | ||||||||
Washington State, Various Purpose, Refunding, GO, | 500,000 | 596,390 | ||||||||
|
| |||||||||
| 3,365,703 | ||||||||||
|
| |||||||||
Total Municipal Bonds |
| 76,141,849 | ||||||||
|
| |||||||||
| Mutual Fund 0.5% | ||||||||||
| Shares | Market Value | |||||||||
| ||||||||||
Money Market Fund 0.5% | ||||||||||
Dreyfus Tax Exempt Cash Management Fund — Institutional Shares, 0.00%† | 366,261 | 366,261 | ||||||||
|
| |||||||||
Total Mutual Fund |
| 366,261 | ||||||||
|
| |||||||||
Total Investments | $ | 76,508,110 | ||||||||
Other assets in excess of liabilities — 0.3% |
| 218,587 | ||||||||
|
| |||||||||
NET ASSETS — 100.0% | $ | 76,726,697 | ||||||||
|
| |||||||||
| † | Amount rounds to less than 0.01% |
| (a) | See notes to financial statements for tax cost and unrealized appreciation/(depreciation) of securities. |
| AGM | Assured Guaranty Municipal Corporation |
| AMBAC | American Municipal Bond Assurance Corporation |
| BAM | Build America Mutual |
| COP | Certificates of Participation |
| FGIC | Financial Guaranty Insurance Corporation |
| GO | General Obligation |
| PSF | Priority Solidarity Fund |
| RB | Revenue Bond |
| RE | Reinsured |
| TA | Tax Allocation |
The accompanying notes are an integral part of these financial statements.
45
Statement of Assets and Liabilities
January 31, 2014 (Unaudited)
| Nationwide HighMark National Intermediate Tax Free Bond Fund | ||||||
Assets: | ||||||
Investments, at value (cost $72,834,129) | $ | 76,508,110 | ||||
Interest receivable | 861,992 | |||||
Receivable for capital shares issued | 1,663 | |||||
Prepaid expenses | 24,361 | |||||
|
| |||||
Total Assets | 77,396,126 | |||||
|
| |||||
Liabilities: | ||||||
Distributions payable | 100,455 | |||||
Payable for capital shares redeemed | 486,563 | |||||
Accrued expenses and other payables: | ||||||
Investment advisory fees | 14,494 | |||||
Fund administration fees | 9,803 | |||||
Distribution fees | 7,088 | |||||
Administrative servicing fees | 7,890 | |||||
Accounting and transfer agent fees | 3,862 | |||||
Trustee fees | 1,490 | |||||
Deferred compensation (Note 2) | 6,790 | |||||
Custodian fees | 445 | |||||
Compliance program costs (Note 3) | 1,540 | |||||
Professional fees | 20,532 | |||||
Printing fees | 6,246 | |||||
Other | 2,231 | |||||
|
| |||||
Total Liabilities | 669,429 | |||||
|
| |||||
Net Assets | $ | 76,726,697 | ||||
|
| |||||
Represented by: | ||||||
Capital | $ | 72,460,982 | ||||
Accumulated distributions in excess of net investment income | (54,846 | ) | ||||
Accumulated net realized gains from investment transactions | 646,580 | |||||
Net unrealized appreciation/(depreciation) from investments | 3,673,981 | |||||
|
| |||||
Net Assets | $ | 76,726,697 | ||||
|
| |||||
46
Statement of Assets and Liabilities (Continued)
January 31, 2014 (Unaudited)
| Nationwide HighMark National Intermediate Tax Free Bond Fund | ||||||
Net Assets: | ||||||
Class A Shares | $ | 16,329,577 | ||||
Class C Shares | 5,480,373 | |||||
Institutional Service Class Shares | 54,906,509 | |||||
Institutional Class Shares | 10,238 | |||||
|
| |||||
Total | $ | 76,726,697 | ||||
|
| |||||
Shares Outstanding (unlimited number of shares authorized): | ||||||
Class A Shares | 1,439,664 | |||||
Class C Shares | 482,566 | |||||
Institutional Service Class Shares | 4,837,924 | |||||
Institutional Class Shares | 902 | |||||
|
| |||||
Total | 6,761,056 | |||||
|
| |||||
Net asset value and redemption price per share (Net assets by class divided by shares outstanding by class, respectively): | ||||||
Class A Shares (a) | $ | 11.34 | ||||
Class C Shares (b) | $ | 11.36 | ||||
Institutional Service Class Shares | $ | 11.35 | ||||
Institutional Class Shares | $ | 11.35 | ||||
Maximum offering price per share (100%/(100%-maximum sales charge) of net asset value adjusted to the nearest cent): | ||||||
Class A Shares | $ | 11.60 | ||||
|
| |||||
Maximum Sales Charge: | ||||||
Class A Shares | 2.25 | % | ||||
|
| |||||
| (a) | For Class A Shares, the redemption price per share is reduced by 0.75% on sales of shares of original purchases of $500,000 or more or that were not subject to a front-end sales charge made within 18 months of the purchase date. |
| (b) | For Class C Shares, the redemption price per share is reduced by 1.00% for shares held less than 1 year. |
The accompanying notes are an integral part of these financial statements.
47
Statement of Operations
For the Six Months Ended January 31, 2014 (Unaudited)
| Nationwide HighMark National Intermediate Tax Free Bond Fund | ||||||
INVESTMENT INCOME: | ||||||
Interest income | $ | 1,285,075 | ||||
|
| |||||
Total Income | 1,285,075 | |||||
|
| |||||
EXPENSES: | ||||||
Investment advisory fees | 209,082 | |||||
Fund administration fees | 59,619 | |||||
Distribution fees Class A | 21,914 | |||||
Distribution fees Class C | 23,830 | |||||
Administrative servicing fees Class A | 8,667 | |||||
Administrative servicing fees Institutional Service Class (a) | 30,500 | |||||
Registration and filing fees | 20,250 | |||||
Professional fees | 22,284 | |||||
Printing fees | 9,485 | |||||
Trustee fees | 1,762 | |||||
Custodian fees | 1,845 | |||||
Accounting and transfer agent fees | 8,652 | |||||
Compliance program costs (Note 3) | 1,735 | |||||
Other | 9,464 | |||||
|
| |||||
Total expenses before earnings credit, fees waived, and expenses reimbursed | 429,089 | |||||
|
| |||||
Earnings credit (Note 4) | (74 | ) | ||||
Administrative servicing fees voluntarily waived – Class A (Note 3) | (4,284 | ) | ||||
Administrative servicing fees voluntarily waived – Institutional Service Class (a) (Note 3) | (15,565 | ) | ||||
Expenses reimbursed by adviser (Note 3) | (147,705 | ) | ||||
|
| |||||
Net Expenses | 261,461 | |||||
|
| |||||
NET INVESTMENT INCOME | 1,023,614 | |||||
|
| |||||
REALIZED/UNREALIZED GAINS (LOSSES) FROM INVESTMENTS: | ||||||
Net realized gains from investment transactions | 714,223 | |||||
Net change in unrealized appreciation/(depreciation) from investments | 272,369 | |||||
|
| |||||
Net realized/unrealized gains from investments | 986,592 | |||||
|
| |||||
CHANGE IN NET ASSETS RESULTING FROM OPERATIONS | $ | 2,010,206 | ||||
|
| |||||
| (a) | Effective September 16, 2013, Fiduciary Shares were renamed Institutional Service Class Shares. |
The accompanying notes are an integral part of these financial statements.
48
Statements of Changes in Net Assets
| Nationwide HighMark National Intermediate Tax Free Bond Fund | ||||||||||||
| Six Months Ended January 31, 2014 (Unaudited) | Year Ended July 31, 2013 | |||||||||||
Operations: | ||||||||||||
Net investment income | $ | 1,023,614 | $ | 2,472,643 | ||||||||
Net realized gains from investment transactions | 714,223 | 828,693 | ||||||||||
Net change in unrealized appreciation/(depreciation) from investments | 272,369 | (4,224,048 | ) | |||||||||
|
|
|
| |||||||||
Change in net assets resulting from operations | 2,010,206 | (922,712 | ) | |||||||||
|
|
|
| |||||||||
Distributions to Shareholders From: | ||||||||||||
Net investment income: | ||||||||||||
Class A | (213,252 | ) | (449,232 | ) | ||||||||
Class C | (63,138 | ) | (160,274 | ) | ||||||||
Institutional Service Class (a) | (803,395 | ) | (1,887,503 | ) | ||||||||
Institutional Class | (103 | )(b) | – | |||||||||
Net realized gains: | ||||||||||||
Class A | (173,393 | ) | (75,784 | ) | ||||||||
Class C | (58,083 | ) | (29,953 | ) | ||||||||
Institutional Service Class (a) | (567,480 | ) | (257,137 | ) | ||||||||
Institutional Class | (100 | )(b) | – | |||||||||
|
|
|
| |||||||||
Change in net assets from shareholder distributions | (1,878,944 | ) | (2,859,883 | ) | ||||||||
|
|
|
| |||||||||
Change in net assets from capital transactions | (11,720,352 | ) | (8,059,890 | ) | ||||||||
|
|
|
| |||||||||
Change in net assets | (11,589,090 | ) | (11,842,485 | ) | ||||||||
|
|
|
| |||||||||
Net Assets: | ||||||||||||
Beginning of period | 88,315,787 | 100,158,272 | ||||||||||
|
|
|
| |||||||||
End of period | $ | 76,726,697 | $ | 88,315,787 | ||||||||
|
|
|
| |||||||||
Accumulated undistributed (distributions in excess of) net investment income at end of period | $ | (54,846 | ) | $ | 1,428 | |||||||
|
|
|
| |||||||||
CAPITAL TRANSACTIONS: | ||||||||||||
Class A Shares | ||||||||||||
Proceeds from shares issued | $ | 4,048,809 | $ | 8,288,589 | ||||||||
Dividends reinvested | 251,213 | 314,655 | ||||||||||
Cost of shares redeemed | (5,913,604 | ) | (8,904,688 | ) | ||||||||
|
|
|
| |||||||||
Total Class A Shares | (1,613,582 | ) | (301,444 | ) | ||||||||
|
|
|
| |||||||||
Class C Shares | ||||||||||||
Proceeds from shares issued | 212,001 | 2,009,124 | ||||||||||
Dividends reinvested | 111,436 | 152,335 | ||||||||||
Cost of shares redeemed | (2,083,124 | ) | (2,602,230 | ) | ||||||||
|
|
|
| |||||||||
Total Class C Shares | (1,759,687 | ) | (440,771 | ) | ||||||||
|
|
|
| |||||||||
| (a) | Effective September 16, 2013, Fiduciary Shares were renamed Institutional Service Class Shares. |
| (b) | For the period from September 19, 2013 (commencement of operations) through January 31, 2014. |
49
Statements of Changes in Net Assets (Continued)
| Nationwide HighMark National Intermediate Tax Free Bond Fund | ||||||||||||
| Six Months Ended January 31, 2014 (Unaudited) | Year Ended July 31, 2013 | |||||||||||
CAPITAL TRANSACTIONS: (continued) | ||||||||||||
Institutional Service Class Shares (a) | ||||||||||||
Proceeds from shares issued | $ | 2,227,580 | $ | 12,657,301 | ||||||||
Dividends reinvested | 670,414 | 686,042 | ||||||||||
Cost of shares redeemed | (11,255,280 | ) | (20,661,018 | ) | ||||||||
|
|
|
| |||||||||
Total Institutional Service Class Shares | (8,357,286 | ) | (7,317,675 | ) | ||||||||
|
|
|
| |||||||||
Institutional Class Shares | ||||||||||||
Proceeds from shares issued | 10,000 | (b) | – | |||||||||
Dividends reinvested | 203 | (b) | – | |||||||||
Cost of shares redeemed | – | (b) | – | |||||||||
|
|
|
| |||||||||
Total Institutional Class Shares | 10,203 | (b) | – | |||||||||
|
|
|
| |||||||||
Change in net assets from capital transactions | $ | (11,720,352 | ) | $ | (8,059,890 | ) | ||||||
|
|
|
| |||||||||
SHARE TRANSACTIONS: | ||||||||||||
Class A Shares | ||||||||||||
Issued | 358,813 | 714,223 | ||||||||||
Reinvested | 22,266 | 26,898 | ||||||||||
Redeemed | (524,040 | ) | (767,467 | ) | ||||||||
|
|
|
| |||||||||
Total Class A Shares | (142,961 | ) | (26,346 | ) | ||||||||
|
|
|
| |||||||||
Class C Shares | ||||||||||||
Issued | 18,784 | 171,146 | ||||||||||
Reinvested | 9,868 | 13,017 | ||||||||||
Redeemed | (183,975 | ) | (223,034 | ) | ||||||||
|
|
|
| |||||||||
Total Class C Shares | (155,323 | ) | (38,871 | ) | ||||||||
|
|
|
| |||||||||
Institutional Service Class Shares (a) | ||||||||||||
Issued | 196,889 | 1,077,972 | ||||||||||
Reinvested | 59,500 | 58,586 | ||||||||||
Redeemed | (995,324 | ) | (1,774,237 | ) | ||||||||
|
|
|
| |||||||||
Total Institutional Service Class Shares | (738,935 | ) | (637,679 | ) | ||||||||
|
|
|
| |||||||||
Institutional Class Shares | ||||||||||||
Issued | 884 | (b) | – | |||||||||
Reinvested | 18 | (b) | – | |||||||||
Redeemed | – | (b) | – | |||||||||
|
|
|
| |||||||||
Total Institutional Class Shares | 902 | (b) | – | |||||||||
|
|
|
| |||||||||
Total change in shares | (1,036,317 | ) | (702,896 | ) | ||||||||
|
|
|
| |||||||||
Amounts designated as “–” are zero or have been rounded to zero.
| (a) | Effective September 16, 2013, Fiduciary Shares were renamed Institutional Service Class Shares. |
| (b) | For the period from September 19, 2013 (commencement of operations) through January 31, 2014. |
The accompanying notes are an integral part of these financial statements.
50
Financial Highlights
Selected data for each share of capital outstanding throughout the periods indicated
Nationwide HighMark National Intermediate Tax Free Bond Fund
| Operations | Distributions | Ratios/Supplemental Data | ||||||||||||||||||||||||||||||||||||||||||||||||||||||
| Net Asset Value, Beginning of Period | Net Investment Income | Net Realized and Unrealized Gains (Losses) from Investments | Total from Operations | Net Investment Income | Net Realized Gains | Total Distributions | Net Asset Value, End of Period | Total Return (a)(b) | Net Assets at End of Period | Ratio of Net Assets (c) | Ratio of Net Investment Income to Average Net Assets (c) | Ratio of Expenses (Prior to Reimbursements) to Average Net Assets (c)(d) | Portfolio Turnover (e) | |||||||||||||||||||||||||||||||||||||||||||
| Class A Shares | ||||||||||||||||||||||||||||||||||||||||||||||||||||||||
Six Months Ended January 31, 2014 (f) (Unaudited) | $ | 11.32 | 0.13 | 0.14 | 0.27 | (0.14 | ) | (0.11 | ) | (0.25 | ) | $ | 11.34 | 2.43% | $ | 16,329,577 | 0.77% | 2.30% | 1.17% | 8.65% | ||||||||||||||||||||||||||||||||||||
Year Ended July 31, 2013 (f) | $ | 11.78 | 0.28 | (0.42 | ) | (0.14 | ) | (0.28 | ) | (0.04 | ) | (0.32 | ) | $ | 11.32 | (1.23% | ) | $ | 17,914,754 | 0.77% | 2.37% | 1.32% | 27.00% | |||||||||||||||||||||||||||||||||
Year Ended July 31, 2012 (f) | $ | 11.42 | 0.28 | 0.36 | 0.64 | (0.28 | ) | – | (0.28 | ) | $ | 11.78 | 5.70% | $ | 18,949,616 | 0.77% | 2.46% | 1.33% | 20.00% | |||||||||||||||||||||||||||||||||||||
Year Ended July 31, 2011 (f) | $ | 11.48 | 0.29 | (0.06 | ) | 0.23 | (0.29 | ) | – | (0.29 | ) | $ | 11.42 | 2.08% | $ | 23,674,401 | 0.77% | 2.56% | 1.33% | 22.00% | ||||||||||||||||||||||||||||||||||||
Year Ended July 31, 2010 (f) | $ | 11.20 | 0.31 | 0.28 | 0.59 | (0.31 | ) | – | (0.31 | ) | $ | 11.48 | 5.33% | $ | 22,334,709 | 0.76% | 2.74% | 1.32% | 14.00% | |||||||||||||||||||||||||||||||||||||
Year Ended July 31, 2009 (f) | $ | 10.95 | 0.34 | 0.26 | 0.60 | (0.34 | ) | (0.01 | ) | (0.35 | ) | $ | 11.20 | 5.60% | $ | 19,284,524 | 0.69% | 3.10% | 1.33% | 35.00% | ||||||||||||||||||||||||||||||||||||
| Class C Shares | ||||||||||||||||||||||||||||||||||||||||||||||||||||||||
Six Months Ended January 31, 2014 (f) (Unaudited) | $ | 11.33 | 0.11 | 0.14 | 0.25 | (0.11 | ) | (0.11 | ) | (0.22 | ) | $ | 11.36 | 2.28% | $ | 5,480,373 | 1.22% | 1.86% | 1.58% | 8.65% | ||||||||||||||||||||||||||||||||||||
Year Ended July 31, 2013 (f) | $ | 11.79 | 0.23 | (0.42 | ) | (0.19 | ) | (0.23 | ) | (0.04 | ) | (0.27 | ) | $ | 11.33 | (1.68% | ) | $ | 7,230,375 | 1.22% | 1.92% | 1.57% | 27.00% | |||||||||||||||||||||||||||||||||
Year Ended July 31, 2012 (f) | $ | 11.43 | 0.23 | 0.36 | 0.59 | (0.23 | ) | – | (0.23 | ) | $ | 11.79 | 5.22% | $ | 7,978,232 | 1.22% | 2.01% | 1.58% | 20.00% | |||||||||||||||||||||||||||||||||||||
Year Ended July 31, 2011 (f) | $ | 11.49 | 0.24 | (0.06 | ) | 0.18 | (0.24 | ) | – | (0.24 | ) | $ | 11.43 | 1.71% | $ | 4,161,043 | 1.22% | 2.11% | 1.58% | 22.00% | ||||||||||||||||||||||||||||||||||||
Period Ended July 31, 2010 (f)(g) | $ | 11.40 | 0.17 | 0.20 | 0.37 | (0.28 | ) | – | (0.28 | ) | $ | 11.49 | 2.25% | $ | 2,362,903 | 1.21% | 2.29% | 1.57% | 14.00% | |||||||||||||||||||||||||||||||||||||
Period Ended July 31, 2008 (f)(h) | $ | 11.05 | 0.06 | 0.07 | 0.13 | (0.06 | ) | – | (0.06 | ) | $ | 11.12 | 1.16% | $ | – | 0.97% | 3.01% | 1.43% | 19.00% | (i) | ||||||||||||||||||||||||||||||||||||
Year Ended July 31, 2007 (f) | $ | 11.12 | 0.36 | (0.05 | ) | 0.31 | (0.35 | ) | (0.04 | ) | (0.39 | ) | $ | 11.05 | 2.86% | $ | 6,089 | 0.97% | 3.22% | 1.55% | 4.00% | |||||||||||||||||||||||||||||||||||
Year Ended July 31, 2006 (f) | $ | 11.44 | 0.37 | (0.23 | ) | 0.14 | (0.37 | ) | (0.09 | ) | (0.46 | ) | $ | 11.12 | 1.24% | $ | 25,170 | 1.00% | 3.27% | 1.51% | 7.00% | |||||||||||||||||||||||||||||||||||
| Institutional Service Class Shares (j) | ||||||||||||||||||||||||||||||||||||||||||||||||||||||||
Six Months Ended January 31, 2014 (f) (Unaudited) | $ | 11.33 | 0.15 | 0.13 | 0.28 | (0.15 | ) | (0.11 | ) | (0.26 | ) | $ | 11.35 | 2.56% | $ | 54,906,509 | 0.52% | 2.55% | 0.93% | 8.65% | ||||||||||||||||||||||||||||||||||||
Year Ended July 31, 2013 (f) | $ | 11.78 | 0.31 | (0.41 | ) | (0.10 | ) | (0.31 | ) | (0.04 | ) | (0.35 | ) | $ | 11.33 | (0.89% | ) | $ | 63,170,658 | 0.52% | 2.62% | 1.07% | 27.00% | |||||||||||||||||||||||||||||||||
Year Ended July 31, 2012 (f) | $ | 11.43 | 0.31 | 0.35 | 0.66 | (0.31 | ) | – | (0.31 | ) | $ | 11.78 | 5.87% | $ | 73,230,424 | 0.52% | 2.71% | 1.08% | 20.00% | |||||||||||||||||||||||||||||||||||||
Year Ended July 31, 2011 (f) | $ | 11.48 | 0.32 | (0.05 | ) | 0.27 | (0.32 | ) | – | (0.32 | ) | $ | 11.43 | 2.43% | $ | 79,902,327 | 0.52% | 2.81% | 1.08% | 22.00% | ||||||||||||||||||||||||||||||||||||
Year Ended July 31, 2010 (f) | $ | 11.20 | 0.34 | 0.28 | 0.62 | (0.34 | ) | – | (0.34 | ) | $ | 11.48 | 5.60% | $ | 81,120,621 | 0.51% | 2.99% | 1.07% | 14.00% | |||||||||||||||||||||||||||||||||||||
Year Ended July 31, 2009 (f) | $ | 10.95 | 0.37 | 0.26 | 0.63 | (0.37 | ) | (0.01 | ) | (0.38 | ) | $ | 11.20 | 5.85% | $ | 75,000,071 | 0.44% | 3.35% | 1.08% | 35.00% | ||||||||||||||||||||||||||||||||||||
| Institutional Class Shares | ||||||||||||||||||||||||||||||||||||||||||||||||||||||||
Period Ended January 31, 2014 (f)(k) (Unaudited) | $ | 11.31 | 0.11 | 0.16 | 0.27 | (0.12 | ) | (0.11 | ) | (0.23 | ) | $ | 11.35 | 2.40% | $ | 10,238 | 0.47% | 2.56% | 0.79% | 8.65% | ||||||||||||||||||||||||||||||||||||
Amounts designated as “–” are zero or have been rounded to zero.
| (a) | Excludes sales charge. |
| (b) | Not annualized for periods less than one year. |
| (c) | Annualized for periods less than one year. |
| (d) | During the period, certain fees may have been waived and/or reimbursed. If such waivers/reimbursements had not occurred, the ratios would have been as indicated. |
| (e) | Portfolio turnover is calculated on the basis of the Fund as a whole without distinguishing among the classes of shares. |
| (f) | Per share calculations were performed using average shares method. |
| (g) | Class C Shares resumed operations on December 4, 2009, with a beginning Net Asset Value per share of $11.40 |
| (h) | The information presented for the period from August 1, 2007 through September 27, 2007. Class C Shares closed on September 27, 2007. The ending net asset value reflects the price which final redemptions were paid. |
| (i) | Portfolio turnover rate based on one year data. |
| (j) | Effective September 16, 2013, Fiduciary Shares were renamed Institutional Service Class Shares. |
| (k) | For the period from September 19, 2013 (commencement of operations) through January 31, 2014. Total return is calculated based on inception date of September 18, 2013 through January 31, 2014. |
The accompanying notes are an integral part of these financial statements.
51
| Fund Commentary | Nationwide HighMark Short Term Bond Fund |
For the semiannual period ended January 31, 2014, the Nationwide HighMark Short Term Bond Fund (Institutional Service Class) returned 0.86%* versus 0.55% for its benchmark, the Barclays U.S. 1-3 Year Government/Credit Bond Index. For broader comparison, the median return for the Fund’s closest Lipper peer category of Short Investment Grade Debt Funds (consisting of 293 funds as of January 31, 2014) was 0.91% for the same time period.
| * | Performance prior to the Fund’s inception on September 16, 2013, is based on the performance of the Fund’s predecessor fund. |
Market Environment
The fixed-income markets were volatile during the reporting period due to uncertainty about fiscal and monetary policy, particularly regarding the future of the Federal Reserve’s bond purchase program. After months of hints from the Fed that it would begin to moderate its monthly bond purchases, the Fed ultimately decided at the September 2013 Federal Open Market Committee (FOMC) meeting not to make any changes. Since Treasury rates had risen more than 100 basis points on the expectation that monetary policy was about to be tightened, this came as a surprise to the markets, and interest rates reversed course and began falling. Treasury yields, which reached two-year highs in early September, fell rapidly as investors reassessed the timing of the Fed’s exit, reaching the period low in late October. Equities, high-yield bonds and emerging markets, having sold off in anticipation of reduced support from the central bank, also began substantial recoveries. It wasn’t long, however, until indications of firmer economic growth began to cause interest rates to rise once more. In addition, after a politically damaging government shutdown in October, the U.S. Congress managed to quickly pass a budget agreement in December 2013 to avoid another government shutdown. The resulting federal budget agreement is expected to have a slightly less negative impact on gross domestic product (GDP) in 2014, although the federal debt ceiling will need to be raised again, perhaps as soon as March, providing another potential flashpoint. On December 18, 2013, the FOMC finally took the first step toward ending the Fed’s bond purchases,
deciding to “modestly reduce the pace of its asset purchases” from $85 billion per month to $75 billion, marking the beginning of the end of this previously unlimited program.
The Fed’s decision to scale back its bond purchases, along with stronger job growth, caused interest rates to begin rising once again in November 2013. Although the 10-year Treasury yield traded between 2.5% and 3.0% during the reporting period, most Treasury yields ended the reporting period at about the same level at which they began. The most significant changes occurred in the intermediate portion of the yield curve (a plotted graph line of the yields, or interest rates, on long-term and short-term maturity bonds), but even there rates increased only 10 to 12 basis points for the reporting period. Short-term Treasury bills fell by a few basis points during the reporting period and continue to be anchored by the Fed’s commitment to keep the federal funds rate unchanged until the labor market shows substantial improvement. While the yield on the two-year Treasury climbed 2 basis points, the 10-year yield increased 7 basis points, and the 30-year bond yield declined 4 basis points during the reporting period.
Portfolio Performance
Risk assets staged a strong rally during the reporting period as improving U.S. economic data and solid company earnings, along with improved market sentiment and the continued search for yield, boosted market valuations. Corporate bond spreads for the 1- to 3-year sector ended the period at 69 basis points, the tightest level since July 2007.
The Fund outperformed the benchmark index during the reporting period primarily as a result of the Fund’s overweight to corporate bonds, which outperformed Treasurys by 74 basis points. Individual issuers that contributed positively to Fund performance during the reporting period included Sequoia Mortgage Trust, El Paso Natural Gas, Rio Tinto, Petrohawk Energy and Bank of New York, while issues that detracted from Fund performance included Verizon, BP Capital, Oracle, Merck and Bank of America. Duration positioning was a neutral factor during the reporting period
52
| Fund Commentary (cont’d) | Nationwide HighMark Short Term Bond Fund |
as interest rates were little changed; however, rates increased 11 basis points in the 5-year area of the yield curve, which had a slightly negative impact on Fund performance.
Agency mortgage-backed securities rose during the period as option-adjusted spreads narrowed by 18 basis points. Agency mortgage spreads remained below long-term averages, supported by the Fed’s low-interest-rate policy and agency mortgage bond-buying mandate. The volume of mortgages issued at these low rates has kept the duration of the mortgage index near the longest in its history, 5.6 years at period end. The Fed continues to reinvest principal and interest payments from its existing portfolio into agency mortgage-backed securities in addition to those purchased under the quantitative easing (QE) program.
Outlook and Positioning
Our near-term outlook is for a gradual improvement in economic growth to put modest upward pressure on Treasury yields beyond two-year maturities. Short-term rates, however, are likely to continue to be anchored by the Fed’s commitment to “a highly accommodative stance of monetary policy…for a considerable time after the asset purchase program ends and the economic recovery strengthens.” Despite the announced reduction in bond purchases, the Fed continues to emphasize that there is no predetermined path for asset purchases and that future decisions regarding the pace remain dependent upon the Fed’s outlook for the labor market and inflation. Corporate bonds should continue to perform well in this environment as the economy slowly improves, valuations remain relatively attractive and the Fed continues to be supportive.
Subadviser:
HighMark Capital Management, Inc.
Portfolio Managers:
Jeffrey Klein, Gregory Lugosi,
E. Jack Montgomery and David Wines
The Fund is subject to the risks of investing in fixed-income securities, including high-yield bonds (which are more volatile and at a greater risk of default). The Fund may invest in more-aggressive investments such as foreign securities (which are volatile, harder to price and less liquid than U.S. securities). Please refer to the summary prospectus for a more detailed explanation of the Fund’s principal risks.
A description of the benchmarks can be found on the Market Index Definitions page at the back of this book.
53
| Fund Overview (Unaudited) | Nationwide HighMark Short Term Bond Fund |
Objective
The Fund seeks total return through investments in fixed-income securities.
Highlights
| Ÿ | For the semiannual period ended January 31, 2014, the Nationwide HighMark Short Term Bond Fund (Institutional Service Class) returned 0.86%, outperforming the benchmark by 0.31% and underperforming the Lipper peer category by 0.05%. |
| Ÿ | The Fed’s decision to scale back its bond purchases, along with stronger job growth, caused interest rates to begin rising once again in November 2013. |
| Ÿ | Our near-term outlook is for a gradual improvement in economic growth to put modest upward pressure on Treasury yields beyond two-year maturities. |
Asset Allocation†
| Corporate Bonds | 59.2% | |||
| Asset-Backed Securities | 13.0% | |||
| U.S. Government Mortgage Backed Agencies | 11.3% | |||
| U.S. Treasury Note | 6.2% | |||
| Commercial Mortgage Backed Securities | 5.6% | |||
| Mutual Fund | 4.3% | |||
| Collateralized Mortgage Obligations | 1.7% | |||
| Sovereign Bond | 0.4% | |||
| Bank Loan | 0.3% | |||
| Liabilities in excess of other assets | (2.0)% | |||
| 100.0% |
Top Industries††
| Diversified Financial Services | 9.3% | |||
| Commercial Banks | 9.0% | |||
| Automobiles | 7.7% | |||
| Oil, Gas & Consumable Fuels | 5.4% | |||
| Pharmaceuticals | 5.1% | |||
| Consumer Finance | 4.5% | |||
| Health Care Providers & Services | 3.1% | |||
| Credit Card | 2.9% | |||
| Biotechnology | 2.4% | |||
| Diversified Telecommunication Services | 2.0% | |||
| Other Industries | 48.6% | |||
| 100.0% |
Top Holdings††
| U.S. Treasury Note, 0.88%, 09/15/16 | 6.1% | |||
| Fidelity Institutional Money Market Fund — Institutional Class | 4.2% | |||
| CARDS Trust, 0.61%, 09/15/17 | 1.7% | |||
| Morgan Stanley Bank of America Merrill Lynch Trust, 1.31%, 08/15/46 | 1.6% | |||
| General Electric Capital Corp., 2.30%, 04/27/17 | 1.5% | |||
| Walgreen Co., 1.80%, 09/15/17 | 1.5% | |||
| BP Capital Markets PLC, 0.88%, 09/26/18 | 1.5% | |||
| Pfizer, Inc., 0.90%, 01/15/17 | 1.5% | |||
| Citigroup, Inc., 1.75%, 05/01/18 | 1.4% | |||
| Oracle Corp., 0.82%, 01/15/19 | 1.4% | |||
| Other Holdings | 77.6% | |||
| 100.0% |
| † | Percentages indicated are based upon net assets as of January 31, 2014. |
| †† | Percentages indicated are based upon total investments as of January 31, 2014. |
54
| Fund Performance | Nationwide HighMark Short Term Bond Fund |
Average Annual Total Return
(For periods ended January 31, 2014)
| Six Months* | 1 Yr. | 5 Yr. | ||||||||||||
| Class A | w/o SC1 | 0.74% | 0.32% | 2.51% | ||||||||||
| w/ SC2 | (1.53)% | (1.92)% | 2.04% | |||||||||||
| Class C | w/o SC1 | 0.50% | (0.05)% | 2.07% | ||||||||||
| w/ SC3 | (0.50)% | (1.05)% | 2.07% | |||||||||||
| Institutional Service Class4,5 | w/o SC | 0.86% | 0.67% | 2.80% | ||||||||||
| Institutional Class4 | w/o SC | 0.79% | 6 | — | — | |||||||||
All figures showing the effect of a sales charge (SC) reflect the maximum charge possible, because it has the most significant effect on performance data.
| * | Not annualized. |
| 1 | These returns do not reflect the effects of SCs. |
| 2 | A 2.25% front-end sales charge was deducted. Prior to December 1, 2005, the front-end sales charge was 3.25%. |
| 3 | A 1.00% CDSC was deducted from the one year return because it is charged when you sell Class C shares within the first year after purchase. |
| 4 | Not subject to any SCs. |
| 5 | Effective September 16, 2013 Fiduciary Shares were renamed Institutional Service Class Shares. |
| 6 | Since inception date of September 18, 2013. Not Annualized. |
Expense Ratios
| Gross Expense Ratio* | Net Expense Ratio* | |||||||
| Class A | 1.06% | 0.85% | ||||||
| Class C | 1.31% | 1.30% | ||||||
| Institutional Service Class | 0.81% | 0.60% | ||||||
| Institutional Class | 0.56% | 0.55% | ||||||
| * | Current effective prospectus dated September 16, 2013. The difference between gross and net operating expenses reflects contractual waivers in place through November 30, 2015. Please see the Fund's most recent prospectus for details. |
55
| Fund Performance | Nationwide HighMark Short Term Bond Fund |
Performance of a $10,000 Investment
Investment return and principal value will fluctuate, and when redeemed, shares may be worth more or less than original cost. Past performance is no guarantee of future results and does not reflect the deduction of taxes that a shareholder would pay on fund distributions or the redemption of fund shares. Investing in mutual funds involves market risk, including loss of principal. Performance returns assume the reinvestment of all distributions.
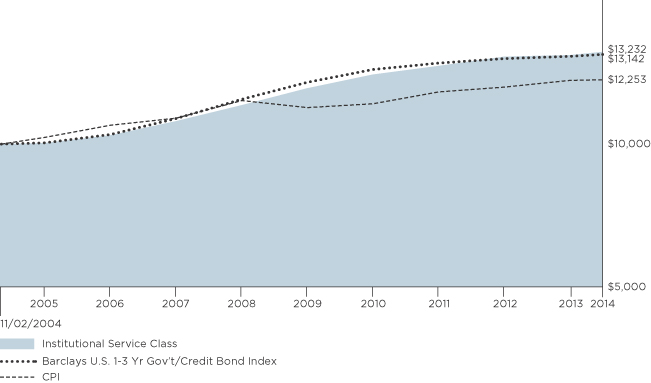
Comparative performance of $10,000 invested in Institutional Service Class shares of the Nationwide HighMark Short Term Bond Fund since inception* through 1/31/14 versus the Barclays U.S. 1-3 Year Government/Credit Bond Index and the Consumer Price Index (CPI) for the same period. Fund performance prior to the Fund’s inception on 9/16/13 is based on the Fund’s predecessor Fund. Unlike the Fund, the performance for these unmanaged indexes does not reflect any fees, expenses, or sales charges. One cannot invest directly in a market index. A description of the benchmarks can be found on the Market Index Definitions page at the back of this book.
*The inception date for the Nationwide HighMark Short Term Bond Fund is 9/16/13. Performance prior to that date is based on the since-inception performance of the Fund’s predecessor fund.
56
| Shareholder Expense Example | Nationwide HighMark Short Term Bond Fund |
As a shareholder of the Fund, you incur two types of costs: (1) transaction costs, including sales charges (loads) paid on purchase payments and redemption fees; and (2) ongoing costs, including investment advisory fees, administration fees, distribution fees and other Fund expenses. The examples below are intended to help you understand your ongoing costs (in dollars) of investing in the Fund and to compare these costs with the ongoing costs of investing in other mutual funds. Per Securities and Exchange Commission (“SEC”) requirements, the examples assume that you had a $1,000 investment in the Class at the beginning of the reporting period (August 1, 2013) and continued to hold your shares at the end of the reporting period (January 31, 2014).
Actual Expenses
For each Class of the Fund in the table below, the first line provides information about actual account values and actual expenses. You may use the information in this line, together with the amount you invested, to estimate the expenses that you paid from August 1, 2013 through January 31, 2014. Simply divide your account value by $1,000 (for example, an $8,600 account value divided by $1,000 = 8.6), then multiply the result by the number in the first line of each Class under the heading entitled “Expenses Paid During Period” to estimate the expenses you paid on your account during this period.
Hypothetical Expenses for Comparison Purposes
The second line of each Class in the table below provides information about hypothetical account values and hypothetical expenses based on the Class’ actual expense ratio and an assumed rate of return of 5% per year before expenses, which is not the Class’ actual return. The hypothetical account values and expenses may not be used to estimate the actual ending account balance or expenses you paid for the period from August 1, 2013 through January 31, 2014. You may use this information to compare the ongoing costs of investing in the Class of the Fund and other funds. To do so, compare this 5% hypothetical example with the 5% hypothetical examples that appear in the shareholder reports of the other funds.
Please note that the expenses shown in the table are meant to highlight your ongoing costs only and do not reflect any transaction costs, such as sales charges (loads) or redemption fees. If these transaction costs were included, your costs would have been higher. Therefore, the second line for each Class in the table is useful in comparing ongoing costs only, and will not help you determine the relative total costs of owning different funds. The examples also assume all dividends and distributions are reinvested.
Schedule of Shareholder Expenses
Expense Analysis of a $1,000 Investment
Nationwide HighMark Short Term Bond Fund January 31, 2014 | Beginning Account Value ($) 08/01/13 | Ending Account Value ($) 01/31/14 | Expenses Paid During Period ($) 08/01/13 -01/31/14 | Expense Ratio During Period (%) 08/01/13 - 01/31/14 | ||||||||
| Class A Shares | Actual | a | 1,000.00 | 1,007.40 | 4.20 | 0.83 | ||||||
| Hypotheticala,b | 1,000.00 | 1,021.02 | 4.23 | 0.83 | ||||||||
| Class C Shares | Actual | a | 1,000.00 | 1,005.00 | 6.47 | 1.28 | ||||||
| Hypotheticala,b | 1,000.00 | 1,018.75 | 6.51 | 1.28 | ||||||||
| Institutional Service Class Sharesc | Actual | a | 1,000.00 | 1,008.60 | 2.94 | 0.58 | ||||||
| Hypotheticala,b | 1,000.00 | 1,022.28 | 2.96 | 0.58 | ||||||||
| Institutional Class Shares | Actual | d | 1,000.00 | 1,007.90 | 1.93 | 0.52 | ||||||
| Hypotheticala,b | 1,000.00 | 1,022.58 | 2.65 | 0.52 | ||||||||
| a | Expenses are equal to the Fund’s annualized expense ratio multiplied by the average account value from August 1, 2013 through January 31, 2014 multiplied to reflect one-half year period. The expense ratio presented represents a six-month, annualized ratio in accordance with Securities and Exchange Commission guidelines. |
| b | Represents the hypothetical 5% return before expenses. |
| c | Effective September 16, 2013, Fiduciary Shares were renamed Institutional Service Class Shares. |
| d | Actual expenses are equal to the Fund’s annualized expense ratio multiplied by the average account value from September 19, 2013 through January 31, 2014 to reflect the period from commencement of operations. |
57
Statement of Investments
January 31, 2014 (Unaudited)
Nationwide HighMark Short Term Bond Fund
| Asset-Backed Securities 13.0% | ||||||||||
| Principal Amount | Market Value | |||||||||
| ||||||||||
Auto Floor Plan 0.1% |
| |||||||||
Ally Master Owner Trust, | $ | 300,000 | $ | 301,668 | ||||||
|
| |||||||||
| ||||||||||
Automobiles 6.8% |
| |||||||||
Ally Auto Receivables Trust, | 2,720,000 | 2,722,820 | ||||||||
ARI Fleet Lease Trust, | 1,050,593 | 1,049,979 | ||||||||
Avis Budget Rental Car Funding AESOP LLC, | 750,000 | 757,546 | ||||||||
Enterprise Fleet Financing LLC, | 1,978,374 | 1,979,496 | ||||||||
Ford Credit Auto Owner Trust, | 816,048 | 817,806 | ||||||||
Hertz Vehicle Financing LLC, | 1,400,000 | 1,418,467 | ||||||||
Honda Auto Receivables Owner Trust, | 1,536,384 | 1,539,639 | ||||||||
Toyota Auto Receivables Owner Trust, | 2,000,000 | 2,000,555 | ||||||||
World Omni Auto Receivables Trust, | 1,351,447 | 1,359,443 | ||||||||
|
| |||||||||
| 13,645,751 | ||||||||||
| ||||||||||
Credit Card 3.0% |
| |||||||||
American Express Credit Account Secured Note Trust, | 2,500,000 | 2,494,428 | ||||||||
CARDS Trust, | 3,500,000 | 3,504,733 | ||||||||
|
| |||||||||
| 5,999,161 | ||||||||||
| ||||||||||
Electric Utilities 0.9% |
| |||||||||
AEP Texas Central Transition Funding LLC, | 1,740,066 | 1,739,392 | ||||||||
|
| |||||||||
Other 0.9% |
| |||||||||
CAL Funding Ltd., | 875,000 | 869,395 | ||||||||
| Asset-Backed Securities (continued) | ||||||||||
| Principal Amount | Market Value | |||||||||
| ||||||||||
Other (continued) |
| |||||||||
CenterPoint Energy Transition Bond Co. LLC, | $ | 865,366 | $ | 911,760 | ||||||
|
| |||||||||
| 1,781,155 | ||||||||||
|
| |||||||||
| ||||||||||
Student Loan 1.3% |
| |||||||||
SLM Private Education Loan Trust, | 1,233,416 | 1,239,148 | ||||||||
SLM Student Loan Trust, | 1,410,803 | 1,419,890 | ||||||||
|
| |||||||||
| 2,659,038 | ||||||||||
|
| |||||||||
Total Asset-Backed Securities |
| 26,126,165 | ||||||||
|
| |||||||||
| Bank Loan 0.3% | ||||||||||
Food Products 0.3% |
| |||||||||
HJ Heinz Co., | 497,500 | 500,953 | ||||||||
|
| |||||||||
Total Bank Loan |
| 500,953 | ||||||||
|
| |||||||||
| Collateralized Mortgage Obligations 1.7% | ||||||||||
Chase Mortgage Finance Trust, | 81,181 | 82,099 | ||||||||
Federal National Mortgage Association REMICS | ||||||||||
Series 2002-18, Class PC, | 103 | 103 | ||||||||
Series 2003-3, Class BC, | 166,151 | 175,370 | ||||||||
Series 2611, Class HD, | 434,532 | 472,588 | ||||||||
RFMSI Trust, | 293,422 | 296,250 | ||||||||
Sequoia Mortgage Trust | ||||||||||
Series 2012-1, Class 2A1, | 374,081 | 374,088 | ||||||||
Series 2012-2, Class A2, | 773,589 | 772,559 | ||||||||
Series 2013-1, Class 1A1, | 1,151,249 | 1,094,448 | ||||||||
Washington Mutual Mortgage Pass Through Certificates Trust, | 37,320 | 33,105 | ||||||||
58
Statement of Investments (Continued)
January 31, 2014 (Unaudited)
Nationwide HighMark Short Term Bond Fund (Continued)
| Collateralized Mortgage Obligations (continued) | ||||||||||
| Principal Amount | Market Value | |||||||||
| ||||||||||
Wells Fargo Mortgage Backed Securities Trust, | $ | 175,170 | $ | 177,071 | ||||||
|
| |||||||||
Total Collateralized Mortgage Obligations |
| 3,477,681 | ||||||||
|
| |||||||||
| Commercial Mortgage Backed Securities 5.6% | ||||||||||
Credit Suisse First Boston Mortgage Securities Corp., | 495,764 | 498,365 | ||||||||
DBUBS Mortgage Trust, | 2,204,852 | 2,310,870 | ||||||||
Government National Mortgage Association | ||||||||||
Series 2006-42, Class B, | 589,264 | 610,373 | ||||||||
Series 2011-20, Class A, | 324,714 | 325,920 | ||||||||
JP Morgan Chase Commercial Mortgage Securities Trust 2013-C16, | 2,442,101 | 2,445,028 | ||||||||
JPMBB Commercial Mortgage Securities Trust, | 1,926,683 | 1,930,939 | ||||||||
Morgan Stanley Bank of America Merrill Lynch Trust, | 3,244,178 | 3,257,231 | ||||||||
|
| |||||||||
Total Commercial Mortgage Backed Securities |
| 11,378,726 | ||||||||
|
| |||||||||
| Corporate Bonds 59.2% | ||||||||||
Airlines 1.4% |
| |||||||||
Continental Airlines Pass Through Trust, | 860,504 | 922,890 | ||||||||
Delta Air Lines Pass Through Trust | ||||||||||
Series 2011-1, Class A, | 762,767 | 839,044 | ||||||||
Series 2012-1, Class A, | 929,930 | 1,004,324 | ||||||||
|
| |||||||||
| 2,766,258 | ||||||||||
|
| |||||||||
| ||||||||||
Automobiles 1.1% | ||||||||||
General Motors Co., | 2,250,000 | 2,295,000 | ||||||||
|
| |||||||||
| Corporate Bonds (continued) | ||||||||||
| Principal Amount | Market Value | |||||||||
| ||||||||||
Beverages 1.8% | ||||||||||
Anheuser-Busch InBev Worldwide, Inc., | $ | 2,500,000 | $ | 2,498,148 | ||||||
Heineken NV, | 1,200,000 | 1,198,140 | ||||||||
|
| |||||||||
| 3,696,288 | ||||||||||
|
| |||||||||
| ||||||||||
Biotechnology 2.5% | ||||||||||
Gilead Sciences, Inc. | ||||||||||
2.40%, 12/01/14 | 1,000,000 | 1,015,285 | ||||||||
3.05%, 12/01/16 | 1,500,000 | 1,585,451 | ||||||||
Warner Chilcott Co. LLC/Warner Chilcott Finance LLC, | 2,250,000 | 2,421,563 | ||||||||
|
| |||||||||
| 5,022,299 | ||||||||||
|
| |||||||||
| ||||||||||
Capital Markets 0.1% | ||||||||||
Lehman Brothers Holdings, Inc., | 500,000 | 108,125 | ||||||||
|
| |||||||||
| ||||||||||
Chemicals 1.1% | ||||||||||
Ecolab, Inc. | ||||||||||
2.38%, 12/08/14 | 1,225,000 | 1,243,817 | ||||||||
1.00%, 08/09/15 | 1,000,000 | 1,004,538 | ||||||||
|
| |||||||||
| 2,248,355 | ||||||||||
|
| |||||||||
| ||||||||||
Commercial Banks 9.2% | ||||||||||
Bank of Montreal, | 1,000,000 | 1,012,828 | ||||||||
Bank of New York Mellon Corp. (The), | 2,500,000 | 2,473,734 | ||||||||
BB&T Corp., | 1,800,000 | 1,820,294 | ||||||||
Canadian Imperial Bank of Commerce, | 2,150,000 | 2,175,726 | ||||||||
Capital One Financial Corp., | 2,300,000 | 2,302,483 | ||||||||
Fifth Third Bank, | 2,000,000 | 1,973,713 | ||||||||
KeyBank NA, | 2,500,000 | 2,502,813 | ||||||||
PNC Bank NA, | 2,280,000 | 2,296,249 | ||||||||
Wells Fargo & Co., | 1,000,000 | 997,837 | ||||||||
Westpac Banking Corp., | 1,050,000 | 1,064,976 | ||||||||
|
| |||||||||
| 18,620,653 | ||||||||||
|
| |||||||||
| ||||||||||
Computers & Peripherals 1.3% | ||||||||||
Hewlett-Packard Co., | 2,500,000 | 2,608,243 | ||||||||
|
| |||||||||
59
Statement of Investments (Continued)
January 31, 2014 (Unaudited)
Nationwide HighMark Short Term Bond Fund (Continued)
| Corporate Bonds (continued) | ||||||||||
| Principal Amount | Market Value | |||||||||
| ||||||||||
Consumer Finance 4.6% |
| |||||||||
American Express Credit Corp., | $ | 2,000,000 | $ | 2,029,371 | ||||||
Ford Motor Credit Co. LLC | ||||||||||
3.88%, 01/15/15 | 1,450,000 | 1,493,011 | ||||||||
2.75%, 05/15/15 | 2,500,000 | 2,559,575 | ||||||||
John Deere Capital Corp., | 2,000,000 | 2,003,799 | ||||||||
PACCAR Financial Corp., | 1,210,000 | 1,210,780 | ||||||||
|
| |||||||||
| 9,296,536 | ||||||||||
|
| |||||||||
| ||||||||||
Containers & Packaging 1.2% |
| |||||||||
Ball Corp., | 2,150,000 | 2,332,750 | ||||||||
|
| |||||||||
| ||||||||||
Diversified Financial Services 9.5% |
| |||||||||
Bank of America Corp. | ||||||||||
7.38%, 05/15/14 | 2,500,000 | 2,546,994 | ||||||||
1.28%, 01/15/19 (a) | 2,650,000 | 2,668,063 | ||||||||
Caterpillar Financial Services Corp., | 1,750,000 | 1,770,190 | ||||||||
Citigroup, Inc., | 3,000,000 | 2,942,427 | ||||||||
General Electric Capital Corp., | 3,000,000 | 3,094,477 | ||||||||
JPMorgan Chase & Co., | 2,400,000 | 2,389,354 | ||||||||
KE Export Leasing LLC | ||||||||||
Series 2011-II, | 1,918,295 | 1,909,302 | ||||||||
Series 2013-A, Class A, | 939,779 | 935,815 | ||||||||
NASDAQ OMX Group, Inc. (The), | 750,000 | 823,304 | ||||||||
|
| |||||||||
| 19,079,926 | ||||||||||
|
| |||||||||
| ||||||||||
Diversified Telecommunication Services 2.0% |
| |||||||||
AT&T, Inc., | 2,000,000 | 2,021,561 | ||||||||
Verizon Communications, Inc., | 2,000,000 | 2,110,000 | ||||||||
|
| |||||||||
| 4,131,561 | ||||||||||
|
| |||||||||
| ||||||||||
Food & Staples Retailing 1.5% |
| |||||||||
Walgreen Co., | 3,000,000 | 3,026,196 | ||||||||
|
| |||||||||
| ||||||||||
Food Products 1.0% |
| |||||||||
WM Wrigley Jr Co., | 2,000,000 | 2,006,493 | ||||||||
|
| |||||||||
| Corporate Bonds (continued) | ||||||||||
| Principal Amount | Market Value | |||||||||
| ||||||||||
Gas Utilities 1.6% |
| |||||||||
Energy Transfer Partners LP, | $ | 522,000 | $ | 529,771 | ||||||
Enterprise Products Operating LLC, | 2,500,000 | 2,615,236 | ||||||||
|
| |||||||||
| 3,145,007 | ||||||||||
|
| |||||||||
| ||||||||||
Health Care Providers & Services 3.1% |
| |||||||||
Baxter International, Inc., | 2,125,000 | 2,134,390 | ||||||||
McKesson Corp., | 2,675,000 | 2,679,474 | ||||||||
UnitedHealth Group, Inc., | 1,500,000 | 1,509,922 | ||||||||
|
| |||||||||
| 6,323,786 | ||||||||||
|
| |||||||||
| ||||||||||
Insurance 0.9% | ||||||||||
Berkshire Hathaway Finance Corp., | 1,800,000 | 1,827,123 | ||||||||
|
| |||||||||
| ||||||||||
Media 0.8% | ||||||||||
Time Warner Cable, Inc., | 1,500,000 | 1,516,428 | ||||||||
|
| |||||||||
| ||||||||||
Metals & Mining 0.9% | ||||||||||
Rio Tinto Finance USA PLC, | 1,750,000 | 1,753,480 | ||||||||
|
| |||||||||
| ||||||||||
Multiline Retail 0.5% | ||||||||||
Macy’s Retail Holdings, Inc., | 1,000,000 | 1,098,528 | ||||||||
|
| |||||||||
| ||||||||||
Office Electronics 0.5% | ||||||||||
Xerox Corp., | 1,000,000 | 1,001,568 | ||||||||
|
| |||||||||
| ||||||||||
Oil, Gas & Consumable Fuels 5.5% |
| |||||||||
BP Capital Markets PLC | ||||||||||
1.38%, 11/06/17 | 750,000 | 747,941 | ||||||||
0.88%, 09/26/18 (a) | 3,000,000 | 3,011,111 | ||||||||
El Paso Natural Gas Co. LLC, | 2,296,000 | 2,588,889 | ||||||||
Petrobras International Finance Co., | 2,000,000 | 2,051,948 | ||||||||
Petrohawk Energy Corp. | ||||||||||
7.88%, 06/01/15 | 1,800,000 | 1,835,460 | ||||||||
7.25%, 08/15/18 | 900,000 | 964,125 | ||||||||
|
| |||||||||
| 11,199,474 | ||||||||||
|
| |||||||||
| ||||||||||
Pharmaceuticals 5.1% |
| |||||||||
AbbVie, Inc., | 2,600,000 | 2,625,897 | ||||||||
Merck & Co., Inc., | 2,050,000 | 2,053,516 | ||||||||
60
Statement of Investments (Continued)
January 31, 2014 (Unaudited)
Nationwide HighMark Short Term Bond Fund (Continued)
| Corporate Bonds (continued) | ||||||||||
| Principal Amount | Market Value | |||||||||
| ||||||||||
Pharmaceuticals (continued) |
| |||||||||
Mylan, Inc., | $ | 2,400,000 | $ | 2,709,000 | ||||||
Pfizer, Inc., | 3,000,000 | 2,998,235 | ||||||||
|
| |||||||||
| 10,386,648 | ||||||||||
|
| |||||||||
| ||||||||||
Road & Rail 0.6% | ||||||||||
Burlington Northern and Santa Fe Railway Co. Pass Through Trust, | 1,106,329 | 1,192,069 | ||||||||
|
| |||||||||
| ||||||||||
Software 1.4% | ||||||||||
Oracle Corp., | 2,850,000 | 2,866,847 | ||||||||
|
| |||||||||
Total Corporate Bonds |
| 119,549,641 | ||||||||
|
| |||||||||
| Sovereign Bond 0.4% | ||||||||||
MEXICO 0.4% |
| |||||||||
Mexico Government International Bond, | 750,000 | 751,267 | ||||||||
|
| |||||||||
Total Sovereign Bond |
| 751,267 | ||||||||
|
| |||||||||
| U.S. Government Mortgage Backed Agencies 11.3% | ||||||||||
Federal Home Loan Mortgage Corp. Gold Pool | ||||||||||
Pool# E00659 | 734 | 736 | ||||||||
Pool# E00669 | 4,311 | 4,327 | ||||||||
Pool# E76505 | 222 | 223 | ||||||||
Pool# E77082 | 788 | 791 | ||||||||
Pool# G10907 | 182 | 183 | ||||||||
Pool# E00720 | 6,930 | 6,983 | ||||||||
Pool# G11038 | 7,917 | 7,971 | ||||||||
Pool# E85741 | 29,671 | 31,124 | ||||||||
Pool# E01136 | 27,732 | 29,086 | ||||||||
Pool# E89121 | 90,710 | 95,746 | ||||||||
Pool# E92833 | 3,083 | 3,266 | ||||||||
| U.S. Government Mortgage Backed Agencies (continued) | ||||||||||
| Principal Amount | Market Value | |||||||||
| ||||||||||
Federal Home Loan Mortgage Corp. Gold Pool (continued) | ||||||||||
Pool# E01311 | $ | 39,339 | $ | 41,754 | ||||||
Pool# E01488 | 119,879 | 126,990 | ||||||||
Pool# E01497 | 4,601 | 4,930 | ||||||||
Pool# G11712 | 439,104 | 469,018 | ||||||||
Pool# G18065 | 51,585 | 55,298 | ||||||||
Pool# G13746 | 628,116 | 674,832 | ||||||||
Pool# G13888 | 216,569 | 233,352 | ||||||||
Pool# J12635 | 526,581 | 562,249 | ||||||||
Pool# J13795 | 521,266 | 550,974 | ||||||||
Pool# E03083 | 798,010 | 842,493 | ||||||||
Pool# C00748 | 38,258 | 42,429 | ||||||||
Pool# C01418 | 231,216 | 254,500 | ||||||||
Pool# G01740 | 130,260 | 143,378 | ||||||||
Pool# G04342 | 179,136 | 199,068 | ||||||||
Federal Home Loan Mortgage Corp. Non Gold Pool | ||||||||||
Pool# 972136 | 201,287 | 212,784 | ||||||||
Pool# 848191 | 1,031,495 | 1,089,000 | ||||||||
Pool# 1B2139 | 134,354 | 142,751 | ||||||||
Pool# 1B2446 | 994,031 | 1,056,158 | ||||||||
Pool# 848621 | 875,754 | 922,382 | ||||||||
Pool# 848251 | 1,181,630 | 1,253,483 | ||||||||
Pool# 848134 | 181,718 | 192,292 | ||||||||
Federal National Mortgage Association Pool | ||||||||||
Pool# 323842 | 1,971 | 1,980 | ||||||||
Pool# 535170 | 722 | 725 | ||||||||
Pool# 535816 | 5,253 | 5,269 | ||||||||
61
Statement of Investments (Continued)
January 31, 2014 (Unaudited)
Nationwide HighMark Short Term Bond Fund (Continued)
| U.S. Government Mortgage Backed Agencies (continued) | ||||||||||
| Principal Amount | Market Value | |||||||||
| ||||||||||
Federal National Mortgage Association Pool (continued) | ||||||||||
Pool# 253752 | $ | 39,156 | $ | 40,732 | ||||||
Pool# 535846 | 83,104 | 86,450 | ||||||||
Pool# 357119 | 99,569 | 103,731 | ||||||||
Pool# 555569 | 10,181 | 10,475 | ||||||||
Pool# 545015 | 4,441 | 4,627 | ||||||||
Pool# 545019 | 10,924 | 11,403 | ||||||||
Pool# 253880 | 8,840 | 9,253 | ||||||||
Pool# 253883 | 8,777 | 9,166 | ||||||||
Pool# 254003 | 24,706 | 25,904 | ||||||||
Pool# 545299 | 8,612 | 9,055 | ||||||||
Pool# 254088 | 11,195 | 11,709 | ||||||||
Pool# 254140 | 78,987 | 82,711 | ||||||||
Pool# 254142 | 9,837 | 10,388 | ||||||||
Pool# 545449 | 3,704 | 3,900 | ||||||||
Pool# 254261 | 15,815 | 16,770 | ||||||||
Pool# 254373 | 15,856 | 16,848 | ||||||||
Pool# 254442 | 139,314 | 147,043 | ||||||||
Pool# 545899 | 13,275 | 13,965 | ||||||||
Pool# 254473 | 22,049 | 23,297 | ||||||||
Pool# 555013 | 34,709 | 36,634 | ||||||||
Pool# 668358 | 19,609 | 20,739 | ||||||||
Pool# 685185 | 2,765 | 2,934 | ||||||||
Pool# 555384 | 6,225 | 6,610 | ||||||||
Pool# 725135 | 67,751 | 71,308 | ||||||||
Pool# 555918 | 6,756 | 7,153 | ||||||||
Pool# 735930 | 235,848 | 248,658 | ||||||||
| U.S. Government Mortgage Backed Agencies (continued) | ||||||||||
| Principal Amount | Market Value | |||||||||
| ||||||||||
Federal National Mortgage Association Pool (continued) | ||||||||||
Pool# MA0517 | $ | 761,707 | $ | 813,688 | ||||||
Pool# 981257 | 573,416 | 616,701 | ||||||||
Pool# 931892 | 1,774,332 | 1,909,556 | ||||||||
Pool# AL0802 | 497,200 | 535,092 | ||||||||
Pool# AE3066 | 1,215,314 | 1,284,103 | ||||||||
Pool# AH0969 | 663,479 | 701,448 | ||||||||
Pool# AH9377 | 398,201 | 420,739 | ||||||||
Pool# AB3298 | 400,456 | 423,122 | ||||||||
Pool# AB4998 | 1,820,771 | 1,880,516 | ||||||||
Pool# 53839 | 15,236 | 15,606 | ||||||||
Pool# 190307 | 2,424 | 2,918 | ||||||||
Pool# 253516 | 1,741 | 2,067 | ||||||||
Pool# 737253 | 83,630 | 87,447 | ||||||||
Pool# 725726 | 832,590 | 871,779 | ||||||||
Pool# 725773 | 289,307 | 319,764 | ||||||||
Pool# 815323 | 377,346 | 393,808 | ||||||||
Pool# 811773 | 233,107 | 257,356 | ||||||||
Pool# AL1009 | 1,273,012 | 1,327,831 | ||||||||
Pool# 829431 | 550,948 | 585,070 | ||||||||
|
| |||||||||
Total U.S. Government Mortgage Backed Agencies |
| 22,738,599 | ||||||||
|
| |||||||||
| U.S. Treasury Note 6.2% | ||||||||||
U.S. Treasury Note, | 12,500,000 | 12,601,562 | ||||||||
|
| |||||||||
Total U.S. Treasury Note |
| 12,601,562 | ||||||||
|
| |||||||||
62
Statement of Investments (Continued)
January 31, 2014 (Unaudited)
Nationwide HighMark Short Term Bond Fund (Continued)
| Mutual Fund 4.3% | ||||||||||
| Shares | Market Value | |||||||||
| ||||||||||
Money Market Fund 4.3% | ||||||||||
Fidelity Institutional Money Market Fund — Institutional Class, 0.08% (c) | 8,747,810 | $ | 8,747,810 | |||||||
|
| |||||||||
Total Mutual Fund |
| 8,747,810 | ||||||||
|
| |||||||||
Total Investments |
| $ | 205,872,404 | |||||||
Liabilities in excess of other assets — (2.0)% |
| (4,055,037 | ) | |||||||
|
| |||||||||
NET ASSETS — 100.0% |
| $ | 201,817,367 | |||||||
|
| |||||||||
| * | Denotes a non-income producing security. |
| (a) | Variable Rate Security. The rate reflected in the Statement of Investments is the rate in effect on January 31, 2014. The maturity date represents the actual maturity date. |
| (b) | Rule 144A, Section 4(2), or other security which is restricted as to sale to institutional investors. These securities were deemed liquid pursuant to procedures approved by the Board of Trustees. The aggregate value of these securities at January 31, 2014 was $21,338,267 which represents 10.57% of net assets. |
| (c) | Represents 7-day effective yield as of January 31, 2014. |
| (d) | See notes to financial statements for tax unrealized appreciation/(depreciation) of securities. |
| LLC | Limited Liability Company |
| LP | Limited Partnership |
| Ltd. | Limited |
| NA | National Association |
| NV | Public Traded Company |
| PLC | Public Limited Company |
| REMICS | Real Estate Mortgage Investment Conduits |
The accompanying notes are an integral part of these financial statements.
63
Statement of Assets and Liabilities
January 31, 2014 (Unaudited)
| Nationwide HighMark Short Term Bond Fund | ||||||
Assets: | ||||||
Investments, at value (cost $205,117,446) | $ | 205,872,404 | ||||
Interest and dividends receivable | 855,901 | |||||
Receivable for investments sold | 160,876 | |||||
Receivable for capital shares issued | 703,087 | |||||
Prepaid expenses | 27,288 | |||||
|
| |||||
Total Assets | 207,619,556 | |||||
|
| |||||
Liabilities: | ||||||
Payable for investments purchased | 3,608,531 | |||||
Distributions payable | 69,526 | |||||
Payable for capital shares redeemed | 1,959,212 | |||||
Accrued expenses and other payables: | ||||||
Investment advisory fees | 59,409 | |||||
Fund administration fees | 11,595 | |||||
Distribution fees | 23,309 | |||||
Administrative servicing fees | 17,625 | |||||
Accounting and transfer agent fees | 4,722 | |||||
Trustee fees | 2,461 | |||||
Deferred compensation (Note 2) | 12,351 | |||||
Custodian fees | 1,127 | |||||
Compliance program costs (Note 3) | 1,524 | |||||
Professional fees | 20,804 | |||||
Printing fees | 9,085 | |||||
Other | 908 | |||||
|
| |||||
Total Liabilities | 5,802,189 | |||||
|
| |||||
Net Assets | $ | 201,817,367 | ||||
|
| |||||
Represented by: | ||||||
Capital | $ | 201,455,743 | ||||
Accumulated distributions in excess of net investment income | (361,027 | ) | ||||
Accumulated net realized losses from investment transactions | (32,307 | ) | ||||
Net unrealized appreciation/(depreciation) from investments | 754,958 | |||||
|
| |||||
Net Assets | $ | 201,817,367 | ||||
|
| |||||
Net Assets: | ||||||
Class A Shares | $ | 44,479,262 | ||||
Class C Shares | 22,186,809 | |||||
Institutional Service Class Shares | 86,396,401 | |||||
Institutional Class Shares | 48,754,895 | |||||
|
| |||||
Total | $ | 201,817,367 | ||||
|
| |||||
Shares Outstanding (unlimited number of shares authorized): | ||||||
Class A Shares | 4,437,331 | |||||
Class C Shares | 2,186,577 | |||||
Institutional Service Class Shares | 8,607,925 | |||||
Institutional Class Shares | 4,854,622 | |||||
|
| |||||
Total | 20,086,455 | |||||
|
| |||||
64
Statement of Assets and Liabilities (Continued)
January 31, 2014 (Unaudited)
| Nationwide HighMark Short Term Bond Fund | ||||||
Net asset value and redemption price per share (Net assets by class divided by shares outstanding by class, respectively): | ||||||
Class A Shares (a) | $ | 10.02 | ||||
Class C Shares (b) | $ | 10.15 | ||||
Institutional Service Class Shares | $ | 10.04 | ||||
Institutional Class Shares | $ | 10.04 | ||||
Maximum offering price per share (100%/(100%-maximum sales charge) of net asset value adjusted to the nearest cent): | ||||||
Class A Shares | $ | 10.25 | ||||
|
| |||||
Maximum Sales Charge: | ||||||
Class A Shares | 2.25 | % | ||||
|
| |||||
| (a) | For Class A Shares, the redemption price per share is reduced by 0.75% on sales of shares of original purchases of $500,000 or more or that were not subject to a front-end sales charge made within 18 months of the purchase date. |
| (b) | For Class C Shares, the redemption price per share is reduced by 1.00% for shares held less than 1 year. |
The accompanying notes are an integral part of these financial statements.
65
Statement of Operations
For the Period Ended January 31, 2014 (Unaudited)
| Nationwide HighMark Short Term Bond Fund | ||||||
INVESTMENT INCOME: | ||||||
Interest income | $ | 1,410,578 | ||||
Dividend income | 1,442 | |||||
|
| |||||
Total Income | 1,412,020 | |||||
|
| |||||
EXPENSES: | ||||||
Investment advisory fees | 340,864 | |||||
Fund administration fees | 95,537 | |||||
Distribution fees Class A | 53,305 | |||||
Distribution fees Class C | 93,453 | |||||
Administrative servicing fees Class A | 21,788 | |||||
Administrative servicing fees Institutional Service Class (a) | 46,102 | |||||
Registration and filing fees | 21,829 | |||||
Professional fees | 24,895 | |||||
Printing fees | 15,590 | |||||
Trustee fees | 3,582 | |||||
Custodian fees | 3,909 | |||||
Accounting and transfer agent fees | 15,730 | |||||
Compliance program costs (Note 3) | 1,812 | |||||
Other | 14,268 | |||||
|
| |||||
Total expenses before earnings credit, fees waived, and expenses reimbursed | 752,664 | |||||
|
| |||||
Earnings credit (Note 4) | (147 | ) | ||||
Administrative servicing fees voluntarily waived – Class A (Note 3) | (11,127 | ) | ||||
Administrative servicing fees voluntarily waived – Institutional Service Class (a) (Note 3) | (23,377 | ) | ||||
Expenses reimbursed by adviser (Note 3) | (38,214 | ) | ||||
|
| |||||
Net Expenses | 679,799 | |||||
|
| |||||
NET INVESTMENT INCOME | 732,221 | |||||
|
| |||||
REALIZED/UNREALIZED GAINS (LOSSES) FROM INVESTMENTS: | ||||||
Net realized gains from investment transactions | 224,004 | |||||
Net change in unrealized appreciation/(depreciation) from investments | 506,719 | |||||
|
| |||||
Net realized/unrealized gains from investments | 730,723 | |||||
|
| |||||
CHANGE IN NET ASSETS RESULTING FROM OPERATIONS | $ | 1,462,944 | ||||
|
| |||||
| (a) | Effective September 16, 2013, Fiduciary Shares were renamed Institutional Service Class Shares. |
The accompanying notes are an integral part of these financial statements.
66
Statements of Changes in Net Assets
Nationwide HighMark Short Term | ||||||||||||
| Six Months Ended January 31, 2014 (Unaudited) | Year Ended July 31, 2013 | |||||||||||
Operations: | ||||||||||||
Net investment income | $ | 732,221 | $ | 1,718,409 | ||||||||
Net realized gains from investment transactions | 224,004 | 722,040 | ||||||||||
Net change in unrealized appreciation/(depreciation) from investments | 506,719 | (1,929,412 | ) | |||||||||
|
|
|
| |||||||||
Change in net assets resulting from operations | 1,462,944 | 511,037 | ||||||||||
|
|
|
| |||||||||
Distributions to Shareholders From: | ||||||||||||
Net investment income: | ||||||||||||
Class A | (226,005 | ) | (505,762 | ) | ||||||||
Class C | (74,470 | ) | (224,745 | ) | ||||||||
Institutional Service Class (a) | (593,398 | ) | (1,693,174 | ) | ||||||||
Institutional Class | (199,375 | )(b) | – | |||||||||
|
|
|
| |||||||||
Change in net assets from shareholder distributions | (1,093,248 | ) | (2,423,681 | ) | ||||||||
|
|
|
| |||||||||
Change in net assets from capital transactions | 36,865,541 | 7,588,632 | ||||||||||
|
|
|
| |||||||||
Change in net assets | 37,235,237 | 5,675,988 | ||||||||||
|
|
|
| |||||||||
Net Assets: | ||||||||||||
Beginning of period | 164,582,130 | 158,906,142 | ||||||||||
|
|
|
| |||||||||
End of period | $ | 201,817,367 | $ | 164,582,130 | ||||||||
|
|
|
| |||||||||
Accumulated distributions in excess of net investment income at end of period | $ | (361,027 | ) | $ | – | |||||||
|
|
|
| |||||||||
CAPITAL TRANSACTIONS: | ||||||||||||
Class A Shares | ||||||||||||
Proceeds from shares issued | $ | 9,179,950 | $ | 37,806,686 | ||||||||
Dividends reinvested | 139,260 | 430,908 | ||||||||||
Cost of shares redeemed | (9,286,965 | ) | 25,347,925 | |||||||||
|
|
|
| |||||||||
Total Class A Shares | 32,245 | 12,889,669 | ||||||||||
|
|
|
| |||||||||
Class C Shares | ||||||||||||
Proceeds from shares issued | 1,465,414 | 11,724,804 | ||||||||||
Dividends reinvested | 60,327 | 173,180 | ||||||||||
Cost of shares redeemed | (6,075,778 | ) | (9,478,565 | ) | ||||||||
|
|
|
| |||||||||
Total Class C Shares | (4,550,037 | ) | 2,419,419 | |||||||||
|
|
|
| |||||||||
Institutional Service Class Shares (a) | ||||||||||||
Proceeds from shares issued | 12,819,591 | 39,762,430 | ||||||||||
Dividends reinvested | 244,807 | 851,530 | ||||||||||
Cost of shares redeemed | (20,349,963 | ) | (48,334,416 | ) | ||||||||
|
|
|
| |||||||||
Total Institutional Service Class Shares | (7,285,565 | ) | (7,720,456 | ) | ||||||||
|
|
|
| |||||||||
| (a) | Effective September 16, 2013, Fiduciary Shares were renamed Institutional Service Class Shares. |
| (b) | For the period from September 19, 2013 (commencement of operations) through January 31, 2014. |
67
Statements of Changes in Net Assets (Continued)
| Nationwide HighMark Short Term Bond Fund | ||||||||||||
| Six Months Ended January 31, 2014 (Unaudited) | Year Ended July 31, 2013 | |||||||||||
CAPITAL TRANSACTIONS: (continued) | ||||||||||||
Institutional Class Shares | ||||||||||||
Proceeds from shares issued | $ | 86,439,963 | (b) | $ | – | |||||||
Dividends reinvested | 199,165 | (b) | – | |||||||||
Cost of shares redeemed | (37,970,230 | )(b) | – | |||||||||
|
|
|
| |||||||||
Total Institutional Class Shares | 48,668,898 | (b) | – | |||||||||
|
|
|
| |||||||||
Change in net assets from capital transactions | $ | 36,865,541 | $ | 7,588,632 | ||||||||
|
|
|
| |||||||||
SHARE TRANSACTIONS: | ||||||||||||
Class A Shares | ||||||||||||
Issued | 917,030 | 3,759,066 | ||||||||||
Reinvested | 13,919 | 42,721 | ||||||||||
Redeemed | (928,083 | ) | (2,521,226 | ) | ||||||||
|
|
|
| |||||||||
Total Class A Shares | 2,866 | 1,280,561 | ||||||||||
|
|
|
| |||||||||
Class C Shares | ||||||||||||
Issued | 144,795 | 1,146,731 | ||||||||||
Reinvested | 5,956 | 16,954 | ||||||||||
Redeemed | (599,732 | ) | (928,566 | ) | ||||||||
|
|
|
| |||||||||
Total Class C Shares | (448,981 | ) | 235,119 | |||||||||
|
|
|
| |||||||||
Institutional Service Class Shares (a) | ||||||||||||
Issued | 1,279,569 | 3,931,680 | ||||||||||
Reinvested | 24,437 | 84,306 | ||||||||||
Redeemed | (2,032,683 | ) | (4,797,488 | ) | ||||||||
|
|
|
| |||||||||
Total Institutional Service Class Shares | (728,677 | ) | (781,502 | ) | ||||||||
|
|
|
| |||||||||
Institutional Class Shares | ||||||||||||
Issued | 8,620,275 | (b) | – | |||||||||
Reinvested | 19,848 | (b) | – | |||||||||
Redeemed | (3,785,501 | )(b) | – | |||||||||
|
|
|
| |||||||||
Total Institutional Class Shares | 4,854,622 | (b) | – | |||||||||
|
|
|
| |||||||||
Total change in shares | 3,679,830 | 734,178 | ||||||||||
|
|
|
| |||||||||
Amounts designated as “–” are zero or have been rounded to zero.
| (a) | Effective September 16, 2013, Fiduciary Shares were renamed Institutional Service Class Shares. |
| (b) | For the period from September 19, 2013 (commencement of operations) through January 31, 2014. |
The accompanying notes are an integral part of these financial statements.
68
Financial Highlights
Selected data for each share of capital outstanding throughout the periods indicated
Nationwide HighMark Short Term Bond Fund
| Operations | Distributions | Ratios/Supplemental Data | ||||||||||||||||||||||||||||||||||||||||||||||||||
Net Asset of Period | Net Investment Income | Net Realized and Unrealized Gains (Losses) from Investments | Total from Operations | Net Investment Income | Total Distributions | Net Asset Value, End of Period | Total Return (a)(b) | Net Assets at End of Period | Ratio of to Average Net Assets (c) | Ratio of Net Investment Income to Average Net Assets (c) | Ratio of Expenses to Average Net Assets (c)(d) | Portfolio Turnover (e) | ||||||||||||||||||||||||||||||||||||||||
| Class A Shares | ||||||||||||||||||||||||||||||||||||||||||||||||||||
Six Months Ended January 31, 2014 (f) (Unaudited) | $ | 10.00 | 0.03 | 0.04 | 0.07 | (0.05 | ) | (0.05 | ) | $ | 10.02 | 0.74% | $ | 44,479,262 | 0.83% | 0.66% | 0.93% | 36.27% | ||||||||||||||||||||||||||||||||||
Year Ended July 31, 2013 (f) | $ | 10.11 | 0.09 | (0.07 | ) | 0.02 | (0.13 | ) | (0.13 | ) | $ | 10.00 | 0.22% | $ | 44,364,179 | 0.85% | 0.89% | 1.19% | 62.00% | |||||||||||||||||||||||||||||||||
Year Ended July 31, 2012 (f) | $ | 10.09 | 0.17 | 0.05 | 0.22 | (0.20 | ) | (0.20 | ) | $ | 10.11 | 2.18% | $ | 31,888,147 | 0.88% | 1.71% | 1.22% | 45.00% | ||||||||||||||||||||||||||||||||||
Year Ended July 31, 2011 (f) | $ | 10.10 | 0.19 | 0.02 | 0.21 | (0.22 | ) | (0.22 | ) | $ | 10.09 | 2.07% | $ | 24,352,508 | 0.95% | 1.89% | 1.23% | 48.00% | ||||||||||||||||||||||||||||||||||
Year Ended July 31, 2010 (f) | $ | 9.98 | 0.24 | 0.14 | 0.38 | (0.26 | ) | (0.26 | ) | $ | 10.10 | 3.86% | $ | 22,581,313 | 0.94% | 2.39% | 1.24% | 27.00% | ||||||||||||||||||||||||||||||||||
Year Ended July 31, 2009 (f) | $ | 9.88 | 0.37 | 0.10 | 0.47 | (0.37 | ) | (0.37 | ) | $ | 9.98 | 4.88% | $ | 9,403,302 | 0.93% | 3.72% | 1.32% | 54.00% | ||||||||||||||||||||||||||||||||||
| Class C Shares | ||||||||||||||||||||||||||||||||||||||||||||||||||||
Six Months Ended January 31, 2014 (f) (Unaudited) | $ | 10.13 | 0.01 | 0.04 | 0.05 | (0.03 | ) | (0.03 | ) | $ | 10.15 | 0.50% | $ | 22,186,809 | 1.28% | 0.20% | 1.33% | 36.27% | ||||||||||||||||||||||||||||||||||
Year Ended July 31, 2013 (f) | $ | 10.24 | 0.05 | (0.07 | ) | (0.02 | ) | (0.09 | ) | (0.09 | ) | $ | 10.13 | (0.24)% | $ | 26,690,172 | 1.30% | 0.44% | 1.44% | 62.00% | ||||||||||||||||||||||||||||||||
Year Ended July 31, 2012 (f) | $ | 10.21 | 0.13 | 0.05 | 0.18 | (0.15 | ) | (0.15 | ) | $ | 10.24 | 1.79% | $ | 24,569,388 | 1.33% | 1.26% | 1.47% | 45.00% | ||||||||||||||||||||||||||||||||||
Year Ended July 31, 2011 (f) | $ | 10.22 | 0.15 | 0.01 | 0.16 | (0.17 | ) | (0.17 | ) | $ | 10.21 | 1.59% | $ | 20,876,269 | 1.40% | 1.44% | 1.48% | 48.00% | ||||||||||||||||||||||||||||||||||
Year Ended July 31, 2010 (f) | $ | 10.10 | 0.20 | 0.14 | 0.34 | (0.22 | ) | (0.22 | ) | $ | 10.22 | 3.37% | $ | 17,565,330 | 1.39% | 1.94% | 1.49% | 27.00% | ||||||||||||||||||||||||||||||||||
Year Ended July 31, 2009 (f) | $ | 9.99 | 0.32 | 0.11 | 0.43 | (0.32 | ) | (0.32 | ) | $ | 10.10 | 4.47% | $ | 3,109,001 | 1.38% | 3.27% | 1.57% | 54.00% | ||||||||||||||||||||||||||||||||||
| Institutional Service Class Shares (g) | ||||||||||||||||||||||||||||||||||||||||||||||||||||
Six Months Ended January 31, 2014 (f) (Unaudited) | $ | 10.02 | 0.05 | 0.04 | 0.09 | (0.07 | ) | (0.07 | ) | $ | 10.04 | 0.86% | $ | 86,396,401 | 0.58% | 0.91% | 0.68% | 36.27% | ||||||||||||||||||||||||||||||||||
Year Ended July 31, 2013 (f) | $ | 10.13 | 0.12 | (0.07 | ) | 0.05 | (0.16 | ) | (0.16 | ) | $ | 10.02 | 0.48% | $ | 93,527,779 | 0.59% | 1.16% | 0.94% | 62.00% | |||||||||||||||||||||||||||||||||
Year Ended July 31, 2012 (f) | $ | 10.10 | 0.20 | 0.05 | 0.25 | (0.22 | ) | (0.22 | ) | $ | 10.13 | 2.55% | $ | 102,448,607 | 0.61% | 1.98% | 0.97% | 45.00% | ||||||||||||||||||||||||||||||||||
Year Ended July 31, 2011 (f) | $ | 10.12 | 0.22 | 0.01 | 0.23 | (0.25 | ) | (0.25 | ) | $ | 10.10 | 2.35% | $ | 87,476,317 | 0.67% | 2.17% | 0.98% | 48.00% | ||||||||||||||||||||||||||||||||||
Year Ended July 31, 2010 (f) | $ | 10.00 | 0.27 | 0.14 | 0.41 | (0.29 | ) | (0.29 | ) | $ | 10.12 | 4.04% | $ | 71,121,675 | 0.66% | 2.67% | 0.99% | 27.00% | ||||||||||||||||||||||||||||||||||
Year Ended July 31, 2009 (f) | $ | 9.89 | 0.39 | 0.11 | 0.50 | (0.39 | ) | (0.39 | ) | $ | 10.00 | 5.24% | $ | 51,470,563 | 0.66% | 3.99% | 1.07% | 54.00% | ||||||||||||||||||||||||||||||||||
| Institutional Class Shares | ||||||||||||||||||||||||||||||||||||||||||||||||||||
Period Ended January 31, 2014 (f)(h) (Unaudited) | $ | 10.01 | 0.04 | 0.04 | 0.08 | (0.05 | ) | (0.05 | ) | $ | 10.04 | 0.79% | $ | 48,754,895 | 0.52% | 0.98% | 0.52% | 36.27% | ||||||||||||||||||||||||||||||||||
Amounts designated as “–” are zero or have been rounded to zero.
| (a) | Excludes sales charge. |
| (b) | Not annualized for periods less than one year. |
| (c) | Annualized for periods less than one year. |
| (d) | During the period, certain fees may have been waived and/or reimbursed. If such waivers/reimbursements had not occurred, the ratios would have been as indicated. |
| (e) | Portfolio turnover is calculated on the basis of the Fund as a whole without distinguishing among the classes of shares. |
| (f) | Per share calculations were performed using average shares method. |
| (g) | Effective September 16, 2013, Fiduciary Shares were renamed Institutional Service Class Shares. |
| (h) | For the period from September 19, 2013 (commencement of operations) through January 31, 2014. Total return is calculated based on inception date of September 18, 2013 through January 31, 2014. |
The accompanying notes are an integral part of these financial statements.
69
| Fund Commentary | Nationwide Ziegler Wisconsin Tax Exempt Fund |
For the semiannual period ended January 31, 2014, the Nationwide Ziegler Wisconsin Tax Exempt Fund (Class A at NAV) registered -1.07%* versus 2.99% for its benchmark, the Barclays Municipal Bond Index. For broader comparison, the median return for the Fund’s closest Lipper peer category of Other States Municipal Debt Funds (consisting of 149 funds as of January 31, 2014) was 2.10% for the same time period.
| * | Performance prior to the Fund’s inception on September 16, 2013, is based on the performance of the Fund’s predecessor fund. |
The Nationwide Ziegler Wisconsin Tax Exempt Fund has experienced underperformance along with the municipal bond market in general, which has experienced significant outflows. Municipal bond funds recorded 32 consecutive weeks of outflows to end 2013. A record $67 billion in net outflows occurred in 2013, according to Morningstar.
Wisconsin offers only three tax-exempt mutual funds: The Nationwide Ziegler Wisconsin Tax Exempt Fund subadvised by Ziegler, the Wisconsin Municipal Bond Fund subadvised by Nuveen and the Advantage Wisconsin Tax Free Fund subadvised by Wells Fargo. Wisconsin ranks number five in the nation in terms of total tax burden (state and local taxes). Typically, as there are only three funds in the Wisconsin tax-exempt space, we’ve observed that investors buy the Nationwide Ziegler Wisconsin Tax Exempt Fund based upon its objective of being fully invested in Wisconsin double tax-exempt bonds and the high relative current income the Fund offers. The Fund generally is fully invested, except for an approximate 3% cash buffer to handle potential redemptions and trading opportunities.
Managing a dedicated Wisconsin state fund has its particular nuances. The biggest challenge is that often there is not enough paper available to purchase within the state of Wisconsin for the Fund to be 100% invested in Wisconsin double tax-exempt paper. The only other bonds that are eligible for this status are territory paper issued by Guam, the U.S. Virgin Islands and Puerto Rico. Puerto Rico is the largest issuer of territory paper, with bonds readily available in the secondary market. Liquidity in bonds from the U.S. Virgin
Islands and Guam is very limited. The Fund’s allocation to Puerto Rico paper is due to the dearth of quality investable Wisconsin double tax-exempt bonds in the market.
Wisconsin double tax-exempt supply has dwindled in recent years due to austerity at the local levels and limited interest in new projects. Almost all new issuance has been refunding of existing bonds to save interest expense. We have also seen Wisconsin double tax-exempt bonds being refinanced in the bank loan market, once again shrinking investable Wisconsin double tax-exempt municipal bond opportunities. General obligation bonds of Wisconsin are not exempt from state tax, which further limits investment options.
Puerto Rico bonds have seen significant pressure in the period. Puerto Rico paper was under severe stress during the second half of 2013 with bond prices down more than 18%. Last summer, a negative cover story on Puerto Rico in Barron’s ignited a major sell-off in Puerto Rico bonds. Investors are very concerned with Puerto Rico’s heavy debt burden and its poor economy. Following Detroit’s bankruptcy in July, investors were worried that Puerto Rico was going down the same path. Prices rapidly deteriorated during 2013 as bond funds sourced liquidity to fund redemptions. Concerns over whether Puerto Rico would maintain an investment-grade rating and have access to capital markets to refinance debt hung heavy over the municipal marketplace at the end of 2013. Moody’s placed Puerto Rico’s Baa3 rating on “review for downgrade” in December 2013. During its review period, Moody’s will focus on the commonwealth’s access to long-term capital markets as well as other factors such as economic indicators, revenue performance, legislative actions and the proposed budget for fiscal year 2015. We expect resolution in early 2014, with Puerto Rico expected to bring a new issue bond deal and report important year-end revenue figures. There is a risk that Puerto Rico will lose its investment-grade ratings in 2014. A downgrade to junk ratings would put additional downward pressure on Puerto Rican bond prices, but we do not expect to see any payment defaults on interest or principal.
70
| Fund Commentary (cont’d) | Nationwide Ziegler Wisconsin Tax Exempt Fund |
The Fund’s exposure to Puerto Rico is not unusual. The Advantage Wisconsin Tax Free Fund subadvised by Wells Fargo had nearly 29% of its assets in Puerto Rico exposure as of year-end 2012. Puerto Rican credits currently make up 17.5% of the Nationwide Ziegler Wisconsin Tax Exempt Fund, greatly reduced from 27% at the end of January 2013. We have funded redemptions predominantly with territory bond sales for prudent risk management. The percentage of Wisconsin assets in the Fund has risen from 63% at the end of January 2013 to more than 77% today. The benchmark for the Fund is not a Wisconsin single-state benchmark but rather the Barclays Municipal Bond Index, which held a benchmark weight of 2.46% in Puerto Rico credits during the reporting period and only 1.23% in total Wisconsin credits. The Barclays Municipal Bond Index in fact only has de minimis allocation to Wisconsin state tax-exempt issues.
The Fund does not invest in state taxable bonds, limiting our ability to invest outside of the territories, a strategy pursued by some other single-state funds. Non-Wisconsin investments are not beneficial to investors from a tax standpoint. The Nationwide Ziegler Wisconsin Tax Exempt Fund seeks to provide investors with a high level of current income that is exempt from both federal and Wisconsin personal income taxes. Furthermore, the Fund does not own any alternative minimum tax (AMT) bonds or any Wisconsin state taxable issues. We improved the overall credit rating of the portfolio from A2 to A1 during the year ended January 31, 2014. The yield to maturity of the Fund has increased by more than 100 basis points during the past year to 3.89%. We will continue to seek to add high-quality Wisconsin state tax-exempt issues and reduce territory exposure where appropriate.
As we look toward the near future, we believe that the municipal market should be very interesting in 2014. We expect to see final resolutions regarding Detroit’s bankruptcy, Puerto Rico’s ratings and capital market access. As interest rates continue to rise and fiscal austerity continues at Wisconsin local levels, new issue Wisconsin state tax-exempt supply may once again prove to be extremely scarce. We will look to take advantage of any and all opportunities that present themselves and focus on capital preservation and high tax-free income for the Fund’s investors.
Subadviser:
Ziegler Capital Management, LLC
Portfolio Managers:
Paula M. Horn, Richard D. Scargill and Eric Zenner
The Fund is subject to the risks of investing in fixed-income securities. By concentrating its investments in bonds issued in specific geographic areas, the Fund’s credit risk is more dependent on the ability of the territory or state and its cities and municipalities to make timely payments on their obligations. The Fund is a nondiversified fund that may invest a greater percentage of its assets in a particular issuer, and thereby have greater exposure to risks associated with an individual issuer. The Fund may invest in municipal securities that generate interest that is subject to alternative minimum tax (“AMT”). As a result, taxpayers who are subject to the AMT potentially could earn a lower after-tax return.
A description of the benchmarks can be found on the Market Index Definitions page at the back of this book.
71
| Fund Overview (Unaudited) | Nationwide Ziegler Wisconsin Tax Exempt Fund |
Objective
The Fund seeks to provide investors with a high level of current income that is exempt from federal income tax and Wisconsin personal income tax.
Highlights
| Ÿ | For the semiannual period ended January 31, 2014, the Nationwide Ziegler Wisconsin Tax Exempt Fund (Class A at NAV) registered -1.07%, underperforming the benchmark by 4.06% and the Lipper peer category by 3.17%. |
| Ÿ | The Fund’s performance was negatively affected during the reporting period by exposure to Puerto Rico. |
| Ÿ | Lack of available double tax-exempt supply was a challenge for the Fund during the reporting period. |
Asset Allocation†
| Municipal Bonds | 96.1% | |||
| Mutual Fund | 2.8% | |||
| Other assets in excess of liabilities | 1.1% | |||
| 100.0% |
Top Holdings††
| Southeast Wisconsin Professional Baseball Park District, Sales Tax Revenue, Refunding, RB, National-RE Insured, 5.50%, 12/15/26 | 4.1% | |||
| Madison, Community Development Authority Revenue, Alumni Research Foundation Project, RB, 5.00%, 10/01/34 | 3.9% | |||
| Southeast Wisconsin Professional Baseball Park District, Sales Tax Revenue, Refunding, RB, National-RE Insured, 5.50%, 12/15/14 | 3.0% | |||
| Invesco Tax Free Cash Reserve Portfolio —Institutional Shares | 2.9% | |||
| Glendale, Community Development Authority, Lease Revenue, Tax Increment District No.7, Refunding, RB, 2.60%, 09/01/21 | 2.5% | |||
| Monroe, Redevelopment Authority, Development Revenue, MonroeClinic Inc., RB, 5.88%, 02/15/39 | 2.3% | |||
| Wisconsin Center District, Junior Dedicated Tax Revenue, Refunding, RB, AGM Insured, 5.25%, 12/15/23 | 2.2% | |||
| Glendale, Community Development Authority, Lease Revenue, Tax Increment District No.7, Refunding, RB, 2.75%, 09/01/22 | 2.1% | |||
| Southeast Wisconsin Professional Baseball Park District, Sales Tax Revenue, Refunding, ETM, RB, National-RE Insured, 5.50%, 12/15/19 | 2.1% | |||
| Milwaukee, Redevelopment Authority Revenue, Milwaukee School of Engineering, Refunding, RB, AGM Insured, 4.10%, 04/01/32 | 1.9% | |||
| Other Holdings | 73.0% | |||
| 100.0% |
| † | Percentages indicated are based upon net assets as of January 31, 2014. |
| †† | Percentages indicated are based upon total investments as of January 31, 2014. |
72
| Fund Performance | Nationwide Ziegler Wisconsin Tax Exempt Fund |
Average Annual Total Return
(For periods ended January 31, 2014)
| Six Months* | 1 Yr. | 5 Yr. | 10 Yr. | |||||||||||||||
| Class A | w/o SC1 | (1.07)% | (4.32)% | 3.38% | 2.97% | |||||||||||||
| w/ SC2 | (3.32)% | (6.49)% | 2.91% | 2.73% | ||||||||||||||
| Class C | w/o SC1 | (1.29)% | (4.85)% | 2.88% | 2.34% | |||||||||||||
| w/ SC3 | (2.29)% | (5.85)% | 2.88% | 2.34% | ||||||||||||||
| Institutional Service Class4,5 | w/o SC | (0.94)% | (4.09)% | 3.56% | 3.06% | |||||||||||||
| Institutional Class4 | w/o SC | 0.99% | 6 | — | — | — | ||||||||||||
All figures showing the effect of a sales charge (SC) reflect the maximum charge possible, because it has the most significant effect on performance data.
| * | Not annualized. |
| 1 | These returns do not reflect the effects of SCs. |
| 2 | A 2.25% front-end sales charge was deducted. |
| 3 | A 1.00% CDSC was deducted from the one year return because it is charged when you sell Class C shares within the first year after purchase. |
| 4 | Not subject to any SCs. |
| 5 | Effective September 16, 2013 Fiduciary Shares were renamed Institutional Service Class Shares. |
| 6 | Since inception date of September 18, 2013. Not Annualized. |
Expense Ratios
| Gross Expense Ratio* | Net Expense Ratio* | |||||||
| Class A | 1.22% | 0.91% | ||||||
| Class C | 1.47% | 1.36% | ||||||
| Institutional Service Class | 0.97% | 0.66% | ||||||
| Institutional Class | 0.72% | 0.61% | ||||||
| * | Current effective prospectus dated September 16, 2013. The difference between gross and net operating expenses reflects contractual waivers in place through November 30, 2015. Please see the Fund's most recent prospectus for details. |
73
| Fund Performance | Nationwide Ziegler Wisconsin Tax Exempt Fund |
Performance of a $10,000 Investment
Investment return and principal value will fluctuate, and when redeemed, shares may be worth more or less than original cost. Past performance is no guarantee of future results and does not reflect the deduction of taxes that a shareholder would pay on fund distributions or the redemption of fund shares. Investing in mutual funds involves market risk, including loss of principal. Performance returns assume the reinvestment of all distributions.
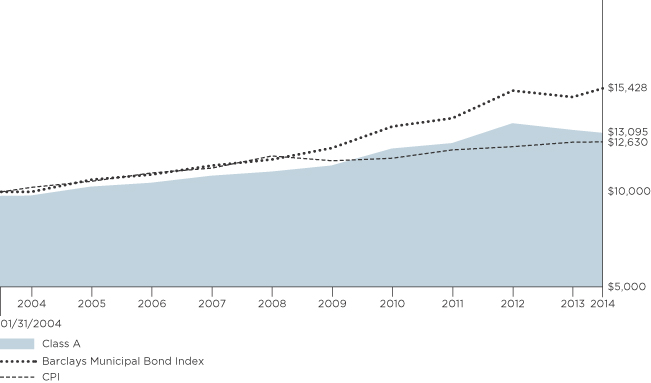
Comparative performance of $10,000 invested in Class A shares of the Nationwide Ziegler Wisconsin Tax Exempt Fund versus the Barclays Municipal Bond Index and the Consumer Price Index (CPI) over the 10-year period ended 1/31/14. Fund performance prior to the Fund’s inception on 9/16/13 is based on the Fund’s predecessor Fund. Unlike the Fund, the performance for these unmanaged indexes does not reflect any fees, expenses, or sales charges. One cannot invest directly in a market index. A description of the benchmarks can be found on the Market Index Definitions page at the back of this book.
74
| Shareholder Expense Example | Nationwide Ziegler Wisconsin Tax Exempt Fund |
As a shareholder of the Fund, you incur two types of costs: (1) transaction costs, including sales charges (loads) paid on purchase payments and redemption fees; and (2) ongoing costs, including investment advisory fees, administration fees, distribution fees and other Fund expenses. The examples below are intended to help you understand your ongoing costs (in dollars) of investing in the Fund and to compare these costs with the ongoing costs of investing in other mutual funds. Per Securities and Exchange Commission (“SEC”) requirements, the examples assume that you had a $1,000 investment in the Class at the beginning of the reporting period (August 1, 2013) and continued to hold your shares at the end of the reporting period (January 31, 2014).
Actual Expenses
For each Class of the Fund in the table below, the first line provides information about actual account values and actual expenses. You may use the information in this line, together with the amount you invested, to estimate the expenses that you paid from August 1, 2013 through January 31, 2014. Simply divide your account value by $1,000 (for example, an $8,600 account value divided by $1,000 = 8.6), then multiply the result by the number in the first line of each Class under the heading entitled “Expenses Paid During Period” to estimate the expenses you paid on your account during this period.
Hypothetical Expenses for Comparison Purposes
The second line of each Class in the table below provides information about hypothetical account values and hypothetical expenses based on the Class’ actual expense ratio and an assumed rate of return of 5% per year before expenses, which is not the Class’ actual return. The hypothetical account values and expenses may not be used to estimate the actual ending account balance or expenses you paid for the period from August 1, 2013 through January 31, 2014. You may use this information to compare the ongoing costs of investing in the Class of the Fund and other funds. To do so, compare this 5% hypothetical example with the 5% hypothetical examples that appear in the shareholder reports of the other funds.
Please note that the expenses shown in the table are meant to highlight your ongoing costs only and do not reflect any transaction costs, such as sales charges (loads) or redemption fees. If these transaction costs were included, your costs would have been higher. Therefore, the second line for each Class in the table is useful in comparing ongoing costs only, and will not help you determine the relative total costs of owning different funds. The examples also assume all dividends and distributions are reinvested.
Schedule of Shareholder Expenses
Expense Analysis of a $1,000 Investment
Nationwide Ziegler Wisconsin Tax Exempt Fund January 31, 2014 | Beginning Account Value ($) 08/01/13 | Ending Account Value ($) 01/31/14 | Expenses Paid During Period ($) 08/01/13 - 01/31/14 | Expense Ratio During Period (%) 08/01/13 - 01/31/14 | ||||||||
| Class A Shares | Actual | a | 1,000.00 | 989.30 | 4.51 | 0.90 | ||||||
| Hypotheticala,b | 1,000.00 | 1,020.67 | 4.58 | 0.90 | ||||||||
| Class C Shares | Actual | a | 1,000.00 | 987.10 | 6.76 | 1.35 | ||||||
| Hypotheticala,b | 1,000.00 | 1,018.40 | 6.87 | 1.35 | ||||||||
| Institutional Service Class Sharesc | Actual | a | 1,000.00 | 990.60 | 3.26 | 0.65 | ||||||
| Hypotheticala,b | 1,000.00 | 1,021.93 | 3.31 | 0.65 | ||||||||
| Institutional Class Shares | Actual | d | 1,000.00 | 1,009.90 | 2.23 | 0.60 | ||||||
| Hypotheticala,b | 1,000.00 | 1,022.18 | 3.06 | 0.60 | ||||||||
| a | Expenses are equal to the Fund’s annualized expense ratio multiplied by the average account value from August 1, 2013 through January 31, 2014 multiplied to reflect one-half year period. The expense ratio presented represents a six-month, annualized ratio in accordance with Securities and Exchange Commission guidelines. |
| b | Represents the hypothetical 5% return before expenses. |
| c | Effective September 16, 2013, Fiduciary Shares were renamed Institutional Service Class Shares. |
| d | Actual expenses are equal to the Fund’s annualized expense ratio multiplied by the average account value from September 19, 2013 through January 31, 2014 to reflect the period from commencement of operations. |
75
Statement of Investments
January 31, 2014 (Unaudited)
Nationwide Ziegler Wisconsin Tax Exempt Fund
| Municipal Bonds 96.1% | ||||||||||
| Principal Amount | Market Value | |||||||||
| ||||||||||
Guam 1.9% |
| |||||||||
Guam Government Business Privilege, Special Tax Revenue, | $ | 750,000 | $ | 863,962 | ||||||
Guam Power Authority Revenue, Refunding, RB, AGM Insured | ||||||||||
Series A, 5.00%, 10/01/19 | 515,000 | 589,927 | ||||||||
Series A, 5.00%, 10/01/22 | 870,000 | 990,678 | ||||||||
|
| |||||||||
| 2,444,567 | ||||||||||
|
| |||||||||
| ||||||||||
Massachusetts 0.9% |
| |||||||||
Massachusetts State, Housing Finance Agency, Multi-Family, ETM, RB, | 910,000 | 1,162,352 | ||||||||
|
| |||||||||
| ||||||||||
Puerto Rico 15.3% |
| |||||||||
Puerto Rico Commonwealth, Highway & Transportation Authority Revenue, Refunding, RB, AGM Insured, | 880,000 | 796,286 | ||||||||
Puerto Rico Commonwealth, Highway & Transportation Authority, Transportation Revenue, Refunding, RB, | 720,000 | 469,159 | ||||||||
Puerto Rico Commonwealth, Highway & Transportation, RB, AGM Insured, | 1,120,000 | 1,099,403 | ||||||||
Puerto Rico Commonwealth, Infrastructure Financing Authority, Special Tax Revenue, RB, FGIC Insured, | 945,000 | 698,034 | ||||||||
Puerto Rico Commonwealth, Public Improvement, GO, AGM Insured, | �� | 750,000 | 666,937 | |||||||
Puerto Rico Commonwealth, Public Improvement, Refunding, GO, | 1,130,000 | 984,253 | ||||||||
Puerto Rico Electric Power Authority, Power Revenue, RB | ||||||||||
Series XX, 4.63%, 07/01/25 | 2,100,000 | 1,270,248 | ||||||||
Series WW, 5.50%, 07/01/38 | 1,500,000 | 869,580 | ||||||||
Puerto Rico Municipal Finance Agency, GO, AGM Insured, | 880,000 | 742,870 | ||||||||
Puerto Rico Municipal Finance Agency, Refunding, GO, | 1,000,000 | 952,120 | ||||||||
Puerto Rico Public Buildings Authority Revenue, Guaranteed, Government Facilities, Refunding, RB, | 1,000,000 | 731,070 | ||||||||
| Municipal Bonds (continued) | ||||||||||
| Principal Amount | Market Value | |||||||||
| ||||||||||
Puerto Rico (continued) |
| |||||||||
Puerto Rico Public Buildings Authority Revenue, Guaranteed, Government Facilities, Refunding, RB, AMBAC Insured, | $ | 1,250,000 | $ | 1,197,450 | ||||||
Puerto Rico Public Buildings Authority Revenue, Guaranteed, Refunding, RB, XLCA Insured, | 500,000 | 382,975 | ||||||||
Puerto Rico Sales Tax Financing, Corporate Sales Tax Revenue, RB, | ||||||||||
5.00%, 08/01/17 | 505,000 | 498,475 | ||||||||
5.50%, 08/01/37 | 2,500,000 | 1,791,325 | ||||||||
5.75%, 08/01/37 | 1,400,000 | 1,033,508 | ||||||||
6.38%, 08/01/39 | 3,000,000 | 2,352,600 | ||||||||
6.00%, 08/01/42 | 1,000,000 | 752,770 | ||||||||
6.50%, 08/01/44 | 2,000,000 | 1,584,400 | ||||||||
Puerto Rico Sales Tax Funding, RB, 5.00%, 08/01/22 | 1,000,000 | 996,580 | ||||||||
|
| |||||||||
| 19,870,043 | ||||||||||
|
| |||||||||
| ||||||||||
Wisconsin 78.0% |
| |||||||||
Appleton Redevelopment Authority, Room Tax, Fox Cities Performing Arts, Refunding, Special Tax Revenue | ||||||||||
2.20%, 09/01/18 | 355,000 | 359,274 | ||||||||
2.40%, 09/01/19 | 290,000 | 291,241 | ||||||||
2.60%, 09/01/20 | 355,000 | 353,069 | ||||||||
Beloit, Community Development Authority, Lease Revenue, RB | ||||||||||
4.70%, 03/01/21 | 345,000 | 368,919 | ||||||||
4.75%, 03/01/22 | 300,000 | 318,258 | ||||||||
Beloit, Community Development Authority, Redevelopment Lease Revenue, RB, | 475,000 | 476,396 | ||||||||
Burlington, Community Development Authority, Lease Revenue, Refunding, RB | ||||||||||
4.00%, 04/01/16 | 200,000 | 207,832 | ||||||||
4.10%, 04/01/17 | 750,000 | 777,922 | ||||||||
Cudahy, Community Development Authority, Redevelopment Lease Revenue, Refunding, RB | ||||||||||
Series A, | 500,000 | 502,645 | ||||||||
4.25%, 06/01/17 | 500,000 | 530,930 | ||||||||
Series A, 1.50%, 06/01/18 | 400,000 | 400,384 | ||||||||
Series A, 1.75%, 06/01/19 | 300,000 | 297,786 | ||||||||
Series A, 1.95%, 06/01/19 | 145,000 | 145,080 | ||||||||
Series A, 2.20%, 06/01/20 | 250,000 | 247,775 | ||||||||
Series A, 2.40%, 06/01/21 | 360,000 | 352,253 | ||||||||
Series A, 2.60%, 06/01/22 | 245,000 | 237,699 | ||||||||
76
Statement of Investments (Continued)
January 31, 2014 (Unaudited)
Nationwide Ziegler Wisconsin Tax Exempt Fund (Continued)
| Municipal Bonds (continued) | ||||||||||
| Principal Amount | Market Value | |||||||||
| ||||||||||
Wisconsin (continued) |
| |||||||||
Delafield, Community Development Authority, Redevelopment Revenue, St. Johns Northwestern Military, RB | ||||||||||
4.15%, 06/01/25 | $ | 250,000 | $ | 264,930 | ||||||
4.25%, 06/01/26 | 330,000 | 350,057 | ||||||||
4.60%, 06/01/30 | 600,000 | 636,930 | ||||||||
Glendale, Community Development Authority, Lease Revenue, Bayshore Public Parking Facility, RB, | 1,500,000 | 1,518,765 | ||||||||
Glendale, Community Development Authority, Lease Revenue, Bayshore, Refunding, RB, | 1,000,000 | 1,021,490 | ||||||||
Glendale, Community Development Authority, Lease Revenue, Tax Increment District No.7, Refunding, RB | ||||||||||
Series B, | 2,250,000 | 2,389,837 | ||||||||
2.60%, 09/01/21 | 3,250,000 | 3,212,918 | ||||||||
2.75%, 09/01/22 | 2,750,000 | 2,691,095 | ||||||||
Green Bay, Redevelopment Authority, Development Revenue, Bellin Memorial Hospital, RB | ||||||||||
6.00%, 12/01/29 | 1,000,000 | 1,067,570 | ||||||||
6.15%, 12/01/32 | 1,000,000 | 1,069,630 | ||||||||
Green Bay, Redevelopment Authority, Lease Revenue, Convention Center Project, Refunding, Special Tax Revenue | ||||||||||
4.20%, 06/01/25 | 1,000,000 | 1,025,420 | ||||||||
4.30%, 06/01/29 | 1,000,000 | 1,017,150 | ||||||||
Johnson Creek, Community Development Authority, Lease Revenue, Tax Increment District No. 3, Refunding, RB | ||||||||||
2.65%, 12/01/24 | 350,000 | 321,066 | ||||||||
2.80%, 12/01/25 | 200,000 | 180,872 | ||||||||
2.90%, 12/01/26 | 200,000 | 178,954 | ||||||||
Madison, Community Development Authority Revenue, Alumni Research Foundation Project, RB | ||||||||||
5.00%, 10/01/14 | 225,000 | 232,137 | ||||||||
5.00%, 10/01/22 | 1,065,000 | 1,236,753 | ||||||||
5.00%, 10/01/27 | 925,000 | 1,059,328 | ||||||||
5.00%, 10/01/28 | 250,000 | 285,605 | ||||||||
5.00%, 10/01/34 | 4,500,000 | 5,014,035 | ||||||||
Milwaukee, Redevelopment Authority Revenue, Milwaukee Public Schools, Refunding, RB | ||||||||||
5.00%, 08/01/17 | 1,000,000 | 1,133,470 | ||||||||
5.00%, 08/01/18 | 1,000,000 | 1,152,910 | ||||||||
| Municipal Bonds (continued) | ||||||||||
| Principal Amount | Market Value | |||||||||
| ||||||||||
Wisconsin (continued) |
| |||||||||
Milwaukee, Redevelopment Authority Revenue, Milwaukee School of Engineering, Refunding, RB, AGM Insured | ||||||||||
2.75%, 04/01/21 | $ | 1,080,000 | $ | 1,093,025 | ||||||
3.00%, 04/01/22 | 375,000 | 377,644 | ||||||||
3.20%, 04/01/23 | 1,000,000 | 1,003,610 | ||||||||
3.75%, 04/01/28 | 950,000 | 924,464 | ||||||||
4.10%, 04/01/32 | 2,500,000 | 2,508,500 | ||||||||
Milwaukee, Redevelopment Authority Revenue, Summerfest Project, RB | ||||||||||
4.50%, 08/01/23 | 110,000 | 117,700 | ||||||||
4.70%, 08/01/25 | 110,000 | 117,207 | ||||||||
5.00%, 08/01/30 | 2,000,000 | 2,125,260 | ||||||||
Milwaukee, Redevelopment Authority, Lease Revenue, Milwaukee Public Schools, Congress, RB, | 500,000 | 513,350 | ||||||||
Monroe, Redevelopment Authority, Development Revenue, MonroeClinic Inc., RB, | 2,850,000 | 3,013,020 | ||||||||
Neenah, Community Development Authority, Lease Revenue, District No.8 Riverwalk Zone, Prerefunded Balance, RB | ||||||||||
Series A, 4.30%, 12/01/20 | 1,000,000 | 1,033,410 | ||||||||
Series A, 5.13%, 12/01/23 | 1,000,000 | 1,040,510 | ||||||||
Series A, 4.70%, 12/01/28 | 1,250,000 | 1,296,175 | ||||||||
Neenah, Community Development Authority, Lease Revenue, RB | ||||||||||
Series A, 4.63%, 12/01/28 | 600,000 | 622,524 | ||||||||
Series A, 4.75%, 12/01/32 | 400,000 | 405,964 | ||||||||
Neenah, Community Development Authority, Lease Revenue, Refunding, RB | ||||||||||
4.00%, 12/01/26 | 500,000 | 525,555 | ||||||||
4.10%, 12/01/27 | 1,000,000 | 1,053,540 | ||||||||
4.20%, 12/01/28 | 500,000 | 528,375 | ||||||||
Osceola, Redevelopment Authority, Lease Revenue, Refunding, RB | ||||||||||
Series A, 1.65%, 12/01/14 | 200,000 | 201,278 | ||||||||
Series A, 1.90%, 12/01/15 | 175,000 | 177,569 | ||||||||
Southeast Wisconsin Professional Baseball Park District, ETM, COP, National-RE Insured | ||||||||||
0.00%, 12/15/15 | 970,000 | 961,813 | ||||||||
0.00%, 12/15/17 | 1,000,000 | 959,510 | ||||||||
Southeast Wisconsin Professional Baseball Park District, Sales Tax Revenue, Refunding, ETM, RB, National-RE Insured | ||||||||||
Series A, 5.50%, 12/15/18 | 250,000 | 300,370 | ||||||||
Series A, 5.50%, 12/15/19 | 2,200,000 | 2,683,582 | ||||||||
77
Statement of Investments (Continued)
January 31, 2014 (Unaudited)
Nationwide Ziegler Wisconsin Tax Exempt Fund (Continued)
| Municipal Bonds (continued) | ||||||||||
| Principal Amount | Market Value | |||||||||
| ||||||||||
Wisconsin (continued) |
| |||||||||
Southeast Wisconsin Professional Baseball Park District, Sales Tax Revenue, Refunding, ETM, RB, National-RE Insured (continued) | ||||||||||
Series A, 5.50%, 12/15/20 | $ | 1,000,000 | $ | 1,226,610 | ||||||
Series A, 5.50%, 12/15/21 | 1,500,000 | 1,843,695 | ||||||||
Southeast Wisconsin Professional Baseball Park District, Sales Tax Revenue, Refunding, RB, National-RE Insured | ||||||||||
Series A, 5.50%, 12/15/14 | 3,660,000 | 3,828,067 | ||||||||
Series A, 5.50%, 12/15/23 | 1,025,000 | 1,228,524 | ||||||||
Series A, 5.50%, 12/15/26 | 4,510,000 | 5,319,906 | ||||||||
Sun Prairie, Community Development Authority, Lease Revenue, RB | ||||||||||
4.40%, 08/01/20 | 150,000 | 150,225 | ||||||||
4.50%, 08/01/21 | 150,000 | 150,192 | ||||||||
Sun Prairie, Community Development Authority, Lease Revenue, Tax Incremental District No. 8, RB | ||||||||||
4.30%, 08/01/21 | 975,000 | 1,021,654 | ||||||||
4.35%, 08/01/22 | 975,000 | 1,022,677 | ||||||||
Waukesha, Redevelopment Authority, Weldall Manufacturing Inc. Project, RB | ||||||||||
4.20%, 12/01/24 | 150,000 | 156,246 | ||||||||
4.50%, 12/01/30 | 1,200,000 | 1,214,604 | ||||||||
West Bend, Redevelopment Authority, Lease Revenue, Prerefunded Balance, RB | ||||||||||
4.50%, 10/01/23 | 250,000 | 267,377 | ||||||||
4.55%, 10/01/24 | 250,000 | 267,602 | ||||||||
4.60%, 10/01/25 | 150,000 | 160,697 | ||||||||
4.65%, 10/01/28 | 250,000 | 268,053 | ||||||||
Weston, Community Development Authority, Lease Revenue, RB | ||||||||||
Series A, 4.10%, 10/01/16 | 500,000 | 511,080 | ||||||||
Series A, 4.25%, 10/01/17 | 200,000 | 204,232 | ||||||||
Series A, 4.35%, 10/01/18 | 500,000 | 500,900 | ||||||||
Series A, 4.40%, 10/01/18 | 500,000 | 509,890 | ||||||||
Series A, 4.45%, 10/01/19 | 500,000 | 500,785 | ||||||||
Series A, 5.25%, 10/01/20 | 445,000 | 454,216 | ||||||||
Series A, 4.50%, 10/01/21 | 100,000 | 104,487 | ||||||||
Series A, 4.70%, 10/01/21 | 1,230,000 | 1,248,069 | ||||||||
Series B, 4.75%, 10/01/22 | 130,000 | 131,716 | ||||||||
Series B, 4.75%, 10/01/23 | 140,000 | 141,667 | ||||||||
Series A, 4.63%, 10/01/25 | 825,000 | 847,201 | ||||||||
Wisconsin Center District, Junior Dedicated Tax Revenue, Refunding, RB, AGM Insured, | 2,585,000 | 2,891,788 | ||||||||
Wisconsin Center District, Junior Dedicated Tax Revenue, Refunding, Special Tax Revenue, | 1,000,000 | 1,060,220 | ||||||||
| Municipal Bonds (continued) | ||||||||||
| Principal Amount | Market Value | |||||||||
| ||||||||||
Wisconsin (continued) |
| |||||||||
Wisconsin Center District, Senior Dedicated Tax Revenue, RB, National- RE Insured, | $ | 2,500,000 | $ | 1,468,400 | ||||||
Wisconsin Dells, Community Development Authority, Lease Revenue, Prerefunded balance, RB, | 1,500,000 | 1,641,150 | ||||||||
Wisconsin Dells, Community Development Authority, Lease Revenue, Prerefunded Balance, RB, | 1,200,000 | 1,256,904 | ||||||||
Wisconsin Dells, Community Development Authority, Lease Revenue, RB | ||||||||||
4.30%, 03/01/22 | 225,000 | 233,476 | ||||||||
4.45%, 03/01/25 | 300,000 | 306,510 | ||||||||
Wisconsin Housing & Economic Development Authority, Home Ownership Revenue, Prerefunded Balance, RB, | 770,000 | 873,719 | ||||||||
Wisconsin Housing & Economic Development Authority, Home Ownership Revenue, Prerefunded Balance, RB, National-RE Insured, | 750,000 | 861,900 | ||||||||
Wisconsin Housing & Economic Development Authority, Housing Revenue, RB | ||||||||||
Series E, 4.70%, 11/01/25 | 275,000 | 278,270 | ||||||||
Series B, 4.30%, 05/01/27 | 1,000,000 | 1,012,120 | ||||||||
Series E, 4.90%, 11/01/35 | 1,650,000 | 1,660,411 | ||||||||
Series B, 4.40%, 05/01/37 | 500,000 | 500,180 | ||||||||
Wisconsin Housing & Economic Development Authority, Housing Revenue, Refunding, RB | ||||||||||
Series A, 4.10%, 11/01/19 | 465,000 | 513,421 | ||||||||
Series A, 4.88%, 11/01/25 | 2,225,000 | 2,358,923 | ||||||||
Series A, 5.38%, 11/01/30 | 2,135,000 | 2,206,266 | ||||||||
Wisconsin Housing & Economic Development Authority, Multifamily Housing, RB | ||||||||||
2.00%, 04/01/19 | 150,000 | 151,364 | ||||||||
2.40%, 04/01/20 | 100,000 | 101,147 | ||||||||
2.80%, 04/01/21 | 150,000 | 152,165 | ||||||||
3.10%, 04/01/22 | 100,000 | 101,177 | ||||||||
3.45%, 04/01/24 | 100,000 | 101,815 | ||||||||
3.80%, 04/01/26 | 285,000 | 290,047 | ||||||||
78
Statement of Investments (Continued)
January 31, 2014 (Unaudited)
Nationwide Ziegler Wisconsin Tax Exempt Fund (Continued)
| Municipal Bonds (continued) | ||||||||||
| Principal Amount | Market Value | |||||||||
| ||||||||||
Wisconsin (continued) |
| |||||||||
Wisconsin Housing & Economic Development Authority, Multifamily Housing, RB (continued) | ||||||||||
4.30%, 04/01/30 | $ | 115,000 | $ | 117,993 | ||||||
4.25%, 12/01/35 | 1,500,000 | 1,576,170 | ||||||||
|
| |||||||||
| $ | 101,508,248 | |||||||||
|
| |||||||||
Total Municipal Bonds | 124,985,210 | |||||||||
|
| |||||||||
| Mutual Fund 2.8% | ||||||||||
| Shares | Market Value | |||||||||
| ||||||||||
Money Market Fund 2.8% | ||||||||||
Invesco Tax Free Cash Reserve Portfolio —Institutional Shares, 0.08% (a) | 3,691,234 | 3,691,234 | ||||||||
|
| |||||||||
Total Mutual Fund | 3,691,234 | |||||||||
|
| |||||||||
Total Investments |
| 128,676,444 | ||||||||
Other assets in excess of liabilities — 1.1% |
| 1,370,249 | ||||||||
|
| |||||||||
NET ASSETS — 100.0% |
| $ | 130,046,693 | |||||||
|
| |||||||||
| (a) | Represents 7-day effective yield as of January 31, 2014. |
| (b) | See notes to financial statements for tax unrealized appreciation/(depreciation) of securities. |
| AGM | Assured Guaranty Municipal Corporation |
| AMBAC | American Municipal Bond Assurance Corporation |
| COP | Certificates of Participation |
| ETM | Escrowed to Maturity |
| FGIC | Financial Guaranty Insurance Corporation |
| GO | General Obligation |
| RB | Revenue Bond |
| RE | Reinsured |
| XLCA | XL Capital Assurance |
The accompanying notes are an integral part of these financial statements.
79
Statement of Assets and Liabilities
January 31, 2014 (Unaudited)
| Nationwide Ziegler Wisconsin Tax Exempt Fund | ||||||
Assets: | ||||||
Investments, at value (cost $131,093,959) | $ | 128,676,444 | ||||
Interest and dividends receivable | 1,636,230 | |||||
Receivable for capital shares issued | 20,449 | |||||
Prepaid expenses | 7,633 | |||||
|
| |||||
Total Assets | 130,340,756 | |||||
|
| |||||
Liabilities: | ||||||
Distributions payable | 74,585 | |||||
Payable for capital shares redeemed | 58,266 | |||||
Accrued expenses and other payables: | ||||||
Investment advisory fees | 38,441 | |||||
Fund administration fees | 10,652 | |||||
Distribution fees | 33,504 | |||||
Administrative servicing fees | 23,124 | |||||
Accounting and transfer agent fees | 6,011 | |||||
Trustee fees | 2,324 | |||||
Deferred compensation (Note 2) | 11,544 | |||||
Custodian fees | 901 | |||||
Compliance program costs (Note 3) | 1,377 | |||||
Professional fees | 21,198 | |||||
Printing fees | 9,023 | |||||
Other | 3,113 | |||||
|
| |||||
Total Liabilities | 294,063 | |||||
|
| |||||
Net Assets | $ | 130,046,693 | ||||
|
| |||||
Represented by: | ||||||
Capital | $ | 133,601,731 | ||||
Accumulated distributions in excess of net investment income | (98,750 | ) | ||||
Accumulated net realized losses from investment transactions | (1,038,773 | ) | ||||
Net unrealized appreciation/(depreciation) from investments | (2,417,515 | ) | ||||
|
| |||||
Net Assets | $ | 130,046,693 | ||||
|
| |||||
Net Assets: | ||||||
Net Assets: | ||||||
Class A Shares | $ | 115,851,408 | ||||
Class C Shares | 13,638,159 | |||||
Institutional Service Class Shares | 547,030 | |||||
Institutional Class Shares | 10,096 | |||||
|
| |||||
Total | $ | 130,046,693 | ||||
|
| |||||
Shares Outstanding (unlimited number of shares authorized): | ||||||
Class A Shares (a) | 11,554,198 | |||||
Class C Shares (b) | 1,361,982 | |||||
Institutional Service Class Shares | 54,563 | |||||
Institutional Class Shares | 1,007 | |||||
|
| |||||
Total | 12,971,750 | |||||
|
| |||||
80
Statement of Assets and Liabilities (Continued)
January 31, 2014 (Unaudited)
| Nationwide Ziegler Wisconsin Tax Exempt Fund | ||||||
Net asset value and redemption price per share (Net assets by class divided by shares outstanding by class, respectively): | ||||||
Class A Shares | $ | 10.03 | ||||
Class C Shares | $ | 10.01 | ||||
Institutional Service Class Shares | $ | 10.03 | ||||
Institutional Class Shares | $ | 10.03 | ||||
Maximum offering price per share (100%/(100%-maximum sales charge) of net asset value adjusted to the nearest cent): | ||||||
Class A Shares | $ | 10.26 | ||||
|
| |||||
Maximum Sales Charge: | ||||||
Class A Shares | 2.25 | % | ||||
|
| |||||
| (a) | For Class A Shares, the redemption price per share is reduced by 0.75% on sales of shares of original purchases of $500,000 or more or that were not subject to a front-end sales charge made with 18 months of the purchase date. |
| (b) | For Class C Shares, the redemption price per share is reduced by 1.00% for shares held less than 1 year. |
The accompanying notes are an integral part of these financial statements.
81
Statement of Operations
For the Six Months Ended January 31, 2014 (Unaudited)
| Nationwide Ziegler Wisconsin Tax Exempt Fund | ||||||
INVESTMENT INCOME: | ||||||
Interest income | $ | 2,694,506 | ||||
Dividend income | 691 | |||||
|
| |||||
Total Income | 2,695,197 | |||||
|
| |||||
EXPENSES: | ||||||
Investment advisory fees | 346,553 | |||||
Fund administration fees | 89,900 | |||||
Distribution fees Class A | 153,274 | |||||
Distribution fees Class B (a) | 393 | |||||
Distribution fees Class C | 57,225 | |||||
Administrative servicing fees Class A | 73,403 | |||||
Administrative servicing fees Class B (a) | 131 | |||||
Administrative servicing fees Institutional Service Class (b) | 392 | |||||
Registration and filing fees | 8,308 | |||||
Professional fees | 24,227 | |||||
Printing fees | 15,067 | |||||
Trustee fees | 2,844 | |||||
Custodian fees | 3,151 | |||||
Accounting and transfer agent fees | 16,550 | |||||
Compliance program costs (Note 3) | 1,611 | |||||
Other | 13,841 | |||||
|
| |||||
Total expenses before earnings credit, fees waived, and expenses reimbursed | 806,870 | |||||
|
| |||||
Earnings credit (Note 4) | (174 | ) | ||||
Administrative servicing fees voluntarily waived – Class A (Note 3) | (32,166 | ) | ||||
Administrative servicing fees voluntarily waived – Institutional Service Class (b) (Note 3) | (185 | ) | ||||
Expenses reimbursed by adviser (Note 3) | (116,935 | ) | ||||
|
| |||||
Net Expenses | 657,410 | |||||
|
| |||||
NET INVESTMENT INCOME | 2,037,787 | |||||
|
| |||||
REALIZED/UNREALIZED GAINS (LOSSES) FROM INVESTMENTS: | ||||||
Net realized losses from investment transactions | (780,071 | ) | ||||
Net change in unrealized appreciation/(depreciation) from investments | (3,023,185 | ) | ||||
|
| |||||
Net realized/unrealized losses from investments | (3,803,256 | ) | ||||
|
| |||||
CHANGE IN NET ASSETS RESULTING FROM OPERATIONS | $ | (1,765,469 | ) | |||
|
| |||||
| (a) | Effective September 16, 2013, Class B Shares were converted to Class A Shares. |
| (b) | Effective September 16, 2013, Fiduciary Shares were renamed Institutional Service Class Shares. |
The accompanying notes are an integral part of these financial statements.
82
Statements of Changes in Net Assets
| Nationwide Ziegler Wisconsin Tax Exempt Fund | ||||||||||||
| Six Months Ended January 31, 2014 (Unaudited) | Year Ended July 31, 2013 | |||||||||||
Operations: | ||||||||||||
Net investment income | $ | 2,037,787 | $ | 4,558,938 | ||||||||
Net realized gains/(losses) from investment transactions | (780,071 | ) | 119,834 | |||||||||
Net change in unrealized appreciation/(depreciation) from investments | (3,023,185 | ) | (9,152,540 | ) | ||||||||
|
|
|
| |||||||||
Change in net assets resulting from operations | (1,765,469 | ) | (4,473,768 | ) | ||||||||
|
|
|
| |||||||||
Distributions to Shareholders From: | ||||||||||||
Net investment income: | ||||||||||||
Class A | (1,920,639 | ) | (4,059,716 | ) | ||||||||
Class B (a) | (701 | ) | (18,645 | ) | ||||||||
Class C | (204,811 | ) | (459,370 | ) | ||||||||
Institutional Service Class (b) | (10,250 | ) | (35,247 | ) | ||||||||
Institutional Class | (136 | )(c) | – | |||||||||
|
|
|
| |||||||||
Change in net assets from shareholder distributions | (2,136,537 | ) | (4,572,978 | ) | ||||||||
|
|
|
| |||||||||
Change in net assets from capital transactions | (18,056,567 | ) | (4,957,196 | ) | ||||||||
|
|
|
| |||||||||
Change in net assets | (21,958,573 | ) | (14,003,942 | ) | ||||||||
|
|
|
| |||||||||
Net Assets: | ||||||||||||
Beginning of period | 152,005,266 | 166,009,208 | ||||||||||
|
|
|
| |||||||||
End of period | $ | 130,046,693 | $ | 152,005,266 | ||||||||
|
|
|
| |||||||||
Accumulated distributions in excess of net investment income at end of period | $ | (98,750 | ) | $ | – | |||||||
|
|
|
| |||||||||
CAPITAL TRANSACTIONS: | ||||||||||||
Class A Shares | ||||||||||||
Proceeds from shares issued | $ | 1,772,124 | $ | 11,633,693 | ||||||||
Dividends reinvested | 1,487,803 | 3,074,159 | ||||||||||
Cost of shares redeemed | (16,949,282 | ) | (20,534,726 | ) | ||||||||
|
|
|
| |||||||||
Total Class A Shares | (13,689,355 | ) | (5,826,874 | ) | ||||||||
|
|
|
| |||||||||
Class B Shares (a) | ||||||||||||
Proceeds from shares issued | – | 8,299 | ||||||||||
Dividends reinvested | 602 | 7,893 | ||||||||||
Cost of shares redeemed | (496,840 | ) | (523,647 | ) | ||||||||
|
|
|
| |||||||||
Total Class B Shares | (496,238 | ) | (507,455 | ) | ||||||||
|
|
|
| |||||||||
Class C Shares | ||||||||||||
Proceeds from shares issued | 137,865 | 4,810,457 | ||||||||||
Dividends reinvested | 162,725 | 368,866 | ||||||||||
Cost of shares redeemed | (3,816,554 | ) | (4,087,279 | ) | ||||||||
|
|
|
| |||||||||
Total Class C Shares | (3,515,964 | ) | 1,092,044 | |||||||||
|
|
|
| |||||||||
| (a) | Effective September 16, 2013, Class B Shares were converted to Class A Shares. |
| (b) | Effective September 16, 2013, Fiduciary Shares were renamed Institutional Service Class Shares. |
| (c) | For the period September 19, 2013 (commencement of operations) through January 31, 2014. |
83
Statements of Changes in Net Assets (Continued)
| Nationwide Ziegler Wisconsin Tax Exempt Fund | ||||||||||||
| Six Months Ended January 31, 2014 (Unaudited) | Year Ended July 31, 2013 | |||||||||||
CAPITAL TRANSACTIONS: (continued) | ||||||||||||
Institutional Service Class Shares (b) | ||||||||||||
Proceeds from shares issued | $ | 7,500 | $ | 1,193,688 | ||||||||
Dividends reinvested | 7,257 | 26,519 | ||||||||||
Cost of shares redeemed | (379,921 | ) | (935,118 | ) | ||||||||
|
|
|
| |||||||||
Total Institutional Service Class Shares | (365,164 | ) | 285,089 | |||||||||
|
|
|
| |||||||||
Institutional Class Shares | ||||||||||||
Proceeds from shares issued | 14,119 | (c) | – | |||||||||
Dividends reinvested | 129 | (c) | – | |||||||||
Cost of shares redeemed | (4,094 | )(c) | – | |||||||||
|
|
|
| |||||||||
Total Institutional Class Shares | 10,154 | (c) | – | |||||||||
|
|
|
| |||||||||
Change in net assets from capital transactions | $ | (18,056,567 | ) | $ | (4,957,196 | ) | ||||||
|
|
|
| |||||||||
SHARE TRANSACTIONS: | ||||||||||||
Class A Shares | ||||||||||||
Issued | 176,782 | 1,075,462 | ||||||||||
Reinvested | 147,870 | 286,146 | ||||||||||
Redeemed | (1,684,375 | ) | (1,920,307 | ) | ||||||||
|
|
|
| |||||||||
Total Class A Shares | (1,359,723 | ) | (558,699 | ) | ||||||||
|
|
|
| |||||||||
Class B Shares (a) | ||||||||||||
Issued | – | 772 | ||||||||||
Reinvested | 59 | 735 | ||||||||||
Redeemed | (49,551 | ) | (49,457 | ) | ||||||||
|
|
|
| |||||||||
Total Class B Shares | (49,492 | ) | (47,950 | ) | ||||||||
|
|
|
| |||||||||
Class C Shares | ||||||||||||
Issued | 13,788 | 445,674 | ||||||||||
Reinvested | 16,194 | 34,392 | ||||||||||
Redeemed | (380,124 | ) | (386,759 | ) | ||||||||
|
|
|
| |||||||||
Total Class C Shares | (350,142 | ) | 93,307 | |||||||||
|
|
|
| |||||||||
Institutional Service Class Shares (b) | ||||||||||||
Issued | 756 | 110,801 | ||||||||||
Reinvested | 721 | 2,468 | ||||||||||
Redeemed | (37,347 | ) | (87,654 | ) | ||||||||
|
|
|
| |||||||||
Total Institutional Service Class Shares | (35,870 | ) | 25,615 | |||||||||
|
|
|
| |||||||||
Institutional Class Shares | ||||||||||||
Issued | 1,404 | (c) | – | |||||||||
Reinvested | 13 | (c) | – | |||||||||
Redeemed | (410 | )(c) | – | |||||||||
|
|
|
| |||||||||
Total Institutional Class Shares | 1,007 | (c) | – | |||||||||
|
|
|
| |||||||||
Total change in shares | (1,794,220 | ) | (487,727 | ) | ||||||||
|
|
|
| |||||||||
Amounts designated as “–” are zero or have been rounded to zero.
| (a) | Effective September 16, 2013, Class B Shares were converted to Class A Shares. |
| (b) | Effective September 16, 2013, Fiduciary Shares were renamed Institutional Service Class Shares. |
| (c) | For the period September 19, 2013 (commencement of operations) through January 31, 2014 |
The accompanying notes are an integral part of these financial statements.
84
Financial Highlights
Selected data for each share of capital outstanding throughout the periods indicated
Nationwide Ziegler Wisconsin Tax Exempt Fund
| Operations | Distributions | Ratios/Supplemental Data | ||||||||||||||||||||||||||||||||||||||||||||||||||||||
| Net Asset Value, Beginning of Period | Net Investment Income | Net Realized and Unrealized Gains (Losses) from Investments | Total from Operations | Net Investment Income | Net Realized Gains | Total Distributions | Net Asset Value, End of Period | Total Return (a)(b) | Net Assets at End of Period | Ratio of Expenses to Average Net Assets (c) | Ratio of Net Investment Income to Average Net Assets (c) | Ratio of Expenses (Prior to Reimbursements) to Average Net Assets (c)(d) | Portfolio Turnover (e) | |||||||||||||||||||||||||||||||||||||||||||
| Class A Shares | ||||||||||||||||||||||||||||||||||||||||||||||||||||||||
Six Months Ended January 31, 2014 (f) (Unaudited) | $ | 10.30 | 0.15 | (0.26 | ) | (0.11 | ) | (0.16 | ) | – | (0.16 | ) | $ | 10.03 | (1.07% | ) | $ | 115,851,408 | 0.90% | 2.99% | 1.12% | 2.25% | ||||||||||||||||||||||||||||||||||
Year Ended July 31, 2013 (f) | $ | 10.88 | 0.30 | (0.58 | ) | (0.28 | ) | (0.30 | ) | – | (0.30 | ) | $ | 10.30 | (2.65% | ) | $ | 132,960,429 | 0.90% | 2.79% | 1.29% | 14.00% | ||||||||||||||||||||||||||||||||||
Year Ended July 31, 2012 (f) | $ | 10.37 | 0.34 | 0.51 | 0.85 | (0.34 | ) | – | (0.34 | ) | $ | 10.88 | 8.30% | $ | 146,648,612 | 0.90% | 3.17% | 1.31% | 13.00% | |||||||||||||||||||||||||||||||||||||
Year Ended July 31, 2011 (f) | $ | 10.52 | 0.36 | (0.13 | ) | 0.23 | (0.37 | ) | (0.01 | ) | (0.38 | ) | $ | 10.37 | 2.28% | $ | 130,165,154 | 0.90% | 3.53% | 1.31% | 10.00% | |||||||||||||||||||||||||||||||||||
Year Ended July 31, 2010 (f) | $ | 10.10 | 0.36 | 0.42 | 0.78 | (0.36 | ) | – | (0.36 | ) | $ | 10.52 | 7.95% | $ | 146,664,880 | 0.90% | 3.45% | 1.29% | 13.00% | |||||||||||||||||||||||||||||||||||||
Period Ended July 31, 2009 (g) | $ | 9.61 | 0.27 | 0.48 | 0.75 | (0.26 | ) | – | (0.26 | ) | $ | 10.10 | 7.76% | $ | 140,399,350 | 1.03% | 3.61% | 1.28% | 9.00% | |||||||||||||||||||||||||||||||||||||
Year Ended October 31, 2008 | $ | 10.35 | 0.37 | (h) | (0.74 | ) | (0.37 | ) | (0.37 | ) | – | (0.37 | ) | $ | 9.61 | (3.72% | ) | $ | 143,532,885 | 0.95% | 3.59% | 1.06% | 9.00% | |||||||||||||||||||||||||||||||||
| Class C Shares | ||||||||||||||||||||||||||||||||||||||||||||||||||||||||
Six Months Ended January 31, 2014 (f) (Unaudited) | $ | 10.28 | 0.13 | (0.26 | ) | (0.13 | ) | (0.14 | ) | – | (0.14 | ) | $ | 10.01 | (1.29% | ) | $ | 13,638,159 | 1.35% | 2.55% | 1.51% | 2.25% | ||||||||||||||||||||||||||||||||||
Year Ended July 31, 2013 (f) | $ | 10.87 | 0.25 | (0.59 | ) | (0.34 | ) | (0.25 | ) | – | (0.25 | ) | $ | 10.28 | (3.18% | ) | $ | 17,604,748 | 1.35% | 2.34% | 1.54% | 14.00% | ||||||||||||||||||||||||||||||||||
Year Ended July 31, 2012 (f) | $ | 10.36 | 0.29 | 0.51 | 0.80 | (0.29 | ) | – | (0.29 | ) | $ | 10.87 | 7.82% | $ | 17,595,471 | 1.35% | 2.71% | 1.56% | 13.00% | |||||||||||||||||||||||||||||||||||||
Year Ended July 31, 2011 (f) | $ | 10.51 | 0.32 | (0.14 | ) | 0.18 | (0.32 | ) | (0.01 | ) | (0.33 | ) | $ | 10.36 | 1.93% | $ | 10,831,411 | 1.35% | 3.08% | 1.56% | 10.00% | |||||||||||||||||||||||||||||||||||
Year Ended July 31, 2010 (f) | $ | 10.09 | 0.31 | 0.43 | 0.74 | (0.32 | ) | – | (0.32 | ) | $ | 10.51 | 7.37% | $ | 10,156,665 | 1.35% | 3.00% | 1.54% | 13.00% | |||||||||||||||||||||||||||||||||||||
Period Ended July 31, 2009 (g) | $ | 9.60 | 0.22 | 0.48 | 0.70 | (0.21 | ) | – | (0.21 | ) | $ | 10.09 | 7.22% | $ | 6,406,280 | 1.72% | 2.92% | 1.93% | 9.00% | |||||||||||||||||||||||||||||||||||||
Year Ended October 31, 2008 | $ | 10.34 | 0.29 | (h) | (0.74 | ) | (0.45 | ) | (0.29 | ) | – | (0.29 | ) | $ | 9.60 | (4.33% | ) | $ | 6,009,357 | 1.70% | 2.84% | 1.83% | 9.00% | |||||||||||||||||||||||||||||||||
| Institutional Service Class Shares (i) | ||||||||||||||||||||||||||||||||||||||||||||||||||||||||
Six Months Ended January 31, 2014 (f) (Unaudited) | $ | 10.30 | 0.16 | (0.26 | ) | (0.10 | ) | (0.17 | ) | – | (0.17 | ) | $ | 10.03 | (0.94% | ) | $ | 547,030 | 0.65% | 3.24% | 0.88% | 2.25% | ||||||||||||||||||||||||||||||||||
Year Ended July 31, 2013 (f) | $ | 10.88 | 0.33 | (0.58 | ) | (0.25 | ) | (0.33 | ) | – | (0.33 | ) | $ | 10.30 | (2.40% | ) | $ | 931,021 | 0.65% | 3.04% | 1.04% | 14.00% | ||||||||||||||||||||||||||||||||||
Year Ended July 31, 2012 (f) | $ | 10.37 | 0.36 | 0.52 | 0.88 | (0.37 | ) | – | (0.37 | ) | $ | 10.88 | 8.57% | $ | 705,422 | 0.65% | 3.42% | 1.06% | 13.00% | |||||||||||||||||||||||||||||||||||||
Period Ended July 31, 2011 (j) | $ | 10.52 | 0.38 | (0.12 | ) | 0.26 | (0.40 | ) | (0.01 | ) | (0.41 | ) | $ | 10.37 | 2.45% | $ | 281,684 | 0.65% | 3.78% | 1.06% | 10.00% | |||||||||||||||||||||||||||||||||||
| Institutional Class Shares | ||||||||||||||||||||||||||||||||||||||||||||||||||||||||
Period Ended January 31, 2014 (f)(k) (Unaudited) | $ | 10.06 | 0.12 | (0.02 | ) | 0.10 | (0.13 | ) | – | (0.13 | ) | $ | 10.03 | 0.99% | $ | 10,096 | 0.60% | 3.29% | 0.71% | 2.25% | ||||||||||||||||||||||||||||||||||||
Amounts designated as “–” are zero or have been rounded to zero.
| (a) | Excludes sales charge. |
| (b) | Not annualized for periods less than one year. |
| (c) | Annualized for periods less than one year. |
| (d) | During the period, certain fees may have been waived and/or reimbursed. If such waivers/reimbursements had not occurred, the ratios would have been as indicated. |
| (e) | Portfolio turnover is calculated on the basis of the Fund as a whole without distinguishing among the classes of shares. |
| (f) | Per share calculations were performed using average shares method. |
| (g) | For the period from October 31, 2008 (predecessor fund fiscal year end) through July 31, 2009. |
| (h) | Per share amounts calculated using SEC method. |
| (i) | Effective September 16, 2013, Fiduciary Shares were renamed Institutional Service Class Shares. |
| (j) | For the period from August 3, 2010 (commencement of operations) through July 31, 2011. |
| (k) | For the period from September 19, 2013 (commencement of operations) through January 31, 2014. Total return is calculated based on inception date of September 18, 2013 through January 31, 2014. |
The accompanying notes are an integral part of these financial statements.
85
January 31, 2014 (Unaudited)
1. Organization
Nationwide Mutual Funds (the “Trust”) is registered under the Investment Company Act of 1940, as amended (the “1940 Act”), as an open-end management investment company, organized as a statutory trust under the laws of the State of Delaware. The Trust has authorized an unlimited number of shares of beneficial interest (“shares”), without par value. As of January 31, 2014, the Trust operates fifty-three (53) separate series, or mutual funds, each with its own investment objective(s) and strategies. This report contains the financial statements and financial highlights of the five (5) series listed below (each, a “Fund”; collectively, the “Funds”).
-Nationwide HighMark Bond Fund (“Bond”)
-Nationwide HighMark California Intermediate Tax Free Bond Fund (“California Intermediate Tax Free Bond”)
-Nationwide HighMark National Intermediate Tax Free Bond Fund (“National Intermediate Tax Free Bond”)
-Nationwide HighMark Short Term Bond Fund (“Short Term Bond”)
-Nationwide Ziegler Wisconsin Tax Exempt Fund (“Wisconsin Tax Exempt”)
Each Fund commenced operations on September 16, 2013 as a result of a reorganization in which Bond, California Intermediate Tax Free Bond, National Intermediate Tax Free Bond, Short Term Bond, and Wisconsin Tax Exempt acquired all of the assets, subject to all liabilities and obligations, of the HighMark Bond Fund, HighMark California Intermediate Tax-Free Bond Fund, HighMark National Intermediate Tax-Free Bond Fund, HighMark Short Term Bond Fund, and HighMark Wisconsin Tax-Exempt Fund, respectively, each a former series of HighMark Funds (each a “Predecessor Fund,” and collectively the “Predecessor Funds”). Each Fund has adopted the historical performance of its corresponding Predecessor Fund. Each Fund and its corresponding Predecessor Fund have substantially similar investment goals and strategies.
Each of the Funds, except Wisconsin Tax Exempt, is a diversified fund, as defined in the 1940 Act. Wisconsin Tax Exempt is a non-diversified fund, as defined in the 1940 Act.
2. Summary of Significant Accounting Policies
The following is a summary of significant accounting policies followed by the Funds in the preparation of their financial statements. The policies are in conformity with accounting principles generally accepted in the United States of America (“U.S. GAAP”). The preparation of financial statements requires Fund management to make estimates and assumptions that affect the reported amounts of assets and liabilities, the disclosure of contingent assets and liabilities at the date of the financial statements, and the reported amounts of income and expenses for the period. The Funds utilize various methods to measure the value of their investments on a recurring basis. Amounts received upon the sale of such investments could differ from those estimated values and those differences could be material.
| (a) | Security Valuation |
The fair market value of the Funds’ portfolio securities is determined in accordance with the procedures described below. U.S. GAAP defines fair value as the price that a Fund would receive to sell an asset or pay to transfer a liability in an orderly transaction between market participants at the measurement date. The Trust’s investment adviser to the Funds, Nationwide Fund Advisors (“NFA”), assigns a fair value to Fund investments in accordance with a hierarchy that prioritizes the various types of inputs used to measure fair value. The hierarchy gives the highest priority to readily available unadjusted quoted prices in active markets for identical assets (Level 1 measurements) and the lowest priority to unobservable inputs (Level 3 measurements) when market prices are not readily available or reliable.
The three levels of the hierarchy are summarized below.
| — | Level 1 — Quoted prices in active markets for identical assets |
| — | Level 2 — Other significant observable inputs (including quoted prices of similar securities, interest rates, prepayment speeds, credit risk, etc.) |
| — | Level 3 — Significant unobservable inputs (including the Fund’s own assumptions in determining the fair value of investments) |
86
Notes to Financial Statements (Continued)
January 31, 2014 (Unaudited)
Changes in valuation techniques may result in transfers into or out of an investment’s assigned level within the hierarchy.
An investment’s categorization within the hierarchy is based on the lowest level of any input that is significant to the fair valuation in its entirety. The inputs or methodology used to value investments are not intended to indicate the risk associated with investing in those investments.
Securities for which market quotations are readily available are valued at the current market value as of “Valuation Time.” Valuation Time is as of the close of regular trading on the New York Stock Exchange (usually 4:00 p.m. Eastern time). Shares of registered open-end management investment companies are valued at net asset value (“NAV”) as reported by such company. Investments valued in this manner are generally categorized as Level 1 investments within the hierarchy.
The Trust’s Board of Trustees (the “Board of Trustees”) has delegated authority to NFA, and the Trust’s administrator, Nationwide Fund Management LLC (“NFM”), to assign fair value. NFA and NFM have established a Fair Valuation Committee (“FVC”) to assign these fair valuations.
The FVC follows guidelines approved by the Board of Trustees to assign the fair value. The fair value of a security may differ from its quoted or published price. Fair valuation of portfolio securities may occur on a daily basis.
Securities may be fair valued in a variety of circumstances, such as where (i) market quotations are not readily available; (ii) an independent pricing service does not provide a value or the value provided by an independent pricing service is determined to be unreliable in the judgment of NFA or its designee; (iii) a significant event has occurred that affects the value of the Funds’ securities after trading has stopped (e.g., earnings announcements or news relating to natural disasters affecting an issuer’s operations); (iv) the securities are illiquid; (v) the securities have defaulted or been delisted from an exchange and are no longer trading; or (vi) any other circumstance in which the FVC believes that market quotations do not accurately reflect the value of a security.
The fair valuation of securities takes into account relevant factors and surrounding circumstances, including, but not limited to, the prices of related or comparable assets or liabilities, recent transactions, market multiples, anticipated cash flows, the nature and duration of any restrictions on transfer, book values, and other information relevant to the investment. Methods utilized to determine fair value may include, among others, the following: (i) a multiple of earnings; (ii) the discount from market value of a similar, freely traded security; (iii) the yield-to-maturity for debt issues; or (iv) a combination of these and other methods. Fair valuations may also take into account significant events that occur before Valuation Time but after the close of the principal market on which a security trades that materially affect the value of such security. The FVC monitors the results of fair valuation determinations and regularly reports the results to the Board of Trustees.
Debt and other fixed-income securities are generally valued at the bid evaluation price provided by an independent pricing service as approved by the Board of Trustees. Evaluations provided by independent pricing service providers may be determined without exclusive reliance on quoted prices and may use broker-dealer quotations, individual trading characteristics and other market data, reported trades or valuation estimates from their internal pricing models. The independent pricing service providers’ internal models use inputs that are observable such as issuer details, interest rates, yield curves, prepayment speeds, credit risks/spreads, default rates and quoted prices for similar assets and are generally categorized as Level 2 investments within the hierarchy. All debt obligations involve some risk of default with respect to interest and/or principal payments.
Bank loans are valued using an average bid price provided by an independent pricing service. Evaluated quotes provided by the pricing service may reflect appropriate factors such as ratings, tranche type, industry, company performance, spread, individual trading characteristics, institution-size trading in similar groups of securities and other market data.
87
Notes to Financial Statements (Continued)
January 31, 2014 (Unaudited)
The following tables provide a summary of the inputs used to value the Funds’ net assets as of January 31, 2014. Please refer to the Statements of Investments for additional information on portfolio holdings.
Bond
| Level 1 | Level 2 | Level 3 | Total | |||||||||||||
Assets: | ||||||||||||||||
Asset-Backed Securities | $ | — | $ | 30,211,626 | $ | — | $ | 30,211,626 | ||||||||
Bank Loan | — | 1,001,905 | — | 1,001,905 | ||||||||||||
Collateralized Mortgage Obligations | — | 9,488,279 | — | 9,488,279 | ||||||||||||
Commercial Mortgage Backed Securities | — | 20,853,569 | — | 20,853,569 | ||||||||||||
Corporate Bonds | — | 190,066,062 | — | 190,066,062 | ||||||||||||
Municipal Bonds | — | 14,280,619 | — | 14,280,619 | ||||||||||||
Mutual Fund | 5,190,171 | — | — | 5,190,171 | ||||||||||||
Sovereign Bond | — | 1,363,816 | — | 1,363,816 | ||||||||||||
U.S. Government Mortgage Backed Agencies | — | 30,579,844 | — | 30,579,844 | ||||||||||||
U.S. Treasury Notes | — | 16,489,375 | — | 16,489,375 | ||||||||||||
Yankee Dollar | — | 1,531,424 | — | 1,531,424 | ||||||||||||
Total | $ | 5,190,171 | $ | 315,866,519 | $ | — | $ | 321,056,690 | ||||||||
California Intermediate Tax Free Bond
| Level 1 | Level 2 | Level 3 | Total | |||||||||||||
Assets: | ||||||||||||||||
Municipal Bonds | $ | — | $ | 199,918,789 | $ | — | $ | 199,918,789 | ||||||||
Total | $ | — | $ | 199,918,789 | $ | — | $ | 199,918,789 | ||||||||
National Intermediate Tax Free Bond
| Level 1 | Level 2 | Level 3 | Total | |||||||||||||
Assets: | ||||||||||||||||
Municipal Bonds | $ | — | $ | 76,141,849 | $ | — | $ | 76,141,849 | ||||||||
Mutual Fund | 366,261 | — | — | 366,261 | ||||||||||||
Total | $ | 366,261 | $ | 76,141,849 | $ | — | $ | 76,508,110 | ||||||||
Short Term Bond
| Level 1 | Level 2 | Level 3 | Total | |||||||||||||
Assets: | ||||||||||||||||
Asset-Backed Securities | $ | — | $ | 26,126,165 | $ | — | $ | 26,126,165 | ||||||||
Bank Loan | — | 500,953 | — | 500,953 | ||||||||||||
Collateralized Mortgage Obligations | — | 3,477,681 | — | 3,477,681 | ||||||||||||
Commercial Mortgage Backed Securities | — | 11,378,726 | — | 11,378,726 | ||||||||||||
Corporate Bonds | — | 119,549,641 | — | 119,549,641 | ||||||||||||
Mutual Fund | 8,747,810 | — | — | 8,747,810 | ||||||||||||
Sovereign Bond | — | 751,267 | — | 751,267 | ||||||||||||
U.S. Government Mortgage Backed Agencies | — | 22,738,599 | — | 22,738,599 | ||||||||||||
U.S. Treasury Note | — | 12,601,562 | — | 12,601,562 | ||||||||||||
Total | $ | 8,747,810 | $ | 197,124,594 | $ | — | $ | 205,872,404 | ||||||||
88
Notes to Financial Statements (Continued)
January 31, 2014 (Unaudited)
Wisconsin Tax Exempt
| Level 1 | Level 2 | Level 3 | Total | |||||||||||||
Assets: | ||||||||||||||||
Municipal Bonds | $ | — | $ | 124,985,210 | $ | — | $ | 124,985,210 | ||||||||
Mutual Fund | 3,691,234 | — | — | 3,691,234 | ||||||||||||
Total | $ | 3,691,234 | $ | 124,985,210 | $ | — | $ | 128,676,444 | ||||||||
Amounts designated as “—”, which may include fair valued securities, are zero or have been rounded to zero.
During the six months ended January 31, 2014, there were no transfers into or out of Level 1, Level 2 or Level 3.
| (b) | Security Transactions and Investment Income |
Security transactions are accounted for on the date the security is purchased or sold. Security gains and losses are calculated on the identified cost basis. Interest income is recognized on the accrual basis and includes, where applicable, the amortization of premiums or accretion of discounts, and is recorded as such on a Fund’s Statement of Operations. Dividend income is recorded on the ex-dividend date and is recorded as such on a Fund’s Statement of Operations.
| (c) | Distributions to Shareholders |
Effective September 16, 2013, distributions from net investment income, if any, are declared daily and paid monthly. Distributions from net realized capital gains, if any, are declared and distributed at least annually. All distributions are recorded on the ex-dividend date.
Dividends and distributions to shareholders are determined in accordance with federal income tax regulations, which may differ from U.S. GAAP. These “book/tax” differences are considered either permanent or temporary. Permanent differences are reclassified within the capital accounts based on their nature for federal income tax purposes; temporary differences do not require reclassification. These reclassifications have no effect upon the NAV of a Fund. Any distribution in excess of current and accumulated earnings and profits for federal income tax purposes is reported as a return of capital distribution.
Prior to September 16, 2013, each of the Funds declared and paid dividends from net investment income monthly. None of the Funds had a targeted dividend rate, and none of the Funds guaranteed that it would pay any dividends or other distributions. Any net realized capital gains, if any, were distributed at least annually by each of the Funds.
| (d) | Deferred Compensation Plan |
On April 17, 2013, the Predecessor Funds terminated a deferred compensation plan that had previously been established for the benefit of certain members of the Predecessor Funds’ Board. Effective September 16, 2013, the Funds assumed the deferred compensation liability of their corresponding Predecessor Funds. At January 31, 2014, the deferred compensation payable by the Funds to the Predecessor Funds’ Board was $75,322.
| (e) | Federal Income Taxes |
Each Fund elected to be treated as, and intends to qualify each year as, a “Regulated Investment Company” (“RIC”) by complying with the provisions available to certain investment companies under Subchapter M of the U.S. Internal Revenue Code of 1986, as amended, and to make distributions of net investment income and net realized capital gains sufficient to relieve a Fund from all, or substantially all, federal income taxes. Therefore, no federal income tax provision is required.
89
Notes to Financial Statements (Continued)
January 31, 2014 (Unaudited)
A Fund recognizes a tax benefit from an uncertain position only if it is more likely than not that the position is sustainable, based solely on its technical merits and consideration of the relevant taxing authorities’ widely understood administrative practices and precedents. A Fund undertakes an affirmative evaluation of tax positions taken or expected to be taken in the course of preparing tax returns to determine whether it is more likely than not (i.e., greater than 50 percent) that each tax position will be sustained upon examination by a taxing authority based on the technical merits of the position. If such a tax position taken by a Fund is not sustained upon examination by a taxing authority, that Fund could incur taxes and penalties related to that position, and those amounts could be material. A tax position that meets the more likely than not recognition threshold is measured to determine the amount of benefits to recognize in the financial statements. Differences result in an increase in a liability for taxes payable (or a reduction of a tax refund receivable) and an increase in a deferred tax liability (or a reduction in a deferred tax asset). The Funds file U.S. federal income tax returns and, if applicable, returns in various foreign jurisdictions in which they invest. The last four tax year ends, or since inception (if shorter), and any interim tax period since then generally remain open for examination by taxing authorities.
Each Fund engages in ongoing monitoring and analysis; future conclusions reached by management could be different and result in adjustments to a Fund’s NAV and financial statements. The Funds are not aware of any tax positions for which it is reasonably possible that the total amounts of unrecognized tax benefits will significantly change in the next twelve months.
| (f) | Allocation of Expenses, Income and Gains and Losses |
Expenses directly attributable to a Fund are charged to that Fund. Expenses not directly attributable to a Fund are allocated proportionally among various or all series of the Trust. Income, fund level expenses, and realized and unrealized gains or losses are allocated to each class of shares of a Fund based on the value of the outstanding shares of that class relative to the total value of the outstanding shares of that Fund. Expenses specific to a class (such as Rule 12b-1 and administrative services fees) are charged to that specific class.
3. Transactions with Affiliates
Effective September 16, 2013 under the terms of the Trust’s Investment Advisory Agreement, NFA manages the investments of the assets and supervises the daily business affairs of the Funds in accordance with policies and procedures established by the Board of Trustees. NFA is a wholly owned subsidiary of Nationwide Financial Services, Inc. (“NFS”), a holding company which is a direct wholly owned subsidiary of Nationwide Corporation. NFA provides investment management evaluation services in monitoring, on an ongoing basis, the performance of the subadvisers.
As of January 31, 2014, the subadvisers for each Fund are as follows:
| Fund | Subadviser | |
Bond | HighMark Capital Management, Inc. (“HighMark”) | |
California Intermediate Tax Free Bond | HighMark | |
National Intermediate Tax Free Bond | HighMark | |
Short Term Bond | HighMark | |
Wisconsin Tax Exempt | Ziegler Lotsoff Capital Management, LLC |
90
Notes to Financial Statements (Continued)
January 31, 2014 (Unaudited)
Effective September 16, 2013, under the terms of the Investment Advisory Agreement, each Fund pays NFA an investment advisory fee based on that Fund’s average daily net assets. The Funds paid investment advisory fees to NFA according to the schedule below.
| Fund | Fee Schedule | Advisory Fee (annual rate) | ||||||
Bond | Up to $250 million | 0.50 | % | |||||
| $250 million up to $1 billion | 0.475 | % | ||||||
| $1 billion up to $2 billion | 0.45 | % | ||||||
| $2 billion up to $5 billion | 0.425 | % | ||||||
| $5 billion and more | 0.40 | % | ||||||
California Intermediate Tax Free Bond | All Assets | 0.50 | % | |||||
National Intermediate Tax Free Bond | ||||||||
Short Term Bond | Up to $500 million | 0.35 | % | |||||
| $500 million up to $1 billion | 0.34 | % | ||||||
| $1 billion up to $3 billion | 0.325 | % | ||||||
| $3 billion up to $5 billion | 0.30 | % | ||||||
| $5 billion up to $10 billion | 0.285 | % | ||||||
| $10 billion and more | 0.275 | % | ||||||
Wisconsin Tax Exempt | Up to $250 million | 0.50 | % | |||||
| On $250 million and more | 0.40 | % | ||||||
From these fees, pursuant to the subadvisory agreements, NFA pays fees to the unaffiliated subadvisers.
For the period from September 16, 2013 through January 31, 2014, the Funds paid investment management fees to NFA in the amounts listed below.
| Fund | Amount | |||
Bond | $ | 610,726 | ||
California Intermediate Tax Free Bond | 397,029 | |||
National Intermediate Tax Free Bond | 155,092 | |||
Short Term Bond | 258,486 | |||
Wisconsin Tax Exempt | 254,928 | |||
Prior to September 16, 2013, the Funds were managed by, and paid investment management fees to, HighMark. For the period from August 1, 2013 through September 15, 2013, the Funds paid investment management fees to HighMark in the amounts listed below.
| Fund | Amount | |||
Bond | $ | 219,453 | ||
California Intermediate Tax Free Bond | 140,860 | |||
National Intermediate Tax Free Bond | 53,990 | |||
Short Term Bond | 82,378 | |||
Wisconsin Tax Exempt | 91,625 | |||
91
Notes to Financial Statements (Continued)
January 31, 2014 (Unaudited)
Effective September 16, 2013, the Funds and NFA have entered into a written Expense Limitation Agreement that limits the Funds’ operating expenses (excluding acquired fund fees and expenses, and certain other expenses) from exceeding the following amounts until February 28, 2015:
| Fund | Class A | Class C | Institutional Service Class | Institutional Class | ||||||||||||
Bond | 0.97 | % | 1.40 | % | 0.72 | % | 0.65 | % | ||||||||
California Intermediate Tax Free Bond | 0.79 | 1.24 | 0.54 | 0.49 | ||||||||||||
National Intermediate Tax Free Bond | 0.77 | 1.22 | 0.52 | 0.47 | ||||||||||||
Short Term Bond | 0.85 | 1.30 | 0.60 | 0.55 | ||||||||||||
Wisconsin Tax Exempt | 0.90 | 1.35 | 0.65 | 0.60 | ||||||||||||
NFA may request and receive reimbursement from a Fund for advisory fees waived and other expenses reimbursed by NFA pursuant to the Expense Limitation Agreement at a date not to exceed three years from the month in which the corresponding waiver or reimbursement to a Fund was made. However, no reimbursement may be made unless: (i) a Fund’s assets exceed $100 million and (ii) the total annual expense ratio of the class making such reimbursement is no higher than the amount of the expense limitation that was in place at the time NFA waived the fees or reimbursed the expenses and does not cause the expense ratio to exceed the current expense limitation. Reimbursement by a Fund of amounts previously waived or assumed by NFA is not permitted except as provided for in the Expense Limitation Agreement. The Expense Limitation Agreement may be changed or eliminated only with the consent of the Board of Trustees.
As of January 31, 2014, the cumulative potential reimbursements for the Funds, listed by the period in which NFA waived fees or reimbursed expenses to the Funds, are:
| Fund | Period Ended January 31, 2014 (a) | |||
Bond | $ | 1,656 | ||
California Intermediate Tax Free Bond | 123,149 | |||
National Intermediate Tax Free Bond | 103,789 | |||
Short Term Bond | — | |||
Wisconsin Tax Exempt | 72,726 | |||
| (a) | For the period from September 16, 2013 through January 31, 2014. |
Amount designated as “—” is zero or has been rounded to zero.
During the period from September 16, 2013 through January 31, 2014, no amounts were reimbursed to NFA pursuant to the Expense Limitation Agreement.
Pursuant to a similar expense limitation agreement, prior to September 16, 2013, no amounts were reimbursed to HighMark.
Prior to September 16, 2013, HighMark contractually agreed to reduce its fees (excluding portfolio brokerage and transaction costs, taxes relating to transacting in foreign securities, if any, extraordinary expenses and any expenses indirectly incurred by a Fund through investments in pooled investment vehicles), and to the extent necessary to reimburse the Funds in order to limit the Funds from exceeding certain expense limitations. For the period from August 1, 2013 through September 15, 2013, expenses reimbursed under the terms of that agreement were as follows:
| Fund | Amount | |||
Bond | $ | 55,593 | ||
California Intermediate Tax Free Bond | 84,194 | |||
National Intermediate Tax Free Bond | 43,916 | |||
Short Term Bond | 38,214 | |||
Wisconsin Tax Exempt | 44,209 | |||
92
Notes to Financial Statements (Continued)
January 31, 2014 (Unaudited)
Effective September 16, 2013, NFM, a wholly owned subsidiary of NFS Distributors, Inc. (“NFSDI”) (a wholly owned subsidiary of NFS), provides various administrative and accounting services for the Funds and serves as Transfer and Dividend Disbursing Agent for the Funds. NFM has entered into an agreement with a third-party service provider to provide certain sub-administration and sub-transfer agency services to the Funds. NFM pays the service provider a fee for these services.
Effective September 16, 2013, under the terms of a Joint Fund Administration and Transfer Agency Agreement, the fees for such services are based on the sum of the following: (i) the amount payable by NFM to its sub-administrator and sub-transfer agent; and (ii) a percentage of the combined average daily net assets of the Trust and Nationwide Variable Insurance Trust, a Delaware statutory trust and registered investment company that is affiliated with the Trust, according to the fee schedule below.
| Combined Fee Schedule | ||||
Up to $25 billion | 0.025 | % | ||
$25 billion and more | 0.020 | % | ||
During the period from September 16, 2013 through January 31, 2014, NFM earned $275,640 in fees from the Funds under the Joint Fund Administration and Transfer Agency Agreement.
Prior to September 16, 2013, the Funds were a series of an investment trust that was a party to an Administration Agreement with HighMark (the “Administrator”) under which the Administrator provided administrative services to such investment trust for an annual fee of 0.15% of the first $8 billion of the average daily net assets of the Funds and 0.14% of such average daily net assets in excess of $8 billion allocated to each Fund based on its respective net assets. For the period from August 1, 2013 through September 15, 2013, the Administrator received fees from the Funds in the amounts listed below.
| Fund | Amount | |||
Bond | $ | 75,609 | ||
California Intermediate Tax Free Bond | 47,527 | |||
National Intermediate Tax Free Bond | 18,658 | |||
Short Term Bond | 37,765 | |||
Wisconsin Tax Exempt | 36,469 | |||
Effective September 16, 2013, the Trust pays out-of-pocket expenses reasonably incurred by NFM in providing services to the Funds and the Trust, including, but not limited to, the cost of pricing services that NFM utilizes and networking fees paid to broker-dealers that provide sub-accounting and sub-transfer agency services to their customers who are Fund shareholders. Such services, which are not otherwise provided by NFM, generally include individual account maintenance and recordkeeping, dividend disbursement, responding to shareholder calls and inquiries, providing statements and transaction confirmations, tax reporting, and other shareholder services. Depending on the nature and quality of the services provided, fees for these services may range from $6 to $21 per customer per year.
Effective September 16, 2013, under the terms of the Joint Fund Administration and Transfer Agency Agreement and a letter agreement between NFM and the Trust, the Trust has agreed to reimburse NFM for certain costs related to the Funds’ portion of ongoing administration, monitoring and annual (compliance audit) testing of the Trust’s Rule 38a-1 Compliance Program subject to the pre-approval of the Trust’s Audit Committee. These costs are allocated among the series of the Trust based upon their relative net assets. For the period from September 16, 2013 through January 31, 2014, the Funds’ aggregate portion of such costs amounted to $931. For the period from August 1, 2013, through September 15, 2013, the Funds paid $8,085 to HighMark.
Effective September 16, 2013, under the terms of a Distribution Plan pursuant to Rule 12b-1 under the 1940 Act, Nationwide Fund Distributors LLC (“NFD”), the Funds’ principal underwriter, is compensated by the Funds for expenses
93
Notes to Financial Statements (Continued)
January 31, 2014 (Unaudited)
associated with the distribution of certain classes of shares of the Funds. NFD is a wholly owned subsidiary of NFSDI. These fees are based on average daily net assets of the respective class of the Funds at an annual rate as follows:
| — | 0.25% of the average daily net assets of Class A shares of each Fund (distribution or service fee) |
| — | 0.75% of the average daily net assets of Class C shares of each Fund (0.75% of which may be a distribution fee and 0.25% service fee) |
Prior to September 16, 2013, HighMark Funds Distributors, LLC (the “Distributor”), a wholly owned subsidiary of Foreside Funds Distributors LLC, and the Funds were parties to an underwriting agreement. HighMark adopted 12b-1 Plans (the “Plans”) with respect to Class A, Class B, and Class C Shares that allowed each Fund to pay distribution and service fees to the Distributor as compensation for its services under the Plans. The Distributor received a distribution fee computed daily and paid monthly, at the annual rate of 0.25% of the daily net assets attributable to each Fund’s Class A Shares, 0.75% of the daily net assets attributable to each Fund’s Class B Shares and 0.75% of the daily net assets attributable to each Fund’s Class C Shares, which was used by the Distributor to provide compensation for sales support and distribution activities.
Effective September 16, 2013, pursuant to an Underwriting Agreement, NFD serves as principal underwriter of the Funds in the continuous distribution of their shares and receives commissions in the form of a front-end sales charge on Class A shares. These fees are deducted from, and are not included in, proceeds from sales of Class A shares of the Funds. From these fees, NFD pays sales commissions, salaries and other expenses in connection with generating new sales of Class A shares of the Funds. Effective September 16, 2013, the Funds’ Class A sales charges ranged from 0.00% to 2.25% based on the amount of the purchase. For the period from September 16, 2013 through January 31, 2014, the Funds imposed front-end sales charges of $6,839. For the period from August 1, 2013 through September 15, 2013, the Funds imposed front-end sales charges of $557.
Effective September 16, 2013, NFD also receives fees in the form of contingent deferred sales charges (“CDSCs”) on Class A and Class C shares. These fees may cause the redeemed value of a shareholder’s account to fall below the total purchase payments. A CDSC is imposed on Class A shares for certain redemptions, and Class C shares made within 1 year of purchase. Effective September 16, 2013, applicable Class A CDSCs were 0.50% for the Funds. Class C CDSCs were 1.00% for the Funds. For the period from September 16, 2013 through January 31, 2014, the Funds imposed CDSCs of $8,497. For the period from August 1, 2013 through September 15, 2013, the Funds imposed CDSCs of $693.
Effective September 16, 2013, under the terms of an Administrative Services Plan, the Funds pay fees to servicing organizations, such as broker-dealers, including NFS, and financial institutions that agree to provide administrative support services to the shareholders of certain classes. These services may include, but are not limited to, the following: (i) establishing and maintaining shareholder accounts; (ii) processing purchase and redemption transactions; (iii) arranging bank wires; (iv) performing shareholder sub-accounting; (v) answering inquiries regarding the Funds; and (vi) other such services. These fees are calculated at an annual rate of up to 0.25% of the average daily net assets of Class A and Institutional Class shares of each Fund.
For the period from September 16, 2013 through January 31, 2014, NFS earned the following amounts in administrative services fees from each Fund:
| Fund | Amount | |||
Bond | $ | 119,328 | ||
California Intermediate Tax Free Bond | 33,027 | |||
National Intermediate Tax Free Bond | 14,356 | |||
Short Term Bond | 24,760 | |||
Wisconsin Tax Exempt | 33,357 | |||
Prior to September 16, 2013, HighMark had similar administrative servicing plans permitting payment of compensation to service providers, which may have included HighMark or its affiliates that had agreed to provide certain shareholder support services for its customers who owned Fiduciary and Class A Shares. In consideration for such services, a service
94
Notes to Financial Statements (Continued)
January 31, 2014 (Unaudited)
provider was entitled to receive compensation at the annual rate of up to 0.25% of the average daily net assets of the applicable class or classes of shares of the Funds. The service providers had agreed to waive a portion of their fees for certain classes of all Funds for the period from August 1, 2013 through September 15, 2013. The administrative servicing fee waivers by HighMark, or its affiliates, were voluntary and not subject to recoupment.
For the period from August 1, 2013 through September 15, 2013, HighMark, or its affiliates earned the following amounts in administrative servicing fees, net of waivers, from each Fund:
| Fund | Amount | |||
Bond | $ | 29,483 | ||
California Intermediate Tax Free Bond | 11,780 | |||
National Intermediate Tax Free Bond | 4,962 | |||
Short Term Bond | 8,626 | |||
Wisconsin Tax Exempt | 8,218 | |||
As of January 31, 2014, NFA or its affiliates directly held the percentage indicated below of the shares outstanding of the applicable Fund.
| Fund | % of Shares Outstanding Owned | |||
Bond | — | |||
California Intermediate Tax Free Bond | — | |||
National Intermediate Tax Free Bond | — | |||
Short Term Bond | 24.81 | % | ||
Wisconsin Tax Exempt | — | |||
Amounts designated as “—” are zero or have been rounded to zero.
4. Earnings Credit
JPMorgan provides earnings credits for cash balances maintained in a Fund’s custody accounts, which are used to offset custody fees of the Fund.
5. Investment Transactions
For the six months ended January 31, 2014, purchases of and sales of securities (excluding short-term securities) were as follows:
| Fund | Purchases | Sales | ||||||
Bond | $ | 64,557,323 | $ | 96,640,480 | ||||
California Intermediate Tax Free Bond | 6,612,058 | 35,208,271 | ||||||
National Intermediate Tax Free Bond | 7,023,362 | 16,237,074 | ||||||
Short Term Bond | 84,877,128 | 64,776,785 | ||||||
Wisconsin Tax Exempt | 3,000,000 | 23,247,570 | ||||||
6. Portfolio Investment Risks
Risks Associated with Interest Rates
Prices of fixed-income securities generally increase when interest rates decline and decrease when interest rates increase. Prices of longer-term securities generally change more in response to interest rate changes than prices of shorter term securities. To the extent the Fund invests a substantial portion of its assets in fixed-income securities with longer-term maturities, rising interest rates are more likely to cause the value of the Fund’s investments to decline significantly.
95
Notes to Financial Statements (Continued)
January 31, 2014 (Unaudited)
Risks Associated with Low Quality/High Yield Securities
Lower quality securities, while generally offering higher yields than investment grade securities with similar maturities, involve greater risks, including the possibility of default or bankruptcy. There is more risk associated with these investments because of reduced creditworthiness and increased risk of default. Lower-quality securities are considered to have extremely poor prospects of ever attaining any real investment standing, to have a current identifiable vulnerability to default or to be in default, to be unlikely to have the capacity to make required interest payments and repay principal when due in the event of adverse business, financial or economic conditions, or to be in default or not current in the payment of interest or principal. They are regarded as predominantly speculative with respect to the issuer’s capacity to pay interest and repay principal.
Other
The Trust along with certain funds in Nationwide Variable Insurance Trust invests through an omnibus account at the Funds’ custodian, JPMorgan, any un-invested cash on a daily basis into one of the following money market funds: Fidelity Institutional Money Market Fund, Institutional Class, Dreyfus Tax Exempt Cash Management, Institutional Shares or Invesco Tax Free Cash Reserve Portfolio, Institutional Shares. As with investments in any money market fund, the Trust’s investments in the aforementioned money market funds are neither guaranteed nor insured, and shares of these money market funds may decline in value, causing losses to the Trust.
7. Indemnifications
Under the Trust’s organizational documents, the Trust’s Officers and Trustees are indemnified by the Trust against certain liabilities arising out of the performance of their duties to the Trust. In addition, the Trust has entered into indemnification agreements with its Trustees and certain of its Officers. Trust Officers receive no compensation from the Trust for serving as its Officers. In addition, in the normal course of business, the Trust enters into contracts with its vendors and others that provide for general indemnifications. The Trust’s maximum liability under these arrangements is unknown, as this would involve future claims made against the Trust. Based on experience, however, the Trust expects the risk of loss to be remote.
8. Other
As of January 31, 2014, the Funds had individual shareholder accounts and/or omnibus shareholder accounts (comprising a group of individual shareholders), which held more than 10% of the total shares outstanding of the Funds as detailed below.
| Fund | % of Shares | Number of Accounts | ||||||
Bond | 68.82 | % | 3 | |||||
California Intermediate Tax Free Bond | 39.28 | 2 | ||||||
National Intermediate Tax Free Bond | 60.84 | 3 | ||||||
Short Term Bond | 35.35 | 2 | (a) | |||||
Wisconsin Tax Exempt | — | — | ||||||
| (a) | One such account is the account of an affiliated fund. |
Amounts designated as “—” are zero or have been rounded to zero.
96
Notes to Financial Statements (Continued)
January 31, 2014 (Unaudited)
9. Federal Tax Information
As of January 31, 2014, the tax cost of securities (excluding derivative contracts) and the breakdown of unrealized appreciation/(depreciation) was as follows:
| Fund | Tax Cost of Securities | Unrealized Appreciation | Unrealized Depreciation | Net Unrealized Appreciation/ (Depreciation) | ||||||||||||
Bond | $ | 311,855,679 | $ | 13,690,720 | $ | (4,489,709 | ) | $ | 9,201,011 | |||||||
California Intermediate Tax Free Bond | 190,319,959 | 10,319,039 | (720,209 | ) | 9,598,830 | |||||||||||
National Intermediate Tax Free Bond | 72,834,129 | 3,882,263 | (208,282 | ) | 3,673,981 | |||||||||||
Short Term Bond | 205,117,446 | 1,417,238 | (662,280 | ) | 754,958 | |||||||||||
Wisconsin Tax Exempt | 131,093,959 | 4,231,678 | (6,649,193 | ) | (2,417,515 | ) | ||||||||||
10. Subsequent Events
Management has evaluated the impact of subsequent events on the Funds and has determined that there are no subsequent events requiring recognition or disclosure in the financial statements.
97
January 31, 2014 (Unaudited)
Nationwide HighMark Bond Fund
Approval of Advisory and Subadvisory Agreements
At the March 28, 2013 meeting of the Board of Trustees, the Board, including the Independent Trustees, discussed and unanimously approved, for the Nationwide HighMark Bond Fund (the “Fund”), the Investment Advisory Agreement with Nationwide Fund Advisors (“NFA”) and the Subadvisory Agreement with HighMark Capital Management, Inc. (“HighMark,” and, together with NFA, the “Advisers”) (each, an “Advisory Agreement,” and together, the “Advisory Agreements”). The Trustees were provided with detailed materials relating to HighMark in advance of the meeting. The material factors and conclusions that formed the basis for the approval are discussed below.
The Trustees met in person with Nationwide Fund Advisors (“NFA”), the investment adviser to the Fund, Trust counsel, Independent Legal Counsel, and others. The Trustees also reviewed the proposed subadvisory relationship with representatives of HighMark.
In making their determinations, the Trustees noted that HighMark is currently the sub-adviser to the HighMark Bond Fund, and that the new Fund is intended to be the successor to that fund. The Trustees took into account information provided by the Advisers as to management style and investment philosophy and process, and the financial position, of HighMark. The Trustees considered HighMark’s past performance and HighMark’s personnel that would be serving the Fund. The Trustees considered the terms of the Advisory Agreements and information regarding fee arrangements, including the structure of the sub-advisory fees, and the fact that NFA pays HighMark out of its advisory fees.
The Trustees considered the proposed advisory fees to be paid by the Fund to NFA, which were above the median of the fees paid by the peer funds presented at the meeting. They also considered pro forma performance information provided by NFA (actual performance of the HighMark Bond Fund adjusted to reflect the Fund’s expense and load structure) showing that the three-year pro forma Class A performance of the Fund exceeded the median performance of a Lipper peer universe identified by NFA. The Trustees also considered that HighMark is the investment adviser to a number of mutual funds being “adopted” by the Nationwide organization and that the adoption transaction contemplated that HighMark would serve as subadviser to the Fund after the adoption; the Trustees took into account the potential conflicts of interest posed by those arrangements.
After discussion and consideration among themselves, and with NFA, Trust counsel, and Independent Legal Counsel, the Trustees concluded the following:
| — | The nature and extent of the investment advisory services to be provided to the Fund by the Advisers were appropriate and consistent with the terms of the Advisory Agreements; |
| — | The prospects for satisfactory investment performance were reasonable; |
| — | The cost of services to be provided by the Advisers to the Fund appeared reasonable in relation to the services and benefits to be provided to the Fund; and |
| — | Profitability should be assessed after a reasonable period of Fund operations. |
Based on all relevant information and factors, none of which was individually determinative of the outcome, the Trustees, including all of the Independent Trustees, concluded that the approval of the Advisory Agreements was in the best interests of the Fund and its shareholders and unanimously approved the Advisory Agreements for a two-year period commencing from the execution of the Advisory Agreements.
98
Supplemental Information (Continued)
January 31, 2014 (Unaudited)
Nationwide HighMark California Intermediate Tax Free Bond Fund
Approval of Advisory and Subadvisory Agreements
At the March 28, 2013 meeting of the Board of Trustees, the Board, including the Independent Trustees, discussed and unanimously approved, for the Nationwide HighMark California Intermediate Tax Free Bond Fund (the “Fund”), the Investment Advisory Agreement with Nationwide Fund Advisors (“NFA”) and the Subadvisory Agreement with HighMark Capital Management, Inc. (“HighMark,” and, together with NFA, the “Advisers”) (each, an “Advisory Agreement,” and together, the “Advisory Agreements”). The Trustees were provided with detailed materials relating to HighMark in advance of the meeting. The material factors and conclusions that formed the basis for the approval are discussed below.
The Trustees met in person with Nationwide Fund Advisors (“NFA”), the investment adviser to the Fund, Trust counsel, Independent Legal Counsel, and others. The Trustees also reviewed the proposed subadvisory relationship with representatives of HighMark.
In making their determinations, the Trustees noted that HighMark is currently the sub-adviser to the HighMark California Intermediate Tax-Free Bond Fund, and that the new Fund is intended to be the successor to that fund. The Trustees took into account information provided by the Advisers as to management style and investment philosophy and process, and the financial position, of HighMark. The Trustees considered HighMark’s past performance and HighMark’s personnel that would be serving the Fund. The Trustees considered the terms of the Advisory Agreements and information regarding fee arrangements, including the structure of the sub-advisory fees, and the fact that NFA pays HighMark out of its advisory fees.
The Trustees noted that the proposed advisory fees to be paid by the Fund to NFA were below the median of the fees paid by the peer funds presented at the meeting. They also considered pro forma performance information provided by NFA (actual performance of the HighMark California Intermediate Tax-Free Bond Fund adjusted to reflect the Fund’s expense and load structure) showing that three-year pro forma Class A performance of the Fund was below the median performance of a Lipper peer universe identified by NFA. The Trustees considered NFA’s statements that the HighMark California Intermediate Tax-Free Bond Fund’s relative performance had been hurt by its quality bias during a period when lesser-quality debt issues had performed strongly. The Trustees also considered that HighMark is the investment adviser to a number of mutual funds being “adopted” by the Nationwide organization and that the adoption transaction contemplated that HighMark would serve as subadviser to the Fund after the adoption; the Trustees took into account the potential conflicts of interest posed by those arrangements.
After discussion and consideration among themselves, and with NFA, Trust counsel, and Independent Legal Counsel, the Trustees concluded the following:
| — | The nature and extent of the investment advisory services to be provided to the Fund by the Advisers were appropriate and consistent with the terms of the Advisory Agreements; |
| — | The prospects for satisfactory investment performance were reasonable; |
| — | The cost of services to be provided by the Advisers to the Fund appeared reasonable in relation to the services and benefits to be provided to the Fund; and |
| — | Profitability should be assessed after a reasonable period of Fund operations. |
Based on all relevant information and factors, none of which was individually determinative of the outcome, the Trustees, including all of the Independent Trustees, concluded that the approval of the Advisory Agreements was in the best interests of the Fund and its shareholders and unanimously approved the Advisory Agreements for a two-year period commencing from the execution of the Advisory Agreements.
99
Supplemental Information (Continued)
January 31, 2014 (Unaudited)
Nationwide HighMark National Intermediate Tax Free Bond Fund
Approval of Advisory and Subadvisory Agreements
At the March 28, 2013 meeting of the Board of Trustees, the Board, including the Independent Trustees, discussed and unanimously approved, for the Nationwide HighMark National Intermediate Tax Free Bond Fund (the “Fund”), the Investment Advisory Agreement with Nationwide Fund Advisors (“NFA”) and the Subadvisory Agreement with HighMark Capital Management, Inc. (“HighMark,” and, together with NFA, the “Advisers”) (each, an “Advisory Agreement,” and together, the “Advisory Agreements”). The Trustees were provided with detailed materials relating to HighMark in advance of the meeting. The material factors and conclusions that formed the basis for the approval are discussed below.
The Trustees met in person with Nationwide Fund Advisors (“NFA”), the investment adviser to the Fund, Trust counsel, Independent Legal Counsel, and others. The Trustees also reviewed the proposed subadvisory relationship with representatives of HighMark.
In making their determinations, the Trustees noted that HighMark is currently the sub-adviser to the HighMark National Intermediate Tax-Free Bond Fund, and that the new Fund is intended to be the successor to that fund. The Trustees took into account information provided by the Advisers as to management style and investment philosophy and process, and the financial position, of HighMark. The Trustees considered HighMark’s past performance and HighMark’s personnel that would be serving the Fund. The Trustees considered the terms of the Advisory Agreements and information regarding fee arrangements, including the structure of the sub-advisory fees, and the fact that NFA pays HighMark out of its advisory fees.
The Trustees noted that the proposed advisory fees to be paid by the Fund to NFA were below the median of the fees paid by the peer funds presented at the meeting. They also considered pro forma performance information provided by NFA (actual performance of the HighMark National Intermediate Tax-Free Bond Fund adjusted to reflect the Fund’s expense and load structure) showing that three-year pro forma Class A performance of the Fund was below the median performance of a Lipper peer universe identified by NFA. The Trustees considered NFA’s statements that the HighMark National Intermediate Tax-Free Bond Fund’s relative performance had been hurt by its quality bias during a period when lesser-quality debt issues had performed strongly. The Trustees also considered that HighMark is the investment adviser to a number of mutual funds being “adopted” by the Nationwide organization and that the adoption transaction contemplated that HighMark would serve as subadviser to the Fund after the adoption; the Trustees took into account the potential conflicts of interest posed by those arrangements.
After discussion and consideration among themselves, and with NFA, Trust counsel, and Independent Legal Counsel, the Trustees concluded the following:
| — | The nature and extent of the investment advisory services to be provided to the Fund by the Advisers were appropriate and consistent with the terms of the Advisory Agreements; |
| — | The prospects for satisfactory investment performance were reasonable; |
| — | The cost of services to be provided by the Advisers to the Fund appeared reasonable in relation to the services and benefits to be provided to the Fund; and |
| — | Profitability should be assessed after a reasonable period of Fund operations. |
Based on all relevant information and factors, none of which was individually determinative of the outcome, the Trustees, including all of the Independent Trustees, concluded that the approval of the Advisory Agreements was in the best interests of the Fund and its shareholders and unanimously approved the Advisory Agreements for a two-year period commencing from the execution of the Advisory Agreements.
100
Supplemental Information (Continued)
January 31, 2014 (Unaudited)
Nationwide HighMark Short Term Bond Fund
Approval of Advisory and Subadvisory Agreements
At the March 28, 2013 meeting of the Board of Trustees, the Board, including the Independent Trustees, discussed and unanimously approved, for the Nationwide HighMark Short Term Bond Fund (the “Fund”), the Investment Advisory Agreement with Nationwide Fund Advisors (“NFA”) and the Subadvisory Agreement with HighMark Capital Management, Inc. (“HighMark,” and, together with NFA, the “Advisers”) (each, an “Advisory Agreement,” and together, the “Advisory Agreements”). The Trustees were provided with detailed materials relating to HighMark in advance of the meeting. The material factors and conclusions that formed the basis for the approval are discussed below.
The Trustees met in person with Nationwide Fund Advisors (“NFA”), the investment adviser to the Fund, Trust counsel, Independent Legal Counsel, and others. The Trustees also reviewed the proposed subadvisory relationship with representatives of HighMark.
In making their determinations, the Trustees noted that HighMark is currently the sub-adviser to the HighMark Short Term Bond Fund, and that the new Fund is intended to be the successor to that fund. The Trustees took into account information provided by the Advisers as to management style and investment philosophy and process, and the financial position, of HighMark. The Trustees considered HighMark’s past performance and HighMark’s personnel that would be serving the Fund. The Trustees considered the terms of the Advisory Agreements and information regarding fee arrangements, including the structure of the sub-advisory fees, and the fact that NFA pays HighMark out of its advisory fees.
The Trustees noted that the proposed advisory fees to be paid by the Fund to NFA were below the median of the fees paid by the peer funds presented at the meeting. They also considered pro forma performance information provided by NFA (actual performance of the HighMark Short Term Bond Fund adjusted to reflect the Fund’s expense and load structure) showing that three-year pro forma Class A performance of the Fund was below the median performance of a Lipper peer universe identified by NFA. The Trustees considered NFA’s statements that the HighMark Short Term Bond Fund had performed generally in the third quartile during the prior three years while its five-year Lipper peer universe ranking was in the 40th percentile as of December 31, 2012. The Trustees further considered NFA’s statement that the Fund’s sub-adviser has a relatively conservative investment style, holding a lower percentage of high yield securities as compared to peer funds. causing the Fund to underperform in recent periods. The Trustees also considered that HighMark is the investment adviser to a number of mutual funds being “adopted” by the Nationwide organization and that the adoption transaction contemplated that HighMark would serve as subadviser to the Fund after the adoption; the Trustees took into account the potential conflicts of interest posed by those arrangements.
After discussion and consideration among themselves, and with NFA, Trust counsel, and Independent Legal Counsel, the Trustees concluded the following:
| — | The nature and extent of the investment advisory services to be provided to the Fund by the Advisers were appropriate and consistent with the terms of the Advisory Agreements; |
| — | The prospects for satisfactory investment performance were reasonable; |
| — | The cost of services to be provided by the Advisers to the Fund appeared reasonable in relation to the services and benefits to be provided to the Fund; and |
| — | Profitability should be assessed after a reasonable period of Fund operations. |
Based on all relevant information and factors, none of which was individually determinative of the outcome, the Trustees, including all of the Independent Trustees, concluded that the approval of the Advisory Agreements was in the best interests of the Fund and its shareholders and unanimously approved the Advisory Agreements for a two-year period commencing from the execution of the Advisory Agreements.
101
Supplemental Information (Continued)
January 31, 2014 (Unaudited)
Nationwide Ziegler Wisconsin Tax Exempt Fund
Approval of Advisory and Subadvisory Agreements
At the March 28, 2013 meeting of the Board of Trustees, the Board, including the Independent Trustees, discussed and unanimously approved, for the Nationwide Ziegler Wisconsin Tax Exempt Fund (the “Fund”), the Investment Advisory Agreement with Nationwide Fund Advisors (“NFA”) and the Subadvisory Agreement with Ziegler Lotsoff Capital Management, LLC (“Ziegler,” and, together with NFA, the “Advisers”) (each, an “Advisory Agreement,” and together, the “Advisory Agreements”). The Trustees were provided with detailed materials relating to Ziegler in advance of the meeting. The material factors and conclusions that formed the basis for the approval are discussed below.
The Trustees met in person with Nationwide Fund Advisors (“NFA”), the investment adviser to the Fund, Trust counsel, Independent Legal Counsel, and others. The Trustees also reviewed the proposed subadvisory relationship with representatives of Ziegler.
In making their determinations, the Trustees noted that Ziegler is currently the sub-adviser to the HighMark Wisconsin Tax-Exempt Fund, and that the new Fund is intended to be the successor to that fund. The Trustees took into account information provided by the Advisers as to management style and investment philosophy and process, and the financial position, of Ziegler. The Trustees considered Ziegler’s past performance and Ziegler’s personnel that would be serving the Fund. The Trustees considered the terms of the Advisory Agreements and information regarding fee arrangements, including the structure of the sub-advisory fees, and the fact that NFA pays Ziegler out of its advisory fees.
The Trustees noted that the proposed advisory fees to be paid by the Fund to NFA were below the median of the fees paid by the peer funds presented at the meeting. They also considered pro forma performance information provided by NFA (actual performance of the HighMark Wisconsin Tax-Exempt Fund adjusted to reflect the Fund’s expense and load structure) showing that three-year pro forma Class A performance of the Fund through a recent date was below the median performance of a Lipper peer universe identified by NFA. The Trustee’s considered NFA’s view that comparison against the performance universe is of limited utility, since there were only three Wisconsin tax-exempt funds in the Lipper universe, and noted that NFA is continuing to consider an alternative peer group for purposes of comparative evaluations of the Fund’s expenses and performance.
After discussion and consideration among themselves, and with NFA, Trust counsel, and Independent Legal Counsel, the Trustees concluded the following:
| — | The nature and extent of the investment advisory services to be provided to the Fund by the Advisers were appropriate and consistent with the terms of the Advisory Agreements; |
| — | The prospects for satisfactory investment performance were reasonable; |
| — | The cost of services to be provided by the Advisers to the Fund appeared reasonable in relation to the services and benefits to be provided to the Fund; and |
| — | Profitability should be assessed after a reasonable period of Fund operations. |
Based on all relevant information and factors, none of which was individually determinative of the outcome, the Trustees, including all of the Independent Trustees, concluded that the approval of the Advisory Agreements was in the best interests of the Fund and its shareholders and unanimously approved the Advisory Agreements for a two-year period commencing from the execution of the Advisory Agreements.
102
January 31, 2014
Trustees and Officers of the Trust
The address for each Trustee is: c/o Nationwide Funds Group, 1000 Continental Drive, Suite 400, King of Prussia, PA 19406.
Name and Year of Birth | Position(s) Held with the Trust and Length of Time Served1,2 | Principal Occupation(s) During Past Five Years | Number of Portfolios in the Nationwide Fund Complex Overseen by Trustee | Other Directorships Held by Trustee During Past Five Years4 | ||||||
| Charles E. Allen 1948 | Trustee since July 2000 | Mr. Allen was Chairman, Chief Executive Officer and President of Graimark Realty Advisors, Inc. (real estate development, investment and asset management) from its founding in 1987 to 2012. | 112 | None | ||||||
| Paula H.J. Cholmondeley 1947 | Trustee since July 2000 | Ms. Cholmondeley focuses full time on corporate governance. She sits on public company boards and is also on the faculty of the National Association of Corporate Directors. She has served as a Chief Executive Officer of Sorrel Group (management consulting company) since January 2004. From April 2000 through December 2003, Ms. Cholmondeley was Vice President and General Manager of Sappi Fine Paper North America. | 112 | Director of Dentsply International, Inc. (dental products) from 2002 to present, Ultralife Batteries, Inc. from 2004 to 2010, Albany International Corp. (paper industry) from 2005 to 2013, Terex Corporation (construction equipment) from 2004 to present, and Minerals Technology, Inc. (specialty chemicals) from 2005 to present. | ||||||
| Phyllis Kay Dryden 1947 | Trustee since December 2004 | Ms. Dryden became CEO and President of Energy Dispute Solutions, LLC in January 2013, leading a company providing strategy consulting, arbitration and mediation services. She has been a management consultant since 1996, first as a partner of Mitchell Madison Group, then as a managing partner and head of west coast business development for march FIRST, returning to Mitchell Madison Group in 2003 as an associated partner until January 2010 and thereafter as an independent strategy consultant through December 2012. Ms. Dryden was VP and General Counsel of Lucasfilm, Ltd. from 1981 to 1984, SVP and General Counsel of Charles Schwab and Co., Inc. from 1984 to 1992, and EVP and General Counsel of Del Monte Foods from 1992 to 1995. | 112 | None | ||||||
103
Management Information (Continued)
January 31, 2014
The address for each Trustee is: c/o Nationwide Funds Group, 1000 Continental Drive, Suite 400, King of Prussia, PA 19406.
| Name and Year of Birth | Position(s) Held with the Trust and Length of Time Served1,2 | Principal Occupation(s) During Past Five Years (or longer)3 | Number of Portfolios in the Nationwide Fund Complex Overseen by Trustee | Other Directorships Held by Trustee During Past Five Years4 | ||||||
| Barbara L. Hennigar 1935 | Trustee since July 2000 | Ms. Hennigar was Executive Vice President of Oppenheimer Funds (an asset management company) from October 1992 until June 2000; Chairman of Oppenheimer Funds Services from October 1999 until June 2000; and President and CEO of Oppenheimer Funds Services from June 1992 until October 1999. She was previously Board Chair of a non-profit independent school, and is currently an independent trustee and endowment chair of St. Mary’s Academy, an independent school in Denver, CO. | 112 | None | ||||||
Barbara I. Jacobs 1950 | Trustee since December 2004 | Ms. Jacobs served as Chairman of the Board of Directors of KICAP Network Fund, a European (United Kingdom) hedge fund, from January 2001 through January 2006. From 1988 through 2003, Ms. Jacobs was also a Managing Director and European Portfolio Manager of CREF Investments (Teachers Insurance and Annuity Association-College Retirement Equities Fund). | 112 | None | ||||||
Keith F. Karlawish 1964 | Trustee since March 2012 | Mr. Karlawish has been a partner of Park Ridge Asset Management, LLC since December 2008, at which he also serves as a portfolio manager. From May 2002 until October 2008, Mr. Karlawish was the President of BB&T Asset Management, Inc., and was President of the BB&T Mutual Funds and BB&T Variable Insurance Funds from February 2005 until October 2008. | 112 | Trustee of the BB&T Mutual Funds and BB&T Variable Insurance Funds from June 2006 until December 2008. | ||||||
Carol A. Kosel 1963 | Trustee since March 2013 | Ms. Kosel was a consultant to the Evergreen Funds Board of Trustees from October 2005 to December 2007. She was Senior Vice President, Treasurer, and Head of Fund Administration of the Evergreen Funds from April 1997 to October 2005. | 112 | Trustee of Sun Capital Advisers Trust from April 2011 to December 2012 and Trustee of Evergreen Funds from January 2008 to July 2010. | ||||||
| Douglas F. Kridler 1955 | Trustee since September 1997 | Mr. Kridler is the President and Chief Executive Officer of The Columbus Foundation, a $1.5 billion community foundation with 2,000 funds in 55 Ohio counties and 37 states in the U.S. | 112 | None | ||||||
104
Management Information (Continued)
January 31, 2014
The address for each Trustee is: c/o Nationwide Funds Group, 1000 Continental Drive, Suite 400, King of Prussia, PA 19406.
Name and Year of Birth | Position(s) Held with the Trust and Length of Time Served1,2 | Principal Occupation(s) During Past Five Years (or longer)3 | Number of Portfolios in the Nationwide Fund Complex Overseen by Trustee | Other Directorships Held by Trustee During Past Five Years4 | ||||||
| David C. Wetmore 1948 | Trustee since 1995 and Chairman since February 2005 | Mr. Wetmore was a Managing Director of Updata Capital, Inc. (a technology-oriented investment banking and venture capital firm) from 1995 through 2000. Prior to 1995, Mr. Wetmore served as the Chief Operating Officer, Chief Executive Officer and Chairman of the Board of several publicly-held software and services companies, and as the managing partner of a “big 8” public accounting firm. | 112 | None | ||||||
| 1 | Length of time served includes time served with predecessor of the Trust. |
| 2 | Each Trustee holds office for the lifetime of the Trust or until such Trustee’s earlier death, resignation, removal, retirement or inability otherwise to serve, or the election and qualification of his or her successor. |
| 3 | Unless otherwise noted, the information presented is the principal occupation of the Trustee during the past five years. |
| 4 | Directorships held in (i) any other investment companies registered under the 1940 Act, (ii) any company with a class of securities registered pursuant to Section 12 of the Securities Exchange Act of 1934, as amended (the “Exchange Act”) or (iii) any company subject to the requirements of Section 15(d) of the Exchange Act. |
105
Management Information (Continued)
January 31, 2014
The address for each Officer is: c/o Nationwide Funds Group, 1000 Continental Drive, Suite 400, King of Prussia, PA 19406.
| Name and Year of Birth | Position(s) Held with Fund and Length of Time Served1 | Principal Occupation(s) During Past Five Years2 | ||
| Michael S. Spangler 1966 | President and Chief Executive Officer since June 2008 | Mr. Spangler is President and Chief Executive Officer of Nationwide Funds Group, which includes NFA3, Nationwide Fund Management LLC3 and Nationwide Fund Distributors LLC3, and is a Senior Vice President of NFS3. From May 2004 through May 2008, Mr. Spangler was Managing Director, Head of Americas Retail and Intermediary Product Management for Morgan Stanley Investment Management. | ||
| Stephen T. Grugeon 1950 | Executive Vice President and Chief Operating Officer since June 2008 | Mr. Grugeon has been Executive Vice President and Chief Operating Officer of Nationwide Funds Group since May 20073. From February 2008 through June 2008, he also served as the acting President and Chief Executive Officer of the Trust and of Nationwide Funds Group. From December 2006 until January 2008, he was Executive Vice President of NWD Investments3. | ||
| Joseph Finelli 1957 | Treasurer since September 2007 | Mr. Finelli is the Principal Financial Officer and Senior Vice President for Nationwide Funds Group3. From July 2001 until September 2007, he was Assistant Treasurer and Vice President of Investment Accounting and Operations of NWD Investments3. | ||
| Brian Hirsch 1956 | Chief Compliance Officer since January 2012 | Mr. Hirsch is Vice President of NFA and Chief Compliance Officer of NFA and the Trust. From January 2003 through January 2012, Mr. Hirsch was the Senior Vice President for Compliance and Fund Administration at IFS Financial Services, Inc., a subsidiary of the Western Southern Financial Group. | ||
| Eric E. Miller 1953 | Secretary since December 2002 | Mr. Miller is Senior Vice President, General Counsel, and Assistant Secretary for Nationwide Funds Group and NWD Investments3. | ||
| Doff Meyer 1950 | Vice President and Chief Marketing Officer since January 2008 | Ms. Meyer is Senior Vice President and Chief Marketing Officer of Nationwide Funds Group (since August 2007)3. From September 2004 until August 2007, Ms. Meyer was Director of Finance and Marketing, Principal of Piedmont Real Estate Associates LLC. |
| 1 | Length of time served includes time served with the Trust’s predecessors. |
| 2 | Unless otherwise noted, the information presented is the principal occupation of the Officer during the past five years. |
| 3 | These positions are held with an affiliated person or principal underwriter of the Funds. |
Additional information regarding the Trustees and Officers may be found in the Trust’s Statement of Additional Information, which is available without charge upon request, by calling 800-848-0920.
Federal law requires the Trust and each of its investment advisers and subadvisers to adopt procedures for voting proxies (“Proxy Voting Guidelines”) and to provide a summary of those Proxy Voting Guidelines used to vote the securities held by the Fund. The Fund’s proxy voting policies and procedures are available without charge (i) upon request, by calling 800-848-0920, (ii) on the Trust’s website at nationwide.com/mutualfunds, and (iii) on the Securities and Exchange Commission’s website at www.sec.gov
106
| Market Index Definitions |
Barclays 7-Year Municipal Bond Index: An unmanaged index that consists of a broad selection of investment-grade general obligation and revenue bonds with maturities of approximately seven years.
Barclays Emerging Markets USD Aggregate Bond Index: An unmanaged index comprising fixed-rate and floating-rate U.S. dollar-denominated bonds from sovereign, quasi-sovereign and corporate emerging market issuers; the countries considered to be emerging markets are determined by annual review using rules-based classifications from the World Bank income group and the International Monetary Fund (IMF).
Barclays Municipal Bond Index: An unmanaged, market value-weighted index of investment-grade municipal bonds with a minimum credit rating of Baa and maturities of one year or more; serves as a broad market performance index for the tax-exempt bond market.
Barclays U.S. 1-3 Year Government/Credit Bond Index: An unmanaged index of U.S. dollar-denominated, investment-grade, fixed-rate, publicly issued, taxable bond market issues (including Treasury, government and corporate securities) with a remaining maturity of one to three years.
Barclays U.S. 10-20 Year Treasury Bond Index: An unmanaged index that measures the performance of U.S. Treasury securities with a remaining maturity of 10 to 20 years.
Barclays U.S. Aggregate Bond Index: An unmanaged, market value-weighted index of investment-grade, fixed-rate debt issues (including government, corporate, asset-backed, and mortgage-backed securities with maturities of one year or more) that is generally representative of the bond market as a whole.
Barclays U.S. Corporate High Yield Index: An unmanaged index that reflects the performance of fixed-rate, non-investment-grade, U.S. dollar-denominated taxable corporate bonds with at least $150 million par value outstanding, a maximum credit rating of Ba1 and a maturity of one year or more; gives a broad look at how high-yield (“junk”) bonds have performed.
Consumer Price Index (CPI): Calculated by the U.S. Department of Labor’s Bureau of Labor Statistics, the CPI represents changes in prices of a basket of goods and services purchased for consumption by urban households.
Lipper Analytical Services, Inc. (Lipper) is an industry research firm whose rankings are based on total return performance and do not reflect the effect of sales charges. Each fund is ranked within a universe of funds similar in investment objective as determined by Lipper.
MSCI ACWI ex USA: An unmanaged, market capitalization-weighted index that is designed to measure the performance of the stocks in the global developed and emerging markets, excluding U.S.-based companies.
MSCI Emerging Markets® Index: An unmanaged, free float-adjusted, market capitalization-weighted index that is designed to measure the performance of the stocks in emerging-country markets.
MSCI World ex USA Index: An unmanaged index that measures the equity market performance of developed-market countries excluding the United States; covers approximately 85% of the free float-adjusted market capitalization in each country, capturing large- and mid-cap representation.
NASDAQ-100 Index: An unmanaged index that includes 100 of the largest domestic and international nonfinancial securities listed on the Nasdaq Stock Market, based on market capitalization.
107
| Market Index Definitions (con’t.) |
NYSE Arca Tech 100 Index®: An unmanaged, price-weighted index of at least 100 individual technology-related securities, consisting of stocks of companies from various industries that produce or deploy innovative technologies to conduct their business.
Russell 1000® Growth Index: An unmanaged index that measures the performance of the large-capitalization growth segment of the U.S. equity universe; includes those Russell 1000® Index companies with higher price-to-book ratios and higher forecasted growth values.
Russell 1000® Value Index: An unmanaged index that measures the performance of the large-capitalization value segment of the U.S. equity universe; includes those Russell 1000® Index companies with lower price-to-book ratios and lower forecasted growth values.
Russell 2000® Index: An unmanaged index that measures the performance of the small-capitalization segment of the U.S. equity universe.
Russell 2000® Growth Index: An unmanaged index that measures the performance of the large-capitalization growth segment of the U.S. equity universe; includes those Russell 2000® Index companies with higher price-to-book ratios and higher forecasted growth values.
Russell Midcap® Growth Index: An unmanaged index that measures the performance of the mid-capitalization growth segment of the U.S. equity universe; includes those Russell Midcap® Index companies with higher price-to-book ratios and higher forecasted growth values.
Note about Russell Indexes
Russell Investment Group is the source and owner of the trademarks, service marks and copyrights related to the Russell Indexes. Russell® is a trademark of Russell Investment Group.
S&P 500® Index: An unmanaged, market capitalization-weighted index of 500 stocks of leading large-cap U.S. companies in leading industries; gives a broad look at the U.S. equities market and those companies’ stock price performance.
S&P North American Technology Sector Index™: An unmanaged, modified, market capitalization-weighted index that measures the performance of the technology sector of the U.S. equity market.
S&P SmallCap 600® Value Index: An unmanaged index comprising small-capitalization value stocks included in the S&P SmallCap 600® Index. Performance is measured based on the ratios of book value, earnings, and sales to price.
108
| Glossary |
Definitions of some commonly used investment terms
Benchmark index: A broad-based securities index used as a comparison tool to measure the performance of a mutual fund.
Coefficient of correlation: a measure that determines the degree to which the movements of two variables are associated.
Derivative: A contract, security or investment with its value based on the performance of an underlying financial asset, index or economic measure.
Duration: A measure of how much the price of a bond would change compared to a change in market interest rates, based on the remaining time until a bond’s maturity together with other factors. A bond’s value drops when interest rates rise, and vice versa. Bonds with longer durations have higher risk and volatility.
Emerging market countries: Developing and low- or middle-income countries as identified by the International Finance Corporation or the World Bank. Emerging market countries may be found in regions such as Asia, Latin America, Eastern Europe, the Middle East and Africa.
Equity securities: Securities that represent an ownership interest in the issuer. Common stocks are the most common type of equity securities.
Expense ratio: The percentage of fees paid by a fund to its adviser for management and operational costs. A fund’s expense ratio includes all administrative expenses and 12b-1 fees but excludes sales charges.
Fixed-income securities: Securities, including bonds and other debt securities, that represent an obligation by the issuer to pay a specified rate of interest or dividend at specified times and eventually return the principal at maturity.
Futures: Contracts that obligate the buyer to buy and the seller to sell a specified quantity of an underlying asset (or settle for cash the value of a contract based on the underlying asset) at a specified price on the contract’s maturity date.
Growth style: Investing in equity securities of companies that the Fund’s subadviser believes have above-average rates of earnings growth and which therefore may experience above-average increases in stock price.
High-yield bonds: Fixed-income securities that are rated below investment grade by nationally recognized statistical rating organizations. These bonds generally offer investors higher interest rates as a way to help compensate for the fact that the issuer is at greater risk of default.
Market capitalization: A common way of measuring the size of a company based on the price of its common stock multiplied by the number of outstanding shares.
Preferred stock: A class of stock that often pays dividends at a specified rate and has preference over common stocks in dividend payments and liquidation of assets.
Quantitative techniques: Mathematical and statistical methods used in the investment process to identify securities of issuers for possible purchase or sale by a mutual fund.
109
| Glossary (con’t.) |
Value style: Investing in equity securities that a fund’s manager believes are undervalued, i.e., their stock prices are less than the manager believes they are intrinsically worth, based on such factors as a company’s stock price relative to its book value, earnings and cash flow.
Yield curve: A plotted graph line showing the interest rates of bonds, at a set point in time, that have equal credit quality but different maturity dates.
110
P.O. Box 701
Milwaukee, WI 53201-0701
nationwide.com/mutualfunds


Investors should carefully consider a fund’s (and, if applicable, each of its underlying funds’) investment objectives, risks, fees, charges and expenses before investing any money. To obtain this and other information on Nationwide Funds, please call 1-800-848-0920 to request a summary prospectus and/or a prospectus, or download a summary prospectus and/or a prospectus at nationwide.com/mutualfunds. Please read it carefully before investing any money.
About Nationwide Funds Group (NFG)
NFG comprises Nationwide Fund Advisors, Nationwide Fund Distributors LLC and Nationwide Fund Management LLC. Together they provide advisory, distribution and administration services, respectively, to Nationwide Funds. Nationwide Fund Advisors (NFA) is the investment adviser to Nationwide Funds. NFA is a wholly owned subsidiary of Nationwide Financial Services, Inc. (NFS).
Distributor
Nationwide Funds distributed by Nationwide Fund Distributors LLC (NFD), member FINRA, King of Prussia, Pa. NFD is not an affiliate of any subadviser discussed in this material.
Nationwide, Nationwide Financial, the Nationwide framemark, Nationwide Funds, Nationwide Funds Group and On Your Side are service marks of Nationwide Mutual Insurance Company.
© 2014 Nationwide Funds Group. All rights reserved.
SAR-HM-CFX 3/14
Item 2. Code of Ethics.
Disclose whether, as of the end of the period covered by the report, the registrant has adopted a code of ethics that applies to the registrant’s principal executive officer, principal financial officer, principal accounting officer or controller, or persons performing similar functions, regardless of whether these individuals are employed by the registrant or a third party. If the registrant has not adopted such a code of ethics, explain why the registrant has not done so.
Not Applicable: The information required by this item is required only in an annual report on the Form N-CSR.
Item 3. Audit Committee Financial Expert.
| (a) | (1) Disclose that the registrant’s board of directors has determined that the registrant either: |
| (i) | Has at least one audit committee financial expert serving on its audit committee; or |
| (ii) | Does not have an audit committee financial expert serving on its audit committee. |
| (2) | If the registrant provides the disclosure required by paragraph (a)(1)(i) of this Item, it must disclose the name of the audit committee financial expert and whether that person is “independent.” In order to be considered “independent” for purposes of this Item, a member of an audit committee may not, other than in his or her capacity as a member of the audit committee, the board of directors, or any other board committee: |
| (i) | Accept directly or indirectly any consulting, advisory, or other compensatory fee from the issuer; or |
| (ii) | Be an “interested person” of the investment company as defined in Section 2(a)(19) of the Act (15 U.S.C. § 80a-2(a)(19)). |
| (3) | If the registrant provides the disclosure required by paragraph (a)(1)(ii) of this Item, the registrant must explain why the registrant does not have an audit committee financial expert. |
Not Applicable: The information required by this item is required only in an annual report on the Form N-CSR.
Item 4. Principal Accountant Fees and Services.
(a) Disclose, under the caption Audit Fees, the aggregate fees billed for each of the last two fiscal years for professional services rendered by the principal accountant for the audit of the registrant’s annual financial statements or services that are normally provided by the accountant in connection with statutory and regulatory filings or engagements for those fiscal years.
(b) Disclose, under the caption Audit-Related Fees, the aggregate fees billed in each of the last two fiscal years for assurance and related services by the principal accountant that are reasonably related to the performance of the audit of the registrant’s financial statements and are not reported under paragraph (a) of this Item. Registrants shall describe the nature of the services comprising the fees disclosed under this category.
(c) Disclose, under the caption Tax Fees, the aggregate fees billed in each of the last two fiscal years for professional services rendered by the principal accountant for tax compliance, tax advice, and tax planning. Registrants shall describe the nature of the services comprising the fees disclosed under this category.
(d) Disclose, under the caption All Other Fees, the aggregate fees billed in each of the last two fiscal years for products and services provided by the principal accountant, other than the services reported in paragraphs (a) through (c) of this Item. Registrants shall describe the nature of the services comprising the fees disclosed under this category.
1
(e)(1) Disclose the audit committee’s pre-approval policies and procedures described in paragraph (c)(7) of Rule 2-01 of Regulation S-X.
(2) Disclose the percentage of services described in each of paragraphs (b) through (d) of this Item that were approved by the audit committee pursuant to paragraph (c)(7)(i)(C) of Rule 2-01 of Regulation S-X.
(f) If greater than 50 percent, disclose the percentage of hours expended on the principal accountant’s engagement to audit the registrant’s financial statements for the most recent fiscal year that were attributed to work performed by persons other than the principal accountant’s full-time, permanent employees.
(g) Disclose the aggregate non-audit fees billed by the registrant’s accountant for services rendered to the registrant, and rendered to the registrant’s investment adviser (not including any sub-adviser whose role is primarily portfolio management and is subcontracted with or overseen by another investment adviser), and any entity controlling, controlled by, or under common control with the adviser that provides ongoing services to the registrant for each of the last two fiscal years of the registrant.
(h) Disclose whether the registrant’s audit committee of the board of directors has considered whether the provision of non-audit services that were rendered to the registrant’s investment adviser (not including any subadviser whose role is primarily portfolio management and is subcontracted with or overseen by another investment adviser), and any entity controlling, controlled by, or under common control with the investment adviser that provides ongoing services to the registrant that were not pre-approved pursuant to paragraph (c)(7)(ii) of Rule 2-01 of Regulation S-X is compatible with maintaining the principal accountant’s independence.
Not Applicable: The information required by this item is required only in an annual report on the Form N-CSR.
Item 5. Audit Committee of Listed Registrants.
| (a) | If the registrant is a listed issuer as defined in Rule 10A-3 under the Exchange Act (17CFR § 240.10A-3), state whether or not the registrant has a separately-designated standing audit committee established in accordance with Section 3(a)(58)(A) of the Exchange Act (15 U.S.C. § 78c(a)(58)(A)). If the registrant has such a committee, however designated, identify each committee member. If the entire board of directors is acting as the registrant’s audit committee as specified in Section 3(a)(58)(B) of the Exchange Act (15 U.S.C. § 78c(a)(58)(B)), so state. |
Not Applicable: The registrant is not a listed issuer as defined in Rule 10A-3 under the Exchange Act.
| (b) | If applicable, provide the disclosure required by Rule 10A-3(d) under the Exchange Act (17 CFR § 240.10A-3(d)) regarding an exemption from the listing standards for all audit committees. |
Not Applicable: The registrant is not a listed issuer as defined in Rule 10A-3 under the Exchange Act.
Item 6. Investments.
| (a) | File Schedule I – Investments in securities of unaffiliated issuers as of the close of the reporting period as set forth in § 210.1212 of the Regulation S-X [17 CFR § 210.12-12], unless the schedule is included as part of the report to shareholders filed under Item 1 of this Form. |
This schedule is included as part of the report to shareholders filed under Item 1 of this Form N-CSR.
2
| (b) | If the registrant has divested itself of securities in accordance with Section 13(c) of the Investment Company Act of 1940 following the filing of its last report on Form N-CSR and before filing of the current report, disclosed the following information for each such divested security: |
| (1) | Name of the issuer; |
| (2) | Exchange ticker symbol; |
| (3) | Committee on Uniform Securities Identification Procedures (“CUSIP’) number; |
| (4) | Total number of shares or, for debt securities, principal amount divested; |
| (5) | Date(s) that the securities were divested; |
| (6) | If the registrant holds any securities of the issuer on the date of filing, the exchange ticker symbol; CUSIP number; and the total number of shares or, for debt securities, principal amount held on the date of filing; and |
| (7) | Name of the statute that added the provision of Section 13(c) in accordance with which the securities were divested. |
This Item 6(b) shall terminate one year after the date on which all statutory provisions that underlie Section 13(c) of the Investment Company Act of 1940 have terminated.
The Registrant made no divestments of securities in accordance with Section 13(c) of the Investment Company Act of 1940.
Item 7. Disclosure of Proxy Voting Policies and Procedures for Closed-End Management Investment Companies.
A closed-end management investment company that is filing an annual report on this Form N-CSR must, unless it invests exclusively in non-voting securities, describe the policies and procedures that it uses to determine how to vote proxies relating to portfolio securities, including the procedures that the company uses when a vote presents a conflict between the interests of its shareholders, on the one hand, and those of the company’s investment adviser; principal underwriter; or any affiliated person (as defined in Section 2(a)(3) of the Investment Company Act of 1940 (15 U.S.C. § 80a-2(a)(3)) and the rules thereunder) of the company, its investment adviser, or its principal underwriter, on the other. Include any policies and procedures of the company’s investment adviser, or any other third party, that the company uses, or that are used on the company’s behalf, to determine how to vote proxies relating to portfolio securities.
Not Applicable: The registrant is an open-end management investment company, not a closed-end management investment company.
Item 8. Portfolio Managers of Closed-End Management Investment Company.
If the registrant is a closed-end management investment company that is filing an annual report on this Form N-CSR, provide the information specified in paragraphs (a) and (b) of this Item with respect to portfolio managers.
Not Applicable: The registrant is an open-end management investment company, not a closed-end management investment company.
Item 9. Purchases of Equity Securities by Closed-End Management Investment Company and Affiliated Purchasers.
If the registrant is a closed-end management investment company, provide the information specified in paragraph (b) of this Item with respect to any purchase made by or on behalf of the registrant or any “affiliated purchaser,” as defined in Rule 10b-18(a)(3) under the Exchange Act (17 CFR § 240.10b-18(a)(3)), of shares or other units of any class of the registrant’s equity securities that is registered by the registrant pursuant to Section 12 of the Exchange Act (15 U.S.C. § 781).
Not Applicable: The registrant is an open-end management investment company, not a closed-end management investment company.
3
Item 10. Submission of Matters to a Vote of Security Holders.
Describe any material changes to the procedures by which shareholders may recommend nominees to the registrant’s board of directors, where those changes were implemented after the registrant last provided disclosure in response to the requirements of Item 7(d)(2)(ii)(G) of Schedule 14A (17 CFR § 240.14a-101), or this Item.
The Independent Trustees and the Board of Trustees of the registrant adopted a formal, written “Policy Regarding Shareholder Submission of Trustee Candidates,” as well as a formal, written “Statement of Policy On Criteria For Selecting Trustees,” on June 9, 2005, and June 10, 2005, respectively. Neither this policy nor this statement of policy has been materially changed since the Board of Trustees adoption of the policy and the statement of policy, respectively. The Nominating and Fund Governance Committee of the Board of Trustees (the “NFGC”) and the Board of Trustees, however, on November 11, 2005, and January 12, 2006, respectively, approved amendments to this policy; these amendments to the policy, though, concerned the criteria for selecting candidates for Trustees and the characteristics expected of candidates for Trustees, as set forth in the Exhibit A, “Statement of Policy On Criteria For Selecting Trustees,” to the policy and, arguably, may not be deemed to be material changes to the policy.
{NOTE – THIS IS REQUIRED BEGINNING WITH THE FIRST REPORTING PERIOD ENDING AFTER JANUARY 1, 2004. For purposes of this Item, adoption of procedures by which shareholders may recommend nominees to the registrant’s board of directors, where the registrant’s most recent proxy disclosure (in response to the requirements of Item 7(d)(2)(ii)(G) of Schedule 14A (17 CFR § 240.14a-101)), or this Item, indicated that the registrant did not have in place such procedures, will constitute a material change.}
Item 11. Controls and Procedures.
(a) Disclose the conclusions of the registrant’s principal executive and principal financial officers, or persons performing similar functions, regarding the effectiveness of the registrant’s disclosure controls and procedures (as defined in Rule 30a-3(c) under the Act (17 CFR § 270.30a-3(c))) as of a date within 90 days of the filing date of the report that includes the disclosure required by this paragraph, based on the evaluation of these controls and procedures required by Rule 30a-3(b) under the Act (17 CFR § 270.30a-3(b)) and Rules 13a-15(b) or 15d-15(b) under the Exchange Act (17 CFR § 240.13a-15(b) or § 240.15d-15(b)).
The registrant’s principal executive officer and principal financial officer have concluded, based on their evaluation of the registrant’s disclosure controls and procedures as conducted within ninety (90) days of the filing date of this report, that these disclosure controls and procedures are adequately designed and are operating effectively to ensure that information required to be disclosed by the registrant on Form N-CSR is: (i) accumulated and communicated to the investment company’s management, including the investment company’s certifying officers, to allow timely decisions regarding required disclosure; and (ii) recorded, processed, summarized, and reported within the time periods specified in the Securities and Exchange Commission’s rules and forms.
(b) Disclose any change in the registrant’s internal control over financial reporting (as defined in Rule 30a-3(d) under the Act (17 CFR § 270.30a-3(d)) that occurred during the second fiscal quarter of the period covered by this report that has materially affected, or is reasonably likely to materially affect, the registrant’s internal control over financial reporting.
There were no changes in the registrant’s internal control over financial reporting that occurred during the second fiscal quarter of the period covered by this report that have materially affected or are reasonably likely to materially affect, the registrant’s internal control over financial reporting.
Item 12. Exhibits.
(a) File the exhibits listed below as part of this Form. Letter or number the exhibits in the sequence indicated.
(a)(1) Any code of ethics, or amendment thereto, that is the subject of the disclosure required by Item 2, to the extent that the registrant intends to satisfy the Item 2 requirements through filing of an exhibit.
4
Not Applicable: The information required by this item is required only in an annual report on the Form N-CSR.
(a)(2) A separate certification for each principal executive officer and principal financial officer of the registrant as required by Rule 30a-2(a) under the Act (17 CFR § 270.30a-2).
Certifications pursuant to Rule 30a-2(a) are attached hereto.
(a)(3) Any written solicitation to purchase securities under Rule 23c-1 under the Act (17 CFR § 270.23c-1) sent or given during the period covered by the report by or on behalf of the registrant to ten (10) or more persons.
Not Applicable.
(b) If the report is filed under Section 13(a) or 15(d) of the Exchange Act, provide the certifications required by Rule 30a-2(b) under the Act as an exhibit. A certification furnished pursuant to this paragraph will not be deemed “filed” for purposes of Section 18 of the Exchange Act, or otherwise subject to the liability of that section. Such certification will not be deemed to be incorporated by reference into any filing under the Securities Act of 1933 or the Exchange Act, except to the extent that the registrant incorporates it by reference.
Certifications pursuant to Rule 30a-2(b) are furnished herewith.
5
SIGNATURES
Pursuant to the requirements of the Securities Exchange Act of 1934 and the Investment Company Act of 1940, the registrant has duly caused this report to be signed on its behalf by the undersigned, thereunto duly authorized.
| (Registrant) | NATIONWIDE MUTUAL FUNDS | |||||||
| By (Signature and Title) | /s/ Joseph A. Finelli | |||||||
| Name: | Joseph A. Finelli | |||||||
| Title: | Principal Financial Officer | |||||||
| Date: | March 28, 2014 | |||||||
Pursuant to the requirements of the Securities Exchange Act of 1934 and the Investment Company Act of 1940, this report has been signed below by the following persons on behalf of the registrant and in the capacities and on the dates indicated.
| NATIONWIDE MUTUAL FUNDS | ||||||||
| By (Signature and Title) | /s/ Michael S. Spangler | |||||||
| Name: | Michael S. Spangler | |||||||
| Title: | Principal Executive Officer | |||||||
| Date: | March 28, 2014 | |||||||
| NATIONWIDE MUTUAL FUNDS | ||||||||
| By (Signature and Title) | /s/ Joseph A. Finelli | |||||||
| Name: | Joseph A. Finelli | |||||||
| Title: | Principal Financial Officer | |||||||
| Date: | March 28, 2014 | |||||||
| * | Print the name and title of each signing officer under his or her signature. |