| | | | | | | | |
| |
| CONTACT: | | 7550 Wisconsin Ave, Suite 900 |
| Amy Hopkins | Bethesda, MD 20814 |
| Vice President, Investor Relations | Tel 202-774-3253 |
| E-Mail: ahopkins@elmecommunities.com | Fax 301-984-9610 |
| www.elmecommunities.com |
| |
| | November 4, 2024 |
| | |
| Elme Communities Announces Third Quarter 2024 Results |
Elme Communities (the “Company”) (NYSE: ELME), a multifamily REIT with communities in the Washington, DC metro area and the Atlanta metro area, reported financial and operating results today for the quarter ended September 30, 2024:
Financial Results
•Net loss was $3.0 million, or $0.03 per diluted share
•NAREIT FFO was $20.5 million, or $0.23 per diluted share
•Core FFO was $20.7 million, or $0.23 per diluted share
•Net Operating Income (NOI) was $38.8 million
Operational Highlights
•Same-store multifamily NOI increased by 2.3% compared to the prior year quarter
•Effective blended Lease Rate Growth was 2.1% for our Same-Store Portfolio during the quarter, comprised of effective new Lease Rate Growth of (1.5)% and effective renewal Lease Rate Growth of 4.5%
•Average Effective Monthly Rent Per Home increased 2.4% compared to the prior year quarter for our Same-Store Portfolio
•Same-store Retention was 66%, up 5% compared to the prior year quarter
•Same-store multifamily Average Occupancy was 95.2% during the quarter, down 0.2% compared to the prior year quarter and up 0.6% compared to the prior quarter.
•Same-store multifamily Ending Occupancy was 94.8%, down 0.4% compared to the prior year quarter and down 0.7% compared to the prior quarter.
Liquidity Position
•Available liquidity was approximately $337 million as of September 30, 2024, consisting of availability under the Company's revolving credit facility and cash on hand
•Annualized third quarter Net Debt to Adjusted EBITDA ratio was 5.6x
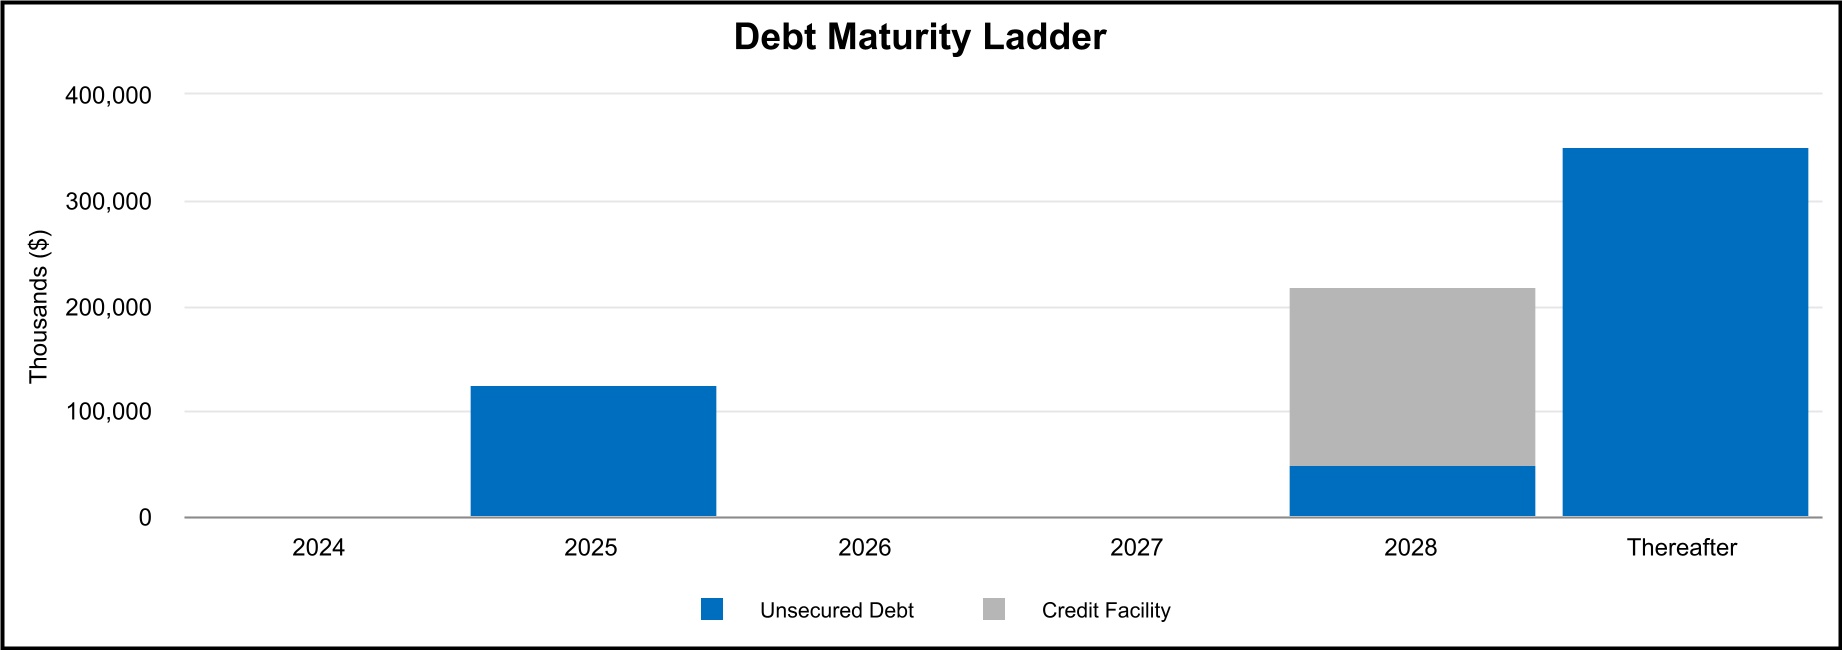
•The Company has a strong balance sheet with only $125 million of debt maturing before 2028 and no secured debt
“We continue to experience solid demand across our Washington Metro portfolio, resulting in a 0.6% sequential improvement in same-store occupancy,” said Paul T. McDermott, President and CEO. “In Atlanta, while we are achieving strong retention and renewal rates, our third quarter performance reflects the combined impacts of elevated supply and slower than expected improvement in bad debt. Looking ahead to 2025, we expect to deliver meaningful improvement in our Atlanta performance due to lower bad debt and we anticipate increasingly favorable supply/demand dynamics thereafter."
Third Quarter Operating Results
•Multifamily same-store NOI - Same-store NOI increased 2.3% compared to the corresponding prior year period driven primarily by higher base rent. Average Occupancy for the quarter decreased 20 basis points from the prior year period to 95.2%.
•Other same-store NOI - The Other same-store portfolio is comprised of one asset, Watergate 600. Other same-store NOI decreased by 0.9% compared to the corresponding prior year period due to higher operating expenses. Watergate 600 was 86.0% occupied and leased at quarter end.
Guidance
“We are pleased with the strong performance from our Washington Metro portfolio and how our teams have effectively managed operating expenses,” said Steven Freishtat, Executive Vice President and CFO. “However, progress on reducing bad debt across our Atlanta portfolio was slower than anticipated for the quarter. As a result, we are tightening our guidance range while reiterating the midpoint of Core FFO guidance.”
The Company is tightening its Core FFO guidance range for 2024 to $0.92 to $0.94 per fully diluted share. The following assumptions are included in the Core FFO guidance for 2024:
Full Year 2024 Outlook on Key Assumptions and Metrics
•Same-store multifamily NOI growth is now expected to range from 1.0% to 1.5%
•Non-same-store multifamily NOI is now expected to range from $5.35 million to $5.75 million
•Other same-store NOI, which consists solely of Watergate 600, is now expected to range from $12.5 million to $12.75 million
•Property management expense is expected to range from $8.5 million to $9.0 million
•G&A, net of core adjustments, is now expected to range from $24.4 million to $25.1 million
•Interest expense is now expected to range from $37.5 million to $38.0 million
•Does not consider any potential future acquisitions or dispositions in 2024
| | | | | |
| Full Year 2024 | |
| Core FFO per diluted share | $0.92 - $0.94 |
| Net Operating Income Assumptions | |
Same-store multifamily NOI growth (a) | 1.0% - 1.5% |
Non-same-store multifamily NOI (b) | $5.35 million - $5.75 million |
Other same-store NOI (c) | $12.5 million - $12.75 million |
| Expense Assumptions | |
| Property management expense | $8.5 million - $9.0 million |
| G&A, net of core adjustments | $24.4 million - $25.1 million |
| Interest expense | $37.5 million - $38.0 million |
(a) Includes revenue and expenses from retail operations at multifamily communities | |
(b) Includes Elme Druid Hills and Riverside Development |
(c) Consists of Watergate 600 |
Elme Communities' 2024 Core FFO guidance and outlook are based on a number of factors, many of which are outside the Company's control, including economic factors such as inflation and interest rate changes, and all of which are subject to change. Elme Communities may change the guidance provided during the year as actual and anticipated results vary from these assumptions, but Elme Communities undertakes no obligation to do so.
2024 Guidance Reconciliation Table
A reconciliation of projected net loss per diluted share to projected Core FFO per diluted share for the full year ending December 31, 2024 is as follows:
| | | | | | | | |
| Low | High |
| Net loss per diluted share | $(0.16) | $(0.14) |
| Real estate depreciation and amortization | 1.09 | 1.09 |
| NAREIT FFO per diluted share | 0.93 | 0.95 |
| Core adjustments | (0.01) | (0.01) |
| Core FFO per diluted share | $0.92 | $0.94 |
Dividends
On October 3, 2024, Elme Communities paid a quarterly dividend of $0.18 per share.
Elme Communities announced today that its Board of Trustees has declared a quarterly dividend of $0.18 per share to be paid on January 6, 2025 to shareholders of record on December 19, 2024.
Presentation Webcast and Conference Call Information
The Third Quarter 2024 Earnings Call is scheduled for Tuesday, November 5, 2024 at 10:00 A.M. Eastern Time. There will also be a webcast presentation with slides. Conference Call access information is as follows:
USA Toll Free Number: 1-888-506-0062
International Toll Number: 1-973-528-0011
Conference ID: 848746
The instant replay of the Earnings Call will be available until Tuesday, November 19, 2024. Instant replay access information is as follows:
USA Toll Free Number: 1-877-481-4010
International Toll Number: 1-919-882-2331
Conference ID: 51315
The live on-demand webcast of the Conference Call with presentation slides will be available on the Investor section of Elme Communities' website at www.elmecommunities.com. Online playback of the webcast and presentation slides will be available following the Conference Call.
About Elme Communities
Elme Communities is committed to elevating what home can be for middle-income renters by providing a higher level of quality, service, and experience. The Company is a multifamily real estate investment trust that owns and operates approximately 9,400 apartment homes in the Washington, DC metro and the Atlanta metro regions, and owns approximately 300,000 square feet of commercial space. Focused on providing quality, affordable homes to a deep, solid, and underserved base of mid-market demand, Elme Communities is building long-term value for shareholders.
Note: Elme Communities' press releases and supplemental financial information are available on the Company website at www.elmecommunities.com or by contacting Investor Relations at (202) 774-3200.
Forward Looking Statements
Certain statements in our earnings release and on our conference call are “forward-looking statements” within the meaning of the Private Securities Litigation Reform Act of 1995 and involve risks and uncertainties. Forward-looking statements relate to expectations, beliefs, projections, future plans and strategies, anticipated events or trends and similar expressions concerning matters that are not historical facts. In some cases, you can identify forward looking statements by the use of forward-looking terminology such as “may,” “will,” “should,” “expects,” “intends,” “plans,” “anticipates,”
“believes,” “estimates,” “predicts,” or “potential” or the negative of these words and phrases or similar words or phrases which are predictions of or indicate future events or trends and which do not relate solely to historical matters. Such statements involve known and unknown risks, uncertainties, and other factors which may cause the actual results, performance, or achievements of Elme Communities to be materially different from future results, performance or achievements expressed or implied by such forward-looking statements. Additional factors which may cause the actual results, performance, or achievements of Elme Communities to be materially different from future results, performance or achievements expressed or implied by such forward-looking statements include, but are not limited to: the risks associated with ownership of real estate in general and our real estate assets in particular; our ability to work through elevated eviction backlogs; our ability to benefit from core growth drivers across our Washington Metro communities and end the year in a strong position; our ability to ramp up renovations over the course of this year; our ability to achieve above market growth after 2024 driven by renovations; the economic health of the areas in which our properties are located, particularly with respect to the greater Washington, DC metro and Sunbelt regions; risks associated with our ability to execute on our strategies, including new strategies with respect to our operations and our portfolio, including the acquisition of apartment homes in the Sunbelt markets and our ability to realize any anticipated operational benefits from our internalization of community management functions; the risk of failure to enter into and/or complete acquisitions and dispositions; changes in the composition of our portfolio; reductions in or actual or threatened changes to the timing of federal government spending; the economic health of our residents; the impact from macroeconomic factors (including inflation, increases in interest rates, potential economic slowdowns or recessions and geopolitical conflicts); risks related to our ability to control our expenses if revenues decrease; compliance with applicable laws and corporate social responsibility goals, including those concerning the environment and access by persons with disabilities; risks related to not having adequate insurance to cover potential losses; changes in the market value of securities; terrorist attacks or actions and/or cyber-attacks; whether we will succeed in the day-to-day property management and leasing activities that we have previously outsourced; the availability and terms of financing and capital and the general volatility of securities markets; our ability to capture the impacts from normalizing bad debt; the risks related to our organizational structure and limitations of share ownership; failure to qualify and maintain our qualification as a REIT and the risks of changes in laws affecting REITs; and other risks and uncertainties detailed from time to time in our filings with the SEC, including our 2023 Form 10-K filed on February 16, 2024. While forward-looking statements reflect our good faith beliefs, they are not guarantees of future performance. We undertake no obligation to update our forward-looking statements or risk factors to reflect new information, future events, or otherwise.
This Earnings Release also includes certain forward-looking non-GAAP information. These non-GAAP financial measures should be considered along with, but not as alternatives to, net income (loss) as a measure of our operating performance. Please see the following pages for the corresponding definitions and reconciliations of such non-GAAP financial measures.
| | | | | | | | | | | | | | | | | | | | | | | |
| ELME COMMUNITIES AND SUBSIDIARIES |
| FINANCIAL HIGHLIGHTS |
| (In thousands, except per share data) |
| (Unaudited) |
| | | | | | | |
| Three Months Ended September 30, | | Nine Months Ended September 30, |
| OPERATING RESULTS | 2024 | | 2023 | | 2024 | | 2023 |
| Revenue | | | | | | | |
| Real estate rental revenue | $ | 61,055 | | | $ | 56,651 | | | $ | 180,671 | | | $ | 169,059 | |
| Expenses | | | | | | | |
Property operating and maintenance (1) | 14,095 | | | 12,696 | | | 41,555 | | | 38,360 | |
Real estate taxes and insurance (1) | 8,163 | | | 7,101 | | | 24,404 | | | 21,216 | |
| Property management | 2,235 | | | 1,935 | | | 6,628 | | | 5,882 | |
| General and administrative | 6,354 | | | 6,370 | | | 18,688 | | | 19,891 | |
| Transformation costs | — | | | 985 | | | — | | | 6,339 | |
| Depreciation and amortization | 23,474 | | | 21,904 | | | 72,312 | | | 64,855 | |
| Real estate impairment | — | | | 41,860 | | | — | | | 41,860 | |
| 54,321 | | | 92,851 | | | 163,587 | | | 198,403 | |
| | | | | | | |
| Real estate operating income (loss) | 6,734 | | | (36,200) | | | 17,084 | | | (29,344) | |
| Other income (expense) | | | | | | | |
| Interest expense | (9,557) | | | (7,418) | | | (28,435) | | | (21,043) | |
| | | | | | | |
| Loss on extinguishment of debt | (147) | | | — | | | (147) | | | (54) | |
| Other income | — | | | — | | | 1,410 | | | 569 | |
| | | | | | | |
| (9,704) | | | (7,418) | | | (27,172) | | | (20,528) | |
| | | | | | | |
| | | | | | | |
| | | | | | | |
| | | | | | | |
| | | | | | | |
| | | | | | | |
| | | | | | | |
| Net loss | $ | (2,970) | | | $ | (43,618) | | | $ | (10,088) | | | $ | (49,872) | |
| | | | | | | |
| | | | | | | |
| | | | | | | |
| Net loss | $ | (2,970) | | | $ | (43,618) | | | $ | (10,088) | | | $ | (49,872) | |
| Depreciation and amortization | 23,474 | | | 21,904 | | | 72,312 | | | 64,855 | |
| Real estate impairment | — | | | 41,860 | | | — | | | 41,860 | |
| | | | | | | |
| | | | | | | |
| | | | | | | |
| | | | | | | |
| | | | | | | |
| | | | | | | |
| | | | | | | |
| NAREIT funds from operations | $ | 20,504 | | | $ | 20,146 | | | $ | 62,224 | | | $ | 56,843 | |
| | | | | | | |
| Non-cash loss on extinguishment of debt | $ | 147 | | | $ | — | | | $ | 147 | | | $ | 54 | |
| Tenant improvements and incentives, net of reimbursements | — | | | — | | | — | | | (10) | |
| Leasing commissions capitalized | (30) | | | — | | | (30) | | | (56) | |
| Recurring capital improvements | (2,284) | | | (1,490) | | | (7,199) | | | (5,950) | |
| Straight-line rents, net | 26 | | | (74) | | | 66 | | | (160) | |
| | | | | | | |
| Non-real estate depreciation & amortization of debt costs | 1,326 | | | 1,348 | | | 3,755 | | | 3,891 | |
| Amortization of lease intangibles, net | (201) | | | (155) | | | (526) | | | (570) | |
| Amortization and expensing of restricted share and unit compensation | 1,578 | | | 1,432 | | | 3,713 | | | 3,966 | |
| | | | | | | |
| Adjusted funds from operations | $ | 21,066 | | | $ | 21,207 | | | $ | 62,150 | | | $ | 58,008 | |
| ______________________________ | | | | | | | |
| (1) Certain immaterial amounts in prior periods have been reclassified to conform with the current period presentation. |
| | | | | | | | | | | | | | | | | | | | | | | | | | |
| | Three Months Ended September 30, | | Nine Months Ended September 30, |
| Per share data: | | 2024 | | 2023 | | 2024 | | 2023 |
| | | | | | | | |
| | | | | | | | |
| Net loss | (Basic) | $ | (0.03) | | | $ | (0.50) | | | $ | (0.12) | | | $ | (0.57) | |
| (Diluted) | $ | (0.03) | | | $ | (0.50) | | | $ | (0.12) | | | $ | (0.57) | |
| | | | | | | | |
| | | | | | | | |
| NAREIT FFO | (Basic) | $ | 0.23 | | | $ | 0.23 | | | $ | 0.71 | | | $ | 0.65 | |
| (Diluted) | $ | 0.23 | | | $ | 0.23 | | | $ | 0.70 | | | $ | 0.64 | |
| | | | | | | | |
| Dividends paid | | $ | 0.18 | | | $ | 0.18 | | | $ | 0.54 | | | $ | 0.54 | |
| | | | | | | | |
| Weighted average shares outstanding - basic | | 87,930 | | | 87,759 | | | 87,909 | | | 87,717 | |
| Weighted average shares outstanding - diluted | | 87,930 | | | 87,759 | | | 87,909 | | | 87,717 | |
| Weighted average shares outstanding - diluted (for NAREIT FFO) | 87,994 | | | 87,799 | | | 87,956 | | | 87,809 | |
| | | | | | | | | | | |
| ELME COMMUNITIES AND SUBSIDIARIES |
| CONSOLIDATED BALANCE SHEETS |
| (In thousands, except per share data) |
| (Unaudited) |
| | | |
| September 30, 2024 | | December 31, 2023 |
| Assets | | | |
| Land | $ | 383,808 | | | $ | 384,097 | |
| Income producing property | 1,986,596 | | | 1,960,020 | |
| 2,370,404 | | | 2,344,117 | |
| Accumulated depreciation and amortization | (595,533) | | | (528,024) | |
| Net income producing property | 1,774,871 | | | 1,816,093 | |
| Properties under development or held for future development | 30,980 | | | 30,980 | |
| Total real estate held for investment, net | 1,805,851 | | | 1,847,073 | |
| | | |
| Cash and cash equivalents | 4,840 | | | 5,984 | |
| Restricted cash | 2,358 | | | 2,554 | |
| Rents and other receivables | 12,676 | | | 17,642 | |
| Prepaid expenses and other assets | 27,434 | | | 26,775 | |
| | | |
| Total assets | $ | 1,853,159 | | | $ | 1,900,028 | |
| | | |
| Liabilities | | | |
| Notes payable, net | $ | 522,914 | | | $ | 522,345 | |
| | | |
| Line of credit | 168,000 | | | 157,000 | |
| Accounts payable and other liabilities | 36,295 | | | 38,997 | |
| Dividend payable | 15,906 | | | 15,863 | |
| Advance rents | 4,801 | | | 5,248 | |
| Tenant security deposits | 6,270 | | | 6,225 | |
| | | |
| Total liabilities | 754,186 | | | 745,678 | |
| | | |
| Equity | | | |
| Shareholders' equity | | | |
| Preferred shares; $0.01 par value; 10,000 shares authorized; no shares issued or outstanding | — | | | — | |
| Shares of beneficial interest, $0.01 par value; 150,000 shares authorized: 88,010 and 87,867 shares issued and outstanding, as of September 30, 2024 and December 31, 2023, respectively | 880 | | | 879 | |
| Additional paid in capital | 1,739,319 | | | 1,735,530 | |
| Distributions in excess of net income | (627,186) | | | (569,391) | |
| Accumulated other comprehensive loss | (14,323) | | | (12,958) | |
| Total shareholders' equity | 1,098,690 | | | 1,154,060 | |
| | | |
| Noncontrolling interests in subsidiaries | 283 | | | 290 | |
| Total equity | 1,098,973 | | | 1,154,350 | |
| | | |
| Total liabilities and equity | $ | 1,853,159 | | | $ | 1,900,028 | |
| | | | | | | | | | | | | | | | | | | | | | | |
| The following tables contain reconciliations of net loss to NOI and same-store NOI for the periods presented (in thousands): |
| Three Months Ended September 30, | | Nine Months Ended September 30, |
| 2024 | | 2023 | | 2024 | | 2023 |
| Net loss | $ | (2,970) | | | $ | (43,618) | | | $ | (10,088) | | | $ | (49,872) | |
| Adjustments: | | | | | | | |
| Property management expense | 2,235 | | | 1,935 | | | 6,628 | | | 5,882 | |
| General and administrative expense | 6,354 | | | 6,370 | | | 18,688 | | | 19,891 | |
| Transformation costs | — | | | 985 | | | — | | | 6,339 | |
| Real estate depreciation and amortization | 23,474 | | | 21,904 | | | 72,312 | | | 64,855 | |
| Real estate impairment | — | | | 41,860 | | | — | | | 41,860 | |
| | | | | | | |
| Interest expense | 9,557 | | | 7,418 | | | 28,435 | | | 21,043 | |
| | | | | | | |
| Loss on extinguishment of debt | 147 | | | — | | | 147 | | | 54 | |
| Other income | — | | | — | | | (1,410) | | | (569) | |
| | | | | | | |
| | | | | | | |
| | | | | | | |
| | | | | | | |
| | | | | | | |
| Total Net Operating Income (NOI) | $ | 38,797 | | | $ | 36,854 | | | $ | 114,712 | | | $ | 109,483 | |
| | | | | | | |
| Multifamily NOI: | | | | | | | |
| Same-store Portfolio | $ | 34,414 | | | $ | 33,654 | | | $ | 100,950 | | | $ | 99,659 | |
| Acquisitions | 1,254 | | | 36 | | | 4,215 | | | 36 | |
| Development | (61) | | | (56) | | | (175) | | | (168) | |
| | | | | | | |
| Total | 35,607 | | | 33,634 | | | 104,990 | | | 99,527 | |
| | | | | | | |
| Other NOI (Watergate 600) | 3,190 | | | 3,220 | | | 9,722 | | | 9,956 | |
| Total NOI | $ | 38,797 | | | $ | 36,854 | | | $ | 114,712 | | | $ | 109,483 | |
| | | | | | | |
| | | | | | | | | | | | | | | | | | | | | | | | | | | |
| The following table contains a reconciliation of net loss to core funds from operations for the periods presented (in thousands, except per share data): | |
| | Three Months Ended September 30, | | Nine Months Ended September 30, | |
| | 2024 | | 2023 | | 2024 | | 2023 | |
| Net loss | | $ | (2,970) | | | $ | (43,618) | | | $ | (10,088) | | | $ | (49,872) | | |
| Add: | | | | | | | | | |
| Real estate depreciation and amortization | | 23,474 | | | 21,904 | | | 72,312 | | | 64,855 | | |
| | | | | | | | | |
| Real estate impairment | | — | | | 41,860 | | | — | | | 41,860 | | |
| | | | | | | | | |
| | | | | | | | | |
| | | | | | | | | |
| | | | | | | | | |
| | | | | | | | | |
| NAREIT funds from operations | | 20,504 | | | 20,146 | | | 62,224 | | | 56,843 | | |
| Add: | | | | | | | | | |
| Structuring expenses | | — | | | — | | | 60 | | | 60 | | |
| | | | | | | | | |
| Loss on extinguishment of debt | | 147 | | | — | | | 147 | | | 54 | | |
| | | | | | | | | |
| Severance expense | | 13 | | | — | | | 77 | | | 394 | | |
| Transformation costs | | — | | | 985 | | | — | | | 6,339 | | |
| | | | | | | | | |
| Write-off of pursuit costs | | — | | | — | | | — | | | 49 | | |
| Relocation expense | | — | | | 306 | | | — | | | 626 | | |
| Gain on land easements | | — | | | — | | | (1,410) | | | — | | |
| | | | | | | | | |
| Core funds from operations | | $ | 20,664 | | | $ | 21,437 | | | $ | 61,098 | | | $ | 64,365 | | |
| | | | | | | | | |
| | Three Months Ended September 30, | | Nine Months Ended September 30, | |
| Per share data: | | 2024 | | 2023 | | 2024 | | 2023 | |
| NAREIT FFO | (Basic) | $ | 0.23 | | | $ | 0.23 | | | $ | 0.71 | | | $ | 0.65 | | |
| (Diluted) | $ | 0.23 | | | $ | 0.23 | | | $ | 0.70 | | | $ | 0.64 | | |
| Core FFO | (Basic) | $ | 0.23 | | | $ | 0.24 | | | $ | 0.69 | | | $ | 0.73 | | |
| (Diluted) | $ | 0.23 | | | $ | 0.24 | | | $ | 0.69 | | | $ | 0.73 | | |
| | | | | | | | | |
| Weighted average shares outstanding - basic | | 87,930 | | | 87,759 | | | 87,909 | | | 87,717 | | |
Weighted average shares outstanding - diluted
(for NAREIT and Core FFO) | | 87,994 | | | 87,799 | | | 87,956 | | | 87,809 | | |
| | | | | | | | | | | | | | | | | | | | | | | |
| Adjusted Earnings Before Interest, Taxes, Depreciation and Amortization (EBITDA) (in thousands): |
| Three Months Ended September 30, | | Nine Months Ended September 30, |
| 2024 | | 2023 | | 2024 | | 2023 |
| Net loss | $ | (2,970) | | $ | (43,618) | | $ | (10,088) | | $ | (49,872) |
| Add/(deduct): | | | | | | | |
| Interest expense | 9,557 | | 7,418 | | 28,435 | | 21,043 |
| Real estate depreciation and amortization | 23,474 | | 21,904 | | 72,312 | | 64,855 |
| | | | | | | |
| Real estate impairment | — | | 41,860 | | — | | 41,860 |
| Non-real estate depreciation | 160 | | 291 | | 468 | | 728 |
| Severance expense | 13 | | — | | 77 | | 394 |
| Transformation costs | — | | 985 | | — | | 6,339 |
| | | | | | | |
| Relocation expense | — | | 306 | | — | | 626 |
| Structuring expenses | — | | — | | 60 | | 60 |
| | | | | | | |
| Loss on extinguishment of debt | 147 | | — | | 147 | | 54 |
| | | | | | | |
| Write-off of pursuit costs | — | | — | | — | | 49 |
| Gain on land easements | — | | — | | (1,410) | | — |
| | | | | | | |
| | | | | | | |
| | | | | | | |
| Adjusted EBITDA | $ | 30,381 | | $ | 29,146 | | $ | 90,001 | | $ | 86,136 |
| | | | | | | | | | | | | | |
| Non-GAAP Financial Measures |
Adjusted EBITDA is earnings before interest expense, taxes, depreciation, amortization, gain/loss on sale of real estate, casualty gain/loss, real estate impairment, gain/loss on extinguishment of debt, gain/loss on interest rate derivatives, severance expense, acquisition expenses, gain from non-disposal activities, adjustment to deferred taxes, write-off of pursuit costs, Transformation Costs and gain on land easements. Adjusted EBITDA is included herein because we believe it helps investors and lenders understand our ability to incur and service debt and to make capital expenditures. Adjusted EBITDA is a non-GAAP and non-standardized measure and may be calculated differently by other REITs.
Adjusted Funds From Operations (“AFFO”) is a non-GAAP measure. It is calculated by subtracting from FFO (1) recurring improvements, tenant improvements and leasing costs, that are capitalized and amortized and are necessary to maintain our properties and revenue stream (excluding items contemplated prior to acquisition or associated with development / redevelopment of a property) and (2) straight line rents, then adding (3) non-real estate depreciation and amortization, (4) non-cash fair value interest expense and (5) amortization of restricted share compensation, then adding or subtracting the (6) amortization of lease intangibles, (7) real estate impairment and (8) non-cash gain/loss on extinguishment of debt, as appropriate. AFFO is included herein, because we consider it to be a performance measure of a REIT’s ability to incur and service debt and to distribute dividends to its shareholders. AFFO is a non-GAAP and non-standardized measure, and may be calculated differently by other REITs.
Core Adjusted Funds From Operations (“Core AFFO”) is calculated by adjusting AFFO for the following items (which we believe are not indicative of the performance of Elme Communities' operating portfolio and affect the comparative measurement of Elme Communities' operating performance over time): (1) gains or losses on extinguishment of debt and gains or losses on interest rate derivatives, (2) expenses related to acquisition and structuring activities, (3) non-share-based executive transition costs, severance expenses and other expenses related to corporate restructuring and executive retirements or resignations, (4) property impairments, casualty gains and losses, and gains or losses on sale not already excluded from Core AFFO, as appropriate, (5) relocation expense, (6) Transformation Costs, (7) write-off of pursuit costs, (8) adjustment to deferred taxes and (9) gain on land easements. These items can vary greatly from period to period, depending upon the volume of our acquisition activity and debt retirements, among other factors. We believe that by excluding these items, Core AFFO serves as a useful, supplementary performance measure of Elme Communities' ability to incur and service debt, and distribute dividends to its shareholders. Core AFFO is a non-GAAP and non-standardized measure, and may be calculated differently by other REITs.
Core Funds From Operations (“Core FFO”) is calculated by adjusting NAREIT FFO for the following items (which we believe are not indicative of the performance of Elme Communities' operating portfolio and affect the comparative measurement of Elme Communities' operating performance over time): (1) gains or losses on extinguishment of debt and gains or losses on interest rate derivatives, (2) expenses related to acquisition and structuring activities, (3) executive transition costs, severance expenses and other expenses related to corporate restructuring and executive retirements or resignations, (4) property impairments, casualty gains and losses, and gains or losses on sale not already excluded from NAREIT FFO, as appropriate, (5) relocation expense, (6) Transformation Costs, (7) write-off of pursuit costs, (8) adjustment to deferred taxes and (9) gain on land easements. These items can vary greatly from period to period, depending upon the volume of our acquisition activity and debt retirements, among other factors. We believe that by excluding these items, Core FFO serves as a useful, supplementary measure of Elme Communities' ability to incur and service debt, and distribute dividends to its shareholders. Core FFO is a non-GAAP and non-standardized measure, and may be calculated differently by other REITs.
NAREIT Funds From Operations (“FFO”) is defined by the 2018 National Association of Real Estate Investment Trusts, Inc. (“NAREIT”) FFO White Paper Restatement, as net income (computed in accordance with generally accepted accounting principles (“GAAP”) excluding gains (or losses) associated with sales of properties, impairments of depreciable real estate and real estate depreciation and amortization. We consider NAREIT FFO to be a standard supplemental measure for real estate investment trusts (“REITs”), and believe it is a useful measure because it facilitates an understanding of the operating performance of our properties without giving effect to real estate depreciation and amortization, which historically assumes that the value of real estate assets diminishes predictably over time. Since real estate values have instead historically risen or fallen with market conditions, we believe that NAREIT FFO more accurately provides investors an indication of our ability to incur and service debt, make capital expenditures and fund other needs. Our NAREIT FFO may not be comparable to FFO reported by other REITs. These other REITs may not define the term in accordance with the current NAREIT definition or may interpret the current NAREIT definition differently. NAREIT FFO is a non-GAAP measure.
Net Debt to Adjusted EBITDA represents net debt as of period end divided by adjusted EBITDA for the period, as annualized (i.e. three months periods are multiplied by four) or on a trailing 12 month basis. We define net debt as the total outstanding debt reported as per our consolidated balance sheets less cash and cash equivalents at the end of the period.
Net Operating Income (“NOI”), defined as real estate rental revenue less direct real estate operating expenses, is a non-GAAP measure. NOI is calculated as net income, less non-real estate revenue and the results of discontinued operations (including the gain or loss on sale, if any), plus interest expense, depreciation and amortization, lease origination expenses, general and administrative expenses, acquisition costs, real estate impairment, casualty gain and losses and gain or loss on extinguishment of debt. NOI does not include management expenses, which consist of corporate property
management costs and property management fees paid to third parties. NOI is the primary performance measure we use to assess the results of our operations at the property level. We believe that NOI is a useful performance measure because, when compared across periods, it reflects the impact on operations of trends in occupancy rates, rental rates and operating costs on an unleveraged basis, providing perspective not immediately apparent from net income. NOI excludes certain components from net income in order to provide results more closely related to a property’s results of operations. For example, interest expense is not necessarily linked to the operating performance of a real estate asset. In addition, depreciation and amortization, because of historical cost accounting and useful life estimates, may distort operating performance at the property level. As a result of the foregoing, we provide NOI as a supplement to net income, calculated in accordance with GAAP. NOI does not represent net income or income from continuing operations calculated in accordance with GAAP. As such, NOI should not be considered an alternative to these measures as an indication of our operating performance.
Average Effective Monthly Rent Per Home represents the average of effective rent (net of concessions) for in-place leases plus the market rent for vacant homes, divided by the total number of homes. We believe Average Effective Monthly Rent Per Home is a useful metric in evaluating the average pricing of our homes. It is a component of Residential Revenue, which is used to calculate our NOI. It does not represent actual rental revenue collected per unit.
Average Occupancy is based on average daily occupied apartment homes as a percentage of total apartment homes.
Current Strategy represents the class of each community in our portfolio based on a set of criteria. Our strategies consist of the following subcategories: Class A, Class A-, Class B Value-Add and Class B. A community's class is dependent on a variety of factors, including its vintage, site location, amenities and services, rent growth drivers and rent relative to the market.
•Class A communities are recently-developed, well-located, have competitive amenities and services and command average rental rates well above market median rents.
•Class A- communities have been developed within the past 20 years and feature operational improvements and unit upgrades and command rents at or above median market rents.
•Class B Value-Add communities are over 20 years old but feature operational improvements and strong potential for unit renovations. These communities command average rental rates below median market rents for units that have not been renovated.
•Class B communities are over 20 years old, feature operational improvements and command average rental rates below median market rents.
Debt Service Coverage Ratio is computed by dividing earnings attributable to the controlling interest before interest expense, taxes, depreciation, amortization, real estate impairment, gain on sale of real estate, gain/loss on extinguishment of debt, severance expense, relocation expense, acquisition and structuring expenses, gain/loss from non-disposal activities and gain on land easements by interest expense (including interest expense from discontinued operations) and principal amortization.
Debt to Total Market Capitalization is total debt divided by the sum of total debt plus the market value of shares outstanding at the end of the period.
Earnings to Fixed Charges Ratio is computed by dividing earnings attributable to the controlling interest by fixed charges. For this purpose, earnings consist of income from continuing operations (or net income if there are no discontinued operations) plus fixed charges, less capitalized interest. Fixed charges consist of interest expense (excluding interest expense from discontinued operations), including amortized costs of debt issuance, plus interest costs capitalized.
Ending Occupancy is calculated as occupied homes as a percentage of total homes as of the last day of that period.
Lease Rate Growth is defined as the average percentage change in either gross (excluding the impact of concessions) or effective rent (net of concessions) for a new or renewed multifamily lease compared to the prior lease based on the move-in date. The “blended” rate represents the weighted average of new and renewal lease rate growth achieved.
Recurring Capital Improvements represent non-accretive building improvements required to maintain a property's income and value. Recurring capital improvements do not include acquisition capital that was taken into consideration when underwriting the purchase of a building or which are incurred to bring a building up to “operating standard”. This category includes improvements made as needed upon vacancy of an apartment. Aside from improvements related to apartment turnover, these improvements include facade repairs, installation of new heating and air conditioning equipment, asphalt replacement, permanent landscaping, new lighting and new finishes.
Retention represents the percentage of multifamily leases renewed that were set to expire in the period presented.
Relocation expenses represent costs associated with the relocation of the corporate headquarters to a new location in the Washington metro region.
Same-store Portfolio includes properties that were owned for the entirety of the years being compared, and exclude properties under redevelopment or development and properties acquired, sold or classified as held for sale during the years being compared. We categorize our properties as “same-store” or “non-same-store” for purposes of evaluating comparative operating performance. We define development properties as those for which we have planned or ongoing major construction activities on existing or acquired land pursuant to an authorized development plan. Development properties are categorized as same-store when they have reached stabilized occupancy (90%) before the start of the prior year. We define redevelopment properties as those for which we have planned or ongoing significant development and construction activities on existing or acquired buildings pursuant to an authorized plan, which has an impact on current operating results, occupancy and the ability to lease space with the intended result of a higher economic return on the property. We categorize a redevelopment property as same-store when redevelopment activities have been complete for the majority of each year being compared. We currently have two same-store portfolios: “Same-store multifamily” which is comprised of our same-store apartment communities and “Other same-store” which is comprised of our Watergate 600 commercial property.
Transformation Costs include costs related to the strategic shift away from the commercial sector to the residential sector, including the allocation of internal costs, consulting, advisory and termination benefits.
| | | | | |
| Table of Contents | |
| September 30, 2024 |
| | | | | | | | |
| Schedule | Page |
| | |
| Key Financial Data | |
| | |
| | |
| | |
| | |
| Portfolio Analysis | |
| Net Operating Income (NOI) - Multifamily | |
| Same-Store Operating Results - Multifamily | |
| Same-Store Operating Expenses - Multifamily | |
| | |
| Growth and Strategy | |
| | |
| | |
| Schedule of Communities | |
| | |
| Capital Analysis | |
| | |
| | |
| | |
| Debt Covenant Compliance | |
| | |
| | |
| Reconciliations | |
| | |
| | | | | |
Consolidated Statements of Operations (In thousands, except per share data) (Unaudited) | |
| | | | | | | | | | | | | | | | | | | | | | | | | | | | | | | | | | | | | | | | | | | | |
| Nine Months Ended | | | Three Months Ended |
| OPERATING RESULTS | September 30, 2024 | | September 30, 2023 | | | September 30, 2024 | | June 30, 2024 | | March 31, 2024 | | December 31, 2023 | | September 30, 2023 |
| Revenues | | | | | | | | | | | | | | |
| Real estate rental revenue | $ | 180,671 | | | $ | 169,059 | | | | $ | 61,055 | | | $ | 60,103 | | | $ | 59,513 | | | $ | 58,852 | | | $ | 56,651 | |
| Expenses | | | | | | | | | | | | | | |
Property operating and maintenance(1) | (41,555) | | | (38,360) | | | | (14,095) | | | (13,996) | | | (13,464) | | | (12,625) | | | (12,696) | |
Real estate taxes and insurance(1) | (24,404) | | | (21,216) | | | | (8,163) | | | (7,986) | | | (8,255) | | | (7,629) | | | (7,101) | |
| Property management | (6,628) | | | (5,882) | | | | (2,235) | | | (2,175) | | | (2,218) | | | (2,226) | | | (1,935) | |
| General and administrative | (18,688) | | | (19,891) | | | | (6,354) | | | (6,138) | | | (6,196) | | | (5,996) | | | (6,370) | |
| Transformation costs | — | | | (6,339) | | | | — | | | — | | | — | | | — | | | (985) | |
| Depreciation and amortization | (72,312) | | | (64,855) | | | | (23,474) | | | (23,895) | | | (24,943) | | | (24,095) | | | (21,904) | |
| Real estate impairment | — | | | (41,860) | | | | — | | | — | | | — | | | — | | | (41,860) | |
| (163,587) | | | (198,403) | | | | (54,321) | | | (54,190) | | | (55,076) | | | (52,571) | | | (92,851) | |
| | | | | | | | | | | | | | |
| Real estate operating income (loss) | 17,084 | | | (29,344) | | | | 6,734 | | | 5,913 | | | 4,437 | | | 6,281 | | | (36,200) | |
| Other income (expense) | | | | | | | | | | | | | | |
| Interest expense | (28,435) | | | (21,043) | | | | (9,557) | | | (9,384) | | | (9,494) | | | (9,386) | | | (7,418) | |
| | | | | | | | | | | | | | |
| Loss on extinguishment of debt | (147) | | | (54) | | | | (147) | | | — | | | — | | | — | | | — | |
| Other income | 1,410 | | | 569 | | | | — | | | — | | | 1,410 | | | — | | | — | |
| | | | | | | | | | | | | | |
| | | | | | | | | | | | | | |
| | | | | | | | | | | | | | |
| | | | | | | | | | | | | | |
| | | | | | | | | | | | | | |
| | | | | | | | | | | | | | |
| | | | | | | | | | | | | | |
| | | | | | | | | | | | | | |
| Net loss | $ | (10,088) | | | $ | (49,872) | | | | $ | (2,970) | | | $ | (3,471) | | | $ | (3,647) | | | $ | (3,105) | | | $ | (43,618) | |
| Per Share Data: | | | | | | | | | | | | | | |
| Net loss | $ | (0.12) | | | $ | (0.57) | | | | $ | (0.03) | | | $ | (0.04) | | | $ | (0.04) | | | $ | (0.04) | | | $ | (0.50) | |
| Fully diluted weighted average shares outstanding | 87,909 | | | 87,717 | | | | 87,930 | | | 87,910 | | | 87,885 | | | 87,788 | | | 87,759 | |
| Percentage of Revenues: | | | | | | | | | | | | | | |
| | | | | | | | | | | | | | |
| General and administrative expenses | 10.3 | % | | 11.8 | % | | | 10.4 | % | | 10.2 | % | | 10.4 | % | | 10.2 | % | | 11.2 | % |
| Net loss | (5.6) | % | | (29.5) | % | | | (4.9) | % | | (5.8) | % | | (6.1) | % | | (5.3) | % | | (77.0) | % |
| Ratios: | | | | | | | | | | | | | | |
Adjusted EBITDA(2) / Interest expense | 3.2 | x | | 4.1 | x | | | 3.2 | x | | 3.2 | x | | 3.1 | x | | 3.2 | x | | 3.9 | x |
| ______________________________ |
| (1) Certain immaterial amounts in prior periods have been reclassified to conform with the current period presentation. |
(2) Adjusted EBITDA is a non-GAAP measure. See “Definitions” on page 11 for the definition of Adjusted EBITDA and page 25 for a reconciliation of Net loss to Adjusted EBITDA. |
| | | | | |
Consolidated Balance Sheets (In thousands, except per share data) (Unaudited) | |
| | | | | | | | | | | | | | | | | | | | | | | | | | | | | |
| September 30, 2024 | | June 30, 2024 | | March 31, 2024 | | December 31, 2023 | | September 30, 2023 |
| Assets | | | | | | | | | |
| Land | $ | 383,808 | | | $ | 383,808 | | | $ | 383,808 | | | $ | 384,097 | | | $ | 384,097 | |
| Income producing property | 1,986,596 | | | 1,976,127 | | | 1,966,412 | | | 1,960,020 | | | 1,941,663 | |
| 2,370,404 | | | 2,359,935 | | | 2,350,220 | | | 2,344,117 | | | 2,325,760 | |
| Accumulated depreciation and amortization | (595,533) | | | (573,054) | | | (550,421) | | | (528,024) | | | (506,298) | |
| Net income producing property | 1,774,871 | | | 1,786,881 | | | 1,799,799 | | | 1,816,093 | | | 1,819,462 | |
| Properties under development or held for future development | 30,980 | | | 30,980 | | | 30,980 | | | 30,980 | | | 31,095 | |
| Total real estate held for investment, net | 1,805,851 | | | 1,817,861 | | | 1,830,779 | | | 1,847,073 | | | 1,850,557 | |
| | | | | | | | | |
| Cash and cash equivalents | 4,840 | | | 5,629 | | | 4,199 | | | 5,984 | | | 8,079 | |
| Restricted cash | 2,358 | | | 2,263 | | | 2,704 | | | 2,554 | | | 2,104 | |
| Rents and other receivables | 12,676 | | | 12,575 | | | 12,886 | | | 17,642 | | | 15,300 | |
| Prepaid expenses and other assets | 27,434 | | | 23,147 | | | 25,971 | | | 26,775 | | | 34,233 | |
| | | | | | | | | |
| Total assets | $ | 1,853,159 | | | $ | 1,861,475 | | | $ | 1,876,539 | | | $ | 1,900,028 | | | $ | 1,910,273 | |
| Liabilities | | | | | | | | | |
| Notes payable, net | $ | 522,914 | | | $ | 522,734 | | | $ | 522,539 | | | $ | 522,345 | | | $ | 522,150 | |
| | | | | | | | | |
| Line of credit | 168,000 | | | 156,000 | | | 160,000 | | | 157,000 | | | 149,000 | |
| Accounts payable and other liabilities | 36,295 | | | 37,283 | | | 31,112 | | | 38,997 | | | 40,666 | |
| Dividend payable | 15,906 | | | 15,905 | | | 15,888 | | | 15,863 | | | 15,868 | |
| Advance rents | 4,801 | | | 5,074 | | | 4,361 | | | 5,248 | | | 3,365 | |
| Tenant security deposits | 6,270 | | | 6,334 | | | 6,235 | | | 6,225 | | | 6,171 | |
| | | | | | | | | |
| Total liabilities | 754,186 | | | 743,330 | | | 740,135 | | | 745,678 | | | 737,220 | |
| Equity | | | | | | | | | |
| Preferred shares, $0.01 par value; 10,000 shares authorized | — | | | — | | | — | | | — | | | — | |
| Shares of beneficial interest, $0.01 par value; 150,000 shares authorized | 880 | | | 880 | | | 880 | | | 879 | | | 878 | |
| Additional paid-in capital | 1,739,319 | | | 1,737,941 | | | 1,736,524 | | | 1,735,530 | | | 1,734,657 | |
| Distributions in excess of net income | (627,186) | | | (608,310) | | | (588,923) | | | (569,391) | | | (550,442) | |
| Accumulated other comprehensive loss | (14,323) | | | (12,651) | | | (12,365) | | | (12,958) | | | (12,332) | |
| Total shareholders' equity | 1,098,690 | | | 1,117,860 | | | 1,136,116 | | | 1,154,060 | | | 1,172,761 | |
| Noncontrolling interests in subsidiaries | 283 | | | 285 | | | 288 | | | 290 | | | 292 | |
| Total equity | 1,098,973 | | | 1,118,145 | | | 1,136,404 | | | 1,154,350 | | | 1,173,053 | |
| Total liabilities and equity | $ | 1,853,159 | | | $ | 1,861,475 | | | $ | 1,876,539 | | | $ | 1,900,028 | | | $ | 1,910,273 | |
| | | | | | | | | |
| | | | | | | | | |
| | | | | |
NAREIT Funds from Operations/ Adjusted Funds From Operations (In thousands, except per share data) (Unaudited)
| |
| | | | | | | | | | | | | | | | | | | | | | | | | | | | | | | | | | | | | | | | | | |
| Nine Months Ended | | | Three Months Ended |
| September 30, 2024 | | September 30, 2023 | | | September 30, 2024 | | June 30, 2024 | | March 31, 2024 | | December 31, 2023 | | September 30, 2023 |
| Funds from operations (FFO) | | | | | | | | | | | | | | |
| Net loss | $ | (10,088) | | $ | (49,872) | | | $ | (2,970) | | $ | (3,471) | | $ | (3,647) | | $ | (3,105) | | $ | (43,618) |
| Real estate depreciation and amortization | 72,312 | | 64,855 | | | 23,474 | | 23,895 | | 24,943 | | 24,095 | | 21,904 |
| | | | | | | | | | | | | | |
| Real estate impairment | — | | 41,860 | | | — | | — | | — | | — | | 41,860 |
| | | | | | | | | | | | | | |
| | | | | | | | | | | | | | |
| | | | | | | | | | | | | | |
| | | | | | | | | | | | | | |
| | | | | | | | | | | | | | |
NAREIT funds from operations (FFO)(1) | 62,224 | | 56,843 | | | 20,504 | | 20,424 | | 21,296 | | 20,990 | | 20,146 |
| Loss on extinguishment of debt | 147 | | 54 | | | 147 | | — | | — | | — | | — |
| | | | | | | | | | | | | | |
| | | | | | | | | | | | | | |
| Severance expense | 77 | | 394 | | | 13 | | 64 | | — | | 391 | | — |
| Transformation costs | — | | 6,339 | | | — | | — | | — | | — | | 985 |
| | | | | | | | | | | | | | |
| Relocation expense | — | | 626 | | | — | | — | | — | | 3 | | 306 |
| Structuring expenses | 60 | | 60 | | | — | | 60 | | — | | — | | — |
| Write-off of pursuit costs | — | | 49 | | | — | | — | | — | | 24 | | — |
| Adjustment to deferred taxes | — | | — | | | — | | — | | — | | (526) | | — |
| Gain on land easements | (1,410) | | — | | | — | | — | | (1,410) | | — | | — |
Core FFO(1) | $ | 61,098 | | $ | 64,365 | | | $ | 20,664 | | $ | 20,548 | | $ | 19,886 | | $ | 20,882 | | $ | 21,437 |
| | | | | | | | | | | | | | |
Allocation to participating securities(2) | (236) | | (209) | | | (78) | | (79) | | (80) | | (46) | | (71) |
| | | | | | | | | | | | | | |
| NAREIT FFO per share - basic | $ | 0.71 | | $ | 0.65 | | | $ | 0.23 | | $ | 0.23 | | $ | 0.24 | | $ | 0.24 | | $ | 0.23 |
| NAREIT FFO per share - fully diluted | $ | 0.70 | | $ | 0.64 | | | $ | 0.23 | | $ | 0.23 | | $ | 0.24 | | $ | 0.24 | | $ | 0.23 |
| | | | | | | | | | | | | | |
| Core FFO per share - fully diluted | $ | 0.69 | | $ | 0.73 | | | $ | 0.23 | | $ | 0.23 | | $ | 0.23 | | $ | 0.24 | | $ | 0.24 |
| | | | | | | | | | | | | | |
| Common dividend per share | $ | 0.54 | | $ | 0.54 | | | $ | 0.18 | | $ | 0.18 | | $ | 0.18 | | $ | 0.18 | | $ | 0.18 |
| | | | | | | | | | | | | | |
| Average shares - basic | 87,909 | | 87,717 | | | 87,930 | | 87,910 | | 87,885 | | 87,788 | | 87,759 |
| Average shares - fully diluted (for NAREIT FFO and Core FFO) | 87,956 | | 87,809 | | | 87,994 | | 87,975 | | 87,897 | | 87,836 | | 87,799 |
| | | | | |
NAREIT Funds from Operations/ Adjusted Funds From Operations (continued) (In thousands, except per share data) (Unaudited)
| |
| | | | | | | | | | | | | | | | | | | | | | | | | | | | | | | | | | | | | | | | | | |
| Nine Months Ended | | | Three Months Ended |
| September 30, 2024 | | September 30, 2023 | | | September 30, 2024 | | June 30, 2024 | | March 31, 2024 | | December 31, 2023 | | September 30, 2023 |
Adjusted funds from operations (AFFO)(1) | | | | | | | | | | | | | | |
NAREIT FFO(1) | $ | 62,224 | | $ | 56,843 | | | $ | 20,504 | | $ | 20,424 | | $ | 21,296 | | $ | 20,990 | | $ | 20,146 |
| Non-cash loss on extinguishment of debt | 147 | | 54 | | | 147 | | — | | — | | — | | — |
| Tenant improvements and incentives, net of reimbursements | — | | (10) | | | — | | — | | — | | (267) | | — |
| Leasing commissions capitalized | (30) | | (56) | | | (30) | | — | | — | | — | | — |
| Recurring capital improvements | (7,199) | | (5,950) | | | (2,284) | | (2,144) | | (2,771) | | (2,642) | | (1,490) |
| Straight-line rent, net | 66 | | (160) | | | 26 | | 25 | | 15 | | (27) | | (74) |
| | | | | | | | | | | | | | |
| Non-real estate depreciation and amortization of debt costs | 3,755 | | 3,891 | | | 1,326 | | 1,259 | | 1,170 | | 1,217 | | 1,348 |
| Amortization of lease intangibles, net | (526) | | (570) | | | (201) | | (163) | | (162) | | (248) | | (155) |
Amortization and expensing of restricted share and unit compensation(3) | 3,713 | | 3,966 | | | 1,578 | | 1,045 | | 1,090 | | 1,508 | | 1,432 |
| | | | | | | | | | | | | | |
AFFO(1) | 62,150 | | 58,008 | | | 21,066 | | 20,446 | | 20,638 | | 20,531 | | 21,207 |
| | | | | | | | | | | | | | |
| | | | | | | | | | | | | | |
| | | | | | | | | | | | | | |
| Non-share-based severance expense | 77 | | 340 | | | 13 | | 64 | | — | | 313 | | — |
| Relocation expense | — | | 626 | | | — | | — | | — | | 3 | | 306 |
| Structuring expenses | 60 | | 60 | | | — | | 60 | | — | | — | | — |
Transformation costs(4) | — | | 6,339 | | | — | | — | | — | | — | | 985 |
| | | | | | | | | | | | | | |
| Write-off of pursuit costs | — | | 49 | | | — | | — | | — | | 24 | | — |
| Adjustment to deferred taxes | — | | — | | | — | | — | | — | | (526) | | — |
| Gain on land easements | (1,410) | | — | | | — | | — | | (1,410) | | — | | — |
Core AFFO(1) | $ | 60,877 | | $ | 65,422 | | | $ | 21,079 | | $ | 20,570 | | $ | 19,228 | | $ | 20,345 | | $ | 22,498 |
| ______________________________ | | | | | | | | | | | | | | |
(1) See “Definitions” on page 11 for the definitions of non-GAAP measures: NAREIT FFO, Core FFO, AFFO, and Core AFFO. |
| (2) Adjustment to the numerators for FFO and Core FFO per share calculations when applying the two-class method for calculating EPS. |
| (3) Includes share award modifications related to transformation costs. |
(4) Excludes share award modifications related to transformation costs. |
| | | | | |
Net Operating Income (NOI) - Multifamily (Dollars In thousands)
| |
| | | | | | | | | | | | | | | | | | | | | | | | | | | | | | | | | | | | | | | | | | | | | | | |
| Apartment Homes as of September 30, 2024 | | Nine Months Ended | | Three Months Ended |
| | September 30, 2024 | | September 30, 2023 | | September 30, 2024 | | June 30, 2024 | | March 31, 2024 | | December 31, 2023 | | September 30, 2023 |
| Rental and other property revenues | | | | | | | | | | | | | | | |
| Same-store | 8,874 | | $ | 159,344 | | | $ | 155,102 | | | $ | 53,949 | | | $ | 53,021 | | | $ | 52,374 | | | $ | 51,660 | | | $ | 52,011 | |
| Acquisitions | 500 | | 7,446 | | | 54 | | | 2,478 | | | 2,471 | | | 2,497 | | | 2,495 | | | 54 | |
| Development | N/A | | — | | | — | | | — | | | — | | | — | | | — | | | — | |
| | | | | | | | | | | | | | | |
Total rental and other property revenues(1) | 9,374 | | $ | 166,790 | | | $ | 155,156 | | | $ | 56,427 | | | $ | 55,492 | | | $ | 54,871 | | | $ | 54,155 | | | $ | 52,065 | |
| | | | | | | | | | | | | | | |
| Property operating expenses | | | | | | | | | | | | | | | |
| Same-store | | | 58,394 | | | 55,443 | | | 19,535 | | | 19,505 | | | 19,354 | | | 17,988 | | | 18,357 | |
| Acquisitions | | | 3,231 | | | 18 | | | 1,224 | | | 1,060 | | | 947 | | | 862 | | | 18 | |
| Development | | | 175 | | | 168 | | | 61 | | | 57 | | | 57 | | | 56 | | | 56 | |
| | | | | | | | | | | | | | | |
| Total property operating expenses | | | $ | 61,800 | | | $ | 55,629 | | | $ | 20,820 | | | $ | 20,622 | | | $ | 20,358 | | | $ | 18,906 | | | $ | 18,431 | |
| | | | | | | | | | | | | | | |
Net Operating Income (NOI)(2) | | | | | | | | | | | | | | | |
| Same-store | | | 100,950 | | | 99,659 | | | 34,414 | | | 33,516 | | | 33,020 | | | 33,672 | | | 33,654 | |
| Acquisitions | | | 4,215 | | | 36 | | | 1,254 | | | 1,411 | | | 1,550 | | | 1,633 | | | 36 | |
| Development | | | (175) | | | (168) | | | (61) | | | (57) | | | (57) | | | (56) | | | (56) | |
| | | | | | | | | | | | | | | |
| Total NOI | | | $ | 104,990 | | | $ | 99,527 | | | $ | 35,607 | | | $ | 34,870 | | | $ | 34,513 | | | $ | 35,249 | | | $ | 33,634 | |
| | | | | | | | | | | | | | | |
| Same-store metrics | | | | | | | | | | | | | | | |
Operating margin(3) | | | 63% | | 64% | | 64% | | 63% | | 63% | | 65% | | 65% |
| Retention | | | 65% | | 62% | | 66% | | 65% | | 65% | | 65% | | 61% |
| | | | | | | | | | | | | | | |
| Same-store effective lease rate growth | | | | | | | | | | | | | | | |
| New | | | (1.2)% | | (0.1)% | | (1.5)% | | 0.2% | | (2.1)% | | (3.6)% | | (0.4)% |
| Renewal | | | 5.2% | | 6.2% | | 4.5% | | 5.4% | | 6.2% | | 5.9% | | 5.1% |
| Blended | | | 2.5% | | 3.3% | | 2.1% | | 3.2% | | 2.3% | | 1.8% | | 2.7% |
| ______________________________ | | | | | | | | | | | | | | | |
|
| (1) Utility costs reimbursed by residents are included in real estate rental revenue on our consolidated statements of operations. Utility reimbursements totaled $6.6 million and $6.1 million for the nine months ended September 30, 2024 and 2023 respectively, and $2.2 million, $2.0 million, $2.4 million, $1.9 million and $1.9 million for the three months ended September 30, 2024, June 30, 2024, March 31, 2024, December 31, 2023 and September 30, 2023, respectively. |
(2) NOI is a non-GAAP measure. See “Definitions” on page 11 for the definition of NOI and reconciliation of Net loss to NOI on page 30. |
| (3) Operating margin is calculated by dividing the same-store NOI (non-GAAP) by same-store rental and other property revenues. |
| | | | | |
Same-Store Operating Results - Multifamily (Dollars in thousands, except Average Effective Monthly Rent per Home) | |
| | | | | | | | | | | | | | | | | | | | | | | | | | | | | | | | | | | | | | | | | | | | | | | | | | | | | | | | | | | | | | | | | | | | | | | | | | | | | | | | | | | | | | | | | | | | | | | | | | |
| | | | Rental and Other Property Revenue | | Property Operating Expenses | | Net Operating Income (1) | | Average Occupancy | | Average Effective Monthly Rent per Home |
| Quarter-to-Date Comparison | | Apt Homes | | Q3 2024 | | Q3 2023 | | % Chg | | Q3 2024 | | Q3 2023 | | % Chg | | Q3 2024 | | Q3 2023 | | %
Chg | | Q3 2024 | | Q3 2023 | | % Chg | | Q3 2024 | | Q3 2023 | | % Chg |
| Virginia | | 5,550 | | $ | 36,963 | | | $ | 34,716 | | | 6.5 | % | | $ | 11,879 | | | $ | 11,619 | | | 2.2 | % | | $ | 25,084 | | | $ | 23,097 | | | 8.6 | % | | 96.7 | % | | 95.9 | % | | 0.8 | % | | $ | 2,035 | | | $ | 1,963 | | | 3.7 | % |
| DC / Maryland | | 1,515 | | 9,263 | | | 8,999 | | | 2.9 | % | | 3,320 | | | 3,105 | | | 6.9 | % | | 5,943 | | | 5,894 | | | 0.8 | % | | 96.0 | % | | 96.5 | % | | (0.5) | % | | 1,986 | | | 1,935 | | | 2.6 | % |
| Georgia | | 1,809 | | 7,723 | | | 8,296 | | | (6.9) | % | | 4,336 | | | 3,633 | | | 19.4 | % | | 3,387 | | | 4,663 | | | (27.4)% | | 90.1 | % | | 92.9 | % | | (2.8) | % | | 1,493 | | | 1,539 | | | (3.0) | % |
| Total | | 8,874 | | $ | 53,949 | | | $ | 52,011 | | | 3.7 | % | | $ | 19,535 | | | $ | 18,357 | | | 6.4 | % | | $ | 34,414 | | | $ | 33,654 | | | 2.3 | % | | 95.2 | % | | 95.4 | % | | (0.2) | % | | $ | 1,916 | | | $ | 1,872 | | | 2.4 | % |
| | | | | | | | | | | | | | | | | | | | | | | | | | | | | | | | |
| | | | | | | | | | | | | | | | | | | | | | | | | | | | | | | | |
| Sequential Comparison | | Apt Homes | | Q3 2024 | | Q2 2024 | | % Chg | | Q3 2024 | | Q2 2024 | | % Chg | | Q3 2024 | | Q2 2024 | | % Chg | | Q3 2024 | | Q2 2024 | | % Chg | | Q3 2024 | | Q2 2024 | | % Chg |
| Virginia | | 5,550 | | $ | 36,963 | | | $ | 36,074 | | | 2.5 | % | | $ | 11,879 | | | $ | 12,221 | | | (2.8) | % | | $ | 25,084 | | | $ | 23,853 | | | 5.2 | % | | 96.7 | % | | 96.3 | % | | 0.4 | % | | $ | 2,035 | | | $ | 2,006 | | | 1.4 | % |
| DC / Maryland | | 1,515 | | 9,263 | | | 9,139 | | | 1.4 | % | | 3,320 | | | 3,359 | | | (1.2) | % | | 5,943 | | | 5,780 | | | 2.8 | % | | 96.0 | % | | 95.2 | % | | 0.8 | % | | 1,986 | | | 1,974 | | | 0.6 | % |
| Georgia | | 1,809 | | 7,723 | | | 7,808 | | | (1.1) | % | | 4,336 | | | 3,925 | | | 10.5 | % | | 3,387 | | | 3,883 | | | (12.8) | % | | 90.1 | % | | 88.8 | % | | 1.3 | % | | 1,493 | | | 1,513 | | | (1.3) | % |
| Total | | 8,874 | | $ | 53,949 | | | $ | 53,021 | | | 1.8 | % | | $ | 19,535 | | | $ | 19,505 | | | 0.2 | % | | $ | 34,414 | | | $ | 33,516 | | | 2.7 | % | | 95.2 | % | | 94.6 | % | | 0.6 | % | | $ | 1,916 | | | $ | 1,900 | | | 0.8 | % |
| | | | | | | | | | | | | | | | | | | | | | | | | | | | | | | | |
| | | | | | | | | | | | | | | | | | | | | | | | | | | | | | | | |
| Year-to-Date Comparison | | Apt Homes | | YTD 2024 | | YTD 2023 | | % Chg | | YTD 2024 | | YTD 2023 | | % Chg | | YTD 2024 | | YTD 2023 | | % Chg | | YTD 2024 | | YTD 2023 | | % Chg | | YTD 2024 | | YTD 2023 | | % Chg |
| Virginia | | 5,550 | | $ | 108,593 | | | $ | 103,578 | | | 4.8 | % | | $ | 36,222 | | | $ | 35,243 | | | 2.8 | % | | $ | 72,371 | | | $ | 68,335 | | | 5.9 | % | | 96.4 | % | | 95.7 | % | | 0.7 | % | | $ | 2,010 | | | $ | 1,941 | | | 3.6 | % |
| DC / Maryland | | 1,515 | | 27,518 | | | 26,471 | | | 4.0 | % | | 9,983 | | | 9,577 | | | 4.2 | % | | 17,535 | | | 16,894 | | | 3.8 | % | | 95.4 | % | | 96.0 | % | | (0.6) | % | | 1,971 | | | 1,901 | | | 3.7 | % |
| Georgia | | 1,809 | | 23,233 | | | 25,053 | | | (7.3) | % | | 12,189 | | | 10,623 | | | 14.7 | % | | 11,044 | | | 14,430 | | | (23.5) | % | | 89.2 | % | | 93.7 | % | | (4.5) | % | | 1,511 | | | 1,538 | | | (1.8) | % |
| Total | | 8,874 | | $ | 159,344 | | | $ | 155,102 | | | 2.7 | % | | $ | 58,394 | | | $ | 55,443 | | | 5.3 | % | | $ | 100,950 | | | $ | 99,659 | | | 1.3 | % | | 94.7 | % | | 95.4 | % | | (0.7) | % | | $ | 1,902 | | | $ | 1,852 | | | 2.7 | % |
| | | | | | | | | | | | | | | | | | | | | | | | | | | | | | | | |
| ______________________________ |
(1) NOI is a non-GAAP measure. See “Definitions” on page 11 for the definition of NOI and reconciliation of Net loss to NOI on page 30. |
| | | | | |
Same-Store Operating Expenses - Multifamily (In thousands) | |
| | | | | | | | | | | | | | | | | | | | | | | | | | | | | | | |
| Quarter-to-Date Comparison | Q3 2024 | | Q3 2023 | | $ Change | | % Change | | | % of Q3 2024 Total | |
Controllable operating expenses(1,2) | $ | 9,283 | | | $ | 8,989 | | | $ | 294 | | | 3.3 | % | | | 47.5 | % | |
Real estate taxes(2) | 5,698 | | | 5,378 | | | 320 | | | 6.0 | % | | | 29.2 | % | |
| Utilities | 3,401 | | | 3,023 | | | 378 | | | 12.5 | % | | | 17.4 | % | |
| Insurance | 1,153 | | | 967 | | | 186 | | | 19.2 | % | | | 5.9 | % | |
| Total same-store operating expenses | 19,535 | | | 18,357 | | | 1,178 | | | 6.4 | % | | | 100.0 | % | |
| Utility reimbursements | (2,225) | | | (1,915) | | | (310) | | | 16.2 | % | | | | |
| Total same-store operating expenses, net of utility reimbursements | $ | 17,310 | | | $ | 16,442 | | | $ | 868 | | | 5.3 | % | | | | |
| | | | | | | | | | | | | | | | | | | | | | | | | | | | | | | |
| Sequential Comparison | Q3 2024 | | Q2 2024 | | $ Change | | % Change | | | % of Q3 2024 Total | |
Controllable operating expenses(1,2) | $ | 9,283 | | | $ | 9,768 | | | $ | (485) | | | (5.0) | % | | | 47.5 | % | |
Real estate taxes(2) | 5,698 | | | 5,609 | | | 89 | | | 1.6 | % | | | 29.2 | % | |
| Utilities | 3,401 | | | 2,984 | | | 417 | | | 14.0 | % | | | 17.4 | % | |
| Insurance | 1,153 | | | 1,144 | | | 9 | | | 0.8 | % | | | 5.9 | % | |
| Total same-store operating expenses | 19,535 | | | 19,505 | | | 30 | | | 0.2 | % | | | 100.0 | % | |
| Utility reimbursements | (2,225) | | | (2,047) | | | (178) | | | 8.7 | % | | | | |
| Total same-store operating expenses, net of utility reimbursements | $ | 17,310 | | | $ | 17,458 | | | $ | (148) | | | (0.8) | % | | | | |
| | | | | | | | | | | | | | | | | | | | | | | | | | | | | | |
| Year-to-Date Comparison | YTD 2024 | | YTD 2023 | | $ Change | | % Change | | | % of YTD 2024 Total |
Controllable operating expenses(1,2) | $ | 27,898 | | | $ | 27,447 | | | $ | 451 | | | 1.6 | % | | | 47.8 | % |
Real estate taxes(2) | 17,200 | | | 16,367 | | | 833 | | | 5.1 | % | | | 29.4 | % |
| Utilities | 9,855 | | | 8,952 | | | 903 | | | 10.1 | % | | | 16.9 | % |
| Insurance | 3,441 | | | 2,677 | | | 764 | | | 28.5 | % | | | 5.9 | % |
| Total same-store operating expenses | 58,394 | | | 55,443 | | | 2,951 | | | 5.3 | % | | | 100.0 | % |
| Utility reimbursements | (6,585) | | | (6,124) | | | (461) | | | 7.5 | % | | | |
| Total same-store operating expenses, net of utility reimbursements | $ | 51,809 | | | $ | 49,319 | | | $ | 2,490 | | | 5.0 | % | | | |
| | |
| ______________________________ |
| (1) Controllable operating expenses consist of: |
| Payroll, Repairs & Maintenance, Marketing, Administrative and other |
| (2) Certain immaterial amounts in prior periods have been reclassified to conform with the current period presentation. |
| | | | | |
| Multifamily Communities | |
| September 30, 2024 |
| | | | | | | | | | | | | | | | | | | | | | | | | | | | | | | |
| Community | | Location | Apartment Homes | Current Strategy | Year Acquired | Year Built | Average Occupancy(1) | | Ending Occupancy | | % of Total Portfolio NOI(1,2) |
| | | | | | | | | | | |
| Virginia | | | | | | | | | | | |
| Cascade at Landmark | | Alexandria, VA | 277 | B Value-Add | 2019 | 1988 | 96.7% | | 96.0% | | 3% |
| Clayborne | | Alexandria, VA | 74 | A- | N/A | 2008 | 96.5% | | 97.3% | | 1% |
| Elme Alexandria | | Alexandria, VA | 532 | B Value-Add | 2019 | 1990 | 95.6% | | 95.1% | | 5% |
| Riverside Apartments | | Alexandria, VA | 1222 | B Value-Add | 2016 | 1971 | 96.7% | | 96.0% | | 13% |
| Bennett Park | | Arlington, VA | 224 | A- | N/A | 2007 | 96.1% | | 97.3% | | 4% |
| Park Adams | | Arlington, VA | 200 | B Value-Add | 1969 | 1959 | 95.5% | | 92.5% | | 2% |
| The Maxwell | | Arlington, VA | 163 | A- | N/A | 2014 | 96.2% | | 95.7% | | 2% |
| The Paramount | | Arlington, VA | 135 | B | 2013 | 1984 | 97.0% | | 97.0% | | 2% |
| The Wellington | | Arlington, VA | 710 | B Value-Add | 2015 | 1960 | 96.6% | | 97.0% | | 7% |
| Trove | | Arlington, VA | 401 | A | N/A | 2020 | 96.2% | | 96.8% | | 5% |
| Roosevelt Towers | | Falls Church, VA | 191 | B Value-Add | 1965 | 1964 | 95.5% | | 96.9% | | 2% |
| Elme Dulles | | Herndon, VA | 328 | B Value-Add | 2019 | 2000 | 97.1% | | 97.0% | | 4% |
| Elme Herndon | | Herndon, VA | 283 | B Value-Add | 2019 | 1991 | 96.3% | | 96.1% | | 3% |
| Elme Leesburg | | Leesburg, VA | 134 | B | 2019 | 1986 | 97.3% | | 95.5% | | 1% |
| Elme Manassas | | Manassas, VA | 408 | B Value-Add | 2019 | 1986 | 96.0% | | 96.1% | | 4% |
| The Ashby at McLean | | McLean, VA | 268 | B Value-Add | 1996 | 1982 | 96.2% | | 96.6% | | 4% |
| Washington, DC | | | | | | | | | | | |
| 3801 Connecticut Avenue | | Washington, DC | 307 | B Value-Add | 1963 | 1951 | 95.4% | | 97.1% | | 3% |
| Kenmore Apartments | | Washington, DC | 371 | B Value-Add | 2008 | 1948 | 94.5% | | 96.0% | | 3% |
| Yale West | | Washington, DC | 216 | A- | 2014 | 2011 | 95.0% | | 97.2% | | 3% |
| Maryland | | | | | | | | | | | |
| Elme Bethesda | | Bethesda, MD | 193 | B | 1997 | 1986 | 96.8% | | 94.8% | | 3% |
| Elme Watkins Mill | | Gaithersburg, MD | 210 | B | 2019 | 1975 | 95.7% | | 96.7% | | 2% |
| Elme Germantown | | Germantown, MD | 218 | B Value-Add | 2019 | 1990 | 95.6% | | 95.0% | | 2% |
| Georgia | | | | | | | | | | | |
| Elme Conyers | | Conyers, GA | 240 | B | 2021 | 1999 | 93.5% | | 92.1% | | 1% |
| Elme Marietta | 3 | Marietta, GA | 420 | B Value-Add | 2022 | 1975 | 86.9% | | 85.2% | | 2% |
| Elme Sandy Springs | | Sandy Springs, GA | 389 | B Value-Add | 2022 | 1972 | 89.1% | | 91.3% | | 2% |
| | | | | |
| Multifamily Communities (continued) | |
| September 30, 2024 |
| | | | | | | | | | | | | | | | | | | | | | | | | | | | | | | | | | | | | | | | | | | | | | | | | | | |
| Community | | Location | Apartment Homes | Current Strategy | Year Acquired | Year Built | Average Occupancy(1) | Ending Occupancy | | % of Total Portfolio NOI(1,2) | | | | | | | | | | | | | | | | | | | | | |
| | | | | | | | | | | | | | | | | | | | | | | | | | | | | | | |
| Elme Cumberland | | Smyrna, GA | 270 | B Value-Add | 2022 | 1982 | 92.2% | 94.4% | | 2% | | | | | | | | | | | | | | | | | | | | | |
| Elme Eagles Landing | | Stockbridge, GA | 490 | B Value-Add | 2021 | 2000 | 87.5% | 88.0% | | 2% | | | | | | | | | | | | | | | | | | | | | |
| Total same-store communities | | | 8,874 | | | | 94.7% | 94.8% | | 87% | | | | | | | | | | | | | | | | | | | | | |
| | | | | | | | | | | | | | | | | | | | | | | | | | | | | | | |
| | | | | | | | | | | | | | | | | | | | | | | | | | | | | |
| Elme Druid Hills | | Atlanta, GA | 500 | B Value-Add | 2023 | 1987 | 92.9% | 94.8% | | 4% | | | | | | | | | | | | | | | | | | | | | |
| Total non same-store communities | 500 | | | | 92.9% | 94.8% | | 4% | | | | | | | | | | | | | | | | | | | | | |
| Total multifamily communities | | | 9,374 | | | | 94.6% | 94.8% | | 91% | | | | | | | | | | | | | | | | | | | | | |
| ______________________________ | | | | | | | | | | | | | | | | | | | | | |
| (1) For the nine months ended September 30, 2024. | | | | | | | | | | | | | | | | | | | | | |
(2) NOI is a non-GAAP measure. See “Definitions” on page 11 for the definition of NOI and reconciliation of Net loss to NOI on page 30. | | | | | | | | | | | | | | | | |
| (3) Metrics for Elme Marietta are not adjusted for 24 down units that are currently unavailable for use due to a fire that occurred within the community on March 24, 2024. We are currently assessing the timeline for these units to be placed back in service. Concurrently, we are engaged with our insurance provider to determine potential insurance proceeds and coverage under our business interruption insurance. | | | | | | | | | | | | | | | | |
| | | | | | | | | | | | | | | | |
| | | | | |
| Office Property | |
| September 30, 2024 |
| | | | | | | | | | | | | | | | | | | | | | | | | | | | | | | | | | | | | | | | | | | | |
| Property | | Location | | Year Acquired | | Year Built | | Net Rentable Square Feet | | Leased %(1) | | Ending Occupancy(1) | | % of Total Portfolio NOI(2,3) |
| Washington, DC |
| Watergate 600 | | Washington, DC | | 2017 | | 1972/1997 | | 300,000 | | 86.0% | | 86.0% | | 9% |
| ______________________________ |
| (1) The leased and occupied square footage includes short-term lease agreements. |
| (2) For the nine months ended September 30, 2024. |
(3) NOI is a non-GAAP measure. See “Definitions” on page 11 for the definition of NOI and reconciliation of Net loss to NOI on page 30. |
| | | | | | | | | | | | | | |
| | | | | |
Adjusted Earnings Before Interest, Taxes, Depreciation and Amortization (EBITDA) (In thousands) (Unaudited) | |
| | | | | | | | | | | | | | | | | | | | | | | | | | | | | | | | | | | | | | | | | | | | |
| Nine Months Ended | | | Three Months Ended |
| September 30, 2024 | | September 30, 2023 | | | September 30, 2024 | | June 30, 2024 | | March 31, 2024 | | December 31, 2023 | | September 30, 2023 |
Adjusted EBITDA(1) | | | | | | | | | | | | | | |
| | | | | | | | | | | | | | |
| Net loss | $ | (10,088) | | $ | (49,872) | | | $ | (2,970) | | $ | (3,471) | | $ | (3,647) | | $ | (3,105) | | $ | (43,618) |
| Add/(deduct): | | | | | | | | | | | | | | |
| Interest expense | 28,435 | | 21,043 | | | 9,557 | | 9,384 | | 9,494 | | 9,386 | | 7,418 |
| Real estate depreciation and amortization | 72,312 | | 64,855 | | | 23,474 | | 23,895 | | 24,943 | | 24,095 | | 21,904 |
| | | | | | | | | | | | | | |
| Real estate impairment | — | | 41,860 | | | — | | — | | — | | — | | 41,860 |
| Non-real estate depreciation | 468 | | 728 | | | 160 | | 197 | | 111 | | 158 | | 291 |
| Severance expense | 77 | | 394 | | | 13 | | 64 | | — | | 391 | | — |
| Transformation costs | — | | 6,339 | | | — | | — | | — | | — | | 985 |
| Relocation expense | — | | 626 | | | — | | — | | — | | 3 | | 306 |
| Structuring expenses | 60 | | 60 | | | — | | 60 | | — | | — | | — |
| | | | | | | | | | | | | | |
| Loss on extinguishment of debt | 147 | | 54 | | | 147 | | — | | — | | — | | — |
| | | | | | | | | | | | | | |
| | | | | | | | | | | | | | |
| Adjustment to deferred taxes | — | | — | | | — | | — | | — | | (526) | | — |
Write-off of pursuit costs(2) | — | | 49 | | | — | | — | | — | | 24 | | — |
| Gain on land easements | (1,410) | | — | | | | — | | — | | (1,410) | | — | | — |
| | | | | | | | | | | | | | |
| Adjusted EBITDA | $ | 90,001 | | $ | 86,136 | | | $ | 30,381 | | $ | 30,129 | | $ | 29,491 | | $ | 30,426 | | $ | 29,146 |
| ______________________________ | | | | | | | | | | | | | | |
(1) Adjusted EBITDA is a non-GAAP measure. See “Definitions” on page 11 for the definition of Adjusted EBITDA and reconciliation of Net loss to Adjusted EBITDA on the current page. |
| (2) Adjusted EBITDA in prior periods has been updated to conform with the current period presentation and definition to include write-off of pursuit costs. |
| | | | | |
Long Term Debt Analysis (Dollars in thousands) | |
| | | | | | | | | | | | | | | | | | | | | | | | | | | | | |
| September 30, 2024 | | June 30, 2024 | | March 31, 2024 | | December 31, 2023 | | September 30, 2023 |
| Balances Outstanding | | | | | | | | | |
| | | | | | | | | |
| | | | | | | | | |
| | | | | | | | | |
| Unsecured | | | | | | | | | |
| Fixed rate bonds | $ | 398,034 | | | $ | 397,945 | | | $ | 397,857 | | | $ | 397,768 | | | $ | 397,679 | |
Term loan(1) | 124,880 | | | 124,788 | | | 124,682 | | | 124,577 | | | 124,471 | |
| Credit facility | 168,000 | | | 156,000 | | | 160,000 | | | 157,000 | | | 149,000 | |
| | | | | | | | | |
| Total | $ | 690,914 | | | $ | 678,733 | | | $ | 682,539 | | | $ | 679,345 | | | $ | 671,150 | |
| | | | | | | | | |
| Weighted Average Interest Rates | | | | | | | | | |
| | | | | | | | | |
| | | | | | | | | |
| | | | | | | | | |
| Unsecured | | | | | | | | | |
| Fixed rate bonds | 4.5 | % | | 4.5 | % | | 4.5 | % | | 4.5 | % | | 4.5 | % |
Term loan(2) | 4.7 | % | | 4.7 | % | | 4.7 | % | | 4.7 | % | | 4.7 | % |
| Credit facility | 5.8 | % | | 6.3 | % | | 6.3 | % | | 6.3 | % | | 6.3 | % |
| | | | | | | | | |
| Weighted Average | 4.9 | % | | 4.9 | % | | 5.0 | % | | 4.9 | % | | 4.9 | % |
| ______________________________ | | | | | | | | | |
|
| (1) Elme Communities entered into a $125.0 million unsecured term loan (“2023 Term Loan”) with an interest rate of SOFR (subject to a credit spread adjustment of 10 basis points) plus a margin of 95 basis points (subject to adjustment depending on Elme Communities' credit rating). The 2023 Term Loan has a two-year term ending in January 2025, with two one-year extension options. We used the proceeds to prepay the $100.0 million 2018 Term Loan in full and a portion of our borrowings under our unsecured credit facility. |
| (2) Elme Communities had an interest rate swap that had effectively fixed the interest rate on a $100.0 million portion of its 2023 Term Loan outstanding through the interest rate swap arrangement's expiration date of July 21, 2023. In March 2023, we entered into two interest rate swap arrangements with an aggregate notional amount of $125.0 million that effectively fixed the interest at 4.73% for the 2023 Term Loan beginning on July 21, 2023 through the 2023 Term Loan’s maturity date of January 10, 2025. |
Note: The current debt balances outstanding are shown net of discounts, premiums and unamortized debt costs (see page 27). |
| | | | | |
Long Term Debt Maturities (in thousands, except average interest rates) | |
| September 30, 2024 |
| | | | | | | | | | | | | | | | | | | | | | | | | |
| | | Future Maturities of Debt |
| Year | | | Unsecured Debt | | Credit Facility | | Total Debt | | Avg Interest Rate |
| | | | | | | | | |
| 2024 | | | $ | — | | | $ | — | | | $ | — | | | —% |
| 2025 | | | 125,000 | | (1) | — | | | 125,000 | | | 4.7% |
| 2026 | | | — | | | — | | | — | | | —% |
| 2027 | | | — | | | — | | | — | | | —% |
| 2028 | | | 50,000 | | | 168,000 | | (2) | 218,000 | | | 6.1% |
| | | | | | | | | |
| Thereafter | | | 350,000 | | | — | | | 350,000 | | | 4.1% |
| Scheduled principal payments | | | $ | 525,000 | | | $ | 168,000 | | | $ | 693,000 | | | 4.9% |
| | | | | | | | | |
| Net discounts/premiums | | | (77) | | | — | | | (77) | | | |
| Loan costs, net of amortization | | | (2,009) | | | — | | | (2,009) | | | |
| Total maturities | | | $ | 522,914 | | | $ | 168,000 | | | $ | 690,914 | | | 4.9% |
| Weighted average maturity = 4.4 years | | | | | | | | | |
| ______________________________ | | | | | | | | | |
| (1) During the first quarter of 2023, we entered into the $125.0 million 2023 Term Loan with an interest rate of adjusted SOFR (subject to a credit spread adjustment of 10 basis points) plus a margin of 95 basis points (subject to adjustment depending on Elme Communities’ credit rating). The 2023 Term Loan has a two-year term ending in January 2025, with two one-year extension options. We used the proceeds to prepay the $100.0 million 2018 Term Loan in full and a portion of our borrowings under our Revolving Credit Facility. Elme Communities had previously entered into an interest rate swap to effectively fix the interest rate for the remaining $100.0 million portion of the 2018 Term Loan. Following the prepayment of the 2018 Term Loan, the interest rate swap effectively fixed a $100.0 million portion of the 2023 Term Loan at 2.16% through the interest rate swap's expiration date of July 21, 2023. In March 2023, we entered into two interest rate swap arrangements with an aggregate notional amount of $125.0 million that effectively fixed the 2023 Term Loan’s interest rate at 4.73% beginning on July 21, 2023 through the 2023 Term Loan’s maturity date of January 10, 2025. |
| (2) On July 10, 2024, we executed an amended and restated credit agreement (the “Amended Credit Agreement”) that provides for a revolving credit facility of $500.0 million that matures in July 2028, with two six-month extension options. |
| | | | | | | | | | | | | | | | | | | | | | | | | | | | | | | | | | | |
| Unsecured Public Debt Covenants | | Unsecured Private Debt Covenants |
| Notes Payable | | Line of Credit and Term Loan | | Notes Payable |
| Quarter Ended September 30, 2024 | | Covenant | | Quarter Ended September 30, 2024 | | Covenant | | Quarter Ended September 30, 2024 | | Covenant |
% of Total Indebtedness to Total Assets(1) | 34.7 | % | | ≤ 65.0% | | N/A | | N/A | | N/A | | N/A |
| Ratio of Income Available for Debt Service to Annual Debt Service | 3.2 | | | ≥ 1.5 | | N/A | | N/A | | N/A | | N/A |
% of Secured Indebtedness to Total Assets(1) | — | % | | ≤ 40.0% | | N/A | | N/A | | N/A | | N/A |
Ratio of Total Unencumbered Assets(2) to Total Unsecured Indebtedness | 2.9 | | | ≥ 1.5 | | N/A | | N/A | | N/A | | N/A |
% of Net Consolidated Total Indebtedness to Consolidated Total Asset Value(3) (7) | N/A | | N/A | | 27.7 | % | | ≤ 60.0% | | 26.9 | % | | ≤ 60.0% |
Ratio of Consolidated Adjusted EBITDA(4) to Consolidated Fixed Charges(5) | N/A | | N/A | | 3.55 | | | ≥ 1.50 | | 3.55 | | | ≥ 1.50 |
% of Consolidated Secured Indebtedness to Consolidated Total Asset Value(3) (7) | N/A | | N/A | | — | % | | ≤ 40.0% | | — | % | | ≤ 40.0% |
% of Consolidated Unsecured Indebtedness to Unencumbered Pool Value(6) (7) | N/A | | N/A | | 27.7 | % | | ≤ 60.0% | | 26.9 | % | | ≤ 60.0% |
| | | | | | | | | | | |
| ______________________________ | | | | | | | | | | | |
(1) Total Assets is calculated by applying a capitalization rate of 7.50% to the EBITDA(4) from the last four consecutive quarters, excluding EBITDA from acquired, disposed, and non-stabilized development properties. |
(2) Total Unencumbered Assets is calculated by applying a capitalization rate of 7.50% to the EBITDA(4) from unencumbered properties from the last four consecutive quarters, excluding EBITDA from acquired, disposed, and non-stabilized development properties. |
| (3) Consolidated Total Asset Value is the sum of unrestricted cash plus the quotient of applying a capitalization rate to the annualized NOI from the most recently ended quarter for each asset class, excluding NOI from disposed properties, acquisitions during the past 6 quarters, development, major redevelopment and low occupancy properties. To this amount, we add the purchase price of acquisitions during the past 6 quarters plus values for development, major redevelopment and low occupancy properties. |
| (4) Consolidated Adjusted EBITDA is defined as earnings before noncontrolling interests, depreciation, amortization, interest expense, income tax expense, acquisition costs, extraordinary, unusual or nonrecurring transactions including sale of assets, impairment, gains and losses on extinguishment of debt and other non-cash charges. |
| (5) Consolidated Fixed Charges consist of interest expense excluding capitalized interest and amortization of deferred financing costs, principal payments and preferred dividends, if any. |
| (6) Unencumbered Pool Value is the sum of unrestricted cash plus the quotient of applying a capitalization rate to the annualized NOI from unencumbered properties from the most recently ended quarter for each asset class excluding NOI from disposed properties, acquisitions during the past 6 quarters, development, major redevelopment and low occupancy properties. To this we add the purchase price of unencumbered acquisitions during the past 6 quarters and values for unencumbered development, major redevelopment and low occupancy properties. |
| (7) For the line of credit and 2023 Term Loan, Watergate 600 is valued at its undepreciated GAAP book value for Consolidated Total Asset Value and Unencumbered Pool Value. |
| | | | | |
Capital Analysis (In thousands, except per share amounts) | |
| | | | | | | | | | | | | | | | | | | | | | | | | | | | | | | | | | | | | | | | | | | | |
| | | | | | Three Months Ended |
| | | | | | September 30, 2024 | | June 30, 2024 | | March 31, 2024 | | December 31, 2023 | | September 30, 2023 |
| Market Data | | | | | | | | | | | | | | |
| | | | | | | | | | | | | | |
| Shares Outstanding | | | | | | 88,010 | | | 88,011 | | | 88,003 | | | 87,867 | | | 87,832 | |
| Market Price per Share | | | | | | $ | 17.59 | | | $ | 15.93 | | | $ | 13.92 | | | $ | 14.60 | | | $ | 13.64 | |
| Equity Market Capitalization | | | | | | $ | 1,548,096 | | | $ | 1,402,015 | | | $ | 1,225,002 | | | $ | 1,282,858 | | | $ | 1,198,028 | |
| | | | | | | | | | | | | | |
| Total Debt | | | | | | $ | 690,914 | | | $ | 678,733 | | | $ | 682,539 | | | $ | 679,345 | | | $ | 671,150 | |
| Total Market Capitalization | | | | | | $ | 2,239,010 | | | $ | 2,080,748 | | | $ | 1,907,541 | | | $ | 1,962,203 | | | $ | 1,869,178 | |
| | | | | | | | | | | | | | |
| Total Debt to Market Capitalization | | | | | | 0.31 | :1 | | 0.33 | :1 | | 0.36 | :1 | | 0.35 | :1 | | 0.36 | :1 |
| | | | | | | | | | | | | | |
Earnings to Fixed Charges(1) | | | | | | 0.7x | | 0.6x | | 0.6x | | 0.7x | | -4.9x |
Debt Service Coverage Ratio(2) | | | | | | 3.2x | | 3.2x | | 3.1x | | 3.2x | | 3.9x |
| | | | | | | | | | | | | | |
| Dividend Data | Nine Months Ended | | | Three Months Ended |
| September 30, 2024 | | September 30, 2023 | | | September 30, 2024 | | June 30, 2024 | | March 31, 2024 | | December 31, 2023 | | September 30, 2023 |
| Total Dividends Declared | $ | 47,707 | | | $ | 47,562 | | | | $ | 15,906 | | | $ | 15,916 | | | $ | 15,885 | | | $ | 15,844 | | | $ | 15,885 | |
| Common Dividend Declared per Share | $ | 0.54 | | | $ | 0.54 | | | | $ | 0.18 | | | $ | 0.18 | | | $ | 0.18 | | | $ | 0.18 | | | $ | 0.18 | |
Payout Ratio (Core FFO basis)(3) | 78.3 | % | | 74.0 | % | | | 78.3 | % | | 78.3 | % | | 78.3 | % | | 75.0 | % | | 75.0 | % |
Payout Ratio (Core AFFO basis)(4) | 78.3 | % | | 73.0 | % | | | 75.0 | % | | | | | | | | 69.2 | % |
| ______________________________ | | | | | | | | | | | | | | |
| (1) The ratio of earnings to fixed charges is computed by dividing earnings by fixed charges. For this purpose, earnings consist of income from continuing operations attributable to the controlling interests plus fixed charges, less capitalized interest. Fixed charges consist of interest expense, including amortized costs of debt issuance, plus interest costs capitalized. The earnings to fixed charges ratio includes real estate impairment of $41.9 million for the three months ended September 30, 2023. |
(2) Debt service coverage ratio is calculated by dividing Adjusted EBITDA by interest expense and principal amortization. Adjusted EBITDA is a non-GAAP measure. See “Definitions” on page 11 for the definition of Adjusted EBITDA. |
(3) Payout Ratio (Core FFO basis) is calculated by dividing the common dividend per share by the Core FFO per share. Core FFO is a non-GAAP measure. See “Definitions” on page 11 for the definition of Core FFO. |
(4) Payout Ratio (Core AFFO basis) is calculated by dividing the common dividend per share by the Core AFFO per share. Core AFFO is a non-GAAP measure. See “Definitions” on page 11 for the definition of Core AFFO. |
| | | | | |
Net Loss to NOI Reconciliations (In thousands) | |
| | | | | | | | | | | | | | | | | | | | | | | | | | | | | | | | | | | | | | | | | | | | |
| Nine Months Ended | | | Three Months Ended |
| September 30, 2024 | | September 30, 2023 | | | September 30, 2024 | | June 30, 2024 | | March 31, 2024 | | December 31, 2023 | | September 30, 2023 |
| Net loss | $ | (10,088) | | | $ | (49,872) | | | | $ | (2,970) | | | $ | (3,471) | | | $ | (3,647) | | | $ | (3,105) | | | $ | (43,618) | |
| Adjustments: | | | | | | | | | | | | | | |
| Property management expense | 6,628 | | | 5,882 | | | | 2,235 | | | 2,175 | | | 2,218 | | | 2,226 | | | 1,935 | |
| General and administrative expense | 18,688 | | | 19,891 | | | | 6,354 | | | 6,138 | | | 6,196 | | | 5,996 | | | 6,370 | |
| Transformation costs | — | | | 6,339 | | | | — | | | — | | | — | | | — | | | 985 | |
| Real estate depreciation and amortization | 72,312 | | | 64,855 | | | | 23,474 | | | 23,895 | | | 24,943 | | | 24,095 | | | 21,904 | |
| Real estate impairment | — | | | 41,860 | | | | — | | | — | | | — | | | — | | | 41,860 | |
| | | | | | | | | | | | | | |
| Interest expense | 28,435 | | | 21,043 | | | | 9,557 | | | 9,384 | | | 9,494 | | | 9,386 | | | 7,418 | |
| | | | | | | | | | | | | | |
| Loss on extinguishment of debt | 147 | | | 54 | | | | 147 | | | — | | | — | | | — | | | — | |
| Other income | (1,410) | | | (569) | | | | — | | | — | | | (1,410) | | | — | | | — | |
| | | | | | | | | | | | | | |
| | | | | | | | | | | | | | |
| | | | | | | | | | | | | | |
| | | | | | | | | | | | | | |
Total Net operating income (NOI)(1) | $ | 114,712 | | | $ | 109,483 | | | | $ | 38,797 | | | $ | 38,121 | | | $ | 37,794 | | | $ | 38,598 | | | $ | 36,854 | |
| | | | | | | | | | | | | | |
| Multifamily NOI: | | | | | | | | | | | | | | |
| Same-store portfolio | $ | 100,950 | | | $ | 99,659 | | | | $ | 34,414 | | | $ | 33,516 | | | $ | 33,020 | | | $ | 33,672 | | | $ | 33,654 | |
| Acquisitions | 4,215 | | | 36 | | | | 1,254 | | | 1,411 | | 1,550 | | 1,633 | | | 36 | |
| Development | (175) | | | (168) | | | | (61) | | | (57) | | | (57) | | | (56) | | | (56) | |
| | | | | | | | | | | | | | |
| Total | 104,990 | | | 99,527 | | | | 35,607 | | | 34,870 | | | 34,513 | | | 35,249 | | | 33,634 | |
| Other NOI (Watergate 600) | 9,722 | | | 9,956 | | | | 3,190 | | | 3,251 | | | 3,281 | | | 3,349 | | | 3,220 | |
| Total NOI | $ | 114,712 | | | $ | 109,483 | | | | $ | 38,797 | | | $ | 38,121 | | | $ | 37,794 | | | $ | 38,598 | | | $ | 36,854 | |
| ______________________________ | | | | | | | | | | | | | | |
(1) NOI is a non-GAAP measure. See “Definitions” on page 11 for the definition of NOI and reconciliation of Net loss to NOI on the current page. |