UNITED STATES
SECURITIES AND EXCHANGE COMMISSION
Washington, D.C. 20549
Form 10-Q
(Mark One)
☒ | QUARTERLY REPORT PURSUANT TO SECTION 13 OR 15(d) OF THE SECURITIES EXCHANGE ACT OF 1934 |
|
|
| FOR THE QUARTERLY PERIOD ENDED September 30, 2021 OR |
☐ | TRANSITION REPORT PURSUANT TO SECTION 13 OR 15(d) OF THE SECURITIES EXCHANGE ACT OF 1934 |
|
|
| FOR THE TRANSITION PERIOD FROM TO |
Commission file number 1-3701
AVISTA CORPORATION
(Exact name of Registrant as specified in its charter)
Washington |
| 91-0462470 |
(State or other jurisdiction of incorporation or organization) |
| (I.R.S. Employer |
1411 East Mission Avenue, Spokane, Washington 99202-2600
(Address of principal executive offices, including zip code)
Registrant’s telephone number, including area code: 509-489-0500
None
(Former name, former address and former fiscal year, if changed since last report)
Securities registered pursuant to Section 12(b) of the Act:
Title of Each Class |
| Trading Symbol(s) |
| Name of Each Exchange on Which Registered |
Common Stock |
| AVA |
| New York Stock Exchange |
Indicate by check mark whether the registrant (1) has filed all reports required to be filed by Section 13 or 15(d) of the Securities Exchange Act of 1934 during the preceding 12 months (or for such shorter period that the Registrant was required to file such reports), and (2) has been subject to such filing requirements for the past 90 days: Yes ☒ No ☐
Indicate by check mark whether the registrant has submitted electronically every Interactive Data File required to be submitted pursuant to Rule 405 of Regulation S-T (§232.405 of this chapter) during the preceding 12 months (or for such shorter period that the registrant was required to submit and post such files). Yes ☒ No ☐
Indicate by check mark whether the registrant is a large accelerated filer, an accelerated filer, a non-accelerated filer, smaller reporting company, or an emerging growth company. See the definitions of “large accelerated filer,” “accelerated filer,” “smaller reporting company,” and "emerging growth company" in Rule 12b-2 of the Exchange Act.
Large accelerated filer | ☒ | Accelerated filer | ☐ |
Non-accelerated filer | ☐ | Smaller reporting company | ☐ |
Emerging growth company | ☐ |
|
|
If an emerging growth company, indicate by check mark if the registrant has elected not to use the extended transition period for complying with any new or revised financial accounting standards provided pursuant to Section 13(a) of the Exchange Act ☐
Indicate by check mark whether the Registrant is a shell company (as defined in Rule 12b-2 of the Exchange Act): Yes ☐ No ☒
As of October 31, 2021, 70,768,243 shares of Registrant’s Common Stock, no par value (the only class of common stock), were outstanding.
AVISTA CORPORATION
AVISTA CORPORATION
INDEX
Item No. |
|
| Page No. |
|
|
|
|
|
| iii | |
|
| 1 | |
|
| 4 | |
|
| ||
Item 1. |
| 5 | |
| Condensed Consolidated Statements of Income - |
| 5 |
|
| 6 | |
| Condensed Consolidated Balance Sheets - |
| 7 |
| Condensed Consolidated Statements of Cash Flows - |
| 8 |
| Condensed Consolidated Statements of Equity - |
| 10 |
|
| 11 | |
|
| 11 | |
|
| 12 | |
|
| 12 | |
|
| 14 | |
|
| 18 | |
| Note 6. Pension Plans and Other Postretirement Benefit Plans |
| 22 |
|
| 22 | |
|
| 23 | |
|
| 24 | |
|
| 24 | |
|
| 24 | |
|
| 25 | |
|
| 28 | |
|
| 28 | |
|
| 29 | |
|
| 29 | |
|
| 32 | |
|
| 34 | |
|
|
|
|
Item 2. | Management’s Discussion and Analysis of Financial Condition and Results of Operations |
| 35 |
|
| 35 | |
|
| 35 | |
|
| 36 | |
|
| 39 | |
|
| 42 | |
i
|
| 43 | |
| Results of Operations - Alaska Electric Light and Power Company |
| 55 |
|
| 55 | |
|
| 56 | |
|
| 56 | |
|
| 56 | |
|
| 56 | |
|
| 57 | |
|
| 58 | |
|
| 58 | |
|
| 58 | |
|
| 58 | |
|
| 59 | |
|
| 61 | |
|
| 61 | |
|
| 62 | |
|
|
|
|
Item 3. |
| 63 | |
|
|
|
|
Item 4. |
| 63 | |
|
|
|
|
|
| ||
Item 1. |
| 64 | |
|
|
|
|
Item 1A. |
| 64 | |
|
|
|
|
Item 6. |
| 66 | |
|
|
|
|
|
| 67 | |
ii
AVISTA CORPORATION
ACRONYMS AND TERMS
(The following acronyms and terms are found in multiple locations within the document)
Acronym/Term | Meaning | |
aMW | - | Average Megawatt - a measure of the average rate at which a particular generating source produces energy over a period of time |
AEL&P | - | Alaska Electric Light and Power Company, the primary operating subsidiary of AERC, which provides electric services in Juneau, Alaska |
AERC | - | Alaska Energy and Resources Company, the Company's wholly-owned subsidiary based in Juneau, Alaska |
AFUDC | - | Allowance for Funds Used During Construction; represents the cost of both the debt and equity funds used to finance utility plant additions during the construction period |
ASC | - | Accounting Standards Codification |
ASU | - | Accounting Standards Update |
Avista Capital | - | Parent company to the Company’s non-utility businesses, with the exception of AJT Mining Properties, Inc., which is a subsidiary of AERC. |
Avista Corp. | - | Avista Corporation, the Company |
Avista Utilities | - | Operating division of Avista Corp. (not a subsidiary) comprising the regulated utility operations in the Pacific Northwest |
Capacity | - | The rate at which a particular generating source is capable of producing energy, measured in KW or MW |
Cabinet Gorge | - | The Cabinet Gorge Hydroelectric Generating Project, located on the Clark Fork River in Idaho |
CETA | - | Clean Energy Transformation Act |
Colstrip | - | The coal-fired Colstrip Generating Plant in southeastern Montana |
Cooling degree days | - | The measure of the warmness of weather experienced, based on the extent to which the average of high and low temperatures for a day exceeds 65 degrees Fahrenheit (annual degree days above historic indicate warmer than average temperatures) |
COVID-19 | - | Coronavirus disease 2019, a respiratory illness that was declared a pandemic in March 2020 |
Deadband or ERM | - | The first $4.0 million in annual power supply costs above or below the amount included in base retail rates in Washington under the ERM in the state of Washington |
EIM | - | Energy Imbalance Market |
Energy | - | The amount of electricity produced or consumed over a period of time, measured in KWh or MWh. Also, refers to natural gas consumed and is measured in dekatherms |
EPA | - | Environmental Protection Agency |
ERM | - | The Energy Recovery Mechanism, a mechanism for accounting and rate recovery of certain power supply costs accepted by the utility commission in the state of Washington |
FASB | - | Financial Accounting Standards Board |
FCA | - | Fixed Cost Adjustment, the electric and natural gas decoupling mechanism in Idaho |
FERC | - | Federal Energy Regulatory Commission |
GAAP | - | Generally Accepted Accounting Principles |
Heating degree days | - | The measure of the coldness of weather experienced, based on the extent to which the average of high and low temperatures for a day falls below 65 degrees Fahrenheit (annual degree days below historic indicate warmer than average temperatures). |
IPUC | - | Idaho Public Utilities Commission |
KW, KWh | - | Kilowatt (1000 watts): a measure of generating power or capability. Kilowatt-hour (1000 watt hours): a measure of energy produced over a period of time |
MPSC | - | Public Service Commission of the State of Montana |
iii
AVISTA CORPORATION
MW, MWh | - | Megawatt: 1000 KW. Megawatt-hour: 1000 KWh |
Noxon Rapids | - | The Noxon Rapids Hydroelectric Generating Project, located on the Clark Fork River in Montana |
OPUC | - | The Public Utility Commission of Oregon |
PCA | - | The Power Cost Adjustment mechanism, a procedure for accounting and rate recovery of certain power supply costs accepted by the utility commission in the state of Idaho |
PGA | - | Purchased Gas Adjustment |
PPA | - | Power Purchase Agreement |
RCA | - | The Regulatory Commission of Alaska |
REC | - | Renewable energy credit |
ROE | - | Return on equity |
ROR | - | Rate of return on rate base |
ROU | - | Right-of-use lease asset |
SEC | - | U.S. Securities and Exchange Commission |
Therm | - | Unit of measurement for natural gas; a therm is equal to approximately one hundred cubic feet (volume) or 100,000 BTUs (energy) |
Watt | - | Unit of measurement of electric power or capability; a watt is equal to the rate of work represented by a current of one ampere under a pressure of one volt |
WUTC | - | Washington Utilities and Transportation Commission |
iv
AVISTA CORPORATION
Forward-Looking Statements
From time to time, we make forward-looking statements such as statements regarding projected or future:
These statements are based upon underlying assumptions (many of which are based, in turn, upon further assumptions). Such statements are made both in our reports filed under the Securities Exchange Act of 1934, as amended (including this Quarterly Report on Form 10-Q), and elsewhere. Forward-looking statements are all statements except those of historical fact including, without limitation, those that are identified by the use of words that include “will,” “may,” “could,” “should,” “intends,” “plans,” “seeks,” “anticipates,” “estimates,” “expects,” “forecasts,” “projects,” “predicts,” and similar expressions.
Forward-looking statements (including those made in this Quarterly Report on Form 10-Q) are subject to a variety of risks, uncertainties and other factors. Most of these factors are beyond our control and may have a significant effect on our operations, results of operations, financial condition or cash flows, which could cause actual results to differ materially from those anticipated in our statements. Such risks, uncertainties and other factors include, among others:
Utility Regulatory Risk
Operational Risk
1
AVISTA CORPORATION
Cyber and Technology Risk
Strategic Risk
2
AVISTA CORPORATION
External Mandates Risk
Financial Risk
3
AVISTA CORPORATION
Energy Commodity Risk
Compliance Risk
Our expectations, beliefs and projections are expressed in good faith. We believe they are reasonable based on, without limitation, an examination of historical operating trends, our records and other information available from third parties. There can be no assurance that our expectations, beliefs or projections will be achieved or accomplished. Furthermore, any forward-looking statement speaks only as of the date on which such statement is made. We undertake no obligation to update any forward-looking statement or statements to reflect events or circumstances that occur after the date on which such statement is made or to reflect the occurrence of unanticipated events. New risks, uncertainties and other factors emerge from time to time, and it is not possible for us to predict all such factors, nor can we assess the effect of each such factor on our business or the extent that any such factor or combination of factors may cause actual results to differ materially from those contained in any forward-looking statement.
Available Information
We file annual, quarterly and current reports and proxy statements with the SEC. The SEC maintains a website that contains these documents at www.sec.gov. We make annual, quarterly and current reports and proxy statements available on our website, https://investor.avistacorp.com/, as soon as practicable after electronically filing these documents with the SEC. Except for SEC filings or portions thereof that are specifically referred to in this report, information contained on these websites is not part of this report.
4
PART I. Financial Information
Item 1. Condensed Consolidated Financial Statements
CONDENSED CONSOLIDATED STATEMENTS OF INCOME
Avista Corporation
For the Three and Nine Months Ended September 30
Dollars in thousands, except per share amounts
(Unaudited)
|
| Three Months Ended September 30, |
|
| Nine Months Ended September 30, |
| ||||||||||
|
| 2021 |
|
| 2020 |
|
| 2021 |
|
| 2020 |
| ||||
Operating Revenues: |
|
|
|
|
|
|
|
|
|
|
|
| ||||
Utility revenues: |
|
|
|
|
|
|
|
|
|
|
|
| ||||
Utility revenues, exclusive of alternative revenue programs |
| $ | 306,398 |
|
| $ | 276,351 |
|
| $ | 1,019,756 |
|
| $ | 944,146 |
|
Alternative revenue programs |
|
| (10,499 | ) |
|
| (3,972 | ) |
|
| (13,069 | ) |
|
| (4,023 | ) |
Total utility revenues |
|
| 295,899 |
|
|
| 272,379 |
|
|
| 1,006,687 |
|
|
| 940,123 |
|
Non-utility revenues |
|
| 108 |
|
|
| 267 |
|
|
| 445 |
|
|
| 1,345 |
|
Total operating revenues |
|
| 296,007 |
|
|
| 272,646 |
|
|
| 1,007,132 |
|
|
| 941,468 |
|
Operating Expenses: |
|
|
|
|
|
|
|
|
|
|
|
| ||||
Utility operating expenses: |
|
|
|
|
|
|
|
|
|
|
|
| ||||
Resource costs |
|
| 102,133 |
|
|
| 78,785 |
|
|
| 327,390 |
|
|
| 276,297 |
|
Other operating expenses |
|
| 85,625 |
|
|
| 85,551 |
|
|
| 267,233 |
|
|
| 266,251 |
|
Depreciation and amortization |
|
| 57,722 |
|
|
| 53,953 |
|
|
| 169,009 |
|
|
| 169,282 |
|
Taxes other than income taxes |
|
| 25,440 |
|
|
| 24,016 |
|
|
| 82,223 |
|
|
| 79,736 |
|
Non-utility operating expenses: |
|
|
|
|
|
|
|
|
|
|
|
| ||||
Other operating expenses |
|
| 843 |
|
|
| 1,697 |
|
|
| 3,186 |
|
|
| 3,716 |
|
Depreciation and amortization |
|
| 30 |
|
|
| 146 |
|
|
| 230 |
|
|
| 569 |
|
Total operating expenses |
|
| 271,793 |
|
|
| 244,148 |
|
|
| 849,271 |
|
|
| 795,851 |
|
Income from operations |
|
| 24,214 |
|
|
| 28,498 |
|
|
| 157,861 |
|
|
| 145,617 |
|
Interest expense |
|
| 26,547 |
|
|
| 25,812 |
|
|
| 78,982 |
|
|
| 77,784 |
|
Interest expense to affiliated trusts |
|
| 102 |
|
|
| 128 |
|
|
| 317 |
|
|
| 606 |
|
Capitalized interest |
|
| (1,102 | ) |
|
| (1,009 | ) |
|
| (3,033 | ) |
|
| (2,979 | ) |
Other income-net |
|
| (10,267 | ) |
|
| (2,168 | ) |
|
| (23,992 | ) |
|
| (2,019 | ) |
Income before income taxes |
|
| 8,934 |
|
|
| 5,735 |
|
|
| 105,587 |
|
|
| 72,225 |
|
Income tax expense (benefit) |
|
| (5,432 | ) |
|
| 859 |
|
|
| 9,130 |
|
|
| 1,472 |
|
Net income |
| $ | 14,366 |
|
| $ | 4,876 |
|
| $ | 96,457 |
|
| $ | 70,753 |
|
Weighted-average common shares outstanding (thousands), basic |
|
| 70,054 |
|
|
| 68,194 |
|
|
| 69,582 |
|
|
| 67,638 |
|
Weighted-average common shares outstanding (thousands), diluted |
|
| 70,129 |
|
|
| 68,337 |
|
|
| 69,722 |
|
|
| 67,769 |
|
|
|
|
|
|
|
|
|
|
|
|
|
| ||||
Earnings per common share: |
|
|
|
|
|
|
|
|
|
|
|
| ||||
Basic |
| $ | 0.21 |
|
| $ | 0.07 |
|
| $ | 1.39 |
|
| $ | 1.05 |
|
Diluted |
| $ | 0.20 |
|
| $ | 0.07 |
|
| $ | 1.38 |
|
| $ | 1.04 |
|
The Accompanying Notes are an Integral Part of These Statements.
5
CONDENSED CONSOLIDATED STATEMENTS OF COMPREHENSIVE INCOME
Avista Corporation
For the Three and Nine Months Ended September 30
Dollars in thousands
(Unaudited)
|
| Three months ended September 30: |
|
| Nine Months Ended September 30, |
| ||||||||||
|
| 2021 |
|
| 2020 |
|
| 2021 |
|
| 2020 |
| ||||
Net income |
| $ | 14,366 |
|
| $ | 4,876 |
|
| $ | 96,457 |
|
| $ | 70,753 |
|
Other Comprehensive Income: |
|
|
|
|
|
|
|
|
|
|
|
| ||||
Change in unfunded benefit obligation for pension and other postretirement benefit plans - net of taxes of $81, $58, $247 and $171 respectively |
|
| 304 |
|
|
| 220 |
|
|
| 927 |
|
|
| 645 |
|
Total other comprehensive income |
|
| 304 |
|
|
| 220 |
|
|
| 927 |
|
|
| 645 |
|
Comprehensive income |
| $ | 14,670 |
|
| $ | 5,096 |
|
| $ | 97,384 |
|
| $ | 71,398 |
|
The Accompanying Notes are an Integral Part of These Statements.
6
CONDENSED CONSOLIDATED BALANCE SHEETS
Avista Corporation
Dollars in thousands
(Unaudited)
|
| September 30, |
|
| December 31, |
| ||
|
| 2021 |
|
| 2020 |
| ||
Assets: |
|
|
|
|
|
| ||
Current Assets: |
|
|
|
|
|
| ||
Cash and cash equivalents |
| $ | 19,224 |
|
| $ | 14,196 |
|
Accounts and notes receivable-less allowances of $12,360 and $11,387, respectively |
|
| 130,696 |
|
|
| 163,772 |
|
Materials and supplies, fuel stock and stored natural gas |
|
| 87,203 |
|
|
| 67,451 |
|
Regulatory assets |
|
| 37,768 |
|
|
| 13,673 |
|
Other current assets |
|
| 81,384 |
|
|
| 84,885 |
|
Total current assets |
|
| 356,275 |
|
|
| 343,977 |
|
Net utility property |
|
| 5,168,825 |
|
|
| 4,991,612 |
|
Goodwill |
|
| 52,426 |
|
|
| 52,426 |
|
Non-current regulatory assets |
|
| 875,952 |
|
|
| 750,443 |
|
Other property and investments-net and other non-current assets |
|
| 278,000 |
|
|
| 263,639 |
|
Total assets |
| $ | 6,731,478 |
|
| $ | 6,402,097 |
|
Liabilities and Equity: |
|
|
|
|
|
| ||
Current Liabilities: |
|
|
|
|
|
| ||
Accounts payable |
| $ | 102,824 |
|
| $ | 106,613 |
|
Current portion of long-term debt |
|
| 250,000 |
|
|
| 0 |
|
Short-term borrowings |
|
| 199,075 |
|
|
| 203,000 |
|
Regulatory liabilities |
|
| 75,559 |
|
|
| 46,435 |
|
Other current liabilities |
|
| 171,728 |
|
|
| 149,831 |
|
Total current liabilities |
|
| 799,186 |
|
|
| 505,879 |
|
Long-term debt |
|
| 1,898,235 |
|
|
| 2,008,534 |
|
Long-term debt to affiliated trusts |
|
| 51,547 |
|
|
| 51,547 |
|
Pensions and other postretirement benefits |
|
| 177,333 |
|
|
| 211,880 |
|
Deferred income taxes |
|
| 634,215 |
|
|
| 594,712 |
|
Non-current regulatory liabilities |
|
| 886,351 |
|
|
| 784,820 |
|
Other non-current liabilities and deferred credits |
|
| 182,975 |
|
|
| 214,999 |
|
Total liabilities |
|
| 4,629,842 |
|
|
| 4,372,371 |
|
Commitments and Contingencies (See Notes to Condensed Consolidated |
|
|
|
|
|
| ||
Equity: |
|
|
|
|
|
| ||
Shareholders’ Equity: |
|
|
|
|
|
| ||
Common stock, no par value; 200,000,000 shares authorized; 70,767,212 and |
|
| 1,349,960 |
|
|
| 1,286,068 |
|
Accumulated other comprehensive loss |
|
| (13,451 | ) |
|
| (14,378 | ) |
Retained earnings |
|
| 765,127 |
|
|
| 758,036 |
|
Total shareholders’ equity |
|
| 2,101,636 |
|
|
| 2,029,726 |
|
Total liabilities and equity |
| $ | 6,731,478 |
|
| $ | 6,402,097 |
|
The Accompanying Notes are an Integral Part of These Statements.
7
CONDENSED CONSOLIDATED STATEMENTS OF CASH FLOWS
Avista Corporation
For the Nine Months Ended September 30
Dollars in thousands
(Unaudited)
|
| 2021 |
|
| 2020 |
| ||
Operating Activities: |
|
|
|
|
|
| ||
Net income |
| $ | 96,457 |
|
| $ | 70,753 |
|
Non-cash items included in net income: |
|
|
|
|
|
| ||
Depreciation and amortization |
|
| 169,239 |
|
|
| 169,851 |
|
Deferred income tax provision and investment tax credits |
|
| 18,645 |
|
|
| (2,200 | ) |
Power and natural gas cost amortizations (deferrals), net |
|
| (40,178 | ) |
|
| (6,470 | ) |
Amortization of debt expense |
|
| 2,068 |
|
|
| 2,329 |
|
Stock-based compensation expense |
|
| 3,173 |
|
|
| 3,705 |
|
Equity-related AFUDC |
|
| (5,280 | ) |
|
| (5,030 | ) |
Pension and other postretirement benefit expense |
|
| 21,925 |
|
|
| 25,010 |
|
Other regulatory assets and liabilities and deferred debits and credits |
|
| 2,597 |
|
|
| 12,456 |
|
Change in decoupling regulatory deferral |
|
| 12,602 |
|
|
| 3,340 |
|
Gain on sale of investments |
|
| (1,816 | ) |
|
| (3,914 | ) |
Other |
|
| (12,697 | ) |
|
| 12,807 |
|
Contributions to defined benefit pension plan |
|
| (42,000 | ) |
|
| (22,000 | ) |
Cash paid for settlement of interest rate swap agreements |
|
| (17,568 | ) |
|
| (33,499 | ) |
Cash received for settlement of interest rate swap agreements |
|
| 324 |
|
|
| — |
|
Changes in certain current assets and liabilities: |
|
|
|
|
|
| ||
Accounts and notes receivable |
|
| 24,521 |
|
|
| 45,552 |
|
Materials and supplies, fuel stock and stored natural gas |
|
| (19,753 | ) |
|
| (2,444 | ) |
Collateral posted for derivative instruments |
|
| (9,944 | ) |
|
| 10,105 |
|
Income taxes receivable |
|
| 10,663 |
|
|
| 3,549 |
|
Other current assets |
|
| 7,902 |
|
|
| 6,352 |
|
Accounts payable |
|
| (889 | ) |
|
| (23,328 | ) |
Other current liabilities |
|
| 8,925 |
|
|
| 15,604 |
|
Net cash provided by operating activities |
|
| 228,916 |
|
|
| 282,528 |
|
|
|
|
|
|
|
| ||
Investing Activities: |
|
|
|
|
|
| ||
Utility property capital expenditures (excluding equity-related AFUDC) |
|
| (322,808 | ) |
|
| (297,834 | ) |
Issuance of notes receivable |
|
| (1,791 | ) |
|
| (4,343 | ) |
Equity and property investments |
|
| (12,621 | ) |
|
| (3,994 | ) |
Proceeds from sale of investments |
|
| 8,306 |
|
|
| 6,644 |
|
Other |
|
| 1,984 |
|
|
| (1,478 | ) |
Net cash used in investing activities |
|
| (326,930 | ) |
|
| (301,005 | ) |
The Accompanying Notes are an Integral Part of These Statements.
8
CONDENSED CONSOLIDATED STATEMENTS OF CASH FLOWS (continued)
Avista Corporation
For the Nine Months Ended September 30
Dollars in thousands
(Unaudited)
|
| 2021 |
|
| 2020 |
| ||
Financing Activities: |
|
|
|
|
|
| ||
Net increase (decrease) in short-term borrowings |
| $ | 66,000 |
|
| $ | (35,800 | ) |
Proceeds from issuance of long-term debt |
|
| 70,000 |
|
|
| 165,000 |
|
Maturity of long-term debt and finance leases |
|
| (2,223 | ) |
|
| (2,129 | ) |
Issuance of common stock, net of issuance costs |
|
| 61,345 |
|
|
| 53,356 |
|
Cash dividends paid |
|
| (88,204 | ) |
|
| (82,281 | ) |
Other |
|
| (3,876 | ) |
|
| (4,818 | ) |
Net cash provided by financing activities |
|
| 103,042 |
|
|
| 93,328 |
|
|
|
|
|
|
|
| ||
Net increase in cash and cash equivalents |
|
| 5,028 |
|
|
| 74,851 |
|
|
|
|
|
|
|
| ||
Cash and cash equivalents at beginning of period |
|
| 14,196 |
|
|
| 9,896 |
|
|
|
|
|
|
|
| ||
Cash and cash equivalents at end of period |
| $ | 19,224 |
|
| $ | 84,747 |
|
The Accompanying Notes are an Integral Part of These Statements.
9
CONDENSED CONSOLIDATED STATEMENTS OF EQUITY
Avista Corporation
For the Three and Nine Months Ended September 30
Dollars in thousands
(Unaudited)
|
| Three Months Ended September 30, |
|
| Nine Months Ended September 30, |
| ||||||||||
|
| 2021 |
|
| 2020 |
|
| 2021 |
|
| 2020 |
| ||||
Common Stock, Shares: |
|
|
|
|
|
|
|
|
|
|
|
| ||||
Shares outstanding at beginning of period |
|
| 69,666,667 |
|
|
| 67,913,265 |
|
|
| 69,238,901 |
|
|
| 67,176,996 |
|
Shares issued |
|
| 1,100,545 |
|
|
| 821,196 |
|
|
| 1,528,311 |
|
|
| 1,557,465 |
|
Shares outstanding at end of period |
|
| 70,767,212 |
|
|
| 68,734,461 |
|
|
| 70,767,212 |
|
|
| 68,734,461 |
|
Common Stock, Amount: |
|
|
|
|
|
|
|
|
|
|
|
| ||||
Balance at beginning of period |
| $ | 1,303,411 |
|
| $ | 1,234,901 |
|
| $ | 1,286,068 |
|
| $ | 1,210,741 |
|
Equity compensation expense |
|
| 893 |
|
|
| 824 |
|
|
| 3,540 |
|
|
| 3,502 |
|
Issuance of common stock, net of issuance costs |
|
| 45,656 |
|
|
| 29,466 |
|
|
| 61,345 |
|
|
| 53,356 |
|
Payment of minimum tax withholdings for share-based |
|
| — |
|
|
| — |
|
|
| (993 | ) |
|
| (2,408 | ) |
Balance at end of period |
|
| 1,349,960 |
|
|
| 1,265,191 |
|
|
| 1,349,960 |
|
|
| 1,265,191 |
|
Accumulated Other Comprehensive Loss: |
|
|
|
|
|
|
|
|
|
|
|
| ||||
Balance at beginning of period |
|
| (13,755 | ) |
|
| (9,834 | ) |
|
| (14,378 | ) |
|
| (10,259 | ) |
Other comprehensive income |
|
| 304 |
|
|
| 220 |
|
|
| 927 |
|
|
| 645 |
|
Balance at end of period |
|
| (13,451 | ) |
|
| (9,614 | ) |
|
| (13,451 | ) |
|
| (9,614 | ) |
Retained Earnings: |
|
|
|
|
|
|
|
|
|
|
|
| ||||
Balance at beginning of period |
|
| 780,310 |
|
|
| 749,971 |
|
|
| 758,036 |
|
|
| 738,802 |
|
Net income |
|
| 14,366 |
|
|
| 4,876 |
|
|
| 96,457 |
|
|
| 70,753 |
|
Cash dividends on common stock |
|
| (29,549 | ) |
|
| (27,573 | ) |
|
| (89,366 | ) |
|
| (82,281 | ) |
Balance at end of period |
|
| 765,127 |
|
|
| 727,274 |
|
|
| 765,127 |
|
|
| 727,274 |
|
Total equity |
| $ | 2,101,636 |
|
| $ | 1,982,851 |
|
| $ | 2,101,636 |
|
| $ | 1,982,851 |
|
Dividends declared per common share |
| $ | 0.4225 |
|
| $ | 0.4050 |
|
| $ | 1.2675 |
|
| $ | 1.2150 |
|
The Accompanying Notes are an Integral Part of These Statements.
10
AVISTA CORPORATION
NOTES TO CONDENSED CONSOLIDATED FINANCIAL STATEMENTS (Unaudited)
The accompanying condensed consolidated financial statements of Avista Corp. as of and for the interim periods ended September 30, 2021 and September 30, 2020 are unaudited; however, in the opinion of management, the statements reflect all adjustments necessary for a fair statement of the results for the interim periods. All such adjustments are of a normal recurring nature. The condensed consolidated financial statements have been prepared in accordance with GAAP for interim financial information and with the instructions to Form 10-Q and Rule 10-01 of Regulation S-X. The Condensed Consolidated Statements of Income for the interim periods are not necessarily indicative of the results to be expected for the full year. These condensed consolidated financial statements do not contain the detail or footnote disclosure concerning accounting policies and other matters which would be included in full fiscal year consolidated financial statements; therefore, they should be read in conjunction with the Company's audited consolidated financial statements included in the Company's Annual Report on Form 10-K for the year ended December 31, 2020 (2020 Form 10-K).
NOTE 1. SUMMARY OF SIGNIFICANT ACCOUNTING POLICIES
Nature of Business
Avista Corp. is primarily an electric and natural gas utility with certain other business ventures. Avista Utilities is an operating division of Avista Corp., comprising its regulated utility operations in the Pacific Northwest. Avista Utilities provides electric distribution and transmission, and natural gas distribution services in parts of eastern Washington and northern Idaho. Avista Utilities also provides natural gas distribution service in parts of northeastern and southwestern Oregon. Avista Utilities has electric generating facilities in Washington, Idaho, Oregon and Montana. Avista Utilities also supplies electricity to a small number of customers in Montana, most of whom are employees who operate the Company's Noxon Rapids generating facility.
AERC is a wholly-owned subsidiary of Avista Corp. The primary subsidiary of AERC is AEL&P, which comprises Avista Corp.'s regulated utility operations in Alaska.
Avista Capital, a wholly owned non-regulated subsidiary of Avista Corp., is the parent company of all of the subsidiary companies in the non-utility businesses, with the exception of AJT Mining Properties, Inc., which is a subsidiary of AERC. See Note 17 for business segment information.
Basis of Reporting
The condensed consolidated financial statements include the assets, liabilities, revenues and expenses of the Company and its subsidiaries and other majority owned subsidiaries and variable interest entities for which the Company or its subsidiaries are the primary beneficiaries. Intercompany balances were eliminated in consolidation. The accompanying condensed consolidated financial statements include the Company’s proportionate share of utility plant and related operations resulting from its interests in jointly owned plants.
Regulation
The Company is subject to state regulation in Washington, Idaho, Montana, Oregon and Alaska. The Company is also subject to federal regulation primarily by the FERC, as well as various other federal agencies with regulatory oversight of particular aspects of its operations.
Derivative Assets and Liabilities
Derivatives are recorded as either assets or liabilities on the Condensed Consolidated Balance Sheets measured at estimated fair value.
The WUTC and the IPUC issued accounting orders authorizing Avista Corp. to offset energy commodity derivative assets or liabilities with a regulatory asset or liability. This accounting treatment is intended to defer the recognition of mark-to-market gains and losses on energy commodity transactions until the period of delivery. Realized benefits and costs result in adjustments to retail rates through
11
AVISTA CORPORATION
PGAs, the ERM in Washington, the PCA mechanism in Idaho, and periodic general rate cases. The resulting regulatory assets associated with energy commodity derivative instruments have been concluded to be probable of recovery through future rates.
Substantially all forward contracts to purchase or sell power and natural gas are recorded as derivative assets or liabilities at estimated fair value with an offsetting regulatory asset or liability. Contracts that are not considered derivatives are accounted for on the accrual basis until they are settled or realized unless there is a decline in the fair value of the contract that is determined to be other-than-temporary.
For interest rate swap derivatives, Avista Corp. records all mark-to-market gains and losses in each accounting period as assets and liabilities, as well as offsetting regulatory assets and liabilities, such that there is no income statement impact. The interest rate swap derivatives are risk management tools similar to energy commodity derivatives. Upon settlement of interest rate swap derivatives, the regulatory asset or liability is amortized as a component of interest expense over the term of the associated debt. The Company records an offset of interest rate swap derivative assets and liabilities with regulatory assets and liabilities, based on the prior practice of the commissions to provide recovery through the ratemaking process.
The Company has multiple master netting agreements with a variety of entities that allow for cross-commodity netting of derivative agreements with the same counterparty (i.e. power derivatives can be netted with natural gas derivatives). In addition, some master netting agreements allow for the netting of commodity derivatives and interest rate swap derivatives for the same counterparty. The Company does not have any agreements which allow for cross-affiliate netting among multiple affiliated legal entities. The Company nets all derivative instruments when allowed by the agreement for presentation in the Condensed Consolidated Balance Sheets.
Fair Value Measurements
Fair value represents the price that would be received when selling an asset or paid to transfer a liability (an exit price) in an orderly transaction between market participants at the measurement date. Energy commodity derivative assets and liabilities, deferred compensation assets, as well as derivatives related to interest rate swaps and foreign currency exchange contracts, are reported at estimated fair value on the Condensed Consolidated Balance Sheets. See Note 12 for the Company’s fair value disclosures.
Contingencies
The Company has unresolved regulatory, legal and tax issues which have inherently uncertain outcomes. The Company accrues a loss contingency if it is probable that a liability has been incurred and the amount of the loss or impairment can be reasonably estimated. The Company also discloses loss contingencies that do not meet these conditions for accrual if there is a reasonable possibility that a material loss may be incurred. See Note 16 for further discussion of the Company's commitments and contingencies.
NOTE 2. NEW ACCOUNTING STANDARDS
There are no new accounting standards with a material impact to the Company.
NOTE 3. BALANCE SHEET COMPONENTS
Materials and Supplies, Fuel Stock and Stored Natural Gas
Inventories of materials and supplies, fuel stock and stored natural gas are recorded at average cost for our regulated operations and the lower of cost or net realizable value for our non-regulated operations and consisted of the following as of September 30, 2021 and December 31, 2020 (dollars in thousands):
|
| September 30, |
|
| December 31, |
| ||
|
| 2021 |
|
| 2020 |
| ||
Materials and supplies |
| $ | 58,238 |
|
| $ | 53,258 |
|
Fuel stock |
|
| 5,154 |
|
|
| 4,658 |
|
Stored natural gas |
|
| 23,811 |
|
|
| 9,535 |
|
Total |
| $ | 87,203 |
|
| $ | 67,451 |
|
12
AVISTA CORPORATION
Other Current Assets
Other current assets consisted of the following as of September 30, 2021 and December 31, 2020 (dollars in thousands):
|
| September 30, |
|
| December 31, |
| ||
|
| 2021 |
|
| 2020 |
| ||
Collateral posted for derivative instruments after netting with outstanding |
| $ | 10,604 |
|
| $ | 4,336 |
|
Prepayments |
|
| 18,523 |
|
|
| 24,411 |
|
Income taxes receivable |
|
| 39,151 |
|
|
| 49,814 |
|
Other |
|
| 13,106 |
|
|
| 6,324 |
|
Total |
| $ | 81,384 |
|
| $ | 84,885 |
|
Net Utility Property
Net utility property, which is recorded at original cost net of accumulated depreciation, consisted of the following as of September 30, 2021 and December 31, 2020 (dollars in thousands):
|
| September 30, |
|
| December 31, |
| ||
|
| 2021 |
|
| 2020 |
| ||
Utility plant in service |
| $ | 7,067,842 |
|
| $ | 6,809,797 |
|
Construction work in progress |
|
| 204,384 |
|
|
| 175,767 |
|
Total |
|
| 7,272,226 |
|
|
| 6,985,564 |
|
Less: Accumulated depreciation and amortization |
|
| 2,103,401 |
|
|
| 1,993,952 |
|
Total net utility property |
| $ | 5,168,825 |
|
| $ | 4,991,612 |
|
Other Property and Investments-Net and Other Non-Current Assets
Other property and investments-net and other non-current assets consisted of the following as of September 30, 2021 and December 31, 2020 (dollars in thousands):
|
| September 30, |
|
| December 31, |
| ||
|
| 2021 |
|
| 2020 |
| ||
Operating lease ROU assets |
| $ | 70,578 |
|
| $ | 71,891 |
|
Equity investments |
|
| 83,496 |
|
|
| 59,318 |
|
Finance lease ROU assets |
|
| 44,607 |
|
|
| 47,338 |
|
Non-utility property |
|
| 19,248 |
|
|
| 19,508 |
|
Notes receivable |
|
| 14,759 |
|
|
| 14,454 |
|
Investment in affiliated trust |
|
| 11,547 |
|
|
| 11,547 |
|
Deferred compensation assets |
|
| 9,917 |
|
|
| 9,174 |
|
Assets held for sale (1) |
|
| 0 |
|
|
| 3,462 |
|
Other |
|
| 23,848 |
|
|
| 26,947 |
|
Total |
| $ | 278,000 |
|
| $ | 263,639 |
|
Other Current Liabilities
Other current liabilities consisted of the following as of September 30, 2021 and December 31, 2020 (dollars in thousands):
|
| September 30, |
|
| December 31, |
| ||
Accrued taxes other than income taxes |
| $ | 42,945 |
|
| $ | 45,099 |
|
Derivative liabilities |
|
| 24,797 |
|
|
| 14,008 |
|
Employee paid time off accruals |
|
| 28,321 |
|
|
| 26,495 |
|
Accrued interest |
|
| 29,278 |
|
|
| 17,083 |
|
Pensions and other postretirement benefits |
|
| 10,970 |
|
|
| 11,987 |
|
Other |
|
| 35,417 |
|
|
| 35,159 |
|
Total other current liabilities |
| $ | 171,728 |
|
| $ | 149,831 |
|
13
AVISTA CORPORATION
Other Non-Current Liabilities and Deferred Credits
Other non-current liabilities and deferred credits consisted of the following as of September 30, 2021 and December 31, 2020 (dollars in thousands):
|
| September 30, |
|
| December 31, |
| ||
Operating lease liabilities |
| $ | 69,475 |
|
| $ | 67,716 |
|
Finance lease liabilities |
|
| 46,501 |
|
|
| 48,815 |
|
Deferred investment tax credits |
|
| 29,452 |
|
|
| 29,866 |
|
Asset retirement obligations |
|
| 16,425 |
|
|
| 17,194 |
|
Derivative liabilities |
|
| 5,580 |
|
|
| 37,427 |
|
Other |
|
| 15,542 |
|
|
| 13,981 |
|
Total |
| $ | 182,975 |
|
| $ | 214,999 |
|
Regulatory Assets and Liabilities
Regulatory assets and liabilities consisted of the following as of September 30, 2021 and December 31, 2020 (dollars in thousands):
|
| September 30, 2021 |
|
| December 31, 2020 |
| ||||||||||
|
| Current |
|
| Non-Current |
|
| Current |
|
| Non-Current |
| ||||
Regulatory Assets |
|
|
|
|
|
|
|
|
|
|
|
| ||||
Energy commodity derivatives |
| $ | 11,159 |
|
| $ | 0 |
|
| $ | 2,073 |
|
| $ | 5,722 |
|
Decoupling surcharge |
|
| 9,036 |
|
|
| 12,641 |
|
|
| 7,123 |
|
|
| 17,123 |
|
Deferred natural gas costs |
|
| 9,967 |
|
|
| 4,758 |
|
|
| 2,308 |
|
|
| 0 |
|
Deferred power costs |
|
| 7,606 |
|
|
| 4,043 |
|
|
| 1,775 |
|
|
| 1,562 |
|
Pension and other postretirement benefit plans |
|
| 0 |
|
|
| 192,220 |
|
|
| 0 |
|
|
| 198,746 |
|
Interest rate swaps |
|
| 0 |
|
|
| 195,909 |
|
|
| 0 |
|
|
| 214,851 |
|
Deferred income taxes (1) |
|
| 0 |
|
|
| 242,782 |
|
|
| 0 |
|
|
| 108,517 |
|
Settlement with Coeur d'Alene Tribe |
|
| 0 |
|
|
| 39,205 |
|
|
| 0 |
|
|
| 40,043 |
|
AFUDC above FERC allowed rate |
|
| 0 |
|
|
| 45,093 |
|
|
| 0 |
|
|
| 47,393 |
|
Demand side management programs |
|
| 0 |
|
|
| 3,124 |
|
|
| 0 |
|
|
| 3,814 |
|
Utility plant to be abandoned |
|
| 0 |
|
|
| 29,684 |
|
|
| 0 |
|
|
| 28,916 |
|
COVID-19 deferrals |
|
| 0 |
|
|
| 15,648 |
|
|
| 0 |
|
|
| 8,166 |
|
Other regulatory assets |
|
| 0 |
|
|
| 90,845 |
|
|
| 394 |
|
|
| 75,590 |
|
Total regulatory assets |
| $ | 37,768 |
|
| $ | 875,952 |
|
| $ | 13,673 |
|
| $ | 750,443 |
|
Regulatory Liabilities |
|
|
|
|
|
|
|
|
|
|
|
| ||||
Income tax related liabilities (1) |
| $ | 52,843 |
|
| $ | 475,607 |
|
| $ | 14,952 |
|
| $ | 399,677 |
|
Deferred power costs |
|
| 10,512 |
|
|
| 9,136 |
|
|
| 20,299 |
|
|
| 17,570 |
|
Decoupling rebate |
|
| 2,717 |
|
|
| 10,283 |
|
|
| 1,447 |
|
|
| 1,519 |
|
Utility plant retirement costs |
|
| 0 |
|
|
| 344,061 |
|
|
| 0 |
|
|
| 325,832 |
|
Interest rate swaps |
|
| 0 |
|
|
| 16,757 |
|
|
| 0 |
|
|
| 15,046 |
|
COVID-19 deferrals |
|
| 0 |
|
|
| 12,673 |
|
|
| 0 |
|
|
| 10,949 |
|
Other regulatory liabilities |
|
| 9,487 |
|
|
| 17,834 |
|
|
| 9,737 |
|
|
| 14,227 |
|
Total regulatory liabilities |
| $ | 75,559 |
|
| $ | 886,351 |
|
| $ | 46,435 |
|
| $ | 784,820 |
|
(1) In 2021, the Company received regulatory approval in all jurisdictions to change to flow-through tax treatment of certain basis adjustments, which was $128.8 million as of September 30, 2021.
NOTE 4. REVENUE
The revenue recognition model contained in ASC 606 requires an entity to identify the various performance obligations in a contract, allocate the transaction price among the performance obligations and recognize revenue when (or as) the entity satisfies each performance obligation.
14
AVISTA CORPORATION
Utility Revenues
Revenue from Contracts with Customers
General
The majority of Avista Corp.’s revenue is from rate-regulated sales of electricity and natural gas to retail customers, which has two performance obligations, (1) having service available for a specified period (typically a month at a time) and (2) the delivery of energy to customers. The total energy price generally has a fixed component (basic charge) related to having service available and a usage-based component, related to the delivery and consumption of energy. The commodity is sold and/or delivered to and consumed by the customer simultaneously, and the provisions of the relevant utility commission authorization determine the charges the Company may bill the customer. Given that all revenue recognition criteria are met upon the delivery of energy to customers, revenue is recognized immediately at that time.
Revenues from contracts with customers are presented in the Condensed Consolidated Statements of Income in the line item "Utility revenues, exclusive of alternative revenue programs."
Non-Derivative Wholesale Contracts
The Company has certain wholesale contracts which are not accounted for as derivatives and, accordingly, are within the scope of ASC 606 and considered revenue from contracts with customers. Revenue is recognized as energy is delivered to the customer or the service is available for a specified period of time, consistent with the discussion of rate-regulated sales above.
Alternative Revenue Programs (Decoupling)
ASC 606 retained existing GAAP associated with alternative revenue programs, which specified that alternative revenue programs are contracts between an entity and a regulator of utilities, not a contract between an entity and a customer. GAAP requires that an entity present revenue arising from alternative revenue programs separately from revenues arising from contracts with customers on the face of the Condensed Consolidated Statements of Income. The Company's decoupling mechanisms (also known as a FCA in Idaho) qualify as alternative revenue programs. Decoupling revenue deferrals are recognized in the Condensed Consolidated Statements of Income during the period they occur (i.e. during the period of revenue shortfall or excess due to fluctuations in customer usage), subject to certain limitations, and a regulatory asset or liability is established that will be surcharged or rebated to customers in future periods. GAAP requires that for any alternative revenue program, like decoupling, the revenue must be expected to be collected from customers within 24 months of the deferral to qualify for recognition in the current period Condensed Consolidated Statement of Income. Any amounts included in the Company's decoupling program that are not expected to be collected from customers within 24 months are not recorded in the financial statements until the period in which revenue recognition criteria are met. The amounts expected to be collected from customers within 24 months represents an estimate that must be made by the Company on an ongoing basis due to it being based on the volumes of electric and natural gas sold to customers on a go-forward basis.
Derivative Revenue
Most wholesale electric and natural gas transactions (including both physical and financial transactions), and the sale of fuel are considered derivatives, which are specifically scoped out of ASC 606. As such, these revenues are disclosed separately from revenue from contracts with customers. Revenue is recognized for these items upon the settlement/expiration of the derivative contract. Derivative revenue includes those transactions that are entered into and settled within the same month.
Other Utility Revenue
Other utility revenue includes rent, sales of materials, late fees and other charges that do not represent contracts with customers. Other utility revenue also includes the provision for earnings sharing. This revenue is scoped out of ASC 606, as this revenue does not represent items where a customer is a party that has contracted with the Company to obtain goods or services that are an output of the
15
AVISTA CORPORATION
Company’s ordinary activities in exchange for consideration. As such, these revenues are presented separately from revenue from contracts with customers.
Other Considerations for Utility Revenues
Gross Versus Net Presentation
Revenues and resource costs from Avista Utilities’ settled energy contracts that are “booked out” (not physically delivered) are reported on a net basis as part of derivative revenues.
Utility-related taxes collected from customers (primarily state excise taxes and city utility taxes) are taxes that are imposed on Avista Utilities as opposed to being imposed on its customers; therefore, Avista Utilities is the taxpayer and records these transactions on a gross basis in revenue from contracts with customers and operating expense (taxes other than income taxes). The utility-related taxes collected from customers at AEL&P are imposed on the customers rather than AEL&P; therefore, the customers are the taxpayers and AEL&P is acting as their agent. As such, these transactions at AEL&P are presented on a net basis within revenue from contracts with customers.
Utility-related taxes that were included in revenue from contracts with customers were as follows for the three and nine months ended September 30 (dollars in thousands):
| Three months ended September 30, |
|
| Nine months ended September 30, |
| ||||||||||
| 2021 |
|
| 2020 |
|
| 2021 |
|
| 2020 |
| ||||
Utility-related taxes | $ | 13,816 |
|
| $ | 12,411 |
|
| $ | 46,971 |
|
| $ | 43,989 |
|
Significant Judgments and Unsatisfied Performance Obligations
The only significant judgments involving revenue recognition are estimates surrounding unbilled revenue and receivables from contracts with customers and estimates surrounding the amount of decoupling revenues that will be collected from customers within 24 months (discussed above).
The Company has certain capacity arrangements, where the Company has a contractual obligation to provide either electric or natural gas capacity to its customers for a fixed fee. Most of these arrangements are paid for in arrears by the customers and do not result in deferred revenue and only result in receivables from the customers. The Company does have one capacity agreement where the customer makes payments throughout the year. As of September 30, 2021, the Company estimates it had unsatisfied capacity performance obligations of $18.8 million, which will be recognized as revenue in future periods as the capacity is provided to the customers. These performance obligations are not reflected in the financial statements, as the Company has not received payment for these services.
16
AVISTA CORPORATION
Disaggregation of Total Operating Revenue
The following table disaggregates total operating revenue by segment and source for the three and nine months ended September 30 (dollars in thousands):
|
| Three months ended September 30, |
|
| Nine months ended September 30, |
| ||||||||||
|
| 2021 |
|
| 2020 |
|
| 2021 |
|
| 2020 |
| ||||
Avista Utilities |
|
|
|
|
|
|
|
|
|
|
|
| ||||
Revenue from contracts with customers |
| $ | 266,789 |
|
| $ | 240,036 |
|
| $ | 886,078 |
|
| $ | 827,071 |
|
Derivative revenues |
|
| 28,087 |
|
|
| 24,075 |
|
|
| 91,151 |
|
|
| 79,361 |
|
Alternative revenue programs |
|
| (10,499 | ) |
|
| (3,972 | ) |
|
| (13,069 | ) |
|
| (4,023 | ) |
Deferrals and amortizations for rate refunds to customers |
|
| (156 | ) |
|
| 1,742 |
|
|
| 2,664 |
|
|
| 1,216 |
|
Other utility revenues |
|
| 2,531 |
|
|
| 1,683 |
|
|
| 7,348 |
|
|
| 5,484 |
|
Total Avista Utilities |
|
| 286,752 |
|
|
| 263,564 |
|
|
| 974,172 |
|
|
| 909,109 |
|
AEL&P |
|
|
|
|
|
|
|
|
|
|
|
| ||||
Revenue from contracts with customers |
|
| 9,065 |
|
|
| 8,797 |
|
|
| 32,331 |
|
|
| 30,900 |
|
Deferrals and amortizations for rate refunds to customers |
|
| (48 | ) |
|
| (48 | ) |
|
| (143 | ) |
|
| (143 | ) |
Other utility revenues |
|
| 130 |
|
|
| 66 |
|
|
| 327 |
|
|
| 257 |
|
Total AEL&P |
|
| 9,147 |
|
|
| 8,815 |
|
|
| 32,515 |
|
|
| 31,014 |
|
|
|
|
|
|
|
|
|
|
|
|
|
| ||||
Other revenues |
|
| 108 |
|
|
| 267 |
|
|
| 445 |
|
|
| 1,345 |
|
Total operating revenues |
| $ | 296,007 |
|
| $ | 272,646 |
|
| $ | 1,007,132 |
|
| $ | 941,468 |
|
Utility Revenue from Contracts with Customers by Type and Service
The following table disaggregates revenue from contracts with customers associated with the Company's electric operations for the three and nine months ended September 30 (dollars in thousands):
|
| 2021 |
|
| 2020 |
| ||||||||||||||||||
|
| Avista |
|
| AEL&P |
|
| Total Utility |
|
| Avista |
|
| AEL&P |
|
| Total Utility |
| ||||||
Three months ended September 30: |
|
|
|
|
|
|
|
|
|
|
|
|
|
|
|
|
|
| ||||||
ELECTRIC OPERATIONS |
|
|
|
|
|
|
|
|
|
|
|
|
|
|
|
|
|
| ||||||
Revenue from contracts with customers |
|
|
|
|
|
|
|
|
|
|
|
|
|
|
|
|
|
| ||||||
Residential |
| $ | 94,803 |
|
| $ | 3,080 |
|
| $ | 97,883 |
|
| $ | 85,494 |
|
| $ | 3,150 |
|
| $ | 88,644 |
|
Commercial |
|
| 86,228 |
|
|
| 5,920 |
|
|
| 92,148 |
|
|
| 79,242 |
|
|
| 5,582 |
|
|
| 84,824 |
|
Industrial |
|
| 28,843 |
|
|
| 0 |
|
|
| 28,843 |
|
|
| 28,472 |
|
|
| 0 |
|
|
| 28,472 |
|
Public street and highway lighting |
|
| 1,877 |
|
|
| 65 |
|
|
| 1,942 |
|
|
| 1,845 |
|
|
| 65 |
|
|
| 1,910 |
|
Total retail revenue |
|
| 211,751 |
|
|
| 9,065 |
|
|
| 220,816 |
|
|
| 195,053 |
|
|
| 8,797 |
|
|
| 203,850 |
|
Transmission |
|
| 7,372 |
|
|
| 0 |
|
|
| 7,372 |
|
|
| 5,938 |
|
|
| 0 |
|
|
| 5,938 |
|
Other revenue from contracts with |
|
| 11,610 |
|
|
| 0 |
|
|
| 11,610 |
|
|
| 4,551 |
|
|
| 0 |
|
|
| 4,551 |
|
Total electric revenue from contracts |
| $ | 230,733 |
|
| $ | 9,065 |
|
| $ | 239,798 |
|
| $ | 205,542 |
|
| $ | 8,797 |
|
| $ | 214,339 |
|
Nine months ended September 30: |
|
|
|
|
|
|
|
|
|
|
|
|
|
|
|
|
|
| ||||||
ELECTRIC OPERATIONS |
|
|
|
|
|
|
|
|
|
|
|
|
|
|
|
|
|
| ||||||
Revenue from contracts with customers |
|
|
|
|
|
|
|
|
|
|
|
|
|
|
|
|
|
| ||||||
Residential |
| $ | 292,714 |
|
| $ | 13,379 |
|
| $ | 306,093 |
|
| $ | 272,231 |
|
| $ | 13,236 |
|
| $ | 285,467 |
|
Commercial |
|
| 243,370 |
|
|
| 18,768 |
|
|
| 262,138 |
|
|
| 226,876 |
|
|
| 17,479 |
|
|
| 244,355 |
|
Industrial |
|
| 80,983 |
|
|
| 0 |
|
|
| 80,983 |
|
|
| 77,999 |
|
|
| 0 |
|
|
| 77,999 |
|
Public street and highway lighting |
|
| 5,598 |
|
|
| 184 |
|
|
| 5,782 |
|
|
| 5,474 |
|
|
| 185 |
|
|
| 5,659 |
|
Total retail revenue |
|
| 622,665 |
|
|
| 32,331 |
|
|
| 654,996 |
|
|
| 582,580 |
|
|
| 30,900 |
|
|
| 613,480 |
|
Transmission |
|
| 15,668 |
|
|
| 0 |
|
|
| 15,668 |
|
|
| 14,121 |
|
|
| 0 |
|
|
| 14,121 |
|
Other revenue from contracts with |
|
| 24,282 |
|
|
| 0 |
|
|
| 24,282 |
|
|
| 13,256 |
|
|
| 0 |
|
|
| 13,256 |
|
Total electric revenue from contracts |
| $ | 662,615 |
|
| $ | 32,331 |
|
| $ | 694,946 |
|
| $ | 609,957 |
|
| $ | 30,900 |
|
| $ | 640,857 |
|
17
AVISTA CORPORATION
The following table disaggregates revenue from contracts with customers associated with the Company's natural gas operations for the three and nine months ended September 30 (dollars in thousands):
|
| Three months ended September 30, |
|
| Nine months ended September 30, |
| ||||||||||
|
| 2021 |
|
| 2020 |
|
| 2021 |
|
| 2020 |
| ||||
|
| Avista Utilities |
|
| Avista Utilities |
|
| Avista Utilities |
|
| Avista Utilities |
| ||||
NATURAL GAS OPERATIONS |
|
|
|
|
|
|
|
|
|
|
|
| ||||
Revenue from contracts with customers |
|
|
|
|
|
|
|
|
|
|
|
| ||||
Residential |
| $ | 21,197 |
|
| $ | 20,835 |
|
| $ | 142,401 |
|
| $ | 139,833 |
|
Commercial |
|
| 10,055 |
|
|
| 9,340 |
|
|
| 65,428 |
|
|
| 62,883 |
|
Industrial and interruptible |
|
| 1,477 |
|
|
| 1,538 |
|
|
| 5,520 |
|
|
| 5,276 |
|
Total retail revenue |
|
| 32,729 |
|
|
| 31,713 |
|
|
| 213,349 |
|
|
| 207,992 |
|
Transportation |
|
| 1,921 |
|
|
| 1,656 |
|
|
| 6,177 |
|
|
| 5,747 |
|
Other revenue from contracts with customers |
|
| 1,406 |
|
|
| 1,125 |
|
|
| 3,937 |
|
|
| 3,375 |
|
Total natural gas revenue from contracts with customers |
| $ | 36,056 |
|
| $ | 34,494 |
|
| $ | 223,463 |
|
| $ | 217,114 |
|
NOTE 5. DERIVATIVES AND RISK MANAGEMENT
Energy Commodity Derivatives
Avista Corp. is exposed to market risks relating to changes in electricity and natural gas commodity prices and certain other fuel prices. Market risk is, in general, the risk of fluctuation in the market price of the commodity being traded and is influenced primarily by supply and demand. Market risk includes the fluctuation in the market price of associated derivative commodity instruments. Avista Corp. utilizes derivative instruments, such as forwards, futures, swap derivatives and options, in order to manage the various risks relating to these commodity price exposures. Avista Corp. has an energy resources risk policy and control procedures to manage these risks.
As part of Avista Corp.'s resource procurement and management operations in the electric business, Avista Corp. engages in an ongoing process of resource optimization, which involves the economic selection from available energy resources to serve Avista Corp.'s load obligations and the use of these resources to capture available economic value through wholesale market transactions. These include sales and purchases of electric capacity and energy, fuel for electric generation, and derivative contracts related to capacity, energy and fuel. Such transactions are part of the process of matching resources with load obligations and hedging a portion of the related financial risks. These transactions range from terms of intra-hour up to multiple years.
As part of its resource procurement and management of its natural gas business, Avista Corp. makes continuing projections of its natural gas loads and assesses available natural gas resources including natural gas storage availability. Natural gas resource planning typically includes peak requirements, low and average monthly requirements and delivery constraints from natural gas supply locations to Avista Corp.’s distribution system. However, daily variations in natural gas demand can be significantly different than monthly demand projections. On the basis of these projections, Avista Corp. plans and executes a series of transactions to hedge a portion of its projected natural gas requirements through forward market transactions and derivative instruments. These transactions may extend as much as three natural gas operating years (November through October) into the future. Avista Corp. also leaves a significant portion of its natural gas supply requirements unhedged for purchase in short-term and spot markets.
Avista Corp. plans for sufficient natural gas delivery capacity to serve its retail customers for a theoretical peak day event. Avista Corp. generally has more pipeline and storage capacity than what is needed during periods other than a peak-day. Avista Corp. optimizes its natural gas resources by using market opportunities to generate economic value that mitigates the fixed costs. Avista Corp. also optimizes its natural gas storage capacity by purchasing and storing natural gas when prices are traditionally lower, typically in the summer, and withdrawing during higher priced months, typically during the winter. However, if market conditions and prices indicate that Avista Corp. should buy or sell natural gas at other times during the year, Avista Corp. engages in optimization transactions to capture value in the marketplace. Natural gas optimization activities include, but are not limited to, wholesale market sales of surplus natural gas supplies, purchases and sales of natural gas to optimize use of pipeline and storage capacity, and participation in the transportation capacity release market.
18
AVISTA CORPORATION
The following table presents the underlying energy commodity derivative volumes as of September 30, 2021 that are expected to be delivered in each respective year (in thousands of MWhs and mmBTUs):
|
| Purchases |
|
| Sales |
| ||||||||||||||||||||||||||
|
| Electric Derivatives |
|
| Gas Derivatives |
|
| Electric Derivatives |
|
| Gas Derivatives |
| ||||||||||||||||||||
Year |
| Physical |
|
| Financial |
|
| Physical |
|
| Financial |
|
| Physical |
|
| Financial |
|
| Physical |
|
| Financial |
| ||||||||
Remainder 2021 |
|
| 0 |
|
|
| 31 |
|
|
| 4,891 |
|
|
| 24,320 |
|
|
| 18 |
|
|
| 103 |
|
|
| 2,587 |
|
|
| 13,033 |
|
2022 |
|
| 123 |
|
|
| 0 |
|
|
| 2,250 |
|
|
| 52,353 |
|
|
| 216 |
|
|
| 370 |
|
|
| 2,260 |
|
|
| 28,898 |
|
2023 |
|
| 0 |
|
|
| 0 |
|
|
| 0 |
|
|
| 18,825 |
|
|
| 0 |
|
|
| 0 |
|
|
| 1,360 |
|
|
| 7,060 |
|
2024 |
|
| 0 |
|
|
| 0 |
|
|
| 0 |
|
|
| 2,275 |
|
|
| 0 |
|
|
| 0 |
|
|
| 1,370 |
|
|
| 0 |
|
2025 |
|
| 0 |
|
|
| 0 |
|
|
| 0 |
|
|
| 0 |
|
|
| 0 |
|
|
| 0 |
|
|
| 1,115 |
|
|
| 0 |
|
As of September 30, 2021, there are 0 expected deliveries of energy commodity derivatives after 2025.
The following table presents the underlying energy commodity derivative volumes as of December 31, 2020 that are expected to be delivered in each respective year (in thousands of MWhs and mmBTUs):
|
| Purchases |
|
| Sales |
| ||||||||||||||||||||||||||
|
| Electric Derivatives |
|
| Gas Derivatives |
|
| Electric Derivatives |
|
| Gas Derivatives |
| ||||||||||||||||||||
Year |
| Physical |
|
| Financial |
|
| Physical |
|
| Financial |
|
| Physical |
|
| Financial |
|
| Physical |
|
| Financial |
| ||||||||
2021 |
|
| 1 |
|
|
| 224 |
|
|
| 10,353 |
|
|
| 65,188 |
|
|
| 17 |
|
|
| 451 |
|
|
| 5,448 |
|
|
| 39,273 |
|
2022 |
|
| 0 |
|
|
| 0 |
|
|
| 450 |
|
|
| 25,525 |
|
|
| 0 |
|
|
| 0 |
|
|
| 1,360 |
|
|
| 12,030 |
|
2023 |
|
| 0 |
|
|
| 0 |
|
|
| 0 |
|
|
| 4,950 |
|
|
| 0 |
|
|
| 0 |
|
|
| 1,360 |
|
|
| 900 |
|
2024 |
|
| 0 |
|
|
| 0 |
|
|
| 0 |
|
|
| 0 |
|
|
| 0 |
|
|
| 0 |
|
|
| 1,370 |
|
|
| 0 |
|
2025 |
|
| 0 |
|
|
| 0 |
|
|
| 0 |
|
|
| 0 |
|
|
| 0 |
|
|
| 0 |
|
|
| 1,115 |
|
|
| 0 |
|
As of December 31, 2020, there are 0 expected deliveries of energy commodity derivatives after 2025.
The electric and natural gas derivative contracts above will be included in either power supply costs or natural gas supply costs during the period they are scheduled to be delivered and will be included in the various deferral and recovery mechanisms (ERM, PCA and PGAs), or in the general rate case process, and are expected to be collected through retail rates from customers.
Foreign Currency Exchange Derivatives
A significant portion of Avista Corp.’s natural gas supply (including fuel for power generation) is obtained from Canadian sources. Most of those transactions are executed in U.S. dollars, which avoids foreign currency risk. A portion of Avista Corp.’s short-term natural gas transactions and long-term Canadian transportation contracts are committed based on Canadian currency prices. The short-term natural gas transactions are settled within 60 days with U.S. dollars. Avista Corp. hedges a portion of the foreign currency risk by purchasing Canadian currency exchange derivatives when such commodity transactions are initiated. The foreign currency exchange derivatives and the unhedged foreign currency risk have not had a material effect on Avista Corp.’s financial condition, results of operations or cash flows and these differences in cost related to currency fluctuations are included with natural gas supply costs for ratemaking.
The following table summarizes the foreign currency exchange derivatives that Avista Corp. has outstanding as of September 30, 2021 and December 31, 2020 (dollars in thousands):
|
| September 30, |
|
| December 31, |
| ||
Number of contracts |
|
| 22 |
|
|
| 22 |
|
Notional amount (in United States dollars) |
| $ | 7,692 |
|
| $ | 3,860 |
|
Notional amount (in Canadian dollars) |
|
| 9,739 |
|
|
| 4,949 |
|
19
AVISTA CORPORATION
Interest Rate Swap Derivatives
Avista Corp. is affected by fluctuating interest rates related to a portion of its existing debt, and future borrowing requirements. Avista Corp. hedges a portion of its interest rate risk with financial derivative instruments, which may include interest rate swap derivatives and U.S. Treasury lock agreements. These interest rate swap derivatives and U.S. Treasury lock agreements are considered economic hedges against fluctuations in future cash flows associated with anticipated debt issuances.
The following table summarizes the unsettled interest rate swap derivatives that Avista Corp. has outstanding as of September 30, 2021 and December 31, 2020 (dollars in thousands):
Balance Sheet Date |
| Number of |
|
| Notional |
|
| Mandatory | ||
September 30, 2021 |
|
| 13 |
|
| $ | 140,000 |
|
| 2022 |
|
|
| 2 |
|
|
| 20,000 |
|
| 2023 |
|
|
| 1 |
|
|
| 10,000 |
|
| 2024 |
December 31, 2020 |
|
| 4 |
|
| $ | 45,000 |
|
| 2021 |
|
|
| 11 |
|
|
| 120,000 |
|
| 2022 |
|
|
| 1 |
|
|
| 10,000 |
|
| 2023 |
The fair value of outstanding interest rate swap derivatives can vary significantly from period to period depending on the total notional amount of swap derivatives outstanding and fluctuations in market interest rates compared to the interest rates fixed by the swaps. Avista Corp. is required to make cash payments to settle the interest rate swap derivatives when the fixed rates are higher than prevailing market rates at the date of settlement. Conversely, Avista Corp. receives cash to settle its interest rate swap derivatives when prevailing market rates at the time of settlement exceed the fixed swap rates.
Summary of Outstanding Derivative Instruments
The amounts recorded on the Condensed Consolidated Balance Sheet as of September 30, 2021 and December 31, 2020 reflect the offsetting of derivative assets and liabilities where a legal right of offset exists.
The following table presents the fair values and locations of derivative instruments recorded on the Condensed Consolidated Balance Sheet as of September 30, 2021 (in thousands):
|
| Fair Value |
| |||||||||||||
Derivative and Balance Sheet Location |
| Gross |
|
| Gross |
|
| Collateral |
|
| Net Asset |
| ||||
Foreign currency exchange derivatives |
|
|
|
|
|
|
|
|
|
|
|
| ||||
Other current liabilities |
| $ | 0 |
|
| $ | (86 | ) |
| $ | 0 |
|
| $ | (86 | ) |
Interest rate swap derivatives |
|
|
|
|
|
|
|
|
|
|
|
| ||||
Other property and investments-net and other non-current assets |
|
| 2,477 |
|
|
| 0 |
|
|
| 0 |
|
|
| 2,477 |
|
Other current liabilities |
|
| 2,072 |
|
|
| (20,732 | ) |
|
| 0 |
|
|
| (18,660 | ) |
Energy commodity derivatives |
|
|
|
|
|
|
|
|
|
|
|
| ||||
Other current assets |
|
| 49,933 |
|
|
| (42,664 | ) |
|
| 0 |
|
|
| 7,269 |
|
Other property and investments-net and other non-current assets |
|
| 12,587 |
|
|
| (5,895 | ) |
|
| 0 |
|
|
| 6,692 |
|
Other current liabilities |
|
| 12,539 |
|
|
| (30,933 | ) |
|
| 12,343 |
|
|
| (6,051 | ) |
Other non-current liabilities and deferred credits |
|
| 108 |
|
|
| (5,688 | ) |
|
| 0 |
|
|
| (5,580 | ) |
Total derivative instruments recorded on the balance sheet |
| $ | 79,716 |
|
| $ | (105,998 | ) |
| $ | 12,343 |
|
| $ | (13,939 | ) |
20
AVISTA CORPORATION
The following table presents the fair values and locations of derivative instruments recorded on the Condensed Consolidated Balance Sheet as of December 31, 2020 (in thousands):
|
| Fair Value |
| |||||||||||||
Derivative and Balance Sheet Location |
| Gross |
|
| Gross |
|
| Collateral |
|
| Net Asset |
| ||||
Foreign currency exchange derivatives |
|
|
|
|
|
|
|
|
|
|
|
| ||||
Other current assets |
| $ | 30 |
|
| $ | 0 |
|
| $ | 0 |
|
| $ | 30 |
|
Interest rate swap derivatives |
|
|
|
|
|
|
|
|
|
|
|
| ||||
Other current liabilities |
|
| 0 |
|
|
| (19,575 | ) |
|
| 8,050 |
|
|
| (11,525 | ) |
Other non-current liabilities and deferred credits |
|
| 952 |
|
|
| (32,190 | ) |
|
| 0 |
|
|
| (31,238 | ) |
Energy commodity derivatives |
|
|
|
|
|
|
|
|
|
|
|
| ||||
Other current assets |
|
| 9,203 |
|
|
| (8,306 | ) |
|
| 0 |
|
|
| 897 |
|
Other property and investments-net and other non-current assets |
|
| 1,755 |
|
|
| (1,159 | ) |
|
| 0 |
|
|
| 596 |
|
Other current liabilities |
|
| 11,037 |
|
|
| (14,007 | ) |
|
| 487 |
|
|
| (2,483 | ) |
Other non-current liabilities and deferred credits |
|
| 1,725 |
|
|
| (8,043 | ) |
|
| 129 |
|
|
| (6,189 | ) |
Total derivative instruments recorded on the balance sheet |
| $ | 24,702 |
|
| $ | (83,280 | ) |
| $ | 8,666 |
|
| $ | (49,912 | ) |
Exposure to Demands for Collateral
Avista Corp.'s derivative contracts often require collateral (in the form of cash or letters of credit) or other credit enhancements, or reductions or terminations of a portion of the contract through cash settlement. In the event of a downgrade in Avista Corp.'s credit ratings or changes in market prices, additional collateral may be required. In periods of price volatility, the level of exposure can change significantly. As a result, sudden and significant demands may be made against Avista Corp.'s credit facilities and cash. Avista Corp. actively monitors the exposure to possible collateral calls and takes steps to mitigate capital requirements.
The following table presents Avista Corp.'s collateral outstanding related to its derivative instruments as of September 30, 2021 and December 31, 2020 (in thousands):
|
| September 30, |
|
| December 31, |
| ||
|
| 2021 |
|
| 2020 |
| ||
Energy commodity derivatives |
|
|
|
|
|
| ||
Cash collateral posted |
| $ | 22,947 |
|
| $ | 4,953 |
|
Letters of credit outstanding |
|
| 21,500 |
|
|
| 23,500 |
|
Balance sheet offsetting |
|
| 12,343 |
|
|
| 616 |
|
Interest rate swap derivatives |
|
|
|
|
|
| ||
Cash collateral posted (offset by net derivative positions) |
|
| 0 |
|
|
| 8,050 |
|
Certain of Avista Corp.’s derivative instruments contain provisions that require Avista Corp. to maintain an "investment grade" credit rating from the major credit rating agencies. If Avista Corp.’s credit ratings were to fall below "investment grade," it would be in violation of these provisions, and the counterparties to the derivative instruments could request immediate payment or demand immediate and ongoing collateralization on derivative instruments in net liability positions.
The following table presents the aggregate fair value of all derivative instruments with credit-risk-related contingent features that are in a liability position and the amount of additional collateral Avista Corp. could be required to post as of September 30, 2021 and December 31, 2020 (in thousands):
|
| September 30, |
|
| December 31, |
| ||
|
| 2021 |
|
| 2020 |
| ||
Interest rate swap derivatives |
|
|
|
|
|
| ||
Liabilities with credit-risk-related contingent features |
|
| 20,732 |
|
|
| 50,813 |
|
Additional collateral to post |
|
| 20,732 |
|
|
| 42,763 |
|
21
AVISTA CORPORATION
NOTE 6. PENSION PLANS AND OTHER POSTRETIREMENT BENEFIT PLANS
Avista Utilities
Avista Utilities’ maintained the same pension and other postretirement plans during the nine months ended September 30, 2021 as those described as of December 31, 2020. The Company contributed $42 million in cash to the pension plan for the nine months ended September 30, 2021, the full amount it expects to contribute in 2021.
The Company uses a December 31 measurement date for its defined benefit pension and other postretirement benefit plans. The following table sets forth the components of net periodic benefit costs for the three and nine months ended September 30 (dollars in thousands):
|
| Pension Benefits |
|
| Other Postretirement Benefits |
| ||||||||||
|
| 2021 |
|
| 2020 |
|
| 2021 |
|
| 2020 |
| ||||
Three months ended September 30: |
|
|
|
|
|
|
|
|
|
|
|
| ||||
Service cost |
| $ | 6,412 |
|
| $ | 5,549 |
|
| $ | 1,062 |
|
| $ | 982 |
|
Interest cost |
|
| 6,528 |
|
|
| 6,968 |
|
|
| 1,305 |
|
|
| 1,524 |
|
Expected return on plan assets |
|
| (9,835 | ) |
|
| (8,625 | ) |
|
| (509 | ) |
|
| (590 | ) |
Amortization of prior service cost |
|
| 75 |
|
|
| 75 |
|
|
| (275 | ) |
|
| (275 | ) |
Net loss recognition |
|
| 1,592 |
|
|
| 1,678 |
|
|
| 777 |
|
|
| 1,243 |
|
Net periodic benefit cost |
| $ | 4,772 |
|
| $ | 5,645 |
|
| $ | 2,360 |
|
| $ | 2,884 |
|
Nine months ended September 30: |
|
|
|
|
|
|
|
|
|
|
|
| ||||
Service cost |
| $ | 18,912 |
|
| $ | 16,645 |
|
| $ | 2,967 |
|
| $ | 2,941 |
|
Interest cost |
|
| 19,638 |
|
|
| 20,906 |
|
|
| 3,990 |
|
|
| 4,563 |
|
Expected return on plan assets |
|
| (29,314 | ) |
|
| (26,375 | ) |
|
| (1,967 | ) |
|
| (1,810 | ) |
Amortization of prior service cost |
|
| 225 |
|
|
| 225 |
|
|
| (825 | ) |
|
| (825 | ) |
Net loss recognition |
|
| 5,103 |
|
|
| 5,011 |
|
|
| 3,196 |
|
|
| 3,729 |
|
Net periodic benefit cost |
| $ | 14,564 |
|
| $ | 16,412 |
|
| $ | 7,361 |
|
| $ | 8,598 |
|
Total service costs in the table above are recorded to the same accounts as labor expense. Labor and benefits expense is recorded to various projects based on whether the work is a capital project or an operating expense. Approximately 40 percent of all labor and benefits is capitalized to utility property and 60 percent is expensed to utility other operating expenses.
The non-service portion of costs in the table above are recorded to other expense below income from operations in the Condensed Consolidated Statements of Income or capitalized as a regulatory asset. Approximately 40 percent of the costs are capitalized to regulatory assets and 60 percent is expensed to the income statement.
NOTE 7. INCOME TAXES
In accordance with interim reporting requirements, the Company uses an estimated annual effective tax rate for computing its provisions for income taxes. An estimate of annual income tax expense (or benefit) is made each interim period using estimates for annual pre-tax income, income tax adjustments, and tax credits. The estimated annual effective tax rates do not include discrete events such as tax law changes, examination settlements, accounting method changes, or adjustments to tax expense or benefits attributable to prior years. Discrete events are recorded in the interim period in which they occur or become known. The estimated annual tax rate is applied to year-to-date pre-tax income to determine income tax expense (or benefit) for the interim period consistent with the annual estimate. In subsequent interim periods, income tax expense (or benefit) for the period is computed as the difference between the year-to-date amount reported for the previous interim period and the current period’s year-to-date amount.
22
AVISTA CORPORATION
The following table summarizes the significant factors impacting the difference between our effective tax rate and the federal statutory rate for the three and nine months ended September 30 (dollars in thousands):
|
| Three months ended September 30, |
|
| Nine months ended September 30, |
| ||||||||||||||||||||||||||
|
| 2021 |
|
| 2020 |
|
| 2021 |
|
| 2020 |
| ||||||||||||||||||||
Federal income taxes at statutory rates |
| $ | 1,876 |
|
|
| 21.0 | % |
| $ | 1,204 |
|
|
| 21.0 | % |
| $ | 22,173 |
|
|
| 21.0 | % |
| $ | 15,167 |
|
|
| 21.0 | % |
Increase (decrease) in tax resulting from: |
|
|
|
|
|
|
|
|
|
|
|
|
|
|
|
|
|
|
|
|
|
|
|
| ||||||||
Tax effect of regulatory treatment of utility |
|
| (3,277 | ) |
|
| (36.7 | ) |
|
| (2,427 | ) |
|
| (42.3 | ) |
|
| (9,721 | ) |
|
| (9.2 | ) |
|
| (7,244 | ) |
|
| (10.0 | ) |
State income tax expense |
|
| 143 |
|
|
| 1.6 |
|
|
| (363 | ) |
|
| (6.3 | ) |
|
| 975 |
|
|
| 0.9 |
|
|
| 539 |
|
|
| 0.7 |
|
Non-plant excess deferred turnaround (1) |
|
| 0 |
|
|
| 0 |
|
|
| 0 |
|
|
| 0 |
|
|
| 0 |
|
|
| 0 |
|
|
| (8,476 | ) |
|
| (11.8 | ) |
Settlement of prior year tax returns |
|
| (400 | ) |
|
| (4.5 | ) |
|
| 524 |
|
|
| 9.1 |
|
|
| (400 | ) |
|
| (0.4 | ) |
|
| 1,565 |
|
|
| 2.2 |
|
Flow through related to deduction of meters |
|
| (5,277 | ) |
|
| (59.0 | ) |
|
| 0 |
|
|
| 0 |
|
|
| (5,277 | ) |
|
| (5.0 | ) |
|
| 0 |
|
|
| 0 |
|
Settlement of equity awards |
|
| 0 |
|
|
| 0 |
|
|
| 0 |
|
|
| 0 |
|
|
| 909 |
|
|
| 0.9 |
|
|
| 165 |
|
|
| 0.2 |
|
Other |
|
| 1,503 |
|
|
| 16.8 |
|
|
| 1,921 |
|
|
| 33.5 |
|
|
| 471 |
|
|
| 0.4 |
|
|
| (244 | ) |
|
| (0.3 | ) |
Total income tax expense (benefit) |
| $ | (5,432 | ) |
|
| (60.8 | )% |
| $ | 859 |
|
|
| 15.0 | % |
| $ | 9,130 |
|
|
| 8.6 | % |
| $ | 1,472 |
|
|
| 2.0 | % |
NOTE 8. COMMITTED LINES OF CREDIT
Avista Corp.
Avista Corp. has a committed line of credit with various financial institutions in the total amount of $400.0 million. In June 2021, the Company entered into an amendment to its committed line of credit that extends the expiration date to June 2026, with the option to extend for an additional one year period (subject to customary conditions). The committed line of credit is secured by non-transferable first mortgage bonds of the Company issued to the agent bank that would only become due and payable in the event, and then only to the extent, that the Company defaults on its obligations under the committed line of credit.
Balances outstanding and interest rates of borrowings (excluding letters of credit) under the Company’s revolving committed line of credit were as follows as of September 30, 2021 and December 31, 2020 (dollars in thousands):
|
| September 30, |
|
| December 31, |
| ||
|
| 2021 |
|
| 2020 |
| ||
Balance outstanding at end of period (1) |
| $ | 269,000 |
|
| $ | 102,000 |
|
Letters of credit outstanding at end of period |
| $ | 25,618 |
|
| $ | 27,618 |
|
Average interest rate at end of period |
|
| 1.09 | % |
|
| 1.22 | % |
23
AVISTA CORPORATION
AEL&P
AEL&P has a committed line of credit in the amount of $25.0 million that expires in November 2024. There were 0 borrowings as of September 30, 2021 and $1.0 million as of December 31, 2020, and there were 0 letters of credit outstanding under this committed line of credit as of September 30, 2021 and December 31, 2020. The committed line of credit is secured by non-transferable first mortgage bonds of AEL&P issued to the agent bank that would only become due and payable in the event, and then only to the extent, that AEL&P defaults on its obligations under the committed line of credit.
NOTE 9. CREDIT AGREEMENT
In April 2020, the Company entered into a one-year Credit Agreement with various financial institutions, in the amount of $100.0 million. The Company borrowed the entire $100.0 million in April 2020 and repaid the outstanding balance in April 2021.
NOTE 10. LONG-TERM DEBT
On September 28, 2021, the Company issued and sold $70.0 million of 2.90 percent first mortgage bonds due in 2051 pursuant to a bond purchase agreement with institutional investors in the private placement market. The Company expects to issue and sell an additional $70.0 million of first mortgage bonds under this bond purchase agreement on December 1, 2021. In connection with the pricing of the first mortgage bonds in September 2021, the Company cash-settled 4 interest rate swap derivatives (notional aggregate amount of $45.0 million) and paid a net amount of $17.2 million, which will be amortized as a component of interest expense over the life of the debt. See Note 5 for a discussion of interest rate swap derivatives.
The total net proceeds from the sale of the new bonds will be used to repay a portion of the borrowings outstanding under the Company’s $400.0 million committed line of credit. Because the Company is refinancing short-term debt on a long-term basis, the Company has classified $69.9 million of the committed line of credit that is expected to be paid off with the net proceeds of the first mortgage bonds to be issued in December as long-term debt.
NOTE 11. LONG-TERM DEBT TO AFFILIATED TRUSTS
In 1997, the Company issued Floating Rate Junior Subordinated Deferrable Interest Debentures, Series B, with a principal amount of $51.5 million to Avista Capital II, an affiliated business trust formed by the Company. Avista Capital II issued $50.0 million of Preferred Trust Securities with a floating distribution rate of LIBOR plus 0.875 percent, calculated and reset quarterly.
The distribution rates paid were as follows during the nine months ended September 30, 2021 and the year ended December 31, 2020:
|
| September 30, |
|
| December 31, |
| ||
|
| 2021 |
|
| 2020 |
| ||
Low distribution rate |
|
| 0.99 | % |
|
| 1.10 | % |
High distribution rate |
|
| 1.10 | % |
|
| 2.79 | % |
Distribution rate at the end of the period |
|
| 0.99 | % |
|
| 1.10 | % |
Concurrent with the issuance of the Preferred Trust Securities, Avista Capital II issued $1.5 million of Common Trust Securities to the Company. The Preferred Trust Securities may be redeemed at the option of Avista Capital II at any time and mature on June 1, 2037. In December 2000, the Company purchased $10.0 million of these Preferred Trust Securities.
The Company owns 100 percent of Avista Capital II and has solely and unconditionally guaranteed the payment of distributions on, and redemption price and liquidation amount for, the Preferred Trust Securities to the extent that Avista Capital II has funds available for such payments from the respective debt securities. Upon maturity or prior redemption of such debt securities, the Preferred Trust
24
AVISTA CORPORATION
Securities will be mandatorily redeemed. The Company does not include these capital trusts in its consolidated financial statements as Avista Corp. is not the primary beneficiary. As such, the sole assets of the capital trusts are $51.5 million of junior subordinated deferrable interest debentures of Avista Corp., which are reflected on the Condensed Consolidated Balance Sheets. Interest expense to affiliated trusts in the Condensed Consolidated Statements of Income represents interest expense on these debentures.
NOTE 12. FAIR VALUE
The carrying values of cash and cash equivalents, accounts and notes receivable, accounts payable, and short-term borrowings are reasonable estimates of their fair values. Long-term debt (including current portion and material finance leases) and long-term debt to affiliated trusts are reported at their carrying value on the Condensed Consolidated Balance Sheets, which may be different from the estimated fair value. See below for the estimated fair value of long-term debt and long-term debt to affiliated trusts.
The fair value hierarchy prioritizes the inputs used to measure fair value. The hierarchy gives the highest priority to unadjusted quoted prices in active markets for identical assets or liabilities (Level 1 measurement) and the lowest priority to fair values derived from unobservable inputs (Level 3 measurement).
The three levels of the fair value hierarchy are defined as follows:
Level 1 – Quoted prices are available in active markets for identical assets or liabilities. Active markets are those in which transactions for the asset or liability occur with sufficient frequency and volume to provide pricing information on an ongoing basis.
Level 2 – Pricing inputs are other than quoted prices in active markets included in Level 1, but which are either directly or indirectly observable as of the reporting date. Level 2 includes those financial instruments that are valued using models or other valuation methodologies. These models are primarily industry-standard models that consider various assumptions, including quoted forward prices for commodities, time value, volatility factors, and current market and contractual prices for the underlying instruments, as well as other relevant economic measures. Substantially all of these assumptions are observable in the marketplace throughout the full term of the instrument, can be derived from observable data or are supported by observable levels at which transactions are executed in the marketplace.
Level 3 – Pricing inputs include significant inputs that are generally unobservable from objective sources. These inputs may be used with internally developed methodologies that result in management’s best estimate of fair value.
Financial assets and liabilities are classified in their entirety based on the lowest level of input that is significant to the fair value measurement. The Company’s assessment of the significance of a particular input to the fair value measurement requires judgment, and may affect the valuation of fair value assets and liabilities and their placement within the fair value hierarchy levels. The determination of the fair values incorporates various factors that not only include the credit standing of the counterparties involved and the impact of credit enhancements (such as cash deposits and letters of credit), but also the impact of Avista Corp.’s nonperformance risk on its liabilities.
The following table sets forth the carrying value and estimated fair value of the Company’s financial instruments not reported at estimated fair value on the Condensed Consolidated Balance Sheets as of September 30, 2021 and December 31, 2020 (dollars in thousands):
|
| September 30, 2021 |
|
| December 31, 2020 |
| ||||||||||
|
| Carrying |
|
| Estimated |
|
| Carrying |
|
| Estimated |
| ||||
Long-term debt (Level 2) |
| $ | 963,500 |
|
| $ | 1,162,759 |
|
| $ | 963,500 |
|
| $ | 1,189,824 |
|
Long-term debt (Level 3) |
|
| 1,130,000 |
|
|
| 1,263,916 |
|
|
| 1,060,000 |
|
|
| 1,235,248 |
|
Snettisham finance lease obligation (Level 3) |
|
| 49,549 |
|
|
| 55,000 |
|
|
| 51,750 |
|
|
| 58,700 |
|
Long-term debt to affiliated trusts (Level 3) |
|
| 51,547 |
|
|
| 43,815 |
|
|
| 51,547 |
|
|
| 43,815 |
|
These estimates of fair value of long-term debt and long-term debt to affiliated trusts were primarily based on available market information, which generally consists of estimated market prices from third party brokers for debt with similar risk and terms. The price ranges obtained from the third party brokers consisted of market prices of 85.00 percent to 139.35 percent of the principal
25
AVISTA CORPORATION
amount, where a market price of 100.0 percent (adjusted for unamortized discount or premium) represents the carrying value recorded on the Condensed Consolidated Balance Sheets. Level 2 long-term debt represents publicly issued bonds with quoted market prices; however, due to their limited trading activity, they are classified as Level 2 because brokers must generate quotes and make estimates if there is no trading activity near a period end. Level 3 long-term debt consists of private placement bonds and debt to affiliated trusts, which typically have no secondary trading activity. Fair values in Level 3 are estimated based on market prices from third party brokers using secondary market quotes for debt with similar risk and terms to generate quotes for Avista Corp. bonds. Due to the unique nature of the Snettisham finance lease obligation, the estimated fair value of these items was determined based on a discounted cash flow model using available market information. The Snettisham finance lease obligation was discounted to present value using the Morgan Markets A Ex-Fin discount rate as published on September 30, 2021 and December 31, 2020.
The following table discloses by level within the fair value hierarchy the Company’s assets and liabilities measured and reported on the Condensed Consolidated Balance Sheets as of September 30, 2021 and December 31, 2020 at fair value on a recurring basis (dollars in thousands):
|
| Level 1 |
|
| Level 2 |
|
| Level 3 |
|
| Counterparty |
|
| Total |
| |||||
September 30, 2021 |
|
|
|
|
|
|
|
|
|
|
|
|
|
|
| |||||
Assets: |
|
|
|
|
|
|
|
|
|
|
|
|
|
|
| |||||
Energy commodity derivatives |
| $ | 0 |
|
| $ | 75,059 |
|
| $ | 0 |
|
| $ | (61,098 | ) |
| $ | 13,961 |
|
Level 3 energy commodity derivatives: |
|
|
|
|
|
|
|
|
|
|
|
|
|
|
| |||||
Natural gas exchange agreement |
|
| 0 |
|
|
| 0 |
|
|
| 108 |
|
|
| (108 | ) |
|
| 0 |
|
Interest rate swap derivatives |
|
| 0 |
|
|
| 4,549 |
|
|
| 0 |
|
|
| (2,072 | ) |
|
| 2,477 |
|
Deferred compensation assets: |
|
|
|
|
|
|
|
|
|
|
|
|
|
|
| |||||
Mutual Funds: |
|
|
|
|
|
|
|
|
|
|
|
|
|
|
| |||||
Fixed income securities (2) |
|
| 1,888 |
|
|
| 0 |
|
|
| 0 |
|
|
| 0 |
|
|
| 1,888 |
|
Equity securities (2) |
|
| 7,916 |
|
|
| 0 |
|
|
| 0 |
|
|
| 0 |
|
|
| 7,916 |
|
Total |
| $ | 9,804 |
|
| $ | 79,608 |
|
| $ | 108 |
|
| $ | (63,278 | ) |
| $ | 26,242 |
|
Liabilities: |
|
|
|
|
|
|
|
|
|
|
|
|
|
|
| |||||
Energy commodity derivatives |
| $ | 0 |
|
| $ | 74,023 |
|
| $ | 0 |
|
| $ | (73,441 | ) |
| $ | 582 |
|
Level 3 energy commodity derivatives: |
|
|
|
|
|
|
|
|
|
|
|
|
|
|
| |||||
Natural gas exchange agreement |
|
| 0 |
|
|
| 0 |
|
|
| 11,157 |
|
|
| (108 | ) |
|
| 11,049 |
|
Foreign currency exchange derivatives |
|
| 0 |
|
|
| 86 |
|
|
| 0 |
|
|
| 0 |
|
|
| 86 |
|
Interest rate swap derivatives |
|
| 0 |
|
|
| 20,732 |
|
|
| 0 |
|
|
| (2,072 | ) |
|
| 18,660 |
|
Total |
| $ | 0 |
|
| $ | 94,841 |
|
| $ | 11,157 |
|
| $ | (75,621 | ) |
| $ | 30,377 |
|
December 31, 2020 |
|
|
|
|
|
|
|
|
|
|
|
|
|
|
| |||||
Assets: |
|
|
|
|
|
|
|
|
|
|
|
|
|
|
| |||||
Energy commodity derivatives |
| $ | — |
|
| $ | 23,645 |
|
| $ | — |
|
| $ | (22,152 | ) |
| $ | 1,493 |
|
Level 3 energy commodity derivatives: |
|
|
|
|
|
|
|
|
|
|
|
|
|
|
| |||||
Natural gas exchange agreement |
|
| — |
|
|
| — |
|
|
| 75 |
|
|
| (75 | ) |
|
| — |
|
Foreign currency exchange derivatives |
|
| — |
|
|
| 30 |
|
|
| — |
|
|
| — |
|
|
| 30 |
|
Interest rate swap derivatives |
|
| — |
|
|
| 952 |
|
|
| — |
|
|
| (952 | ) |
|
| — |
|
Deferred compensation assets: |
|
|
|
|
|
|
|
|
|
|
|
|
|
|
| |||||
Mutual Funds: |
|
|
|
|
|
|
|
|
|
|
|
|
|
|
| |||||
Fixed income securities (2) |
|
| 2,471 |
|
|
| — |
|
|
| — |
|
|
| — |
|
|
| 2,471 |
|
Equity securities (2) |
|
| 6,228 |
|
|
| — |
|
|
| — |
|
|
| — |
|
|
| 6,228 |
|
Total |
| $ | 8,699 |
|
| $ | 24,627 |
|
| $ | 75 |
|
| $ | (23,179 | ) |
| $ | 10,222 |
|
Liabilities: |
|
|
|
|
|
|
|
|
|
|
|
|
|
|
| |||||
Energy commodity derivatives |
| $ | — |
|
| $ | 23,030 |
|
| $ | — |
|
| $ | (22,768 | ) |
| $ | 262 |
|
Level 3 energy commodity derivatives: |
|
|
|
|
|
|
|
|
|
|
|
|
|
|
| |||||
Natural gas exchange agreement |
|
| — |
|
|
| — |
|
|
| 8,485 |
|
|
| (75 | ) |
|
| 8,410 |
|
Interest rate swap derivatives |
|
| — |
|
|
| 51,765 |
|
|
| — |
|
|
| (9,002 | ) |
|
| 42,763 |
|
Total |
| $ | — |
|
| $ | 74,795 |
|
| $ | 8,485 |
|
| $ | (31,845 | ) |
| $ | 51,435 |
|
26
AVISTA CORPORATION
The difference between the amount of derivative assets and liabilities disclosed in respective levels in the table above and the amount of derivative assets and liabilities disclosed on the Condensed Consolidated Balance Sheets is due to netting arrangements with certain counterparties. See Note 5 for additional discussion of derivative netting.
To establish fair value for energy commodity derivatives, the Company uses quoted market prices and forward price curves to estimate the fair value of energy commodity derivative instruments included in Level 2. In particular, electric derivative valuations are performed using market quotes, adjusted for periods in between quotable periods. Natural gas derivative valuations are estimated using New York Mercantile Exchange pricing for similar instruments, adjusted for basin differences, using market quotes. Where observable inputs are available for substantially the full term of the contract, the derivative asset or liability is included in Level 2.
To establish fair values for interest rate swap derivatives, the Company uses forward market curves for interest rates for the term of the swaps and discounts the cash flows back to present value using an appropriate discount rate. The discount rate is calculated by third party brokers according to the terms of the swap derivatives and evaluated by the Company for reasonableness, with consideration given to the potential non-performance risk by the Company. Future cash flows of the interest rate swap derivatives are equal to the fixed interest rate in the swap compared to the floating market interest rate multiplied by the notional amount for each period.
To establish fair value for foreign currency derivatives, the Company uses forward market curves for Canadian dollars against the US dollar and multiplies the difference between the locked-in price and the market price by the notional amount of the derivative. Forward foreign currency market curves are provided by third party brokers. The Company's credit spread is factored into the locked-in price of the foreign exchange contracts.
Deferred compensation assets and liabilities represent funds held by the Company in a Rabbi Trust for an executive deferral plan. These funds consist of actively traded equity and bond funds with quoted prices in active markets. The balance disclosed in the table above excludes cash and cash equivalents of $0.1 million and $0.5 million as of September 30, 2021 and December 31, 2020, respectively.
Level 3 Fair Value
The following table presents the quantitative information which was used to estimate the fair values of the Level 3 assets and liabilities above as of September 30, 2021 (dollars in thousands):
|
| Fair Value |
|
| Valuation |
| Unobservable |
| Range and Weighted | |
|
| September 30, 2021 |
|
| Technique |
| Input |
| Average Price | |
Natural gas exchange agreement |
| $ | (11,049 | ) |
| Internally derived weighted average cost of gas |
| Forward purchase |
| $2.41 - $3.83/mmBTU |
|
|
|
|
|
|
| Forward sales prices |
| $2.40 - $8.25/mmBTU | |
|
|
|
|
|
|
| Purchase volumes |
| 130,000 - 310,000 mmBTUs | |
|
|
|
|
|
|
| Sales volumes |
| 75,000 - 310,000 mmBTUs | |
27
AVISTA CORPORATION
The following table presents activity for energy commodity derivative assets (liabilities) measured at fair value using significant unobservable inputs (Level 3) for the three and nine months ended September 30 (dollars in thousands):
|
| Natural Gas |
| |
Three months ended September 30, 2021: |
|
|
| |
Balance as of June 30, 2021 |
| $ | (6,078 | ) |
Total gains or (losses) (realized/unrealized): |
|
|
| |
Included in regulatory assets/liabilities (1) |
|
| (4,971 | ) |
Settlements |
|
| 0 |
|
Ending balance as of September 30, 2021 (2) |
| $ | (11,049 | ) |
Three months ended September 30, 2020: |
|
|
| |
Balance as of June 30, 2020 |
| $ | (2,628 | ) |
Total gains or (losses) (realized/unrealized): |
|
|
| |
Included in regulatory assets/liabilities (1) |
|
| (1,046 | ) |
Settlements |
|
| 0 |
|
Ending balance as of September 30, 2020 (2) |
| $ | (3,674 | ) |
Nine months ended September 30, 2021: |
|
|
| |
Balance as of December 31, 2020 |
| $ | (8,410 | ) |
Total gains (realized/unrealized): |
|
|
| |
Included in regulatory assets/liabilities (1) |
|
| (1,482 | ) |
Settlements |
|
| (1,157 | ) |
Ending balance as of September 30, 2021 (2) |
| $ | (11,049 | ) |
Nine months ended September 30, 2020: |
|
|
| |
Balance as of December 31, 2019 |
| $ | (2,976 | ) |
Total gains (realized/unrealized): |
|
|
| |
Included in regulatory assets/liabilities (1) |
|
| (952 | ) |
Settlements |
|
| 254 |
|
Ending balance as of September 30, 2020 (2) |
| $ | (3,674 | ) |
NOTE 13. COMMON STOCK
The Company has board and regulatory authority to issue 3.9 million shares of common stock in public offerings. Of this number, the Company issued 1.1 million shares and 1.4 million shares during the three and nine months ended September 30, 2021, respectively, under the sales agency agreements relating to the Company's periodic offering program, leaving 2.5 million shares authorized to be issued.
NOTE 14. ACCUMULATED OTHER COMPREHENSIVE LOSS
Accumulated other comprehensive loss, net of tax, consisted of the following as of September 30, 2021 and December 31, 2020 (dollars in thousands):
|
| September 30, |
|
| December 31, |
| ||
Unfunded benefit obligation for pensions and other postretirement benefit plans - |
| $ | 13,451 |
|
| $ | 14,378 |
|
28
AVISTA CORPORATION
The following table details the reclassifications out of accumulated other comprehensive loss to net income by component for the three and nine months ended September 30 (dollars in thousands):
|
| Amounts Reclassified from Accumulated Other |
| |||||||||||||
|
| Three months ended September 30, |
|
| Nine months ended September 30, |
| ||||||||||
Details about Accumulated Other Comprehensive Loss Components |
| 2021 |
|
| 2020 |
|
| 2021 |
|
| 2020 |
| ||||
Amortization of defined benefit pension and |
|
|
|
|
|
|
|
|
|
|
|
| ||||
Amortization of net prior service cost (a) |
| $ | (200 | ) |
| $ | (200 | ) |
| $ | (600 | ) |
| $ | (600 | ) |
Amortization of net loss (a) |
|
| 2,369 |
|
|
| 3,120 |
|
|
| 8,299 |
|
|
| 9,341 |
|
Adjustment due to effects of regulation (a) |
|
| (1,784 | ) |
|
| (2,642 | ) |
|
| (6,525 | ) |
|
| (7,925 | ) |
Total before tax (b) |
|
| 385 |
|
|
| 278 |
|
|
| 1,174 |
|
|
| 816 |
|
Tax expense (b) |
|
| (81 | ) |
|
| (58 | ) |
|
| (247 | ) |
|
| (171 | ) |
Net of tax (b) |
| $ | 304 |
|
| $ | 220 |
|
| $ | 927 |
|
| $ | 645 |
|
The following table presents the computation of basic and diluted earnings per common share for the three and nine months ended September 30 (in thousands, except per share amounts):
|
| Three months ended September 30, |
|
| Nine months ended September 30, |
| ||||||||||
|
| 2021 |
|
| 2020 |
|
| 2021 |
|
| 2020 |
| ||||
Numerator: |
|
|
|
|
|
|
|
|
|
|
|
| ||||
Net income |
| $ | 14,366 |
|
| $ | 4,876 |
|
| $ | 96,457 |
|
| $ | 70,753 |
|
Denominator: |
|
|
|
|
|
|
|
|
|
|
|
| ||||
Weighted-average number of common shares outstanding-basic |
|
| 70,054 |
|
|
| 68,194 |
|
|
| 69,582 |
|
|
| 67,638 |
|
Effect of dilutive securities: |
|
|
|
|
|
|
|
|
|
|
|
| ||||
Performance and restricted stock awards |
|
| 75 |
|
|
| 143 |
|
|
| 140 |
|
|
| 131 |
|
Weighted-average number of common shares outstanding-diluted |
|
| 70,129 |
|
|
| 68,337 |
|
|
| 69,722 |
|
|
| 67,769 |
|
Earnings per common share: |
|
|
|
|
|
|
|
|
|
|
|
| ||||
Basic |
| $ | 0.21 |
|
| $ | 0.07 |
|
| $ | 1.39 |
|
| $ | 1.05 |
|
Diluted |
| $ | 0.20 |
|
| $ | 0.07 |
|
| $ | 1.38 |
|
| $ | 1.04 |
|
There were 0 shares excluded from the calculation because they were antidilutive.
NOTE 16. COMMITMENTS AND CONTINGENCIES
In the course of its business, the Company becomes involved in various claims, controversies, disputes and other contingent matters, including the items described in this Note. Some of these claims, controversies, disputes and other contingent matters involve litigation or other contested proceedings. For all such matters, the Company intends to vigorously protect and defend its interests and pursue its rights. However, no assurance can be given as to the ultimate outcome of any particular matter because litigation and other contested proceedings are inherently subject to numerous uncertainties. For matters that affect Avista Utilities’ or AEL&P's operations, the Company intends to seek, to the extent appropriate, recovery of incurred costs through the ratemaking process.
Boyds Fire (State of Washington Department of Natural Resources (DNR) v. Avista)
In August 2019, the Company was served with a complaint, captioned “State of Washington Department of Natural Resources v. Avista Corporation,” seeking recovery up to $4.4 million for fire suppression and investigation costs and related expenses incurred in connection with a wildfire that occurred in Ferry County, Washington in August 2018. The complaint alleges that the fire, which became known as the “Boyds Fire,” was caused by a dead ponderosa pine tree falling into an overhead distribution line, and that
29
AVISTA CORPORATION
Avista Corp. was negligent in failing to identify and remove the tree before it came into contact with the line. Avista Corp. disputes that the tree in question was the cause of the fire and that it was negligent in failing to identify and remove it. Additional lawsuits have subsequently been filed by private landowners seeking property damages, and holders of insurance subrogation claims seeking recovery of insurance proceeds paid.
The lawsuits were filed in the Superior Court of Ferry County, Washington and subsequently consolidated into a single action. The Company intends to vigorously defend itself in the litigation. However, the Company cannot predict the outcome of these matters.
Labor Day Windstorm
General
In September 2020, a severe windstorm occurred in eastern Washington and northern Idaho. The extreme weather event resulted in customer outages and the cause of multiple wildfires in the region.
The Company has become aware of instances where, during the course of the storm, trees and limbs, located in areas outside its maintenance right-of-way, broke under the extraordinary wind conditions and caused damage to its energy delivery system at or near what is believed to be the potential area of origin of a wildfire. Those instances include what has been referred to as: the Babb Road fire (near Malden and Pine City, Washington); the Christensen Road fire (near Airway Heights, Washington); and the Mile Marker 49 fire (near Orofino, Idaho). These wildfires covered, in total, approximately 22,000 acres. The Company currently estimates approximately 230 residential, commercial and other structures were impacted. Parallel investigations by applicable state agencies are ongoing, and the Company is cooperating with those efforts. With respect to the Christensen Road Fire and the Mile Marker 49 Fire, the Company’s investigation determined that the primary cause of the fires was extreme high winds. To date, the Company has not found any evidence that the fires were caused by any deficiencies in its equipment, maintenance activities or vegetation management practices. See further discussion below regarding the Babb Road Fire.
In addition to the instances identified above, the Company is aware of a 5-acre fire that occurred in Colfax, Washington, which damaged several residential structures. The Company’s investigation determined that the Company’s facilities were not involved in the ignition of this fire in any way.
The Company contends that there is no evidence of negligence and intends to vigorously defend any claims for damages that may be asserted against it with respect to the wildfires arising out of the extreme wind event.
Babb Road Fire
On May 14, 2021 the Company learned that the DNR had completed its investigation and issued a report on the Babb Road Fire. The Babb Road fire covered approximately 15,000 acres and destroyed approximately 220 structures. There are no reports of personal injury or death resulting from the fire.
The DNR report concluded, among other things, that
The DNR report concluded as follows: “It is my opinion that because of the unusual configuration of the tree, and its proximity to the powerline, a closer inspection was warranted. A nearer inspection of the tree should have revealed the cut LBL ends and its previous failure, and necessitated determination of the failure potential of the adjacent LBL, implicated in starting the Babb Road Fire.”
30
AVISTA CORPORATION
The DNR report acknowledged that, other than the multi-dominant nature of the tree, the conditions mentioned above would not have been easily visible without close-up inspection of, or cutting into, the tree. The report also acknowledged that, while the presence of multiple tops would have been visible from the nearby roadway, the tree did not fail at a v-fork due to the presence of multiple tops. The Company contends that applicable inspection standards did not require a closer inspection of the otherwise healthy tree, nor was the Company in any way negligent with respect to its maintenance, inspection or vegetation management practices. The Company intends to vigorously defend any such assertion, if made. At this time, no material claims have been asserted against Avista Corp. for damages resulting from the Babb Road Fire.
Colstrip
The Washington CETA imposes deadlines by which coal-fired resources, such as Colstrip, must be excluded from the rate base of Washington utilities and by which electricity from such resources may no longer be delivered to Washington retail customers. Not all of the co-owners of Colstrip Units 3 & 4 are Washington utilities subject to CETA, and the co-owners have differing needs for the generating capacity of these units. Accordingly, business disagreements have arisen among the co-owners, including, but not limited to, disagreements as to the shut-down date or dates of these units. These business disagreements, in turn, have led to disagreements as to the interpretation of the Ownership and Operating Agreement, including, but not limited to, the rights of the co-owners to discontinue operations of, or otherwise terminate their interest in, Unit 3 and/or Unit 4. The Ownership and Operating Agreement contains an arbitration clause that dictates a dispute resolution process to address and resolve these disagreements through an arbitration conducted in Spokane, Washington. At least one owner, Talen Montana, has challenged the validity of the arbitration clause contained in the Ownership and Operating Agreement on the basis that it is not consistent with recently-enacted amendments to Montana Code Section 27-5-323 which requires, among other things, that an arbitration be conducted in Montana. A majority of the owners of Colstrip (including the Company) initiated legal proceedings in Washington to compel arbitration in accordance with the Ownership and Operating Agreement, which proceedings were subsequently removed and transferred to Montana Federal District Court, as well as legal proceedings in Montana to challenge the constitutionality of the amendments to Montana Code Section 27-5-323.
In addition to amending Montana Code Section 27-5-323, during the course of the 2021 legislative session the Montana Legislature passed Senate Bill 266, which amended Montana’s Consumer Protection Act (MC 30-14-103 et seq.) to make (i) the failure or refusal of an owner of Colstrip to fund its share of operating costs, and (ii) conduct by one or more of the owners of Colstrip to bring about permanent closure of a generating unit of Colstrip without seeking and obtaining the unanimous consent of the owners, an unfair or deceptive act or practice in the conduct of trade or commerce under Montana’s Consumer Protection Act. A majority of the owners of Colstrip (including the Company) initiated legal proceedings to challenge the constitutionality of Senate Bill 266. On October 13, 2021, the United States District Court for the District of Montana issued a preliminary injunction finding it likely that Senate Bill 266 unconstitutionally violates both the Contracts Clause and the Commerce Clause of the United States Constitution. The Company will continue to vigorously defend and protect its interests (and those of its stakeholders) in this and all other legal proceedings relating to Colstrip.
The Company is not able to predict the outcome, nor an amount or range of potential impact in the event of an outcome that is adverse to the Company’s interests.
National Park Service (NPS) - Natural and Cultural Damage Claim
In March 2017, the Company accessed property managed by the National Park Service (NPS) to prevent the imminent failure of a power pole that was surrounded by flood water in the Spokane River. The Company voluntarily reported its actions to the NPS several days later. Thereafter, in March 2018, the NPS notified the Company that it might seek recovery for unspecified costs and damages allegedly caused during the incident pursuant to the System Unit Resource Protection Act (SURPA), 54 U.S.C. 100721 et seq. In January 2021, the United States Department of Justice (DOJ) requested that the Company and the DOJ renew discussions relating to the matter. In July 2021, the DOJ communicated that it may seek damages of approximately $2 million in connection with the incident for alleged damage to "natural and cultural resources". In addition, the DOJ indicated that it may seek treble damages under the SURPA and state law, bringing its total potential claim to approximately $6 million.
31
AVISTA CORPORATION
The Company disputes the position taken by the DOJ with respect to the incident, as well as the nature and extent of the DOJ’s alleged damages, and will vigorously defend itself in any litigation that may arise with respect to the matter. The Company and the DOJ have agreed to engage in discussions to understand their respective positions and determine whether a resolution of the dispute may be possible. However, the Company cannot predict the outcome of the matter.
Rathdrum, Idaho Natural Gas Incident
On October 28, 2021, there was an incident in Rathdrum Idaho involving the Company’s natural gas infrastructure. The incident occurred after a third party damaged those facilities during the course of excavation work. The incident resulted in a fire which destroyed one residence and resulted in minor injuries to the occupants. At this time, the Company is unable to predict the likelihood of a claim arising out of the matter, nor an amount or range of a potential loss, if any, in the event of such a claim.
Other Contingencies
In the normal course of business, the Company has various other legal claims and contingent matters outstanding. The Company believes that any ultimate liability arising from these actions will not have a material impact on its financial condition, results of operations or cash flows. It is possible that a change could occur in the Company’s estimates of the probability or amount of a liability being incurred. Such a change, should it occur, could be significant. See "Note 22 of the Notes to Consolidated Financial Statements" in the 2020 Form 10-K for additional discussion regarding other contingencies.
NOTE 17. INFORMATION BY BUSINESS SEGMENTS
The business segment presentation reflects the basis used by the Company's management to analyze performance and determine the allocation of resources. The Company's management evaluates performance based on income (loss) from operations before income taxes as well as net income (loss). The accounting policies of the segments are the same as those described in the summary of significant accounting policies. Avista Utilities' business is managed based on the total regulated utility operation; therefore, it is considered one segment. AEL&P is a separate reportable business segment, as it has separate financial reports that are reviewed in detail by the Chief Operating Decision Maker and its operations and risks are sufficiently different from Avista Utilities and the other businesses at AERC that it cannot be aggregated with any other operating segments. The Other category, which is not a reportable segment, includes other investments and operations of various subsidiaries, as well as certain other operations of Avista Capital.
32
AVISTA CORPORATION
The following table presents information for each of the Company’s business segments (dollars in thousands):
|
| Avista |
|
| Alaska |
|
| Total Utility |
|
| Other |
|
| Intersegment |
|
| Total |
| ||||||
For the three months ended September 30, 2021: |
|
|
|
|
|
|
|
|
|
|
|
|
|
|
|
|
|
| ||||||
Operating revenues |
| $ | 286,752 |
|
| $ | 9,147 |
|
| $ | 295,899 |
|
| $ | 108 |
|
| $ | 0 |
|
| $ | 296,007 |
|
Resource costs |
|
| 101,109 |
|
|
| 1,024 |
|
|
| 102,133 |
|
|
| 0 |
|
|
| 0 |
|
|
| 102,133 |
|
Other operating expenses |
|
| 82,006 |
|
|
| 3,619 |
|
|
| 85,625 |
|
|
| 843 |
|
|
| 0 |
|
|
| 86,468 |
|
Depreciation and amortization |
|
| 55,039 |
|
|
| 2,683 |
|
|
| 57,722 |
|
|
| 30 |
|
|
| 0 |
|
|
| 57,752 |
|
Income (loss) from operations |
|
| 23,416 |
|
|
| 1,563 |
|
|
| 24,979 |
|
|
| (765 | ) |
|
| 0 |
|
|
| 24,214 |
|
Interest expense (2) |
|
| 25,015 |
|
|
| 1,523 |
|
|
| 26,538 |
|
|
| 132 |
|
|
| (21 | ) |
|
| 26,649 |
|
Income taxes |
|
| (6,371 | ) |
|
| 18 |
|
|
| (6,353 | ) |
|
| 921 |
|
|
| 0 |
|
|
| (5,432 | ) |
Net income |
|
| 9,086 |
|
|
| 41 |
|
|
| 9,127 |
|
|
| 5,239 |
|
|
| 0 |
|
|
| 14,366 |
|
Capital expenditures (3) |
|
| 107,519 |
|
|
| 1,462 |
|
|
| 108,981 |
|
|
| 373 |
|
|
| 0 |
|
|
| 109,354 |
|
For the three months ended September 30, 2020: |
|
|
|
|
|
|
|
|
|
|
|
|
|
|
|
|
|
| ||||||
Operating revenues |
| $ | 263,564 |
|
| $ | 8,815 |
|
| $ | 272,379 |
|
| $ | 267 |
|
| $ | 0 |
|
| $ | 272,646 |
|
Resource costs |
|
| 77,843 |
|
|
| 942 |
|
|
| 78,785 |
|
|
| 0 |
|
|
| 0 |
|
|
| 78,785 |
|
Other operating expenses |
|
| 82,151 |
|
|
| 3,400 |
|
|
| 85,551 |
|
|
| 1,697 |
|
|
| 0 |
|
|
| 87,248 |
|
Depreciation and amortization |
|
| 51,499 |
|
|
| 2,454 |
|
|
| 53,953 |
|
|
| 146 |
|
|
| 0 |
|
|
| 54,099 |
|
Income (loss) from operations |
|
| 28,284 |
|
|
| 1,790 |
|
|
| 30,074 |
|
|
| (1,576 | ) |
|
| 0 |
|
|
| 28,498 |
|
Interest expense (2) |
|
| 24,277 |
|
|
| 1,561 |
|
|
| 25,838 |
|
|
| 131 |
|
|
| (29 | ) |
|
| 25,940 |
|
Income taxes |
|
| 1,060 |
|
|
| 59 |
|
|
| 1,119 |
|
|
| (260 | ) |
|
| 0 |
|
|
| 859 |
|
Net income (loss) |
|
| 5,546 |
|
|
| 268 |
|
|
| 5,814 |
|
|
| (938 | ) |
|
| 0 |
|
|
| 4,876 |
|
Capital expenditures (3) |
|
| 105,494 |
|
|
| 2,860 |
|
|
| 108,354 |
|
|
| 803 |
|
|
| 0 |
|
|
| 109,157 |
|
For the nine months ended September 30, 2021: |
|
|
|
|
|
|
|
|
|
|
|
|
|
|
|
|
|
| ||||||
Operating revenues |
| $ | 974,172 |
|
| $ | 32,515 |
|
| $ | 1,006,687 |
|
| $ | 445 |
|
| $ | 0 |
|
| $ | 1,007,132 |
|
Resource costs |
|
| 324,464 |
|
|
| 2,926 |
|
|
| 327,390 |
|
|
| 0 |
|
|
| 0 |
|
|
| 327,390 |
|
Other operating expenses |
|
| 257,333 |
|
|
| 9,900 |
|
|
| 267,233 |
|
|
| 3,186 |
|
|
| 0 |
|
|
| 270,419 |
|
Depreciation and amortization |
|
| 161,332 |
|
|
| 7,677 |
|
|
| 169,009 |
|
|
| 230 |
|
|
| 0 |
|
|
| 169,239 |
|
Income (loss) from operations |
|
| 149,670 |
|
|
| 11,162 |
|
|
| 160,832 |
|
|
| (2,971 | ) |
|
| 0 |
|
|
| 157,861 |
|
Interest expense (2) |
|
| 74,423 |
|
|
| 4,571 |
|
|
| 78,994 |
|
|
| 392 |
|
|
| (87 | ) |
|
| 79,299 |
|
Income taxes |
|
| 4,932 |
|
|
| 1,819 |
|
|
| 6,751 |
|
|
| 2,379 |
|
|
| 0 |
|
|
| 9,130 |
|
Net income |
|
| 80,861 |
|
|
| 4,816 |
|
|
| 85,677 |
|
|
| 10,780 |
|
|
| 0 |
|
|
| 96,457 |
|
Capital expenditures (3) |
|
| 318,354 |
|
|
| 4,454 |
|
|
| 322,808 |
|
|
| 938 |
|
|
| 0 |
|
|
| 323,746 |
|
For the nine months ended September 30, 2020: |
|
|
|
|
|
|
|
|
|
|
|
|
|
|
|
|
|
| ||||||
Operating revenues |
| $ | 909,109 |
|
| $ | 31,014 |
|
| $ | 940,123 |
|
| $ | 1,345 |
|
| $ | 0 |
|
| $ | 941,468 |
|
Resource costs |
|
| 274,468 |
|
|
| 1,829 |
|
|
| 276,297 |
|
|
| 0 |
|
|
| 0 |
|
|
| 276,297 |
|
Other operating expenses |
|
| 256,570 |
|
|
| 9,681 |
|
|
| 266,251 |
|
|
| 3,716 |
|
|
| 0 |
|
|
| 269,967 |
|
Depreciation and amortization |
|
| 161,934 |
|
|
| 7,348 |
|
|
| 169,282 |
|
|
| 569 |
|
|
| 0 |
|
|
| 169,851 |
|
Income (loss) from operations |
|
| 137,219 |
|
|
| 11,337 |
|
|
| 148,556 |
|
|
| (2,939 | ) |
|
| 0 |
|
|
| 145,617 |
|
Interest expense (2) |
|
| 73,449 |
|
|
| 4,709 |
|
|
| 78,158 |
|
|
| 393 |
|
|
| (161 | ) |
|
| 78,390 |
|
Income taxes |
|
| 460 |
|
|
| 1,840 |
|
|
| 2,300 |
|
|
| (828 | ) |
|
| 0 |
|
|
| 1,472 |
|
Net income (loss) |
|
| 69,130 |
|
|
| 4,991 |
|
|
| 74,121 |
|
|
| (3,368 | ) |
|
| 0 |
|
|
| 70,753 |
|
Capital expenditures (3) |
|
| 291,417 |
|
|
| 6,417 |
|
|
| 297,834 |
|
|
| 1,389 |
|
|
| 0 |
|
|
| 299,223 |
|
Total Assets: |
|
|
|
|
|
|
|
|
|
|
|
|
|
|
|
|
|
| ||||||
As of September 30, 2021: |
| $ | 6,345,036 |
|
| $ | 269,061 |
|
| $ | 6,614,097 |
|
| $ | 123,355 |
|
| $ | (5,974 | ) |
| $ | 6,731,478 |
|
As of December 31, 2020: |
| $ | 6,035,340 |
|
| $ | 268,971 |
|
| $ | 6,304,311 |
|
| $ | 109,658 |
|
| $ | (11,872 | ) |
| $ | 6,402,097 |
|
33
AVISTA CORPORATION
REPORT OF INDEPENDENT REGISTERED PUBLIC ACCOUNTING FIRM
To the Shareholders and Board of Directors of
Avista Corporation
Spokane, Washington
Results of Review of Interim Financial Information
We have reviewed the accompanying condensed consolidated balance sheet of Avista Corporation and subsidiaries (the "Company") as of September 30, 2021, the related condensed consolidated statements of income, comprehensive income, and equity for the three-month and nine-month periods ended September 30, 2021 and 2020, and of cash flows for the nine-month periods ended September 30, 2021 and 2020, and the related notes (collectively referred to as the "interim financial information"). Based on our reviews, we are not aware of any material modifications that should be made to the accompanying interim financial information for it to be in conformity with accounting principles generally accepted in the United States of America.
We have previously audited, in accordance with the standards of the Public Company Accounting Oversight Board (United States) (PCAOB), the consolidated balance sheet of the Company as of December 31, 2020, and the related consolidated statements of income, comprehensive income, equity, and cash flows for the year then ended (not presented herein); and in our report dated February 23, 2021, we expressed an unqualified opinion on those consolidated financial statements. In our opinion, the information set forth in the accompanying condensed consolidated balance sheet as of December 31, 2020, is fairly stated, in all material respects, in relation to the consolidated balance sheet from which it has been derived.
Basis for Review Results
This interim financial information is the responsibility of the Company's management. We are a public accounting firm registered with the PCAOB and are required to be independent with respect to the Company in accordance with the U.S. federal securities laws and the applicable rules and regulations of the Securities and Exchange Commission and the PCAOB.
We conducted our reviews in accordance with standards of the PCAOB. A review of interim financial information consists principally of applying analytical procedures and making inquiries of persons responsible for financial and accounting matters. It is substantially less in scope than an audit conducted in accordance with the standards of the PCAOB, the objective of which is the expression of an opinion regarding the financial statements taken as a whole. Accordingly, we do not express such an opinion.
/s/ Deloitte & Touche LLP
Portland, Oregon
November 2, 2021
34
AVISTA CORPORATION
Item 2. Management’s Discussion and Analysis of Financial Condition and Results of Operations
Management’s Discussion and Analysis of Financial Condition and Results of Operations has been prepared in accordance with the SEC’s Regulation S-K for interim financial information and with the instructions to Form 10-Q. This Management’s Discussion and Analysis of Financial Condition and Results of Operations does not contain the full detail or analysis that would accompany financial statements for a full fiscal year; therefore, it should be read in conjunction with the Company's 2020 Form 10-K.
Business Segments
Our business segments have not changed during the nine months ended September 30, 2021. See the 2020 Form 10-K as well as “Note 17 of the Notes to Condensed Consolidated Financial Statements” for further information regarding our business segments.
The following table presents net income for each of our business segments (and the other businesses) for the three and nine months ended September 30 (dollars in thousands):
|
| Three months ended September 30, |
|
| Nine months ended September 30, |
| ||||||||||
|
| 2021 |
|
| 2020 |
|
| 2021 |
|
| 2020 |
| ||||
Avista Utilities |
| $ | 9,086 |
|
| $ | 5,546 |
|
| $ | 80,861 |
|
| $ | 69,130 |
|
AEL&P |
|
| 41 |
|
|
| 268 |
|
|
| 4,816 |
|
|
| 4,991 |
|
Other |
|
| 5,239 |
|
|
| (938 | ) |
|
| 10,780 |
|
|
| (3,368 | ) |
Net income |
| $ | 14,366 |
|
| $ | 4,876 |
|
| $ | 96,457 |
|
| $ | 70,753 |
|
Executive Level Summary
Overall Results
Net income for the three months ended September 30, 2021 increased compared to the three months ended September 30, 2020 primarily due to increased net income at our other businesses, and timing of recognition of income taxes. These items were partially offset by higher power supply costs and a $2.5 million write off of Colstrip SmartBurn assets disallowed in the Washington general rate case. Net income for the nine months ended September 30, 2021 increased compared to 2020 primarily due to an increase in utility margin as a result of general rate increases, timing of recognition of income taxes, and non-decoupled revenue growth and customer growth. These increases were partially offset by higher power supply costs. In addition, the nine months ended September 30, 2020 included an accrual for customer refunds related to the outcome of our 2015 Washington general rate cases, an accrual for disallowed replacement power during an unplanned outage at Colstrip and a contribution to the Colstrip community fund.
The increase in net income at our other businesses was primarily due to increased earnings from our investments during the second and third quarters.
More detailed explanations of the fluctuations are provided in the results of operations and business segment discussions (Avista Utilities, AEL&P, and the other businesses) that follow this section.
Summer Weather Conditions
The Pacific Northwest experienced hot and dry weather conditions throughout the second and third quarters of 2021 compared to normal weather conditions for this time of year. These weather conditions resulted in higher than usual customer loads, as well as lower than usual hydroelectric generation. In these periods, we often have excess generation to sell into the wholesale markets, which benefits our net power supply costs. This did not occur at expected levels in 2021 primarily due to the hot and dry weather conditions throughout the Pacific Northwest.
As a result of our lower than normal hydroelectric generation capability and in order to serve higher than usual loads, we were required to rely more heavily than usual on purchased power and our thermal generation, which in turn resulted in higher than authorized resource costs due to higher volumes of energy and fuel purchased and higher market prices of each. For the nine-months
35
AVISTA CORPORATION
ended September 30, 2021 we have recognized a pre-tax expense of $7.1 million under the ERM, compared to a $5.9 million pre-tax benefit recognized in the first nine months of 2020.
These hot conditions had a minimal impact on revenues, as the majority of the increase in revenues associated with increased usage was offset with decoupling revenues due to the decoupling mechanisms that cover a majority of our customers.
COVID-19 Pandemic
The COVID-19 pandemic has impacted our business, as well as the global, national and local economies. However, as we progress through 2021, the economies in our service territory have opened, and we expect the impacts of the pandemic to be less severe than 2020. This was the case through the third quarter. The pandemic has affected and may continue to affect our results of operations, financial condition, liquidity and cash flows in the following ways:
Results of Operations
We expect continued economic recovery and improvement in employment through the remainder of 2021. We have decoupling and other regulatory mechanisms in Washington, Idaho and Oregon, which mitigate the impact of changes in loads and revenues for residential and certain commercial customer classes. Over 90 percent of our utility revenue is covered by regulatory mechanisms.
Customer disconnections for non-payment have resumed in all jurisdictions.
We have received accounting orders in each of our jurisdictions to defer the recognition of COVID-19 expenses as well as identified cost savings of other COVID-19 related benefits. COVID-19 deferred cumulative regulatory assets and liabilities as of September 30, 2021 and December 31, 2020 were as follows (dollars in thousands):
|
| September 30, |
|
| December 31, |
| ||
|
| 2021 |
|
| 2020 |
| ||
Regulatory asset |
| $ | 15,648 |
|
| $ | 8,166 |
|
Regulatory liability |
|
| (12,673 | ) |
|
| (10,949 | ) |
Total |
| $ | 2,975 |
|
| $ | (2,783 | ) |
Several vaccine mandates have been issued by various governmental entities. To the extent that governmental mandates are applicable to us, we are assessing our options as to how to comply with the mandates while minimizing the impact on our operations. If we mandate vaccines, it could result in a loss of employees which could cause disruption to operations.
Financial Condition, Liquidity and Cash Flows
After considering the impacts of COVID-19, and the issuances of long-term debt and equity during 2021, we expect net cash flows from operations, together with cash available under our committed lines of credit, to provide adequate resources to fund capital expenditures, dividends, and other contractual commitments.
We cannot predict the duration and severity of the COVID-19 pandemic or if emerging variants will result in the reimplementation of economic restrictions. The longer and more severe the economic restrictions and business disruption, the greater the impact on our operations, results of operations, financial condition and cash flows.
Regulatory Matters
General Rate Cases
We regularly review the need for electric and natural gas rate changes in each state in which we provide service. We expect to continue to file for rate adjustments to:
36
AVISTA CORPORATION
With regards to the timing and plans for future filings, the assessment of our need for rate relief and the development of rate case plans takes into consideration short-term and long-term needs, as well as specific factors that can affect the timing of rate filings. Such factors include, but are not limited to, in-service dates of major capital investments and the timing of changes in major revenue and expense items.
Avista Utilities
Washington General Rate Cases
2019 General Rate Cases
In March 2020, we received an order from the WUTC that approved a partial multi-party settlement agreement. The approved rates were designed to increase annual base electric revenues by $28.5 million, or 5.7 percent, and annual natural gas base revenues by $8.0 million, or 8.5 percent, effective April 1, 2020. The revenue increases incorporate a 9.4 percent ROE with a common equity ratio of 48.5 percent and a ROR of 7.21 percent.
As part of the WUTC order, we are returning approximately $40 million from the ERM rebate to customers over a two-year period.
Included in the WUTC order was the acceleration of depreciation of Colstrip Units 3 & 4 to reflect a remaining useful life through December 31, 2025. The order utilized certain electric tax benefits associated with the 2018 tax reform to partially offset these increased costs. The order also sets aside $3 million for community transition efforts to mitigate the impacts of the eventual closure of Colstrip, half funded by customers and half funded by our shareholders. We recorded this liability and recognized the shareholder portion of the expense in the first quarter of 2020. The funds were issued to the Montana Community Fund in the first quarter of 2021.
Lastly, the order included the extension of electric and natural gas decoupling mechanisms through March 31, 2025, with one modification in that new customers added after any test period will not be decoupled until those customers are embedded in a rate case test year.
2020 General Rate Cases
In September 2021, we received an order from the WUTC that approved a partial multi-party settlement agreement and resolved all other remaining issues. The approved rates are designed to increase annual base electric revenues by $13.6 million, or 2.6 percent, and annual natural gas base revenues by $8.1 million, or 7.7 percent, effective October 1, 2021. The revenue increases are based on a 9.4 percent ROE with a common equity ratio of 48.5 percent and a ROR of 7.12 percent.
While base rates increased, there was no increase in billed rates at this time because of the use of offsetting tax benefits. With the approval of these customer tax credits, the company recognized an adjustment in the third quarter.
The WUTC's order approved recovery of capital additions including investments in advanced metering infrastructure, wildfire resiliency, joining the Western Energy Imbalance Market, and other projects. The WUTC disallowed $2.5 million of costs associated with Colstrip SmartBurn technology.
The WUTC order also approves the Company's request to defer incremental wildfire expenses incurred from January 1, 2021 to September 30, 2021, as well as the Company's use of a wildfire balancing account to track the level of expense associated with wildfire resiliency going forward.
2022 General Rate Cases
We expect to file multi-year electric and natural gas general rate cases with the WUTC in the first quarter of 2022.
Washington Engrossed Substitute Senate Bill 5295
This bill, which was signed into law and is effective as of July 25, 2021, is designed to promote multi-year rate plans and performance-based rate making for electric and natural gas utilities. The bill includes a number of provisions such as required multi-year rate plans from 2-4 years in length, methodologies the WUTC may use to minimize regulatory lag and/or adjust for under earning
37
AVISTA CORPORATION
and starts an investigation into Performance Based Ratemaking Metrics, an initial move that may help to modify the historical test-year ratemaking construct. On October 20, 2021, the WUTC issued a notice of opportunity to comment on a proposed work plan to be conducted in various phases between 2021 and 2025, initially focusing on Performance Based Ratemaking and identifying performance metrics. Thereafter, the WUTC will address revenue adjustment mechanisms and performance incentives in the context of multi-year rate plans. The new law leaves much to the discretion of the WUTC, and we cannot predict the extent to which the WUTC will embrace the options now permitted.
Idaho General Rate Cases
2021 General Rate Cases
In January 2021, we filed electric and natural gas general rate cases with the IPUC.
In September 2021, the IPUC approved the all party settlement agreement. The approved rates under the settlement agreement are designed to increase annual base electric revenues by $10.6 million, or 4.3 percent, effective September 1, 2021, and $8.0 million, or 3.1 percent, effective September 1, 2022. For natural gas, the proposed rates under the settlement agreement are designed to decrease annual base natural gas revenues by $1.6 million, or 3.7 percent, effective September 1, 2021, and increase annual base revenues by $0.9 million, or 2.2 percent, effective September 1, 2022. The parties have agreed to use the customer tax credits, related to flow through of certain tax items, included in our original filing to offset overall proposed changes to electric and natural gas rates over the two-year plan.
The settlement is based on a 9.4 percent ROE with a common equity ratio of 50 percent and a ROR of 7.05 percent.
Oregon General Rate Cases
2020 General Rate Case
In March 2020, we filed a natural gas general rate case with the OPUC.
Through several settlement stipulations the parties resolved all issues in the general rate case and in December 2020, the OPUC approved the settlement stipulations.
These stipulations approved by the OPUC were designed to increase annual base revenue by $3.9 million, or 5.7 percent, effective January 16, 2021. The approved ROE is 9.4 percent, with a common equity ratio of 50 percent and a ROR of 7.24 percent.
2021 General Rate Case
On October 22, 2021, we filed a natural gas general rate case with the OPUC that, if approved, would allow us to recover costs for ongoing natural gas infrastructure and other investments without increasing customer bills. The proposal is designed to increase overall natural gas base revenue by $3.8 million and is based on a proposed rate of return of 7.35 percent with a common equity ratio of 50 percent and a 9.9 percent return on equity. We have proposed that the increase be fully offset for a two-year period with tax customer credits (related to the flow through of certain tax items) of the same amount.
AEL&P
Alaska General Rate Case
AEL&P is required to file its next general rate case by August 30, 2022.
Avista Utilities
Purchased Gas Adjustments
PGAs are designed to pass through changes in natural gas costs to Avista Utilities' customers with no change in utility margin (operating revenues less resource costs) or net income. In Oregon, we absorb (cost or benefit) 10 percent of the difference between
38
AVISTA CORPORATION
actual and projected natural gas costs included in retail rates for supply that is not hedged. Total net deferred natural gas costs among all jurisdictions were assets of $14.7 million and $1.4 million as of September 30, 2021 and December 31, 2020, respectively.
Power Cost Deferrals and Recovery Mechanisms
The ERM is an accounting method used to track certain differences between Avista Utilities' actual power supply costs, net of wholesale sales and sales of fuel, and the amount included in base retail rates for our Washington customers. Under the ERM, Avista Utilities makes an annual filing on or before April 1 of each year to provide the opportunity for the WUTC staff and other interested parties to review the prudence of and audit the ERM deferred power cost transactions for the prior calendar year. See the 2020 Form 10-K for a full discussion of the mechanics of the ERM and the various sharing bands. Total net deferred power costs under the ERM were liabilities of $19.6 million and $37.9 million as of September 30, 2021 and December 31, 2020, respectively. These deferred power cost balances represent amounts due to customers. Pursuant to WUTC requirements, should the cumulative deferral balance exceed $30 million in the rebate or surcharge direction, we must make a filing with the WUTC to adjust customer rates to either return the balance to customers or recover the balance from customers.
Avista Utilities has a PCA mechanism in Idaho that allows us to modify electric rates on October 1 of each year with IPUC approval. Under the PCA mechanism, we defer 90 percent of the difference between certain actual net power supply expenses and the amount included in base retail rates for our Idaho customers. The October 1 rate adjustments recover or rebate power supply costs deferred during the preceding July-June twelve-month period. Total net power supply costs deferred under the PCA mechanism were assets of $11.6 million as of September 30, 2021 and $2.5 million as of December 31, 2020. These deferred power cost balances represent amounts due from customers.
Decoupling Mechanisms
Decoupling (also known as an FCA in Idaho) is a mechanism designed to sever the link between a utility's revenues and consumers' energy usage. In each of our jurisdictions, Avista Utilities' electric and natural gas revenues are adjusted so as to be based on the number of customers in certain customer rate classes and assumed "normal" kilowatt hour and therm sales, rather than being based on actual kilowatt hour and therm sales. The difference between revenues based on the number of customers and "normal" sales and revenues based on actual usage is deferred and either surcharged or rebated to customers beginning in the following year. Only residential and certain commercial customer classes are included in our decoupling mechanisms. See the 2020 Form 10-K for a discussion of the mechanisms in each jurisdiction.
Total net cumulative decoupling deferrals among all jurisdictions were regulatory assets of $8.7 million as of September 30, 2021 and $21.3 million as of December 31, 2020. These decoupling assets represent amounts due from customers.
See "Results of Operations - Avista Utilities" for further discussion of the amounts recorded to operating revenues in 2021 and 2020 related to the decoupling mechanisms.
Results of Operations - Overall
The following provides an overview of changes in our Condensed Consolidated Statements of Income. More detailed explanations are provided, particularly for operating revenues and operating expenses, in the business segment discussions (Avista Utilities, AEL&P, and the other businesses) that follow this section.
The balances included below for utility operations reconcile to the Condensed Consolidated Statements of Income.
39
AVISTA CORPORATION
Three months ended September 30, 2021 compared to the three months ended September 30, 2020
The following graph shows the total change in net income for the third quarter of 2021 compared to the third quarter of 2020, as well as the various factors that caused such change (dollars in millions):
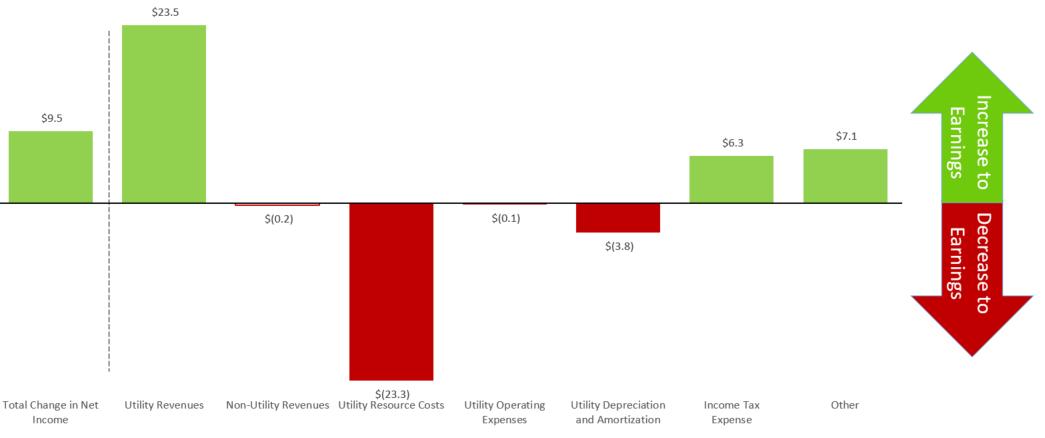
Utility revenues increased at Avista Utilities when compared to the third quarter of 2020. This was primarily due to warmer weather than the third quarter of 2020, customer growth, and reduced COVID-19 restrictions. In addition, utility revenues increased due to general rate increases in Oregon.
Utility resource costs increased at Avista Utilities due to increased purchased power, fuel for generation and other fuel costs, as well as higher natural gas purchases. See "Summer Weather Conditions" in the Executive Level Summary above for further discussion on the increase in net power supply expenses. There was also an increase at AEL&P due to an increase in deferred power supply expenses.
Utility operating expenses slightly increased when compared to the third quarter of 2020. This increase includes $2.5 million of SmartBurn technology assets disallowed for recovery through rates in the Washington 2020 rate case final order. This additional expense was offset by $1.9 million of deferred incremental wildfire expenses incurred from January 1, 2021 to September 30, 2021 as approved by WUTC, as well as a decrease in bad debt expense when compared to the third quarter of 2020. During the third quarter of 2020, we had only received regulatory approval to defer COVID-19 related bad debt expense in our Idaho jurisdiction, whereas we deferred COVID-19 related bad debt expense for Washington and Oregon jurisdictions during the third quarter of 2021.
Utility depreciation and amortization increased primarily due to additions to utility plant.
Income tax expense decreased primarily due to a change in tax methodology to a flow through method, as accepted by IPUC and WUTC through our general rate cases. See “Note 7 of the Notes to Condensed Consolidated Financial Statements” for further details and a reconciliation of our effective tax rate.
The increase in other was primarily related to net investment gains during the third quarter of 2021, compared to net investment losses during the third quarter of 2020.
40
AVISTA CORPORATION
Nine months ended September 30, 2021 compared to the nine months ended September 30, 2020
The following graph shows the total change in net income for the nine months ended September 30, 2021 compared to the nine months ended September 30, 2020, as well as various factors that caused such change (dollars in millions):
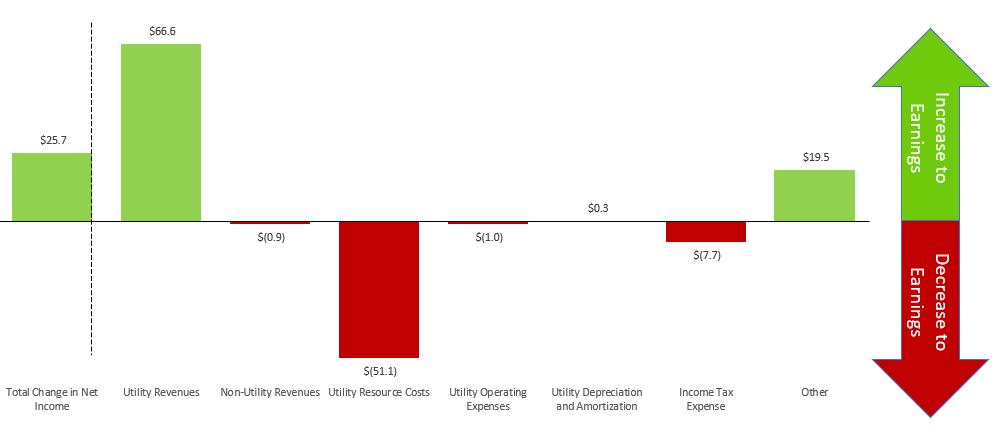
Utility revenues increased at Avista Utilities primarily due increased loads from non-decoupled customers as a result of reduced COVID-19 restrictions during the nine months ended September 30, 2021 and weather that was warmer than normal and the prior year. In addition, utility revenues increased due to general rate increases in Washington, Idaho and Oregon and customer growth. During the first nine months of 2020, there was a $4.9 million decrease to revenue due to the outcome of the 2015 Washington general rate cases.
Utility resource costs increased at Avista Utilities due to increased purchased power, fuel for generation and other fuel costs, as well as higher natural gas purchases. See "Summer Weather Conditions" in the Executive Level Summary above for further discussion of the increased net power supply costs. There was an increase at AEL&P due to an increase in deferred power supply expenses.
The increase in utility operating expenses was primarily due to increases in generation and distribution operating and maintenance costs at Avista Utilities, as well as a $2.5 million write off of Colstrip SmartBurn technology assets disallowed under the 2020 Washington general rate case. The increases were partially offset by an accrual during the nine months ended September 30, 2020 for disallowed replacement power during an unplanned outage at Colstrip and a decrease in bad debt expense when compared to the nine months ended September 30, 2020. During the first nine months of 2020, we had only received regulatory approval to defer COVID-19 related bad debt expense in our Idaho jurisdiction, whereas we deferred COVID-19 related bad debt expense for all jurisdictions during the first nine months of 2021.
Utility depreciation and amortization decreased primarily due to a one-time increase to depreciation expense during the first nine months of 2020 as we were able to utilize $10.9 million ($8.4 million when tax-effected) of electric tax benefits to offset costs associated with accelerating the depreciation of Colstrip based on a settlement in Washington. This was mostly offset by additions to utility plant.
Income taxes increased primarily due to a decrease in tax expense during the nine months ended September 30, 2020 related to the offset of $8.4 million of deferred income taxes against accelerated depreciation for Colstrip based on a settlement in Washington and an increase in pre-tax earnings. This was offset by a change in tax methodology to flow through method for certain items in 2021, as accepted by IPUC and WUTC through our general rate cases. Our effective tax rate was 8.6 percent for the first nine months of 2021
41
AVISTA CORPORATION
compared to 2.0 percent for the first nine months of 2020. See “Note 7 of the Notes to Condensed Consolidated Financial Statements” for further details and a reconciliation of our effective tax rate.
The increase in other was primarily related to net investment gains during the first nine months of 2021, compared to net investment losses during the first nine months of 2020. Additionally, other increased due to the sale of certain subsidiary assets associated with the Spokane Steam Plant during the first nine months of 2021.
Non-GAAP Financial Measures
The following discussion for Avista Utilities includes two financial measures that are considered “non-GAAP financial measures”: electric utility margin and natural gas utility margin. In the AEL&P section, we include a discussion of utility margin, which is also a non-GAAP financial measure.
Generally, a non-GAAP financial measure is a numerical measure of a company's financial performance, financial position or cash flows that excludes (or includes) amounts that are included (excluded) in the most directly comparable measure calculated and presented in accordance with GAAP. Electric utility margin is electric operating revenues less electric resource costs, while natural gas utility margin is natural gas operating revenues less natural gas resource costs. The most directly comparable GAAP financial measure to electric and natural gas utility margin is utility operating revenues as presented in "Note 17 of the Notes to Condensed Consolidated Financial Statements."
The presentation of electric utility margin and natural gas utility margin is intended to enhance the understanding of operating performance. We use these measures internally and believe they provide useful information to investors in their analysis of how changes in loads (due to weather, economic or other conditions), rates, supply costs and other factors impact our results of operations. Changes in loads, as well as power and natural gas supply costs, are generally deferred and recovered from customers through regulatory accounting mechanisms. Accordingly, the analysis of utility margin generally excludes most of the change in revenue resulting from these regulatory mechanisms. We present electric and natural gas utility margin separately below for Avista Utilities since each business has different cost sources, cost recovery mechanisms and jurisdictions, so we believe that separate analysis is beneficial. These measures are not intended to replace utility operating revenues as determined in accordance with GAAP as an indicator of operating performance. Reconciliations of operating revenues to utility margin are set forth below.
42
AVISTA CORPORATION
Results of Operations - Avista Utilities
Three months ended September 30, 2021 compared to the three months ended September 30, 2020
Utility Operating Revenues
The following graphs present Avista Utilities' electric operating revenues and megawatt-hour (MWh) sales for the three months ended September 30, 2021 and 2020 (dollars in millions and MWhs in thousands):
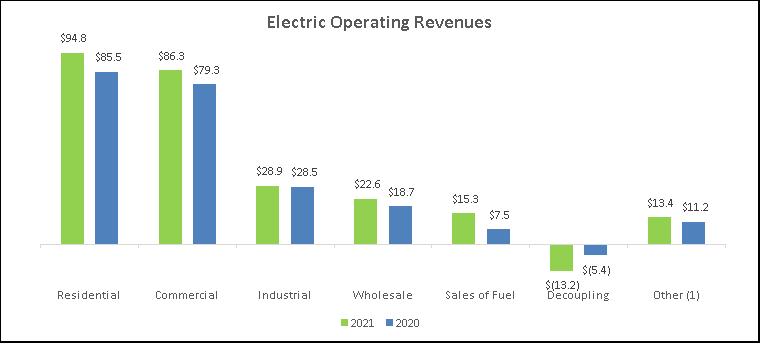
Total electric operating revenues in the graph above include intracompany sales of $9.4 million and $10.2 million for the three months ended September 30, 2021 and 2020, respectively.
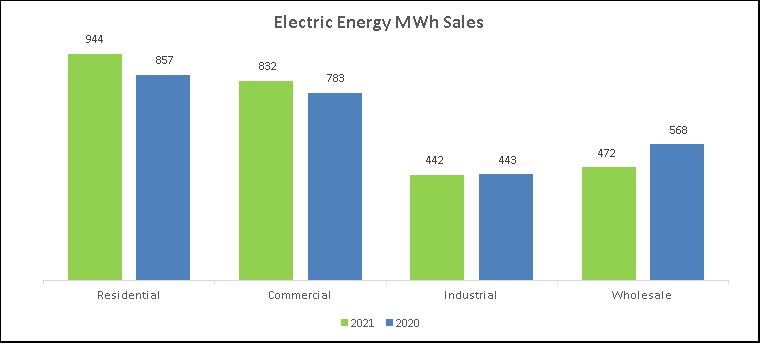
43
AVISTA CORPORATION
The following table presents the current year deferrals and the amortization of prior year decoupling balances that are reflected in utility electric operating revenues for the three months ended September 30 (dollars in thousands):
|
| Electric Decoupling Revenues |
| |||||
|
| 2021 |
|
| 2020 |
| ||
Current year decoupling deferrals (a) |
| $ | (9,508 | ) |
| $ | (1,316 | ) |
Amortization of prior year decoupling deferrals (b) |
|
| (3,667 | ) |
|
| (4,067 | ) |
Total electric decoupling revenue |
| $ | (13,175 | ) |
| $ | (5,383 | ) |
Total electric revenues increased $22.8 million for the third quarter of 2021 as compared to the third quarter of 2020. The primary fluctuations that occurred during the period were as follows:
44
AVISTA CORPORATION
The following graphs present Avista Utilities' natural gas operating revenues and therms delivered for the three months ended September 30, 2021 and 2020 (dollars in millions and therms in thousands):
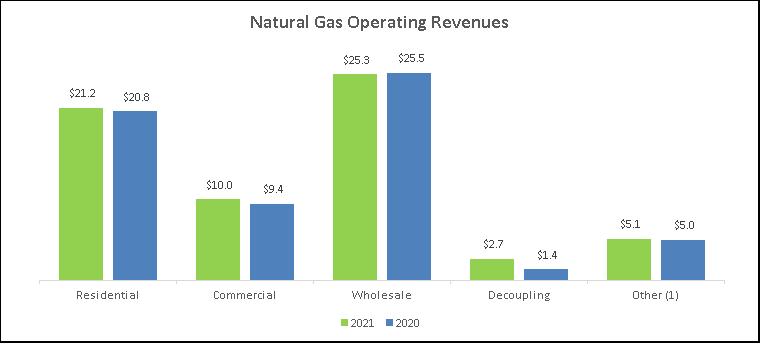
Total natural gas operating revenues in the graph above include intracompany sales of $16.3 million and $13.8 million for the three months ended September 30, 2021 and 2020, respectively.
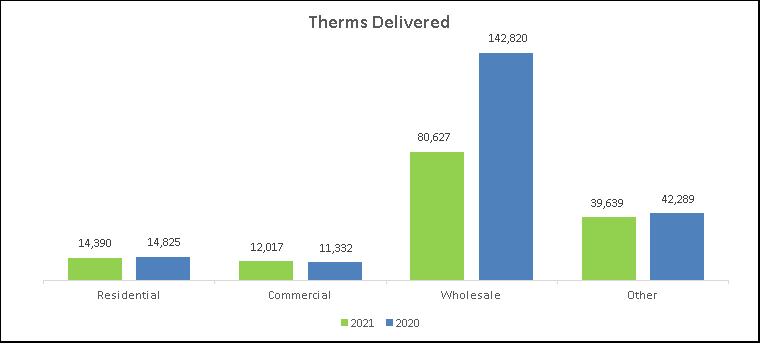
45
AVISTA CORPORATION
The following table presents the current year deferrals and the amortization of prior year decoupling balances that are reflected in utility natural gas operating revenues for the three months ended September 30 (dollars in thousands):
|
| Natural Gas Decoupling Revenues |
| |||||
|
| 2021 |
|
| 2020 |
| ||
Current year decoupling deferrals (a) |
| $ | 2,458 |
|
| $ | 1,540 |
|
Amortization of prior year decoupling deferrals (b) |
|
| 218 |
|
|
| (129 | ) |
Total natural gas decoupling revenue |
| $ | 2,676 |
|
| $ | 1,411 |
|
Total natural gas revenues increased $2.2 million for the third quarter of 2021 as compared to the third quarter of 2020. The primary fluctuations that occurred during the period were as follows:
The following table presents Avista Utilities' average number of electric and natural gas retail customers for the three months ended September 30, 2021 and 2020:
|
| Electric Customers |
|
| Natural Gas Customers |
| ||||||||||
|
| 2021 |
|
| 2020 |
|
| 2021 |
|
| 2020 |
| ||||
Residential |
|
| 356,846 |
|
|
| 350,831 |
|
|
| 332,403 |
|
|
| 327,073 |
|
Commercial |
|
| 44,117 |
|
|
| 43,510 |
|
|
| 36,329 |
|
|
| 36,074 |
|
Interruptible |
|
| — |
|
|
| — |
|
|
| 44 |
|
|
| 40 |
|
Industrial |
|
| 1,204 |
|
|
| 1,297 |
|
|
| 191 |
|
|
| 239 |
|
Public street and highway lighting |
|
| 680 |
|
|
| 629 |
|
|
| — |
|
|
| — |
|
Total retail customers |
|
| 402,847 |
|
|
| 396,267 |
|
|
| 368,967 |
|
|
| 363,426 |
|
46
AVISTA CORPORATION
Utility Resource Costs
The following graphs present Avista Utilities' resource costs for the three months ended September 30, 2021 and 2020 (dollars in millions):
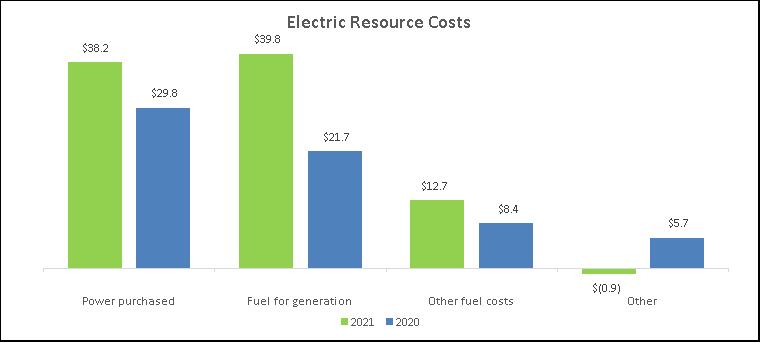
Total electric resource costs in the graph above include intracompany resource costs of $16.3 million and $13.8 million for the three months ended September 30, 2021 and 2020, respectively.
Total electric resource costs increased $24.4 million for the third quarter of 2021 as compared to the third quarter of 2020. The primary fluctuations that occurred during the period were as follows:
47
AVISTA CORPORATION
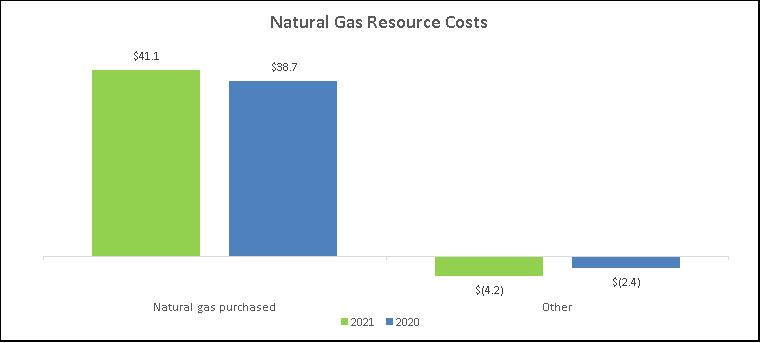
Total natural gas resource costs in the graph above include intracompany resource costs of $9.4 million and $10.2 million for the three months ended September 30, 2021 and 2020, respectively.
Total natural gas resource costs increased $0.6 million for the third quarter of 2021 as compared to the third quarter of 2020 primarily due to the following:
Utility Margin
The following table reconciles Avista Utilities' operating revenues, as presented in "Note 17 of the Notes to Condensed Consolidated Financial Statements" to the Non-GAAP financial measure utility margin for the three months ended September 30, 2021 and 2020 (dollars in thousands):
|
| Electric |
|
| Natural Gas |
|
| Intracompany |
|
| Total |
| ||||||||||||||||||||
|
| 2021 |
|
| 2020 |
|
| 2021 |
|
| 2020 |
|
| 2021 |
|
| 2020 |
|
| 2021 |
|
| 2020 |
| ||||||||
Operating revenues |
| $ | 248,110 |
|
| $ | 225,416 |
|
| $ | 64,299 |
|
| $ | 62,107 |
|
| $ | (25,657 | ) |
| $ | (23,959 | ) |
| $ | 286,752 |
|
| $ | 263,564 |
|
Resource costs |
|
| 89,894 |
|
|
| 65,527 |
|
|
| 36,872 |
|
|
| 36,275 |
|
|
| (25,657 | ) |
|
| (23,959 | ) |
|
| 101,109 |
|
|
| 77,843 |
|
Utility margin |
| $ | 158,216 |
|
| $ | 159,889 |
|
| $ | 27,427 |
|
| $ | 25,832 |
|
| $ | — |
|
| $ | — |
|
| $ | 185,643 |
|
| $ | 185,721 |
|
Electric utility margin decreased $1.7 million and natural gas utility margin increased $1.6 million.
Electric utility margin decreased primarily due to increased net power supply costs as compared to the prior year. For the third quarter of 2021, we had a $3.8 million pre-tax expense under the ERM in Washington, compared to a $0.3 million pre-tax benefit for the third quarter of 2020. The increase in net power supply costs was due to the hot, dry weather conditions experienced in 2021 (see "Summer Weather Conditions" in the Executive Level Summary above).
Natural gas utility margin increased primarily due to a general rate increase in Oregon, effective January 16, 2021 and customer growth.
48
AVISTA CORPORATION
Intracompany revenues and resource costs represent purchases and sales of natural gas between our natural gas distribution operations and our electric generation operations (as fuel for our generation plants). These transactions are eliminated in the presentation of total results for Avista Utilities and in the condensed consolidated financial statements but are included in the separate results for electric and natural gas presented above.
Nine months ended September 30, 2021 compared to the nine months ended September 30, 2020
Utility Operating Revenues
The following graphs present Avista Utilities' electric operating revenues and megawatt-hour (MWh) sales for the nine months ended September 30, 2021 and 2020 (dollars in millions and MWhs in thousands):
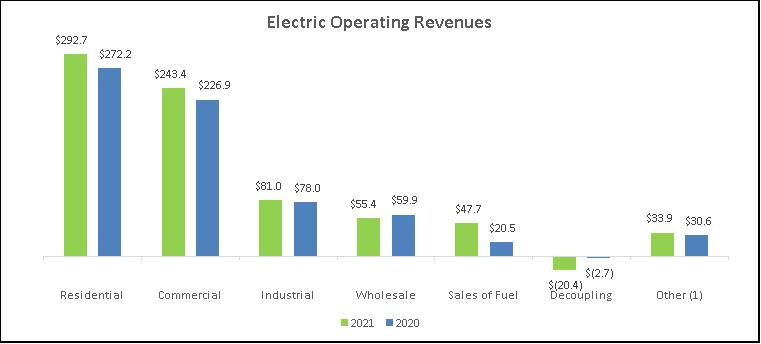
49
AVISTA CORPORATION
Total electric operating revenues in the graph above include intracompany sales of $21.9 million and $25.1 million for the nine months ended September 30, 2021 and 2020, respectively.
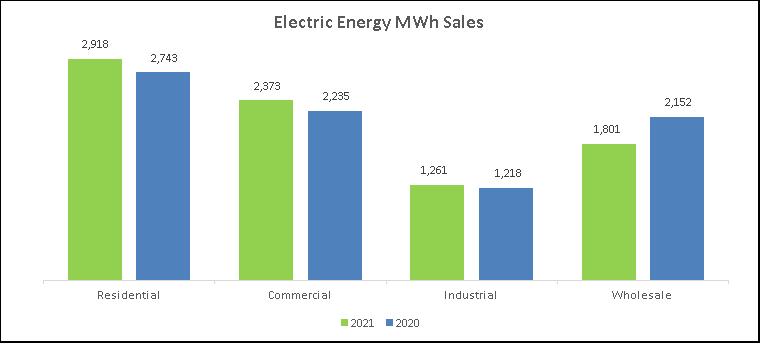
The following table presents the current year deferrals and the amortization of prior year decoupling balances that are reflected in utility electric operating revenues for the nine months ended September 30 (dollars in thousands):
|
| Electric Decoupling Revenues |
| |||||
|
| 2021 |
|
| 2020 |
| ||
Current year decoupling deferrals (a) |
| $ | (9,947 | ) |
| $ | 9,657 |
|
Amortization of prior year decoupling deferrals (b) |
|
| (10,461 | ) |
|
| (12,333 | ) |
Total electric decoupling revenue |
| $ | (20,408 | ) |
| $ | (2,676 | ) |
Total electric revenues increased $48.3 million for the first nine months of 2021 as compared to the first nine months of 2020. The primary fluctuations that occurred during the period were as follows:
50
AVISTA CORPORATION
The following graphs present Avista Utilities' natural gas operating revenues and therms delivered for the nine months ended September 30, 2021 and 2020 (dollars in millions and therms in thousands):
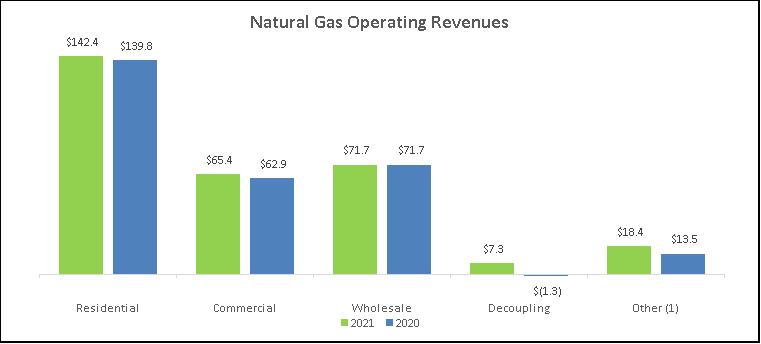
Total natural gas operating revenues in the graph above include intracompany sales of $42.8 million and $37.8 million for the nine months ended September 30, 2021 and 2020, respectively.
51
AVISTA CORPORATION
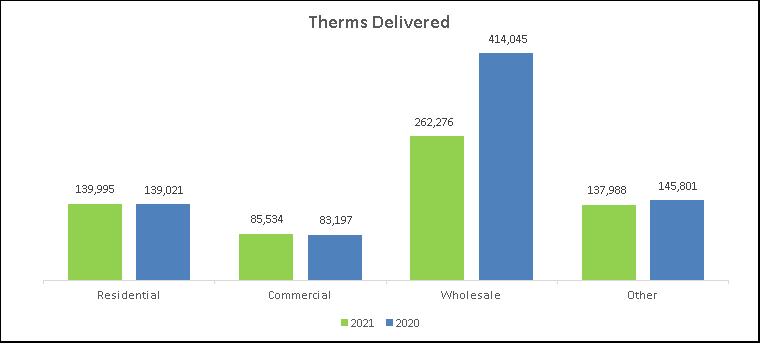
The following table presents the current year deferrals and the amortization of prior year decoupling balances that are reflected in utility natural gas operating revenues for the nine months ended September 30 (dollars in thousands):
|
| Natural Gas Decoupling Revenues |
| |||||
|
| 2021 |
|
| 2020 |
| ||
Current year decoupling deferrals (a) |
| $ | 5,348 |
|
| $ | 641 |
|
Amortization of prior year decoupling deferrals (b) |
|
| 1,991 |
|
|
| (1,988 | ) |
Total natural gas decoupling revenue |
| $ | 7,339 |
|
| $ | (1,347 | ) |
Total natural gas revenues increased $18.6 million for the first nine months of 2021 as compared to the first nine months of 2020. The primary fluctuations that occurred during the period were as follows:
52
AVISTA CORPORATION
The following table presents Avista Utilities' average number of electric and natural gas retail customers for the nine months ended September 30, 2021 and 2020:
|
| Electric Customers |
|
| Natural Gas Customers |
| ||||||||||
|
| 2021 |
|
| 2020 |
|
| 2021 |
|
| 2020 |
| ||||
Residential |
|
| 355,613 |
|
|
| 349,890 |
|
|
| 331,441 |
|
|
| 326,568 |
|
Commercial |
|
| 44,064 |
|
|
| 43,399 |
|
|
| 36,425 |
|
|
| 36,139 |
|
Interruptible |
|
| — |
|
|
| — |
|
|
| 42 |
|
|
| 40 |
|
Industrial |
|
| 1,208 |
|
|
| 1,297 |
|
|
| 191 |
|
|
| 240 |
|
Public street and highway lighting |
|
| 664 |
|
|
| 639 |
|
|
| — |
|
|
| — |
|
Total retail customers |
|
| 401,549 |
|
|
| 395,225 |
|
|
| 368,099 |
|
|
| 362,987 |
|
Utility Resource Costs
The following graphs present Avista Utilities' resource costs for the nine months ended September 30, 2021 and 2020 (dollars in millions):
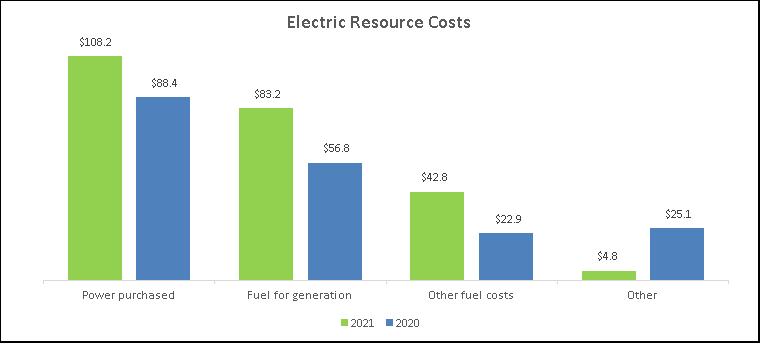
Total electric resource costs in the graph above include intracompany resource costs of $42.8 million and $37.8 million for the nine months ended September 30, 2021 and 2020, respectively.
53
AVISTA CORPORATION
Total electric resource costs increased $45.9 million for the first nine months of 2021 as compared to the first nine months of 2020. The primary fluctuations that occurred during the period were as follows:
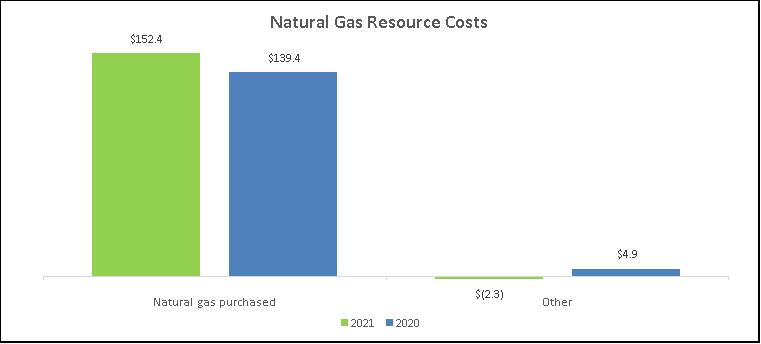
Total natural gas resource costs in the graph above include intracompany resource costs of $21.9 million and $25.1 million for the nine months ended September 30, 2021 and 2020, respectively.
Total natural gas resource costs increased $5.9 million for the first nine months of 2021 as compared to the first nine months of 2020 primarily due to the following:
54
AVISTA CORPORATION
Utility Margin
The following table reconciles Avista Utilities' operating revenues, as presented in "Note 17 of the Notes to Condensed Consolidated Financial Statements" to the Non-GAAP financial measure utility margin for the nine months ended September 30, 2021 and 2020 (dollars in thousands):
|
| Electric |
|
| Natural Gas |
|
| Intracompany |
|
| Total |
| ||||||||||||||||||||
|
| 2021 |
|
| 2020 |
|
| 2021 |
|
| 2020 |
|
| 2021 |
|
| 2020 |
|
| 2021 |
|
| 2020 |
| ||||||||
Operating revenues |
| $ | 733,709 |
|
| $ | 685,409 |
|
| $ | 305,165 |
|
| $ | 286,612 |
|
| $ | (64,702 | ) |
| $ | (62,912 | ) |
| $ | 974,172 |
|
| $ | 909,109 |
|
Resource costs |
|
| 239,050 |
|
|
| 193,150 |
|
|
| 150,116 |
|
|
| 144,230 |
|
|
| (64,702 | ) |
|
| (62,912 | ) |
|
| 324,464 |
|
|
| 274,468 |
|
Utility margin |
| $ | 494,659 |
|
| $ | 492,259 |
|
| $ | 155,049 |
|
| $ | 142,382 |
|
| $ | — |
|
| $ | — |
|
| $ | 649,708 |
|
| $ | 634,641 |
|
Electric utility margin increased $2.4 million and natural gas utility margin increased $12.7 million.
Electric utility margin increased primarily due to customer growth and a general rate increase in Washington, effective April 1, 2020. In addition, the first three quarters of 2020 included an accrual for customer refunds of $1.4 million related to our 2015 Washington general rate case. This was partially offset by an increase in net power supply costs as compared to the prior year due, in part, to the hot, dry weather conditions experienced in 2021 (see "Summer Weather Conditions" in the Executive Level Summary above). For the first nine months of 2021, we had a $7.1 million pre-tax expense under the ERM in Washington, compared to a $5.9 million pre-tax benefit for the first nine months of 2020.
Natural gas utility margin increased primarily due to a general rate increase in Oregon, effective January 16, 2021 and Washington, effective April 1, 2020, and customer growth. Also, the first quarter of 2020 included an accrual for customer refunds of $3.6 million related to our 2015 Washington general rate case.
Intracompany revenues and resource costs represent purchases and sales of natural gas between our natural gas distribution operations and our electric generation operations (as fuel for our generation plants). These transactions are eliminated in the presentation of total results for Avista Utilities and in the condensed consolidated financial statements but are included in the separate results for electric and natural gas presented above.
Results of Operations - Alaska Electric Light and Power Company
Three months ended September 30, 2021 compared to the three months ended September 30, 2020 and nine months ended September 30, 2021 compared to the nine months ended September 30, 2020
Net income for AEL&P was less than $0.1 million for the three months ended September 30, 2021 and $0.3 for the three months ended September 30, 2020. Net income was $4.8 million for the nine months ended September 30, 2021 compared to $5.0 million for the nine months ended September 30, 2020.
The following table presents AEL&P's operating revenues, resource costs and resulting utility margin for the three and nine months ended September 30, 2021 and 2020 (dollars in thousands):
|
| Three months ended September 30, |
|
| Nine months ended September 30, |
| ||||||||||
|
| 2021 |
|
| 2020 |
|
| 2021 |
|
| 2020 |
| ||||
Operating revenues |
| $ | 9,147 |
|
| $ | 8,815 |
|
| $ | 32,515 |
|
| $ | 31,014 |
|
Resource costs |
|
| 1,024 |
|
|
| 942 |
|
|
| 2,926 |
|
|
| 1,829 |
|
Utility margin |
| $ | 8,123 |
|
| $ | 7,873 |
|
| $ | 29,589 |
|
| $ | 29,185 |
|
Utility margin increased slightly for 2021, primarily due to higher sales volumes to commercial customers for 2021 compared to 2020.
Results of Operations - Other Businesses
Our other businesses had net income of $5.2 million for the three months ended September 30, 2021 compared to a net loss of $0.9 million for the three months ended September 30, 2020. Net income was $10.8 million for the nine months ended September 30, 2021 compared to a net loss of $3.4 million for the nine months ended September 30, 2020.
55
AVISTA CORPORATION
The increase in net income primarily relates to net investment gains during the three and nine months ended September 30, 2021. This is compared to 2020 that resulted in net investment losses. In addition, 2021 net income increased due to the sale of certain subsidiary assets associated with the Spokane Steam Plant during the second quarter of 2021. During the first nine months of 2020 there was an impairment loss and an accrual for bad debt.
Critical Accounting Policies and Estimates
The preparation of our consolidated financial statements in conformity with GAAP requires us to make estimates and assumptions that affect amounts reported in the consolidated financial statements. Changes in these estimates and assumptions are considered reasonably possible and may have a material effect on our consolidated financial statements and thus, actual results could differ from the amounts reported and disclosed herein. Our critical accounting policies that require the use of estimates and assumptions were discussed in detail in the 2020 Form 10-K and have not changed materially.
Liquidity and Capital Resources
Overall Liquidity
Our sources of overall liquidity and the requirements for liquidity have not materially changed in the nine months ended September 30, 2021. See the 2020 Form 10-K for further discussion.
In April 2021, we repaid our $100 million credit agreement.
As of September 30, 2021, we had $105.4 million of available liquidity under the Avista Corp. committed line of credit and $25.0 million under the AEL&P committed line of credit. With our $400.0 million credit facility that expires in June 2026 and AEL&P's $25.0 million credit facility that expires in November 2024, we believe that we have adequate liquidity to meet our needs for the next 12 months.
Review of Cash Flow Statement
Operating Activities
Net cash provided by operating activities was $228.9 million for the nine months ended September 30, 2021, compared to $282.5 million for the nine months ended September 30, 2020. The decrease is primarily due to an increase in power and natural gas cost deferrals, which decreased cash flows by $40.2 million, as compared to a decrease to operating cash flows of $6.5 million in 2020. Additionally, during the nine months ended September 30, 2021 we contributed $42.0 million to the pension plan, compared to $22.0 million in 2020. Additionally, changes in certain current assets and liabilities decreased cash provided by operating activities by $34.0 million.
Investing Activities
Net cash used in investing activities was $326.9 million for the nine months ended September 30, 2021, compared to $301.0 million for the nine months ended September 30, 2020. During the nine months ended September 30, 2021, we paid $322.8 million for utility capital expenditures compared to $297.8 million for the nine months ended September 30, 2020.
Financing Activities
Net cash provided by financing activities was $103.0 million for the nine months ended September 30, 2021, compared to net cash provided of $93.3 million for the nine months ended September 30, 2020. In the nine months ended September 30, 2021, we increased our short term borrowings by $66.0 million, compared to decreasing short term borrowings by $35.8 million in 2020. This was offset by a decrease in the issuance of long term debt during the period, from $165.0 million in 2020 to $70.0 million in 2021.
56
AVISTA CORPORATION
Capital Resources
Our consolidated capital structure, including the current portion of long-term debt and short-term borrowings consisted of the following as of September 30, 2021 and December 31, 2020 (dollars in thousands):
|
| September 30, 2021 |
|
| December 31, 2020 |
| ||||||||||
|
| Amount |
|
| Percent |
|
| Amount |
|
| Percent |
| ||||
Current portion of long-term debt and leases |
| $ | 257,337 |
|
|
| 5.6 | % |
| $ | 7,184 |
|
|
| 0.2 | % |
Short-term borrowings |
|
| 199,075 |
|
|
| 4.3 | % |
|
| 203,000 |
|
|
| 4.6 | % |
Long-term debt to affiliated trusts |
|
| 51,547 |
|
|
| 1.1 | % |
|
| 51,547 |
|
|
| 1.2 | % |
Long-term debt and leases |
|
| 2,014,212 |
|
|
| 43.5 | % |
|
| 2,125,065 |
|
|
| 48.0 | % |
Total debt |
|
| 2,522,171 |
|
|
| 54.5 | % |
|
| 2,386,796 |
|
|
| 54.0 | % |
Total Avista Corporation shareholders’ equity |
|
| 2,101,636 |
|
|
| 45.5 | % |
|
| 2,029,726 |
|
|
| 46.0 | % |
Total |
| $ | 4,623,807 |
|
|
| 100.0 | % |
| $ | 4,416,522 |
|
|
| 100.0 | % |
Our shareholders’ equity increased $71.9 million during the first nine months of 2021 primarily due to net income and the issuance of common stock, which was partially offset by dividends.
We need to finance capital expenditures and acquire additional funds for operations from time to time. The cash requirements needed to service our indebtedness, both short-term and long-term, reduce the amount of cash flow available to fund capital expenditures, purchased power, fuel and natural gas costs, dividends and other requirements.
Committed Lines of Credit
Avista Corp. has a committed line of credit with various financial institutions in the total amount of $400.0 million. In June 2021, we entered into an amendment that extends the expiration date to June 2026, with the option to extend for an additional one year period (subject to customary conditions). The committed line of credit is secured by non-transferable first mortgage bonds we issued to the agent bank that would only become due and payable in the event, and then only to the extent, that we default on our obligations under the committed line of credit.
The Avista Corp. credit facility contains customary covenants, including a covenant which does not permit our ratio of “consolidated total debt” to “consolidated total capitalization” to be greater than 65 percent at the end of any fiscal quarter, and customary events of default, including a Change in Control (as defined in the agreement). As of September 30, 2021, we were in compliance with this covenant with a ratio of 54.5 percent.
AEL&P has a $25.0 million committed line of credit that expires in November 2024. As of September 30, 2021, there were no borrowings or letters of credit outstanding under this committed line of credit.
The AEL&P credit facility contains customary covenants and default provisions including a covenant which does not permit the ratio of “consolidated total debt at AEL&P” to “consolidated total capitalization at AEL&P” (including the impact of the Snettisham obligation) to be greater than 67.5 percent at any time. As of September 30, 2021, AEL&P was in compliance with this covenant with a ratio of 51.3 percent.
Balances outstanding and interest rates of borrowings under Avista Corp.'s committed line of credit were as follows as of and for the nine months ended September 30 (dollars in thousands):
|
| 2021 |
|
| 2020 |
| ||
Borrowings outstanding at end of period |
| $ | 269,000 |
|
| $ | 50,000 |
|
Letters of credit outstanding at end of period |
| $ | 25,618 |
|
| $ | 25,573 |
|
Maximum borrowings outstanding during the period |
| $ | 338,000 |
|
| $ | 257,000 |
|
Average borrowings outstanding during the period |
| $ | 190,641 |
|
| $ | 178,537 |
|
Average interest rate on borrowings during the period |
|
| 1.15 | % |
|
| 1.28 | % |
Average interest rate on borrowings at end of period |
|
| 1.09 | % |
|
| 1.20 | % |
57
AVISTA CORPORATION
As of September 30, 2021, Avista Corp. and its subsidiaries were in compliance with all of the covenants of their financing agreements, and none of Avista Corp.'s subsidiaries constituted a “significant subsidiary” as defined in Avista Corp.'s committed line of credit.
Liquidity Expectations
During 2021, we expect to issue approximately $140 million of long-term debt and $90 million of common stock (including $70.0 million of long-term debt and $61.3 million of common stock issued during the nine months ended September 30, 2021). During 2022, we expect to issue approximately $370 million of long-term debt and $90 million of common stock in order to refinance $250 million of maturing long-term debt and fund capital expenditures.
After considering the expected issuances of long-term debt and common stock during 2021, we expect net cash flows from operations, together with cash available under our committed lines of credit to provide adequate resources to fund capital expenditures, dividends, and other contractual commitments.
Capital Expenditures
We are making capital investments to enhance service and system reliability for our customers and replace aging infrastructure. We expect Avista Utilities capital expenditures to $450 million in 2021, and about $445 million for each of 2022 and 2023 to support continued customer growth and maintain our system to provide safe, reliable energy to our customers. See the 2020 Form 10-K for further information on our expected capital expenditures.
Off-Balance Sheet Arrangements
As of September 30, 2021, we had $25.6 million in letters of credit outstanding under our $400.0 million committed line of credit, compared to $27.6 million as of December 31, 2020.
Pension Plan
Avista Utilities
In the nine months ended September 30, 2021 we contributed $42.0 million to the pension plan, fulfilling our expected contributions for 2021. We expect to contribute a total of $108 million to the pension plan in the period 2022 through 2025, with annual contributions of $42 million in 2022 and $22 million in 2023 to 2025.
The final determination of pension plan contributions for future periods is subject to multiple variables, most of which are beyond our control, including changes to the fair value of pension plan assets, changes in actuarial assumptions (in particular the discount rate used in determining the benefit obligation), or changes in federal legislation. We may change our pension plan contributions in the future depending on changes to any variables, including those listed above.
See "Note 6 of the Notes to Condensed Consolidated Financial Statements" for additional information regarding the pension plan.
Contractual Obligations
Our future contractual obligations have not materially changed during the nine months ended September 30, 2021, except for the following:
See the 2020 Form 10-K for our contractual obligations.
58
AVISTA CORPORATION
Environmental Issues and Contingencies
Our environmental issues and contingencies disclosures have not materially changed during the nine months ended September 30, 2021 except as discussed below:
Clean Energy Commitment
In April 2019, we announced a goal to serve our customers with 100 percent clean electricity by 2045 and to have a carbon-neutral supply of electricity by the end of 2027. To help achieve our goals and add to our clean electricity portfolio we have implemented renewable energy projects on behalf of our customers, including the Solar Select project (28 MW) in Lind, Washington (PPA) and the Rattlesnake Flat Wind project (144 MW) in Adams County, Washington (PPA). We also entered into a PPA for an additional 5 percent of the output from Chelan PUD’s hydroelectric projects. The contract with Chelan PUD begins in 2024. These resources are in addition to our existing clean hydroelectric generation, biomass generation, and other wind and solar projects.
To achieve our clean energy goals, we expect that energy storage and other technologies, which are either not currently available or are not cost-effective under a lowest reasonable cost regulatory standard, will advance such that those technologies will assist us in meeting our goals while also maintaining reliability and affordability for our customers. If the required technology is not available or not affordable in the future, we may not meet our goals in the desired timeframe. Meeting our clean energy goals may also require accommodation from economic regulatory agencies insofar as the Company may need to acquire emission offsets to meet its goals.
Washington Clean Energy Implementation Plan
In October 2021, Avista Utilities filed its first Clean Energy Implementation Plan (CEIP) with the WUTC. This filing will trigger comments from interested parties in early 2022, with WUTC action to follow thereafter in 2022.
Our CEIP is a road map of specific actions we propose to take over the next four years (2022-2025) to show the progress being made toward clean energy goals established by the Clean Energy Transformation Act (CETA), which was passed by the Washington legislature and enacted into law in 2019. CETA requires electric supply to be greenhouse gas neutral by 2030 and 100 percent renewable or generated from zero-carbon resources by 2045.
Some highlights of Avista’s CEIP include:
While the CEIP represents our current objectives, it is subject to change from time to time in the future as circumstances warrant.
59
AVISTA CORPORATION
Climate Change
Federal Regulatory Actions
In January 2021, the U.S. Court of Appeals for the District of Columbia Circuit (D.C. Circuit) vacated the Affordable Clean Energy Rule and remanded the record back to the EPA for further consideration consistent with its opinion. The Court also vacated the repeal of the Clean Power Plan (CPP). Subsequently, the EPA indicated, in a February 12, 2021 Memorandum from Acting Assistant Administrator Joseph Goffman that “…EPA understands the decision as leaving neither of those rules, and thus no CAA section 111(d) regulation, in place with respect to greenhouse gas (GHG) emissions from electric generating units (EGUs). As a practical matter, the reinstatement of the CPP would not make sense.”
Washington Climate Commitment Act
In 2021, the legislature passed the Climate Commitment Act, which establishes a cap and invest program to help achieve Washington’s greenhouse gas limits by 2050. The Washington Department of Ecology is responsible for the implementation and the start of this program by January 1, 2023, including the adoption of annual allowance budgets for the first compliance period of the program by October 1, 2022. There are various rule making proceedings regarding the details of the program pending before the Department of Ecology. We will actively monitor and participate in these rulemakings as they proceed but cannot reasonably predict how these programs may impact our facilities at this time.
Oregon Executive Order 20-04
On March 10, 2020, the governor of Oregon issued an Executive Order (EO) establishing GHG emissions reduction goals of at least 45 percent below 1990 emission levels by 2035 and at least 80 percent below 1990 emission levels by 2050 and directed state agencies and commissions to facilitate such GHG emission goals targeting a variety of sources and industries. Although the EO does not specifically direct actions of natural gas distribution businesses like Avista, the OPUC is directed to prioritize proceedings and activities that advance decarbonization in the utility sector, mitigate energy burden experienced by utility customers and ensure system reliability and resource adequacy. The EO also directs other agencies to cap and reduce GHG emissions from transportation fuels and all other liquid and gaseous fuels, including natural gas, adopt building energy efficiency goals for new building construction, reduce methane gas emissions from landfills and food waste, and submit a proposal for adoption of state goals for carbon sequestration and storage by Oregon’s forest, wetlands and agricultural lands.
The Oregon Department of Environmental Quality (ODEQ) is developing cap and reduce rules known as the Climate Protection Program (CPP). Final rules are expected to be considered for adoption by the Environmental Quality Commission in December 2021 and become effective in 2022. The OPUC has opened a Natural Gas Fact-Finding effort to analyze the potential natural gas utility bill impacts that may result from limiting GHG emissions of regulated natural gas utilities under the ODEQ’s CPP and to identify appropriate regulatory tools to mitigate potential customer impacts. According to the OPUC Staff, the ultimate goal of the Fact-Finding Docket will be to inform future policy decisions and other key analyses to be considered in 2022, after the CPP is in place. We expect the OPUC Staff will present a final report on the Fact-Finding effort to the OPUC in February 2022 with recommendations for further OPUC engagement later in 2022.
See the 2020 Form 10-K for further discussion of environmental issues and contingencies.
Other
TSA Security Directive
In July 2021, the Department of Homeland Security, acting through the Transportation Security Administration (TSA), announced the issuance of a security directive that requires owners and operators of TSA-designated critical pipeline facilities that transport hazardous liquids and natural gas to implement specified protections against cyber intrusions. The security directive requires designated owners and operators of such facilities to implement specific mitigation measures to protect against ransomware attacks and other known threats to information and operational technology systems, develop and implement a cybersecurity contingency and recovery plan and conduct a cybersecurity architecture design review.
60
AVISTA CORPORATION
The Company is assessing the extent to which its facilities are or may be affected, directly or indirectly, by the directive. The Company is engaged in a continuous program of testing and updating its cybersecurity measures. As reported in the 2020 Form 10-K, the Company’s natural gas distribution facilities, as well as most of its gas-fired generation facilities, are interconnected with the gas transportation systems of several interstate gas pipelines.
Colstrip
Colstrip is a coal-fired generating plant in southeastern Montana that includes four units and which is owned by six separate entities. We have a 15 percent ownership interest in Units 3 & 4 and provide financing for our ownership interest in the project. The other owners are Puget Sound Energy, Portland General Electric, PacifiCorp, NorthWestern Energy and Talen Montana (which is also the operator of the plant). In January 2020, the owners of Units 1 & 2, in which we have no ownership, closed those two units. The owners of Units 3 & 4 currently share operating and capital costs pursuant to the terms of an operating agreement among them.
See “Note 16 of the Notes to Condensed Consolidated Financial Statements” for discussion of pending arbitration proceedings, recent Montana legislation, and other matters related to Colstrip. See also the 2020 Form 10-K for further discussion of Colstrip.
Enterprise Risk Management
The material risks to our businesses, and our mitigation process and procedures to address these risks, were discussed in our 2020 Form 10-K and have not materially changed during the nine months ended September 30, 2021. See the 2020 Form 10-K.
Financial Risk
Our financial risks have not materially changed during the nine months ended September 30, 2021. Refer to the 2020 Form 10-K. The financial risks included below are required interim disclosures, even if they have not materially changed from December 31, 2020.
Interest Rate Risk
We use a variety of techniques to manage our interest rate risks. We have an interest rate risk policy and have established a policy to limit our variable rate exposures to a percentage of total capitalization. Additionally, interest rate risk is managed by monitoring market conditions when timing the issuance of long-term debt and optional debt redemptions and establishing fixed rate long-term debt with varying maturities. See "Note 5 of the Notes to Condensed Consolidated Financial Statements" for a summary of our interest rate swap derivatives outstanding as of September 30, 2021 and December 31, 2020 and the amount of additional collateral we would have to post in certain circumstances.
Credit Risk
Under the terms of interest rate swap derivatives that we enter into periodically, we may be required to post cash or letters of credit as collateral depending on fluctuations in the fair value of the instrument. A downgrade in our credit ratings could further impact the amount of collateral required. See “Credit Ratings” in the 2020 Form 10-K for further information. As of September 30, 2021, we had interest rate swap derivatives outstanding with a notional amount totaling $170.0 million and we had no cash deposited as collateral and no letters of credit outstanding for these interest rate swap derivatives. If our credit ratings were lowered to below “investment grade” based on our interest rate swap derivatives outstanding at September 30, 2021, we would potentially be required to post the following additional collateral (in thousands):
|
| September 30, 2021 |
| |
Additional collateral taking into account contractual thresholds |
| $ | 9,040 |
|
Additional collateral without contractual thresholds |
|
| 20,732 |
|
61
AVISTA CORPORATION
Energy Commodity Risk
Our energy commodity risks have not materially changed during the nine months ended September 30, 2021. See the 2020 Form 10-K. The following table presents energy commodity derivative fair values as a net asset or (liability) as of September 30, 2021 that are expected to settle in each respective year (dollars in thousands). There are no expected deliveries of energy commodity derivatives after 2025.
|
| Purchases |
|
| Sales |
| ||||||||||||||||||||||||||
|
| Electric Derivatives |
|
| Gas Derivatives |
|
| Electric Derivatives |
|
| Gas Derivatives |
| ||||||||||||||||||||
Year |
| Physical (1) |
|
| Financial (1) |
|
| Physical (1) |
|
| Financial (1) |
|
| Physical (1) |
|
| Financial (1) |
|
| Physical (1) |
|
| Financial (1) |
| ||||||||
Remainder 2021 |
| $ | 4 |
|
| $ | 1,538 |
|
| $ | 1,932 |
|
| $ | 13,271 |
|
| $ | (11 | ) |
| $ | (3,299 | ) |
| $ | (1,961 | ) |
| $ | (16,291 | ) |
2022 |
|
| (306 | ) |
|
| — |
|
|
| 1,118 |
|
|
| 18,477 |
|
|
| 624 |
|
|
| (3,104 | ) |
|
| (4,416 | ) |
|
| (17,146 | ) |
2023 |
|
| — |
|
|
| — |
|
|
| — |
|
|
| 4,938 |
|
|
| — |
|
|
| — |
|
|
| (1,789 | ) |
|
| (1,184 | ) |
2024 |
|
| — |
|
|
| — |
|
|
| — |
|
|
| 598 |
|
|
| — |
|
|
| — |
|
|
| (1,838 | ) |
|
| — |
|
2025 |
|
| — |
|
|
| — |
|
|
| — |
|
|
| — |
|
|
| — |
|
|
| — |
|
|
| (1,166 | ) |
|
| — |
|
The following table presents energy commodity derivative fair values as a net asset or (liability) as of December 31, 2020 that are expected to be delivered in each respective year (dollars in thousands). There are no expected deliveries of energy commodity derivatives after 2025.
|
| Purchases |
|
| Sales |
| ||||||||||||||||||||||||||
|
| Electric Derivatives |
|
| Gas Derivatives |
|
| Electric Derivatives |
|
| Gas Derivatives |
| ||||||||||||||||||||
Year |
| Physical (1) |
|
| Financial (1) |
|
| Physical (1) |
|
| Financial (1) |
|
| Physical (1) |
|
| Financial (1) |
|
| Physical (1) |
|
| Financial (1) |
| ||||||||
2021 |
| $ | 2 |
|
| $ | (414 | ) |
| $ | (87 | ) |
| $ | 10,549 |
|
| $ | (15 | ) |
| $ | 716 |
|
| $ | (2,152 | ) |
| $ | (10,672 | ) |
2022 |
|
| — |
|
|
| — |
|
|
| 247 |
|
|
| 1,920 |
|
|
| — |
|
|
| — |
|
|
| (1,697 | ) |
|
| (1,536 | ) |
2023 |
|
| — |
|
|
| — |
|
|
| — |
|
|
| (122 | ) |
|
| — |
|
|
| — |
|
|
| (1,599 | ) |
|
| (42 | ) |
2024 |
|
| — |
|
|
| — |
|
|
| — |
|
|
| — |
|
|
| — |
|
|
| — |
|
|
| (1,673 | ) |
|
| — |
|
2025 |
|
| — |
|
|
| — |
|
|
| — |
|
|
| — |
|
|
| — |
|
|
| — |
|
|
| (1,219 | ) |
|
| — |
|
The above electric and natural gas derivative contracts will be included in either power supply costs or natural gas supply costs during the period they are delivered and will be included in the various deferral and recovery mechanisms (ERM, PCA, and PGAs), or in the general rate case process, and are expected to eventually be collected through retail rates from customers.
Future Resource Needs
2021 Electric Integrated Resource Plan
In April 2021, we filed our 2021 Electric Integrated Resource Plan (IRP) with the WUTC and the IPUC. Then on April 30th, we filed an amended IRP to include the results of the 2020 Renewable RFP. The WUTC and the IPUC review the IRPs and give the public the opportunity to comment. The WUTC and the IPUC do not approve or disapprove of the content in the IRPs; rather they acknowledge the IRPs are prepared in accordance with applicable standards.
Highlights of the 2021 IRP include the following expectations and/or assumptions:
62
AVISTA CORPORATION
Item 3. Quantitative and Qualitative Disclosures about Market Risk
The information required by this item is set forth in the Enterprise Risk Management section of "Item 2. Management’s Discussion and Analysis of Financial Condition and Results of Operations" and is incorporated herein by reference.
Item 4. Controls and Procedures
Conclusion Regarding the Effectiveness of Disclosure Controls and Procedures
The Company has disclosure controls and procedures (as defined in Rules 13a-15(e) and 15d-15(e) under the Securities Exchange Act of 1934, as amended) (Act) that are designed to ensure that information required to be disclosed in the reports it files or submits under the Act is recorded, processed, summarized and reported on a timely basis. Disclosure controls and procedures include, without limitation, controls and procedures designed to ensure that information required to be disclosed by the Company in the reports that it files or submits under the Act is accumulated and communicated to the Company’s management, including its principal executive and principal financial officers, as appropriate, to allow timely decisions regarding required disclosure. With the participation of the Company’s principal executive officer and principal financial officer, the Company's management evaluated its disclosure controls and procedures as of the end of the period covered by this report. There are inherent limitations to the effectiveness of any system of disclosure controls and procedures, including the possibility of human error and the circumvention or overriding of the controls and procedures. Accordingly, even effective disclosure controls and procedures can only provide reasonable assurance of achieving their control objectives. Based upon this evaluation, the Company’s principal executive officer and principal financial officer have concluded that the Company’s disclosure controls and procedures are effective at a reasonable assurance level as of September 30, 2021.
There have been no changes in the Company's internal control over financial reporting that occurred during the third quarter of 2021 that have materially affected, or are reasonably likely to materially affect, the Company's internal control over financial reporting.
63
AVISTA CORPORATION
PART II. Other Information
Item 1. Legal Proceedings
See “Note 16 of Notes to Condensed Consolidated Financial Statements” in “Part I. Financial Information Item 1. Condensed Consolidated Financial Statements.”
Item 1A. Risk Factors
Refer to the 2020 Form 10-K for disclosure of risk factors that could have a significant impact on our results of operations, financial condition or cash flows and could cause actual results or outcomes to differ materially from those discussed in our reports filed with the SEC (including this Quarterly Report on Form 10-Q), and elsewhere. These risk factors have not materially changed from the disclosures provided in the 2020 Form 10-K with the exception of the following:
The COVID 19 pandemic is disrupting our business and could have a negative effect on our results of operations, financial condition and cash flows.
The COVID-19 pandemic is currently impacting our business, as well as the global, national and local economy. We cannot predict the full extent to which COVID-19 will impact our operations, results of operations, cash flows, financial condition or capital resources. It is possible that the continued spread of COVID-19 and efforts to contain the virus will continue to cause an economic slowdown, resulting in significant disruptions in various public, commercial or industrial activities and causing employee absences which could interfere with operation and maintenance of the Company’s facilities. Any of these circumstances could adversely affect our operations, results of operations, financial condition and cash flows in many ways, including, but not limited to:
We cannot predict the duration and severity of the COVID-19 pandemic. The longer and more severe the economic restrictions and business disruptions are, the greater the impact on our operations, results of operations, financial condition and cash flows will be.
64
AVISTA CORPORATION
In addition to these risk factors, see also “Forward-Looking Statements” for additional factors which could have a significant impact on our operations, results of operations, financial condition or cash flows and could cause actual results to differ materially from those anticipated in such statements.
65
AVISTA CORPORATION
Item 6. Exhibits
| ||
|
|
|
| ||
|
|
|
| ||
|
|
|
| ||
|
|
|
101.INS |
| Inline XBRL Instance Document. The instance document does not appear in the interactive data file because its inline XBRL tags are embedded within the inline XBRL document. |
101.SCH |
| Inline XBRL Taxonomy Extension Schema Document |
101.CAL |
| Inline XBRL Taxonomy Extension Calculation Linkbase Document |
101.LAB |
| Inline XBRL Taxonomy Extension Label Linkbase Document |
101.PRE |
| Inline XBRL Taxonomy Extension Presentation Linkbase Document |
101.DEF |
| Inline XBRL Taxonomy Extension Definition Linkbase Document |
104 |
| Cover page formatted as Inline XBRL and contained in Exhibit 101. |
|
|
|
(1) |
| Filed herewith. |
(2) |
| Furnished herewith. |
66
AVISTA CORPORATION
SIGNATURE
Pursuant to the requirements of the Securities Exchange Act of 1934, the registrant has duly caused this report to be signed on its behalf by the undersigned thereunto duly authorized.
|
|
| AVISTA CORPORATION |
|
|
| (Registrant) |
|
|
|
|
|
|
|
|
|
|
|
|
|
|
|
|
Date: | November 2, 2021 |
| /s/ Mark T. Thies |
|
|
| Mark T. Thies |
|
|
| Executive Vice President, Chief Financial Officer, and Treasurer (Principal Financial Officer) |
67