UNITED STATES
SECURITIES AND EXCHANGE COMMISSION
WASHINGTON, D.C. 20549
FORM 10-K
(MARK ONE)
| |
☒ | ANNUAL REPORT PURSUANT TO SECTION 13 OR 15(d) OF THE SECURITIES EXCHANGE ACT OF 1934 |
For the fiscal year ended December 31, 2024
Or
| |
☐ | TRANSITION REPORT PURSUANT TO SECTION 13 OR 15(d) OF THE SECURITIES EXCHANGE ACT OF 1934 |
For the transition period from ______________ to ______________
Commission File number 0-23621
MKS INSTRUMENTS, INC.
(Exact Name of Registrant as Specified in Its Charter)
| | |
Massachusetts | | 04-2277512 |
(State or other Jurisdiction of | | (I.R.S. Employer |
Incorporation or Organization) | | Identification No.) |
| | |
2 Tech Drive, Suite 201, Andover, Massachusetts | | 01810 |
(Address of Principal Executive Offices) | | (Zip Code) |
(978) 645-5500
(Registrant’s Telephone Number, including area code)
Securities registered pursuant to Section 12(b) of the Act:
| | | | |
Title of each class | | Trading Symbol(s) | | Name of each exchange on which registered |
Common Stock, no par value | | MKSI | | Nasdaq Global Select Market |
Securities registered pursuant to Section 12(g) of the Act: None
Indicate by check mark if the registrant is a well-known seasoned issuer, as defined in Rule 405 of the Securities Act. Yes ☒ No ☐
Indicate by check mark if the registrant is not required to file reports pursuant to Section 13 or Section 15(d) of the Act. Yes ☐ No ☒
Indicate by check mark whether the registrant (1) has filed all reports required to be filed by Section 13 or 15(d) of the Securities Exchange Act of 1934 during the preceding 12 months (or for such shorter period that the registrant was required to file such reports), and (2) has been subject to such filing requirements for the past 90 days. Yes ☒ No ☐
Indicate by check mark whether the registrant has submitted electronically every Interactive Data File required to be submitted pursuant to Rule 405 of Regulation S-T (§ 232.405 of this chapter) during the preceding 12 months (or for such shorter period that the registrant was required to submit such files). Yes ☒ No☐
Indicate by check mark whether the registrant is a large accelerated filer, an accelerated filer, a non-accelerated filer, a smaller reporting company, or an emerging growth company. See the definitions of “large accelerated filer,” “accelerated filer,” “smaller reporting company,” and “emerging growth company” in Rule 12b-2 of the Exchange Act.
| | | | | | | |
Large accelerated filer | ☒ | | | Accelerated filer | ☐ | Emerging growth company | ☐ |
Non-accelerated filer | ☐ | | | Smaller reporting company | ☐ | | |
If an emerging growth company, indicate by check mark if the registrant has elected not to use the extended transition period for complying with any new or revised financial accounting standards provided pursuant to Section 13(a) of the Exchange Act. ☐
Indicate by check mark whether the registrant has filed a report on and attestation to its management’s assessment of the effectiveness of its internal control over financial reporting under Section 404(b) of the Sarbanes-Oxley Act (15 U.S.C. 7262(b)) by the registered public accounting firm that prepared or issued its audit report. ☒
If securities are registered pursuant to Section 12(b) of the Act, indicate by check mark whether the financial statements of the registrant included in the filing reflect the correction of an error to previously issued financial statements. ☐
Indicate by check mark whether any of those error corrections are restatements that required a recovery analysis of incentive-based compensation received by any of the registrant’s executive officers during the relevant recovery period pursuant to §240.10D-1(b). ☐
Indicate by check mark whether the registrant is a shell company (as defined in Rule 12b-2 of the Exchange Act). Yes ☐ No ☒
Aggregate market value of the voting and non-voting common equity held by nonaffiliates of the registrant as of June 30, 2024 based on the closing price of the registrant’s common stock on such date as reported by the Nasdaq Global Select Market: $8,786,410,629.
Number of shares outstanding of the issuer’s common stock, no par value, as of February 18, 2025: 67,377,585
DOCUMENTS INCORPORATED BY REFERENCE
Portions of the definitive Proxy Statement for our 2025 Annual Meeting of Shareholders, to be filed with the Securities and Exchange Commission no later than 120 days after the close of our fiscal year ended December 31, 2024, are incorporated by reference into Part III of this Annual Report on Form 10-K.
TABLE OF CONTENTS
Special Note Regarding Forward-Looking Statements
This Annual Report on Form 10-K contains “forward-looking statements” within the meaning of the Private Securities Litigation Reform Act of 1995, Section 27A of the Securities Act of 1933 and Section 21E of the Securities Exchange Act of 1934 regarding the future financial performance, business prospects and growth of MKS Instruments, Inc. (“MKS,” the “Company,” “our,” or “we”). These statements are only predictions based on current assumptions and expectations. Any statements that are not statements of historical fact (including statements containing the words “will,” “projects,” “intends,” “believes,” “plans,” “anticipates,” “expects,” “estimates,” “forecasts,” “continues” and similar expressions) should be considered forward-looking statements. Actual events or results may differ materially from those in the forward-looking statements set forth herein.
Among the important factors that could cause actual events to differ materially from those in the forward-looking statements that we make are the level and terms of our substantial indebtedness and our ability to service such debt; our entry into the chemicals technology business through our acquisition of Atotech Limited (“Atotech”) in August 2022 (the “Atotech Acquisition”) which has exposed us to significant additional liabilities; the risk that we are unable to realize the anticipated benefits of the Atotech Acquisition; legal, reputational, financial and contractual risks resulting from the ransomware event we identified in February 2023, and other risks related to cybersecurity, data privacy and intellectual property; competition from larger, more advanced or more established companies in our markets; the ability to successfully grow our business, including through growth of the Atotech business and growth of the Electro Scientific Industries, Inc. business, which we acquired in February 2019, and financial risks associated with those and potential future acquisitions, including goodwill and intangible asset impairments; manufacturing and sourcing risks, including those associated with limited and sole source suppliers and the impact and duration of supply chain disruptions, component shortages, and price increases; changes in global demand; risks associated with doing business internationally, including geopolitical conflicts, such as the conflict in the Middle East, trade compliance, trade protection measures, such as import tariffs by the United States or retaliatory actions taken by other countries, regulatory restrictions on our products, components or markets, particularly the semiconductor market, and unfavorable currency exchange and tax rate fluctuations, which risks become more significant as we grow our business internationally and in China specifically; conditions affecting the markets in which we operate, including fluctuations in capital spending in the semiconductor, electronics manufacturing and automotive industries, and fluctuations in sales to our major customers; disruptions or delays from third-party service providers upon which our operations may rely; the ability to anticipate and meet customer demand; the challenges, risks and costs involved with integrating or transitioning global operations of the companies we have acquired; risks associated with the attraction and retention of key personnel; potential fluctuations in quarterly results; dependence on new product development; rapid technological and market change; acquisition strategy; volatility of stock price; risks associated with chemical manufacturing and environmental regulation compliance; risks related to defective products; financial and legal risk management; and the other important factors described in Part I, Item 1A of this Annual Report on Form 10-K. We are under no obligation to, and expressly disclaim any obligation to, update or alter these forward-looking statements, whether as a result of new information, future events or otherwise, even if subsequent events cause our views to change.
SUMMARY OF RISK FACTORS
Below is a summary of the principal factors that make an investment in MKS speculative or risky. This summary does not contain all of the information that may be important to you, and you should read the below summary in conjunction with the more detailed discussion of risks set forth under the heading “Risk Factors” in Part I, Item 1A of this Annual Report on Form 10-K.
Acquisition Risks
•As part of our business strategy, we have consummated and may continue to pursue business combinations and acquisitions that may be difficult to identify and complete, challenging and costly to integrate, disruptive to our business and our management, and/or dilutive to stockholder value.
Financial Risks
•Our consolidated indebtedness has increased substantially as a result of the Atotech Acquisition in August 2022. This increased level of indebtedness could adversely affect us, including by increasing our interest expense and decreasing our business flexibility.
•The terms of our Term Loan Facility and Revolving Facility (each as defined below) impose significant financial obligations and risks upon us, limit our ability to take certain actions, and could discourage a change in control.
•A material amount of our assets represents goodwill and intangible assets, against which we have recorded impairments in the past, and our net income may be significantly reduced by future impairments of these assets.
Risks Related to Cybersecurity, Data Privacy and Intellectual Property Protection
•We are exposed to risks related to cybersecurity and data privacy threats and incidents, such as the ransomware event we identified in February 2023, and we are subject to restrictions and changes in laws and regulations governing data privacy and data protection, any of which could have a material adverse effect on our business.
•Our proprietary technology is important to the continued success of our business. Our failure to protect this proprietary technology may significantly impair our competitive position.
Risks Related to Our Operations
•Supply chain disruptions and other manufacturing interruptions or delays have affected our ability to meet customer demand and have led to higher costs, while the failure to estimate customer demand accurately has resulted in excess or obsolete inventory, all of which has negatively impacted, and could in the future negatively impact, our business.
•Our dependence on sole and limited source suppliers and international suppliers has negatively impacted, and could continue to impact, our ability to manufacture products and systems.
•Our failure to successfully manage the transition of certain of our products to other manufacturing locations, the transition of certain of our products to or from contract manufacturers, and the transition of certain functions to centralized locations would likely harm our business, financial condition and operating results.
•Our products could contain defects, which would increase our costs and seriously harm our business, financial condition, operating results and customer relationships.
•Chemical manufacturing is inherently hazardous and could result in accidents that disrupt our operations or expose us to significant losses or liabilities.
•We outsource a number of services to third-party service providers, which decreases our control over the performance of these functions. Disruptions or delays at our third-party service providers could adversely impact our operations.
•The loss of net revenues from any one of our major customers would likely have a material adverse effect on us.
•Key personnel have been, and may continue to be, difficult to attract and retain.
Risks Related to Our Industries and Markets
•The semiconductor, electronics manufacturing and automotive industries we serve are characterized by periodic fluctuations in business activity that may cause a reduction in demand for our products.
•Many of the markets and industries we serve are highly competitive, are subject to rapid technological advancement, and have narrow design windows, and if we fail to introduce new and innovative products or improve our existing products, or if our products or the applications we invest in do not achieve widespread adoption, our business, financial condition and operating results will be harmed.
•We offer products for multiple markets and must face the challenges of supporting the distinct needs of each of the markets we serve.
Risks Related to Operating a Global Business
•We face significant risks associated with doing business internationally.
•We face significant risks associated with doing increased business in China in particular.
•Unfavorable currency exchange rate fluctuations may lead to lower operating results or may cause us to change customer pricing, which could result in reduced sales and losses.
Legal, Tax, Regulatory and Compliance Risks
•We are obligated to develop and maintain proper and effective internal control over financial reporting, and we previously identified a material weakness in our internal control over financial reporting and may discover additional material weaknesses in the future. Any failure to maintain the adequacy of this internal control may adversely affect our results of operations, our stock price and investor confidence in our Company.
•If significant trade restrictions or tariffs on our products or components that are imported from or exported to certain countries, for example, China, Canada and Mexico, are initiated, continue or are expanded, our business, financial condition and operating results may be materially harmed.
•We are subject to international trade compliance regulations, and violations of those regulations could result in fines or trade restrictions, which could have a material adverse effect on us.
•Changes in tax rates or tax regulation or the termination of tax incentives could affect our operating results.
•Many of our products and customers are subject to numerous laws regulating the production and use of chemical substances, and some of our products may need to be reformulated or discontinued to comply with these laws and regulations.
•We are subject to environmental regulations. If we fail to comply with these regulations, our business could be harmed.
•We are exposed to various risks related to legal proceedings, including, for example, product liability claims, intellectual property infringement claims, regulatory claims, contractual claims and class action litigation, which if successful, could have a material adverse effect on our commercial relationships, business, financial condition and operating results.
Risks Related to Owning Our Common Stock
•Our quarterly operating results have fluctuated, and are likely to continue to vary significantly, which may result in volatility in the market price of our common stock.
•The market price of our common stock has fluctuated and may continue to fluctuate for reasons over which we have no control.
PART I
Item 1. Business
MKS Instruments, Inc. (“MKS,” the “Company,” “our,” or “we”) was founded in 1961 as a Massachusetts corporation. We enable technologies that transform our world. We deliver foundational technology solutions to leading edge semiconductor manufacturing, electronics and packaging, and specialty industrial applications. We apply our broad science and engineering capabilities to create instruments, subsystems, systems, process control solutions and specialty chemicals technology that improve process performance, optimize productivity and enable unique innovations for many of the world’s leading technology and industrial companies. Our solutions are critical to addressing the challenges of miniaturization and complexity in advanced device manufacturing by enabling increased power, speed, feature enhancement and optimized connectivity. Our solutions are also critical to addressing ever-increasing performance requirements across a wide array of specialty industrial applications.
Where You Can Find More Information
We file reports, proxy statements and other documents with the Securities and Exchange Commission (“SEC”). Our SEC filings are available to you on the SEC’s website at http://www.sec.gov.
Our website is http://www.mks.com. We are not including the information contained in our website as part of, or incorporating it by reference into, this Annual Report on Form 10-K. We make available free of charge through our website our Annual Reports on Form 10-K, Quarterly Reports on Form 10-Q, Current Reports on Form 8-K and amendments to these reports filed or furnished pursuant to Section 13(a) or 15(d) of the Securities Exchange Act of 1934, as amended (the “Exchange Act”), as soon as reasonably practicable after we electronically file such materials with, or furnish them to, the SEC.
Markets and Applications
Since our inception, we have focused on satisfying the needs of our customers by establishing long-term collaborative relationships. We have a diverse base of customers across our three end-markets, semiconductor, electronics and packaging, and specialty industrial.
We have developed the following two product strategies that have been instrumental in delivering value to our customers and helping them solve their most complex problems:
•Our Surround the Wafer® offering includes a wide range of products, design and development services, system-level integration, training programs, calibration, service, and repair for our semiconductor customers. This unique combination of products and services enables our customers to solve the challenges of ultra-thin layers, new materials and complex 3D structures while maintaining quality and productivity levels. We have cultivated this strategy over the past two decades by adding critical enabling technologies to our portfolio. The Surround the Wafer offering is an update from what we previously referred to as Surround the Chamber®, given our broadened exposure in photonics solutions for lithography, metrology and inspection, which extends beyond just the vacuum chamber.
•Our Surround the Workpiece® offering includes product design and development, system-level integration, research and development, system, subsystem and component selection, and maintenance, repair and calibration services in the field of laser-based guidance and control for manufacturing processes. In connection with the Atotech Acquisition, we introduced an extension of the Surround the Workpiece offering called Optimize the Interconnect®, which refers to MKS’ combined laser drilling and chemistry solutions geared towards accelerating innovation and customers’ time-to-market in printed circuit board (“PCB”) and package substrate manufacturing.
At its core, MKS is a foundational enabler of miniaturization and complexity. We believe there are three secular trends benefiting MKS. First is the impact of a world that continues to be increasingly interconnected, driving the need for smaller, more powerful and feature-rich advanced electronic devices, which is enabled by semiconductor manufacturing, laser processing and chemistry solutions. Second is the increasing complexity of technology transitions in semiconductor, PCB and package substrate manufacturing, which leads to inflections, such as extreme vertical structures and process engineering at the atomic level, as well as increased interconnect density and smaller features. These inflections provide additional growth opportunities for MKS, as we believe we are uniquely positioned to deliver the broadest and deepest portfolio of solutions. Third is the accelerating need for laser-based precision manufacturing techniques, which are enabled by lasers, photonics, optics, precision motion control, vibration control and systems solutions.
We believe our long history and deep expertise in solving critical problems position us well to address these challenges for our customers.
Semiconductor Market
MKS is a critical solutions provider for semiconductor manufacturing. Our products are used in major semiconductor processing steps, such as deposition, etching, cleaning, lithography, metrology, and inspection. The semiconductor industry continually faces new challenges, as products become smaller, more powerful and highly mobile. Ultra-thin layers, smaller critical dimensions, new materials, 3D structures, and the ongoing need for higher yield and productivity drive the need for tighter process measurement and control, all of which MKS supports. We believe we are the broadest critical subsystem provider in the wafer fabrication equipment (“WFE”) ecosystem and address over 85% of the market. We characterize our broad and unique offering as Surround the Wafer® to reflect the technology enablement we provide across almost every major process in semiconductor manufacturing today.
The semiconductor market is subject to rapid demand shifts, which are difficult to predict, and we cannot be certain as to the timing or extent of future demand in the semiconductor capital equipment industry. In addition to these rapid demand shifts, the semiconductor capital equipment industry has recently been subject to significant trade restrictions, especially in key markets, including China, which has impacted our sales. For example, due in part to these demand shifts and trade restrictions, our semiconductor market revenue sequentially increased 1% in 2024, but sequentially decreased 28% in 2023 and sequentially increased 12% in 2022. Approximately 42%, 41%, and 58% of our net revenues for 2024, 2023, and 2022, respectively, were from sales to our semiconductor market.
Electronics and Packaging Market
MKS is a foundational solutions provider for the electronics and packaging market. Our portfolio includes photonics components, laser drilling systems, electronics chemistries and plating equipment that are critical for the manufacturing of PCBs and package substrates, and critical to wafer level packaging (“WLP”) applications. Similar to the semiconductor industry, the PCB, package substrate and WLP industries continue to demand smaller features, greater density, and better performance. In addition, the electronics and packaging market also includes sales of our vacuum and photonics solutions for display manufacturing applications. We characterize our complementary offering of laser systems and chemistry solutions as Optimize the Interconnect®, to reflect the unique technology enablement we provide at the Interconnect level within PCBs, package substrates and WLPs. Approximately 26%, 25%, and 15% of our net revenues for 2024, 2023, and 2022, respectively, were from sales to our electronics and packaging market.
Specialty Industrial Market
MKS’ strategy in the specialty industrial market is to leverage our domain expertise and proprietary technologies across a broad array of applications in industrial, life and health sciences, and research and defense markets.
Industrial
Industrial encompasses a wide range of diverse applications, including chemistries for functional coatings, surface finishing and wear resistance in the automobile industry, vacuum solutions for synthetic diamond manufacturing and photonics for solar manufacturing. Other applications include vacuum and photonics solutions for light emitting diode and laser diode manufacturing.
Life and Health Sciences
Our products for life and health sciences are used in a diverse array of applications, including bioimaging, medical instrument sterilization, medical device manufacturing, analytical, diagnostic and surgical instrumentation, consumable medical supply manufacturing and pharmaceutical production.
Research and Defense
Our products for research and defense are sold to government, university and industrial laboratories for applications involving research and development in materials science, physical chemistry, photonics, optics and electronics materials. Our products are also sold for monitoring and defense applications including surveillance, imaging and infrastructure protection.
Approximately 32%, 34%, and 27% of our net revenues for 2024, 2023, and 2022, respectively, were from sales to our specialty industrial market.
International Markets
Starting in the second quarter of 2024, we changed our basis of reporting geographical net revenues from the location in which the sale originated to the shipped-to location of the end customer. Prior periods have been recast to reflect this change, which was made to better align with how management reviews geographic net revenues.
A significant portion of our net revenues is from sales to customers in international markets. For 2024, 2023, and 2022, international net revenues accounted for approximately 78%, 75%, and 69%, respectively, of our total net revenues. A significant portion of our international net revenues was from customers in China, South Korea, Japan, Taiwan, and Singapore. We expect international net revenues will continue to account for a significant percentage of total net revenues for the foreseeable future.
Long-lived assets located outside of the United States accounted for approximately 59% and 58% of our total long-lived assets in 2024 and 2023, respectively. Long-lived assets include property, plant and equipment, net, right-of-use assets, net and certain other assets.
Reportable Segments, and Product and Service Offerings
We are divided into three divisions: the Vacuum Solutions Division (“VSD”), the Photonics Solutions Division (“PSD”) and the Materials Solutions Division (“MSD”). We group our product offerings by our reportable segments: VSD, PSD and MSD. Global Service represents our various service offerings across our three divisions.
VSD delivers foundational technology solutions to semiconductor manufacturing, electronics and packaging and specialty industrial applications. VSD products are derived from our core competencies in vacuum technologies, including pressure measurement and control, flow measurement and control, gas and vapor delivery, gas composition analysis, electronic control technology, reactive gas generation and delivery, power generation and delivery, and fiber optic temperature and position sensing. Its products include:
•Pressure and Vacuum Control Solutions Products, which consist of direct and indirect pressure measurement.
•Materials Delivery Solutions Products, which include flow and valve technologies as well as integrated pressure measurement and control subsystems, which provide customers with precise control capabilities.
•Power Solutions Products, which consist of microwave and radio frequency power delivery systems, radio frequency matching networks, metrology products, and fiber optic temperature and position sensors. Our power delivery solutions are used to provide energy to various etching, stripping and deposition processes.
•Plasma and Reactive Gas Products, which consist of remote plasma and ozone generators that create reactive species. A reactive gas is used to facilitate various chemical reactions in the processing of thin films, including the deposition of films, etching and cleaning of films and surface modifications.
PSD provides a broad range of instruments, components and subsystems to leading edge semiconductor manufacturing, electronics and packaging and specialty industrial applications. PSD products are derived from our core competencies in lasers, photonics, optics, precision motion control and vibration control. Its products include:
•Laser Products, which consist of continuous wave and pulsed nanosecond and ultrafast lasers based on diode, diode-pumped solid-state and fiber laser technologies.
•Photonics Products, which include precision motion control, optical tables and vibration isolation systems, photonic instruments, high-performance optics and optical assemblies, opto-mechanical components, laser and LED measurement products, including laser power and energy meters and laser beam profilers and complex optical and photonic subsystems.
•Laser-based systems for PCB manufacturing, which include flexible interconnect PCB processing systems and high-density interconnect (“HDI”) solutions for the creation of blind micro-vias necessary for the manufacturing of PCBs (flexible, rigid-flexible, multilayer, HDI) and package substrates.
MSD develops leading process and manufacturing technologies for advanced surface modification, electroless and electrolytic plating, and surface finishing. Applying a comprehensive systems-and-solutions approach, MSD's portfolio includes chemistry, equipment and services for innovative and high-technology applications in our electronics and packaging and specialty industrial markets. Its products include:
•Advanced chemical processes and production equipment, for the manufacturing of PCBs, package substrates and wafers used in smartphones, computers, other consumer electronics, server and data centers, automotive electronics, and the medical and industrial industries.
•Advanced chemical processes and production equipment for decorative and functional surface finishing, which include decorative, corrosion-protective, and wear-resistant coatings for various end markets, such as automotive, construction, energy, household appliance and heavy machinery.
•Advanced chemical processes for paint support applications, including pretreatment, stripping and overspray treatment for various end markets such as automotive, construction, aviation, heavy machinery and household appliance.
For further information on our segments, see Note 21 to the Notes to Consolidated Financial Statements contained in Part II, Item 8 of this Annual Report on Form 10-K.
Global Service includes:
•Installation services and training for many of our products.
•On-site services for maintenance and repair of equipment and critical subsystems.
•Technical support offices and technology centers located near many of our customers’ facilities.
•Repair and calibration services at internal service depots and authorized service providers located worldwide.
•Warranties on our products typically range from one to three years, with the majority of the warranties on our products ranging from one to two years. We typically provide warranties on our repair services for periods ranging from 90 days to up to one year, depending upon the type of repair. We also offer extended warranties on our products ranging from one to five years.
Customers
We sell our products and services to thousands of customers worldwide, in a wide range of end markets. Net revenues from our top ten customers accounted for 32%, 30% and 42% of net revenues for 2024, 2023 and 2022, respectively. None of our customers in 2024 or 2023 accounted for greater than 10% of net revenues.
Sales and Marketing
Our worldwide sales and marketing organizations are critical to our strategy of maintaining close relationships with a wide array of customers across a diverse set of advanced applications, including semiconductor capital equipment manufacturers, semiconductor device manufacturers, PCB and package substrate manufacturers, and customers across a range of specialty industrial applications. We market and sell our products and services through our global direct sales organization, an international network of independent distributors and sales representatives, our websites and product catalogs. We maintain a marketing staff that identifies customer requirements, assists in product planning and specifications, and focuses on future trends in the markets we serve.
Research and Development
Our products incorporate sophisticated technologies to measure, monitor, deliver, analyze, power, control and improve complex semiconductor and advanced manufacturing processes, thereby enhancing uptime, yield and throughput for our customers. We also offer a broad portfolio of specialty chemistry solutions for advanced surface modification, electroless and electrolytic plating, surface finishing, functional coating and corrosion resistance applications. MSD is supported by 15 state-of-the-art global technology centers, which are used to conduct extensive research and development in order to anticipate future industry requirements.
We continue to develop our products as we strive to meet our customers’ evolving needs. We have developed, and continue to develop, new products to address industry trends, such as the shrinking of integrated circuit critical dimensions and technology inflections, and, in the flat panel display and solar markets, the transition to larger substrate sizes, which require more advanced processing and process control technology, the continuing drive toward more complex and accurate components and devices within the handset, tablet and high performance computing markets, the transition to 5G for both communications devices and infrastructure, the growth in units and via counts in the HDI PCB and package substrate markets, the industry transition to battery-powered vehicles in the automotive market, and the advancement of artificial intelligence (“AI”). In addition, we have developed, and continue to develop, products that support the migration to new classes of materials, ultra-thin layers, and 3D structures that are used in small geometry manufacturing. In our chemistry and equipment plating businesses, a majority of our research and
development investment supports existing customers' product improvement needs and their short-term research and development goals, which enables us to pioneer new high-value solutions while limiting commercial risk.
We involve our marketing, engineering, manufacturing and sales personnel in the development of new products in order to reduce the time to market for new products. Our employees also work closely with our customers’ development personnel, helping us to identify and define future technical needs on which to focus research and development efforts. We support research at academic institutions targeted at advances in materials science, semiconductor process development and photonics.
Our research and development expenses were $271 million, $288 million and $241 million for 2024, 2023 and 2022, respectively. Our research and development efforts include numerous projects, none of which are individually material, and generally have a duration of 3 to 36 months, depending upon whether the product is an enhancement of existing technology or a new product. Our current initiatives include projects to enhance the performance characteristics of older products, to develop new products and to integrate various technologies into subsystems.
Manufacturing
Manufacturing activities for VSD and PSD include the assembly and testing of components and subassemblies, which are integrated into our products. Manufacturing activities for MSD consist primarily of the production of chemicals through the mixing of substances and metals to form solutions, and the manufacturing of a range of plating equipment to customer specifications, which utilize these chemicals. Our plating equipment manufacturing process includes design and development, factory installation configuration, assembly and testing.
Our manufacturing facilities are located in Austria, Brazil, Canada, China, Czech Republic, France, Germany, India, Israel, Italy, Japan, Malaysia, Mexico, Romania, Singapore, Slovenia, South Korea, Taiwan and the United States. In addition, we rely on significant subcontracted operations in Mexico and selected contract manufacturers in Asia. Our business depends on the timely supply of products and services that meet the rapidly changing technical and volume requirements of our customers, which depends in part on the timely delivery of chemicals, parts, components and subassemblies from suppliers, including contract manufacturers. We purchase a wide range of electronic, optical, mechanical and electrical components, some of which are designed to our specifications. For chemical production, we purchase our substances, metals, and compounds from a global supply base. The materials we buy range from commodities, which we buy in bulk, to small quantities of specialty compounds. We consider our lean manufacturing techniques and responsiveness to customers’ significantly fluctuating product demands to be a competitive advantage.
Backlog
We generally schedule production of our products based upon our customers’ delivery requirements. Lead times for many of our products are very short, as a large portion of our orders are received and shipped within 90 days. Some of the plating equipment manufactured by MSD has longer lead times of up to 12 months. In many cases, orders may be subject to cancellation or rescheduling by the customer with limited or no penalty. Our backlog at any particular date, therefore, is not necessarily indicative of actual sales which may be generated for any succeeding period. Historically, our backlog levels have fluctuated based upon the ordering patterns of our customers and changes in our manufacturing capacity.
Competition
The market for our products is cyclical and highly competitive. Principal competitive factors include product quality, performance and price, historical customer relationships, breadth of product line, ease of use, manufacturing capabilities and responsiveness, and customer service and support. Although we believe that we compete favorably with respect to these factors, we can make no assurances that we will continue to do so.
We encounter substantial competition in most of our product lines, although no single competitor competes with us across all product lines. Certain of our competitors have greater financial and other resources than we do. In some cases, competitors are smaller than we are but are well established in specific product niches.
For example, in VSD, Advanced Energy Industries, Inc. offers products that compete with our power solutions, plasma and reactive gas and sensing products. Inficon, Inc. offers products that compete with our pressure and vacuum control solutions products. Hitachi Ltd., Horiba Ltd., Brooks Instrument and VAT, Inc. offer products that compete with our materials delivery solutions products.
In PSD, Trumpf Group, Lumentum Holdings Inc., IPG Photonics Corporation, EdgeWave GmbH and Amplitude Systemes SA offer products that compete with our laser products. Coherent Corp., Excelitas Technologies Corp., Jenoptik AG and Thorlabs, Inc. offer products that compete with our laser and photonics products. Sigma Koki Co., Ltd. and PI miCos GmbH offer products
that compete with our photonics products. Our laser-based systems for PCB manufacturing primarily compete with laser-based systems provided by Via Mechanics, Ltd., EO Technics Co., Ltd. and Mitsubishi Electric Corporation.
In MSD, Element Solutions Inc., DuPont de Nemours, Inc., Uyemura, Dipsol Chemicals Co., Ltd., JCU International, Inc. and Okuno Chemical Industries Co., Ltd. offer products that compete with our chemistry products. Schmid Group, Process Automation International Limited and Manz AG offer products that compete with our plating equipment products.
Sources and Availability of Materials, Parts and Components
We use various suppliers and contract manufacturers to supply materials, parts and components for manufacturing and support of our product lines. Although our intention is to establish multiple sources of supply whenever practicable, we have sole or limited source supply arrangements for certain materials, parts and components, such as certain metals and electronic components. Certain of our sole or limited source supply arrangements are the result of “copy exact” requirements of our customers. We may not be able to procure these materials, parts and components from alternate sources at acceptable prices and quality within a reasonable time, or at all. The risk of loss or interruption of this supply could impact our ability to deliver certain products on a timely basis. For additional information about risks related to our supply chain, please refer to our Risk Factors in Part I, Item 1A of this Annual Report.
Patents and Other Intellectual Property Rights
We rely on a combination of patent, copyright, trademark and trade secret laws and license agreements to establish and protect our proprietary rights. As of December 31, 2024, we owned 638 U.S. patents and 2,534 foreign patents that expire at various dates through 2043. As of December 31, 2024, we had 142 pending U.S. patent applications. Foreign counterparts of certain U.S. applications have been filed or may be filed at the appropriate time.
We require each of our employees, including our executive officers, to enter into standard agreements pursuant to which the employee agrees to keep confidential our proprietary information and to assign to us all inventions while they are employed by us.
Government Regulations
We are subject to various federal, state, local and international laws and regulations relating to the development, manufacture, sale and distribution of our products and services, and it is our policy to comply with the laws in every jurisdiction in which we conduct business. Regulations include, but are not limited to, those related to the environment, trade, corruption, bribery, import and export controls, competition, product safety, workplace health and safety, employment, labor and data privacy. The following describes certain significant regulations that may have a material effect on our capital expenditures, earnings and competitive position. For additional information about risks related to government regulations, please refer to “Risk Factors–Legal, Tax, Regulatory and Compliance Risks” in Part I, Item 1A of this Annual Report on Form 10-K.
Trade Compliance
We are subject to trade compliance laws in both the United States and other jurisdictions where we operate, including export regulations such as the U.S. Export Administration Regulations, administered by the U.S. Department of Commerce’s Bureau of Industry and Security, and the International Traffic in Arms Regulation, administered by the Department of State’s Directorate of Defense Trade Controls.
Environmental Regulations
We are subject to various, federal, state, local and international laws and regulations relating to environmental protection, including those governing discharges of pollutants into the air, water and land, the reporting, generation, use, handling, storage, transportation, treatment and disposal of hazardous substances, waste and other materials and the cleanup of contaminated sites. These environmental regulations include the European Union Regulation on Registration, Evaluation, Authorisation and Restriction of Chemicals and the Toxic Substances Control Act in the United States and the Technical Standards on Environmental Risk Assessment and Control of Chemical Substances (2024) and List of Chemicals under Priority Control in China.
Human Capital
In order to compete and succeed in highly competitive markets and industries that are subject to rapid technological change, we believe it is critical to attract, motivate and retain a dedicated, talented and innovative team of employees. As part of these
efforts, we strive to foster an inclusive and welcoming community, invest in continuous learning and development, engage meaningfully with employees, offer a competitive compensation and benefits program and provide a safe and healthy workplace.
As of December 31, 2024, we had a total workforce of approximately 10,200 individuals, excluding contracted employees. We have sites in 37 countries, with 32% of our employees located in the Asia-Pacific region, 34% located in Europe, the Middle East and India and 34% located in the Americas. Of our total workforce, approximately 10,100 were employees and approximately 100 were temporary workers. Of our total workforce, 19% work in research and development, 53% work in operations, manufacturing, service and quality assurance, and 28% work in sales, order administration, marketing, finance, human resources, legal, information technology, general management and other administrative functions.
Inclusion and Belonging
At MKS, we are committed to cultivating an inclusive environment where every individual is valued, respected and empowered to bring their authentic selves to their work. This commitment stems from our belief that diverse viewpoints not only spur innovation but also fuel exceptional performance and sustainable progress. By embracing our global workforce’s unique backgrounds and perspectives, we strengthen our collective ability to innovate, collaborate and drive sustainable growth.
To further foster inclusion and belonging at MKS, we operate several initiatives:
•We recently launched programs—including cultural awareness workshops, book-read discussion groups, bias awareness trainings, and inclusive leadership sessions—to strengthen empathy, foster deeper cross-functional collaboration and cultivate a workplace culture where every voice is heard and valued.
•We also recently launched two Employee Resource Groups (“ERGs”) — Veterans@MKS and Women@MKS. While these ERGs focus on the unique experiences of these groups, they are open to all employees who want to connect, learn and contribute to a culture of belonging at MKS.
•Our recruitment and selection procedures are bolstered by our MKS Hiring Guide & Toolkit, which is designed to attract top talent while mitigating potential bias.
•Consistent with our Corporate Governance Guidelines, we actively seek diverse candidates for the pool from which our Board of Director nominees are chosen.
•We routinely conduct comprehensive analyses of pay practices in our major regions of operations to identify and, if needed, rectify any disparities promptly and effectively. Our most recent global compensation analysis has resulted in equitable pay for our workforce with minimal adjustments.
Learning and Development
MKS remains steadfast in its dedication to fostering learning and professional growth. We offer our employees a comprehensive catalog of programs, courses and resources aimed at building leadership capabilities and personal effectiveness. Our performance management framework is designed to provide ongoing, actionable feedback and facilitate dynamic career development conversations throughout the year.
In 2024, we launched a global mentorship program designed to connect our employees across all regions and functions and build mentor and mentee relationships that focus on continuous learning and development. This program reflects our commitment to investing in our people and promoting a culture of growth and development.
We extend financial assistance for higher education to eligible employees, including support for college and graduate studies. Additionally, we ensure accessibility to online learning resources via LinkedIn Learning for all employees, cultivating professional development.
Employee Engagement
MKS remains dedicated to fostering meaningful connections with its employees. In 2024, MKS conducted its fourth annual global employee engagement survey, with a record 88% participation rate. The survey findings were analyzed and shared with our President and Chief Executive Officer, the executive leadership team and our Board of Directors. Comprehensive communication of the results was extended to all employees and supplemented with executive videos and both in-person and virtual focus groups to pinpoint prevailing themes. Leveraging these themes and data points, tailored action items were created to encourage meaningful change, with corporate initiatives focusing on communication, innovation and inclusion.
Additionally, our executive leadership team routinely engages in direct communication with employees worldwide, ensuring alignment with the Company's strategic goals. Our executive leadership team is committed to continuously enhancing MKS’
workplace environment and steering organizational growth, with the annual engagement survey serving as a pivotal component for gathering employee insights.
Compensation and Benefits
MKS is committed to providing total compensation packages that attract, motivate and retain our employees, as well as recognizing and rewarding employees’ sustained performance and results. We run a recognition program for all U.S. employees, which allows peer-to-peer recognition and recognition by managers. We continue to assess the potential expansion of this recognition program globally. We also maintain a global flexible work policy. We are committed to ensuring that our total compensation packages are externally competitive and internally equitable, while supporting our business plans and strategies.
As employee turnover is an indicator of employee satisfaction, we monitor turnover globally. MKS has a very stable and committed workforce, as evidenced by low voluntary turnover. Our voluntary turnover for the year ended December 31, 2024 was below 7%. Our average employee tenure as of December 31, 2024 was more than ten years.
Health and Safety
MKS is committed to providing a safe and healthy workplace for all employees. We accomplish this through strict compliance with applicable laws and regulations regarding workplace safety, including recognition and control of workplace hazards, tracking injury and illness rates, utilizing a global travel risk management program and maintaining detailed emergency and business continuity plans. We also provide mandatory environmental, health and safety training to ensure all employees are provided with the education to perform their jobs safely and to protect the environment.
We have instituted MEHS, a formal Global MKS Management System for Environmental, Health, and Safety, to protect our employees, other stakeholders, and the environment. We continue to implement this strong foundation across our organization in a stepwise process.
In addition, we offer employees and eligible family members a full range of health and wellness programs, as well as many clinical and administrative services.
Additional information regarding MKS’ activities related to its people and sustainability can be found in our Environmental, Social, Governance Report, which is accessible through the Environmental, Social and Governance section of our website. Our Environmental, Social, Governance Report is updated periodically. None of the information on, or accessible through, MKS’ website is part of this Annual Report on Form 10-K or is incorporated by reference herein.
Item 1A. Risk Factors
This section describes certain risks we face in our business. Additional risks that we do not yet know of or that we currently believe are immaterial may also impair our business. If any of the events or circumstances described in this section actually occurs, our business, financial condition or operating results could suffer, and the market price of our common stock could decline. In assessing these risks, investors should also refer to the other information contained in or incorporated by reference into this report and our other filings with the Securities and Exchange Commission (“SEC”).
Acquisition Risks
As part of our business strategy, we have consummated and may continue to pursue business combinations and acquisitions that may be difficult to identify and complete, challenging and costly to integrate, disruptive to our business and our management, and/or dilutive to stockholder value.
As a part of our business strategy, we have consummated and continue to pursue business combinations and acquisitions. Our most recent acquisition of Atotech Limited (“Atotech”) in August 2022 (the “Atotech Acquisition”) significantly increased our size, including with respect to revenue, product offerings, number of employees and facilities, and geographic exposure. Atotech's products and technology, and certain of its markets and customer base, are significantly different from our historical experience. In particular, we did not have previous experience in the specialty chemistry industry, which Atotech serves. Atotech's chemistry business is also subject to highly complex environmental regulations, across multiple jurisdictions around the globe, and may expose us to significant additional liabilities for past or future activities. We acquired Atotech at a significant cost, and integrating Atotech's business and operations with ours has been complex, challenging and time-consuming and has required significant efforts and expenditures. Despite these efforts and expenditures, we may not be able to realize the anticipated benefits of the Atotech Acquisition.
Our ability to successfully identify suitable acquisition targets, complete acquisitions on acceptable terms, and efficiently, effectively and profitably integrate and operate our acquired businesses, is critical to our growth. We may not be able to identify target companies that meet our strategic objectives or successfully negotiate and complete acquisitions with companies we have identified on acceptable terms. Further, we may incur significant expense in pursuing acquisitions that cannot be completed, or are significantly delayed, due to regulatory or other restrictions. Additionally, our Credit Facilities (as defined below) only permit us to make acquisitions under certain circumstances and also restrict our ability to incur additional indebtedness in certain circumstances. As a result, our ability to pursue our acquisition strategy may be hindered by our indebtedness. Moreover, we may not realize the benefits we anticipate from these acquisitions, because of significant challenges, such as:
•The difficulty, distraction, resource requirements, cost and disruption of developing sufficient knowledge of, managing, and integrating the operations, personnel, and internal controls, financial reporting and information technology (“IT”) systems of the acquired companies;
•The potential disruption of our ongoing business and distraction of management;
•Potential internal control or other compliance weaknesses of the acquired companies;
•Significant expenses related to the acquisitions, including any resulting shareholder litigation;
•The assumption of unknown or contingent liabilities associated with acquired businesses;
•Potentially incompatible cultural differences between us and the acquired companies;
•The difficulty of incorporating the acquired companies' technology and products into our current and future product lines, and successfully generating market demand for these expanded product lines;
•Potential additional geographic dispersion of operations and/or increased exposure to high-risk geographies;
•The difficulty in achieving anticipated synergies and efficiencies;
•The difficulty in leveraging the acquired companies' and our combined technologies and capabilities across our product lines and customer base;
•Burdensome requirements or conditions imposed by government regulators in connection with their review of acquisitions, including divestitures and restrictions on the conduct of our business or the business of the acquired companies;
•Competitive disadvantages we may face by selling products that are new to us and/or selling products in markets and geographies that are new to us;
•The difficulty of retaining key customers, suppliers and employees of the acquired companies; and
•The potential to incur or record significant cash or non-cash charges or write down the carrying value of intangible assets and goodwill obtained in the acquisitions, which could adversely impact our cash flow or lower our earnings in the period or periods for which we incur such charges or write down such assets.
For example, in 2023, we recorded impairments of goodwill and intangible assets obtained in the Atotech Acquisition and the acquisition of Electro Scientific Industries, Inc. (“ESI”), which we acquired in 2019 (the “ESI Acquisition”). As described in Note 13 to the Notes to Consolidated Financial Statements, following triggering events at (i) each of our electronics (“EL”) and general metal finishing (“GMF”) reporting units, which together represent the Atotech business and constitute our Materials Solutions Division (“MSD”), and (ii) the Equipment Solutions Business (“ESB”) reporting unit, which represents the ESI business and is a part of our Photonics Solutions Division (“PSD”), we recorded goodwill and intangible asset impairments at MSD and ESB of $1.8 billion during the quarter ended June 30, 2023 and, following an annual impairment analysis, we recorded goodwill and intangible asset impairments at MSD and ESB of $75 million during the quarter ended December 31, 2023.
In addition, if we are not successful in completing acquisitions or integrating acquired businesses, we may need to re-evaluate our growth strategy. We may incur substantial expenses and devote significant management time and resources to complete acquisitions that may not generate the financial results we planned to achieve. We may also choose to close or divest certain sectors or divisions of acquired companies that are not deemed to fit with our strategic plan. Divestitures involve additional risks and uncertainties, such as the ability to sell such businesses on satisfactory price and terms and in a timely manner, or at all, disruption to other parts of the businesses and distraction of management, allocation of internal resources that would otherwise be devoted to completing strategic acquisitions or other strategic projects or initiatives, loss of key employees or customers, loss of access by retained business units to critical intellectual property or other assets transferred with the divested business, exposure to unanticipated liabilities or ongoing obligations to support the businesses following such divestitures, and other adverse financial impacts.
We continue to experience significant risks associated with the ESI Acquisition. These risks include our ability to retain key personnel and to realize the anticipated growth in net revenues from ESB, as well as the potential to continue to incur or record
significant cash or non-cash charges or write down the carrying value of intangible assets and goodwill obtained in the ESI Acquisition, which lower our earnings in the period or periods for which we incur such charges or write down such assets.
In addition, we could use substantial portions of our available cash for all or a portion of the purchase price of future acquisitions. We could also issue additional securities as consideration for or to finance these acquisitions, which could cause significant stockholder dilution, or obtain additional debt financing, which would increase our costs, reduce our future cash flow and subject us to covenants and other restrictions that may impede our ability to manage our operations, without achieving the desired accretion to our business.
As a result of previous acquisitions, we presently have several different decentralized operating and accounting systems. We will need to continue to modify our accounting policies, internal controls, procedures and compliance programs to provide consistency across our operations. In order to increase efficiency and operating effectiveness and improve corporate visibility into our decentralized operations, we continue to review opportunities to integrate enterprise resource planning systems where practical. Any such integrations may disrupt our operations during the conversion periods and may require significantly more management time and higher implementation costs than anticipated.
Financial Risks
Our consolidated indebtedness has increased substantially as a result of the Atotech Acquisition in August 2022. This increased level of indebtedness could adversely affect us, including by increasing our interest expense and decreasing our business flexibility.
Our consolidated indebtedness has increased substantially as a result of the Atotech Acquisition in August 2022. As of January 31, 2025, we had approximately $3.1 billion of principal indebtedness outstanding under a senior secured term loan facility (the “Term Loan Facility”) comprised of two tranches: a $2.5 billion loan (the “USD Tranche B”) and a €596 million loan (the “Euro Tranche B”). As of January 31, 2025, we also had $675 million of available borrowing capacity under a senior secured revolving credit facility (the “Revolving Facility” and together with the Term Loan Facility, the “Credit Facilities”). On May 16, 2024, we completed a private offering of $1.4 billion aggregate principal amount of the Convertible Notes, and used approximately $1.2 billion of the proceeds to partially repay borrowings under the USD Tranche B.
This level of indebtedness could have the effect, among other things, of reducing our flexibility to respond to changing business, industry and economic conditions, limiting our ability to obtain financing in the future and increasing interest expense. We have also incurred and will continue to incur various costs and expenses associated with our indebtedness. The amount of cash required to pay interest on our increased indebtedness levels, and the demands on our cash resources that come from that debt, are significant. Our level of indebtedness could also reduce funds available for working capital, capital expenditures, acquisitions and other general corporate purposes and may create competitive disadvantages relative to other companies with lower debt levels. If our financial performance does not meet our expectations, then our ability to service our indebtedness may be adversely impacted.
With respect to the Convertible Notes, the accounting method for convertible debt securities that may be settled in cash, such as the Convertible Notes, could have a material effect on our reported financial results. Furthermore, in the event the conditional conversion feature of the Convertible Notes is triggered, holders of Convertible Notes will be entitled to convert the Convertible Notes at any time during specified periods at their option. If one or more holders elect to convert their Convertible Notes, we would be required to settle any converted principal in cash, which could adversely affect our liquidity. In addition, even if holders do not elect to convert their Convertible Notes, we would be required under applicable accounting rules to reclassify all or a portion of the outstanding principal of the Convertible Notes as a current rather than long-term liability, which would result in a material reduction of our net working capital.
If a fundamental change occurs prior to the maturity date of the Convertible Notes, holders of the Convertible Notes will have the right, at their option, to require us to repurchase all or a portion of their Notes. In addition, if a make-whole fundamental change occurs prior to the maturity date of the Convertible Notes, we will in some cases be required to increase the conversion rate for a holder that elects to convert its Convertible Notes in connection with such make-whole fundamental change. Furthermore, the indenture governing the Convertible Notes prohibits us from engaging in certain mergers or acquisitions unless, among other things, the surviving entity assumes our obligations under the Convertible Notes and the indenture. These and other provisions in the indenture could deter or prevent a third party from acquiring us even when the acquisition may be favorable to investors.
Despite our current level of indebtedness, we and our subsidiaries may still be able to incur more indebtedness. Although our debt agreements contain restrictions on the incurrence of additional indebtedness, these restrictions are subject to certain qualifications and exceptions, and thus, additional indebtedness may be incurred in compliance with these restrictions. This could further exacerbate the risks we describe.
Moreover, we may be required to raise substantial additional financing to fund working capital, capital expenditures, acquisitions or other general corporate requirements. Our ability to arrange additional financing or refinancing will depend on,
among other factors, our financial position and performance, as well as prevailing market conditions and other factors beyond our control. There can be no assurance that we will be able to obtain additional financing or refinancing on terms acceptable to us or at all.
The terms of our Term Loan Facility and Revolving Facility impose significant financial obligations and risks upon us, limit our ability to take certain actions, and could discourage a change in control.
As of January 31, 2025, the total principal balance of our USD Tranche B was $2.5 billion, and the total principal balance of our Euro Tranche B was €596 million. As of January 31, 2025, our Revolving Facility provided us with a senior secured revolving credit facility of up to $675 million. We have not borrowed against our Revolving Facility as of January 31, 2025.
All amounts outstanding under the Term Loan Facility and the Revolving Facility bear interest at a variable interest rate. Although we hedge some of the variable interest rate exposure, if interest rates increase, debt service requirements on our variable rate debt will increase. Further interest rate increases, if they occur and we do not hedge such variable rates, will create higher debt service requirements, which would adversely affect our cash flows. In addition, changes in our credit ratings could affect the cost and availability of future borrowings and, accordingly, our cost of capital. The ratings of our indebtedness reflect each nationally recognized statistical rating organization’s opinion of our financial strength, operating performance and ability to meet our debt obligations. We cannot make any assurances that we will achieve or maintain a particular rating.
Our Term Loan Facility and Revolving Facility contain several negative covenants that, among other things and subject to certain exceptions, restrict our ability and/or our subsidiaries’ ability to:
•Incur additional indebtedness;
•Pay certain dividends on our capital stock or redeem, repurchase or retire certain capital stock or certain other indebtedness;
•Make certain investments, loans and acquisitions;
•Engage in certain transactions with our affiliates;
•Sell assets, including capital stock of our subsidiaries;
•Materially alter the business we conduct;
•Engage in sale-leaseback transactions.
In addition, our Revolving Facility requires that we meet a financial covenant based on a consolidated leverage ratio test in certain circumstances. Under our Revolving Facility, whenever the aggregate amount of loans outstanding under the Revolving Facility (net of (a) all letters of credit (whether cash collateralized or not) and (b) unrestricted cash of us and our restricted subsidiaries) exceeds 35% of the aggregate commitments under the Revolving Facility, our first lien net leverage ratio cannot exceed 6.00 to 1.00.
Our ability to comply with these provisions may be affected by events beyond our control, including prevailing economic, financial and industry conditions. These restrictions on our ability to engage in or benefit from these actions may also limit our flexibility in planning for, or reacting to, changes in and opportunities for our business, such as limiting our ability to engage in mergers and acquisitions. This could place us at a competitive disadvantage. If the matters described in our other risk factors result in a material adverse effect on our business, financial condition or operating results, we may be unable to comply with the terms of the Credit Facilities or experience an event of default.
Our Term Loan Facility and Revolving Facility contain customary events of default, including:
•Failure to make required payments;
•Failure to comply with certain agreements or covenants;
•Materially breaching any representation or warranty;
•Failure to pay, or otherwise causing the acceleration of, certain other indebtedness;
•Certain events of bankruptcy and insolvency;
•Failure to pay certain judgments; and
•A change in control of us.
The amount of cash available to us for repayment of amounts owed under the Credit Facilities will depend on our usage of our existing cash balances and our operating performance and ability to generate cash flows from operations, which will be subject to financial, business and other factors affecting our operations, many of which are beyond our control. We cannot provide any assurances that we will generate sufficient cash flows from operations to service our debt obligations. Any failure to repay these obligations as they become due would result in an event of default under the Credit Facilities.
If an event of default occurs, the lenders may end their obligation to make loans to us under the Credit Facilities and may declare any outstanding indebtedness under the Credit Facilities immediately due and payable. In such case, we would need to obtain additional financing or significantly deplete our available cash, or both, to repay this indebtedness. Any additional financing may not be available on reasonable terms or at all, and significant depletion of our available cash would harm our ability to fund our operations or execute our broader corporate objectives. If we were unable to repay outstanding indebtedness following an event of default, then in addition to other available rights and remedies, the lenders could initiate foreclosure proceedings on substantially all of our assets. Any such foreclosure proceedings or other rights and remedies successfully implemented by the lenders in an event of default would have a material adverse effect on our business, financial condition and operating results.
Further, because a change in control of us constitutes an event of default under the Credit Facilities, this may be a deterrent to some potential acquirers, as it would likely require an acquirer to repay any outstanding borrowings under the Credit Facilities.
A material amount of our assets represents goodwill and intangible assets, against which we have recorded impairments in the past, and our net income may be significantly reduced by future impairments of these assets.
As of December 31, 2024, our goodwill and intangible assets, net, represented approximately $4.8 billion, or 55%, of our total assets. Goodwill is generated as a result of our acquisitions when the cost of an acquisition exceeds the fair value of the net tangible and identifiable intangible assets we acquire. For example, as a result of the Atotech Acquisition, we added significant additional goodwill and intangible assets because the cost of the Atotech Acquisition significantly exceeded the fair value of Atotech’s net tangible and identifiable intangible assets. Intangible assets relate primarily to the developed technologies, customer relationships, trade names and trademarks acquired by us as part of our acquisitions of other companies. Goodwill and indefinite-lived intangible assets are subject to an impairment analysis at least annually based on the fair value of the reporting unit in which the respective goodwill and intangible assets are recorded. In addition, intangible assets and goodwill are subject to an impairment analysis whenever events or changes in circumstances indicate that the carrying value of the goodwill or intangible assets might not be recoverable. As described in Note 13 to the Notes to Consolidated Financial Statements, following triggering events at each of our EL and GMF reporting units, which together constitute MSD, and the ESB reporting unit of PSD, we recorded goodwill and intangible asset impairments of $1.8 billion during the quarter ended June 30, 2023 and, following an annual impairment analysis of all our reporting units, we recorded goodwill and intangible asset impairments of $75 million during the quarter ended December 31, 2023. We will continue to monitor and evaluate the carrying value of goodwill and intangible assets. If market and economic conditions or business performance deteriorate, the likelihood that we would record another impairment charge would increase. Any impairment charge could materially and adversely affect our financial condition and operating results, including by significantly reducing our net income in future periods.
Risks Related to Cybersecurity, Data Privacy and Intellectual Property Protection
We are exposed to risks related to cybersecurity and data privacy threats and incidents, such as the ransomware event we identified in February 2023, and we are subject to restrictions and changes in laws and regulations governing data privacy and data protection, any of which could have a material adverse effect on our business.
We rely on various IT networks and systems, some of which are managed by third parties, to process, transmit and store electronic information and to carry out and support a variety of business activities, including, among others, finance and accounting, order management, human resources, communications, manufacturing, research and development, intellectual property, supply chain management, sales and IT, including critical functions such as internet connectivity, network communications, and email. Many of these activities are processed via Software-as-a-Service (“SaaS”) products provided by third parties and hosted on their own networks and servers or on third-party networks and servers. The data on such IT networks and systems includes confidential information, personally identifiable information, transactional information and intellectual property belonging to us and our employees, customers, suppliers and other business partners.
We and our third-party administrators, vendors, customers and partners are subject to ongoing cybersecurity threats, including ransomware and other malware, hacking, phishing, smishing, denial of service attacks, employee errors or malfeasance, telecommunication failures, system failures, natural disasters and other attacks and events. We cannot guarantee that these threats will not have an adverse impact on our business, financial condition or results of operations. For example, in February 2023, we identified that we had become subject to a ransomware event. Based on our investigation, we concluded ransomware actors encrypted certain of our systems by deploying malware. This incident required us to temporarily suspend operations at
certain of our facilities and had a material impact during the three months ended March 31, 2023 on our ability to process orders, ship products and provide service to our Vacuum Solutions Division (“VSD”) and PSD customers. For the year ended December 31, 2023, we incurred net costs related to the incident of approximately $15 million. In addition, as a result of the incident, we were previously subject to two lawsuits, and we may be subject to future litigation, investigations, claims or actions, in addition to fines, penalties, or other obligations related to impacted data, whether or not such data is misused.
We face the challenge of supporting our older and disparate IT systems and implementing necessary upgrades. Further, as we transition to using more cloud-based solutions that are dependent on the internet or other networks to operate, we expose ourselves to additional or different cybersecurity and other data security threats, whether directly or through our third-party administrators, vendors and partners. As cybersecurity threats rapidly evolve and become increasingly difficult to detect and defend against, our current security controls and measures may not be effective in detecting vulnerabilities or preventing cybersecurity incidents. These risks may be amplified by increased reliance on remote access to IT systems as a result of the use of SaaS software, cloud and remote services, and employees working remotely. Further, the use of AI by us, our customers, suppliers and other business partners and third-party providers may introduce vulnerabilities into our IT systems and data. AI may also be used by bad actors to identify vulnerabilities and implement increasingly sophisticated cybersecurity attacks. Additionally, we may need to update security protocols for, transition to or from, or integrate various information management systems as a result of mergers, acquisitions and divestitures. The systems that we acquire or that are used by acquired entities or businesses may pose security risks of which we are unaware or unable to mitigate, particularly during the transition of these systems.
The evolving regulatory landscape for data privacy presents a number of legal and operational challenges, and our efforts to comply with relevant regulations may be unsuccessful. For example, regulations in the European Union (the “EU”) and China prohibit the transfer of personally identifiable information from their respective countries to other countries whose laws do not adequately protect personal data. While we have utilized certain permitted approaches for transferring personally identifiable information from these countries, these approaches may be invalidated by courts or regulatory bodies, and we may be required to ascertain an alternative legal basis for such transfers. Additionally, based on our investigation of the ransomware event we identified in February 2023, we became aware on February 13, 2023 that the ransomware actors may have exfiltrated personal information from our systems. We provided notifications to individuals and to regulators in accordance with applicable laws, and we may be required to provide additional notifications in the future. See “We are exposed to various risks related to legal proceedings, including, for example, product liability claims, intellectual property infringement claims, regulatory claims, contractual claims and class action litigation, which if successful, could have a material adverse effect on our commercial relationships, business, financial condition and operating results” below for more information regarding legal risks associated with privacy-related matters.
A failure to comply with the evolving regulatory landscape, or a breach of our operational or security systems or infrastructure, or those of our customers, suppliers and other business partners, could disrupt our business, including business operations and manufacturing processes; result in the disclosure, misuse, corruption or loss of confidential or other valuable business information, including intellectual property, personally identifiable information and other critical data of ours and our employees, customers, suppliers and other business partners; result in competitive disadvantages to the extent the information is competitively sensitive; damage our reputation; negatively affect our relationships with our employees, customers, suppliers and other business partners, including loss of confidence, which could lead to loss of or reduction in orders; divert the attention of management; cause losses; result in litigation, investigations or liability under contracts; require notifications to regulatory authorities and impacted individuals; result in significant penalties and/or fines from regulatory bodies, including pursuant to privacy laws and export control laws; add to the complexity of our compliance obligations; increase our cybersecurity protection costs; and result in the incurrence of remediation costs. These adverse effects would likely be amplified in the event a breach of operational or security systems remains undetected for an extended period of time.
The costs of compliance with, and other burdens imposed by, privacy, cybersecurity, data protection and data localization laws, regulations and policies, including restrictions on marketing activities, could have a material adverse effect on our business, financial condition and operating results. For example, as a result of the ransomware event described above, we incurred significant costs in connection with efforts to investigate the incident, assess the impact of the incident and recover our systems. We have incurred and expect to continue to incur significant costs to enhance our data security and protect against unauthorized access to, or manipulation of, our systems and data. Despite incurring these costs, we cannot eliminate every possible vulnerability, as cybersecurity threats rapidly evolve and become more sophisticated. Accordingly, similar incidents may occur in the future. Further, customers and third-party providers increasingly demand rigorous contractual provisions regarding privacy, cybersecurity, data protection, confidentiality, and intellectual property, which may also increase our overall compliance burden and potential liability.
Although we maintain insurance related to cybersecurity risks, these costs, expenses, liability and other matters may not be adequately covered by insurance and may result in an increase in our costs for insurance or insurance not being available to us on economically feasible terms, or at all. Insurers may also deny us coverage as to any future claim. Any of these results could
harm our business, financial condition and reputation. For additional information on our cybersecurity risk management, strategy and governance, please refer to Part I, Item 1C of this Annual Report on Form 10-K.
Our proprietary technology is important to the continued success of our business. Our failure to protect this proprietary technology may significantly impair our competitive position.
Our success and ability to compete depend in large part upon protecting our proprietary technology. We rely on a combination of patent, trademark and trade secret protection and agreements, such as nondisclosure agreements and other contractual agreements with our employees and third parties, to protect our proprietary rights. The steps we have taken may not be sufficient to prevent the misappropriation of our intellectual property, particularly in countries and regions outside, for example, the United States and Europe, where laws may not protect our proprietary rights as fully. For example, the patent prosecution and enforcement systems within China and India, where we have a significant customer base and manufacturing presence, are comparatively less robust and, as a result, we may be limited in our ability to enforce our intellectual property rights there. We may also be at a disadvantage in any enforcement proceeding in China and India as a foreign entity seeking protection against a locally headquartered company. Patent and trademark laws and trade secret protection may not adequately deter third-party infringement or misappropriation of our patents, trademarks, trade secrets and similar proprietary rights. In addition, patents issued to us may be challenged, invalidated or circumvented. The loss or expiration of any of our key patents could lead to a significant loss of sales of certain of our products and could materially affect our operating results. We have in the past and may in the future be subject to or may initiate interference proceedings, validity challenges or opposition proceedings in the U.S. Patent and Trademark Office, the European Patent Office, or similar agencies, which can demand significant financial and management resources. The process of seeking patent protection can be time consuming and expensive and patents may not be issued from pending or future applications. Moreover, our patents may not be sufficient in scope or strength to provide meaningful protection or a commercial advantage to us. We may initiate claims, enforcement actions or litigation against third parties for infringement of our proprietary rights in order to determine the scope and validity of our proprietary rights or the proprietary rights of our competitors, which claims could result in costly litigation, the diversion of our technical and management personnel and the assertion of counterclaims by defendants, including counterclaims asserting invalidity of our patents. Further, governments and courts are considering new issues in intellectual property law with respect to work created by AI technology, which could result in different intellectual property rights in development processes, procedures and technologies we may create with artificial technology, which could have a material adverse effect on our business.
Risks Related to Our Operations
Supply chain disruptions and other manufacturing interruptions or delays have affected our ability to meet customer demand and have led to higher costs, while the failure to estimate customer demand accurately has resulted in excess or obsolete inventory, all of which has negatively impacted, and could in the future negatively impact, our business.
Our business depends on the timely supply of products and services that meet the rapidly changing technical and volume requirements of our customers, which depends in part on the timely delivery of raw materials, parts, components and subassemblies from our suppliers, including contract manufacturers. For example, from the first quarter of 2021 until the second half of 2023, we experienced significant constraints due to global supply chain disruptions, including procuring electronic components, which negatively impacted our sales, costs and margins, and our ability to timely produce products to meet customer demand. Supply constraints and the potential for shortages caused us to increase safety stock levels, which has increased the amount of inventory we hold. Cyclical industry conditions and volatility of demand for our products increase capital, technical, operational and other risks for us and for companies throughout our supply chain. We have experienced, and we could experience in the future, significant disruptions in our supply chain, interruptions of our manufacturing operations, delays in our ability to deliver products or services, increased costs, price volatility, and customer order cancellations, which have been, or may in the future be, as a result of:
•Volatility in the availability and cost of materials, including electronic components and raw materials, whether due to interruptions in production by suppliers, allocations of products to other purchasers, fluctuations in foreign currency exchange rates, changes in worldwide price levels (whether due to inflationary pressures or otherwise), environmental limitations, geopolitical issues or other factors;
•Pandemics such as COVID-19, natural disasters or other events beyond our control (such as earthquakes, floods or storms, wildfires, power outages, such as rolling blackouts previously experienced in China, regional economic downturns, social unrest, political instability, terrorism, or acts of war), particularly where we or our suppliers, subcontractors and contract manufacturers conduct manufacturing;
•Global logistics network challenges, such as limited availability of and constraints on freight capacity;
•IT or infrastructure failures; and
•New laws or regulations.
For example, we use certain raw materials derived from petrochemical based feedstocks, the prices of which have historically been subject to periods of rapid and significant upward and downward movement. We may not be able to pass on price increases in raw materials, or price increases by our suppliers, to our customers due to competitive pricing pressure, and, even when we are able to do so, there may be a delay between price increases in raw materials and our ability to increase the prices of our products.
In addition, a rapid increase in our business and manufacturing capacity to meet increases in demand or expedited shipment schedules may exacerbate any interruptions in our manufacturing operations and supply chain and the associated effect on our working capital. Moreover, if actual demand for our products is different than expected, we may purchase more or fewer parts than necessary or incur costs for canceling, postponing or expediting delivery of parts. If we purchase inventory in anticipation of customer demand that does not materialize, or if our customers reduce or delay orders, we may incur excess inventory charges. Any of these factors could materially and adversely affect our business, financial condition and operating results.
Our dependence on sole and limited source suppliers and international suppliers has negatively impacted, and could continue to impact, our ability to manufacture products and systems.
We rely on sole and limited source suppliers and international suppliers for some of our raw materials, components, subassemblies and software that are critical to manufacturing our products and/or our testing and operations processes due to unique properties or component designs as well as specialized quality and performance requirements. Our reliance on sole and limited source suppliers and international suppliers involves a number of risks, including:
•The inability to obtain an adequate supply of required raw materials or components, including if our suppliers cannot scale their manufacturing output to meet our demands;
•Quality and reliability problems with raw materials or components, which in turn may adversely affect our products' quality and reliability;
•Prohibitively higher raw material or component prices, including as a result of tariffs;
•Supply chain disruptions, including as a result of the relocation of certain low-cost and sole and limited source suppliers to less-developed countries;
•Reduced control over pricing and timing of delivery of raw materials and components;
•The inability of our suppliers to develop technologically advanced products to support our growth and development of new products;
•Difficulty obtaining raw materials concentrated in limited geographies at reasonable prices or at all due to trade restrictions for those materials;
•The unavailability of service and/or spare parts for critical capital equipment; and
•The inability or unwillingness of our suppliers to continue to offer supplies or services on commercially acceptable terms.
At times, we have not been able to, and in the future, we may not be able to, obtain and qualify alternative sources of these components on favorable terms, on a timely basis, or at all, whether because there are a limited number of suppliers or because we have entered into supply agreements with certain suppliers that contain certain minimum purchase requirements. The use of alternative sources could require us to redesign our products, which could result in increased costs, shipping delays and the need to requalify products with customers, particularly those with “copy exact” requirements. Any inability to redesign our products could result in further costs and shipping delays. Increased costs would decrease our profit margins if we could not pass these costs to our customers. Further, shipping delays damage, and may continue to damage, our relationships with customers and have a material adverse effect on our business and operating results.
Our failure to successfully manage the transition of certain of our products to other manufacturing locations, the transition of certain of our products to or from contract manufacturers, and the transition of certain functions to centralized locations would likely harm our business, financial condition and operating results.
As part of our continuous cost-reduction and business continuity efforts, we continue to relocate the manufacturing of certain of our existing product lines and subassemblies to, and initiate the manufacturing of certain new products in, our facilities in Mexico, Romania and Singapore, as well as to our significant subcontracted operations in Mexico and selected contract manufacturers in Asia. In addition, we have relocated certain segments of other functions to, or initiated certain segments of other
functions in, centralized locations, including relocating certain procurement activity to Mexico and Romania, relocating certain IT and research and development activity to India, relocating certain administrative finance, payroll, software and IT activity to Poland, and continuing certain engineering activity in India. In the future, we may expand the level of functions that we initiate in or move to other global locations to take advantage of cost efficiencies or for business continuity purposes. For example, in October 2024, we announced that we broke ground on a new manufacturing factory in Penang, Malaysia. However, we may not be able to achieve significant cost savings or other benefits from these actions. For example, costs may increase as development and manufacturing expenses increase and labor, material, logistics and facility-related costs rise, as we have seen in our manufacturing locations in China, Mexico and Romania. If these costs increase to the extent that we no longer realize the cost savings we anticipated, we may need to relocate these operations and functions to other lower-cost regions. Additionally, if we are unable to successfully manage the relocation, initiation or oversight of these operations and functions, including identifying, training and retaining skilled labor, our business, financial condition and operating results would be harmed.
In particular, transferring product lines to other manufacturing locations and/or to or from our contract manufacturers' facilities often requires us to transplant complex manufacturing equipment and processes across a large geographical distance, train a completely new workforce concerning the use of this equipment and these processes and comply with local regulations. In addition, our customers may require us to requalify products supplied to them in connection with the relocation of manufacturing operations. If we are unable to manage these transfers and training smoothly and comprehensively, or if we are unable to requalify products in a timely manner, we could suffer manufacturing and supply chain delays, excessive product defects, harm to our operating results and our reputation, and loss of customers. Further, the utilization of overseas manufacturing locations and contract manufacturers may require additional transportation and shipping costs and customs tariffs or export licenses, which may be difficult or costly to obtain.
Additionally, qualifying contract manufacturers and commencing volume production is expensive and time-consuming, and there is no guarantee we will continue to do so successfully. Further, our reliance on contract manufacturers reduces our control over compliance, assembly, quality assurance, production costs and material and component supply for our products. If we fail to manage our relationships with our contract manufacturers, or if any of our contract manufacturers violate laws or regulations or experience financial difficulty, delays, disruptions, capacity constraints or quality control problems, our ability to ship products to our customers could be impaired and our competitive position and reputation could be harmed. Further, if we or our contract manufacturers are unable to negotiate with suppliers for reduced material or component costs, our operating results could be harmed.
In addition, our contract manufacturers may terminate our agreements with them, including immediately if we become insolvent or fail to perform a material obligation under the agreements. If we are required to change contract manufacturers or assume internal manufacturing operations, including due to the termination of one of our contract manufacturing contracts, we will likely suffer manufacturing and shipping delays, lost sales, increased costs and damage to our customer relationships, any of which would harm our business, financial condition and operating results.
Our products could contain defects, which would increase our costs and seriously harm our business, financial condition, operating results and customer relationships.
Many of our products are inherently complex in design and, in some cases, require extensive customization and/or ongoing regular maintenance. Further, the manufacturing of these products often involves a highly complex and precise process, the utilization of specially qualified materials or components that conform to stringent specifications, and highly skilled labor. As a result of the technical complexity of these products, design defects, skilled labor turnover, changes in our or our suppliers' manufacturing processes or the inadvertent use of defective or nonconforming materials or software by us or our suppliers could adversely affect our manufacturing yields and product reliability. This could in turn harm our business, operating results, financial condition and customer relationships.
We provide warranties for our products, and we accrue reserves for estimated warranty costs at the time we recognize revenue for the sale of the products. The determination of such reserves requires us to make estimates of product return rates and expected costs to repair or replace the products under warranty. We establish warranty reserves based on historical warranty costs for our products. If actual return rates or repair and replacement costs differ significantly from our estimates, our operating results would be negatively impacted.
Our customers may discover defects in our products after the products have been fully deployed and operated under peak stress conditions. In addition, some of our products are combined with other suppliers’ products, which may contain defects. Further, some of our customers use our products in ways other than their intended purpose. As a result, it may be difficult to identify the source of a customer’s problem. If we are unable to promptly identify and fix defects or other problems, we could experience, among other things:
•Increased costs of product returns and warranty expenses;
•Increased costs required to analyze and mitigate the defects or problems;
•Damage to our reputation;
•Failure to attract new customers or achieve market acceptance;
•Diversion of development, engineering and service resources; and/or
•Legal action by our customers or their customers.
The occurrence of any of these factors could seriously harm our business, financial condition and operating results.
Chemical manufacturing is inherently hazardous and could result in accidents that disrupt our operations or expose us to significant losses or liabilities.
The hazards associated with chemical manufacturing and the related storage and transportation of chemical raw materials, products and waste are inherent to our specialty chemicals operations. These hazards could lead to an interruption or suspension of operations and have a material adverse effect on the productivity and profitability of a particular manufacturing facility or on our business as a whole. Potential risks include storage tank leaks and ruptures, explosions and fires, and chemical spills and other discharges or releases of toxic or hazardous substances or gases. These risks could be caused or exacerbated by mechanical failures, unscheduled downtime, labor difficulties, transportation interruptions, inclement weather, natural disasters, cybersecurity breaches or terrorist attacks. These hazards may result in personal injury and loss of life, damage to property, and contamination of the environment, which may result in an interruption or suspension of operations, the imposition of civil or criminal fines, penalties and other sanctions, cleanup costs, and claims by our employees, governmental entities or third parties. We are dependent on the continued operation of our production facilities, and the loss or shutdown of operations at any of our major operating facilities could have a material adverse effect on our business, financial condition and operating results.
We outsource a number of services to third-party service providers, which decreases our control over the performance of these functions. Disruptions or delays at our third-party service providers could adversely impact our operations.
We outsource a number of services, including certain IT systems and systems management, logistics, contract manufacturing, payroll and tax functions, to third-party service providers. While outsourcing arrangements may lower our cost of operations, they also reduce our direct control over the services rendered. This diminished control may have an adverse effect on the quality or quantity of services rendered, our ability to quickly respond to changing market conditions, or our ability to ensure compliance with all applicable laws and regulations. If we do not effectively develop and manage our outsourcing strategies, if required export and other governmental approvals are not timely obtained, if our third-party service providers do not comply with laws or perform as anticipated, or do not adequately protect our data, including from cybersecurity breaches, or if there are delays or difficulties in enhancing business processes, we may experience operational difficulties, increased costs, manufacturing or service interruptions or delays, loss of intellectual property rights or other sensitive data, quality and compliance issues, and challenges in managing our product inventory or recording and reporting financial and management information, any of which could materially and adversely affect our business, financial condition and operating results.
The loss of net revenues from any one of our major customers would likely have a material adverse effect on us.
Our top ten customers accounted for approximately 32%, 30% and 42% of our net revenues for 2024, 2023 and 2022, respectively. In any one reporting period, a single customer or several customers may contribute an even larger percentage of our consolidated net revenues. The loss of any of these customers or any significant reduction in orders by these customers, including reductions due to economic, market or competitive conditions, regulatory requirements, or failure to meet customer demands, would likely have a material adverse effect on our business, financial condition and operating results. None of our significant customers has entered into an agreement with us that requires it to purchase any minimum quantity of our products.
Attempts to offset the effect of any loss or reduction of net revenues through the rapid addition of new customers would be difficult because a relatively small number of companies dominate the semiconductor and electronics manufacturing industries. Further, prospective customers typically require lengthy qualification periods prior to placing volume orders with a new supplier. Our future success will continue to depend upon:
•Our ability to maintain relationships with existing key customers;
•Our ability to attract new customers and satisfy any required qualification periods;
•Our ability to introduce new products in a timely manner for existing and new customers;
•The successes of our original equipment manufacturer (“OEM”) customers in creating demand for their capital equipment products that incorporate our products; and
•Our ability to gain significant customers and business in new, emerging segments of our markets.
Key personnel have been, and may continue to be, difficult to attract and retain.
Our ability to maintain and grow our business is directly related to the service of our employees, who we consider to be a significant asset. Our performance is directly tied to our ability to hire, train, motivate and retain qualified personnel, including highly skilled technical, financial, managerial, and sales and marketing personnel. There is significant competition for personnel in the technology and sciences marketplace, particularly in certain geographies where we are located, including the Boston, Massachusetts area, Orange County and the San Francisco Bay area of California, Tokyo, Japan, and Singapore. Also, employees in our industries are increasingly able to work remotely, which could increase employee mobility and turnover, making it more difficult for us to attract and retain employees. In addition, many of our product manufacturing processes and product services require deep technical expertise, and it can be particularly challenging to identify and attract candidates and retain employees possessing such expertise. We have experienced, and may continue to experience, attrition in certain key positions. For example, Seth H. Bagshaw, our former Executive Vice President, Chief Financial Officer and Treasurer, retired on April 1, 2024, and his successor, Ramakumar Mayampurath, did not begin his employment until October 14, 2024. A related challenge is that a significant portion of our technical talent is nearing retirement age, and we may have difficulty training our existing workforce or attracting a sufficient number of new employees with the necessary skills and experience to replace them. If we are unable to hire sufficient numbers of qualified employees or retain and motivate existing employees, our business and operating results would be harmed.
Risks Related to Our Industries and Markets
The semiconductor, electronics manufacturing and automotive industries we serve are characterized by periodic fluctuations in business activity that may cause a reduction in demand for our products.
Our business depends upon capital expenditures of semiconductor device manufacturers (which in turn depends upon demand for semiconductors), electronics manufacturers and Tier 1 and Tier 2 suppliers for the automotive industry. All of these industries have historically experienced cyclical variations in product supply and demand. For example, our year-over-year sales to semiconductor capital equipment manufacturers and semiconductor device manufacturers sequentially increased 1% in 2024, decreased 28% in 2023, increased 12% in 2022 and increased 32% in 2021. These sometimes sudden and severe cycles can result from many factors, including overall consumer and industrial spending, demand for electronic products that drive manufacturer production, manufacturers' capacity utilization, timing of new product introductions, demand for customers' products, inventory levels relative to demand, access to affordable capital, labor conditions, commodity prices, and energy costs. The timing, severity and duration of these cycles are difficult to predict, and we may not be able to respond effectively to these cycles.
During downturns in the semiconductor and electronics manufacturing industries, periods of overcapacity have resulted in significantly reduced demand for our products, which may result in lower gross margins due to reduced absorption of manufacturing overhead, as our ability to rapidly and effectively reduce our cost structure in response to such downturns is limited by the fixed nature of many of our expenses in the near term. During downturns in the automotive industry, we have experienced a similar effect on the gross margins of the GMF business of MSD. Further, our ability to reduce our long-term expenses is constrained by our need to continue investing in next-generation product technology and to support and service our products. In addition, due to the relatively long manufacturing lead times for some of the products we sell to these industries, we may incur expenditures or purchase raw materials or components for products we are unable to sell. As a result, downturns in these industries may materially harm our business, financial condition and operating results. Conversely, during upturns in these industries, we may have difficulty rapidly and effectively increasing our manufacturing capacity to meet sudden increases in customer demand. If we fail to do so, we may lose business to our competitors and our relationships with our customers may be harmed.
Many of the markets and industries we serve are highly competitive, are subject to rapid technological advancement, and have narrow design windows, and if we fail to introduce new and innovative products or improve our existing products, or if our products or the applications we invest in do not achieve widespread adoption, our business, financial condition and operating results will be harmed.
We operate in highly competitive markets characterized by rapid technological advances, frequent product introductions and enhancements, changing customer requirements, evolving industry standards, substantial capital investment and increasing price pressure. Our success depends upon our ability to continuously develop, market and support superior products, processes and solutions. Factors that could harm our competitive position include:
•Our failure to anticipate demand for and internally develop or acquire new, improved and disruptive technologies;
•Our investment in emerging applications that do not achieve widespread adoption or significant growth;
•Delays in introducing new, enhanced and differentiated products, many of which are difficult to design and manufacture because of their technical sophistication and complexity;
•Inadequate manufacturing capabilities, customer service or support;
•Semiconductor device manufacturers failing to direct semiconductor capital equipment manufacturers to use our products at their semiconductor fabrication facilities;
•Global electronics OEMs failing to specify our products in their manufacturing processes for the rigid PCB manufacturers they use;
•Customers failing to achieve market demand for their products that incorporate our technologies;
•Efforts of customers to internally develop products that compete with our technologies or to engage subcontract manufacturers or system integrators to manufacture competitive products on their behalf;
•Implementation by our customers of dual source strategies, after historically relying on sole or limited source suppliers;
•Competitors that develop products that offer superior performance, technological features or value than our products;
•Competitors with greater financial, technical, marketing and other resources, including ownership by or affiliations with members of government, political entities or larger, multinational businesses, which may offer a number of competitive advantages, such as the ability to incur lower costs due to control over sources of components and raw materials or exclusive agreements with suppliers thereof;
•Competitors with greater recognition and stronger presences in specific product niches and/or regions, including in the specialty chemicals industry;
•Competitors, particularly in Asia, that are able to develop low-cost competitive products;
•Difficulties in displacing competitors' products that are designed into customers' products;
•Pricing pressure from customers and competitors, particularly new competitors that offer aggressive price and payment terms in an attempt to gain market share, and especially during cyclical downturns in our markets, when end-markets become more sensitive to costs and competitors are more likely to seek to maintain or increase market share, reduce inventory or introduce more technologically advanced or lower-cost products;
•Competitors that are able to adopt new technologies and technological advancements using AI and machine learning to pursue new products and approaches more quickly, successfully and effectively than us;
•Industry consolidation among competitors, which could exacerbate certain of these factors; and
•Regulatory changes that prevent or restrict the supply of our products and services to a particular industry, market or country.
Certain of these factors could cause customers to defer or cancel orders for our products and/or place orders for our competitors' products. This is particularly significant to us, as our success depends on many of our products being designed into new generations of equipment and manufacturing processes. Certain markets in which we operate, such as the semiconductor capital equipment market and the mobile phone market, which is part of our electronics and packaging market, experience cyclicality and unevenness in capital spending. If we are unable to introduce new products in a timely manner or are otherwise unsuccessful in making sales to customers, we may miss market upturns or fail to have our products or subsystems designed into our customers' products. For example, new products designed by capital equipment manufacturers historically have had a lifespan of five to fifteen years. We must develop products that are technologically advanced in a timely manner so that they are positioned to be chosen for use in each successive generation of capital equipment.
These factors could also prompt us to agree to pricing concessions or extended payment terms with our customers, in an effort to expand into new markets, gain volume orders or improve customer cost of ownership in highly competitive applications. In other cases, we may discontinue selling certain products if we cannot offset price erosion through shifts in operations.
Finally, these factors could render the portfolios of products or lines of business from which we generate significant net revenues obsolete. For example, we have lost business to customers who identify alternative materials or processes and therefore no longer require as much or any specialty chemicals. If our customers or the industries we serve shift to other technologies, our business, financial condition and operating results would be harmed.
We offer products for multiple markets and must face the challenges of supporting the distinct needs of each of the markets we serve.
We offer products for very diverse markets. Because we operate in multiple markets, we must work constantly to understand the needs, standards and technical requirements of many different applications within these markets and must devote significant resources to developing different products for these markets. Product development is costly and time consuming. We must anticipate trends in our customers' industries and develop products before our customers' products and processes are commercialized. If we do not anticipate our customers’ needs and activities, we may invest substantial resources in developing products that do not achieve broad market acceptance. Our growth prospects rely in part on successful entry into new markets, which depends on displacing competitors who are more familiar with these markets and better known to customers. In many cases, we are attempting to enter or expand our presence in these new markets with newly introduced products that are not yet proven in the industry. Our decision to continue to offer products to a given market or to penetrate new markets is based in part on our judgment of the size, growth rate, profitability and other factors that contribute to the attractiveness of a particular market. If our product offerings in any particular market are not competitive, our analyses of a market are incorrect or our sales and marketing approach for a market is ineffective, we may not achieve anticipated growth rates in this market, and our business, financial condition and operating results would be harmed.
Further, serving diverse markets requires an understanding of different sales cycles and customer types, and the development and maintenance of a complex global sales team and sales channels to support each market’s differing needs. It also requires dynamic operations that can support both complex, customized product builds as well as quick turn-around for commercial off-the-shelf sales. If we fail to provide sales and operational support for our diverse markets, our business, financial condition and operating results would be harmed.
Risks Related to Operating a Global Business
We face significant risks associated with doing business internationally.
We face significant risks from our substantial operations in, sales to, and purchases from international markets. Our presence and operations in international markets, and the risks associated with doing business internationally, may continue to change and will likely increase if our business grows. These risks, many of which we have experienced, include:
•Adverse changes or instability in political or economic conditions in countries or regions where we and our customers and suppliers are located, including currency devaluations, debt defaults, lack of liquidity and recessions;
•Challenges of administering our diverse business and product lines globally;
•Actions of government regulatory authorities, including embargoes, sanctions (including “anti-blocking” rules), executive orders, import, export, and reexport restrictions, antiboycott laws, tariffs (including anti-dumping and countervailing duties), currency controls, trade restrictions and trade barriers (including retaliatory actions), license requirements (including license-specific restrictions and provisos), citizenship requirements, nationality restrictions, environmental requirements and other rules and regulations (including extraterritorial rules and regulations) applicable to the manufacture, import, export, reexport or end-use of our products, all of which may be complicated and conflicting, require significant investments in cost, time and resources for compliance, negatively impact revenues and margins, and impose strict and severe penalties for non-compliance;
•Political and social attitudes, laws, rules, regulations and policies within countries that favor domestic companies over non-domestic companies, including customer- or government-supported efforts to promote the development and growth of local competitors;
•Greater risk of violations of U.S. and international laws and regulations, including anti-corruption and trade laws, and our code of conduct, by our employees, sales representatives, distributors or other agents;
•Ambiguous or vague laws that make collecting payments or seeking recourse difficult;
•Increased credit risk and differing financial conditions of customers and distributors, resulting in longer accounts receivable collection periods and payment cycles, increased bad debt write-offs and additions to reserves;
•Overlapping, burdensome and differing tax structures and laws;
•Potential for certain tax benefits to be revoked or reclaimed;
•Reduced, inconsistent or differing protection of intellectual property, including unequal recognition and treatment of multi-national corporations’ rights by hostile or indifferent governments;
•Increasingly stringent privacy, security, consumer and data protection laws, such as the EU General Data Protection Regulation, the Data Security Law of China and the China Personal Information Protection Law;
•Shipping, logistics and other supply chain complications or cargo security requirements, including forced-labor mitigation rules and increased shipping costs, the latter of which certain parts of our business are experiencing as a result of the attacks on shipping in the Red Sea;
•Adverse currency exchange rate fluctuations;
•Restrictions on currency conversion or the transfer of funds, including restrictions on certain financial institutions themselves;
•Compliance costs, withholding taxes and legal and contractual restrictions associated with repatriating overseas earnings;
•Increased risk of exposure to significant health concerns (such as Monkeypox, COVID-19, Sudden Acute Respiratory Syndrome, Avian Influenza and the H7N9, Ebola or Zika viruses);
•Differences in business practices, culture, language and management style;
•Complex, burdensome and differing labor and employment laws and practices;
•Changing labor conditions and difficulties staffing, managing, and rationalizing our foreign operations, including rising wages and other labor costs, retention of employees, the formation of labor unions and works councils and the maintenance of defined benefit pension plans;
•Nationalization or other expropriation of private enterprises or land;
•Involuntary geopolitical annexations or accessions through military force or otherwise, including, for example, any actions by China to take control over Taiwan, and the implications any such action would have on our customers, other partners, and the global semiconductor ecosystem; and
•Increased risk of exposure to civil unrest, terrorism, government sanctioned and non-government sanctioned acts of violence, and military activities.
If we experience any of the risks associated with doing business internationally, our business, financial condition and operating results could be significantly harmed.
We have significant facilities and operations and a considerable number of employees in Israel. A number of our products are manufactured in facilities located in Israel. Following the Hamas attack on Israel in October 2023 and the additional attacks which followed from other countries in the Middle East (including Lebanon, Iran, Syria, Iraq and Yemen), some of our employees in Israel were called for active military duty. While, as of February 25, 2025, our facilities in Israel remain operational, if the current ceasefire between Israel and Hamas ends, and the Israel-Hamas war resumes or if other regional conflicts begin, our operations in Israel could be significantly disrupted, including due to the absence of one or more key employees or a significant number of other employees, or significant damage to or the complete destruction of any of our local facilities. More broadly, the future of peace efforts between Israel and its neighboring countries remains extremely uncertain. Any other armed conflicts or further political instability in the region could similarly negatively affect our business, including if additional employees in Israel are called for active military duty. Any such disruptions could adversely affect our business, financial condition and operating results.
We have limited operations and employees in Belarus. Historically, we made immaterial sales into Russia and Belarus. As a result of the ongoing military conflict between Russia and Ukraine, including the imposition of sanctions on Russia, Belarus and related parties, our sales into Belarus and Russia ceased. Any additional disruptions, including the expansion of sanctions in connection with the conflict, could adversely affect our business.
The U.S. government continues to take action against certain of our customers, particularly our customers located in Asia, including indictments for various criminal charges, and in some cases, restrictions on doing business with these customers (or restrictions on third parties from engaging designated entities), including the suspension of our ability to fill outstanding orders. These actions have caused us, and will in the future cause us, to lose anticipated revenue from product sales, the amount of which could be significant. In addition, these or other customers could elect to purchase products from unaffected non-U.S. competitors, even when trade restrictions are not in place, jeopardizing our long-term relationship with them. Further, compliance with regulatory restrictions may cause us to breach contractual obligations, which could result in costs, penalties and litigation.
Additionally, potential customers in certain countries, particularly in Asia, have a strong preference for technology and products developed by suppliers based in their home countries. The trade dispute between the U.S. government and the Chinese government has reinforced and broadened this preference, as potential and existing customers seek to avoid the uncertainty related
to the trade dispute. While we have attempted to mitigate these issues by establishing a significant local presence in many of these countries, companies like us that are based elsewhere remain at a disadvantage in these markets.
We face significant risks associated with doing business in China in particular.
As a result of our extensive presence in China, we are subject to the following significant risks:
•Adverse changes in Chinese political, economic or social conditions or Chinese laws, regulations or policies, including the imposition of unexpected or confiscatory taxation, restrictions on currency conversion, imports and sources of supply, devaluations of currency, the nationalization or other expropriation of private enterprises, or the reversal of economic reform policies that encourage private economic activity, foreign investments and greater economic decentralization;
•Differing economic practices compared to most developed countries, including with respect to the amount of government involvement, control of foreign exchange and allocation of resources;
•Uncertainties presented by the Chinese legal system, which is not fully integrated and continues to rapidly evolve, impeding our ability to interpret certain Chinese laws and regulations, predict and evaluate the outcome of administrative and court proceedings and the level of legal protection in China and enforce contracts we have entered into in China;
•Chinese controls on the convertibility of Renminbi into foreign currencies and, in certain cases, the remittance of currency out of China, restricting our ability to remit sufficient foreign currency to pay dividends or make other payments to us, or otherwise satisfy foreign currency-denominated obligations; and
•The escalation of trade tensions between China and other countries, including the United States, and the imposition of tariffs, sanctions and export controls by various government agencies, has impacted international trade. Notably, as discussed in greater detail below, the U.S. government imposed tariffs on certain imports from China in 2018 and 2019, and China responded by imposing its own retaliatory tariffs. In early 2025, the U.S. government increased trade tensions with China by imposing additional tariffs on certain imports from China. In addition, as discussed in greater detail below, the U.S. government has implemented export restrictions and national security reviews on semiconductor technologies related to China, which has disrupted, and could further disrupt, existing partnerships and limit market opportunities within the Chinese market. These reviews and restrictions may lead to challenges in accessing markets or curtail investment prospects. The complexity of these regulations further elevates the risk of non-compliance.
If we experience any of the risks associated with doing business in China, our business, financial condition and operating results could be significantly harmed.
Unfavorable currency exchange rate fluctuations may lead to lower operating results or may cause us to change customer pricing, which could result in reduced sales and losses.
Although we report our financial position and operating results in U.S. dollars, a significant portion of our net revenues are from customers in international markets where we invoice in currencies other than the U.S. dollar, and we have facilities where costs are incurred in currencies other than the U.S. dollar. In addition, we carry certain assets and liabilities in currencies other than the U.S. dollar. The indebtedness we incurred in connection with the Atotech Acquisition includes a Euro tranche, the outstanding balance of which was €596 million as of January 31, 2025. Currency exchange rate fluctuations could have an adverse effect on our assets, liabilities, net revenues, expenses and operating results and we could experience losses with respect to our hedging activities. Unfavorable exchange rate fluctuations could require us to increase or decrease prices to customers, which could result in lower net revenues from such customers. Alternatively, if we do not adjust the prices for our products in response to unfavorable currency fluctuations, our operating results could be adversely affected by declining net revenues or profit margins for our products. Such exchange rate fluctuations could also increase the costs and expenses of our non-U.S. operations when translated into U.S. dollars or require us to modify our current business practices. In addition, most sales made by our foreign subsidiaries are denominated in the currency of the country in which these products are sold and the currency they receive in payment for such sales could be less valuable on a U.S. dollar basis at the time of receipt as a result of exchange rate fluctuations. We enter into foreign exchange forward contracts to reduce a portion of our currency exposure arising from intercompany sales of inventory as well as intercompany accounts receivable and intercompany loans. However, we cannot be certain that our efforts will be adequate to protect us from significant exchange rate fluctuations or that such efforts will not expose us to additional exchange rate risks.
Legal, Tax, Regulatory and Compliance Risks
We are obligated to develop and maintain proper and effective internal control over financial reporting, and we previously identified a material weakness in our internal control over financial reporting and may discover additional material weaknesses
in the future. Any failure to maintain the adequacy of this internal control may adversely affect our results of operations, our stock price and investor confidence in our Company.
We previously identified a material weakness in our internal control over financial reporting that was remediated as of December 31, 2023. We may in the future identify additional internal control deficiencies that could rise to the level of a material weakness or uncover other errors in financial reporting. If we fail to remediate any future material weaknesses and maintain effective internal control over financial reporting, our ability to accurately record, process, and report financial information and, consequently, our ability to prepare financial statements within required time periods could be adversely affected. Failure to maintain effective internal controls could result in a failure to comply with SEC rules and regulations, stock exchange listing requirements, and the covenants under our debt agreements, subject us to litigation, investigations or enforcement actions, negatively affect investor confidence in our financial statements, and adversely impact our stock price and ability to access capital markets. The defense of any such claims, investigations or enforcement actions could divert our attention and resources and could cause us to incur significant legal and other expenses even if the matters are resolved in our favor.
If significant trade restrictions or tariffs on our products or components that are imported from or exported to certain countries, for example, China, Canada and Mexico, are initiated, continue or are expanded, our business, financial condition and operating results may be materially harmed.
In recent years, trade tensions between the United States and China, and since early 2025 between the United States and Mexico and the United States and Canada, have increased substantially, resulting in significant trade restrictions that have significantly harmed our business. These regulations include tariff increases, additional sanctions against specified entities, and the broadening of restrictions and license requirements for specified end-uses of those of our products that are subject to these restrictions, including restrictions surrounding specific product groups, applications and/or end uses. The U.S. government’s concerns relate to, among other things, national security and the concept of “military/civil fusion” in China, a national strategy in which military technologies are developed or produced alongside commercial, non-military items, often by private or quasi-government companies. Further, concerns related to the use and growth of AI in military and intelligence applications, the development of weapons of mass destruction, offensive cyber operations, and human rights violations through mass surveillance continue to drive the regulatory landscape. In each of 2018 and 2019, the U.S. government-imposed tariffs on certain imports from China, and the current U.S. administration has announced 25% tariffs on certain imports from Canada and Mexico and an additional 10% tariff on certain imports from China and may announce future tariffs on imports from these and other countries. In addition to tariffs and targeted comprehensive sanctions against specific firms, in recent years, “Entity List” designations and “military end-user” controls have been significantly expanded, as have some rules relating to items produced outside the United States that incorporate more than de minimis levels of U.S. controlled content or that are derived from (i.e., the “direct product” of) U.S. origin technologies, equipment or software. In October 2022, the U.S. Department of Commerce’s Bureau of Industry and Security (“BIS”) implemented new and novel restrictions related to end-uses in semiconductor, semiconductor manufacturing, supercomputer, and advanced computing, along with certain equipment used to develop and produce them, as well as controls around the activities of U.S. persons in certain markets, including China. These regulations, which BIS has amended several times since initial publication (as amended, the “BIS Rules”), have resulted in, and may in the future result in, loss of business, both directly to China end-customers, and indirectly through our OEM customers, as well as additional export license requirements on shipments of our products, parts and supplies, and associated increased administrative burdens. For example, as a result of the initial BIS Rules promulgated in late 2022, we experienced an annual loss in net revenues of approximately $200 to $250 million, most of which was realized in 2023. The extraordinary complexity of these rules, combined with their continued modification and the likelihood of further amendments from BIS, significantly increases our risk of non-compliance, which could result in fines and other penalties, and could change how these rules impact us. The U.S. government and other government agencies may promulgate new or additional export licensing or other regulations that have the effect of further limiting our ability to provide certain products and services to customers outside the United States, including China. The U.S. government may also revise or expand existing regulations or issue guidance clarifying the scope and application of these requirements, which could change the impact of these rules on our business and manufacturing operations. While we continue to adjust our policies and practices to ensure compliance with these regulations, and seek to mitigate their impact, there can be no assurances that current or future regulations and tariffs will not have a material adverse effect on our business.
Since the beginning of 2019, regulatory changes have been implemented at an unprecedented pace, which increases the resources needed to monitor and comply with regulations, while heightening the risk of non-compliance. Such regulatory changes include the addition by BIS of China-based Huawei Technologies Co., Ltd. (“Huawei”), Semiconductor Manufacturing International Corporation (“SMIC”), Yangtze Memory Technologies Corp (“YMTC”), NAURA Technology Group, Piotech, Inc. and many of their respective affiliates onto its Entity List. Accordingly, we have implemented additional monitoring processes and suspended orders from these companies as well as other designated Chinese-based customers, where those orders are subject to U.S. jurisdiction. We have also been negatively impacted by the cancellation of orders from customers who are suppliers to these firms. In addition, BIS has modified the Foreign Direct Product, De Minimis and “military end-use” rules, expanded the scope of
products and technologies that would require licenses for military end-uses, primarily in China, and expanded the list of “military end users,” mostly in China, further limiting our sales. At the same time, BIS and the U.S. Department of Defense have also added numerous China-based companies, including companies with which we do business, to the “Unverified List,” and “Chinese Military Companies” list, respectively. Placement on such lists may be an indication of additional future restrictions by the U.S. government, as was the case with YMTC, which was added to the Unverified List in October 2022 and was then added to the Entity List in December 2022.
Increased restrictions on China have led to and may continue to lead to regulatory retaliation by the Chinese government and further escalate geopolitical tensions between China and Taiwan. China has adopted, and announced its intention to further adopt, new regulations that could have an adverse effect on our operations. For example, in response to the imposition of U.S. tariffs in 2018 and 2019, China imposed its own retaliatory tariffs. In 2019, China’s Ministry of Commerce also announced an “unreliable entity list” under which non-Chinese entities that cut off supply to Chinese companies may be subject to government action. Because many of the mechanisms for being named to the list, removed from the list, and enforcement remain ill-defined and unavailable to the public, the potential impacts of the regulation remain unknown. In addition, in 2023, China adopted export curbs on crucial raw materials, including gallium, germanium, and graphite, that had both direct and indirect adverse impacts on our business and supply chain. In December 2024, the Chinese Ministry of Commerce imposed stricter export control restrictions on the export to the United States of gallium, germanium and other materials with potential dual-use applications, thereby increasing the adverse impact on our business, costs and supply chain. The ongoing geopolitical tensions and economic uncertainty between the United States and China caused by recent tariffs, Entity List and “military end user” designations, foreign-made product rules and the BIS Rules, and the unknown impact of current and future Chinese trade regulations, may continue to increase costs, as well as restrict our ability to sell, or decrease demand from customers to purchase, our products, directly and indirectly, which could materially harm our business, financial condition and operating results. This trade uncertainty has caused, and may continue to cause, customers to delay or cancel orders, as they mitigate the risk to their own supply chain and cost exposure by sourcing from locally based suppliers or suppliers based in other countries. Such delays and cancellations could have a material impact on our business, financial condition and operating results. It is possible that additional trade restrictions will be imposed, and that existing tariffs will be increased on imports of our products or the components used in our products and/or that our business will be impacted by additional retaliatory tariffs, policies that favor domestic industries, or restrictions imposed and/or increased by China or other countries in response to existing or future tariffs. These developments could cause us to lose additional sales and customers, incur increased costs and lower margins, seek alternative suppliers, raise prices or make changes to our operations, any of which could materially harm our business, financial condition and operating results.
We are subject to international trade compliance regulations, and violations of those regulations could result in fines or trade restrictions, which could have a material adverse effect on us.
We are subject to trade compliance laws in both the United States and other jurisdictions where we operate. For example, exports of our products and technology developed or manufactured in the United States are subject to export controls imposed by the U.S. government and administered by the U.S. Departments of Commerce and, to a lesser extent, State and Treasury. Export regulations govern exports of our products and technology developed or manufactured in other countries, including, for example, Austria, China, France, Germany, Israel, Romania and Singapore. In certain instances, these regulations may require obtaining licenses from an administering agency prior to exporting products or technology to international locations or foreign nationals, including foreign nationals employed by us in the United States and abroad. For products and technology subject to the U.S. Export Administration Regulations administered by BIS, the requirement for a license is dependent on the type and end use of the product and technology, the final destination and the identity and nationality of the end user. Virtually all exports from the United States of defense articles are subject to the International Traffic in Arms Regulations, administered by the Department of State’s Directorate of Defense Trade Controls, and require a license. The Israeli Ministry of Economy and the Defense Export Control Agency of the Israeli Ministry of Defense administer similar export regulations and license requirements, which apply to many of our products and technology developed or manufactured in Israel. In addition, the Romanian Ministry of Foreign Affairs and the Department for Export Controls administer similar export regulations and license requirements, which apply to many of our products and technology developed or manufactured in Romania. Obtaining export licenses can be difficult and time-consuming, and we may not be successful in obtaining them. Failure to obtain export licenses to enable product and technology exports could reduce our net revenues, harm our relationships with our customers and could adversely affect our business, financial condition and operating results. Compliance with export regulations require resources and may also subject us to additional fees and costs. The absence of comparable export restrictions on competitors, whether due to technical specifications or such competitors’ geography, either with respect to their place of incorporation or location of their operations, may adversely affect our competitive position.
In addition, if we or our international representatives or distributors fail to comply with any of these export regulations, we or they could be subject to civil and criminal and monetary and non-monetary penalties and costly consent decrees, and we could experience disruptions to our business, restrictions on our ability to export products and technology, damage to our reputation and significant harm to our business and operating results. We are constantly engaged in systematic, risk-based reviews of our
compliance-related activities to identify and remediate known and suspected weaknesses (e.g., product export classification). In connection with these reviews, we periodically identify certain activities that are non-compliant with applicable trade regulations and submit appropriate voluntary disclosures to applicable authorities to report such non-compliance. While such instances of non-compliance have not had a material adverse impact on us to date, other reported non-compliance may have a different effect. Additionally, while we have implemented, and continue to implement and optimize, policies and procedures to comply with these laws, we cannot be certain that our employees, contractors, suppliers or agents will not violate such laws or our policies.
Changes in tax rates or tax regulation or the termination of tax incentives could affect our operating results.
As a global company, we are subject to taxation in the United States and various other countries. Significant judgment is required to determine and estimate worldwide tax liabilities. Our future annual and quarterly effective tax rates could be materially affected by numerous factors, including changes in the following: applicable tax laws; the organizational structure of our business, including reorganizations, location of assets and outstanding indebtedness; composition of pre-tax income in countries with differing tax rates; our determinations of tax liabilities; and/or valuation of our deferred tax assets and liabilities.
Changes in U.S. tax law, such as the Tax Cuts and Jobs Act, the Inflation Reduction Act, and changes in regulations and tax guidance may affect our business. Additionally, the United States is considering various corporate and international income tax proposals, which, if enacted, could have a material impact on our provision for income taxes and effective tax rate.
We are subject to regular examination by the U.S. Internal Revenue Service and state, local and foreign tax authorities. We regularly assess the likelihood of favorable or unfavorable outcomes resulting from these examinations to determine the adequacy of our provision for income taxes. Although we believe our tax estimates are reasonable, we can make no assurances that any final determination of tax liability will not be materially different from the treatment reflected in our historical income tax provisions and accruals, which could materially and adversely affect our financial condition and operating results.
We qualify for tax incentives based on our ability to meet, on a continuing basis, various tests relating to our employment levels, research and development expenditures and other qualification requirements in a particular jurisdiction. While we intend to operate in such a manner to maintain and maximize our tax incentives, we can make no assurances that we have so qualified, or that we will qualify, for tax incentives for any particular year or jurisdiction. If we fail to qualify or remain qualified for certain tax incentives, the tax incentives we previously received may be terminated and/or retroactively revoked, requiring repayment of past tax benefits, and we would be subject to an increase in our effective tax rate, which could have a materially adverse impact our financial results.
Many of our products and customers are subject to numerous laws regulating the production and use of chemical substances, and some of our products may need to be reformulated or discontinued to comply with these laws and regulations.
As a manufacturer of specialty chemicals, we are subject to chemicals approvals, registrations and regulations around the world, including European Union Regulations on Registration, Evaluation, Authorisation and Restriction of Chemicals (“EU REACH”) in the EU, the Toxic Substances Control Act (“TSCA”) in the United States, and similar laws and regulations in certain other jurisdictions in which we and our customers operate. In recent years, changes to existing laws and regulations and the adoption of new laws and regulations have imposed new obligations, including restrictions and prohibitions on highly hazardous substances, could also force us to reformulate or discontinue certain of our products.
Governmental, regulatory, and societal demands for increasing levels of product safety and environmental protection are resulting in increased pressure for more stringent regulatory control with respect to the chemical industry, including with respect to manufacturing, importing and using chemicals. For example, EU REACH imposes comprehensive compliance obligations and establishes mechanisms to identify and restrict high-concern chemicals, and comparable regulatory requirements have now been adopted in several other countries. As another example, in the United States, the core provisions of TSCA were amended in June 2016 for the first time in nearly 40 years. Among the more significant changes, the amended TSCA mandates risk evaluation of existing “high priority” chemicals. In addition, the U.S. Environmental Protection Agency (the “EPA”) must make a no “unreasonable risk” finding before a new chemical can be fully commercialized. In China, with the publication of the first and second batch of the List of Chemicals under Priority Control, the Ministry of Ecology and Environment has begun to implement restrictions and bans on the use of certain substances in a variety of industrial sectors. Additionally, the Technical Standards on Environmental Risk Assessment and Control of Chemical Substances (2024) impose comprehensive obligations with respect to the screening, determination and mitigation of risks of certain chemicals. These laws and regulations generally create uncertainty about whether existing chemicals important to our business may be designated for restriction and whether the approval process for new chemicals may become more difficult and costly. These changes could adversely impact our ability to supply certain products to our customers and could also result in compliance obligations, fines, ongoing monitoring and other future business activity restrictions, which could have a material adverse effect on our business, financial condition and operating results.
Perfluorooctanesulfonic acid and other per- and polyfluoroaklyl substances (“PFAS”) are chemical agents that have been targeted for risk assessment, restriction, regulation and high-priority remediation and are the subject of litigation and governmental investigations in the United States and other countries. While we have developed a suite of products that do not require any PFAS chemicals and, when adopted by the industry, will obviate the need for PFAS-containing mist suppressants and wetting agents, we continue to sell a limited number of products that contain permissible levels of PFAS. We have been named as a defendant in lawsuits related to PFAS and we have received a request for information from, and responded to, a state agency.
International environmental protection requirements, including chemical regulation requirements, and enforcement of these requirements, may become more stringent in the future and could result in material costs relating to regulatory compliance, liabilities, litigation proceedings, or other impacts, such as restrictions or prohibitions on our products. Future regulatory or other developments could also restrict or eliminate the use of, or require us to make modifications to, our products, packaging, manufacturing processes, transportation methods, and technology, which could have a material adverse effect on our business, financial condition, and operating results. Our production facilities require permits, such as environmental, operating, and product-related permits and import/export permits, which are subject to renewal and, in some circumstances, revocation. We may not obtain the necessary permits. In addition, permits may be discontinued or may contain significant and costly new requirements. If a permit for a production facility is not renewed or is revoked, the facility may need to be closed temporarily or permanently, which may have a material adverse effect on our business, financial condition and operating results. Failure to obtain or maintain permits for our facilities or other failure to comply with applicable environmental regulations could result in the shutdown of, or suspension of operations at, our plants.
Many of our customers are subject to the same or similar environmental regulations. The impact of these regulations on our customers and our customers' ability to comply with these regulations is outside of our control. However, non-compliance by our customers could have an indirect negative effect on our business and result in claims against us. We must monitor relevant chemical regulatory developments in order to limit the associated risks of new developments by triggering countermeasures, such as alternative products and phase-outs, at the right time.
We are subject to environmental regulations. If we fail to comply with these regulations, our business could be harmed.
Our operations are subject to various federal, state, local and international laws and regulations relating to environmental protection, including those governing discharges of pollutants into the air, water and land, the reporting, generation, use, handling, storage, transportation, treatment and disposal of hazardous substances, waste and other materials and the cleanup of contaminated sites. In the United States, we are subject to the federal regulation and control of the EPA, and we are subject to regulations and controls of comparable authorities in other countries. Some of our operations, including our chemical operations, require environmental permits and controls to prevent and reduce air and water pollution, and these permits are subject to modification, renewal and revocation by issuing authorities. Future developments, administrative actions or liabilities relating to environmental matters, including sanctions such as capital expenditure obligations, clean-up and removal costs, long-term monitoring and maintenance costs, costs of waste disposal, natural resource damages and payments for property damage and personal injury, could have a material adverse effect on our business, financial condition or operating results.
Although we believe that our safety procedures for using, handling, storing and disposing of such materials comply with the standards required by applicable federal, state, local and international laws and regulations, we cannot eliminate the risk of accidental contamination or injury from these materials, including risks related to our chemical products, which are inherently hazardous. We have been, and may in the future be, subject to claims by employees or third parties alleging contamination or injury, and could be liable for damages, which liability could exceed the amount of our liability insurance coverage (if any) and the resources of our business.
Certain portions of the soil at the former facility of our Spectra-Physics lasers business, located in Mountain View, California, and certain portions of the aquifer surrounding the facility, through which contaminated groundwater flows, are part of an EPA-designated Superfund site and are subject to a cleanup and abatement order from the California Regional Water Quality Control Board. Spectra-Physics, which we acquired as part of our acquisition of Newport Corporation (“Newport”) in April 2016 (the “Newport Acquisition”) and which had been acquired by Newport in 2004, along with other entities with facilities located near the Mountain View, California facility, were identified as responsible parties with respect to this Superfund site, due to releases of hazardous substances during the 1960s, 1970s and 1980s. Spectra-Physics and the other responsible parties entered into cost-sharing agreements covering the costs of remediating the off-site groundwater impact. The site is mature, and investigations, monitoring and remediation efforts by the responsible parties have been ongoing for approximately 35 years. We have certain ongoing costs related to investigation, monitoring and remediation of the site that have not historically been material to us as a whole. However, while we benefited from the indemnification of certain costs by a third party in the past, that indemnification is now in a transition period, and we will become subject to a greater portion of costs of remediation in the future. Our ultimate costs of remediation and other potential liabilities are difficult to predict. If the EPA and the California Regional Water Quality Control Board determine that the site cleanup requires additional measures to ensure that it meets current standards for environmental contamination, or if they enhance any of the applicable required standards, we will likely become subject to additional remediation
obligations in the future. In addition to our investigation, monitoring and remediation obligations, we may be liable for property damage or personal injury claims relating to this site. While we are not aware of any material claims at this time, such claims could be made against us in the future. If significant costs or other liability relating to this site arise in the future, our business, financial condition and operating results would be adversely affected.
In addition, some of our manufacturing facilities and former facilities have an extended history of chemical manufacturing operations or other industrial activities, and contaminants have been detected at some of those sites. We or our predecessors have in the past been required to remediate contamination at several of these current and former sites, and there remains some risk that further investigation and remediation in the future might be necessary.
The environmental regulations that we are subject to include a variety of federal, state, local and international regulations that restrict the use and disposal of materials used in the manufacture of our products or require design changes or recycling of our products. If we fail to comply with any present or future regulations, we could be subject to future liabilities, the suspension of manufacturing or a prohibition on the sale of products we manufacture. In addition, these regulations could restrict our ability to equip our facilities or could require us to acquire costly equipment, or to incur other significant expenses to comply with environmental regulations, including expenses associated with the recall of any non-compliant product and the management of historical waste. For example, in addition to EU REACH, which regulates the use of certain hazardous substances in certain products, the EU has enacted the Waste Electrical and Electronic Equipment Directive, which requires the collection, reuse and recycling of waste from certain products. Compliance with such laws requires significant resources. These regulations may require us to redesign our products or source alternative components to ensure compliance with applicable requirements, for example by mandating the use of different types of materials in certain components. Any such redesign or alternative sourcing may increase the cost of our products, adversely impact the performance of our products, add greater testing lead-times for product introductions, or in some cases limit the markets for certain products. Further, such environmental laws are frequently amended, which increases the cost and complexity of compliance. For example, such amendments have in the past resulted in, and may in the future result in, certain of our products falling within the scope of a directive, even if they were initially exempt. In addition, certain of our customers, particularly OEM customers whose end products may be subject to these directives, may require that the products we supply to them comply with these directives, even if not mandated by law. Because certain directives, for example, those issued from the EU, are implemented in individual member states, compliance is particularly challenging. Our failure to comply with any of such regulatory requirements or contractual obligations could result in our being directly or indirectly liable for costs, fines or penalties and third-party claims, and could jeopardize our ability to conduct business in certain countries.
Additionally, we have established and communicated environmental goals, targets and objectives. For example, in December 2023, we announced our commitment to reduce our combined Scope 1 and 2 emissions by 42% by 2030 from our 2022 baseline. Any disclosed goals, targets and objectives reflect our current plans and aspirations, and we may be unable to achieve them. Furthermore, the standards, regulations and laws by which these environmental efforts are tracked and measured may change over time and result in inconsistent data or significant revisions to our goals, targets and objectives. We also are, or may become subject to, new environmental standards, regulations and laws, such as the EU’s Corporate Sustainability Reporting Directive. Our efforts to comply with these standards, regulations and laws, and to accurately report on our goals, targets and objectives, present numerous operational, reputational, financial, legal, and other risks, and require significant investments. Our processes and controls may not always align with evolving standards, our interpretation of standards may differ from others, and standards may continue to change over time, any of which could result in significant revisions to our goals, our reported progress toward those goals, or other environmental information we disclose, as well as significant unanticipated costs. In addition, any failure or perceived failure to pursue or fulfill our previously stated goals, targets and objectives or to satisfy various disclosure or reporting standards, could also have similar negative impacts and expose us to government enforcement actions, private litigation and reputational harm.
We are exposed to various risks related to legal proceedings, including, for example, product liability claims, intellectual property infringement claims, regulatory claims, contractual claims and class action litigation, which if successful, could have a material adverse effect on our commercial relationships, business, financial condition and operating results.
From time to time, we may be involved in legal proceedings, enforcement actions or claims regarding product performance, product warranty, product certification, product liability, patent infringement, misappropriation of trade secrets, other intellectual property rights, data privacy, antitrust, environmental regulations, trade regulations, tax regulations, securities, contracts, unfair competition, employment, workplace safety, liability to shareholders, and other matters. We can provide no assurance of the outcome of these legal proceedings, enforcement actions or claims or that the insurance we maintain will be adequate to cover them.
Certain of our products may be hazardous if not operated properly or if defective. For example, some of our products, such as certain ultrafast lasers, are used in medical and scientific research applications where misuse or malfunctions could result in serious injury. Other products of ours, including our chemicals products and laser systems, are inherently hazardous and must be used with particular care. We are exposed to significant risks for product liability claims in the event of a significant line down
situation or if death, personal injury or property damage results from the handling, use or storage of our products, including our chemical products and laser systems. We may experience material product liability losses in the future. While we maintain insurance for certain product liability claims, our insurance coverage may not continue to be available on acceptable terms, if at all. This insurance coverage also may not adequately cover liabilities that we incur. Further, if our products are defective, we may be required to recall or redesign these products. A successful claim against us that exceeds our insurance coverage level or that is not covered by insurance, or any product recall, could have a material adverse effect on our commercial relationships, business, financial condition and operating results.
In addition, securities class action lawsuits and derivative lawsuits are often brought against companies who have entered into business combinations and acquisitions. We were previously involved in securities class action litigation in connection with the Newport Acquisition and the ESI Acquisition. In each case, the plaintiffs alleged, among other things, that the then-current directors of the acquired company breached their fiduciary duties to their respective shareholders by agreeing to sell the company through an inadequate and unfair process, leading to inadequate and unfair consideration, by agreeing to unfair deal protection devices, and by omitting material information from the proxy statement. We, or the companies we acquire, may be subject to additional securities class action litigation in connection with business combinations, acquisitions or divestitures in the future.
With respect to data privacy, as a result of the ransomware event described under “Risks Related to Cybersecurity, Data Privacy and Intellectual Property Protection” above, we were previously subject to two lawsuits, and we may be subject to future litigation, investigations, claims or actions, in addition to fines, penalties, or other obligations related to impacted data, whether or not such data is misused.
While we intend to vigorously defend any lawsuits, in light of the inherent uncertainties involved in such proceedings, we may incur losses associated with any such proceedings. Additionally, ongoing legal and other costs related to any potential future proceedings and inquiries may be substantial, and losses associated with any adverse judgments, settlements, penalties or other resolutions of such proceedings and inquiries could be significant and have a material adverse impact on our business, reputation, financial condition, cash flows and operating results.
In addition, we have from time to time received claims from third parties alleging that we are infringing certain trademarks, patents or other intellectual property rights held by them. Such infringement claims have in the past resulted in, and may in the future result in, litigation, settlement or enforcement action. Any such action could be protracted and costly, and we could become subject to damages for infringement, or to an injunction preventing us from making, selling or using certain of our products or services, or using certain of our trademarks. Such claims could also result in the necessity of obtaining a license or paying damages relating to one or more of our products, services or technologies, which may not be available on commercially acceptable terms or at all. Any intellectual property action and the failure to obtain necessary licenses or other rights or develop substitute technology could have a material adverse effect on our business, financial condition and operating results. In addition, the terms of some of our customer contracts require us to indemnify the customer for any claim of infringement brought by a third party based on our products. Claims of this kind may have a material adverse effect on our commercial relationships, business, financial condition or operating results.
Although our standard commercial documentation sets forth the terms and conditions that we intend to apply to commercial transactions with our business partners, counterparties to these transactions may not explicitly agree to our terms and conditions. In situations where we engage in business with a third party without an explicit written agreement regarding the applicable terms and conditions, or where the commercial documentation applicable to the transaction is subject to interpretation, we may have disputes with those third parties regarding the applicable terms and conditions of our transaction with them. These disputes could result in deterioration of commercial relationships, costly and time-consuming litigation, concessions or obligations being offered by us to resolve these disputes, as well as impact our net revenue or cost recognition. Any of these outcomes could materially and adversely affect our business, financial condition and operating results.
In addition, from time to time in the normal course of business we indemnify parties with whom we enter into contractual relationships, including customers, suppliers, consultants and lessors, with respect to certain matters. We have agreed, under certain conditions, to hold these parties harmless against losses, such as those arising from a breach of representations or covenants, negligence or willful misconduct, and other third-party claims that our products and/or technologies infringe intellectual property rights. We may be compelled to enter into or accrue for probable settlements of alleged indemnification obligations, or we may be subject to potential liability arising from our customers’ involvement in legal disputes. In addition, notwithstanding the provisions related to limitations on our liability that we seek to include in our business agreements, the counterparties to such agreements may dispute our interpretation or application of such provisions, and a court of law may not interpret or apply such provisions in our favor, any of which could result in an obligation for us to pay significant additional damages and engage in costly legal proceedings. It is difficult to determine the maximum potential amount of liability under any indemnification obligations, whether or not asserted, due to the unique facts and circumstances likely to be involved in any particular claim. Our business, financial condition and operating results in a reported fiscal period could be materially and adversely affected if we expend significant amounts in defending or settling any asserted claims, regardless of their merit or outcomes.
Legal proceedings, enforcement actions and claims, whether with or without merit, and associated internal investigations, may be time-consuming and expensive to prosecute, defend or conduct; divert management’s attention and other resources; inhibit our ability to sell our products or services; result in adverse judgments for damages, injunctive relief, penalties and fines; and negatively affect our business, including result in a material adverse effect on our financial condition, operating results and cash flows. We can make no assurances regarding the outcome of legal proceedings, enforcement actions, claims or investigations or that the insurance we maintain will be adequate to cover them.
Risks Related to Owning Our Common Stock
Our quarterly operating results have fluctuated, and are likely to continue to vary significantly, which may result in volatility in the market price of our common stock.
A substantial portion of our shipments occurs shortly after an order is received, and therefore we generally operate with a relatively low level of backlog. As a result, a decrease in demand for our products from one or more customers could occur with limited advance notice and could have a significant adverse effect on our operating results in any particular period. Further, we often recognize a significant portion of the revenue of certain of our business lines in the last month of a fiscal quarter, due in part to the tendency of some customers to wait until late in a quarter to commit to purchase our products as a result of capital expenditure approvals and budgeting constraints occurring at the end of a quarter, or the hope of obtaining more favorable pricing from a competitor. Thus, variations in timing of sales can cause significant fluctuations in our quarterly sales, gross margin and profitability. In addition, orders expected to ship in one period could shift to another period due to changes in the timing of our customers’ purchase decisions, requests for rescheduled delivery dates, material shortages, manufacturing capacity constraints or logistics delays. Our orders are generally subject to rescheduling or cancellation without penalty other than reimbursement in certain cases for certain labor and material costs. Our operating results for a particular period may be adversely affected if our customers, particularly our largest customers, cancel or reschedule orders, or if we cannot fill orders in time due to material shortages, capacity constraints or unexpected delays in manufacturing, testing, shipping, delivery or product acceptance. Also, we base our manufacturing plans on our forecasted product mix. If the actual product mix varies significantly from our forecast, we may not be able to fill some orders, which would result in delays in the shipment of our products and could shift sales to a subsequent period. Moreover, a significant percentage of our expenses are fixed and based in part on expectations of net revenues. Our inability to adjust spending quickly enough to compensate for any shortfall would magnify the adverse impact of a shortfall in net revenues on our operating results.
Customers of our high-value, more complex products often require substantial time to qualify our products and make purchase decisions. In addition, some of our sales to defense and security customers are under major defense programs that involve lengthy competitive bidding and qualification processes. These customers often perform, or require us to perform, extensive configuration, testing and evaluation of our products before committing to purchase them, which can require a significant upfront investment in time and resources. The sales cycle for these products from initial contact through shipment varies significantly, is difficult to predict and can last more than a year. If we fail to anticipate the likelihood of, or the costs or timing associated with, sales of these products, or the cancellation or rescheduling of orders for these products, our business and operating results would be harmed.
Our worldwide sales to customers in the research and defense markets rely to a large extent on government funding for research and defense-related programs. Any decline in government funding as a result of reduced budgets in connection with fiscal austerity measures, revised budget priorities or other causes would likely result in reduced sales of our products that are purchased either directly or indirectly with government funding, which would have an adverse impact on our operating results. Concerns regarding the global availability of credit may also make it more difficult for our customers to raise capital, whether debt or equity, to finance their projects and purchases of capital equipment, which would adversely affect sales of our products and therefore harm our business and operating results.
Market seasonality also causes fluctuations in our operating results. MSD has generally experienced its strongest revenue in the second half of the fiscal year, mostly driven by consumption trends during the holiday season, and its lowest revenue in the first quarter of the fiscal year, mostly driven by the slowdown in production as a result of the Lunar New Year. In addition, we typically experience our strongest revenue in the research market in the fourth quarter of our fiscal year as a result of government spending patterns, and our highest revenue in the electronics manufacturing market in the second half of our fiscal year as a result of consumer spending during the holiday season.
Other factors that could cause fluctuations in our financial results include:
•A worldwide economic slowdown or disruption in the global financial markets;
•Fluctuations in our customers’ capital spending, industry cyclicality (particularly in the semiconductor, electronics manufacturing and automotive industries), levels of government funding available to our customers (particularly in the
life and health sciences and the research and defense markets) and other economic conditions within the markets we serve;
•The timing of the receipt of orders within a given period;
•Demand for our products and the products sold by our customers;
•Disruption in sources of supply;
•Production capacity constraints;
•Regulatory and trade restrictions in the countries where we source, manufacture or sell our products;
•Specific features requested by customers;
•Natural disasters or other events beyond our control (such as earthquakes, floods or storms, regional economic downturns, pandemics, social unrest, political instability, terrorism, or acts of war);
•IT or infrastructure failures;
•The timing of product shipments and revenue recognition within a given quarter;
•Changes in our pricing practices or in the pricing practices of our competitors or suppliers, including as a result of inflationary pressures;
•Our and our competitors’ timing in introducing new products;
•Engineering and development investments relating to new product introductions, and significant changes to our manufacturing and outsourcing operations;
•Market acceptance of any new or enhanced versions of our products;
•The timing and level of inventory obsolescence, scrap and warranty expenses;
•The availability, quality and cost of components and raw materials we use to manufacture our products;
•Changes in our effective tax rates;
•Changes in our capital structure, including cash, marketable securities and debt balances, and changes in interest rates;
•Changes in bad debt expense based on the collectability of our accounts receivable;
•The timing, type and size of acquisitions and divestitures, and related expenses and charges;
•Fluctuations in currency exchange rates;
•Impairment charges for goodwill, intangible assets or long-lived assets; and
•Fees, expenses and settlement costs or judgments against us relating to litigation or regulatory compliance.
As a result of these factors, among others, we may experience quarterly or annual fluctuations in our operating results, and our operating results for any period may fall below our expectations or the expectations of public market analysts or investors. In any such event, the price of our common stock could fluctuate or decline significantly. Consequently, we believe that quarter-to-quarter and year-to-year comparisons of our operating results, or any other similar period-to-period comparisons, may not be reliable indicators of our future performance.
The market price of our common stock has fluctuated and may continue to fluctuate for reasons over which we have no control.
The stock market has from time to time experienced, and is likely to continue to experience, extreme price and volume fluctuations. For example, the closing price of our common stock ranged from a high of $144.60 to a low of $97.35 between January 1, 2024 and December 31, 2024. Prices of securities of technology companies have been especially volatile and have often fluctuated for reasons that are unrelated to the operating performance of the companies. Historically, the market price of shares of our common stock has fluctuated greatly and could continue to fluctuate due to a variety of factors. In the past, companies that have experienced volatility in the market price of their stock have been the subject of securities class action litigation. If we become the subject of securities class action litigation, it could result in substantial costs and a diversion of our management’s attention and resources.
The market price of our common stock is also likely to be influenced by the Convertible Notes. For example, the market price of our common stock could become more volatile and could be depressed by: (i) investors’ anticipation of the potential resale
in the market of a substantial number of additional shares of our common stock received upon conversion of the Convertible Notes; and (ii) hedging or arbitrage trading activity that may develop involving the Convertible Notes and our common stock.
We may not pay dividends on our common stock.
Holders of our common stock are only entitled to receive dividends when and if they are declared by our Board of Directors. Our credit facilities restrict our ability to pay dividends on our capital stock under certain circumstances. Although we have declared cash dividends on our common stock since 2011, and occasionally increased the dividends from prior quarters, we are not required to do so, and we may reduce or eliminate our cash dividend in the future. This could adversely affect the market price of our common stock.
Some provisions of our Restated Articles of Organization, as amended, our Second Amended and Restated By-laws and Massachusetts law could discourage potential acquisition proposals and could delay or prevent a change in control.
Anti-takeover provisions in our Restated Articles of Organization, as amended, in our Second Amended and Restated By-laws and under Massachusetts law could diminish opportunities for stockholders to participate in tender offers, including tender offers at a price above the then-current market price of our common stock. Such provisions may also inhibit increases in the market price of our common stock that could result from takeover attempts. For example, while we have no present plans to issue any preferred stock, our Board of Directors, without further stockholder approval, may issue preferred stock that could have the effect of delaying, deterring or preventing a change in control of us. The issuance of preferred stock could adversely affect the voting power of the holders of our common stock, including the loss of voting control to others. In addition, pursuant to our Second Amended and Restated By-laws, the declassification of our Board of Directors, which currently consists of three classes, will be phased in so that our Board of Directors will be fully declassified by our 2028 annual meeting of stockholders. Until our Board of Directors is fully declassified, the continuing classification of the Board could also have the effect of delaying or deterring a change in control of our Company.
None.
Item 1C. Cybersecurity
Risk Management and Strategy
Processes for Assessing, Identifying and Managing Material Risks from Cybersecurity Threats
We primarily assess, identify and manage material risks from cybersecurity threats through our enterprise information security program, which is maintained by our Chief Information Security Officer (“CISO”) and overseen by our Executive Vice President and Chief Information Officer (“CIO”).
Our enterprise information security program, which is designed to ensure that our information systems are adequately protected, is based on frameworks established by the National Institute of Standards and Technology and other applicable industry standards. We consider our enterprise information security program to be a key component of our overall risk management system, with program elements evaluated annually and briefings provided to management each quarter.
As part of our enterprise information security program, we regularly assess and deploy technical safeguards designed to detect cybersecurity threats and protect our information systems from these threats. In addition, we maintain incident response and recovery plans, the effectiveness of which is tested and evaluated on a regular basis. We also provide privacy and security training, including quarterly phishing education campaigns, to enhance employee awareness of how to detect and respond to cybersecurity threats.
We regularly engage assessors, consultants, auditors and other third parties to support our enterprise information security program. These engagements encompass a variety of activities, including information security maturity assessments, audits and independent reviews of our information security control environment and operating effectiveness.
The information gleaned from these assessments, audits and reviews is used to enhance our enterprise information security program, including cybersecurity policies, standards, processes and practices. In addition, significant findings from these assessments are reported to management and the Audit Committee of our Board of Directors (the “Board”).
We also have processes in place to oversee and identify risks from cybersecurity threats associated with the use of third-party service providers. Third-party service providers are subject to security risk assessments at the time of on-boarding, contract
renewal, and upon detection of an increase in risk profile. We have similar processes in place to oversee and identify cybersecurity-related risks posed by our suppliers.
Risks from Cybersecurity Threats
We and our third-party administrators, vendors and partners are subject to ongoing cybersecurity threats. While we cannot guarantee that these threats will not have an adverse impact on us, these threats did not materially affect us during the year ended December 31, 2024 and we do not believe such threats are reasonably likely to materially affect us in the future, including with respect to our business strategy, results of operations, or financial condition. For more information on risks related to cybersecurity, refer to “Risk Factors—Risks Related to Cybersecurity, Data Privacy and Intellectual Property Protection.”
Governance
Board of Directors’ Oversight of Risks from Cybersecurity Threats
The Audit Committee is primarily responsible for oversight of risks from cybersecurity threats. As set forth in the Amended & Restated Audit Committee Charter, the Audit Committee oversees the steps management takes to monitor and control our data privacy and cybersecurity risk exposure. The Board delegated this responsibility to the Audit Committee in part because it includes members with significant experience and/or expertise in cybersecurity and other technology matters.
The Audit Committee is informed of risks from cybersecurity threats through regular reports from our CIO and CISO. Our CIO and CISO report to the Audit Committee at least quarterly. The Audit Committee actively engages with our CIO and CISO regarding these risks. Depending on the materiality of a risk, the Audit Committee, CIO or CISO may report on such risk to the full Board.
In addition, from time to time, the Board may constitute a special committee to focus on a particular cybersecurity matter or risk.
Management’s Role in Assessing and Managing Material Risks from Cybersecurity Threats
Management is integral to assessing and managing our material risks from cybersecurity threats. While all members of management are involved in the review of these risks, our CIO oversees and is responsible for our cybersecurity program. Our CIO is a seasoned technology leader and change agent who has served as the top technology executive for multi-billion-dollar global organizations spanning diverse industries. With over 25 years of experience, our CIO has led business and information technology transformations, implemented global digital strategies, and optimized and integrated governance, risk, and compliance frameworks, processes and technologies in complex regulatory and industry environments. We believe our CIO’s knowledge, skills and experience provide significant value to our Company.
Our CIO and CISO provide regular reports to management regarding risks from cybersecurity threats and the prevention, detection, mitigation and remediation of cybersecurity incidents. Within our information technology organization, our CISO and other key members of our information security team provide regular reports to our CIO.
As discussed above, our CIO and CISO also provide regular reports regarding risks from cybersecurity threats to our Audit Committee and, depending on the materiality of a risk, the full Board. In addition, from time to time, members of management may provide reports to a special committee of the Board for cybersecurity.
Item 2. Properties
The following table provides information concerning MKS’ principal and certain other owned and leased facilities as of December 31, 2024:
| | | | | | | | | | |
Country | | City | | Sq. Ft. | | Activity | | Reportable Segment | | Owned/Leased |
China | | Guangzhou | | 704,000 | | Manufacturing, Warehouse, Sales, and Research and Development | | MSD | | Owned |
| | Shenzhen | | 253,000 | | Manufacturing and Service | | VSD | | Leased |
| | Tianjin | | 179,000 | | Manufacturing, Office, Warehouse, and Sales | | MSD | | Owned |
| | Yangzhou | | 156,000 | | Manufacturing, Warehouse, and Office | | MSD | | Owned |
Germany | | Berlin | | 200,000 | | Manufacturing, Office, and Research and Development | | MSD | | Leased |
| | Feucht | | 301,000 | | Manufacturing, Warehouse, Office, and Research and Development | | MSD | | Owned |
| | Neuruppin | | 170,000 | | Manufacturing, Warehouse, Office, and Research and Development | | MSD | | Owned |
India | | Manesar | | 189,000 | | Manufacturing, and Research and Development | | MSD | | Owned |
Mexico | | Nogales | | 124,000 | | Manufacturing and Service | | VSD and PSD | | Leased |
Romania | | Bucharest | | 131,000 | | Manufacturing, Office, Research and Development, Service, and Warehouse | | PSD | | Leased |
South Korea | | Hwasung | | 100,000 | | Manufacturing, Sales, and Office | | MSD | | Owned |
| | Yongin-si | | 179,000 | | Research and Development, Office, Warehouse, Service, and Sales | | VSD | | Owned |
United States | | Andover, MA | | 76,000 | | Corporate Headquarters, Manufacturing, and Research and Development | | VSD | | Leased |
| | Beaverton, OR | | 113,000 | | Manufacturing, Office, and Warehouse | | PSD | | Leased |
| | Broomfield, CO | | 107,000 | | Manufacturing, and Research and Development | | VSD | | Leased |
| | Irvine, CA | | 191,000 | | Manufacturing, and Research and Development | | PSD | | Leased |
| | Milpitas, CA | | 103,000 | | Manufacturing, Sales, Customer Support, Service, and Research and Development | | PSD | | Leased |
| | Rochester, NY | | 156,000 | | Manufacturing, Sales, Customer Support, Service, and Research and Development | | VSD | | Owned |
| | Rock Hill, SC | | 201,000 | | Manufacturing, Warehouse, Office, and Research and Development | | MSD | | Owned |
| | Wilmington, MA | | 118,000 | | Manufacturing, Customer Support, Service, and Research and Development | | VSD | | Owned |
In addition to the significant facilities listed above, MKS also has manufacturing, sales and marketing, customer support and services operations in various other leased and owned facilities throughout the world. See “Business—Sales and Marketing” and “Business—Reportable Segments, and Product and Service Offerings” in Part I, Item 1 of this Annual Report on Form 10-K. We believe that our current facilities are suitable and adequate to meet our needs.
Item 3. Legal Proceedings
We are subject to various legal proceedings and claims, which have arisen in the ordinary course of business. In the opinion of management, the ultimate disposition of these matters will not have a material adverse effect on our results of operations, financial condition or cash flows.
Item 4. Mine Safety Disclosures
Not applicable.
PART II
Item 5. Market for the Registrant’s Common Equity, Related Stockholder Matters and Issuer Purchases of Equity Securities
Common Stock
Our common stock is traded on the Nasdaq Global Select Market under the symbol MKSI.
As of February 18, 2025, we had 62 stockholders of record.
Dividend Policy and Cash Dividends
Holders of our common stock are entitled to receive dividends when and if they are declared by our Board of Directors. Our Board of Directors declared a cash dividend of $0.22 per share during each quarter of 2024, which totaled $59 million or $0.88 per share. During 2023, our Board of Directors declared a cash dividend of $0.22 per share during each quarter of the year, which totaled $59 million or $0.88 per share.
On February 10, 2025, our Board of Directors declared a quarterly cash dividend of $0.22 per share to be paid on March 7, 2025 to shareholders of record as of February 24, 2025.
Future dividend declarations, if any, as well as the record and payment dates for such dividends, are subject to the final determination of our Board of Directors. The Board of Directors intends to declare and pay cash dividends on our common stock based on our financial conditions and results of operations, although it has no obligation to do so. Our credit facilities contain covenants that restrict our ability to grant cash dividends in certain circumstances.
Share Repurchase Program
On July 25, 2011, our Board of Directors approved, and on July 27, 2011, we publicly announced a share repurchase program for the repurchase of up to an aggregate of $200 million of our outstanding common stock from time to time in open market purchases, privately negotiated transactions or through other appropriate means. The timing and quantity of any shares repurchased depends upon a variety of factors, including business conditions, stock market conditions and business development activities, including, but not limited to, merger and acquisition opportunities. These repurchases may be commenced, suspended or discontinued at any time without prior notice.
During 2024 and 2023, we did not repurchase any shares of common stock. We have repurchased approximately 2.6 million shares of common stock for approximately $127 million pursuant to the program since its adoption.
Comparative Stock Performance
The following graph compares the cumulative total shareholder return (assuming reinvestment of dividends) from investing $100 on December 31, 2019, and plotted at the last trading day of each of the fiscal years ended December 31, 2020, 2021, 2022, 2023 and 2024 of MKS’ common stock; a peer group index representing all companies comprising the S&P 1500 Composite Electronic Equipment Instruments & Components Index and the Nasdaq Market Index. The stock price performance in the graph below is not necessarily indicative of future price performance.
Performance Graph
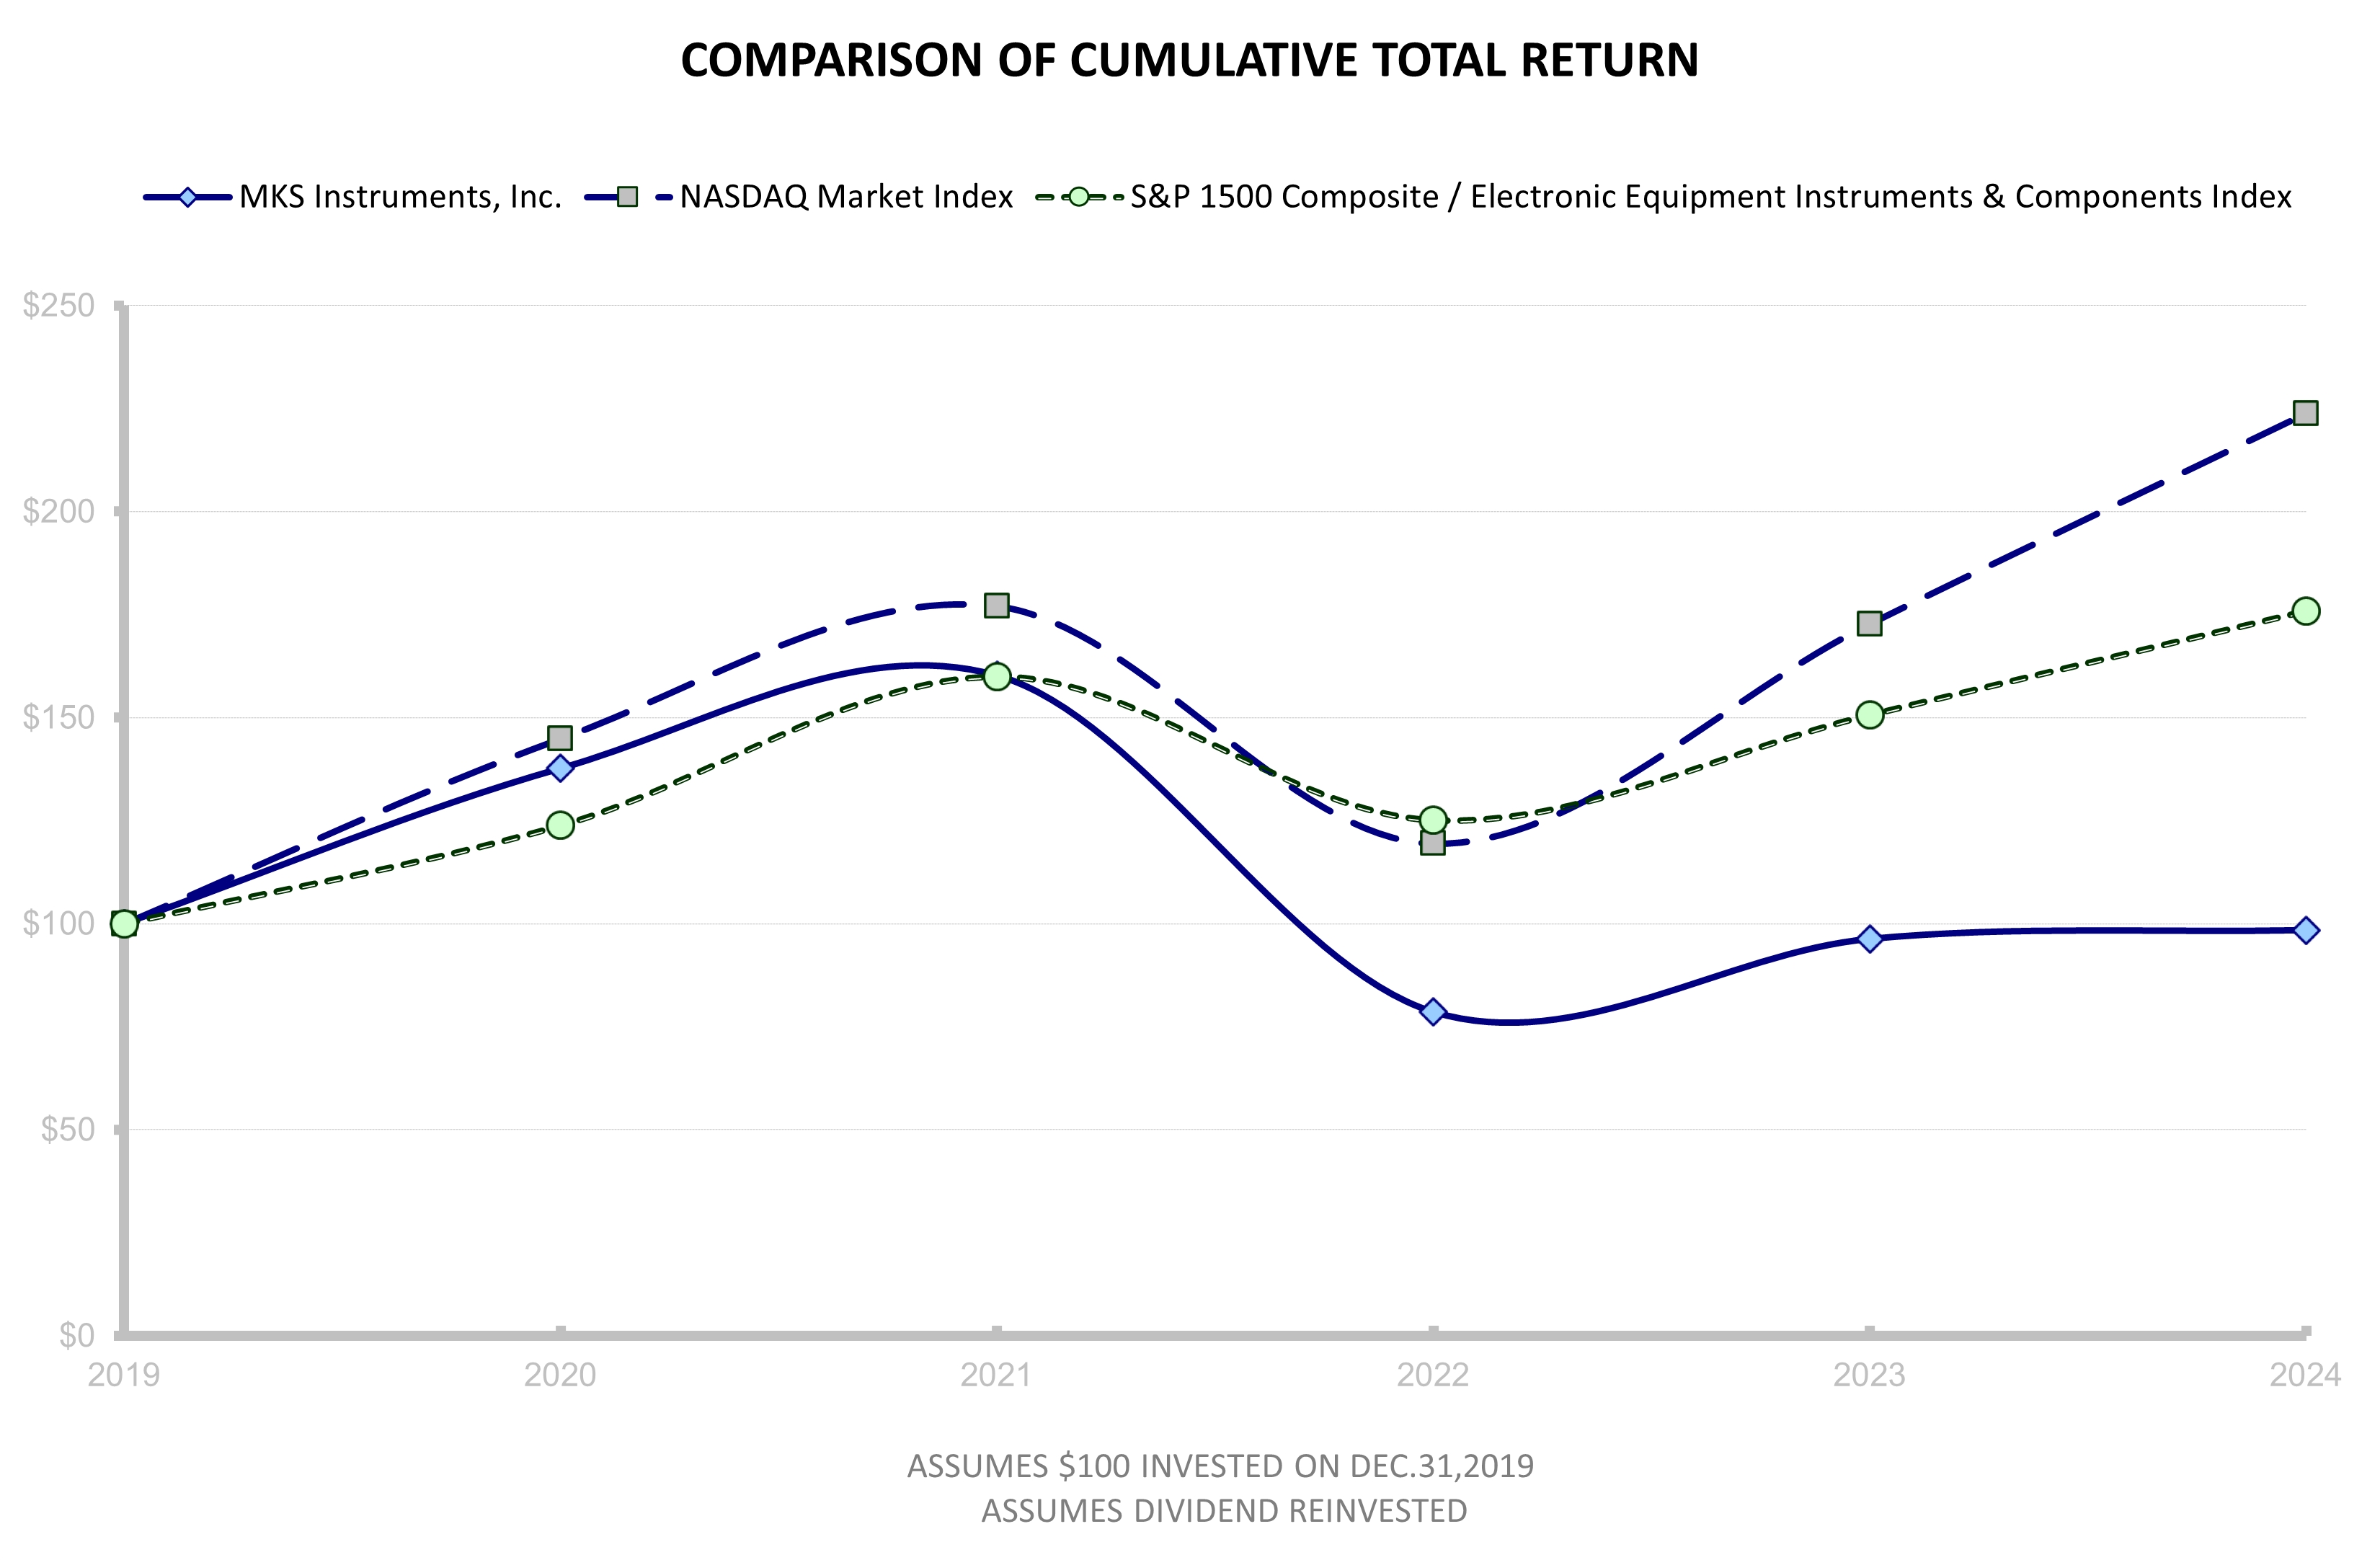
| | | | | | | | | | | | | | | | | | | | | | | | |
| | 2019 | | | 2020 | | | 2021 | | | 2022 | | | 2023 | | | 2024 | |
MKS Instruments, Inc. | | $ | 100.00 | | | $ | 137.70 | | | $ | 160.22 | | | $ | 78.55 | | | $ | 96.28 | | | $ | 98.41 | |
Nasdaq Market Index | | $ | 100.00 | | | $ | 144.92 | | | $ | 177.06 | | | $ | 119.45 | | | $ | 172.77 | | | $ | 223.87 | |
S&P 1500 Composite / Electronic Equipment,
Instruments & Components Index | | $ | 100.00 | | | $ | 123.86 | | | $ | 160.00 | | | $ | 125.15 | | | $ | 150.70 | | | $ | 175.92 | |
Item 6. Reserved.
Item 7. Management’s Discussion and Analysis of Financial Condition and Results of Operations
The Management’s Discussion and Analysis of Financial Condition and Results of Operations (“MD&A”) describes principal factors affecting the results of operations, financial condition, cash flows and liquidity, as well as our critical accounting policies and estimates that require significant judgment and thus have the most significant potential impact on our consolidated financial statements, and is intended to better allow investors to view the Company from management’s perspective. This section focuses on material events and uncertainties known to management that are reasonably likely to cause reported financial information not to be necessarily indicative of our future operating results or of our future financial condition. This section provides an analysis of our financial results for the year ended December 31, 2024 compared to the year ended December 31, 2023. For the discussion and analysis covering the year ended December 31, 2023 compared to the year ended December 31, 2022, please refer to “Management’s Discussion and Analysis of Financial Condition and Results of Operations” in Part II, Item 7 of our Annual Report on Form 10-K for the year ended December 31, 2023, as filed with the SEC on February 27, 2024. As a result of rounding, there may be immaterial differences in amounts presented and certain calculations may not sum to the total number expressed in each category or tie to a corresponding schedule.
Overview
We enable technologies that transform our world. We deliver foundational technology solutions to leading edge semiconductor manufacturing, electronics and packaging, and specialty industrial applications. We apply our broad science and engineering capabilities to create instruments, subsystems, systems, process control solutions and specialty chemicals technology that improve process performance, optimize productivity and enable unique innovations for many of the world’s leading technology and industrial companies. Our solutions are critical to addressing the challenges of miniaturization and complexity in advanced device manufacturing by enabling increased power, speed, feature enhancement and optimized connectivity. Our solutions are also critical to addressing ever-increasing performance requirements across a wide array of specialty industrial applications.
Segments
We have three divisions, which are our reportable segments: Vacuum Solutions Division (“VSD”), Photonics Solutions Division (“PSD”) and Materials Solutions Division (“MSD”).
VSD delivers foundational technology solutions to semiconductor manufacturing, electronics and packaging and specialty industrial applications. VSD products are derived from our core competencies in vacuum technologies, including pressure measurement and control, flow measurement and control, gas and vapor delivery, gas composition analysis, electronic control technology, reactive gas generation and delivery, power generation and delivery, and fiber optic temperature and position sensing.
PSD provides a broad range of solutions including lasers, beam measurement and profiling, precision motion control, vibration isolation systems, photonics instruments, opto-mechanical components, optical elements, laser-based systems for flexible printed circuit board (“PCB”) laser processing, laser-based systems for high density interconnect PCB and package substrate manufacturing. During the quarter ended March 31, 2024, we moved our Optical Sensing Products (“OSP”) product line from the PSD segment to the VSD segment. The purpose of this realignment was to better align the OSP products with semiconductor related products within the VSD segment. Prior periods have been recast to reflect this change.
MSD develops leading process and manufacturing technologies for advanced surface modification, electroless and electrolytic plating, and surface finishing. Applying a comprehensive systems-and-solutions approach, MSD’s portfolio includes chemistry, equipment and services for innovative and high-technology applications in our electronics and packaging and specialty industrial markets.
Markets
Net Revenues by End Market
| | | | | | | | | | | | | | | | |
| | Years Ended December 31, | |
(dollars in millions) | | 2024 | | | % Total | | | 2023 | | | % Total | |
Semiconductor | | $ | 1,498 | | | | 42 | % | | $ | 1,479 | | | | 41 | % |
Electronics and Packaging | | | 922 | | | | 26 | % | | | 916 | | | | 25 | % |
Specialty Industrial | | | 1,166 | | | | 32 | % | | | 1,227 | | | | 34 | % |
Total net revenues | | $ | 3,586 | | | | 100 | % | | $ | 3,622 | | | | 100 | % |
Semiconductor Market
MKS is a critical solutions provider for semiconductor manufacturing. Our products are used in major semiconductor processing steps, such as deposition, etching, cleaning, lithography, metrology, and inspection. The semiconductor industry continually faces new challenges, as products become smaller, more powerful and highly mobile. Ultra-thin layers, smaller critical dimensions, new materials, 3D structures, and the ongoing need for higher yield and productivity drive the need for tighter process measurement and control, all of which MKS supports. We believe we are the broadest critical subsystem provider in the wafer fabrication equipment (“WFE”) ecosystem and address over 85% of the market. We characterize our broad and unique offering as Surround the Wafer® to reflect the technology enablement we provide across almost every major process in semiconductor manufacturing today.
The semiconductor market is subject to rapid demand shifts, which are difficult to predict, and we cannot be certain as to the timing or extent of future demand or any future softening in the semiconductor capital equipment industry. In addition to these rapid demand shifts, the semiconductor capital equipment industry is subject to significant trade restrictions, especially in China.
Approximately 42% and 41% of our net revenues for 2024 and 2023, respectively, were from sales to customers in the semiconductor market.
Net revenues from customers in our semiconductor market increased by $19 million, or 1%, in 2024, compared to 2023, due primarily to an increase in sales of our lithography, metrology and inspection products, which we refer to as our World Class Optics portfolio, partially offset by decreased industry spending on deposition and etch equipment for memory applications, particularly NAND, where MKS is a critical solutions provider.
Electronics and Packaging Market
MKS is a foundational solutions provider for the electronics and packaging market. Our portfolio includes photonics components, laser drilling systems, electronics chemistries and plating equipment that are critical for the manufacturing of PCBs and package substrates, and critical to wafer level packaging (“WLP”) applications. Similar to the semiconductor industry, the PCB, package substrate and WLP industries demand smaller features, greater density, and better performance. In addition, the electronics and packaging market also includes sales of our vacuum and photonics solutions for display manufacturing applications. We characterize our complementary offering of laser systems and chemistry solutions as Optimize the Interconnect®, to reflect the unique technology enablement we provide at the Interconnect level within PCBs, package substrates and WLPs.
Approximately 26% and 25% of our net revenues for 2024 and 2023, respectively, were from sales to customers in our electronics and packaging market.
Net revenues from customers in our electronics and packaging market increased by $6 million, or 1%, in 2024 compared to 2023. This increase was primarily due to an increase in industry demand for PCB via drilling systems at PSD and an increase in the volume of chemistry materials at MSD, partially offset by a decline in palladium prices for chemistry products, which lower prices are passed through to our customers, and lower equipment revenue at MSD as customers postponed investment decisions.
Specialty Industrial Market
MKS’ strategy in the specialty industrial market is to leverage our domain expertise and proprietary technologies across a broad array of applications in industrial, life and health sciences, and research and defense markets.
Industrial
Industrial encompasses a wide range of diverse applications, including chemistries for functional coatings, surface finishing and wear resistance in the automobile industry, vacuum solutions for synthetic diamond manufacturing and photonics for solar manufacturing. Other applications include vacuum and photonics solutions for light emitting diode and laser diode manufacturing.
Life and Health Sciences
Our products for life and health sciences are used in a diverse array of applications, including bioimaging, medical instrument sterilization, medical device manufacturing, analytical, diagnostic and surgical instrumentation, consumable medical supply manufacturing and pharmaceutical production.
Research and Defense
Our products for research and defense are sold to government, university and industrial laboratories for applications involving research and development in materials science, physical chemistry, photonics, optics and electronics materials. Our products are also sold for monitoring and defense applications, including surveillance, imaging and infrastructure protection.
Approximately 32% and 34% of our net revenues for 2024 and 2023, respectively, were from customers in our specialty industrial market.
Net revenues from customers in our specialty industrial market decreased by $61 million, or 5%, in 2024, compared to 2023. This decrease was driven primarily by lower revenue in the solar, general industrial and material processing markets, mainly within VSD and MSD.
International Markets
Starting in the second quarter of 2024, we changed our basis of reporting geographical net revenues from the location in which the sale originated to the shipped-to location of the end customer. Prior periods have been recast to reflect this change, which was made to better align with how management reviews geographic net revenues.
A significant portion of our net revenues is from sales to customers in international markets. International net revenues accounted for approximately 78% and 75% of our total net revenues in 2024 and 2023, respectively. A significant portion of our international net revenues was from customers in China, South Korea, Japan, Taiwan and Singapore. We expect international net revenues will continue to account for a significant percentage of total net revenues for the foreseeable future.
Long-lived assets located outside of the United States accounted for approximately 59% and 58% of our total long-lived assets as of December 31, 2024 and 2023, respectively. Long-lived assets include property, plant and equipment, net, right-of-use assets, net and certain other assets.
Critical Accounting Policies and Estimates
MD&A discusses our Consolidated Financial Statements, which have been prepared in accordance with accounting principles generally accepted in the United States (“U.S. GAAP”). The preparation of these financial statements requires management to make estimates and assumptions that affect the reported amounts of assets and liabilities and the disclosure of contingent liabilities at the date of the financial statements and the reported amounts of revenues and expenses during the reporting period. On an ongoing basis, we evaluate our estimates and judgments, including those related to revenue recognition, inventory valuation, warranty costs, pension plan valuations, stock-based compensation expense, intangible assets, goodwill and long-lived assets, income taxes and derivatives. We base our estimates and judgments on historical experience and on various other factors that are believed to be reasonable under the circumstances, the results of which form the basis for making judgments about the carrying values of assets and liabilities that are not readily apparent from other sources. Actual results may differ from these estimates under different assumptions or conditions.
For a complete description of our significant accounting policies, see Part II—Item 8 Financial Statements and Supplementary Data, Note 3, “Summary of Significant Accounting Policies”. We believe the following critical accounting policies affect the most significant judgments, assumptions and estimates we use in preparing our Consolidated Financial Statements:
Revenue Recognition. We account for revenue using Accounting Standards Codification 606, “Revenue from Contracts with Customers” (“ASC Topic 606”). We apply ASC Topic 606 using the following steps:
•Identify the contract with a customer
•Identify the performance obligations in the contract
•Determine the transaction price
•Allocate the transaction price to performance obligations in the contract
•Recognize revenue when or as we satisfy a performance obligation
Revenue is recognized when or as obligations under the terms of a contract with our customer have been satisfied and control has transferred to the customer. The majority of our performance obligations, and associated revenue, are transferred to customers at a point in time, generally upon shipment of a product to the customer or receipt of the product by the customer and without significant judgments. We recognize revenue over time for contracts relating to the manufacturing, modifications and retrofits of our plating equipment, as the equipment is built to customer specification, and we have an enforceable right to payment for the performance completed to date. For these sales, we use the cost-to-cost input method to measure progress. In cases, where
cost-to-cost is not proportionate to our progress in satisfying the performance obligation because of uninstalled materials, we adjust the measure of progress and recognize revenue to the extent of cost incurred to satisfy the performance obligation under the contract. Revenue from customized products with no alternative future use to us, and that have an enforceable right to payment for performance completed to date, is also recorded over time. We consider this to be a faithful depiction of the transfer to the customer of revenue over time as the work is performed or service is delivered. Adjustments for custom products were immaterial in each of the periods presented.
Installation services, other than those related to our plating equipment, are not significant, are usually completed in a short period of time and, therefore, are recorded at a point in time when the installation services are completed, rather than over time, as they are not material. Extended warranty, service contracts, and repair services, which are transferred to the customer over time, are recorded as revenue as the services are performed. For repair services, we make an accrual at each quarter end based upon historical repair times within our product groups to record revenue based upon the estimated number of days completed to date, which is consistent with ratable recognition.
Revenue is measured as the amount of consideration we expect to receive in exchange for transferring goods or providing services. Performance obligations promised in a contract are identified based on the products or services that will be transferred to the customer that are both capable of being distinct, whereby the customer can benefit from the product or service either on its own or together with other resources that are readily available from third parties or from us, and are distinct in the context of the contract, whereby the transfer of the product or service is separately identifiable from other promises in the contract. Sales tax, value add tax, and other taxes we collect concurrent with revenue-producing activities are excluded from revenue. Our normal payment terms are 30 to 60 days but vary by the type and location of our customers and the products or services offered. The time between invoicing and when payment is due is not significant. For certain products and services and customer types, we require payment before the products are delivered to, or the services are performed for, the customer. None of our contracts in each of the periods presented contained a significant financing component.
We periodically enter into contracts with our customers in which a customer may purchase a combination of goods and or services, such as products with installation services or extended warranties. These contracts include multiple deliverables that we evaluate to determine if the deliverables are separate performance obligations. Once we determine the performance obligations, we then determine the transaction price, which includes estimating the amount of variable consideration to be included in the transaction price, if any. To the extent the transaction price includes variable consideration, we estimate the amount of variable consideration that should be included in the transaction price utilizing either the expected value method or the most likely amount method, depending on the method we expect to better predict the amount of consideration to which we will be entitled. There are no constraints on the variable consideration recorded. We then allocate the transaction price to each performance obligation in the contract based on a relative stand-alone selling price charged separately to customers or using an expected cost-plus margin method. The corresponding revenues are recognized when or as the related performance obligations are satisfied, which are noted above. The impact of variable consideration was immaterial in each of the periods presented.
Our standard assurance warranty is normally 12 to 24 months. We sell separately priced service contracts and extended warranty contracts related to certain of our products, in particular related to our plating and laser-based products. These separately priced contracts generally range from 12 to 60 months. We normally receive payment at the inception of the contract and recognize revenue over the term of the contract in proportion to the costs expected to be incurred in satisfying the obligations under the contract. We have elected to use the practical expedient related to disclosing remaining performance obligations as of December 31, 2024 and 2023, as the majority have a duration of less than one year.
We monitor and track the amount of product returns, provide for sales return allowances and reduce revenue at the time of shipment for the estimated amount of such future returns, based on historical experience. We make estimates evaluating our allowance for doubtful accounts. While product returns have historically been within our expectations and established provisions, there is no assurance that we will continue to experience the same return rates that we have in the past. Any significant increase in product return rates could have a material adverse impact on our operating results for the period in which such returns materialize.
While we maintain a credit approval process, significant judgments are made by management in connection with assessing our customers' ability to pay at the time of shipment. Despite this assessment, from time to time, our customers are unable to meet their payment obligations. We continuously monitor our customers' creditworthiness and use our judgment in establishing a provision for estimated credit losses based upon our historical experience and any specific customer collection issues that we have identified. While such credit losses have historically been within our expectations and the provisions established, there is no assurance that we will continue to experience the same credit loss rates that we have in the past. A significant change in the liquidity or financial position of our customers could have a material adverse impact on the collectability of accounts receivable and our future operating results. Bad debt expense was immaterial in each period presented.
Inventory Valuation. We value our inventory at the lower of cost or net realizable value, cost being determined using a standard costing system that approximates actual costs, based on a first-in, first-out method. We regularly review inventory quantities on hand and record a provision to write-down excess and obsolete inventory to its estimated net realizable value, if less
than cost, based primarily on our estimated forecast of product demand. Once our inventory value is written-down and a new cost basis has been established, the inventory value is not increased due to demand increases. Demand for our products can fluctuate significantly. A significant increase in the demand for our products could result in a short-term increase in the cost of inventory purchases as a result of supply shortages or a decrease in the cost of inventory purchases as a result of volume discounts, while a significant decrease in demand could result in an increase in the charges for excess inventory quantities on hand. In addition, our industry is subject to technological change, new product development and product technological obsolescence that could result in an increase in the amount of obsolete inventory quantities on hand. Therefore, any significant unanticipated changes in demand or technological developments could have a significant impact on the value of our inventory and our reported operating results. Excess and obsolete expense was $56 million, $64 million and $21 million for 2024, 2023 and 2022, respectively. The higher excess and obsolete charge in 2023 was partially the result of an inventory write-off related to the discontinuation of a product line in 2023 and partially the result of reduced forecasted usage. The higher excess and obsolete charge in 2024 was the result of reduced forecasted usage.
Warranty Costs. We provide for the estimated costs to fulfill customer warranty obligations upon the recognition of the related revenue. We provide warranty coverage for our products for periods ranging from 12 to 36 months, with the majority of our products for periods ranging from 12 to 24 months. Short-term accrued warranty obligations, which expire within one year, are included in other current liabilities and long-term accrued warranty obligations are included in other liabilities in the consolidated balance sheets. We estimate the anticipated costs of repairing our products under such warranties based on the historical costs of the repairs and any known specific product issues. The assumptions we use to estimate warranty accruals are re-evaluated periodically in light of actual experience and, when appropriate, the accruals are adjusted. Our determination of the appropriate level of warranty accrual is based upon estimates. Should product failure rates differ from our estimates, actual costs could vary significantly from our expectations. Defective products will be either repaired or replaced, generally at our option, upon meeting certain criteria.
Pension Plan Valuations. Several of our non-U.S. subsidiaries have defined benefit pension plans covering employees of those subsidiaries. The majority of these defined benefit plans are frozen and do not allow new employees to join the plans. Some of the plans are unfunded, as permitted under the plans and applicable laws. For financial reporting purposes, we obtained actuarial reports supporting the calculation of net periodic pension costs that used a number of actuarial assumptions, including a discount rate for plan obligations, an assumed rate of return on pension plan assets, and an assumed rate of compensation increase for employees covered by the various plans. We reviewed these actuarial assumptions and concluded they were reasonable based upon our judgment, considering known trends and uncertainties. Actual results that differ from these assumptions would impact future expense recognition and the cash funding requirements of our pension plans.
Stock-Based Compensation Expense. Stock-based awards include (i) time-based restricted stock units (“RSUs”), (ii) performance-based RSUs based on the achievement of adjusted EBITDA targets (the “Adjusted EBITDA RSUs”), (iii) performance-based RSUs based on the Company’s total shareholder return relative to a group of peers over a three-year performance period (the “rTSR RSUs”) and (iv) employee stock purchase plan rights. We record compensation expense for all stock-based compensation awards to employees and directors based upon the estimated fair market value of the underlying instrument. Accordingly, stock-based compensation cost is measured at the grant date, based upon the fair value of the award.
We determine the fair value of time-based RSUs based on the closing market price of our common stock on the date of the award. We determine the original fair value of Adjusted EBITDA RSUs based upon the closing market price of our stock on the date of the award and adjust the fair value quarterly during the first year based upon actual and forecasted results against Adjusted EBITDA targets. Accordingly, the number of performance shares earned will vary based on the level of achievement of financial performance objectives for the applicable period. For each quarter until such time that our financial performance can ultimately be determined, we estimate the number of performance shares to be earned based on an evaluation of the probability of achieving the financial performance objectives. Such estimates are revised, if necessary, in subsequent periods when the underlying factors change our evaluation of the probability of achieving the financial performance objectives. Accordingly, share-based compensation expense associated with performance shares may differ significantly from the amount recorded in the current period. Such values are recognized as expense using the accelerated graded vesting method for Adjusted EBITDA RSUs, all over the requisite service periods. We estimate the fair value of rTSR RSUs using the Monte Carlo simulation model, which requires the use of highly subjective and complex assumptions, including the price volatility of the underlying stock. For the rTSR RSUs, the expense computed for the total shareholder return shares is fixed and recognized on a straight-line basis over the vesting period.
We provide certain employees the opportunity to purchase our shares through an Employee Stock Purchase Plan (“ESPP”). We estimate the fair value of shares issued under our ESPP using the Black-Scholes model, which incorporates a number of complex and subjective variables, including expected stock price volatility over the term of the awards, expected life, risk-free interest rate and expected dividends. Management determined that blended stock-based compensation, a combination of historical and implied volatility, is more reflective of market conditions and a better indicator of expected volatility than historical or implied volatility alone.
The assumptions used in calculating the fair value of share-based compensation awards represents management’s best estimates, but these estimates involve inherent uncertainties and the application of management’s judgment. As a result, if factors change and we use different assumptions, our stock-based compensation expense could be materially different in the future.
Intangible Assets, Goodwill and Long-Lived Assets. As a result of our acquisitions, we have identified intangible assets and generated significant goodwill. Definite-lived intangible assets are valued based on estimates of future cash flows and amortized over their estimated useful life. Determining fair value requires the exercise of significant judgment, including assumptions about appropriate discount rates as well as forecasted revenue, terminal growth rate, gross profit and operating expenses.
Goodwill and indefinite-lived intangible assets are subject to annual impairment testing as well as testing upon the occurrence of any event that indicates a potential impairment. Intangible assets and other long-lived assets are also subject to an impairment test if there is an indicator of impairment. If our expectations of future results and cash flows are significantly diminished, intangible assets, goodwill and other long-lived assets may be impaired and the resulting charge to operations may be material. When we determine that the carrying value of intangible assets or other long-lived assets may not be recoverable based upon the existence of one or more indicators of impairment, we use the projected undiscounted cash flow method to determine whether an impairment exists and then measure the impairment using discounted cash flows. To measure impairment for goodwill, we compare the fair value of our reporting units by measuring discounted cash flows to the book value of the reporting units. Goodwill would be impaired if the resulting implied fair value was less than the recorded book value of the goodwill.
The estimation of useful lives and expected cash flows requires us to make significant judgments regarding future periods that are subject to factors outside of our control. Changes in these estimates can result in significant revisions to the carrying value of these assets and may result in material charges to the results of operations.
We have elected to perform our annual goodwill impairment test as of October 31 of each year, or more often if events or circumstances indicate that there may be impairment. Goodwill is the amount by which the cost of acquired net assets exceeded the fair value of those net assets on the date of acquisition. We allocate goodwill to reporting units at the time of acquisition or when there is a change in the reporting structure and base that allocation on which reporting units will benefit from the acquired assets and liabilities. Reporting units are defined as operating segments or one level below an operating segment, referred to as a component. The estimated fair value of our reporting units was based on discounted cash flow models derived from internal earnings and internal and external market forecasts. Determining fair value requires the exercise of significant judgment, including assumptions about appropriate discount and perpetual growth rates, as well as forecasted revenue growth rates and gross profit and operating expenses. Discount rates are based on a weighted average cost of capital (“WACC”), which represents the average rate a business must pay its providers of debt and equity. The WACC used to test goodwill is derived from a group of comparable companies. Assumptions in estimating future cash flows are subject to a high degree of judgment and complexity. We make every effort to forecast these future cash flows as accurately as possible with the information available at the time the forecast is developed.
In performing our annual goodwill impairment test, we are permitted to first assess qualitative factors to determine whether it is more likely than not that the fair value of our reporting unit is less than its carrying amount, including goodwill. In performing the qualitative assessment, we consider certain events and circumstances specific to the reporting unit and to the entity as a whole, such as macroeconomic conditions, industry and market considerations, overall financial performance and cost factors when evaluating whether it is more likely than not that the fair value of a reporting unit is less than its carrying amount. We are also permitted to bypass the qualitative assessment and proceed directly to the quantitative assessment. If we choose to undertake the qualitative assessment and we conclude that it is more likely than not that the fair value of the reporting unit is less than its carrying amount, we would then proceed to the quantitative impairment assessment. In the quantitative assessment, we compare the fair value of the reporting unit to its carrying amount, which includes goodwill. If the fair value exceeds the carrying value, no impairment loss exists. If the fair value is less than the carrying amount, a goodwill impairment loss is measured and recorded.
As of October 31, 2024, we performed our annual impairment assessment of goodwill using a qualitative assessment for all of our reporting units. We determined that it was more likely than not that the fair values were more than the carrying values for each of the reporting units.
During the quarter ended June 30, 2023, as a result of softer industry demand, particularly in the personal computer and smartphone markets, we concluded there was a triggering event at our Electronics (“EL”) and general metal finishing (“GMF”) reporting units, which together constitute MSD, and our Equipment Solutions Business (“ESB”) reporting unit of PSD. We concluded there was no triggering event at our other reporting units within VSD and PSD.
For the EL, GMF and ESB reporting units, we performed a quantitative assessment of goodwill using a combination of a market approach and the income approach. This quantitative assessment resulted in a non-cash goodwill impairment of $826 million for the EL reporting unit, $428 million for the GMF reporting unit and $372 million for the ESB reporting unit. In addition, we recorded a $49 million impairment of in-process research and development (“IPR&D”) allocated to the EL reporting unit and a $152 million impairment related to completed technology allocated to the ESB reporting unit.
As of October 31, 2023, we performed our annual impairment assessment of goodwill by bypassing the qualitative assessment and using a quantitative assessment for all of our reporting units. As a result of higher WACC mainly caused by overall higher market interest rates, we recorded additional non-cash goodwill impairment charges of $48 million and $13 million at our EL and ESB reporting units, respectively. There was no goodwill impairment at any of our other reporting units. In addition, we recorded a $14 million impairment of IPR&D allocated to the EL reporting unit.
We will continue to monitor and evaluate the carrying value of goodwill and intangible assets. If market and economic conditions or business performance deteriorate, this could increase the likelihood of us recording an impairment charge. Our stock price and any estimated control premium are factors affecting the assessment of the fair value of our underlying reporting units for purposes of performing any goodwill impairment assessment.
Income Taxes. We evaluate the realizability of our net deferred tax assets and assess the need for a valuation allowance on a quarterly basis. The future benefit to be derived from our deferred tax assets is dependent upon our ability to generate sufficient future taxable income in each jurisdiction of the right type to realize the assets. We record a valuation allowance to reduce our net deferred tax assets to the amount that is expected to be realized. To the extent we establish a valuation allowance, or determine that a valuation allowance is no longer needed, an expense or benefit is recorded within the provision for income taxes line in the consolidated statements of operations and comprehensive (loss) income.
We are subject to the income tax laws and regulations of the many jurisdictions in which we operate. These tax laws and regulations are complex and involve uncertainties in the application to our facts and circumstances that may be open to interpretation. Accounting for income taxes requires a two-step approach to recognize and measure uncertain tax positions. The first step is to evaluate the tax position for recognition by determining if, based on the technical merits, it is more likely than not that the position will be sustained upon audit, including resolutions of related appeals or litigation processes, if any. The second step is to measure the tax benefit as the largest amount that is more than 50% likely of being realized upon ultimate settlement. This process is inherently subjective since it requires our assessment of the probability of future outcomes. We re-evaluate these uncertain tax positions on a quarterly basis based on factors including, but not limited to, changes in facts or circumstances, changes in tax law, effectively settled issues under audit and new audit activity. Any change in these factors could result in the recognition of a tax benefit or an additional charge to the tax provision.
Derivatives. As a result of our global operating activities and variable interest rate borrowings, we are exposed to market risks from changes in foreign currency exchange rates and interest rates, which may adversely affect our operating results and financial position. We address these risks through a risk management program that includes the use of derivative financial instruments. We operate the program pursuant to documented corporate risk management policies. We enter into derivative instruments for risk management purposes only, including derivatives designated as hedging instruments and those utilized as economic hedges. We do not enter into derivative instruments for trading or speculative purposes.
We have used derivative instruments, such as foreign exchange forward contracts, options and net investment hedges, to manage certain foreign currency exposure, and interest rate swaps and interest rate caps to manage certain interest rate exposure. Changes in fair value of derivative instruments are recognized in the consolidated statement of operations or, if hedge accounting is applied, in Other Comprehensive (Loss) Income (“OCI”) for the effective portion of the changes in fair value. The cash flows resulting from foreign exchange forward contracts are classified in the consolidated statements of cash flows as part of cash flows from operating activities. All derivatives are stated at fair value in the consolidated balance sheets.
Accounting principles for qualifying hedges require detailed documentation that describes the relationship between the hedging instrument and the hedged item, including, but not limited to, the risk management objectives and hedging strategy and the methods to assess the effectiveness of the hedging relationship. We assess the hedging relationships, both at the inception of the hedge and on an ongoing basis, using either the critical terms matching approach or a regression analysis approach to determine whether the designated hedging instrument is highly effective in offsetting changes in the value of the hedged item.
By nature, all financial instruments involve market and credit risks. We enter into derivative instruments with a diversified group of major investment grade financial institutions, for which no collateral is required. We have policies to monitor the credit risk of these counterparties. While there can be no assurance, we do not anticipate any material non-performance by any of these counterparties.
Results of Operations
The following table sets forth, for the periods indicated, the percentage of total net revenues of certain line items included in our consolidated statements of operations and comprehensive income (loss) data:
| | | | | | | | |
| | Years Ended December 31, | |
| | 2024 | | | 2023 | |
Net revenues: | | | | | | |
Product | | | 87.1 | % | | | 88.3 | % |
Service | | | 12.9 | | | | 11.7 | |
Total net revenues | | | 100.0 | | | | 100.0 | |
Cost of revenues: | | | | | | |
Cost of product revenues | | | 46.3 | | | | 48.3 | |
Cost of service revenues | | | 6.0 | | | | 6.4 | |
Total cost of revenues (exclusive of amortization shown separately below) | | | 52.4 | | | | 54.7 | |
Gross profit | | | 47.6 | | | | 45.3 | |
Research and development | | | 7.6 | | | | 8.0 | |
Selling, general and administrative | | | 18.8 | | | | 18.6 | |
Acquisition and integration costs | | | 0.3 | | | | 0.4 | |
Restructuring and other | | | 0.2 | | | | 0.6 | |
Fees and expenses related to amendments to the Term Loan Facility | | | 0.1 | | | | 0.1 | |
Amortization of intangible assets | | | 6.8 | | | | 8.1 | |
Goodwill and intangible asset impairments | | | — | | | | 52.5 | |
Gain on sale of long-lived assets | | | — | | | | (0.1 | ) |
Income (loss) from operations | | | 13.9 | | | | (42.9 | ) |
Interest income | | | (0.6 | ) | | | (0.5 | ) |
Interest expense | | | 7.9 | | | | 9.8 | |
Loss on extinguishment of debt | | | 1.6 | | | | 0.2 | |
Other (income) expense, net | | | (0.1 | ) | | | 0.7 | |
Income (loss) before income taxes | | | 5.0 | | | | (53.2 | ) |
Provision (benefit) for income taxes | | | (0.3 | ) | | | (2.4 | ) |
Net income (loss) | | | 5.3 | % | | | (50.8 | )% |
Year Ended December 31, 2024 compared to 2023
The following table sets forth our net revenues for products and services:
Net Revenues
| | | | | | | | |
| | Years Ended December 31, | |
(Dollars in millions) | | 2024 | | | 2023 | |
Product | | $ | 3,124 | | | $ | 3,200 | |
Service | | | 462 | | | | 422 | |
Total net revenues | | $ | 3,586 | | | $ | 3,622 | |
Net product revenues decreased $76 million in 2024, compared to 2023, primarily driven by a decrease of $63 million in net product revenues from our specialty industrial market mainly due to lower solar, general industrial, and material processing sales and a decrease of $12 million in net product revenues from our electronics and packaging market, primarily due to lower equipment revenues at MSD as customers postponed investment decisions and also as a result of lower palladium prices for chemistry products which lower prices are passed through to our customers in our electronics component business at MSD, partially offset by volume increases in chemistry materials. The decrease in our electronics and packaging market was partially offset by an increase in industry demand for PCB via drilling systems at PSD and an increase in the volume of chemistry materials at MSD.
Net service revenues consisted mainly of fees for services related to the maintenance and repair of our products, sales of spare parts, and installation and training. Net service revenues increased $40 million in 2024, compared to 2023, primarily due to an increase in net service revenues in our semiconductor market, mainly at VSD, and an increase of net service revenues in our electronics and packaging market, mainly at PSD and MSD.
Total international net revenues, including product and service, were $2.8 billion in 2024, compared to $2.7 billion in 2023.
The following table sets forth our net revenues by reportable segment:
Net Revenues
| | | | | | | | |
| | Years Ended December 31, | |
(Dollars in millions) | | 2024 | | | 2023 | |
Vacuum Solutions Division | | $ | 1,384 | | | $ | 1,440 | |
Photonics Solutions Division | | | 1,021 | | | | 976 | |
Materials Solutions Division | | | 1,181 | | | | 1,206 | |
Total net revenues | | $ | 3,586 | | | $ | 3,622 | |
Net revenues for our VSD segment decreased $56 million in 2024, compared to 2023, mainly due to a decrease in revenues from customers in the specialty industrial market, as a result of lower solar and general industrial sales, as well as a decrease in net revenues in the semiconductor market as a result of continued softened demand for semiconductor capital equipment in the deposition and etching tool markets for memory applications, particularly NAND.
Net revenues for our PSD segment increased $45 million in 2024, compared to 2023, primarily as a result of an increase in sales of our lithography, metrology and inspection products, that are a part of our World Class Optics portfolio, in our semiconductor market and an increase in industry demand for PCB via drilling systems in our electronics and packaging market.
Net revenues for our MSD segment decreased $25 million in 2024, compared to 2023, primarily due to lower equipment revenue in the electronics and packaging market, as customers postponed certain investment decisions, and a decrease in chemistry sales in specialty industrial markets, primarily due to lower palladium prices, which lower prices are passed through to our customers, and the negative impact of foreign exchange, partially offset by volume increases in chemistry materials.
The following table sets forth gross profit as a percentage of net revenues by product and service:
Gross Profit Excluding Amortization
| | | | | | | | | | | | |
| | Years Ended December 31, | | | % Points | |
(As a percentage of net revenues) | | 2024 | | | 2023 | | | Change | |
Product | | | 46.8 | % | | | 45.4 | % | | | 1.4 | % |
Service | | | 53.3 | % | | | 45.0 | % | | | 8.3 | % |
Total gross profit percentage | | | 47.6 | % | | | 45.3 | % | | | 2.3 | % |
Gross profit as a percentage of net product revenues increased by 1.4 percentage points in 2024, compared to 2023, primarily due to favorable product mix, higher factory utilization and lower excess and obsolete inventory charges, partially offset by higher warranty costs.
Gross profit as a percentage of net service revenues increased by 8.3 percentage points in 2024, compared to 2023, primarily due to favorable product mix and lower direct labor and overhead cost on repairs.
The following table sets forth gross profit as a percentage of net revenues by reportable segment:
Gross Profit Excluding Amortization
| | | | | | | | | | | | |
| | Years Ended December 31, | % Points | |
(As a percentage of net revenues) | | 2024 | | | 2023 | | | Change | |
Vacuum Solutions Division | | | 42.9 | % | | | 42.6 | % | | | 0.3 | % |
Photonics Solutions Division | | | 44.9 | % | | | 43.4 | % | | | 1.5 | % |
Materials Solutions Division | | | 56.1 | % | | | 51.4 | % | | | 4.7 | % |
Total gross profit percentage | | | 47.6 | % | | | 45.3 | % | | | 2.3 | % |
Gross profit as a percentage of net revenues for VSD increased in 2024, compared to 2023, primarily due to higher factory utilization and lower material costs, partially offset by unfavorable product mix, higher excess and obsolete inventory charges and higher warranty costs.
Gross profit as a percentage of net revenues for PSD increased in 2024, compared to 2023, primarily due to higher revenue volumes, lower excess and obsolete inventory charges and lower freight and duty costs, partially offset by unfavorable product mix.
Gross profit as a percentage of net revenues for MSD increased in 2024, compared to 2023, primarily due to lower palladium prices and favorable product mix, partially offset by higher warranty costs.
The above gross profit percentages by division exclude an immaterial amount of unallocated corporate expense included in the total gross profit percentage.
Research and Development
| | | | | | | | |
| | Years Ended December 31, | |
(Dollars in millions) | | 2024 | | | 2023 | |
Research and development | | $ | 271 | | | $ | 288 | |
Research and development expenses decreased $17 million in 2024, compared to 2023, mainly due to decreases of $8 million in compensation-related costs, including salaries, fringe and variable compensation expenses, a decrease of $2 million in engineering consulting fees, and a decrease of $5 million of research and development credits and government assistance received in 2024.
Our research and development efforts are primarily focused on developing and improving our instruments, components, chemistry, subsystems, systems and process control solutions to improve process performance and productivity. We have thousands of products, and our research and development efforts primarily consist of a large number of projects related to these products, none of which is individually material to us. Projects typically have a duration of 3 to 36 months but may be extended for development of new products.
We continue to make product advancements designed to meet our customers’ evolving needs. We have developed, and continue to develop, new products designed to address industry trends, such as the rising demand for more complex hardware architecture related to increasing investments in artificial intelligence, the shrinking of integrated circuit critical dimensions and technology inflections, and, in the flat panel display and solar markets, the transition to larger substrate sizes, which require more advanced processing and process control technology, the continuing drive toward more complex and accurate components and devices within the handset and tablet market, the transition to 5G for both devices and infrastructure, the growth in units and via counts in the high density interconnect PCB drilling market, and the transition from internal combustion to electric vehicles. In addition, we have developed, and continue to develop, products that support the migration to new classes of materials, ultra-thin layers, and 3D structures that are used in small geometry manufacturing. In our chemistry and equipment plating businesses, a majority of our research and development investment supports existing customers’ product improvement needs and their short-term research and development goals, which enables us to pioneer new high-value solutions while limiting commercial risk. Research and development expenses consist primarily of salaries and related expenses for personnel engaged in research and development, fees paid to consultants, material costs for prototypes and other expenses related to the design, development, testing and enhancement of our products.
We believe that the continued investment in research and development and ongoing development of new products are essential to the expansion of our markets. We expect to continue to make significant investment in research and development activities. We are subject to risks from products not being developed in a timely manner, as well as from rapidly changing customer requirements and competitive threats from other companies and technologies. Our success depends on many of our products being designed into new generations of equipment for the semiconductor, electronics and packaging, and specialty industrial markets. We seek to develop products that are technologically advanced so that they are positioned to be chosen for use in each successive generation of semiconductor capital equipment and advanced markets applications. If our products are not chosen to be designed into our customers’ products, our net revenues may be reduced during the lifespan of those products.
Selling, General and Administrative
| | | | | | | | |
| | Years Ended December 31, | |
(Dollars in millions) | | 2024 | | | 2023 | |
Selling, general and administrative | | $ | 674 | | | $ | 675 | |
Selling, general and administrative expenses decreased $1 million during 2024, compared to 2023, primarily due to a $20 million decrease in compensation-related costs, mainly related to salaries, fringe and variable compensation and a $14 million reduction in net costs mostly incurred in 2023 due to the ransomware event in February 2023. These savings were partially offset by increases of $14 million in information technology investments, $7 million in consulting and professional fees, $5 million in non-income related taxes, $2 million in lease expenses and $2 million in travel expenses.
Acquisition and Integration Costs
| | | | | | | | |
| | Years Ended December 31, | |
(Dollars in millions) | | 2024 | | | 2023 | |
Acquisition and integration costs | | $ | 9 | | | $ | 16 | |
Acquisition and integration costs incurred during 2024 and 2023 were related to consulting and professional fees related to the acquisition of Atotech Limited (“Atotech”) in August 2022 (the “Atotech Acquisition”).
Restructuring and other
| | | | | | | | |
| | Years Ended December 31, | |
(Dollars in millions) | | 2024 | | | 2023 | |
Restructuring and other | | $ | 6 | | | $ | 20 | |
Restructuring and other charges incurred in 2024 and 2023 were primarily related to severance costs as a result of global cost-saving initiatives.
Fees and expenses related to amendments to the Term Loan Facility
| | | | | | | | |
| | Years Ended December 31, | |
(Dollars in millions) | | 2024 | | | 2023 | |
Fees and expenses related to amendments to the Term Loan Facility | | $ | 5 | | | $ | 2 | |
In 2024, we recorded fees and expenses related to (i) the Second Amendment to Credit Agreement, dated as of January 22, 2024, by and among us as parent borrower, the other loan parties party thereto, JPMorgan Chase Bank, N.A., as administrative agent, and each lender party thereto (the “Second Amendment”) and (ii) the Fourth Amendment to Credit Agreement, dated as of July 23, 2024, by and among us as parent borrower, the other loan parties party thereto, JPMorgan Chase Bank, N.A., as administrative agent, and each lender party thereto (the “Fourth Amendment”).
In 2023, we recorded fees and expenses related to the First Amendment to Credit Agreement, dated as of October 3, 2023, by and among us as parent borrower, the other loan parties party thereto, JPMorgan Chase Bank, N.A., as administrative agent, and each lender party thereto (the “First Amendment”).
Amortization of Intangible Assets
| | | | | | | | |
| | Years Ended December 31, | |
(Dollars in millions) | | 2024 | | | 2023 | |
Amortization of intangible assets | | $ | 245 | | | $ | 295 | |
Amortization of intangible assets decreased $50 million in 2024, compared to 2023, primarily due to the backlog-related intangible assets related to MSD being fully amortized in 2023, and the write-off of completed technology at our ESB reporting unit of PSD in the second quarter of 2023.
Goodwill and Intangible Asset Impairments
| | | | | | | | |
| | Years Ended December 31, | |
(Dollars in millions) | | 2024 | | | 2023 | |
Goodwill and intangible asset impairments | | | — | | | $ | 1,902 | |
During the quarter ended June 30, 2023, as a result of softer industry demand, particularly in the personal computer and smartphone markets, we concluded there was a triggering event at our EL and GMF reporting units, which together constitute MSD, and the ESB reporting unit of PSD. We concluded there was no triggering event at our other reporting units within VSD and PSD.
For the EL, GMF and ESB reporting units, we performed a quantitative assessment of goodwill using a combination of a market approach and income approach. Fair value estimates are based on a complex series of judgments about future events and uncertainties and rely heavily on estimates and assumptions that have been deemed reasonable by our management.
This quantitative assessment resulted in a non-cash goodwill impairment of $826 million for the EL reporting unit, $428 million for the GMF reporting unit and $372 million for the ESB reporting unit. In addition, we recorded a $49 million impairment
of IPR&D allocated to the EL reporting unit and a $152 million impairment related to completed technology allocated to the ESB reporting unit.
On October 31, 2023, we performed our annual goodwill and intangible asset impairment assessment. As a result of higher WACC mainly caused by overall higher market interest rates, we recorded additional non-cash goodwill impairment charges of $48 million and $13 million at our EL and ESB reporting units, respectively. In addition, we recorded a $14 million impairment of IPR&D allocated to the EL reporting unit. There were no impairments at any of our other reporting units.
On October 31, 2024, we again performed our annual goodwill and intangible asset impairment assessment using a qualitative assessment for all of our reporting units. We determined that it was more likely than not that the fair values were more than the carrying values for each of the reporting units.
We will continue to monitor and evaluate the carrying value of goodwill and intangible assets. If market and economic conditions or business performance deteriorate, the likelihood that we would record an impairment charge would increase, which could materially and adversely affect our financial condition and operating results.
Gain on Sale of Long-Lived Assets
| | | | | | | | |
| | Years Ended December 31, | |
(Dollars in millions) | | 2024 | | | 2023 | |
Gain on sale of long-lived assets | | | — | | | $ | (2 | ) |
In 2023, we recorded a gain as a result of receiving cash from the sale of a minority interest investment in a private company.
Interest Expense, Net
| | | | | | | | |
| | Years Ended December 31, | |
(Dollars in millions) | | 2024 | | | 2023 | |
Interest expense, net | | $ | 263 | | | $ | 339 | |
Interest expense, net, decreased by $76 million in 2024, compared to 2023, primarily as a result of the issuance of $1.4 billion of Convertible Notes (as defined and described further below under “Convertible Notes”) in May 2024, at a coupon rate of 1.25%, $1.2 billion of the proceeds of which were used to pay down our loans under the Term Loan Facility, which had an interest rate of approximately 7.8%. In addition in July 2024, we entered into the Fourth Amendment, which decreased the applicable margin for both the USD Tranche B and the EUR Tranche B (each as defined and described further below under “Credit Facilities”) by 0.25%. In addition, interest expense, net was lower in 2024 than 2023 as a result of the voluntary prepayments of $100 million in October 2023, $50 million in February 2024, $50 million in April 2024, $110 million in July 2024 and $216 million in October 2024, on loans under the Term Loan Facility.
Loss on extinguishment of debt
| | | | | | | | |
| | Years Ended December 31, | |
(Dollars in millions) | | 2024 | | | 2023 | |
Loss on extinguishment of debt | | $ | 57 | | | $ | 8 | |
We recorded a loss on extinguishment of debt as a result of the acceleration of deferred financing and original issue discount costs associated with the Second Amendment in January 2024, Convertible Notes in May 2024 and Fourth Amendment in July 2024. In addition, we recorded a loss on extinguishment of debt as a result of the acceleration of deferred financing and original issue discount costs as a result of voluntary prepayments under the Term Loan Facility made in 2024, as described above.
In October 2023, in connection with the First Amendment and the voluntary prepayment of $100 million, we recorded a loss on extinguishment of debt as a result of the acceleration of deferred financing and original issue discount costs.
Other (Income) Expense, Net
| | | | | | | | |
| | Years Ended December 31, | |
(Dollars in millions) | | 2024 | | | 2023 | |
Other (income) expense, net | | $ | (2 | ) | | $ | 27 | |
Other (income) expense, net, for 2024 and 2023 primarily relate to net foreign exchange and fair value gains and losses.
(Benefit) Provision for Income Taxes
| | | | | | | | |
| | Years Ended December 31, | |
(Dollars in millions) | | 2024 | | | 2023 | |
(Benefit) provision for income taxes | | $ | (10 | ) | | $ | (87 | ) |
Our effective tax rates for 2024 and 2023 were (5.7)% and 4.5%, respectively. Our effective tax rate for 2024 was lower than the U.S. statutory tax rate, mainly due to the U.S. deduction for foreign derived intangible income (“FDII”) and valuation allowance release partially offset by the increase in withholding taxes.
Our effective tax rate for 2023 was lower than the U.S. statutory tax rate, mainly due to the impairment of goodwill and intangible assets.
As of December 31, 2024 and 2023, total gross unrecognized tax benefits, which excludes interest and penalties, was $94 million and $86 million, respectively. The net increase was primarily due to the addition of income tax reserves related to intercompany transactions.
We accrue interest and, if applicable, penalties for any uncertain tax positions. Interest and penalties are classified as a component of income tax expense. As of December 31, 2024 and 2023, we accrued interest on unrecognized tax benefits of approximately $8 million and $7 million, respectively.
Over the next 12 months, it is reasonably possible that we may recognize approximately $3 million of previously net unrecognized tax benefits, excluding interest and penalties, related to various U.S. federal, state and foreign tax positions, primarily due to the expiration of statutes of limitations.
We are subject to examination by U.S. federal, state and foreign tax authorities. The U.S. federal statute of limitations remains open for tax years 2020 through the present. The statute of limitations for our tax filings in other jurisdictions varies between fiscal years 2019 through the present. We also have certain prior year federal credit carryforwards and state tax loss and credit carryforwards that are subject to examination to the extent used in an open year.
Our future effective tax rate depends on various factors, including the impact of tax legislation, further interpretations and guidance from U.S. federal and state governments on the impact of proposed regulations issued by the Internal Revenue Service, as well as the geographic composition of our pre-tax income and changes in income tax reserves for unrecognized tax benefits. While we believe we have adequately provided for all tax positions, amounts asserted by taxing authorities could materially differ from our accrued positions as a result of uncertain and complex application of tax laws and regulations. Additionally, the recognition and measurement of certain tax benefits include estimates and judgment by management. Accordingly, we could record additional provisions or benefits for U.S. federal, state, and foreign tax matters in future periods as new information becomes available.
The Organisation for Economic Co-operation and Development (“OECD”) and participating OECD member countries continue to work toward the enactment of a 15% global minimum corporate tax rate for large multinational enterprise groups, also known as "Pillar Two". Many of the participating countries have enacted legislation that became effective beginning in 2024, while other countries continue to work on defining the underlying rules and administrative procedures. Although the enacted and effective legislation in some countries was applicable to us as of January 1, 2024, and increased our effective income tax rate, the increase did not have a material impact on our overall results of operations or cash flows. We will continue to monitor and evaluate the impacts of the developing legislation.
Liquidity and Capital Resources
Cash and cash equivalents at December 31, 2024 and 2023 totaled $714 million and $875 million, respectively. The primary driver of our current and anticipated future cash flows is, and we expect will continue to be, cash generated from operations, consisting primarily of our net income (loss), excluding non-cash charges and changes in operating assets and liabilities.
Our total cash and cash equivalents at December 31, 2024 consisted of $268 million held in the United States and $446 million held by our foreign subsidiaries. We believe that our current cash and investments position and available borrowing capacity, together with the cash anticipated to be generated from our operations, will be sufficient to satisfy our estimated working capital, planned capital expenditure requirements, payments of debt, and any future cash dividends declared by our Board of Directors or share repurchases through at least the next 12 months and the foreseeable future.
In periods when our sales are growing, higher sales to customers will result in increased trade receivables, and inventories will generally increase as we build products for future sales. This may result in lower cash generated from operations. Conversely, in periods when our sales are declining, our trade accounts receivable and inventory balances will generally decrease, resulting in increased cash from operations.
Net cash provided by operating activities was $528 million for 2024 and resulted from net income of $190 million, which included non-cash charges of $334 million, offset by a net decrease in working capital of $4 million. The net decrease in working capital was primarily due to an increase in income taxes payable of $49 million, an increase in accounts payable of $21 million, a decrease in other current and non-current assets of $25 million, primarily related to a decrease in right of use assets, and a decrease in inventory of $20 million. This net decrease in working capital was partially offset by a decrease in other current and non-current liabilities of $43 million, a decrease in current and non-current accrued compensation of $32 million as a result of lower variable compensation and an increase in accounts receivable of $36 million.
Net cash provided by operating activities was $319 million for 2023 and resulted from a net loss of $1,841 million, which included non-cash charges of $2,259 million, mainly as a result of goodwill and intangible asset impairment charges of $1,902 million, offset by a net increase in working capital of $99 million. The net increase in working capital was primarily due to a decrease in accounts payable of $99 million, a decrease in income taxes payable of $64 million and an increase in inventory of $76 million. This net increase in working capital was partially offset by a decrease in accounts receivable of $114 million, as a result of lower business levels, and a decrease in other current and non-current assets of $50 million, primarily as a result of a decrease in right of use assets of $31 million, and a decrease in other current and non-current assets of $19 million.
Net cash used in investing activities was $117 million for 2024, consisting primarily of $118 million in capital expenditures.
Net cash used in investing activities was $84 million for 2023, consisting primarily of $87 million in capital expenditures, offset by $3 million in proceeds from the sale of long-lived assets.
Net cash used in financing activities was $549 million for 2024, primarily due to net proceeds from the issuance of Convertible Notes of $1.4 billion and incremental loans under the Term Loan Facility in an aggregate principal amount of $761 million. The proceeds of the incremental loans under the Term Loan Facility were used in part to prepay the USD Tranche A term loans outstanding under the Amended Credit Agreement (as defined and described further below under “Credit Facilities”) in full in an aggregate principal amount of $744 million, and the proceeds of the Convertible Notes were used in part to prepay a portion of the USD Tranche B loans in an aggregate principal amount of $1.2 billion. In addition, there were normal quarterly debt payments and voluntary prepayments that totaled $476 million. We also made payments of $167 million to purchase a capped call option related to the Convertible Notes, $33 million for debt financing costs and $59 million for dividends.
Net cash used in financing activities was $259 million for 2023, primarily due to $403 million of payments on our Term Loan Facility and $59 million of dividend payments, partially offset by $216 million in proceeds from our Term Loan Facility.
Holders of our common stock are entitled to receive dividends when and if they are declared by our Board of Directors. For the years ended December 31, 2024 and 2023, we paid cash dividends of $59 million in the aggregate or $0.88 per share, respectively. Future dividend declarations, if any, as well as the record and payment dates for such dividends, are subject to the final determination of our Board of Directors.
On February 10, 2025, our Board of Directors declared a quarterly cash dividend of $0.22 per share to be paid on March 7, 2025 to shareholders of record as of February 24, 2025.
Credit Facilities
In connection with the completion of the Atotech Acquisition, on August 17, 2022 (the “Effective Date”) we entered into a credit agreement with JPMorgan Chase Bank, N.A., as administrative agent and collateral agent, Barclays Bank PLC, and the lenders from time to time party thereto, which we have amended several times since (as amended, the “Amended Credit Agreement”). As of December 31, 2024, the Amended Credit Agreement provided for (i) a senior secured term loan facility comprised of two tranches: a $2.6 billion loan (the “USD Tranche B”) and a €596 million loan (the “Euro Tranche B” and together with the USD Tranche B, the “Term Loan Facility”) and (ii) a senior secured revolving credit facility of $675 million (the “Revolving Facility” and, together with the Term Loan Facility, the “Credit Facilities”), with the commitments under each of the foregoing facilities subject to increase from time to time subject to certain conditions.
As of December 31, 2024, borrowings under the Credit Facilities bore interest at a rate per annum equal to, at our option, any of the following, plus, in each case, an applicable margin: (a) with respect to the USD Tranche B and the Revolving Facility, (x) a base rate determined by reference to the highest of (1) the federal funds effective rate plus 0.50%, (2) the prime rate quoted in The Wall Street Journal, or (3) a forward-looking term rate based on the variable secured overnight financing rate (“Term SOFR”) (plus an applicable credit spread adjustment) for an interest period of one month, plus 1.00%, and (y) a Term SOFR rate (plus an applicable credit spread adjustment) for the interest period relevant to such borrowing, subject to a rate floor of (I) with respect to the USD Tranche B, 0.50% and (II) with respect to the Revolving Facility, 0.0%; and (b) with respect to the Euro Tranche B, a Euro Interbank Offered Rate (“EURIBOR”) rate determined by reference to the costs of funds for Euro deposits for the interest period relevant to such borrowing adjusted for certain additional costs, subject to a EURIBOR rate floor of 0.0%. As of December 31, 2024, the applicable margins for borrowings under the Credit Facilities were (i) under the USD Tranche B and the Revolving
Facility, 1.25% with respect to base rate borrowings and 2.25% with respect to Term SOFR borrowings and (ii) under the Euro Tranche B, 2.75%.
In addition to paying interest on outstanding principal under the Credit Facilities, we are required to pay a commitment fee in respect of the unutilized commitments under the Revolving Facility. The commitment fee is subject to adjustment based on our first lien net leverage ratio as of the end of the preceding fiscal quarter. We must also pay customary letter of credit fees and agency fees. As of December 31, 2024, the commitment fee was 0.25% per annum, representing a downward adjustment from 0.375% as of June 30, 2024.
As of December 31, 2024, the principal outstanding on the Term Loan Facility was $3.2 billion, and the weighted average interest rate was 6.4%. The Revolving Facility has a maturity date in August 2027 while the USD Tranche B and Euro Tranche B have a maturity date in August 2029. As of December 31, 2024, there were no borrowings under the Revolving Facility.
We are required to make scheduled quarterly principal payments equal to approximately $10 million with respect to the USD Tranche B and approximately €2 million with respect to the Euro Tranche B, in each case with the balance due thereunder on the seventh anniversary of the Effective Date. There is no scheduled amortization under the Revolving Facility. Any principal amount outstanding under the Revolving Facility is due and payable in full on the fifth anniversary of the Effective Date.
Under the Amended Credit Agreement, we are required to prepay outstanding term loans, subject to certain exceptions, with portions of our annual excess cash flow as well as with the net cash proceeds of certain of its asset sales, certain casualty and condemnation events and the incurrence or issuances of certain debt. If at any time the aggregate amount of outstanding loans, unreimbursed letter of credit drawings and undrawn letters of credit under the Revolving Facility exceeds the aggregate commitments under the Revolving Facility, we are required to repay outstanding loans and/or cash collateralize letters of credit, with no reduction of the commitment amount.
We may voluntarily prepay, and have voluntarily repaid, outstanding loans under the Credit Facilities from time to time, subject to certain conditions, without premium or penalty other than customary “breakage” costs with respect to Term SOFR or EURIBOR loans and any prepayment premium that might be applicable to repayments we make prior to July 24, 2025. Additionally, we may voluntarily reduce the unutilized portion of the commitment amount under the Revolving Facility.
All obligations under the Credit Facilities are guaranteed by certain of our wholly-owned domestic subsidiaries and are required to be guaranteed by certain of our future wholly-owned domestic subsidiaries and are secured by substantially all of our assets and the assets of such subsidiaries, subject to certain exceptions and exclusions.
Under the Amended Credit Agreement, we have the ability to incur additional incremental debt facilities in an amount up to (x) the greater of (1) $1,011 million and (2) 75% of consolidated last twelve months earnings before interest, taxes, depreciation, and amortization, plus (y) an amount equal to the sum of all voluntary prepayments of term loans under the Term Loan Facility, plus (z) an additional unlimited amount subject to pro forma compliance with certain leverage ratio tests (based on the security and priority of such incremental debt).
The Amended Credit Agreement contains customary representations and warranties, covenants and provisions relating to events of default. As of December 31, 2024, we were in compliance with all covenants under the Amended Credit Agreement. The USD Tranche B and the Euro Tranche B are not subject to financial maintenance covenants.
2025 Amendments and Prepayment of Credit Facilities
On January 24, 2025 (the “Fifth Amendment Effective Date”), we entered into the Fifth Amendment to Credit Agreement (the “Fifth Amendment”). Pursuant to the Fifth Amendment, we (i) refinanced our existing USD Tranche B loan and Euro Tranche B loan with a new $2.5 billion USD Tranche B loan and a new €596 million Euro Tranche B loan, (ii) decreased the applicable margin for the USD Tranche B from 2.25% to 2.00% with respect to Term SOFR borrowings and from 1.25% to 1.00% with respect to base rate borrowings, (iii) decreased the applicable margin for the Euro Tranche B from 2.75% to 2.50% and (iv) extended the period during which a 1.00% prepayment premium may be required if we prepay any loans under the USD Tranche B or the Euro Tranche B in connection with a repricing transaction until the date that is six months following the Fifth Amendment Effective Date. The repriced USD Tranche B loan and Euro Tranche B loan were issued without original issue discount. In connection with the execution of the Fifth Amendment, we paid customary fees and expenses to JPMorgan Chase Bank, N.A.
On January 24, 2025, concurrently with the effectiveness of the Fifth Amendment, we made a voluntary prepayment of $100 million principal amount to the USD Tranche B loan, reducing the principal from $2.6 billion to $2.5 billion.
Convertible Notes
On May 16, 2024, we completed a private offering of $1.4 billion aggregate principal amount of convertible senior notes due 2030 (the “Convertible Notes”). The Convertible Notes were sold in a private placement under a purchase agreement, dated as of May 13, 2024, entered into by and among us and Morgan Stanley & Co. LLC, J.P. Morgan Securities LLC, BofA Securities, Inc. and Mizuho Securities USA LLC, as representatives of the several initial purchasers named therein, for resale to persons reasonably believed to be qualified institutional buyers in reliance on Rule 144A under the Securities Act of 1933, as amended.
The net proceeds from the offering were approximately $1.4 billion after deducting the initial purchasers’ discounts and commissions and estimated offering expenses paid by us. We used approximately $167 million of the net proceeds from the offering to pay the cost of the capped call transactions described below. We used the remaining net proceeds from the offering to repay approximately $1.2 billion in borrowings outstanding under the USD Tranche B, together with accrued interest, as well as for general corporate purposes. As a result of the repayment, we recorded a $38 million loss on extinguishment of debt.
Indenture and the Convertible Notes
On May 16, 2024, we entered into an indenture (the “Indenture”) with respect to the Convertible Notes with U.S. Bank Trust Company, National Association, as trustee. Under the Indenture, the Convertible Notes are senior unsecured obligations of ours and bear interest at a coupon rate of 1.25% per annum, with interest payable semiannually in arrears on June 1 and December 1 of each year, beginning on December 1, 2024. The Convertible Notes will mature on June 1, 2030, unless earlier converted, redeemed or repurchased in accordance with their terms.
Subject to certain conditions, on or after June 5, 2027, we may redeem for cash all or any portion of the Convertible Notes at a redemption price equal to 100% of the principal amount of the Convertible Notes to be redeemed, plus accrued and unpaid interest to, but excluding, the redemption date, if the last reported sale price of our common stock has been at least 130% of the conversion price then in effect for at least 20 trading days (whether or not consecutive) during the period of 30 consecutive trading days ending on, and including, the trading day immediately preceding the date the notice of redemption is sent.
The conversion rate for the Convertible Notes is initially 6.4799 shares of our common stock per one thousand dollars principal amount of Notes, which is equivalent to an initial conversion price of approximately $154.32 per share. The conversion rate is subject to adjustment upon the occurrence of certain events.
Upon conversion, we will pay cash up to the aggregate principal amount of the Convertible Notes to be converted and pay or deliver, as the case may be, cash, shares of common stock or a combination of cash and shares of common stock, at our election, in respect of the remainder, if any, of our conversion obligation in excess of the aggregate principal amount of the Convertible Notes being converted. Prior to March 1, 2030, noteholders may convert all or any portion of their Convertible Notes only upon the occurrence of certain events and during certain periods, and thereafter, at any time until the second scheduled trading day immediately preceding the maturity date.
If we undergo a fundamental change (as defined in the Indenture) prior to the maturity date of the Convertible Notes, holders may require us to repurchase for cash all or any portion of their Convertible Notes at a fundamental change repurchase price equal to 100% of the principal amount of the Convertible Notes to be repurchased, plus any accrued and unpaid interest to, but excluding, the fundamental change repurchase date.
The Indenture contains customary terms and covenants, including that upon certain events of default that are occurring and continuing, either the trustee or the holders of at least 25% in aggregate principal amount of the outstanding Convertible Notes may declare 100% of the principal of, and accrued and unpaid interest, if any, on, all the Convertible Notes to be due and payable.
As of December 31, 2024, the Convertible Notes are classified as a long-term liability, net of issuances costs, on the consolidated balance sheet. The Convertible Notes were issued at par and costs associated with the issuance of the Convertible Notes are amortized to interest expense over the contractual term of the Convertible Notes. As of December 31, 2024, the effective interest rate of the Convertible Notes was 1.56%.
Capped Call Transactions
On May 13, 2024, in connection with the pricing of the Convertible Notes, and on May 14, 2024, in connection with the exercise in full by the initial purchasers of their option to purchase additional Convertible Notes, we entered into privately negotiated capped call transactions with certain of the initial purchasers of the Convertible Notes or their respective affiliates and other financial institutions. The capped call transactions are expected generally to reduce the potential dilution to our common stock upon conversion of any Convertible Notes and/or offset any cash payments that we are required to make in excess of the principal amount of any converted Convertible Notes, as the case may be, with such reduction and/or offset subject to a cap initially equal to $237.42 per share (which represents a premium of 100% over the last reported sale price of $118.71 per share of our common stock on The Nasdaq Global Select Market on May 13, 2024), and is subject to customary adjustments under the terms of the capped call transactions.
Lines of Credit and Borrowing Arrangements
Certain of our Japanese subsidiaries have lines of credit and a financing facility with various financial institutions, many of which generally expire and are renewed at three-month intervals with the remaining having no expiration date. The lines of credit and financing facility provided for aggregate borrowings as of December 31, 2024 and December 31, 2023 of up to an equivalent of $19 million and $14 million, respectively. There were no borrowings outstanding under these arrangements at December 31, 2024 or December 31, 2023.
Derivatives
We enter into derivative instruments for risk management purposes only, including derivatives designated as hedging instruments and those utilized as economic hedges. We operate internationally, and in the normal course of business, are exposed to fluctuations in interest rates and foreign exchange rates. These fluctuations can increase the costs of financing, investing, and operating the business. We have used derivative instruments, such as foreign exchange forward contracts, options, and net investment hedges, to manage certain foreign currency exposure, and interest rate swaps and caps to manage certain interest rate exposure. We do not enter into derivative instruments for trading or speculative purposes.
By nature, all financial instruments involve market and credit risks. We enter into derivative instruments with major investment grade financial institutions and no collateral is required. We have policies to monitor the credit risk of these counterparties. While there can be no assurance, we do not anticipate any material non-performance by any of these counterparties.
Interest Rate Swap and Interest Rate Cap Agreements
We have various interest rate swap agreements maturing through January 31, 2029 that exchange a one-month forward-looking term rate based on Term SOFR paid on the outstanding balance of our USD Term Loan Facility, to a fixed rate. The notional value of the agreements was $2,600 million and $2,300 million as of December 31, 2024 and December 31, 2023, respectively. We acquired USD London Interbank Offered Rate (“USD LIBOR”) based interest rate cap agreements as a result of the Atotech Acquisition and had utilized these agreements to offset Term SOFR on our Term Loan Facility. The notional value of the agreements was $700 million as of December 31, 2023 and expired on January 31, 2024. Effective June 30, 2023, our USD LIBOR based interest rate caps were converted to Term SOFR. We also had two USD LIBOR based swaps that were converted to Term SOFR, effective June 30, 2023. The conversions from USD LIBOR to Term SOFR did not have a material impact on our results of operations.
The interest rate swaps are recorded at fair value on the consolidated balance sheets and changes in the fair value are recognized in OCI. To the extent these arrangements are no longer effective hedges, the hedging relationship will be discontinued and changes in the fair value of the hedging instruments from the last assessment period that were effective up to the current period will be recorded immediately in earnings. Amounts previously recorded in OCI will remain in OCI and will be reclassified to earnings when the interest payments impact consolidated earnings. If we determine that the interest payments are unlikely to occur, amounts previously recorded in OCI will be reclassified to earnings immediately. Changes in the fair value of interest rate caps were recorded immediately in earnings, as we did not designate these instruments as hedges and therefore these instruments did not qualify for hedge accounting. There was a benefit on these derivatives of $3 million in 2023 and there was no net impact on these derivatives in 2024. The cash flows resulting from interest rate agreements are classified in cash flows from operating activities. We expect a gain of approximately $17 million to be reclassified from accumulated OCI into interest expense during the twelve months ending December 31, 2025 related to interest rate swaps.
Foreign Exchange Forward Contracts
We hedge a portion of our forecasted foreign currency denominated intercompany sales of inventory, over a maximum period of twenty-four months, using foreign exchange forward contracts accounted for as cash-flow hedges. To the extent these derivatives are effective in offsetting the variability of the hedged cash flows, and otherwise meet the hedge accounting criteria, changes in the derivatives’ fair value are not included in current earnings but are included in accumulated OCI in stockholders’ equity. These changes in fair value will subsequently be reclassified into earnings, as applicable, when the forecasted transaction occurs. To the extent that a previously designated hedging transaction is no longer an effective hedge, any ineffectiveness measured in the hedging relationship is recorded immediately in earnings in the period it occurs. The cash flows resulting from foreign exchange forward contracts are classified in the consolidated statements of cash flows as part of cash flows from operating activities.
We also enter into foreign exchange forward contracts to hedge against certain monetary asset and liability accounts on the consolidated balance sheet to mitigate the risk associated with certain foreign currency transactions in the ordinary course of business. These derivatives are not designated as cash flow hedging instruments and gains or losses from these derivatives are recorded immediately in other (income) expense, net. The net foreign exchange gain on these derivatives was $1 million in 2024, compared to a loss of $4 million in 2023. The cash flows resulting from foreign exchange forward contracts are classified in our consolidated statements of cash flows as part of cash flows from operating activities.
We had foreign exchange forward contracts designated as cash flow hedges with notional amounts totaling $74 million and $178 million outstanding at December 31, 2024 and at December 31, 2023, respectively, with the Japanese yen and the South Korean won being the largest notional contracts in both periods. We had foreign exchange forward contracts not designated as hedging instruments with notional amounts totaling $154 million and $155 million outstanding at December 31, 2024 and at December 31, 2023, respectively. The British pound and Chinese yuan were the largest notional contracts for 2024, and the Euro and British pound were the largest notional contracts for 2023 for balance sheet hedges not designated as a hedging instrument.
As of December 31, 2024, the unrealized gain that will be reclassified from accumulated OCI to cost of revenues over the next twelve months is approximately $7 million. Gains and losses on foreign exchange forward contracts that qualify for hedge accounting are classified in cost of products in 2024 and 2023 and totaled gains of $6 million and $7 million, respectively. There were no ineffective portions of the derivatives recorded in 2024 and 2023.
Net Investment Hedge
We have designated certain Euro-denominated debt as a net investment hedge to hedge a portion of our net investments in certain of our entities with functional currencies denominated in the Euro. As of December 31, 2024, we designated as a net investment hedge €596 million in aggregate principal amount of our Euro Tranche B loan. For these nonderivative instruments, we defer recognition of the foreign currency remeasurement gains and losses within the foreign currency translation adjustment component of OCI.
Contractual Obligations
As of December 31, 2024, we are a party to purchase commitments for certain inventory components and other equipment and services used in our normal operations totaling approximately $544 million. The majority of these purchase commitments covered by these arrangements are for periods of less than one year.
In addition, we have various operating leases for real estate and non-real estate items. The non-real estate leases are mainly comprised of automobiles but also include office equipment and other lower-valued items. We also have a small number of finance leases for real estate.
Future payments related to operating and finance leases are as follows:
| | | | | | | | |
(Dollars in millions) | | Operating | | | Finance | |
Year Ending December 31, | | Leases | | | Leases | |
2025 | | | 33 | | | | 7 | |
2026 | | | 30 | | | | 5 | |
2027 | | | 26 | | | | 3 | |
2028 | | | 19 | | | | 2 | |
2029 | | | 18 | | | | 2 | |
Thereafter | | | 133 | | | | 19 | |
Total lease payments | | | 259 | | | | 38 | |
Less: imputed interest | | | 46 | | | | 9 | |
Total lease liabilities | | $ | 213 | | | $ | 29 | |
Contractual maturities of our debt obligations as of December 31, 2024 are as follows:
| | | | |
(Dollars in millions) | | | |
Year | | Amount | |
2025 | | $ | 50 | |
2026 | | | 50 | |
2027 | | | 50 | |
2028 | | | 50 | |
2029 | | | 3,049 | |
Thereafter | | | 1,400 | |
We have a number of defined benefit pension plans, which cover some of our employees outside the United States. As of December 31, 2024, our estimated benefit payments over the next 10 years amount to $80 million. The majority of the benefit payments covered by these arrangements occurs after 2029.
Recent Accounting Pronouncements
Income Taxes (Topic 740): Improvements to Income Tax Disclosures
In December 2023, the FASB issued ASU No. 2023-09, Income Taxes (Topic 740): Improvements to Income Tax Disclosures, which focuses on the rate reconciliation and income taxes paid. ASU No. 2023-09 requires a public business entity (“PBE”) to disclose, on an annual basis, a tabular rate reconciliation using both percentages and currency amounts, broken out into specified categories with certain reconciling items further broken out by nature and jurisdiction to the extent those items exceed a specified threshold. In addition, all entities are required to disclose income taxes paid, net of refunds received disaggregated by federal, state/local, and foreign and by jurisdiction if the amount is at least 5% of total income tax payments, net of refunds received. For PBEs, the new standard is effective for annual periods beginning after December 15, 2024, with early adoption permitted. An entity may apply the amendments in this ASU prospectively by providing the revised disclosures for the period ending December 31, 2025 and continuing to provide the pre-ASU disclosures for the prior periods or may apply the amendments retrospectively by providing the revised disclosures for all periods presented. We are currently evaluating the impact on the consolidated financial statement disclosures; however, adoption will not impact our consolidated balance sheets, cash flows or income statements.
Income Statement—Reporting Comprehensive Income—Expense Disaggregation Disclosures (Subtopic 220-40): Disaggregation of Income Statement Expenses
In November 2024, the FASB issued ASU No. 2024-03, Income Statement—Reporting Comprehensive Income—Expense Disaggregation Disclosures (Subtopic 220-40): Disaggregation of Income Statement Expenses, which requires public companies to disclose, in interim and annual reporting periods, additional information about certain expenses in the notes to financial statements. The amendments in this ASU are effective for annual reporting periods beginning after December 15, 2026, and interim reporting periods beginning after December 15, 2027, with early adoption permitted. We are currently evaluating the impact on the consolidated financial statement disclosures; however, adoption will not impact our consolidated balance sheets, cash flows or income statements.
Item 7A. Quantitative and Qualitative Disclosures about Market Risk
Market Risk and Sensitivity Analysis
Our primary exposures to market risks include fluctuations in interest rates on our Term Loan Facility, as defined and as described further in Item 7 of this Annual Report on Form 10-K, as well as fluctuations in foreign currency exchange rates.
Foreign Exchange Rate Risk
Our currency risk consists primarily of foreign currency denominated firm commitments, forecasted foreign currency denominated intercompany and third-party transactions, and net investments in certain subsidiaries. We use both nonderivative and derivative instruments to manage our earnings and cash flow exposure to changes in currency exchange rates.
We mainly enter into foreign exchange forward contracts to reduce currency exposure arising from intercompany sales of inventory. We also enter into foreign exchange forward contracts to reduce foreign exchange risks arising from the change in fair value of certain foreign currency denominated assets and liabilities.
We had foreign exchange forward contracts designated as cash flow hedges with notional amounts totaling $74 million and $178 million outstanding at December 31, 2024 and December 31, 2023, respectively, with the Japanese yen and the South Korean won being the largest notional contracts in both periods. We had foreign exchange forward contracts not designated as hedging instruments with notional amounts totaling $154 million and $155 million outstanding at December 31, 2024 and December 31, 2023, respectively. For 2024, the British pound and Chinese yuan were the largest notional contracts and for 2023 the Euro and British pound were the largest notional contracts for balance sheet hedges not designated as a hedging instrument. The potential fair value loss for a hypothetical 10% adverse change in the currency exchange rate on our foreign exchange forward contracts at December 31, 2024 and 2023 would be immaterial.
We designated certain Euro-denominated debt as a net investment hedge to hedge a portion of our net investments in certain of our entities with functional currencies denominated in the Euro. As of December 31, 2024, we designated as a net investment hedge €596 million in aggregate principal amount of our Euro Tranche B loan. For these nonderivative instruments, we defer recognition of the foreign currency remeasurement gains and losses within the foreign currency translation adjustment component of OCI.
Interest Rate Risk
We hold our cash and cash equivalents for working capital purposes. Some of the cash equivalents are subject to market risk. This means that a change in prevailing interest rates may cause the principal amount of such cash equivalents to fluctuate. To minimize this risk, we maintain a portion of our portfolio of cash and cash equivalents in money market funds. Due to the short-term nature of these instruments, we believe that we do not have any material exposure to changes in the fair value of our cash equivalents as a result of changes in interest rates. Declines in interest rates, however, would reduce future interest income. The effect of a hypothetical 10% increase or decrease in overall interest rates would not have had a material impact on our operating results or the total fair value of our portfolio.
We have various interest rate swap agreements as described further in “Management's Discussion and Analysis of Financial Condition and Results of Operations—Critical Accounting Policies and Estimates—Derivatives” that exchange the one-month Term SOFR interest rate to a fixed rate in order to manage the exposure to interest rate fluctuations associated with the variable Term SOFR interest rate paid on the outstanding balance of the Term Loan Facility.
We are exposed to market risks related to fluctuations in interest rates related to our Term Loan Facility. As of December 31, 2024, the principal outstanding on our Term Loan Facility was $3.2 billion, at a weighted average interest rate of 6.4%. A 10% increase or decrease in the weighted average interest rate as of December 31, 2024 would increase or decrease annual interest expense by approximately $13 million, excluding the effect of our interest rate hedges. Because the notional amount of our interest rate hedges as of December 31, 2024 equaled approximately 91% of the principal outstanding on our Term Loan Facility, the resulting net impact to interest expense would be approximately $4 million.
Item 8. Financial Statements and Supplementary Data
Report of Independent Registered Public Accounting Firm
To the Board of Directors and Stockholders of MKS Instruments, Inc.
Opinions on the Financial Statements and Internal Control over Financial Reporting
We have audited the accompanying consolidated balance sheets of MKS Instruments, Inc. and its subsidiaries (the "Company") as of December 31, 2024 and 2023, and the related consolidated statements of operations and comprehensive income (loss), of stockholders’ equity and of cash flows for each of the three years in the period ended December 31, 2024, including the related notes and schedule of valuation and qualifying accounts for each of the three years in the period ended December 31, 2024 appearing after Item 16 (collectively referred to as the "consolidated financial statements"). We also have audited the Company's internal control over financial reporting as of December 31, 2024, based on criteria established in Internal Control - Integrated Framework (2013) issued by the Committee of Sponsoring Organizations of the Treadway Commission (COSO).
In our opinion, the consolidated financial statements referred to above present fairly, in all material respects, the financial position of the Company as of December 31, 2024 and 2023, and the results of its operations and its cash flows for each of the three years in the period ended December 31, 2024 in conformity with accounting principles generally accepted in the United States of America. Also in our opinion, the Company maintained, in all material respects, effective internal control over financial reporting as of December 31, 2024, based on criteria established in Internal Control - Integrated Framework (2013) issued by the COSO.
Basis for Opinions
The Company's management is responsible for these consolidated financial statements, for maintaining effective internal control over financial reporting, and for its assessment of the effectiveness of internal control over financial reporting, included in Management’s Report on Internal Control over Financial Reporting appearing under Item 9A. Our responsibility is to express opinions on the Company’s consolidated financial statements and on the Company's internal control over financial reporting based on our audits. We are a public accounting firm registered with the Public Company Accounting Oversight Board (United States) (PCAOB) and are required to be independent with respect to the Company in accordance with the U.S. federal securities laws and the applicable rules and regulations of the Securities and Exchange Commission and the PCAOB.
We conducted our audits in accordance with the standards of the PCAOB. Those standards require that we plan and perform the audits to obtain reasonable assurance about whether the consolidated financial statements are free of material misstatement, whether due to error or fraud, and whether effective internal control over financial reporting was maintained in all material respects.
Our audits of the consolidated financial statements included performing procedures to assess the risks of material misstatement of the consolidated financial statements, whether due to error or fraud, and performing procedures that respond to those risks. Such procedures included examining, on a test basis, evidence regarding the amounts and disclosures in the consolidated financial statements. Our audits also included evaluating the accounting principles used and significant estimates made by management, as well as evaluating the overall presentation of the consolidated financial statements. Our audit of internal control over financial reporting included obtaining an understanding of internal control over financial reporting, assessing the risk that a material weakness exists, and testing and evaluating the design and operating effectiveness of internal control based on the assessed risk. Our audits also included performing such other procedures as we considered necessary in the circumstances. We believe that our audits provide a reasonable basis for our opinions.
Definition and Limitations of Internal Control over Financial Reporting
A company’s internal control over financial reporting is a process designed to provide reasonable assurance regarding the reliability of financial reporting and the preparation of financial statements for external purposes in accordance with generally accepted accounting principles. A company’s internal control over financial reporting includes those policies and procedures that (i) pertain to the maintenance of records that, in reasonable detail, accurately and fairly reflect the transactions and dispositions of the assets of the company; (ii) provide reasonable assurance that transactions are recorded as necessary to permit preparation of financial statements in accordance with generally accepted accounting principles, and that receipts and expenditures of the company are being made only in accordance with authorizations of management and directors of the company; and (iii) provide reasonable assurance regarding prevention or timely detection of unauthorized acquisition, use, or disposition of the company’s assets that could have a material effect on the financial statements.
Because of its inherent limitations, internal control over financial reporting may not prevent or detect misstatements. Also, projections of any evaluation of effectiveness to future periods are subject to the risk that controls may become inadequate because of changes in conditions, or that the degree of compliance with the policies or procedures may deteriorate.
Critical Audit Matters
The critical audit matter communicated below is a matter arising from the current period audit of the consolidated financial statements that was communicated or required to be communicated to the audit committee and that (i) relates to accounts or disclosures that are material to the consolidated financial statements and (ii) involved our especially challenging, subjective, or complex judgments. The communication of critical audit matters does not alter in any way our opinion on the consolidated financial statements, taken as a whole, and we are not, by communicating the critical audit matter below, providing a separate opinion on the critical audit matter or on the accounts or disclosures to which it relates.
Revenue Recognition – Certain Product Revenue
As described in Note 3 to the consolidated financial statements, revenue is recognized when or as obligations under the terms of a contract with a customer have been satisfied by the Company and control has transferred to the customer. The majority of the Company’s performance obligations, and associated revenue, are transferred to customers at a point in time, generally upon shipment of a product to the customer or receipt of the product by the customer and without significant judgments. Revenue is measured as the amount of consideration the Company expects to receive in exchange for transferring goods or providing services. The Company’s total net product revenue was $3.1 billion for the year ended December 31, 2024, of which a majority relates to certain product revenue.
The principal consideration for our determination that performing procedures relating to revenue recognition for certain product revenue is a critical audit matter is a high degree of auditor effort in performing procedures related to the Company’s revenue recognition for certain product revenue.
Addressing the matter involved performing procedures and evaluating audit evidence in connection with forming our overall opinion on the consolidated financial statements. These procedures included testing the effectiveness of controls relating to the revenue recognition process, including controls over the recording of revenue for certain product revenue at the consideration once control passes to the customer. These procedures also included, among others (i) testing revenue recognized for a sample of certain product revenue transactions by obtaining and inspecting source documents, such as purchase orders, invoices, and proof of shipment or delivery; (ii) testing revenue recognized for a sample of certain product revenue transactions before and after period end by obtaining and inspecting source documents, such as purchase orders, invoices and proof of shipment or delivery; and (iii) confirming a sample of outstanding customer invoice balances as of December 31, 2024 and, for confirmations not returned, obtaining and inspecting source documents, such as purchase orders, invoices, proof of shipment or delivery, and subsequent cash receipts
/s/ PricewaterhouseCoopers LLP
Boston, Massachusetts
February 25, 2025
We have served as the Company’s auditor since 1981.
MKS Instruments, Inc.
Consolidated Balance Sheets
(in millions, except per share data)
| | | | | | | | |
| | December 31, | |
| | 2024 | | | 2023 | |
ASSETS | | | | | | |
Current assets: | | | | | | |
Cash and cash equivalents | | $ | 714 | | | $ | 875 | |
Trade accounts receivable, net of allowance for doubtful accounts of
$5 and $6 at December 31, 2024 and 2023, respectively | | | 615 | | | | 603 | |
Inventories | | | 893 | | | | 991 | |
Other current assets | | | 252 | | | | 227 | |
Total current assets | | | 2,474 | | | | 2,696 | |
| | | | | | |
Property, plant and equipment, net | | | 771 | | | | 784 | |
Right-of-use assets | | | 238 | | | | 225 | |
Goodwill | | | 2,479 | | | | 2,554 | |
Intangible assets, net | | | 2,272 | | | | 2,619 | |
Other assets | | | 356 | | | | 240 | |
Total assets | | $ | 8,590 | | | $ | 9,118 | |
| | | | | | |
LIABILITIES AND STOCKHOLDERS’ EQUITY | | | | | | |
Current liabilities: | | | | | | |
Short-term debt | | $ | 50 | | | $ | 93 | |
Accounts payable | | | 341 | | | | 327 | |
Other current liabilities | | | 384 | | | | 428 | |
Total current liabilities | | | 775 | | | | 848 | |
| | | | | | |
Long-term debt, net | | | 4,488 | | | | 4,696 | |
Non-current deferred taxes | | | 504 | | | | 640 | |
Non-current accrued compensation | | | 141 | | | | 151 | |
Non-current lease liabilities | | | 211 | | | | 205 | |
Other non-current liabilities | | | 149 | | | | 106 | |
Total liabilities | | | 6,268 | | | | 6,646 | |
Commitments and contingencies (Note 23) | | | | | | |
Stockholders’ equity: | | | | | | |
Preferred stock, $0.01 par value, 2 shares authorized; no shares issued
and outstanding | | | — | | | | — | |
Common stock, no par value, 200 shares authorized; 67.4
and 66.9 shares issued and outstanding at December
31, 2024 and 2023, respectively | | | — | | | | — | |
Additional paid-in capital | | | 2,067 | | | | 2,195 | |
Retained earnings | | | 503 | | | | 373 | |
Accumulated other comprehensive loss | | | (248 | ) | | | (96 | ) |
Total stockholders’ equity | | | 2,322 | | | | 2,472 | |
Total liabilities and stockholders' equity | | $ | 8,590 | | | $ | 9,118 | |
The accompanying notes are an integral part of the Consolidated Financial Statements.
MKS Instruments, Inc.
Consolidated Statements of Operations and Comprehensive Income (Loss)
(in millions, except per share data)
| | | | | | | | | | | | |
| | Years Ended December 31, | |
| | 2024 | | | 2023 | | | 2022 | |
Net revenues: | | | | | | | | | |
Products | | $ | 3,124 | | | $ | 3,200 | | | $ | 3,119 | |
Services | | | 462 | | | | 422 | | | | 428 | |
Total net revenues | | | 3,586 | | | | 3,622 | | | | 3,547 | |
Cost of revenues: | | | | | | | | | |
Products | | | 1,662 | | | | 1,748 | | | | 1,774 | |
Services | | | 216 | | | | 232 | | | | 226 | |
Total cost of revenues (exclusive of amortization shown separately
below) | | | 1,878 | | | | 1,980 | | | | 2,000 | |
Gross profit | | | 1,708 | | | | 1,642 | | | | 1,547 | |
Research and development | | | 271 | | | | 288 | | | | 241 | |
Selling, general and administrative | | | 674 | | | | 675 | | | | 488 | |
Acquisition and integration costs | | | 9 | | | | 16 | | | | 52 | |
Restructuring and other | | | 6 | | | | 20 | | | | 10 | |
Fees and expenses related to repricing of Term Loan Facility | | | 5 | | | | 2 | | | | — | |
Amortization of intangible assets | | | 245 | | | | 295 | | | | 146 | |
Goodwill and intangible asset impairments | | | — | | | | 1,902 | | | | — | |
Gain on sale of long-lived assets | | | — | | | | (2 | ) | | | (7 | ) |
Income (loss) from operations | | | 498 | | | | (1,554 | ) | | | 617 | |
Interest income | | | (21 | ) | | | (17 | ) | | | (4 | ) |
Interest expense | | | 284 | | | | 356 | | | | 177 | |
Loss on extinguishment of debt | | | 57 | | | | 8 | | | | — | |
Other (income) expense, net | | | (2 | ) | | | 27 | | | | 11 | |
Income (loss) before income taxes | | | 180 | | | | (1,928 | ) | | | 433 | |
(Benefit) provision for income taxes | | | (10 | ) | | | (87 | ) | | | 100 | |
Net income (loss) | | $ | 190 | | | $ | (1,841 | ) | | $ | 333 | |
Other comprehensive income (loss), net of tax: | | | | | | | | | |
Changes in value of financial instruments designated as cash flow
hedges | | $ | (1 | ) | | $ | (24 | ) | | $ | 50 | |
Foreign currency translation adjustments | | | (213 | ) | | | (83 | ) | | | 18 | |
Change in net investment hedge | | | 36 | | | | (25 | ) | | | — | |
Unrecognized pension gain (loss) | | | 3 | | | | (9 | ) | | | 12 | |
Unrealized loss on investments | | | 23 | | | | (23 | ) | | | — | |
Total comprehensive income (loss) | | $ | 38 | | | $ | (2,005 | ) | | $ | 413 | |
Net income (loss) per share: | | | | | | | | | |
Basic | | $ | 2.82 | | | $ | (27.54 | ) | | $ | 5.57 | |
Diluted | | $ | 2.81 | | | $ | (27.54 | ) | | $ | 5.56 | |
Weighted average common shares outstanding: | | | | | | | | | |
Basic | | | 67.3 | | | | 66.8 | | | | 59.7 | |
Diluted | | | 67.6 | | | | 66.8 | | | | 59.9 | |
The accompanying notes are an integral part of the Consolidated Financial Statements.
MKS Instruments, Inc.
Consolidated Statements of Stockholders’ Equity
(in millions, except per share data)
| | | | | | | | | | | | | | | | | | | | | | | | |
| | | | | | | | | | | | | | Accumulated | | | | |
| | | | | | | | Additional | | | | | | Other | | | Total | |
| | Common Stock | | | Paid-In | | | Retained | | | Comprehensive | | | Stockholders' | |
| | Shares | | | Amount | | | Capital | | | Earnings | | | (Loss) Income | | | Equity | |
Balance at December 31, 2021 | | | 55.5 | | | $ | 0.1 | | | $ | 907 | | | $ | 1,991 | | | $ | (11 | ) | | $ | 2,887 | |
Net issuance under stock-based plans | | | 0.4 | | | | | | | 5 | | | | | | | | | | 5 | |
Shares issued for Atotech Acquisition | | | 10.7 | | | | | | | 1,186 | | | | | | | | | | 1,186 | |
Stock-based compensation | | | | | | | | | 45 | | | | | | | | | | 45 | |
Cash dividend ($0.88 per common share) | | | | | | | | | | | | (52 | ) | | | | | | (52 | ) |
Comprehensive income (net of tax): | | | | | | | | | | | | | | | | | | — | |
Net income | | | | | | | | | | | | 333 | | | | | | | 333 | |
Other comprehensive income | | | | | | | | | | | | | | | 80 | | | | 80 | |
Balance at December 31, 2022 | | | 66.6 | | | | 0.1 | | | | 2,142 | | | | 2,272 | | | | 69 | | | | 4,483 | |
Net issuance under stock-based plans | | | 0.3 | | | | | | | (1 | ) | | | | | | | | | (1 | ) |
Stock-based compensation | | | | | | | | | 54 | | | | | | | | | | 54 | |
Cash dividend ($0.88 per common share) | | | | | | | | | | | | (59 | ) | | | | | | (59 | ) |
Comprehensive loss (net of tax): | | | | | | | | | | | | | | | | | | — | |
Net loss | | | | | | | | | | | | (1,841 | ) | | | | | | (1,841 | ) |
Other comprehensive loss | | | | | | | | | | | | | | | (164 | ) | | | (164 | ) |
Balance at December 31, 2023 | | | 66.9 | | | | 0.1 | | | | 2,195 | | | | 373 | | | | (96 | ) | | | 2,472 | |
Net issuance under stock-based plans | | | 0.5 | | | | | | | (9 | ) | | | | | | | | | (9 | ) |
Stock-based compensation | | | | | | | | | 48 | | | | | | | | | | 48 | |
Purchase of capped calls related to Convertible Notes | | | | | | | | | (167 | ) | | | | | | | | | (167 | ) |
Cash dividend ($0.88 per common share) | | | | | | | | | | | | (59 | ) | | | | | | (59 | ) |
Comprehensive income (loss) (net of tax): | | | | | | | | | | | | | | | | | | — | |
Net income | | | | | | | | | | | | 190 | | | | | | | 190 | |
Other comprehensive loss | | | | | | | | | | | | | | | (152 | ) | | | (152 | ) |
Balance at December 31, 2024 | | | 67.4 | | | $ | 0.1 | | | $ | 2,067 | | | $ | 503 | | | $ | (248 | ) | | $ | 2,322 | |
The accompanying notes are an integral part of the Consolidated Financial Statements.
MKS Instruments, Inc.
Consolidated Statements of Cash Flows
(in millions)
| | | | | | | | | | | | |
| | Years Ended December 31, | |
| | 2024 | | | 2023 | | | 2022 | |
Cash flows from operating activities: | | | | | | | | | |
Net income (loss) | | $ | 190 | | | $ | (1,841 | ) | | $ | 333 | |
Adjustments to reconcile net income (loss) to net cash provided by operating activities: | | | | | | | | | |
Depreciation and amortization | | | 348 | | | | 397 | | | | 216 | |
Amortization of inventory step-up to fair value | | | — | | | | — | | | | 52 | |
Goodwill and intangible asset impairments | | | — | | | | 1,902 | | | | — | |
Unrealized loss (gain) on foreign currency and derivative instruments | | | 13 | | | | 32 | | | | 13 | |
Amortization of debt issuance costs and original issue discount | | | 30 | | | | 33 | | | | 56 | |
Loss on extinguishment of debt | | | 57 | | | | 8 | | | | — | |
Gain on sale of long-lived assets | | | — | | | | (2 | ) | | | (7 | ) |
Stock-based compensation | | | 48 | | | | 54 | | | | 45 | |
Provision for excess and obsolete inventory | | | 56 | | | | 64 | | | | 21 | |
Deferred income taxes | | | (226 | ) | | | (234 | ) | | | (46 | ) |
Other | | | 8 | | | | 5 | | | | 3 | |
Changes in operating assets and liabilities, net of acquired assets and liabilities: | | | | | | | | | |
Trade accounts receivable | | | (36 | ) | | | 114 | | | | (4 | ) |
Inventories | | | 20 | | | | (76 | ) | | | (236 | ) |
Other current and non-current assets | | | 25 | | | | 50 | | | | 28 | |
Accounts payable | | | 21 | | | | (99 | ) | | | 61 | |
Current and non-current accrued compensation | | | (32 | ) | | | (5 | ) | | | (31 | ) |
Income taxes payable | | | 49 | | | | (64 | ) | | | 19 | |
Other current and non-current liabilities | | | (43 | ) | | | (19 | ) | | | 6 | |
Net cash provided by operating activities | | | 528 | | | | 319 | | | | 529 | |
Cash flows from investing activities: | | | | | | | | | |
Acquisitions of businesses, net of cash acquired | | | — | | | | — | | | | (4,473 | ) |
Purchases of investments | | | — | | | | — | | | | (1 | ) |
Maturities of investments | | | — | | | | — | | | | 77 | |
Proceeds from sale of long-lived assets | | | 1 | | | | 3 | | | | 9 | |
Purchases of property, plant and equipment | | | (118 | ) | | | (87 | ) | | | (164 | ) |
Net cash used in investing activities | | | (117 | ) | | | (84 | ) | | | (4,552 | ) |
Cash flows from financing activities: | | | | | | | | | |
Proceeds from borrowing | | | 2,161 | | | | 216 | | | | 5,237 | |
Payments of borrowings | | | (2,427 | ) | | | (403 | ) | | | (962 | ) |
Purchase of capped calls related to Convertible Notes | | | (167 | ) | | | — | | | | — | |
Payments of deferred financing fees | | | (33 | ) | | | (9 | ) | | | (249 | ) |
Dividend payments | | | (59 | ) | | | (59 | ) | | | (52 | ) |
Net payments related to employee stock awards | | | (9 | ) | | | (1 | ) | | | (1 | ) |
Other financing activities | | | (15 | ) | | | (3 | ) | | | (2 | ) |
Net cash (used in) provided by financing activities | | | (549 | ) | | | (259 | ) | | | 3,971 | |
Effect of exchange rate changes on cash and cash equivalents | | | (23 | ) | | | (10 | ) | | | (5 | ) |
Decrease in cash and cash equivalents | | | (161 | ) | | | (34 | ) |
| | (57 | ) |
Cash and cash equivalents at beginning of period | | | 875 | | | | 909 | |
| | 966 | |
Cash and cash equivalents at end of period | | $ | 714 | | | $ | 875 | |
| $ | 909 | |
Supplemental disclosure of cash flow information: | | | | | | | | | |
Cash paid during the period for: | | | | | | | | | |
Interest | | $ | 268 | | | $ | 305 | | | $ | 110 | |
Income taxes | | $ | 145 | | | $ | 180 | | | $ | 133 | |
The accompanying notes are an integral part of the Consolidated Financial Statements.
MKS INSTRUMENTS, INC.
NOTES TO CONSOLIDATED FINANCIAL STATEMENTS
(in millions, except per share data)
MKS Instruments, Inc. (“MKS” or the “Company”) was founded in 1961 and enables technologies that transform the world. The Company delivers foundational technology solutions to leading edge semiconductor manufacturing, electronics and packaging, and specialty industrial applications. The Company applies its broad science and engineering capabilities to create instruments, subsystems, systems, process control solutions and specialty chemicals technology that improve process performance, optimize productivity and enable unique innovations for many of the world’s leading technology and industrial companies. The Company’s solutions are critical to addressing the challenges of miniaturization and complexity in advanced device manufacturing by enabling increased power, speed, feature enhancement and optimized connectivity. These solutions are also critical to addressing ever-increasing performance requirements across a wide array of specialty industrial applications.
The terms “MKS” and the “Company” refer to MKS Instruments, Inc. and its subsidiaries. All intercompany accounts and transactions have been eliminated in consolidation. Certain prior period amounts have been reclassified to conform to current period presentation.
The Consolidated Financial Statements have been prepared in accordance with accounting principles generally accepted in the United States of America (“U.S. GAAP”). The preparation of these financial statements requires management to make estimates and assumptions that affect the reported amounts of assets and liabilities and the disclosure of contingent liabilities at the date of the financial statements and the reported amounts of revenues and expenses during the reporting period. On an ongoing basis, management evaluates its estimates and judgments, including those related to revenue recognition, inventory valuation, warranty costs, pension plan valuations, stock-based compensation expense, intangible assets, goodwill, long-lived assets, income taxes and derivatives. Management bases its estimates and judgments on historical experience and on various other factors that are believed to be reasonable under the circumstances, the results of which form the basis for making judgments about the carrying values of assets and liabilities that are not readily apparent from other sources. Actual results may differ from these estimates under different assumptions or conditions. As a result of rounding, there may be immaterial differences in amounts presented and certain calculations may not sum to the total number expressed in each category or tie to a corresponding schedule.
The Company has three reportable segments: the Vacuum Solutions Division (“VSD”), the Photonics Solutions Division (“PSD”) and the Materials Solutions Division (“MSD”) as described in Note 21. During the quarter ended March 31, 2024, the Company moved its Optical Sensing Products (“OSP”) product line from the PSD segment to the VSD segment. The purpose of this realignment was to group the OSP products with related semiconductor products within the VSD segment. Prior periods have been recast to reflect this change.
(3)Summary of Significant Accounting Policies
Revenue from Contracts with Customers
The Company accounts for revenue using Accounting Standards Codification (“ASC”) 606, “Revenue from Contracts with Customers” (“ASC Topic 606”). The Company applies ASC Topic 606 using the following steps:
•Identify the contract with a customer
•Identify the performance obligations in the contract
•Determine the transaction price
•Allocate the transaction price to performance obligations in the contract
•Recognize revenue when or as the Company satisfies a performance obligation
Revenue is recognized when or as obligations under the terms of a contract with a customer have been satisfied and control has transferred to the customer. The majority of the Company’s performance obligations, and associated revenue,
MKS INSTRUMENTS, INC.
NOTES TO CONSOLIDATED FINANCIAL STATEMENTS
(in millions, except per share data)
are transferred to customers at a point in time, generally upon shipment of a product to the customer or receipt of the product by the customer and without significant judgments. The Company recognizes revenue over time for contracts relating to the manufacturing, modifications and retrofits of its plating equipment, as the equipment is built to customer specification, and the Company has an enforceable right to payment for the performance completed to date. For these sales, the Company uses the cost-to-cost input method to measure progress. In cases, where cost-to-cost is not proportionate to its progress in satisfying the performance obligation because of uninstalled materials, the Company adjusts the measure of progress and recognizes revenue to the extent of cost incurred to satisfy the performance obligation under the contract. Revenue from customized products with no alternative future use to the Company, and that have an enforceable right to payment for performance completed to date, is also recorded over time. The Company considers this to be a faithful depiction of the transfer to the customer of revenue over time as the work is performed or service is delivered. Adjustments for custom products were not material for 2024, 2023 or 2022.
Installation services, other than those related to the Company’s plating equipment, are not significant, are usually completed in a short period of time and, therefore, are recorded at a point in time when the installation services are completed, rather than over time, as they are not material. Extended warranty, service contracts, and repair services, which are transferred to the customer over time, are recorded as revenue as the services are performed. For repair services, the Company makes an accrual at each quarter end based upon historical repair times within its product groups to record revenue based upon the estimated number of days completed to date, which is consistent with ratable recognition.
Revenue is measured as the amount of consideration the Company expects to receive in exchange for transferring goods or providing services. Performance obligations promised in a contract are identified based on the products or services that will be transferred to the customer that are both capable of being distinct, whereby the customer can benefit from the product or service either on its own or together with other resources that are readily available from third parties or from the Company, and are distinct in the context of the contract, whereby the transfer of the product or service is separately identifiable from other promises in the contract. Sales tax, value add tax, and other taxes the Company collects concurrent with revenue-producing activities are excluded from revenue. The Company’s normal payment terms are generally 30 to 60 days but vary by the type and location of its customers and the products or services offered. The time between invoicing and when payment is due is not significant. For certain products and services and customer types, the Company requires payment before the products are delivered to, or the services are performed for, the customer. None of the Company’s contracts in each of the periods presented contained a significant financing component.
Contracts with Multiple Performance Obligations
The Company periodically enters into contracts with its customers in which a customer may purchase a combination of goods and or services, such as products with installation services or extended warranties. These contracts include multiple deliverables that the Company evaluates to determine if the deliverables are separate performance obligations. Once the Company determines the performance obligations, the Company then determines the transaction price, which includes estimating the amount of variable consideration to be included in the transaction price, if any. To the extent the transaction price includes variable consideration, the Company estimates the amount of variable consideration that should be included in the transaction price utilizing either the expected value method or the most likely amount method, depending on the method the Company expects to better predict the amount of consideration to which it will be entitled. There are no constraints on the variable consideration recorded. The Company then allocates the transaction price to each performance obligation in the contract based on a relative stand-alone selling price charged separately to customers or using an expected cost-plus-margin method. The corresponding revenues are recognized when or as the related performance obligations are satisfied, which are noted above. The impact of variable consideration was immaterial in each of the periods presented.
The Company’s standard assurance warranty period is normally 12 to 24 months. The Company sells separately priced service contracts and extended warranty contracts related to certain of its products, in particular related to its plating and laser-based products. The separately priced contracts generally range from 12 to 60 months. The Company normally receives payment at the inception of the contract and recognizes revenue over the term of the agreement in proportion to the costs expected to be incurred in satisfying the obligations under the contract. The Company has elected to use the practical expedient related to disclosing the remaining performance obligations as of December 31, 2024 and 2023, as the majority have a duration of less than one year.
MKS INSTRUMENTS, INC.
NOTES TO CONSOLIDATED FINANCIAL STATEMENTS
(in millions, except per share data)
Costs to Obtain and Fulfill a Contract
The Company expenses sales commissions when incurred because the amortization period would have been one year or less. These costs are recorded within selling, general and administration expenses. The Company has elected to recognize the costs for freight and shipping when control over products has transferred to the customer as an expense in cost of sales.
Accounts Receivable Allowances
Accounts receivable allowances include sales returns and bad debt allowances. The Company monitors and tracks the amount of product returns and reduces revenue at the time of shipment for the estimated amount of such future returns, based on historical experience. The Company makes estimates evaluating its allowance for doubtful accounts. The Company continuously monitors collections and payments from its customers and maintains a provision for estimated credit losses based upon its historical experience, current economic conditions and any specific customer collection issues that it has identified.
Research and Development
Research and development costs are expensed as incurred and consist mainly of compensation-related expenses and project materials. The Company’s research and development efforts include numerous projects, which generally have a duration of 3 to 36 months. Acquired in-process research and development (“IPR&D”) expenses, if acquired in a business combination, are capitalized at fair value as an intangible asset until the related project is completed and are then amortized over the estimated useful life of the product. The Company monitors projects and, if they are abandoned, writes them off.
Advertising Costs
Advertising costs are expensed as incurred and were immaterial in 2024, 2023 and 2022.
Leases
The Company accounts for leases under ASC Topic 842, “Leases” (“ASC Topic 842”). Under ASC Topic 842, a contract is or contains a lease when the Company has the right to control the use of the identified asset. The Company determines if an arrangement is a lease at inception of the contract, which is the date on which the terms of the contract are agreed to, and the agreement creates enforceable rights and obligations. The commencement date of the lease is the date that the lessor makes an underlying asset available for use.
The Company determines if the lease is an operating or finance lease at the lease commencement date based upon the terms of the lease and the nature of the asset. The lease term used to calculate the lease liability includes options to extend or terminate the lease when it is reasonably certain that the option will be exercised.
The Company measures the lease liability as the present value of future lease payments, discounted using the discount rate for the lease at the commencement date. The Company is typically unable to determine the implicit interest rate, so it uses an incremental borrowing rate based on the lease term and economic environment at commencement date. The right-of-use (“ROU”) asset is initially measured as the amount of the lease liability, adjusted for any initial lease costs, prepaid lease payments and reduced by any lease incentives.
The Company’s contracts often include non-lease components such as common area maintenance. MKS has elected the practical expedient to account for the lease and non-lease components as a single lease component. For leases with a term of one year or less the Company has elected not to record the lease asset or liability. The lease payments are recognized in the consolidated statements of operations and comprehensive income (loss) on a straight-line basis over the lease term. The Company includes lease costs within cost of revenues and operating expenses.
Stock-Based Compensation
The accounting for share-based compensation expense requires the measurement and recognition of compensation expense for all stock-based payment awards made to employees and directors based on estimated fair values. Stock-based
MKS INSTRUMENTS, INC.
NOTES TO CONSOLIDATED FINANCIAL STATEMENTS
(in millions, except per share data)
awards include (i) time-based restricted stock units (“RSUs”), (ii) performance-based RSUs based on the achievement of adjusted EBITDA targets (the “Adjusted EBITDA RSUs”), (iii) performance-based RSUs based on the Company’s total shareholder return relative to a group of peers over a three-year performance period (the “rTSR RSUs”) and (iv) employee stock purchase plan rights. For RSUs, the fair value is measured on the date of grant and expensed normally over a three-year period. The Company does not include a forfeiture rate in the fair value measurement at the date of grant. The Company determines the fair value of time-based RSUs based on the closing market price of the Company’s common stock on the date of the award. The Company determines the original fair value of Adjusted EBITDA RSUs based upon the closing market price of the Company’s stock on the date of the award and adjusts the fair value quarterly during the first year based upon actual and forecasted results against Adjusted EBITDA targets. The Company estimates the fair value of rTSR RSUs using the Monte Carlo simulation model, which requires the use of highly subjective and complex assumptions, including the price volatility of the underlying stock. Such values are recognized as expense on a straight-line basis for time-based awards and rTSR RSUs and using the accelerated graded vesting method for Adjusted EBITDA RSUs, all over the requisite service periods.
The Company also provides certain employees with the opportunity to purchase shares through its 2014 Employee Stock Purchase Plan (“2014 ESPP”). The Company estimates the fair value of employee stock purchase plan rights using the Black-Scholes model which incorporates a number of complex and subjective variables, including expected stock price volatility over the term of the awards, expected life, risk-free interest rate and expected dividends. Management determined that blended volatility, a combination of historical and implied volatility, is more reflective of market conditions and a better indicator of expected volatility than historical or implied volatility alone.
The assumptions used in calculating the fair value of share-based payment awards represent management’s best estimates, but these estimates involve inherent uncertainties and the application of management judgment. As a result, if factors change and the Company uses different assumptions, stock-based compensation expense could be materially different in the future.
Accumulated Other Comprehensive Income (Loss)
For foreign subsidiaries where the functional currency is the local currency, assets and liabilities are translated into U.S. dollars at the current exchange rate on the consolidated balance sheets date. Revenue and expenses are translated at average rates of exchange prevailing during the year. Translation adjustments resulting from this process are recorded to Other Comprehensive Income (Loss) (“OCI”). There were translation adjustment losses included in accumulated OCI, net of taxes, of $292 and $79, as of December 31, 2024 and 2023, respectively. Unrealized gains and losses on securities classified as available-for-sale and unrecognized pension gains and losses are included in accumulated OCI in consolidated stockholders’ equity. For derivative instruments designated as cash-flow hedges and interest rate swap hedges, the effective portion of the derivative’s gain (loss) is initially reported as a component of OCI and is subsequently recognized in earnings, upon reclassification from accumulated OCI. There were derivative gains included in accumulated OCI, net of taxes, of $30 and $31, as of December 31, 2024 and 2023, respectively. The related tax effects of these OCI items are recorded in income tax expense within the statement of income, upon reclassification from accumulated OCI.
Net Income (Loss) Per Share
Basic net income (loss) per share is based on the weighted average number of common shares outstanding and diluted net income (loss) per share is based on the weighted average number of common shares outstanding and all potential dilutive common equivalent shares outstanding. The dilutive effect of equity awards is determined under the treasury stock method using the average market price for the period. Common equivalent shares are included in the per share calculations when the effect of their inclusion would be dilutive. In periods in which a net loss is recognized, common equivalent shares are not included as they are antidilutive.
Cash and Cash Equivalents and Investments
All highly liquid investments with a maturity date of three months or less at the date of purchase are considered to be cash equivalents. The appropriate classification of investments in securities is determined at the time of purchase. Debt securities that the Company does not have the intent and ability to hold to maturity are classified as “available-for-sale” and are carried at fair value.
MKS INSTRUMENTS, INC.
NOTES TO CONSOLIDATED FINANCIAL STATEMENTS
(in millions, except per share data)
The Company classifies investments with maturity dates greater than twelve months in short-term investments rather than long-term investments. This method classifies these securities as current based on the nature of the securities and the availability for use in current operations. The Company believes this method is preferable because it is more reflective of the Company’s assessment of its overall liquidity position.
The Company reviews its investment portfolio on a quarterly basis to identify and evaluate individual investments that have indications of possible impairment. The factors considered in determining whether a loss is other-than-temporary include: the length of time and extent to which fair market value has been below the cost basis, the financial condition and near-term prospects of the issuer, credit quality, and the Company’s ability to hold the investment for a period of time sufficient to allow for any anticipated recovery in fair value.
Concentrations of Credit Risk
The Company’s significant concentrations of credit risk consist principally of cash and cash equivalents, foreign exchange forward contracts, interest rate swaps and trade accounts receivable. The Company maintains cash and cash equivalents with financial institutions, including some banks with which it has borrowings. The Company enters into foreign exchange forward contracts with high credit-quality financial institutions in order to minimize credit risk exposure.
The Company’s largest customers are primarily concentrated in the semiconductor industry, and a limited number of these customers account for a significant portion of the Company’s revenues. The Company regularly monitors the creditworthiness of its customers and believes it has adequately provided for potential credit loss exposures. Credit is extended for all customers based primarily on financial condition, and collateral is not required.
During 2024, 2023 and 2022, approximately 42%, 41%, and 58% of the Company’s net revenues, respectively, were from sales to customers in the semiconductor market. No single customer represented greater than 10% of the Company’s accounts receivable balance as of December 31, 2024 or 2023.
Inventories are stated at the lower of cost or net realizable value, cost being determined using a standard costing system that approximates actual cost, based on a first-in, first-out method. The Company regularly reviews inventory quantities on hand and records a provision to write-down excess and obsolete inventory to its estimated net realizable value, if less than cost, based primarily on its estimated forecast of product demand. Once the Company’s inventory value is written-down and a new cost basis has been established, the inventory value is not increased due to demand increases.
Property, Plant and Equipment
Property, plant and equipment are stated at cost. Expenditures for major renewals and betterments that extend the useful lives of property, plant and equipment are capitalized. Expenditures for maintenance and repairs are charged to expense as incurred. When assets are sold or otherwise disposed of, the cost and related accumulated depreciation are eliminated from the accounts and any resulting gain or loss is recognized in earnings.
Depreciation is provided on the straight-line method over the estimated useful lives of ten to fifty years for buildings and building improvements, and three to fifteen years for machinery and equipment, furniture and fixtures, office equipment and software. Leasehold improvements are amortized over the shorter of the lease term or the estimated useful life of the leased asset.
Acquisition Accounting
The fair value of the consideration exchanged in a business combination is allocated to tangible assets and identifiable intangible assets acquired and liabilities assumed at acquisition date fair value. Goodwill is measured as the excess of the consideration transferred over the net fair value of identifiable assets acquired and liabilities assumed. The accounting for an acquisition involves a considerable amount of judgment and estimation. Cost, income, market or a combination of approaches may be used to establish the fair value of consideration exchanged, assets acquired, and liabilities assumed, depending on the nature of those items. The valuation approach is determined in accordance with generally accepted valuation methods. Key areas of estimation and judgment may include the selection of valuation approaches, cost of capital, market characteristics, cost structure, impacts of synergies, and estimates of terminal value, among other factors.
MKS INSTRUMENTS, INC.
NOTES TO CONSOLIDATED FINANCIAL STATEMENTS
(in millions, except per share data)
While the Company uses estimates and assumptions as part of the purchase price allocation process to estimate the value of assets acquired and liabilities assumed, estimates are inherently uncertain and subject to refinement. During the measurement period, which may be up to one year from the acquisition date, the Company may record adjustments to the assets acquired and liabilities assumed, with a corresponding offset to goodwill, to the extent that adjustments are identified to the preliminary purchase price allocation. Upon conclusion of the measurement period, or final determination of the value of the assets acquired and liabilities assumed, whichever comes first, any subsequent adjustments are recorded to results of operations.
Intangible Assets
Intangible assets resulting from the acquisitions of businesses are estimated by management based on the fair value of assets acquired. These include acquired customer lists, completed technology, patents, trademarks, trade names, backlog and IPR&D. Definite-lived intangible assets, other than IPR&D, are amortized from one to eighteen years on a straight-line basis, which represents the estimated periods of benefit and the expected pattern of consumption. IPR&D is not subject to amortization until reclassification into completed technology. Upon completion of a project, the Company expects the corresponding IPR&D intangible assets to be amortized over an estimated useful life of eight to nine years. Indefinite-lived intangible assets, such as trade names, are not amortized; they are subject to annual impairment testing as well as testing upon the occurrence of any event that indicates a potential impairment.
Goodwill
Goodwill is the amount by which the cost of acquired net assets exceeded the fair value of those net assets on the date of acquisition. The Company allocates goodwill to reporting units at the time of acquisition or when there is a change in the reporting structure and bases that allocation on which reporting units will benefit from the acquired assets and liabilities. Reporting units are defined as operating segments or one level below an operating segment, referred to as a component. The Company assesses goodwill for impairment on an annual basis as of October 31 or more frequently when events and circumstances occur indicating that the recorded goodwill may be impaired.
The estimated fair value of the Company’s reporting units is based on discounted cash flow models derived from internal earnings and internal and external market forecasts. Determining fair value requires the exercise of significant judgment, including judgments about appropriate discount and terminal growth rates, as well as forecasted revenue, gross profit and operating expenses. Discount rates are based on a weighted average cost of capital (“WACC”), which represents the average rate a business must pay its providers of debt and equity. The WACC used to test goodwill is derived from a group of comparable companies. Assumptions in estimating future cash flows are subject to a high degree of judgment and complexity. The Company makes every effort to forecast these future cash flows as accurately as possible with the information available at the time the forecast is developed.
In performing the Company’s annual goodwill impairment test, the Company is permitted to first assess qualitative factors to determine whether it is more likely than not that the fair value of the Company’s reporting unit exceeds its carrying amount, including goodwill. In performing the qualitative assessment, the Company considers certain events and circumstances specific to the reporting unit and to the entity as a whole, such as macroeconomic conditions, industry and market considerations, overall financial performance and cost factors when evaluating whether it is more likely than not that the fair value of the reporting unit exceeds its carrying amount. The Company is also permitted to bypass the qualitative assessment and proceed directly to the quantitative assessment. If the Company chooses to undertake the qualitative assessment and concludes that it is more likely than not that the fair value of the reporting unit is less than its carrying amount, the Company would then proceed to the quantitative impairment assessment. In the quantitative assessment, the Company compares the fair value of the reporting unit to its carrying amount, which includes goodwill. If the fair value exceeds the carrying value, no impairment loss exists. If the fair value is less than the carrying amount, a goodwill impairment loss is measured and recorded.
Long-Lived Assets
The Company evaluates the recoverability of its long-lived assets whenever events and changes in circumstances indicate that the carrying amount of an asset may not be fully recoverable. This periodic review may result in an adjustment of estimated depreciable lives or asset impairment. When indicators of impairment are present, the carrying values of the asset are evaluated in relation to their operating performance and future undiscounted cash flows of the underlying business. If the future undiscounted cash flows are less than their carrying value, impairment exists. The impairment is
MKS INSTRUMENTS, INC.
NOTES TO CONSOLIDATED FINANCIAL STATEMENTS
(in millions, except per share data)
measured as the difference between the carrying value and the fair value of the underlying asset. Fair values are based on estimates of market prices and assumptions concerning the amount and timing of estimated future cash flows and assumed discount rates, reflecting varying degrees of perceived risk.
Foreign Exchange
The functional currency of the majority of the Company’s foreign subsidiaries is the applicable local currency. For those subsidiaries, assets and liabilities are translated to U.S. dollars at year-end exchange rates. Income and expense accounts are translated at the average exchange rates prevailing during the year. The resulting translation adjustments are included in OCI in consolidated stockholders’ equity. Foreign exchange transaction gains and losses are classified in other (income) expense, net in the statement of operations and comprehensive income (loss).
Net foreign exchange losses resulting from re-measurement were $0, $30, and $5 for the years ended December 31, 2024, 2023, and 2022, respectively, and are included in other (income) expense, net. These amounts do not reflect the corresponding gain (loss) from foreign exchange forward contracts, which are included in cost of sales. See Note 8 regarding foreign exchange forward contracts.
Employee Benefit Plans
The majority of the Company’s employees participate in defined contribution plans, whereby the Company, at its discretion, makes certain matching contributions based on participating employees’ annual contribution to the plan and their total compensation.
The Company also has defined benefit retirement plans at certain of its foreign subsidiaries. The majority of these defined benefit plans are frozen and do not allow new employees to join the plan. The Company accounts for these plans based on the provisions of ASC Topic 715, “Compensation-Retirement Benefits.” Some of the key assumptions used to calculate the pension expense and projected benefit obligation include the discount rate, rate of forecasted salary increases, the expected long-term rate of return on plan assets and expected mortality. The obligation for these claims and the related periodic costs are measured using actuarial techniques and assumptions. Actuarial gains and losses are deferred and amortized over future periods.
Income Taxes
The Company records income taxes using the asset and liability method. Deferred income tax assets and liabilities are recognized for the future tax consequences attributable to differences between the financial statement carrying amounts of existing assets and liabilities and their respective income tax bases, and also for operating loss and tax credit carryforwards. On a quarterly basis, the Company evaluates both the positive and negative evidence that affects the realizability of net deferred tax assets and assesses the need for a valuation allowance. The future benefit to be derived from its deferred tax assets is dependent upon its ability to generate sufficient future taxable income in each jurisdiction of the right type to realize the assets. The Company records a valuation allowance to reduce its net deferred tax assets to the amount that is expected to be realized. To the extent the Company establishes a valuation allowance an expense will be recorded as a component of the provision for income taxes on the statement of operations.
Accounting for income taxes requires a two-step approach to recognize and measure uncertain tax positions. The first step is to evaluate the tax position for recognition by determining if, based on the technical merits, it is more likely than not that the position will be sustained upon audit, including resolutions of related appeals or litigation processes, if any. The second step is to measure the tax benefit as the largest amount that is more than 50% likely of being realized upon ultimate settlement. The Company re-evaluates these uncertain tax positions on a quarterly basis. This evaluation is based on factors including, but not limited to, changes in facts or circumstances, changes in tax law, effectively settled issues under audit and new audit activity. Any change in these factors could result in the recognition of a tax benefit or an additional charge to the tax provision.
Income tax effects resulting from changes in tax law are accounted for by the Company in the period in which the law is enacted and the effects are recorded as a component of provision for income taxes from continuing operations.
MKS INSTRUMENTS, INC.
NOTES TO CONSOLIDATED FINANCIAL STATEMENTS
(in millions, except per share data)
Derivatives
As a result of the Company's global operating activities and variable interest rate borrowings, the Company is exposed to market risks from changes in foreign currency exchange rates and interest rates, which may adversely affect its operating results and financial position. The Company enters into derivative instruments for risk management purposes only, including derivatives designated as hedging instruments and those utilized as economic hedges. The Company does not enter into derivative instruments for trading or speculative purposes.
The Company uses derivative instruments, such as foreign exchange forward contracts and options, to manage certain foreign currency exposure, and interest rate swaps and interest rate caps to manage certain interest rate exposure. Changes in fair value of derivative instruments are recognized in the consolidated statement of operations or, if hedge accounting is applied, in OCI for the effective portion of the changes in fair value. The cash flows resulting from foreign exchange forward contracts are classified in the consolidated statements of cash flows as part of cash flows from operating activities. All derivatives are stated at fair value in the consolidated balance sheets.
Accounting principles for qualifying hedges require detailed documentation that describes the relationship between the hedging instrument and the hedged item, including, but not limited to, the risk management objectives and hedging strategy and the methods to assess the effectiveness of the hedging relationship. The Company assesses the hedging relationships, both at the inception of the hedge and on an ongoing basis, using either the critical terms matching approach or a regression analysis approach to determine whether the designated hedging instrument is highly effective in offsetting changes in the value of the hedged item.
By nature, all financial instruments involve market and credit risks. The Company enters into derivative instruments with major investment grade financial institutions, for which no collateral is required. The Company has policies to monitor the credit risk of these counterparties. While there can be no assurance, the Company does not anticipate any material non-performance by any of these counterparties.
(4)Recent Accounting Pronouncements
Segment Reporting (Topic 280): Improvements to Reportable Segment Disclosures
In November 2023, the Financial Accounting Standards Board (“FASB”) issued Accounting Standard Update (“ASU”) No. 2023-07, Segment Reporting (Topic 280): Improvements to Reportable Segment Disclosures (“ASU 2023-07”), which requires a public entity to disclose significant segment expenses and other segment items on an annual and interim basis and provide certain interim periods disclosures that are currently only required annually. Additionally, it requires a public entity to disclose the title and position of the Chief Operating Decision Maker (“CODM”). ASU 2023-07 does not change how a public entity identifies its operating segments, aggregates them, or applies the quantitative thresholds to determine its reportable segments. The new standard is effective for fiscal years beginning after December 15, 2023, and interim periods within fiscal years beginning after December 15, 2024. A public entity should apply the amendments in ASU 2023-07 retrospectively to all prior periods presented in the financial statements. The Company adopted this standard during fiscal year 2024. The adoption of this standard only impacts disclosures and did not have a material impact on the Company’s consolidated financial statements.
Income Taxes (Topic 740): Improvements to Income Tax Disclosures
In December 2023, the FASB issued ASU No. 2023-09, Income Taxes (Topic 740): Improvements to Income Tax Disclosures (“ASU 2023-09”), which focuses on the rate reconciliation and income taxes paid. ASU 2023-09 requires a public business entity (“PBE”) to disclose, on an annual basis, a tabular rate reconciliation using both percentages and currency amounts, broken out into specified categories with certain reconciling items further broken out by nature and jurisdiction to the extent those items exceed a specified threshold. In addition, all entities are required to disclose income taxes paid, net of refunds received disaggregated by federal, state/local and foreign and by jurisdiction if the amount is at least 5% of total income tax payments, net of refunds received. For PBEs, the new standard is effective for annual periods beginning after December 15, 2024, with early adoption permitted. An entity may apply the amendments prospectively by providing the revised disclosures for the period ending December 31, 2025 and continuing to provide the pre-ASU disclosures for the prior periods or may apply the amendments retrospectively by providing the revised disclosures for all periods presented. The Company is currently evaluating the impact on its consolidated financial statement disclosures; however, adoption will not impact its consolidated balance sheets, cash flows or income statements.
MKS INSTRUMENTS, INC.
NOTES TO CONSOLIDATED FINANCIAL STATEMENTS
(in millions, except per share data)
Income Statement—Reporting Comprehensive Income—Expense Disaggregation Disclosures (Subtopic 220-40): Disaggregation of Income Statement Expenses
In November 2024, the FASB issued ASU No. 2024-03, Income Statement—Reporting Comprehensive Income—Expense Disaggregation Disclosures (Subtopic 220-40): Disaggregation of Income Statement Expenses (“ASU 2024-03”), which requires public companies to disclose, in interim and annual reporting periods, additional information about certain expenses in the notes to financial statements. The amendments in ASU 2024-03 are effective for annual reporting periods beginning after December 15, 2026, and interim reporting periods beginning after December 15, 2027, with early adoption permitted. The Company is currently evaluating the impact on its consolidated financial statement disclosures; however, adoption will not impact its consolidated balance sheets, cash flows or income statements.
(5)Revenue from Contracts with Customers
Contract assets as of December 31, 2024 and 2023 were $30 and $26, respectively. A roll forward of the Company’s deferred revenue and customer advances is as follows:
| | | | | | | | |
| | 2024 | | | 2023 | |
Beginning balance, January 1(1) | | $ | 79 | | | $ | 96 | |
Additions to deferred revenue and customer advances | | | 134 | | | | 167 | |
Amount of deferred revenue and customer advances recognized in income | | | (140 | ) | | | (184 | ) |
Ending balance, December 31(2) | | $ | 73 | | | $ | 79 | |
(1)Beginning deferred revenue and customer advances as of January 1, 2024 included $77 of current deferred revenue and customer advances, and $2 of long-term deferred revenue. Beginning deferred revenue and customer advances as of January 1, 2023 included $94 of current deferred revenue and customer advances, and $2 of long-term deferred revenue. The majority of the beginning balance in 2024 and 2023 was recognized in each year.
(2)Ending deferred revenue and customer advances as of December 31, 2024 included $71 of current deferred revenue and customer advances, and $2 of long-term deferred revenue. Ending deferred revenue and customer advances as of December 31, 2023 included $77 of current deferred revenue and customer advances, and $2 of long-term deferred revenue.
Revenue from certain custom products, including MSD plating equipment, and revenue from certain service contracts are recorded over time. Remaining product and services revenues are recorded at a point in time.
Disaggregation of Revenue
The following table summarizes revenue from contracts with customers in the Company’s three end markets: Semiconductor, Electronics and Packaging, and Specialty Industrial.
| | | | | | | | | | | | |
| | Years Ended December 31, | |
| | 2024 | | | 2023 | | | 2022 | |
Semiconductor | | $ | 1,498 | | | $ | 1,479 | | | $ | 2,041 | |
Electronics and Packaging | | | 922 | | | | 916 | | | | 541 | |
Specialty Industrial | | | 1,166 | | | | 1,227 | | | | 964 | |
Total net revenues | | $ | 3,586 | | | $ | 3,622 | | | $ | 3,547 | |
Refer to Note 21 for revenue by reportable segment, geography and groupings of similar products.
MKS INSTRUMENTS, INC.
NOTES TO CONSOLIDATED FINANCIAL STATEMENTS
(in millions, except per share data)
(6)Net Income (Loss) Per Share
The following table sets forth the computation of basic and diluted net income (loss) per share:
| | | | | | | | | | | | |
| | Years Ended December 31, | |
Numerator: | | 2024 | | | 2023 | | | 2022 | |
Net income (loss) | | $ | 190 | | | $ | (1,841 | ) | | $ | 333 | |
Denominator: | | | | | | | | | |
Shares used in net income (loss) per common share – basic | | | 67.3 | | | | 66.8 | | | | 59.7 | |
Effect of dilutive securities | | | 0.3 | | | | — | | | | 0.2 | |
Shares used in net income (loss) per common share – diluted | | | 67.6 | | | | 66.8 | | | | 59.9 | |
Net income (loss) per common share: | | | | | | | | | |
Basic | | $ | 2.82 | | | $ | (27.54 | ) | | $ | 5.57 | |
Diluted | | $ | 2.81 | | | $ | (27.54 | ) | | $ | 5.56 | |
Basic earnings per share is computed by dividing net income (loss) available to common shareholders by the weighted-average number of common shares outstanding during the period.
Diluted net income (loss) per common share is computed by dividing the diluted net income (loss) available to common shareholders by the weighted-average number of shares of common stock and potentially dilutive shares of common stock outstanding during the period. The dilutive effect of equity awards is calculated based on the average stock price for the relevant period, using the treasury stock method. In periods in which a net loss is recognized, the impact of RSUs is not included as they are antidilutive. The dilutive effect of the Convertible Notes is calculated under the if-converted method. Shares that would be issued if the Convertible Notes were converted are not included in the calculation of diluted net income (loss) per common share as the Company’s share price is below the initial conversion price and inclusion would be antidilutive.
In 2024 and 2022, the Company had an immaterial quantity of RSUs that were antidilutive and were excluded from the computation of diluted weighted-average shares.
(7)Fair Value Measurements
In accordance with the provisions of fair value accounting, a fair value measurement assumes that the transaction to sell an asset or transfer a liability occurs in the principal market for the asset or liability or, in the absence of a principal market, the most advantageous market for the asset or liability and defines fair value based upon an exit price model.
The fair value measurement guidance establishes a fair value hierarchy which requires an entity to maximize the use of observable inputs and minimize the use of unobservable inputs when measuring fair value. The guidance describes three levels of inputs that may be used to measure fair value:
| | |
Level 1 | | Quoted prices in active markets for identical assets or liabilities as of the reporting date. Active markets are those in which transactions for the asset or liability occur in sufficient frequency and volume to provide pricing information on an ongoing basis. |
Level 2 | | Observable inputs other than Level 1 prices, such as quoted prices for similar assets or liabilities; quoted prices in markets that are not active; or other inputs that are observable or can be corroborated by observable market data for substantially the full term of the assets or liabilities. Level 2 assets and liabilities include debt securities with quoted prices that are traded less frequently than exchange-traded instruments or securities or derivative contracts that are valued using a pricing model with inputs that are observable in the market or can be derived principally from or corroborated by observable market data. |
Level 3 | | Unobservable inputs that are supported by little or no market activity and that are significant to the fair value of the assets or liabilities. Level 3 assets and liabilities include financial instruments whose value is determined using pricing models, discounted cash flow methodologies, or similar techniques, as well as instruments for which the determination of fair value requires significant management judgment or estimation. |
In certain cases, the inputs used to measure fair value may fall into different levels of the fair value hierarchy. In such cases, the Company categorizes such assets and liabilities based on the lowest level input that is significant to the fair
MKS INSTRUMENTS, INC.
NOTES TO CONSOLIDATED FINANCIAL STATEMENTS
(in millions, except per share data)
value measurement in its entirety. The Company’s assessment of the significance of a particular input to the fair value measurement in its entirety requires judgment and considers factors specific to the asset or liability.
Assets and liabilities of the Company are measured at fair value on a recurring basis as of December 31, 2024, and are summarized as follows:
| | | | | | | | | | | | | | | | |
| | | | | Fair Value Measurements at Reporting Date Using | |
Description | | December 31, 2024 | | | Quoted Prices in
Active Markets for
Identical Assets
(Level 1) | | | Significant Other
Observable
Inputs
(Level 2) | | | Significant
Unobservable
Inputs
(Level 3) | |
Assets: | | | | | | | | | | | | |
Cash equivalents: | | | | | | | | | | | | |
Money market funds | | $ | 289 | | | $ | 289 | | | $ | — | | | $ | — | |
Time deposits | | | 5 | | | | — | | | | 5 | | | | — | |
Equity securities | | | 1 | | | | 1 | | | | — | | | | — | |
Available-for-sale securities: | | | | | | | | | | | | |
Group insurance contracts | | | 6 | | | | — | | | | 6 | | | | — | |
Derivatives | | | | | | | | | | | | |
Foreign exchange forward contracts | | | 9 | | | | — | | | | 9 | | | | — | |
Interest rate swaps - current | | | 3 | | | | — | | | | 3 | | | | — | |
Interest rate swaps - non-current | | | 35 | | | | — | | | | 35 | | | | — | |
Pension and deferred compensation plan assets | | | 22 | | | | — | | | | 22 | | | | — | |
Total assets | | $ | 370 | | | $ | 290 | | | $ | 80 | | | $ | — | |
Liabilities: | | | | | | | | | | | | |
Derivatives | | | | | | | | | | | | |
Foreign exchange forward contracts-current | | $ | 3 | | | $ | — | | | $ | 3 | | | $ | — | |
Interest rate swaps - current | | | 4 | | | | — | | | | 4 | | | | — | |
Total liabilities | | $ | 7 | | | $ | — | | | $ | 7 | | | $ | — | |
Reported as follows: | | | | | | | | | | | | |
Assets: | | | | | | | | | | | | |
Cash and cash equivalents (1) | | $ | 294 | | | $ | 289 | | | $ | 5 | | | $ | — | |
Other current assets | | | 12 | | | | — | | | | 12 | | | | — | |
Total current assets | | $ | 306 | | | $ | 289 | | | $ | 17 | | | $ | — | |
Other assets | | $ | 64 | | | $ | 1 | | | $ | 63 | | | $ | — | |
Liabilities: | | | | | | | | | | | | |
Other current liabilities | | $ | 7 | | | $ | — | | | $ | 7 | | | $ | — | |
(1)The cash and cash equivalents amount presented in the table above does not include cash of $420 as of December 31, 2024.
MKS INSTRUMENTS, INC.
NOTES TO CONSOLIDATED FINANCIAL STATEMENTS
(in millions, except per share data)
Assets and liabilities of the Company are measured at fair value on a recurring basis as of December 31, 2023, and are summarized as follows:
| | | | | | | | | | | | | | | | |
| | | | | Fair Value Measurements at Reporting Date Using | |
Description | | December 31, 2023 | | | Quoted Prices in
Active Markets for
Identical Assets
(Level 1) | | | Significant Other
Observable
Inputs
(Level 2) | | | Significant
Unobservable
Inputs
(Level 3) | |
Assets: | | | | | | | | | | | | |
Cash equivalents: | | | | | | | | | | | | |
Money market funds | | $ | 356 | | | $ | 356 | | | $ | — | | | $ | — | |
Time deposits | | | 12 | | | | — | | | | 12 | | | | — | |
Available-for-sale securities: | | | | | | | | | | | | |
Group insurance contracts | | | 6 | | | | — | | | | 6 | | | | — | |
Derivatives | | | | | | | | | | | | |
Foreign exchange forward contracts | | | 2 | | | | — | | | | 2 | | | | — | |
Interest rate caps - current | | | 3 | | | | — | | | | 3 | | | | — | |
Interest rate swaps - non-current | | | 41 | | | | — | | | | 41 | | | | — | |
Pension and deferred compensation plan assets | | | 19 | | | | — | | | | 19 | | | | — | |
Total assets | | $ | 439 | | | $ | 356 | | | $ | 83 | | | $ | — | |
Liabilities: | | | | | | | | | | | | |
Derivatives | | | | | | | | | | | | |
Foreign exchange forward contracts | | $ | 5 | | | $ | — | | | $ | 5 | | | $ | — | |
Total liabilities | | $ | 5 | | | $ | — | | | $ | 5 | | | $ | — | |
Reported as follows: | | | | | | | | | | | | |
Assets: | | | | | | | | | | | | |
Cash and cash equivalents (1) | | $ | 368 | | | $ | 356 | | | $ | 12 | | | $ | — | |
Other current assets | | | 5 | | | | — | | | | 5 | | | | — | |
Total current assets | | $ | 373 | | | $ | 356 | | | $ | 17 | | | $ | — | |
Other assets | | $ | 66 | | | $ | — | | | $ | 66 | | | $ | — | |
Liabilities: | | | | | | | | | | | | |
Other current liabilities | | $ | 5 | | | $ | — | | | $ | 5 | | | $ | — | |
(1)The cash and cash equivalents amount presented in the table above does not include cash of $507 as of December 31, 2023.
Other Fair Value Disclosures
The estimated carrying value and fair value of the Company’s debt as of December 31, 2024 and 2023 is as follows:
| | | | | | | | | | | | | | | | |
| | Years Ended December 31, | |
| | 2024 | | | 2023 | |
| | Carrying Value | | | Fair Value | | | Carrying Value | | | Fair Value | |
Term Loan Facility | | $ | 3,249 | | | $ | 3,262 | | | $ | 4,953 | | | $ | 4,965 | |
Convertible Notes | | | 1,400 | | | | 1,357 | | | | — | | | | — | |
Total | | $ | 4,649 | | | $ | 4,619 | | | $ | 4,953 | | | $ | 4,965 | |
The estimated carrying value of the Company’s Term Loan Facility, as defined and further described in Note 15, was determined using available market information based on recent trades or activity of debt instruments with substantially similar risks, terms and maturities, which fall within Level 2 under the fair value hierarchy. The estimated fair value of the Company’s Convertible Notes, as defined and further described in Note 15, was determined based on the last traded price of the Convertible Notes for the period ended December 31, 2024, and falls under Level 2 of the fair value hierarchy.
Money Market Funds
Money market funds are cash and cash equivalents and are classified within Level 1 of the fair value hierarchy.
MKS INSTRUMENTS, INC.
NOTES TO CONSOLIDATED FINANCIAL STATEMENTS
(in millions, except per share data)
Pension and Deferred Compensation Plan Assets
The pension and deferred compensation plan assets represent investments in mutual funds, exchange traded funds, government securities and other time deposits. These investments are set aside for retirement benefits of certain of the Company's subsidiaries.
Derivatives
As a result of the Company’s global operating activities and variable interest rate borrowings, the Company is exposed to market risks from changes in foreign currency exchange rates and interest rates, which may adversely affect its operating results and financial position. When deemed appropriate, the Company minimizes its risks from foreign currency exchange rate and interest rate fluctuations through the use of derivative financial instruments. The principal market in which the Company executes its foreign currency and interest rate contracts is the institutional market in an over-the-counter environment with a relatively high level of price transparency. The market participants are typically large commercial banks. The contracts are valued using broker quotations or market transactions.
(8)Derivatives and Net Investment Hedge
Foreign Exchange Forward Contracts
The Company hedges a portion of its forecasted foreign currency-denominated intercompany sales of inventory, over a maximum period of twenty-four months, using foreign exchange forward contracts accounted for as cash-flow hedges. To the extent these derivatives are effective in offsetting the variability of the hedged cash flows, and otherwise meet the hedge accounting criteria, changes in the derivatives' fair value are not included in current earnings but are included in OCI in stockholders' equity. These changes in fair value will subsequently be reclassified into earnings as applicable, when the forecasted transaction occurs. To the extent that a previously designated hedging transaction is no longer an effective hedge, any ineffectiveness measured in the hedging relationship is recorded in earnings in the period it occurs.
The Company also enters into foreign exchange forward contracts to hedge against certain monetary asset and liability accounts on the consolidated balance sheet to mitigate the risk associated with certain foreign currency transactions in the ordinary course of business. These derivatives are not designated as cash flow hedging instruments and gains or losses from these derivatives are recorded immediately in other (income) expense, net.
The following table summarizes the net notional values of foreign exchange forward contracts outstanding as of December 31, 2024 and December 31, 2023:
| | | | | | | | |
| | Years Ended December 31, | |
| | 2024 | | | 2023 | |
Derivatives designated as hedging instruments: | | | | | | |
Foreign exchange forward contracts-cash flow hedges | | $ | 74 | | | $ | 178 | |
Derivatives not designated as hedging instruments: | | | | | | |
Foreign exchange forward contracts-balance sheet hedges | | $ | 154 | | | $ | 155 | |
For both periods presented in the table, the Japanese yen and the South Korean won were the largest notional contracts for designated cash flow hedges.
For 2024, the British pound and Chinese yuan were the largest notional contracts for balance sheet hedges not designated as a hedging instrument. For 2023, the Euro and British pound were the largest notional contracts for balance sheet hedges not designated as a hedging instrument.
Net Investment Hedge
On January 1, 2023, the Company designated certain Euro-denominated debt as a net investment hedge to hedge a portion of its net investments in certain of its entities with functional currencies denominated in the Euro. On January 22, 2024, the Company prepaid its USD Tranche A in full using, in part, a €250 incremental borrowing under its Euro Tranche B, each as defined and further described in Note 15. On January 22, 2024, the Company designated the additional €250 of its Euro Tranche B as a net investment hedge. As of December 31, 2024, the total principal amount outstanding under its Euro Tranche B was €596 and the entire balance was designated as a net investment hedge. As of December 31, 2023, the
MKS INSTRUMENTS, INC.
NOTES TO CONSOLIDATED FINANCIAL STATEMENTS
(in millions, except per share data)
total principal amount outstanding under its Euro Tranche B was €593 and the entire balance was designated as a net investment hedge. For these net investment hedges, the Company records foreign currency remeasurement gains and losses within a component of OCI. Recognition in earnings of amounts previously recorded in accumulated OCI is limited to circumstances such as complete or substantially complete liquidation or sale of the net investment in the hedged foreign operations.
Interest Rate Agreements
The Company has various interest rate swap agreements maturing through January 31, 2029, that exchange a one-month forward-looking term rate based on the variable secured overnight financing rate (“Term SOFR”) paid on the outstanding balance of its USD Term Loan Facility, as defined and further described in Note 15, to a fixed rate. The notional value of the agreements was $2,600 and $2,300 as of December 31, 2024 and December 31, 2023, respectively. The Company acquired USD London Interbank Offered Rate (“LIBOR”) interest rate cap agreements as a result of its acquisition of Atotech Limited (“Atotech”) on August 17, 2022 (the “Atotech Acquisition”) and had utilized these agreements to offset Term SOFR on its Term Loan Facility. The notional value of the agreements was $700 as of December 31, 2023 and expired on January 31, 2024. Effective June 30, 2023, the Company’s USD LIBOR based interest rate caps were converted to Term SOFR. The Company also had two USD LIBOR based swaps that were converted to Term SOFR, effective June 30, 2023. The conversions from USD LIBOR to Term SOFR did not have a material impact on the Company’s results of operations.
The interest rate swaps are recorded at fair value on the balance sheet and changes in the fair value are recognized in OCI. To the extent these arrangements are no longer effective hedges, the hedging relationship will be discontinued and changes in the fair value of the hedging instruments from the last assessment period that were effective up to the current period will be recorded immediately in earnings. Amounts previously recorded in OCI will remain in OCI and will be reclassified to earnings when the interest payments impact consolidated earnings. If the Company determines that the interest payments are unlikely to occur, amounts previously recorded in OCI will be reclassified to earnings immediately. Changes in the fair value of interest rate caps were recorded immediately in earnings, as the Company did not designate these instruments as hedges and therefore these instruments did not qualify for hedge accounting. The cash flows resulting from interest rate agreements are classified in cash flows from operating activities.
The following table summarizes the net gains (losses) on derivatives designated as cash flow hedging instruments:
| | | | | | | | | | | | |
| | Years Ended December 31, | |
| | 2024 | | | 2023 | | | 2022 | |
Foreign exchange forward contracts-cash flow hedges: | | | | | | | | | |
Net (losses) gains recognized in OCI, net of tax | | $ | 6 | | | $ | 1 | | | $ | (4 | ) |
Net gains (losses) reclassified from accumulated OCI into cost of revenues | | $ | 6 | | | $ | 7 | | | $ | 18 | |
Interest rate hedges: | | | | | | | | | |
Net (losses) gains recognized in OCI, net of tax | | $ | (7 | ) | | $ | (25 | ) | | $ | 54 | |
Net gains (losses) reclassified from accumulated OCI into interest expense | | $ | 61 | | | $ | 45 | | | $ | 3 | |
The Company expects a gain of approximately $7 to be reclassified from OCI into cost of revenues during the next twelve months related to foreign exchange forward contracts. The Company expects a gain of approximately $17 to be reclassified from OCI into interest expense during the next twelve months related to interest rate swaps.
The following table summarizes the net gains (losses) on derivatives not designated as hedging instruments:
| | | | | | | | | | | | |
| | Years Ended December 31, | |
| | 2024 | | | 2023 | | | 2022 | |
Net (losses) gains recognized in other (income) expense, net | | $ | (2 | ) | | $ | (32 | ) | | $ | (8 | ) |
The interest rate caps resulted in a reduction of $3, $30 and $5 to interest expense in 2024, 2023 and 2022, respectively.
Currency Option Agreements
In connection with financing the Atotech Acquisition, the Company issued euro denominated term loan debt. In anticipation of issuing this debt, the Company purchased foreign currency option contracts in 2021 to fix the conversion
MKS INSTRUMENTS, INC.
NOTES TO CONSOLIDATED FINANCIAL STATEMENTS
(in millions, except per share data)
of EUR 300 into U.S. dollars. The options settled on January 31, 2022, and the Company recorded a gain of $5, net of premiums, in 2022 which is included in other (income) expense, net in the table above.
Derivative instruments are subject to master netting arrangements. However, the Company has elected to record these contracts on a gross basis in the consolidated balance sheet. The location and fair value amounts of derivative instruments reported in the consolidated balance sheet is disclosed in Note 7.
Inventories consist of the following:
| | | | | | | | |
| | Years Ended December 31, | |
| | 2024 | | | 2023 | |
Raw material | | $ | 618 | | | $ | 740 | |
Work-in-process | | | 97 | | | | 94 | |
Finished goods | | | 178 | | | | 157 | |
Total | | $ | 893 | | | $ | 991 | |
Inventory-related excess and obsolete charges of $56, $64 and $21 were recorded in cost of products and services in the years ended December 31, 2024, 2023 and 2022, respectively.
(10)Property, Plant and Equipment
Property, plant and equipment consist of the following:
| | | | | | | | |
| | Years Ended December 31, | |
| | 2024 | | | 2023 | |
Land | | $ | 80 | | | $ | 76 | |
Buildings and building improvements | | | 322 | | | | 335 | |
Machinery and equipment | | | 646 | | | | 670 | |
Furniture and fixtures, office equipment and software | | | 194 | | | | 207 | |
Leasehold improvements | | | 183 | | | | 174 | |
Construction in progress | | | 82 | | | | 60 | |
| | | 1,507 | | | | 1,522 | |
Less: accumulated depreciation | | | 736 | | | | 738 | |
Total | | $ | 771 | | | $ | 784 | |
Depreciation of property, plant and equipment totaled $103, $102 and $70 for the years ended 2024, 2023 and 2022, respectively.
The Company has various operating leases for real estate and non-real estate items. The non-real estate leases are mainly comprised of automobiles but also include office equipment and other lower-valued items.
MKS INSTRUMENTS, INC.
NOTES TO CONSOLIDATED FINANCIAL STATEMENTS
(in millions, except per share data)
Leases consist of the following:
| | | | | | | | | | | | |
| | Years Ended December 31, | |
| | 2024 | | | 2023 | | | 2022 | |
Operating lease cost (1) | | $ | 37 | | | $ | 31 | | | $ | 27 | |
Finance lease cost | | | 9 | | | | 9 | | | | 3 | |
Short-term lease | | | 8 | | | | 12 | | | | 10 | |
Total lease cost | | $ | 54 | | | $ | 52 | | | $ | 40 | |
(1)Operating lease cost includes an immaterial amount of variable expenses, offset by certain sublease rental income.
Supplemental cash flow information related to leases was as follows:
| | | | | | | | | | | | |
| | Years Ended December 31, | |
| | 2024 | | | 2023 | | | 2022 | |
Cash paid for amounts included in measurement of liabilities: | | | | | | | | | |
Operating cash flows used for operating leases(1) | | $ | 33 | | | $ | 34 | | | $ | 28 | |
Operating cash flows used for finance leases | | | 2 | | | | 1 | | | | — | |
Financing cash flows used for finance leases | | | 15 | | | | 4 | | | | 2 | |
| | | | | | | | | |
ROU assets obtained in exchange for new lease liabilities: | | | | | | | | | |
Operating leases | | | 26 | | | | 25 | | | | 7 | |
Finance leases | | | 12 | | | | 1 | | | | 3 | |
(1)Operating cash flows used for operating leases for the year ended December 31, 2023 and 2022 include an immaterial amount of tenant improvement allowance receipts.
The weighted average remaining terms for all leases were as follows:
| | | | | | | | |
| | Years Ended December 31, | |
| | 2024 | | | 2023 | |
Weighted-average remaining lease term years-operating leases | | 11.5 | | | | 12.3 | |
Weighted-average remaining lease term years-finance leases | | | 13.1 | | | | 11.3 | |
Weighted-average discount rate-operating leases | | | 3.7 | % | | | 3.3 | % |
Weighted-average discount rate-finance leases | | | 5.2 | % | | | 5.2 | % |
Future lease payments under non-cancelable leases as of December 31, 2024 are detailed as follows:
| | | | | | | | |
Year Ending December 31, | | Operating
Leases | | | Finance
Leases | |
2025 | | | 33 | | | | 7 | |
2026 | | | 30 | | | | 5 | |
2027 | | | 26 | | | | 3 | |
2028 | | | 19 | | | | 2 | |
2029 | | | 18 | | | | 2 | |
Thereafter | | | 133 | | | | 19 | |
Total lease payments | | | 259 | | | | 38 | |
Less: imputed interest | | | 46 | | | | 9 | |
Total lease liabilities | | $ | 213 | | | $ | 29 | |
Amounts presented above do not include payments relating to immaterial leases excluded from the consolidated balance sheets as well as leases with terms of less than twelve months.
MKS INSTRUMENTS, INC.
NOTES TO CONSOLIDATED FINANCIAL STATEMENTS
(in millions, except per share data)
Atotech
On August 17, 2022 (the “Effective Date”), the Company completed the Atotech Acquisition, through the acquisition of the entire issued share capital of Atotech by Atotech Manufacturing, Inc. (“Bidco”), a Delaware corporation and indirect wholly owned subsidiary of the Company. The Atotech Acquisition was implemented by means of a scheme of arrangement under the laws of Jersey (the “Scheme”) pursuant to the definitive agreement entered into by the Company and Atotech on July 1, 2021 (as amended, the “Implementation Agreement”).
Atotech, which the Company operates as MSD, develops leading process and manufacturing technologies for advanced surface modification, electroless and electrolytic plating, and surface finishing. Applying a comprehensive systems-and-solutions approach, Atotech's portfolio includes chemistry, equipment and services for innovative and high-technology applications in a wide variety of end markets. Atotech further broadens the Company’s capabilities by bringing leadership in critical chemistry solutions for electronics and packaging and specialty industrial applications.
On the Effective Date, pursuant to the Scheme and in accordance with the terms and conditions of the Implementation Agreement, Bidco acquired each issued and outstanding ordinary share of Atotech in exchange for per share consideration of $16.20 in cash and 0.0552 of a share of Company common stock. The Company funded the payment of the aggregate cash consideration with a combination of cash on hand and the proceeds from the Term Loan Facility, as defined in Note 15. As a result of the Atotech Acquisition, the Company issued an aggregate of 10.7 shares of Company common stock to the former Atotech shareholders.
The purchase price of Atotech consisted of the following:
| | | | |
Cash consideration to Atotech stockholders, net | | $ | 2,886 | |
Value of MKS shares issued | | | 1,186 | |
Repayment of Atotech senior secured term loans | | | 1,545 | |
Settlement of accelerated Atotech share-based awards | | | 47 | |
Total purchase price, net of cash and cash equivalents acquired | | $ | 5,664 | |
Under the acquisition method of accounting, the total purchase price was allocated to the acquired tangible and intangible assets and assumed liabilities of Atotech based on their fair values as of the Effective Date, except for contract assets and liabilities, which remain at book value in accordance with ASC Topic 606, Revenue from Contracts with Customers. Any excess of the acquisition consideration over the fair value of assets acquired and liabilities assumed was allocated to goodwill and none of this goodwill or intangible assets will be deductible for tax purposes. The Company believes the amount of goodwill relative to identifiable intangible assets relates to several factors, including (1) broadening its position in key electronics and industrial markets to offer complementary solutions, and (2) leveraging component and systems expertise to provide robust solutions to meet its customers’ evolving technology needs.
MKS INSTRUMENTS, INC.
NOTES TO CONSOLIDATED FINANCIAL STATEMENTS
(in millions, except per share data)
The following table summarizes the allocation of the purchase price to the fair values assigned to assets acquired and liabilities assumed at the Effective Date inclusive of immaterial measurement period adjustments:
| | | | |
Cash and cash equivalents | | $ | 238 | |
Accounts receivable | | | 283 | |
Inventories | | | 244 | |
Other current assets | | | 104 | |
Property, plant and equipment | | | 381 | |
Intangible assets | | | 2,726 | |
Goodwill | | | 3,054 | |
Other assets | | | 131 | |
Total assets acquired | | | 7,161 | |
Accounts payable | | | 194 | |
Other current liabilities | | | 166 | |
Non-current deferred taxes | | | 719 | |
Non-current accrued compensation | | | 99 | |
Other non-current liabilities | | | 81 | |
Total liabilities assumed | | | 1,259 | |
Fair value of assets acquired and liabilities assumed | | | 5,902 | |
Less: Cash and cash equivalents acquired | | | (238 | ) |
Total purchase price, net of cash and cash equivalents acquired | | $ | 5,664 | |
The fair value of the acquired intangible assets was determined using the income approach. In performing these valuations, the key underlying assumptions used included the appropriate discount rates as well as forecasted revenue growth rates, gross profit and operating expenses. Fair value estimates are based on a complex series of judgments about future events and uncertainties and rely heavily on estimates and assumptions. The judgments used to determine the estimated fair value assigned to each class of assets acquired and liabilities assumed, as well as asset lives, can materially impact the Company’s results of operations.
The valuations were based on the information that was available during the one-year measurement period that existed as of the Effective Date and the expectations and assumptions that have been deemed reasonable by the Company's management. The size and breadth of the Atotech Acquisition necessitated the use of this measurement period to adequately analyze and assess a number of the factors used in establishing the fair value of certain tangible and intangible assets acquired and liabilities assumed as of the Effective Date and the related tax impacts of any changes made. The measurement period is now complete.
The following table reflects the allocation of the acquired intangible assets and related estimate of useful lives at the Effective Date:
| | | | | | |
Customer relationships | | $ | 1,756 | | | 11-14 years |
Completed technology | | | 595 | | | 8-9 years |
Trade names | | | 145 | | | 16 years |
Backlog | | | 40 | | | 1.5 years |
In-process research and development | | | 190 | | |
|
| | $ | 2,726 | | | |
The acquired intangible assets are being amortized on a straight-line basis, which approximates the economic use of the assets over their estimated useful lives. Upon completion of the related projects, the Company expects the IPR&D intangible asset to be amortized over its estimated useful life of eight to nine years.
During the fourth quarter of 2022, the Company recorded adjustments to balances reported as of, and for the period ended, September 30, 2022, resulting from foreign currency translation of the preliminary allocation of intangible assets and goodwill from the Atotech Acquisition in August 2022 and the related effect on cumulative translation adjustment and deferred tax liabilities. The adjustments recorded were to correct an overstatement of goodwill of $43, intangible assets, net of $56, and non-current deferred tax liabilities of $38, and an understatement of both accumulated OCI and OCI of $61. These adjustments that the Company recorded did not affect net income, earnings per share or the consolidated statements of cash flows. The Company assessed these adjustments in accordance with SEC Staff
MKS INSTRUMENTS, INC.
NOTES TO CONSOLIDATED FINANCIAL STATEMENTS
(in millions, except per share data)
Accounting Bulletin (“SAB”) No. 99 and SAB No. 108 and determined they were not material to the interim financial statements taken as a whole.
Pro Forma Results
The following unaudited pro forma financial information presents the combined results of operations of the Company as if the Atotech Acquisition had occurred on January 1, 2022. The unaudited pro forma financial information is not necessarily indicative of what the Company’s consolidated results of operations actually would have been had the acquisition occurred on the assumed date. In addition, the unaudited pro forma financial information does not attempt to project the future results of operations of the combined Company.
| | |
| | Year Ended
December 31, 2022 |
Total net revenues | | $4,450 |
Net income | | $197 |
The unaudited pro forma information for the year ended December 31, 2022 give effect primarily to the following:
•Applying the Company’s accounting policies;
•Incremental interest expense related to the Term Loan Facility;
•Incremental amortization of acquired intangible assets related to the estimated fair value from the purchase price allocation;
•The exclusion of inventory step-up amortization in 2022;
•Incremental depreciation of acquired property, plant and equipment related to the estimated fair value from the purchase price allocation;
•Incremental compensation expense for share-based compensation arrangements; and
•The estimated tax impact of the above adjustments.
(13)Goodwill and Intangible Assets
The Company’s methodology for allocating the purchase price of an acquisition is determined through established and generally accepted valuation techniques. Goodwill is measured as the excess of the cost of the acquisition over the sum of the amounts assigned to tangible and identifiable intangible assets acquired less liabilities assumed. The Company assigns assets acquired (including goodwill) and liabilities assumed to one or more reporting units as of the date of acquisition. If the products obtained in an acquisition are assigned to multiple reporting units, the goodwill is distributed to the respective reporting units as part of the purchase price allocation process.
Goodwill and intangible assets with indefinite useful lives are not amortized but are reviewed for impairment annually during the fourth quarter of each fiscal year or whenever events or changes in circumstances indicate that the carrying value of an asset may not be recoverable. To measure impairment, the Company compares the fair value of the reporting unit to its carrying amount, which includes goodwill. If the fair value of the reporting unit exceeds the carrying value of the reporting unit, no impairment exists. If the fair value of the reporting unit is less than the carrying value of the reporting unit, a goodwill impairment is recorded.
Amortizable intangible assets and other long-lived assets are also subject to an impairment test if there is an indicator of impairment. When the Company determines that the carrying value of intangible assets or other long-lived assets may not be recoverable based upon the existence of one or more indicators of impairment, the Company uses the projected undiscounted cash flow method to determine whether an impairment exists, and then measures the impairment using discounted cash flows.
The process of evaluating the potential impairment of goodwill, intangible assets and other long-lived assets requires significant judgment. The Company regularly monitors current business conditions and other factors, including, but not limited to, adverse industry or economic trends, restructuring actions and lower projections of profitability that may impact future operating results. The Company’s stock price and any estimated control premium are factors affecting the
MKS INSTRUMENTS, INC.
NOTES TO CONSOLIDATED FINANCIAL STATEMENTS
(in millions, except per share data)
assessment of the fair value of the Company’s underlying reporting units for purposes of performing any goodwill impairment assessment.
Goodwill
The changes in the carrying amount of goodwill and accumulated impairment losses were as follows:
| | | | | | | | | | | | | | | | | | | | | | | | |
| | 2024 | | | 2023 | |
| | Gross Carrying Amount | | | Accumulated Impairment Loss | | | Net | | | Gross Carrying Amount | | | Accumulated Impairment Loss | | | Net | |
Beginning balance at January 1 | | $ | 4,387 | | | $ | (1,833 | ) | | $ | 2,554 | | | $ | 4,454 | | | $ | (146 | ) | | $ | 4,308 | |
Impairment of goodwill | | | — | | | | | | | — | | | | — | | | | (1,687 | ) | | | (1,687 | ) |
Acquired goodwill | | | — | | | | | | | — | | | | — | | | | — | | | | — | |
Foreign currency translation and measurement period adjustments | | | (75 | ) | | | | | | (75 | ) | | | (67 | ) | | | — | | | | (67 | ) |
Ending balance at December 31 | | $ | 4,312 | | | $ | (1,833 | ) | | $ | 2,479 | | | $ | 4,387 | | | $ | (1,833 | ) | | $ | 2,554 | |
As of October 31, 2024, the Company performed its annual impairment assessment of goodwill using a qualitative assessment for all of its reporting units. The Company determined that it was more likely than not that the fair values were more than the carrying values for each of the reporting units.
During the quarter ended June 30, 2023, the Company identified softer industry demand, particularly in the personal computer and smartphone markets, and concluded there was a triggering event at each of its electronics (“EL”) and general metal finishing reporting (“GMF”) units, which together constitute MSD, and the equipment solutions business (“ESB”) reporting unit of PSD.
For each of the three reporting units, the Company performed a quantitative assessment of goodwill using a weighting of an income approach and market approach. The income approach was based upon projected future cash flows that were discounted to present value and an assumed terminal growth rate. The key underlying assumptions included forecasted revenues, which incorporated external market data, terminal growth rate, gross profit and operating expenses, as well as an applicable discount rate for each reporting unit. The market approach for each of the three reporting units incorporated observed multiples of guideline public companies. The market approach for the EL and GMF reporting units also incorporated multiples from guideline transactions.
Fair value estimates are based on complex series of judgments about future events and uncertainties and rely heavily on estimates and assumptions that have been deemed reasonable by the Company’s management. There are inherent uncertainties and management judgment required in these determinations.
This quantitative assessment during the quarter ended June 30, 2023 resulted in the following:
| | | | | | | | |
Reporting Unit | | Goodwill Impairment | | | Remaining Goodwill | |
Electronics | | $ | 826 | | | $ | 1,420 | |
General Metal Finishing | | | 428 | | | | 307 | |
Equipment Solutions Business | | | 372 | | | | 100 | |
In addition, the Company used an income approach to determine the fair value of the long-lived and indefinite-lived intangible assets within these reporting units (Level 3 within the fair value hierarchy). These valuations resulted in a $20 fair value and $152 impairment of completed technology within the ESB reporting unit and a $72 fair value and $49 impairment of IPR&D within the EL reporting unit. After evaluating forecast updates and carrying values, the Company did not identify impairments at any other of its reporting units.
For the completed technology valuation within the ESB reporting unit, the forecasted future undiscounted cash flows were consistent with the Company’s goodwill analysis, using an approximate 7 year useful life, an 8% weighted-average forecasted revenue growth rate, and a discount rate of 13.5%. For the IPR&D intangible asset within the EL reporting unit, the forecasted undiscounted future cash flows utilized were consistent with the Company’s goodwill analysis, with estimated time to complete in-process projects of up to 2 years, and a discount rate of 12.5%.
MKS INSTRUMENTS, INC.
NOTES TO CONSOLIDATED FINANCIAL STATEMENTS
(in millions, except per share data)
As of October 31, 2023, the Company performed its annual goodwill and intangible asset impairment assessment using a quantitative assessment for all its reporting units. For the EL, GMF and ESB reporting units, the Company performed a quantitative assessment of goodwill using an equal weighting of the income approach and market approach and for the VSD and PSD reporting units only used an income approach. The income approach was based upon projected future cash flows that were discounted to present value and an assumed terminal growth rate. The key underlying assumptions included forecasted revenues, which incorporated external market data, the terminal growth rate, gross profit and operating expenses, as well as an applicable discount rate for each reporting unit. The market approach incorporated observed multiples of guideline public companies. The market approach for the electronics and general metal finishing reporting units also incorporated multiples from guideline transactions.
This quantitative assessment during the quarter ended December 31, 2023 resulted in the following:
| | | | | | | | |
Reporting Unit | | Goodwill Impairment | | | Remaining Goodwill | |
Electronics | | $ | 48 | | | $ | 1,401 | |
Equipment Solutions | | | 13 | | | | 87 | |
There was no goodwill impairment at any of the Company’s other reporting units. The Company will continue to monitor for future triggering events which could result in an impairment charge.
In addition, the Company used an income approach to determine the fair value of the long-lived and indefinite lived intangible assets within these reporting units (Level 3 within the fair value hierarchy). These valuations resulted in a $14 impairment of IPR&D within the EL reporting unit as it was determined that there was no remaining fair value in its remaining projects. After evaluating forecast updates and carrying values, the Company did not identify impairments at any other of its reporting units.
Intangible Assets
The Company’s intangible assets are comprised of the following:
| | | | | | | | | | | | | | | | | | | | |
As of December 31, 2024 | | Gross | | | Accumulated
Impairment Charges | | | Accumulated Amortization | | | Foreign Currency
Translation | | | Net | |
Completed technology | | $ | 1,268 | | | $ | (152 | ) | | $ | (496 | ) | | $ | (31 | ) | | $ | 589 | |
Customer relationships | | | 2,072 | | | | (1 | ) | | | (477 | ) | | | (86 | ) | | | 1,508 | |
Patents, trademarks, trade names and other | | | 381 | | | | (63 | ) | | | (130 | ) | | | (13 | ) | | | 175 | |
| | $ | 3,721 | | | $ | (216 | ) | | $ | (1,103 | ) | | $ | (130 | ) | | $ | 2,272 | |
| | | | | | | | | | | | | | | | | | | | |
As of December 31, 2023 | | Gross | | | Accumulated Impairment
Charges | | | Accumulated
Amortization | | | Foreign
Currency
Translation and Measurement Period Adjustments | | | Net | |
Completed technology | | $ | 1,268 | | | $ | (152 | ) | | $ | (405 | ) | | $ | (4 | ) | | $ | 707 | |
Customer relationships | | | 2,072 | | | | (1 | ) | | | (335 | ) | | | (17 | ) | | | 1,719 | |
Patents, trademarks, trade names and other | | | 381 | | | | (63 | ) | | | (118 | ) | | | (7 | ) | | | 193 | |
| | $ | 3,721 | | | $ | (216 | ) | | $ | (858 | ) | | $ | (28 | ) | | $ | 2,619 | |
MKS INSTRUMENTS, INC.
NOTES TO CONSOLIDATED FINANCIAL STATEMENTS
(in millions, except per share data)
During the twelve months ended December 31, 2023, $117 of IPR&D included with patents, trademarks, trade names and other was reclassified into completed technology.
Aggregate amortization expense related to acquired intangible assets for 2024, 2023 and 2022 was $245, $295 and $146, respectively. Aggregate amortization expense related to acquired intangible assets for future years is:
| | | | |
Year | | Amount | |
2025 | | | 243 | |
2026 | | | 239 | |
2027 | | | 238 | |
2028 | | | 238 | |
2029 | | | 235 | |
Thereafter | | | 1,023 | |
The Company excluded from the above table intangible assets of $56 of indefinite-lived trademarks and trade names, which were not subject to amortization.
The Company provides for the estimated costs to fulfill customer warranty obligations upon the recognition of the related revenue. The Company’s warranty obligations are affected by shipment volume, product failure rates, utilization levels, material usage and supplier warranties on parts delivered to the Company. Should actual product failure rates, utilization levels, material usage, or supplier warranties on parts differ from the Company's estimates, revisions to the estimated warranty liability would be required. The Company engages in extensive product quality programs and processes, including actively monitoring and evaluating the quality of its component suppliers.
Product warranty activities were as follows:
| | | | | | | | |
| | Years Ended December 31, | |
| | 2024 | | | 2023 | |
Beginning of period | | $ | 22 | | | $ | 27 | |
Provision for product warranties | | | 24 | | | | 11 | |
Charges to warranty liability | | | (24 | ) | | | (16 | ) |
End of period | | $ | 22 | | | $ | 22 | |
Short-term product warranties of $14 and long-term product warranties of $8, each as of December 31, 2024, are included within other current liabilities and other non-current liabilities, respectively, within the accompanying consolidated balance sheets. Short-term product warranties of $15 and long-term product warranties of $7, each as of December 31, 2023, are included within other current liabilities and other non-current liabilities, respectively, within the accompanying consolidated balance sheets.
The Company’s outstanding debt is as follows:
| | | | | | | | |
| | December 31,
2024 | | | December 31,
2023 | |
Short-term debt: | | | | | | |
Term Loan Facility | | $ | 50 | | | $ | 93 | |
Long-term debt: | | | | | | |
Term Loan Facility | | $ | 3,199 | | | $ | 4,860 | |
Debt issuance costs - Term Loan Facility | | | (85 | ) | | | (164 | ) |
Term Loan Facility, net | | | 3,114 | | | | 4,696 | |
Convertible Notes | | | 1,400 | | | | — | |
Debt issuance costs - Convertible Notes | | | (26 | ) | | | — | |
Convertible Notes, net | | | 1,374 | | | | — | |
Total long-term debt, net | | $ | 4,488 | | | $ | 4,696 | |
MKS INSTRUMENTS, INC.
NOTES TO CONSOLIDATED FINANCIAL STATEMENTS
(in millions, except per share data)
Credit Facilities
In connection with the completion of the Atotech Acquisition, on August 17, 2022 (the “Effective Date”) the Company entered into a credit agreement with JPMorgan Chase Bank, N.A., as administrative agent and collateral agent, Barclays Bank PLC, and the lenders from time to time party thereto (the “Credit Agreement”). The Credit Agreement provided for (i) a senior secured term loan facility comprised of three tranches: a $1,000 loan (the “USD Tranche A”), a $3,600 loan (as further increased, refinanced and otherwise modified as described herein, the “USD Tranche B”) and a €600 loan (as further increased and otherwise modified as described herein, the “Euro Tranche B” and together with the USD Tranche A and the USD Tranche B, the “Term Loan Facility”), each of which were borrowed in full on the Effective Date, and (ii) a senior secured revolving credit facility of $500 (as further increased and otherwise modified as described herein, the “Revolving Facility” and, together with the Term Loan Facility, the “Credit Facilities”), with the commitments under each of the foregoing facilities subject to increase from time to time subject to certain conditions. The proceeds of the Term Loan Facility were used on the Effective Date, among other things, to fund a portion of the consideration payable in connection with the Atotech Acquisition and to refinance the existing term loan and revolving credit facilities of the Company and certain indebtedness of Atotech.
Initially, borrowings under the Credit Facilities bore interest at a rate per annum equal to, at the Company’s option, any of the following, plus, in each case, an applicable margin: (a) with respect to the USD Tranche A, the Revolving Facility and the USD Tranche B, (x) a base rate determined by reference to the highest of (1) the federal funds effective rate plus 0.50%, (2) the prime rate quoted in The Wall Street Journal, or (3) a forward-looking term rate based on Term SOFR (plus an applicable credit spread adjustment) for an interest period of one month, plus 1.00%; and (y) a Term SOFR rate (plus an applicable credit spread adjustment) for the interest period relevant to such borrowing, subject to a rate floor of (I) with respect to the USD Tranche B, 0.50% and (II) with respect to the USD Tranche A and the Revolving Facility, 0.0%; and (b) with respect to the Euro Tranche B, a Euro Interbank Offered Rate (“EURIBOR”) rate determined by reference to the costs of funds for Euro deposits for the interest period relevant to such borrowing adjusted for certain additional costs, subject to a EURIBOR rate floor of 0.0%. Initially, the applicable margins for borrowings under the Credit Facilities were (i) under the USD Tranche A, 1.50% with respect to base rate borrowings and 2.50% with respect to Term SOFR borrowings, (ii) under the USD Tranche B, 1.75% with respect to base rate borrowings and 2.75% with respect to Term SOFR borrowings, (iii) under the Euro Tranche B, 3.00% and (iv) under the Revolving Facility, 1.50% with respect to base rate borrowings and 2.50% with respect to Term SOFR borrowings.
In addition to paying interest on outstanding principal under the Credit Facilities, the Company is required to pay a commitment fee in respect of the unutilized commitments under the Revolving Facility. The commitment fee is subject to adjustment based on the Company’s first lien net leverage ratio as of the end of the preceding fiscal quarter. The Company must also pay customary letter of credit fees and agency fees. As of December 31, 2024, the commitment fee was 0.25% per annum, representing a downward adjustment from 0.375% as of June 30, 2024.
On October 3, 2023 (the “First Amendment Effective Date”), the Company entered into the First Amendment to Credit Agreement (the “First Amendment”), which refinanced all of the $3,564 outstanding USD Tranche B to (i) decrease the applicable margin for the USD Tranche B from 1.75% to 1.50% with respect to base rate borrowings and from 2.75% to 2.50% with respect to Term SOFR borrowings and (ii) remove the credit spread adjustment applicable to Term SOFR borrowings of the USD Tranche B.
On January 22, 2024 (the “Second Amendment Effective Date”), the Company entered into the Second Amendment to Credit Agreement (the “Second Amendment”), pursuant to which the Company (i) borrowed additional USD Tranche B loans in an aggregate principal amount of $490 and additional Euro Tranche B loans in an aggregate principal amount of €250 (collectively, the “Incremental Tranche B Loans”) and (ii) used a portion of the proceeds of the Incremental Tranche B Loans to prepay the USD Tranche A in full in an aggregate principal amount of $744.
On February 13, 2024, the Company entered into the Third Amendment to Credit Agreement (the “Third Amendment”), pursuant to which the Company increased the available borrowing capacity under the Revolving Facility by $175 (the “Incremental Revolving Commitments”). As of December 31, 2024, the available borrowing capacity under the Revolving Facility was $675.
MKS INSTRUMENTS, INC.
NOTES TO CONSOLIDATED FINANCIAL STATEMENTS
(in millions, except per share data)
On July 23, 2024 (the “Fourth Amendment Effective Date”), the Company entered into the Fourth Amendment to Credit Agreement (the “Fourth Amendment”), pursuant to which the Company (i) refinanced its existing USD Tranche B loan and Euro Tranche B loan with a new $2,650 USD Tranche B loan and a new €800 Euro Tranche B loan, (ii) decreased the applicable margin for the USD Tranche B from 2.50% to 2.25% with respect to Term SOFR borrowings and from 1.50% to 1.25% with respect to base rate borrowings and (iii) decreased the applicable margin for the Euro Tranche B from 3.00% to 2.75%.
On July 23, 2024, immediately prior to the effectiveness of the Fourth Amendment, the Company made a voluntary prepayment of $110 aggregate principal amount under the Term Loan Facility, consisting of $69 principal amount of its USD Tranche B loan and €38 principal amount of its Euro Tranche B loan.
The USD Tranche B and the Euro Tranche B were issued on the Effective Date with original issue discount of 2.00% of the principal amounts thereof. The USD Tranche B was issued on the First Amendment Effective Date with original issue discount of 0.25% of the principal amount thereof. The Incremental Tranche B Loans were issued with original issue discount of 0.25% of the principal amount thereof.
The Company incurred $242 of deferred financing fees and original issue discount related to the term loans under the Term Loan Facility funded on the Effective Date, which are included in long-term debt, net in the accompanying consolidated balance sheets and are being amortized to interest expense over the estimated life of the term loans using the effective interest method.
The Company incurred $11 of deferred financing fees and original issue discount related to the USD Tranche B funded on the First Amendment Effective Date, of which $9 is included in long-term debt, net in the accompanying consolidated balance sheets and is being amortized to interest expense over the estimated life of the term loans using the effective interest method. The Company recorded an $8 loss on extinguishment of debt in connection with the First Amendment.
The Company incurred $5 of deferred financing fees and original issue discount related to the Incremental Tranche B Loans funded on the Second Amendment Effective Date, of which $2 is included in long-term debt, net in the accompanying consolidated balance sheets and is being amortized to interest expense over the estimated life of the term loans using the effective interest method. The Company recorded a $9 loss on extinguishment of debt in connection with the Second Amendment.
The Company recorded a $5 loss on extinguishment of debt in connection with the Fourth Amendment as a result of the acceleration of deferred financing and original issue discounts.
Under the Credit Agreement, the Company is required to prepay outstanding term loans, subject to certain exceptions, with portions of its annual excess cash flow as well as with the net cash proceeds of certain of its asset sales, certain casualty and condemnation events and the incurrence or issuances of certain debt. If at any time the aggregate amount of outstanding loans, unreimbursed letter of credit drawings and undrawn letters of credit under the Revolving Facility exceeds the aggregate commitments under the Revolving Facility, the Company is required to repay outstanding loans and/or cash collateralize letters of credit, with no reduction of the commitment amount.
The Company may voluntarily prepay outstanding loans under the Credit Facilities from time to time, subject to certain conditions, without premium or penalty other than customary “breakage” costs with respect to Term SOFR or EURIBOR loans; provided, however, that subject to certain exceptions, if on or prior to the date that is six months after the Fourth Amendment Effective Date, the Company prepays any loans under the USD Tranche B or the Euro Tranche B in connection with a repricing transaction, the Company must pay a prepayment premium of 1.00% of the aggregate principal amount of the loans so prepaid. Additionally, the Company may voluntarily reduce the unutilized portion of the commitment amount under the Revolving Facility.
Prior to the repayment in full of the USD Tranche A, the Company was required to make scheduled quarterly payments each equal to 1.25% of the original principal amount of the USD Tranche A. The Company is required to make scheduled quarterly payments each equal to approximately $10 with respect to the USD Tranche B and approximately €2 with respect to the Euro Tranche B, in each case with the balance due thereunder on the seventh anniversary of the Effective Date.
There is no scheduled amortization under the Revolving Facility. Any principal amount outstanding under the Revolving Facility is due and payable in full on the fifth anniversary of the Effective Date.
MKS INSTRUMENTS, INC.
NOTES TO CONSOLIDATED FINANCIAL STATEMENTS
(in millions, except per share data)
All obligations under the Credit Facilities are guaranteed by certain of the Company’s wholly-owned domestic subsidiaries and are required to be guaranteed by certain of the Company’s future wholly-owned domestic subsidiaries, and are secured by substantially all of the Company’s assets and the assets of such subsidiaries, subject to certain exceptions and exclusions.
Under the Credit Agreement, the Company has the ability to incur additional incremental debt facilities in an amount up to (x) the greater of (1) $1,011 and (2) 75% of consolidated last twelve months earnings before interest, taxes, depreciation, and amortization (“EBITDA”), plus (y) an amount equal to the sum of all voluntary prepayments of term loans under the Term Loan Facility, plus (z) an additional unlimited amount subject to pro forma compliance with certain leverage ratio tests (based on the security and priority of such incremental debt).
Under the USD Tranche A and the Revolving Facility, so long as any USD Tranche A loans (or commitments in respect thereof) are outstanding as of the end of any fiscal quarter, the Company may not allow its total net leverage ratio as of the end of such fiscal quarter to be greater than 5.25 to 1.00 for the fiscal quarters ending December 31, 2023 through September 30, 2024, with an annual step-down of 0.25:1.00 and subject to a step-up of 0.50:1.00 for the four full fiscal quarter period following any material acquisition, not to exceed 5.50 to 1.00.
In addition, in the event there are no loans outstanding under the USD Tranche A, as of the end of any fiscal quarter of the Company when the aggregate amount of loans outstanding under the Revolving Facility (net of (a) all letters of credit (whether cash collateralized or not) and (b) unrestricted cash of the Company and its restricted subsidiaries) exceeds 35% of the aggregate amount of all commitments under the Revolving Facility in effect as of such date, the Company may not allow its first lien net leverage ratio as of the end of each such fiscal quarter to be greater than 6.00 to 1.00.
The USD Tranche B and the Euro Tranche B are not subject to financial maintenance covenants.
The Credit Agreement contains a number of negative covenants that, among other things and subject to certain exceptions, restrict the ability of the Company and each of its subsidiaries to: incur additional indebtedness; pay dividends on its capital stock or redeem, repurchase or retire its capital stock or its subordinated indebtedness; make investments, loans and acquisitions; create restrictions on the payment of dividends or other amounts to the Company from the Company’s restricted subsidiaries or restrictions on the ability of the Company’s restricted subsidiaries to incur liens; engage in transactions with its affiliates; sell assets, including capital stock of its subsidiaries; materially alter the business it conducts; consolidate or merge; incur liens; and engage in sale-leaseback transactions.
The Credit Agreement also contains customary representations and warranties, affirmative covenants and provisions relating to events of default. If an event of default occurs, the lenders under the Credit Facilities will be entitled to take various actions, including the acceleration of amounts due under the Credit Facilities and all actions permitted to be taken by a secured creditor. As of December 31, 2024, the Company was in compliance with all covenants under the Credit Agreement.
The Company paid certain customary fees to and expenses of (i) JPMorgan Chase Bank, N.A., Barclays Bank PLC, BofA Securities, Inc., Citibank, N.A., HSBC Securities (USA) Inc. and Mizuho Bank, Ltd. in their respective capacities as lead arrangers and bookrunners in connection with the Credit Facilities on the Effective Date, (ii) JPMorgan Chase Bank, N.A. in its capacity as lead arranger in connection with each of the First Amendment, the Second Amendment, the Third Amendment and the Fourth Amendment and (iii) the lenders providing the Incremental Revolving Commitments pursuant to the Third Amendment.
As described further below under “Convertible Notes,” on May 16, 2024, the Company completed a private offering of convertible senior notes. A significant portion of the net proceeds from the offering was used to repay approximately $1,206 of the USD Tranche B. As a result of the repayment, the Company recorded a $38 loss on extinguishment of debt.
As of December 31, 2024, the weighted average interest rate of the Term Loan Facility was 6.4%. The Revolving Facility has a maturity date in August 2027 while the USD Tranche B and Euro Tranche B have a maturity date in August 2029. As of December 31, 2024 there were no borrowings under the Revolving Facility.
MKS INSTRUMENTS, INC.
NOTES TO CONSOLIDATED FINANCIAL STATEMENTS
(in millions, except per share data)
Convertible Notes
On May 16, 2024, the Company completed a private offering of $1,400 aggregate principal amount of its convertible senior notes due 2030 (the “Convertible Notes”). The Convertible Notes were sold in a private placement under a purchase agreement, dated as of May 13, 2024 (the “Purchase Agreement”), entered into by and between the Company and each of Morgan Stanley & Co. LLC, J.P. Morgan Securities LLC, BofA Securities, Inc. and Mizuho Securities USA LLC, as representatives of the several initial purchasers named therein, for resale to persons reasonably believed to be qualified institutional buyers in reliance on Rule 144A under the Securities Act of 1933, as amended.
The aggregate principal amount of the Convertible Notes sold in the offering was $1,400, which included $200 aggregate principal amount of the Convertible Notes issued pursuant to an option to purchase, within a 13-day period beginning on, and including, the date on which the Convertible Notes were first issued, which the initial purchasers exercised in full on May 14, 2024 and which additional purchase was also completed on May 16, 2024.
The net proceeds from the offering were approximately $1,374 after deducting the initial purchasers’ discounts and commissions and estimated offering expenses paid by the Company. The Company used approximately $167 of the net proceeds from the offering to pay the cost of the capped call transactions described below. The Company used the remaining net proceeds from the offering to repay approximately $1,206 in borrowings outstanding under the USD Tranche B, together with accrued interest, as well as for general corporate purposes.
Indenture and the Convertible Notes
On May 16, 2024, the Company entered into an indenture (the “Indenture”) with respect to the Convertible Notes with U.S. Bank Trust Company, National Association, as trustee (the “Trustee”). Under the Indenture, the Convertible Notes are senior unsecured obligations of the Company and bear interest at a coupon rate of 1.25% per annum, with interest payable semiannually in arrears on June 1 and December 1 of each year, beginning on December 1, 2024. The Convertible Notes will mature on June 1, 2030, unless earlier converted, redeemed or repurchased in accordance with their terms.
Subject to certain conditions, on or after June 5, 2027, the Company may redeem for cash all or any portion of the Convertible Notes at a redemption price equal to 100% of the principal amount of the Convertible Notes to be redeemed, plus accrued and unpaid interest to, but excluding, the redemption date, if the last reported sale price of the Company’s common stock has been at least 130% of the conversion price then in effect for at least 20 trading days (whether or not consecutive) during the period of 30 consecutive trading days ending on, and including, the trading day immediately preceding the date the notice of redemption is sent.
The conversion rate for the Convertible Notes is initially 6.4799 shares of the Company’s common stock per one thousand dollars principal amount of the Convertible Notes, which is equivalent to an initial conversion price of approximately $154.32 per share. The conversion rate is subject to adjustment upon the occurrence of certain events.
Upon conversion, the Company will pay cash up to the aggregate principal amount of the Convertible Notes to be converted and pay or deliver, as the case may be, cash, shares of common stock or a combination of cash and shares of common stock, at the Company’s election, in respect of the remainder, if any, of its conversion obligation in excess of the aggregate principal amount of the Convertible Notes being converted. Prior to March 1, 2030, noteholders may convert all or any portion of their Convertible Notes only upon the occurrence of certain events and during certain periods, and thereafter, at any time until the second scheduled trading day immediately preceding the maturity date.
If the Company undergoes a fundamental change (as defined in the Indenture) prior to the maturity date of the Convertible Notes, holders may require the Company to repurchase for cash all or any portion of their Convertible Notes at a fundamental change repurchase price equal to 100% of the principal amount of the Convertible Notes to be repurchased, plus any accrued and unpaid interest to, but excluding, the fundamental change repurchase date.
The Indenture contains customary terms and covenants, including that upon certain events of default that are occurring and continuing, either the Trustee or the holders of at least 25% in aggregate principal amount of the outstanding Convertible Notes may declare 100% of the principal of, and accrued and unpaid interest, if any, on, all the Convertible Notes to be due and payable.
As of December 31, 2024, the Convertible Notes are classified as a long-term liability, net of issuances costs, on the consolidated balance sheet. The Convertible Notes were issued at par and costs associated with the issuance of the Convertible Notes are amortized to interest expense over the contractual term of the Convertible Notes. As of December 31, 2024, the effective interest rate of the Convertible Notes was 1.56%.
MKS INSTRUMENTS, INC.
NOTES TO CONSOLIDATED FINANCIAL STATEMENTS
(in millions, except per share data)
Capped Call Transactions
On May 13, 2024, in connection with the pricing of the Convertible Notes, and on May 14, 2024, in connection with the exercise in full by the initial purchasers of their option to purchase additional Convertible Notes, the Company entered into privately negotiated capped call transactions with certain of the initial purchasers of the Convertible Notes or their respective affiliates and other financial institutions. The capped call transactions are expected generally to reduce the potential dilution to the Company’s common stock upon conversion of any Convertible Notes and/or offset any cash payments that the Company is required to make in excess of the principal amount of any converted Convertible Notes, as the case may be, with such reduction and/or offset subject to a cap initially equal to $237.42 per share, which represents a premium of 100% over the last reported sale price of $118.71 per share of the Company’s common stock on The Nasdaq Global Select Market on May 13, 2024, and is subject to customary adjustments under the terms of the capped call transactions.
The Company evaluated the capped call transactions and determined that they should be accounted for separately from the Convertible Notes. The cost of $167 to purchase the capped call transactions was recorded as a reduction to additional paid-in capital in the consolidated balance sheet as the capped call transactions are indexed to the Company’s own stock and met the criteria to be classified in stockholders' equity.
The Company’s interest expense is as follows:
| | | | | | | | | | | | |
| | Years Ended December 31, | |
| | 2024 | | | 2023 | | | 2022 | |
Term Loan Facility: | | | | | | | | | |
Contractual interest expense | | $ | 302 | | | $ | 391 | | | $ | 128 | |
Amortization of debt issuance costs as interest expense | | | 26 | | | | 31 | | | | 55 | |
Total interest expense on Term Loan Facility | | $ | 328 | | | $ | 422 | | | $ | 183 | |
Convertible Notes: | | | | | | | | | |
Contractual interest expense | | $ | 11 | | | $ | — | | | $ | — | |
Amortization of debt issuance costs as
interest expense | | | 3 | | | | — | | | | — | |
Total interest expense on Convertible Notes | | $ | 14 | | | $ | — | | | $ | — | |
Other interest expense, net (1) | | $ | (58 | ) | | $ | (66 | ) | | $ | (6 | ) |
Total interest expense | | $ | 284 | | | $ | 356 | | | $ | 177 | |
(1)Other interest expense, net primarily consists of interest (income) expense related to the Company’s interest rate swap and interest rate cap agreements.
Lines of Credit and Borrowing Arrangements
Certain of the Company’s Japanese subsidiaries have lines of credit and a financing facility with various financial institutions, many of which generally expire and are renewed at three-month intervals with the remaining having no expiration date. The lines of credit and financing facility provided for aggregate borrowings as of December 31, 2024 and December 31, 2023 of up to an equivalent of $19 and $14, respectively. There were no borrowings outstanding under these arrangements at December 31, 2024 or December 31, 2023.
Contractual maturities of the Company’s debt obligations as of December 31, 2024 are as follows:
| | | | |
Year | | Amount | |
2025 | | | 50 | |
2026 | | | 50 | |
2027 | | | 50 | |
2028 | | | 50 | |
2029 | | | 3,049 | |
Thereafter | | | 1,400 | |
MKS INSTRUMENTS, INC.
NOTES TO CONSOLIDATED FINANCIAL STATEMENTS
(in millions, except per share data)
(16)Other Current Liabilities
Other current liabilities consisted of the following:
| | | | | | | | |
| | December 31, 2024 | | | December 31, 2023 | |
Accrued compensation and other employee-related obligations | | $ | 124 | | | $ | 159 | |
Deferred revenue and customer advances | | | 71 | | | | 77 | |
Income taxes payable | | | 64 | | | | 57 | |
Lease liabilities | | | 31 | | | | 30 | |
Other | | | 94 | | | | 105 | |
Total other current liabilities | | $ | 384 | | | $ | 428 | |
A reconciliation of the Company’s effective tax rate to the U.S. federal income tax statutory rate is as follows:
| | | | | | | | | | | | |
| | Years Ended December 31, | |
| | 2024 | | | 2023 | | | 2022 | |
U.S. federal income tax statutory rate | | | 21.0 | % | | | 21.0 | % | | | 21.0 | % |
Foreign derived intangible income deduction | | | (24.9 | ) | | | 0.6 | | | | (4.8 | ) |
Change in valuation allowance | | | (22.7 | ) | | | 0.1 | | | | (0.3 | ) |
Withholding taxes, net of foreign tax credits | | | 15.4 | | | | (0.4 | ) | | | 10.9 | |
Federal tax credits | | | (11.7 | ) | | | 1.5 | | | | (1.5 | ) |
Effect of foreign operations taxed at various rates | | | (8.9 | ) | | | 0.9 | | | | (6.8 | ) |
Change in income tax reserves (including interest) | | | 6.7 | | | | (0.5 | ) | | | 0.8 | |
Base erosion waiver of deductions | | | 5.6 | | | | — | | | | — | |
State income taxes, net of federal benefit | | | (3.0 | ) | | | 0.5 | | | | (0.3 | ) |
Executive compensation | | | 1.8 | | | | (0.1 | ) | | | 0.7 | |
Foreign subpart F income taxed in the U.S., net of foreign tax credits | | | 1.6 | | | | — | | | | (0.2 | ) |
Global intangible low taxed income, net of foreign tax credits | | | 1.0 | | | | 0.2 | | | | 3.6 | |
Goodwill impairment | | | — | | | | (18.4 | ) | | | — | |
Other | | | 12.4 | | | | (0.9 | ) | | | — | |
| | | (5.7 | )% | | | 4.5 | % | | | 23.1 | % |
MKS INSTRUMENTS, INC.
NOTES TO CONSOLIDATED FINANCIAL STATEMENTS
(in millions, except per share data)
The components of income (loss) before income taxes and the related (benefit) provision for income taxes consist of the following:
| | | | | | | | | | | | |
| | Years Ended December 31, | |
| | 2024 | | | 2023 | | | 2022 | |
Income (loss) before income taxes: | | | | | | | | | |
United States | | $ | (57 | ) | | $ | (760 | ) | | $ | (90 | ) |
Foreign | | | 237 | | | | (1,168 | ) | | | 523 | |
| | $ | 180 | | | $ | (1,928 | ) | | $ | 433 | |
Current taxes: | | | | | | | | | |
Federal | | $ | 91 | | | $ | 21 | | | $ | 40 | |
State | | | 13 | | | | 6 | | | | 7 | |
Foreign | | | 112 | | | | 120 | | | | 99 | |
| | | 216 | | | | 147 | | | | 146 | |
Deferred taxes: | | | | | | | | | |
Federal | | | (106 | ) | | | (130 | ) | | | (68 | ) |
State | | | (20 | ) | | | (18 | ) | | | (8 | ) |
Foreign | | | (100 | ) | | | (86 | ) | | | 30 | |
| | | (226 | ) | | | (234 | ) | | | (46 | ) |
(Benefit) provision for income taxes | | $ | (10 | ) | | $ | (87 | ) | | $ | 100 | |
The significant components of the deferred tax assets and deferred tax liabilities are as follows:
| | | | | | | | |
| | December 31, | |
| | 2024 | | | 2023 | |
Deferred tax assets: | | | | | | |
Interest expense carryforwards | | $ | 178 | | | $ | 171 | |
Net operating loss carryforwards | | | 71 | | | | 85 | |
Tax credit carryforwards | | | 34 | | | | 22 | |
Capitalized research and development | | | 146 | | | | 98 | |
Lease liability | | | 49 | | | | 51 | |
Inventory and warranty reserves | | | 48 | | | | 54 | |
Accrued expenses and other reserves | | | 30 | | | | 23 | |
Other | | | 9 | | | | 15 | |
Total deferred tax assets | | | 565 | | | | 519 | |
Valuation allowance | | | (151 | ) | | | (190 | ) |
Net deferred tax assets | | $ | 414 | | | $ | 329 | |
| | | | | | |
Deferred tax liabilities: | | | | | | |
Acquired intangible assets and goodwill | | $ | (558 | ) | | $ | (637 | ) |
Right-of-use asset | | | (48 | ) | | | (49 | ) |
Foreign withholding taxes | | | (40 | ) | | | (50 | ) |
Loan costs | | | (9 | ) | | | (24 | ) |
Depreciation and amortization | | | (4 | ) | | | (56 | ) |
Total deferred tax liabilities | | | (659 | ) | | | (816 | ) |
Net deferred tax liabilities | | $ | (245 | ) | | $ | (487 | ) |
On a quarterly basis, the Company evaluates both positive and negative evidence that affects the realizability of its net deferred tax assets and assesses the need for a valuation allowance. The future benefit to be derived from its deferred tax assets is dependent upon its ability to generate sufficient future taxable income to realize the assets.
During 2024, the Company decreased its valuation allowance by $39, primarily related to the valuation allowance recorded in connection with certain foreign interest and net operating loss carryforwards. During 2023, the Company increased its valuation allowance by $9, primarily related to the valuation allowance recorded in connection with certain foreign interest and net operating loss carryforwards.
MKS INSTRUMENTS, INC.
NOTES TO CONSOLIDATED FINANCIAL STATEMENTS
(in millions, except per share data)
Deferred taxes have been recorded related to historical outside basis differences, primarily unremitted earnings, of certain of the Company’s foreign subsidiaries. During 2024, the Company recorded a tax benefit of $8 related to such taxes for prior periods.
As of December 31, 2024, the Company had U.S. federal and state as well as foreign gross research and other tax credit carryforwards of $16, $39 and $0, respectively. Included in the total carryforwards are $1 of federal and $20 of state credits that can be carried forward indefinitely while the remaining credits expire at various dates through 2038.
The Company also had U.S. federal and state as well as foreign gross net operating loss and capital loss carryforwards of $3, $41 and $273, respectively. Included in the total carryforwards are $2, $1 and $50 of losses from federal, state and foreign that can be carried forward indefinitely while the remaining losses expire at various dates through 2043.
The Company had $371 and $362 of U.S. federal and foreign interest carryforwards, respectively, that can be carried forward indefinitely.
Although the Company believes that its tax positions are consistent with applicable U.S. federal, state and international laws, it maintains certain income tax reserves as of December 31, 2024 in the event its tax positions were to be challenged by the applicable tax authority and additional tax assessed upon audit.
A reconciliation of the beginning and ending amount of gross unrecognized tax benefits, excluding interest and penalties, is as follows:
| | | | | | | | | | | | |
| | Years Ended December 31, | |
| | 2024 | | | 2023 | | | 2022 | |
Balance at beginning of year | | $ | 86 | | | $ | 83 | | | $ | 43 | |
(Decreases) increases for tax positions taken during prior years | | | (4 | ) | | | (5 | ) | | | 35 | |
Increases for tax positions taken during the current year | | | 36 | | | | 12 | | | | 9 | |
Reductions related to expiration of statutes of limitations and audit settlements | | | (24 | ) | | | (4 | ) | | | (4 | ) |
Balance at end of year | | $ | 94 | | | $ | 86 | | | $ | 83 | |
The net increase in gross unrecognized tax benefits in 2024 was primarily due to the addition of income tax reserves related to intercompany transactions. The Company also recorded an offsetting asset of $18 against these reserves.
The Company accrues interest and, if applicable, penalties for any uncertain tax positions. Interest and penalties are classified as a component of income tax (benefit) expense. As of December 31, 2024, 2023 and 2022, the Company accrued interest on unrecognized tax benefits of approximately $8, $7 and $6, respectively.
Over the next 12 months, it is reasonably possible that the Company may recognize approximately $3 of previously net unrecognized tax benefits, excluding interest and penalties, related to various U.S. federal and state as well as foreign tax positions, primarily due to the expiration of statutes of limitations.
The Company is subject to examination by U.S. federal and state as well as foreign tax authorities. The U.S. federal statute of limitations remains open for tax years 2020 through the present. The statute of limitations for the Company’s tax filings in other jurisdictions varies between fiscal years 2019 through present. The Company also has certain prior year federal credit carryforwards and state tax loss and credit carryforwards that are subject to examination to the extent used in an open year.
(18)Stock-Based Compensation
Employee Stock Purchase Plans
The 2014 ESPP was adopted by the Board of Directors on February 10, 2014 and approved by the Company’s stockholders on May 5, 2014. The 2014 ESPP authorizes the issuance of up to an aggregate of 2.5 shares of common stock to participating employees. Offerings under the 2014 ESPP commence on June 1 and December 1 and terminate on November 30 and May 31, respectively. Under the 2014 ESPP, eligible employees can purchase shares of common stock through payroll deductions up to 10% of their compensation, up to a defined maximum annual amount. The price at which an employee’s purchase option is exercised for each offering period is the lower of (1) 90% of the closing price of the common stock on the Nasdaq Global Select Market on the day that the offering commences, or (2) 90% of the closing price of the common stock on the day that the offering terminates. The Company issued 0.1 shares of common stock
MKS INSTRUMENTS, INC.
NOTES TO CONSOLIDATED FINANCIAL STATEMENTS
(in millions, except per share data)
during each of 2024, 2023 and 2022 to employees who participated in the 2014 ESPP at exercise prices of $102.28 and $75.77 per share in 2024, $74.95 and $74.30 per share in 2023, and $111.15 and $75.47 per share in 2022. The Company recorded an immaterial amount of compensation expense related to the 2014 ESPP in 2024, 2023 and 2022. As of December 31, 2024 there were 1.2 shares reserved for future issuance under the 2014 ESPP.
Equity Incentive Plans
Prior to May 10, 2022, the Company granted RSUs to employees and directors under the 2014 Stock Incentive Plan (the “2014 Plan”). Following shareholder approval of the 2022 Stock Incentive Plan (the “2022 Plan,” and together with the 2014 Plan, the “Plans”) on May 10, 2022, the Company discontinued granting RSUs to employees and directors under the 2014 Plan and began granting them under the 2022 Plan. The Plans are administered by the Compensation Committee of the Company's Board of Directors. The Plans are intended to attract and retain employees and directors, and to provide an incentive for these individuals to assist the Company to achieve long-range performance goals and enable these individuals to participate in the long-term growth of the Company. Up to 6.6 shares of common stock (subject to adjustment in the event of stock splits and other similar events) may be issued pursuant to awards granted under the 2022 Plan. The Company may grant options, RSUs, restricted stock, stock appreciation rights (“SARs”) and other stock-based awards to employees, officers, directors, consultants and advisors under the 2022 Plan. Any full-value awards granted under the 2022 Plan will be counted against the shares reserved for issuance under the 2022 Plan as 1.91 shares for each share of common stock subject to such award. Any award granted under the 2022 Plan that is not a full-value award (including, without limitation, any option or SAR) will be counted against the shares reserved for issuance under the plan on a one-for-one basis of common stock subject to such award. “Full-value award” means any restricted stock, RSUs, or other stock-based award with a per share price or per unit purchase price lower than 100% of fair market value on the date of grant. To the extent an award that is not a full-value award is returned to the 2022 Plan, the share reserve under the 2022 Plan will be credited with one share. To the extent that a full-value award is returned to the 2022 Plan, the share reserve under the 2022 Plan will be credited with 1.91 shares. As of December 31, 2024, there were 3.9 shares reserved for future issuance under the 2022 Plan.
Time-based RSUs granted to employees generally vest 33% per year beginning on the first anniversary of the date of grant. Adjusted EBITDA RSUs granted to the Company’s executive officers in 2024, 2023 and 2022 were based on the Company’s achievement of adjusted EBITDA for each respective year, defined as GAAP operating income excluding any charges or income not related to the operating performance of the Company plus depreciation and stock compensation expense, set at varying revenue levels. The final number of Adjusted EBITDA RSUs that vest varies based on the level of performance achieved from 0% to 200% of the underlying target shares granted in 2024, 2023 and 2022. The Adjusted EBITDA RSUs earned generally vest 33% per year beginning on the first anniversary of the date of grant. For rTSR RSUs, the vesting is dependent on the Company's total shareholder return relative to a group of peers over the performance period.
RSUs granted to certain employees who meet certain retirement eligibility requirements will vest in full upon each such employee’s retirement and are expensed immediately. RSUs granted to directors generally vest at the earliest of (1) one day prior to the next annual meeting, (2) 13 months from date of grant, or (3) the effective date of a change in control of the Company.
MKS INSTRUMENTS, INC.
NOTES TO CONSOLIDATED FINANCIAL STATEMENTS
(in millions, except per share data)
The Company determines the fair value of time-based RSUs based on the closing market price of the Company’s common stock on the date of the award. The Company determines the original fair value of Adjusted EBITDA RSUs based upon the closing market price of the Company’s stock on the date of the award and adjusts the fair value quarterly during the first year based upon actual and forecasted results against Adjusted EBITDA targets. The Company estimates the fair value of rTSR RSUs using the Monte Carlo simulation model, which requires the use of highly subjective and complex assumptions, including the price volatility of the underlying stock. The Company recorded an immaterial amount of compensation expense related to the rTSR RSUs in 2024. Such values are recognized as expense on a straight-line basis for time-based awards and rTSR RSUs and using the accelerated graded vesting method for Adjusted EBITDA RSUs, all over the requisite service periods.
The following tables present the activity for the RSUs under the Plans:
| | | | | | | | |
| | Year Ended December 31, 2024 | |
| | Quantity | | | Weighted Average Grant Date Fair Value Per Share | |
RSUs — beginning of period | | | 1.0 | | | $ | 98.36 | |
Granted | | | 0.5 | | | $ | 121.24 | |
Vested or forfeited | | | (0.6 | ) | | $ | 106.42 | |
RSUs — end of period | | | 0.9 | | | $ | 104.83 | |
| | | | | | | | |
| | Year Ended December 31, 2023 | |
| | Quantity | | | Weighted Average Grant Date Fair Value Per Share | |
RSUs — beginning of period | | | 0.8 | | | $ | 118.96 | |
Granted | | | 0.7 | | | $ | 87.03 | |
Vested or forfeited | | | (0.5 | ) | | $ | 117.10 | |
RSUs — end of period | | | 1.0 | | | $ | 98.36 | |
| | | | | | | | |
| | Year Ended December 31, 2022 | |
| | Quantity | | | Weighted Average Grant Date Fair Value Per Share | |
RSUs — beginning of period | | | 0.5 | | | $ | 127.93 | |
RSUs issued in Atotech Acquisition | | | 0.1 | | | $ | 110.30 | |
Granted | | | 0.5 | | | $ | 111.60 | |
Vested | | | (0.3 | ) | | $ | 118.06 | |
RSUs — end of period | | | 0.8 | | | $ | 118.96 | |
MKS INSTRUMENTS, INC.
NOTES TO CONSOLIDATED FINANCIAL STATEMENTS
(in millions, except per share data)
The total fair value of RSUs vested during 2024, 2023 and 2022 was approximately $66, $40 and $40, respectively. As of December 31, 2024, the unrecognized compensation cost related to RSUs was approximately $45 and will be recognized over an estimated weighted average amortization period of 1 year.
Stock-Based Compensation Expense
The Company recognized the full impact of its share-based payment plans in the consolidated statements of operations and comprehensive income (loss). The following table reflects the effect of recording stock-based compensation:
| | | | | | | | | | | | |
| | Years Ended December 31, | |
| | 2024 | | | 2023 | | | 2022 | |
Stock-based compensation expense by type of award: | | | | | | | | | |
RSUs | | $ | 46 | | | $ | 51 | | | $ | 42 | |
Employee stock purchase plan | | | 2 | | | | 3 | | | | 3 | |
Total stock-based compensation | | | 48 | | | | 54 | | | | 45 | |
(Excess tax benefit)/shortfall from stock-based compensation | | | (5 | ) | | | 2 | | | | (1 | ) |
Net effect on net income (loss) | | $ | 43 | | | $ | 56 | | | $ | 44 | |
Effect on net earnings (loss) per share: | | | | | | | | | |
Basic | | $ | 0.64 | | | $ | 0.84 | | | $ | 0.74 | |
Diluted | | $ | 0.64 | | | $ | 0.84 | | | $ | 0.73 | |
The pre-tax effect within the consolidated statements of operations and comprehensive income (loss) of recording stock-based compensation was as follows:
| | | | | | | | | | | | |
| | Years Ended December 31, | |
| | 2024 | | | 2023 | | | 2022 | |
Cost of revenues | | $ | 6 | | | $ | 6 | | | $ | 5 | |
Research and development expense | | | 7 | | | | 7 | | | | 6 | |
Selling, general and administrative expense | | | 35 | | | | 41 | | | | 34 | |
Total pre-tax stock-based compensation expense | | $ | 48 | | | $ | 54 | | | $ | 45 | |
Share Repurchase Program
On July 25, 2011, the Company’s Board of Directors approved a share repurchase program for the repurchase of up to an aggregate of $200 of its outstanding common stock from time to time in open market purchases, privately negotiated transactions or through other appropriate means. The timing and quantity of any shares repurchased will depend upon a variety of factors, including business conditions, stock market conditions and business development activities, including, but not limited to, merger and acquisition opportunities. These repurchases may be commenced, suspended or discontinued at any time without prior notice. The Company has repurchased approximately 2.6 shares of common stock for approximately $127 pursuant to the program since its adoption. During 2024, 2023 and 2022, there were no repurchases of common stock.
Cash Dividends
Holders of the Company’s common stock are entitled to receive dividends when they are declared by the Company’s Board of Directors. The Company’s Board of Directors declared a cash dividend of $0.22 per share during each quarter of 2024, which totaled $59 or $0.88 per share. The Company’s Board of Directors declared a cash dividend of $0.22 per share during each quarter of 2023, which totaled $59 or $0.88 per share.
On February 10, 2025, the Company’s Board of Directors declared a quarterly cash dividend of $0.22 per share to be paid on March 7, 2025 to Stockholders of record as of February 24, 2025.
MKS INSTRUMENTS, INC.
NOTES TO CONSOLIDATED FINANCIAL STATEMENTS
(in millions, except per share data)
Future dividend declarations, if any, as well as the record and payment dates for such dividends, are subject to the final determination of the Company’s Board of Directors.
(20)Employee Benefit Plans
The Company has a 401(k) profit-sharing plan for U.S. employees meeting certain requirements, in which eligible employees may contribute between 1% and 50% of their annual compensation to this plan, and, with respect to employees who are age 50 and older, certain specified additional amounts, limited by an annual maximum amount determined by the Internal Revenue Service. The Company, at its discretion, makes certain matching contributions to this plan based on participating employees’ annual contribution to this plan and their total compensation. The Company’s contributions were $9, $9 and $10 for 2024, 2023 and 2022, respectively.
The Company also has a number of defined contribution plans at some of its foreign locations. The Company’s contributions were immaterial for 2024, 2023 and 2022.
The Company maintains a management incentive bonus plan (“MIP”) which provides cash awards to certain employees, at the discretion of the Compensation Committee of the Company’s Board of Directors, based upon certain metrics tied to the Company’s consolidated financial results. In addition, certain of the Company’s foreign locations also have various bonus plans, which in 2024 were generally based upon the same consolidated financial results as the MIP. In 2023 and 2022, these foreign bonus plans were based upon local operating results and employee performance. The Company may also grant certain sign-on and spot bonuses when applicable. The total bonus expense was $38, $63 and $48 for 2024, 2023 and 2022, respectively.
Defined Benefit Pension Plans.
The Company has a number of defined benefit pension plans at many of its foreign locations covering some employees at these respective locations. The majority of these defined benefit plans are frozen and do not allow new employees to join the plans. One of the Company’s German pension plans is unfunded, as permitted under the plan and applicable laws.
For financial reporting purposes, the Company obtained actuarial reports supporting the calculations of net periodic pension costs that used a number of actuarial assumptions, including a discount rate for plan obligations, an assumed rate of return on pension plan assets and an assumed rate of compensation increase for employees covered by the various plans. The Company reviewed these actuarial assumptions and concluded they were reasonable based upon management’s judgment, considering known trends and uncertainties. Actual results that differ from these assumptions would impact future expense recognition and the cash funding requirements of the Company’s pension plans.
The net periodic benefit costs for the defined benefit plans included the following components:
| | | | | | | | |
| | Year Ended December 31, | |
| | 2024 | | | 2023 | |
Service cost | | $ | 2 | | | $ | 2 | |
Interest cost on projected benefit obligations | | | 5 | | | | 5 | |
Expected return on plan assets | | | (1 | ) | | | (1 | ) |
| | $ | 6 | | | $ | 6 | |
MKS INSTRUMENTS, INC.
NOTES TO CONSOLIDATED FINANCIAL STATEMENTS
(in millions, except per share data)
The changes in projected benefit obligations and plan assets, as well as the ending balance sheet amounts for the Company’s defined benefit plans, were as follows:
| | | | | | | | |
| | Year Ended December 31, | |
| | 2024 | | | 2023 | |
Change in projected benefit obligations: | | | | | | |
Projected benefit obligations, beginning of year | | $ | 154 | | | $ | 144 | |
Service cost | | | 2 | | | | 2 | |
Interest cost | | | 5 | | | | 5 | |
Actuarial (gain) loss | | | (5 | ) | | | 9 | |
Benefits paid | | | (7 | ) | | | (7 | ) |
Currency translation adjustments | | | (9 | ) | | | 1 | |
Projected benefit obligations, end of year | | $ | 140 | | | $ | 154 | |
| | | | | | |
Change in plan assets: | | | | | | |
Fair value of plan assets, beginning of year | | | 34 | | | | 31 | |
Company contributions | | | 1 | | | | 3 | |
Gain (loss) on plan assets | | | 2 | | | | 2 | |
Benefits paid | | | (3 | ) | | | (3 | ) |
Currency translation adjustments | | | (2 | ) | | | 1 | |
Fair value of plan assets, end of year | | | 32 | | | | 34 | |
Net underfunded status | | $ | (108 | ) | | $ | (120 | ) |
As of December 31, 2024, the estimated benefit payments for the Company’s defined benefit plans for the next 10 years were as follows:
| | | | |
| | Estimated benefit
payments | |
2025 | | $ | 7 | |
2026 | | | 8 | |
2027 | | | 8 | |
2028 | | | 8 | |
2029 | | | 8 | |
2030-2034 | | | 41 | |
| | $ | 80 | |
The Company expects to contribute less than $1 to the plans during 2025.
The weighted-average rates used to determine the net periodic benefit costs were as follows:
| | | | | | | | |
| | December 31,
2024 | | | December 31,
2023 | |
Discount rate | | | 3.3 | % | | | 3.3 | % |
Rate of increase in salary levels | | | 3.7 | % | | | 3.1 | % |
Expected long-term rate of return on assets | | | 3.0 | % | | | 2.7 | % |
In determining the expected long-term rate of return on plan assets, the Company considers the relative weighting of plan assets, the historical performance of total plan assets and individual asset classes, and economic and other indicators of future performance.
MKS INSTRUMENTS, INC.
NOTES TO CONSOLIDATED FINANCIAL STATEMENTS
(in millions, except per share data)
Plan assets were held in the following categories as a percentage of total plan assets:
| | | | | | | | | | | | | | | | |
| | December 31, 2024 | | | December 31, 2023 | |
| | Amount | | | Percentage | | | Amount | | | Percentage | |
Debt securities | | $ | 17 | | | | 54 | % | | $ | 18 | | | | 54 | % |
Equity securities | | | 8 | | | | 25 | | | | 9 | | | | 24 | |
Cash | | | 3 | | | | 10 | | | | 3 | | | | 10 | |
Other | | | 4 | | | | 11 | | | | 4 | | | | 12 | |
| | $ | 32 | | | | 100 | % | | $ | 34 | | | | 100 | % |
In general, the Company’s asset management objectives include maintaining an adequate level of diversification to reduce interest rate and market risk, while providing adequate liquidity to meet immediate and future benefit payment requirements.
The Company’s Israeli plans account for the deferred vested benefits using the shut-down method of accounting, which resulted in assets of $22 and vested benefit obligations of $24 as of December 31, 2024 and assets of $19 and vested benefit obligations of $22 as of December 31, 2023. Under the shut-down method, the liability is calculated as if it were payable as of the balance sheet date, on an undiscounted basis.
Other Pension-Related Assets
As of December 31, 2024 and 2023, the Company had assets with an aggregate market value of $6 for each period, for one of its German pension plans. These assets are invested in group insurance contracts through the insurance companies administering these plans, in accordance with applicable pension laws. These group insurance contracts have a guaranteed minimum rate of return ranging from 2.25% to 4.00% in 2024 and 2.00% to 4.25% in 2023, depending on the contract. Because these assets were not separate legal assets of the pension plan, they were not included in the Company’s plan assets shown above. However, the Company has designated such assets to pay pension benefits. Such assets are included in other assets in the accompanying consolidated balance sheet.
(21)Business Segment, Geographic Area, Product Information and Significant Customer Information
Reportable Segments and Products
The Company’s CODM, which is the Company’s Chief Executive Officer, utilizes financial information to make decisions about allocating resources and assessing performance for the entire Company, which is used in the decision-making process to assess performance. The Company has a diverse base of customers across its three end markets, semiconductor, electronics and packaging, and specialty industrial. Segment gross margin is the primary measure used by the CODM to assess segment performance and to decide how to allocate resources. The Company’s CODM assesses segment performance and decides how to allocate resources using segment gross margin among other measures. Gross margin is utilized to drive decisions in the annual forecasting process when making decisions about allocating capital and personnel to the segments.
The Company has three reporting segments, VSD, PSD and MSD as described below.
VSD delivers foundational technology solutions to semiconductor manufacturing, electronics and packaging and specialty industrial applications. VSD products are derived from the Company’s core competencies in vacuum technologies, including pressure measurement and control, flow measurement and control, gas and vapor delivery, gas composition analysis, electronic control technology, reactive gas generation and delivery, power generation and delivery, and fiber optic temperature and position sensing.
PSD provides a broad range of solutions including lasers, beam measurement and profiling, precision motion control, vibration isolation systems, photonics instruments, opto-mechanical components, optical elements, laser-based systems for flexible PCB laser processing, laser-based systems for high-density interconnect PCB and package substrate manufacturing.
MSD develops leading process and manufacturing technologies for advanced surface modification, electroless and electrolytic plating, and surface finishing. Applying a comprehensive systems-and-solutions approach, MSD’s portfolio includes chemistry, equipment and services for innovative and high-technology applications in the electronics and packaging and specialty industrial markets.
MKS INSTRUMENTS, INC.
NOTES TO CONSOLIDATED FINANCIAL STATEMENTS
(in millions, except per share data)
The Company derives its segment results directly from the manner in which results are reported in its management reporting system. The accounting policies that the Company uses to derive reportable segment results are substantially the same as those used for external reporting purposes. The Company groups its product offerings by its reportable segments, VSD, PSD, and MSD. For each reportable segment, the Company also provides services relating to the maintenance and repair of its products, installation services and training. Unallocated corporate expenses represent those costs not specifically related to the operations of each segment and are managed separately at the corporate level and primarily relate to labor costs of global functions such as supply chain, quality control and operations.
The following tables sets forth the details of gross profit by reportable segment and then reconciles to income (loss) before income taxes for each year presented:
| | | | | | | | | | | | | | | | |
| | Year Ended December 31, 2024 | |
| | VSD | | | PSD | | | MSD | | | Total | |
Product | | $ | 1,144 | | | $ | 856 | | | $ | 1,124 | | | $ | 3,124 | |
Services | | | 240 | | | | 165 | | | | 57 | | | | 462 | |
Revenues by segment | | | 1,384 | | | | 1,021 | | | | 1,181 | | | | 3,586 | |
Total cost of revenues (exclusive of amortization shown separately below)(1) | | | 790 | | | | 563 | | | | 519 | | | | 1,872 | |
Segment gross profit | | | 594 | | | | 458 | | | | 662 | | | | 1,714 | |
Segment gross profit percentage | | | 42.9 | % | | | 44.9 | % | | | 56.1 | % | | | 47.8 | % |
Reconciliation to income before income taxes | | | | | | | | | | | | |
Operating expenses: | | | | | | | | | | | | |
Research and development | | | | | | | | | | | | 271 | |
Selling, general and administrative | | | | | | | | | | | | 674 | |
Acquisition and integrated costs | | | | | | | | | | | | 9 | |
Restructuring and other | | | | | | | | | | | | 6 | |
Fees and expenses related to repricing of Term Loan Facility | | | | | | | | | | | | 5 | |
Amortization of intangible assets | | | | | | | | | | | | 245 | |
Unallocated corporate expenses | | | | | | | | | | | | 6 | |
Income from operations | | | | | | | | | | | | 498 | |
Interest income | | | | | | | | | | | | (21 | ) |
Interest expense | | | | | | | | | | | | 284 | |
Loss on extinguishment of debt | | | | | | | | | | | | 57 | |
Other (income) expense, net | | | | | | | | | | | | (2 | ) |
Income before income taxes | | | | | | | | | | | $ | 180 | |
MKS INSTRUMENTS, INC.
NOTES TO CONSOLIDATED FINANCIAL STATEMENTS
(in millions, except per share data)
| | | | | | | | | | | | | | | | |
| | Year Ended December 31, 2023 | |
| | VSD | | | PSD | | | MSD | | | Total | |
Product | | $ | 1,222 | | | $ | 824 | | | $ | 1,154 | | | $ | 3,200 | |
Services | | | 218 | | | | 152 | | | | 52 | | | | 422 | |
Revenues by segment | | | 1,440 | | | | 976 | | | | 1,206 | | | | 3,622 | |
Total cost of revenues (exclusive of amortization shown separately below)(1) | | | 827 | | | | 552 | | | | 586 | | | | 1,965 | |
Segment gross profit | | | 613 | | | | 424 | | | | 620 | | | | 1,657 | |
Segment gross profit percentage | | | 42.6 | % | | | 43.4 | % | | | 51.4 | % | | | 45.7 | % |
Reconciliation to loss before income taxes | | | | | | | | | | | | |
Operating expenses: | | | | | | | | | | | | |
Research and development | | | | | | | | | | | | 288 | |
Selling, general and administrative | | | | | | | | | | | | 675 | |
Acquisition and integrated costs | | | | | | | | | | | | 16 | |
Restructuring | | | | | | | | | | | | 20 | |
Fees and expenses related to repricing of Term Loan Facility | | | | | | | | | | | | 2 | |
Amortization of intangible assets | | | | | | | | | | | | 295 | |
Goodwill and intangible asset impairment | | | | | | | | | | | | 1,902 | |
Gain on sale of long-lived assets | | | | | | | | | | | | (2 | ) |
Unallocated corporate expenses | | | | | | | | | | | | 15 | |
Loss from operations | | | | | | | | | | | | (1,554 | ) |
Interest income | | | | | | | | | | | | (17 | ) |
Interest expense | | | | | | | | | | | | 356 | |
Loss on extinguishment of debt | | | | | | | | | | | | 8 | |
Other (income) expense, net | | | | | | | | | | | | 27 | |
Loss before income taxes | | | | | | | | | | | $ | (1,928 | ) |
| | | | | | | | | | | | | | | | |
| | Year Ended December 31, 2022 | |
| | VSD | | | PSD | | | MSD | | | Total | |
Product | | $ | 1,791 | | | $ | 842 | | | $ | 486 | | | $ | 3,119 | |
Services | | | 246 | | | | 151 | | | | 31 | | | | 428 | |
Revenues by segment | | | 2,037 | | | | 993 | | | | 517 | | | | 3,547 | |
Total cost of revenues (exclusive of amortization shown separately below)(1) | | | 1,121 | | | | 537 | | | | 325 | | | | 1,983 | |
Segment gross profit | | | 916 | | | | 456 | | | | 192 | | | | 1,564 | |
Segment gross profit percentage | | | 45.0 | % | | | 45.9 | % | | | 37.1 | % | | | 44.1 | % |
Reconciliation to income before income taxes | | | | | | | | | | | | |
Operating expenses: | | | | | | | | | | | | |
Research and development | | | | | | | | | | | | 241 | |
Selling, general and administrative | | | | | | | | | | | | 488 | |
Acquisition and integrated costs | | | | | | | | | | | | 52 | |
Restructuring | | | | | | | | | | | | 10 | |
Amortization of intangible assets | | | | | | | | | | | | 146 | |
Gain on sale of long-lived assets | | | | | | | | | | | | (7 | ) |
Unallocated corporate expenses | | | | | | | | | | | | 17 | |
Income from operations | | | | | | | | | | | | 617 | |
Interest income | | | | | | | | | | | | (4 | ) |
Interest expense | | | | | | | | | | | | 177 | |
Other (income) expense, net | | | | | | | | | | | | 11 | |
Income before income taxes | | | | | | | | | | | $ | 433 | |
MKS INSTRUMENTS, INC.
NOTES TO CONSOLIDATED FINANCIAL STATEMENTS
(in millions, except per share data)
(1)The significant expense category and amount aligns with the segment-level information that is regularly provided to the CODM.
The following table set forth capital expenditures by reportable segment:
| | | | | | | | | | | | |
| | Years Ended December 31, | |
| | 2024 | | | 2023 | | | 2022 | |
VSD | | $ | 36 | | | $ | 26 | | | $ | 97 | |
PSD | | | 36 | | | | 29 | | | | 39 | |
MSD | | | 53 | | | | 32 | | | | 28 | |
Total capital expenditures | | $ | 125 | | | $ | 87 | | | $ | 164 | |
The following table sets forth depreciation and amortization by reportable segment:
| | | | | | | | | | | | |
| | Years Ended December 31, | |
| | 2024 | | | 2023 | | | 2022 | |
VSD | | $ | 44 | | | $ | 43 | | | $ | 40 | |
PSD | | | 50 | | | | 60 | | | | 72 | |
MSD | | | 254 | | | | 294 | | | | 104 | |
Total depreciation and amortization | | $ | 348 | | | $ | 397 | | | $ | 216 | |
The following table sets forth segment assets by reportable segment:
| | | | | | | | | | | | |
| | Accounts
receivable, net | | | Inventories | | | Total | |
December 31, 2024 | | | | | | | | | |
VSD | | $ | 200 | | | $ | 488 | | | $ | 688 | |
PSD | | | 168 | | | | 260 | | | | 428 | |
MSD | | | 247 | | | | 145 | | | | 392 | |
Total segment assets | | $ | 615 | | | $ | 893 | | | $ | 1,508 | |
| | | | | | | | | | | | |
| | Accounts
receivable, net | | | Inventories | | | Total | |
December 31, 2023 | | | | | | | | | |
VSD | | $ | 181 | | | $ | 553 | | | $ | 734 | |
PSD | | | 171 | | | | 283 | | | | 454 | |
MSD | | | 251 | | | | 155 | | | | 406 | |
Total segment assets | | $ | 603 | | | $ | 991 | | | $ | 1,594 | |
| | | | | | | | | | | | |
| | Accounts
receivable, net | | | Inventories | | | Total | |
December 31, 2022 | | | | | | | | | |
VSD | | $ | 274 | | | $ | 504 | | | $ | 778 | |
PSD | | | 190 | | | | 283 | | | | 473 | |
MSD | | | 256 | | | | 190 | | | | 446 | |
Total segment assets | | $ | 720 | | | $ | 977 | | | $ | 1,697 | |
MKS INSTRUMENTS, INC.
NOTES TO CONSOLIDATED FINANCIAL STATEMENTS
(in millions, except per share data)
The following tables reconciles total segment assets to total assets:
| | | | | | | | |
| | December 31, | |
| | 2024 | | | 2023 | |
Total segment assets | | $ | 1,508 | | | $ | 1,594 | |
Cash and cash equivalents | | | 714 | | | | 875 | |
Other current assets | | | 252 | | | | 227 | |
Property, plant and equipment, net | | | 771 | | | | 784 | |
Right-of-use assets, net | | | 238 | | | | 225 | |
Goodwill and intangible assets, net | | | 4,751 | | | | 5,173 | |
Other assets | | | 356 | | | | 240 | |
Total assets | | $ | 8,590 | | | $ | 9,118 | |
Goodwill associated with each of the Company’s reportable segments is as follows:
| | | | | | | | | | | | | | | | |
| | VSD | | | PSD | | | MSD | | | Total | |
Reportable segment: | | | | | | | | | | | | |
Gross goodwill at December 31, 2023 | | | 335 | | | | 1,031 | | | | 3,021 | | | | 4,387 | |
Movement of OSP product line | | | 24 | | | | (24 | ) | | | — | | | | — | |
Foreign currency translation and measurement period adjustments | | | (1 | ) | | | (4 | ) | | | (70 | ) | | | (75 | ) |
Gross goodwill at December 31, 2024 | | | 358 | | | | 1,003 | | | | 2,951 | | | | 4,312 | |
| | | | | | | | | | | | |
Accumulated goodwill impairment at December 31, 2023 | | | (141 | ) | | | (390 | ) | | | (1,302 | ) | | | (1,833 | ) |
Impairment charge | | | — | | | | — | | | | — | | | | — | |
Accumulated goodwill impairment at December 31, 2024 | | | (141 | ) | | | (390 | ) | | | (1,302 | ) | | | (1,833 | ) |
| | | | | | | | | | | | |
Goodwill, net of accumulated impairment and foreign currency translation at December 31, 2024 | | $ | 217 | | | $ | 613 | | | $ | 1,649 | | | $ | 2,479 | |
| | | | | | | | | | | | | | | | |
| | VSD | | | PSD | | | MSD | | | Total | |
Reportable segment: | | | | | | | | | | | | |
Gross goodwill at December 31, 2022 | | $ | 336 | | | $ | 1,031 | | | $ | 3,087 | | | $ | 4,454 | |
Foreign currency translation and measurement period adjustments | | | (1 | ) | | | — | | | | (66 | ) | | | (67 | ) |
Gross goodwill at December 31, 2023 | | | 335 | | | | 1,031 | | | | 3,021 | | | | 4,387 | |
| | | | | | | | | | | | |
Accumulated goodwill impairment at December 31, 2022 | | | (141 | ) | | | (5 | ) | | | — | | | | (146 | ) |
Impairment charge | | | — | | | | (385 | ) | | | (1,302 | ) | | | (1,687 | ) |
Accumulated goodwill impairment at December 31, 2023 | | | (141 | ) | | | (390 | ) | | | (1,302 | ) | | | (1,833 | ) |
| | | | | | | | | | | | |
Goodwill, net of accumulated impairment and foreign currency translation at December 31, 2023 | | $ | 194 | | | $ | 641 | | | $ | 1,719 | | | $ | 2,554 | |
Geographic Area
Information about the Company’s operations by geographic area is presented in the tables below. Starting in the second quarter of 2024, the Company changed its basis of reporting geographical net revenues from the location in which the sale originated to the shipped-to location of the end customer. Prior periods have been recast to reflect this change, which was
MKS INSTRUMENTS, INC.
NOTES TO CONSOLIDATED FINANCIAL STATEMENTS
(in millions, except per share data)
made to better align with how management reviews geographic net revenues. Intercompany sales between geographic areas are at tax transfer prices and have been eliminated from consolidated revenues.
| | | | | | | | | | | | |
| | Years Ended December 31, | |
| | 2024 | | | 2023 | | | 2022 | |
Net revenues: | | | | | | | | | |
United States | | $ | 804 | | | $ | 893 | | | $ | 1,083 | |
China | | | 775 | | | | 745 | | | | 602 | |
South Korea | | | 358 | | | | 359 | | | | 445 | |
Japan | | | 250 | | | | 280 | | | | 263 | |
Taiwan | | | 234 | | | | 248 | | | | 231 | |
Singapore | | | 229 | | | | 239 | | | | 297 | |
Other | | | 936 | | | | 858 | | | | 626 | |
| | $ | 3,586 | | | $ | 3,622 | | | $ | 3,547 | |
Long-lived assets include property, plant and equipment, net, right-of-use assets, net and certain other assets.
| | | | | | | | |
| | December 31, | |
| | 2024 | | | 2023 | |
Long-lived assets: | | | | | | |
United States | | $ | 458 | | | $ | 459 | |
China | | | 172 | | | | 163 | |
Germany | | | 125 | | | | 149 | |
Other | | | 349 | | | | 326 | |
| | $ | 1,104 | | | $ | 1,097 | |
The Company sells products and services to thousands of customers worldwide, in a wide range of end markets. Revenues from its top ten customers accounted for 32%, 30% and 42% of net revenues for 2024, 2023, and 2022, respectively.
For the years ended December 31, 2024 and 2023, no customer represented 10% or more of the Company’s net revenues. For the year ended December 31, 2022, the Company had one customer that represented 14% and one customer that represented 10% of net revenues.
(22)Restructuring and Other
Restructuring
The Company recorded restructuring charges of $4 in 2024, primarily related to severance costs incurred as a result of a global cost-saving initiative implemented in the fourth quarter of 2023. The Company recorded restructuring charges of $20 in 2023, primarily related to severance costs incurred as a result of various global cost-saving initiatives implemented in 2023.
The activity related to the Company’s restructuring accrual is shown below:
| | | | | | | | |
| | Years Ended December 31, | |
| | 2024 | | | 2023 | |
Restructuring accrual, beginning of period | | $ | 9 | | | $ | 3 | |
Charged to expense | | | 4 | | | | 20 | |
Payments and adjustments | | | (10 | ) | | | (14 | ) |
Restructuring accrual, end of period | | $ | 3 | | | $ | 9 | |
MKS INSTRUMENTS, INC.
NOTES TO CONSOLIDATED FINANCIAL STATEMENTS
(in millions, except per share data)
Other
The Company recorded other charges of $2 in 2024 related to legal matters.
(23)Commitments and Contingencies
As of December 31, 2024, the Company has entered into purchase commitments for certain inventory components and other equipment and services used in its normal operations. The majority of the purchase commitments covered by these arrangements are for periods of less than one year and aggregate to approximately $544.
Legal Proceedings
The Company is subject to various legal proceedings and claims that have arisen in the ordinary course of business. In the opinion of management, the ultimate disposition of these matters will not have a material adverse effect on the Company’s results of operations, financial condition or cash flows.
On January 24, 2025, the Company entered into the Fifth Amendment to Credit Agreement, by and among us as parent borrower, the other loan parties party thereto, JPMorgan Chase Bank, N.A., as administrative agent, and each lender party thereto (the “Fifth Amendment”). Pursuant to the Fifth Amendment, the Company (i) refinanced its existing USD Tranche B loan and Euro Tranche B loan with a new $2,529 USD Tranche B loan and a new €596 Euro Tranche B loan, (ii) decreased the applicable margin for the USD Tranche B from 2.25% to 2.00% with respect to Term SOFR borrowings and from 1.25% to 1.00% with respect to base rate borrowings, (iii) decreased the applicable margin for the Euro Tranche B from 2.75% to 2.50% and (iv) extended the period during which a 1.00% prepayment premium may be required if the Company prepays any loans under the USD Tranche B or the Euro Tranche B in connection with a repricing transaction until the date that is six months following the Fifth Amendment Effective Date. The repriced USD Tranche B loan and Euro Tranche B loan were issued without original issue discount. In connection with the execution of the Fifth Amendment, the Company paid customary fees and expenses to JPMorgan Chase Bank, N.A.
On January 24, 2025, concurrently with the effectiveness of the Fifth Amendment, the Company made a voluntary prepayment of $100 principal amount of USD Tranche B loans, reducing the principal amount of USD Tranche B loan from $2,629 to $2,529.
Item 9. Changes in and Disagreements with Accountants on Accounting and Financial Disclosure
None.
Item 9A. Controls and Procedures
Evaluation of Disclosure Controls and Procedures
Our management, with the participation of our Chief Executive Officer and Chief Financial Officer, evaluated the effectiveness of our disclosure controls and procedures as of December 31, 2024. The term “disclosure controls and procedures,” as defined in Rules 13a-15(e) and 15d-15(e) under the Securities Exchange Act of 1934, as amended (the “Exchange Act”), means controls and other procedures of an issuer that are designed to ensure that information required to be disclosed by the issuer in the reports that it files or submits under the Exchange Act is recorded, processed, summarized and reported, within the time periods specified in the Securities and Exchange Commission’s (“SEC”) rules and forms. Disclosure controls and procedures include, without limitation, controls and procedures designed to ensure that information required to be disclosed by an issuer in the reports that it files or submits under the Exchange Act is accumulated and communicated to the issuer’s management, including its principal executive and principal financial officers, or persons performing similar functions as appropriate to allow timely decisions regarding required disclosure. Management recognizes that any controls and procedures, no matter how well designed and operated, can provide only reasonable assurance of achieving their objectives and management necessarily applies its judgment in evaluating the cost-benefit relationship of possible controls and procedures. Based on that evaluation, our Chief Executive Officer and Chief Financial Officer concluded that, as of December 31, 2024, our disclosure controls and procedures were effective to provide reasonable assurance that information required to be disclosed by us in reports that we file or submit under the Exchange Act is recorded, processed, summarized and reported within the time periods specified in SEC rules and forms and is accumulated and communicated to our management, including our Chief Executive Office and Chief Financial Officer, as appropriate to allow timely decisions regarding required disclosure.
Management’s Report on Internal Control over Financial Reporting
Our management is responsible for establishing and maintaining adequate internal control over financial reporting. Internal control over financial reporting is defined in Rules 13a-15(f) and 15d-15(f) under the Exchange Act as a process designed by, or under the supervision of our Chief Executive Officer and Chief Financial Officer, and effected by our Board of Directors, management and other personnel, to provide reasonable assurance regarding the reliability of financial reporting and the preparation of financial statements for external purposes in accordance with generally accepted accounting principles and includes those policies and procedures that:
•Pertain to the maintenance of records that in reasonable detail accurately and fairly reflect the transactions and dispositions of the assets of the Company;
•Provide reasonable assurance that transactions are recorded as necessary to permit preparation of financial statements in accordance with generally accepted accounting principles, and that our receipts and expenditures of the Company are being made only in accordance with authorization of our management and directors of the Company; and
•Provide reasonable assurance regarding prevention or timely detection of unauthorized acquisition, use or disposition of our assets that could have a material effect on the financial statements.
Because of its inherent limitations, internal control over financial reporting may not prevent or detect misstatements. Projections of any evaluation of effectiveness to future periods are subject to the risk that controls may become inadequate because of changes in conditions, or that the degree of compliance with the policies or procedures may deteriorate.
Under the supervision and with the participation of our management including our Chief Executive Officer and Chief Financial Officer, we conducted an assessment of the effectiveness of our internal control over financial reporting as of December 31, 2024. In making this assessment, we used the criteria set forth in the Internal Control-Integrated Framework (2013) issued by the Committee of Sponsoring Organizations of the Treadway Commission. Based on this evaluation, our management concluded that, as of December 31, 2024, our internal control over financial reporting was effective.
Our internal control over financial reporting as of December 31, 2024 has been audited by PricewaterhouseCoopers LLP, an independent registered public accounting firm, as stated in its report, which appears in Item 8 of this Annual Report on Form 10-K.
Changes in Internal Control over Financial Reporting
There was no change in our internal control over financial reporting (as defined in Rules 13a-15(f) and 15d-15(f) under the Exchange Act) during the quarter ended December 31, 2024 that has materially affected, or is reasonably likely to materially affect, our internal control over financial reporting.
Item 9B. Other Information
For the three months ended December 31, 2024, none of our directors or officers (as defined in Rule 16a-1(f) under the Exchange Act) adopted or terminated a trading arrangement for the sale or purchase of Company securities that is either (1) a contract, instruction or written plan intended to satisfy the affirmative defense conditions of Rule 10b5-1(c) or (2) a “non-Rule 10b5-1 trading arrangement” (as defined in Item 408(c) of Regulation S-K).
Item 9C. Disclosure Regarding Foreign Jurisdictions that Prevent Inspections
Not applicable.
PART III
Item 10. Directors, Executive Officers and Corporate Governance
The information required by this item will be set forth under the captions “Proposal One — Election of Directors,” “Directors,” “Corporate Governance,” “Executive Officers,” “Corporate Governance — Code of Business Conduct and Ethics” and “Corporate Governance — Board of Directors Meetings and Committees of the Board of Directors — Audit Committee” in our definitive proxy statement for the 2025 Annual Meeting of Stockholders, to be filed with the Securities and Exchange Commission (“SEC”) no later than 120 days after the end of our fiscal year, and is incorporated herein by reference.
We are also required under Item 405 of Regulation S-K to provide information concerning delinquent filers of reports under Section 16 of the Securities and Exchange Act of 1934, as amended. This information will be set forth under the caption “Delinquent Section 16(a) Reports,” if applicable, in our definitive proxy statement for the 2025 Annual Meeting of Stockholders, to be filed with the SEC no later than 120 days after the end of our fiscal year, and is incorporated herein by reference.
Item 11. Executive Compensation
The information required by this item will be set forth under the captions “Executive Officers,” “Executive Compensation – Compensation Discussion and Analysis,” “Corporate Governance – Board of Director Meetings and Committees of the Board of Directors – Compensation Committee - Compensation Committee Interlocks and Insider Participation,” “Compensation Committee Report” and “Director Compensation” in our definitive proxy statement for the 2025 Annual Meeting of Stockholders, to be filed with the SEC no later than 120 days after the end of our fiscal year, and, other than the information required by Item 402(v) of Regulation S-K, is incorporated herein by reference.
Item 12. Security Ownership of Certain Beneficial Owners and Management and Related Stockholder Matters
The information required by Item 403 of Regulation S-K will be set forth under the caption “Security Ownership of Certain Beneficial Owners and Management” in our definitive proxy statement for the 2025 Annual Meeting of Stockholders, to be filed with the SEC no later than 120 days after the end of our fiscal year, and is incorporated herein by reference.
The information required by Item 201(d) of Regulation S-K will be set forth under the caption “Equity Compensation Plan Information” in our definitive proxy statement for the 2025 Annual Meeting of Stockholders, to be filed with the SEC no later than 120 days after the end of our fiscal year, and is incorporated herein by reference.
Item 13. Certain Relationships and Related Transactions and Director Independence
The information required by this item will be set forth under the captions “Corporate Governance – Board Independence” and “Corporate Governance – Transactions with Related Persons” in our definitive proxy statement for the 2025 Annual Meeting of Stockholders, to be filed with the SEC no later than 120 days after the end of our fiscal year, and is incorporated herein by reference.
Item 14. Principal Accountant Fees and Services
The information required by this item will be set forth under the caption “Audit and Financial Accounting Oversight — Principal Accountant Fees and Services” in our definitive proxy statement for the 2025 Annual Meeting of Stockholders, to be filed with the SEC no later than 120 days after the end of our fiscal year, and is incorporated herein by reference.
PART IV
Item 15. Exhibits and Financial Statement Schedules
(a)The following documents are filed as a part of this Annual Report on Form 10-K:
1.Financial Statements. The following Consolidated Financial Statements are included under Item 8 of this Annual Report on Form 10-K.
INDEX TO CONSOLIDATED FINANCIAL STATEMENTS
2.Financial Statement Schedules. The following consolidated financial statement schedule is included in this Annual Report on Form 10-K.
Schedule II – Valuation and Qualifying Accounts
Schedules other than those listed above have been omitted since they are either not required or information is otherwise included.
3.Exhibits. The following exhibits are filed as part of this Annual Report on Form 10-K.
| | |
Exhibit No. | | Title |
| | |
+3.1(1) | | Restated Articles of Organization of the Registrant |
| | |
+3.2(2) | | Articles of Amendment to Restated Articles of Organization, as filed with the Secretary of State of Massachusetts on May 18, 2001 |
| | |
+3.3(3) | | Articles of Amendment to Restated Articles of Organization, as filed with the Secretary of State of Massachusetts on May 16, 2002 |
| | |
+3.4(4) | | Second Amended and Restated By-Laws of the Registrant |
| | |
4.1 | | Specimen certificate representing the Common Stock |
| | |
+4.2(5) | | Description of Capital Stock Registered Under Section 12 of the Exchange Act |
| | |
+4.3(6) | | Indenture, dated May 16, 2024, between the Registrant and U.S. Bank Trust Company, National Association, as trustee |
| | |
+4.4(6) | | Form of Global Note (included with Exhibit 4.3) |
| | |
+10.1(7) | | Credit Agreement, dated as of August 17, 2022, by and among the Registrant, the lenders and letter of credit issuers party thereto and JPMorgan Chase Bank, N.A., as administrative agent and collateral agent |
| | |
+10.2(8) | | First Amendment to Credit Agreement, dated as of October 3, 2023, by and among the Registrant, as parent borrower, the other loan parties party thereto, JPMorgan Chase Bank, N.A., as administrative agent, and each lender party thereto |
| | |
Exhibit No. | | Title |
| | |
+10.3(9) | | Second Amendment to Credit Agreement, dated as of January 22, 2024, by and among the Registrant, as parent borrower, the other loan parties party thereto, JPMorgan Chase Bank, N.A., as administrative agent, and each lender party thereto |
| | |
+10.4(10) | | Third Amendment to Credit Agreement, dated as of February 13, 2024, by and among the Registrant, as parent borrower, the other loan parties party thereto, JPMorgan Chase Bank, N.A., as administrative agent, and each lender and letter of credit issuer party thereto |
| | |
+10.5(11) | | Fourth Amendment to Credit Agreement, dated as of July 23, 2024, by and among the Registrant, as parent borrower, the other loan parties party thereto, JPMorgan Chase Bank, N.A., as administrative agent, and each lender and letter of credit issuer party thereto |
| | |
+10.6(12) | | Fifth Amendment to Credit Agreement, dated as of January 24, 2025, by and among the Registrant, as parent borrower, the other loan parties party thereto, JPMorgan Chase Bank, N.A., as administrative agent, and each lender and letter of credit issuer party thereto |
| | |
+10.7(13)* | | 2022 Stock Incentive Plan |
| | |
+10.8(14)* | | Form of Restricted Stock Unit Agreement for Non-Employee Directors under the 2022 Stock Incentive Plan for 2022-2024 |
| | |
10.9* | | Form of Restricted Stock Unit Agreement for Non-Employee Directors under the 2022 Stock Incentive Plan for 2025 |
| | |
+10.10(14)* | | Form of Restricted Stock Unit Agreement for Employees under the 2022 Stock Incentive Plan for 2022 |
| | |
+10.11(15)* | | Form of Restricted Stock Unit Agreement for Employees under the 2022 Stock Incentive Plan for 2023 |
| | |
+10.12(16)* | | Form of Restricted Stock Unit Agreement for Employees under the 2022 Stock Incentive Plan for 2024-2025 (Standard) |
| | |
+10.13(16)* | | Form of Restricted Stock Unit Agreement for Employees under the 2022 Stock Incentive Plan for 2024-2025 (rTSR) |
| | |
+10.14(17)* | | 2014 Stock Incentive Plan |
| | |
+10.15(17)* | | 2014 Employee Stock Purchase Plan |
| | |
+10.16(18)* | | Form of Restricted Stock Unit Agreement for Employees under the 2014 Stock Incentive Plan |
| | |
+10.17(19)* | | Employment Agreement, dated October 22, 2013, between Gerald G. Colella and the Registrant |
| | |
+10.18(20)* | | Amendment, dated March 27, 2018, to Employment Agreement, dated as of October 22, 2013, between Gerald G. Colella and the Registrant |
| | |
+10.19(21)* | | Second Amendment, dated October 29, 2018, to Employment Agreement, dated as of October 22, 2013, between Gerald G. Colella and the Registrant |
| | |
+10.20(22)* | | Employment Agreement, dated as of November 18, 2019, between John T.C. Lee and the Registrant |
| | |
+10.21(23)* | | Employment Agreement, effective August 1, 2016, between Seth Bagshaw and the Registrant |
| | |
+10.22(21)* | | Amendment, dated October 29, 2018, to Employment Agreement, effective August 1, 2016, by and between Seth Bagshaw and the Registrant |
| | |
+10.23(24)* | | Employment Agreement, effective August 1, 2016, between Kathleen Burke and the Registrant, as amended on October 29, 2018 |
| | |
+10.24(5)* | | Employment Agreement, effective September 16, 2019, between James A. Schreiner and the Registrant |
| | |
+10.25(25)* | | Amendment, dated October 25, 2021, to Employment Agreement, effective September 16, 2019, between James A. Schreiner and the Registrant |
| | |
+10.26(26)* | | Second Amendment, dated May 7, 2024, to Employment Agreement, dated as of September 16, 2019, between James A. Schreiner and the Registrant |
| | |
| | |
Exhibit No. | | Title |
+10.27(27)* | | Employment Agreement, effective January 1, 2020, between David Henry and the Registrant |
| | |
+10.28(27)* | | Employment Agreement, effective February 17, 2021, between Eric Taranto and the Registrant |
| | |
+10.29(26)* | | Employment Agreement, effective April 30, 2024, between John Williams and the Registrant |
| | |
+10.30(28)* | | Employment Agreement, effective August 9, 2024, between Ramakumar Mayampurath and the Registrant |
| | |
+10.31(29)* | | Management Incentive Plan |
| | |
19.1 | | Insider Trading Policy |
| | |
21.1 | | Subsidiaries of the Registrant |
| | |
23.1 | | Consent of PricewaterhouseCoopers LLP |
| | |
31.1 | | Certification of Principal Executive Officer pursuant to Rule 13a-14(a)/Rule 15d-14(a) of the Securities Exchange Act of 1934 |
| | |
31.2 | | Certification of Principal Financial Officer pursuant to Rule 13a-14(a)/Rule 15d-14(a) of the Securities Exchange Act of 1934 |
| | |
32.1 | | Certification of Chief Executive Officer and Chief Financial Officer pursuant to 18 U.S.C. Section 1350, as adopted pursuant to Section 906 of the Sarbanes-Oxley Act of 2002 |
| | |
+97.1(16) | | Dodd-Frank Compensation Recovery Policy |
| | |
101.INS** | | Inline XBRL Instance Document - the instance document does not appear in the Interactive Data File because its XBRL tags are embedded within the Inline XBRL document. |
| | |
101.SCH** | | Inline XBRL Taxonomy Extension Schema with Embedded Linkbase Documents |
| | |
104 | | Cover Page Interactive Data File (formatted as inline XBRL with applicable taxonomy extension information contained in Exhibits 101) |
+ Previously filed
* Management contract or compensatory plan arrangement
** Filed with this Annual Report on Form 10-K for the year ended December 31, 2024 are the following documents formatted in iXBRL (Inline Extensible Business Reporting Language): (i) the Consolidated Balance Sheets; (ii) the Consolidated Statements of Operations and Comprehensive Income (Loss); (iii) the Consolidated Statements of Stockholders’ Equity; (iv) the Consolidated Statements of Cash Flows; and (v) the Notes to Consolidated Financial Statements.
The following materials from MKS Instruments, Inc.’s Annual Report on Form 10-K for the year ended December 31, 2024, are formatted in XBRL (Extensible Business Reporting Language): (i) the Consolidated Balance Sheets, (ii) the Consolidated Statements of Operations and Comprehensive (Loss) Income, (iii) the Consolidated Statements of Stockholders’ Equity, (iv) the Consolidated Statements of Cash Flows, and (v) Notes to Consolidated Financial Statements.
(1)Incorporated by reference to the Registration Statement on Form S-4 (File No. 333-49738), filed with the Securities and Exchange Commission on November 13, 2000.
(2)Incorporated by reference to the Registrant’s Quarterly Report on Form 10-Q for the quarter ended June 30, 2001 (File No. 000-23621), filed with the Securities and Exchange Commission on August 14, 2001.
(3)Incorporated by reference to the Registrant’s Quarterly Report on Form 10-Q for the quarter ended June 30, 2002 (File No. 000-23621), filed with the Securities and Exchange Commission on August 13, 2002.
(4)Incorporated by reference to the Registrant’s Current Report on Form 8-K (File No. 000-23621), filed with the Securities and Exchange Commission on December 3, 2024.
(5)Incorporated by reference to the Registrant’s Annual Report on Form 10-K for the year ended December 31, 2019 (File No. 000-23621), filed with the Securities and Exchange Commission on February 28, 2020.
(6)Incorporated by reference to the Registrant’s Current Report on Form 8-K (File No. 000-23621), filed with the Securities and Exchange Commission on May 16, 2024.
(7)Incorporated by reference to the Registrant’s Current Report on Form 8-K (File No. 000-23621), filed with the Securities and Exchange Commission on August 17, 2022.
(8)Incorporated by reference to the Registrant’s Current Report on Form 8-K (File No. 000-23621), filed with the Securities and Exchange Commission on October 3, 2023.
(9)Incorporated by reference to the Registrant’s Current Report on Form 8-K (File No. 000-23621), filed with the Securities and Exchange Commission on January 22, 2024.
(10)Incorporated by reference to the Registrant’s Current Report on Form 8-K (File No. 000-23621), filed with the Securities and Exchange Commission on February 14, 2024.
(11)Incorporated by reference to the Registrant’s Current Report on Form 8-K (File No. 000-23621), filed with the Securities and Exchange Commission on July 23, 2024.
(12)Incorporated by reference to the Registrant’s Current Report on Form 8-K (File No. 000-23621), filed with the Securities and Exchange Commission on January 24, 2025.
(13)Incorporated by reference to the Registration Statement on Form S-8 (File No. 333-264817), filed with the Securities and Exchange Commission on May 10, 2022.
(14)Incorporated by reference to the Registrant’s Current Report on Form 8-K (File No. 000-23621), filed with the Securities and Exchange Commission on May 11, 2022.
(15)Incorporated by reference to the Registrant’s Annual Report on Form 10-K for the year ended December 31, 2022 (File No. 000-23621), filed with the Securities and Exchange Commission on March 14, 2023.
(16)Incorporated by reference to the Registrant’s Annual Report on Form 10-K for the year ended December 31, 2023 (File No.000-23621), filed with the Securities and Exchange Commission on February 27, 2024.
(17)Incorporated by reference to the Registrant’s Current Report on Form 8-K (File No. 000-23621), filed with the Securities and Exchange Commission on May 6, 2014.
(18)Incorporated by reference to the Registrant’s Annual Report on Form 10-K for the year ended December 31, 2018 (File No.000-23621), filed with the Securities and Exchange Commission on February 26, 2019.
(19)Incorporated by reference to the Registrant’s Current Report on Form 8-K (File No. 000-23621), filed with the Securities and Exchange Commission on October 24, 2013.
(20)Incorporated by reference to the Registrant’s Quarterly Report on Form 10-Q for the quarter ended March 31, 2018 (File No. 000-23621), filed with the Securities and Exchange Commission on May 8, 2018.
(21)Incorporated by reference to the Registrant’s Current Report on Form 8-K (File No. 000-23621), filed with the Securities and Exchange Commission on November 1, 2018.
(22)Incorporated by reference to the Registrant’s Current Report on Form 8-K (File No. 000-23621), filed with the Securities and Exchange Commission on November 20, 2019.
(23)Incorporated by reference to the Registrant’s Quarterly Report on Form 10-Q for the quarter ended June 30, 2016 (File No. 000-23621), filed with the Securities and Exchange Commission on August 3, 2016.
(24)Incorporated by reference to the Registrant’s Quarterly Report on Form 10-Q for the quarter ended June 30, 2019 (File No. 000-23621), filed with the Securities and Exchange Commission on August 7, 2019.
(25)Incorporated by reference to the Registrant’s Current Report on Form 8-K (File No. 000-23621), filed with the Securities and Exchange Commission on October 29, 2021.
(26)Incorporated by reference to the Registrant’s Quarterly Report on Form 10-Q for the quarter ended June 30, 2024 (File No. 000-23621), filed with the Securities and Exchange Commission on August 8, 2024.
(27)Incorporated by reference to the Registrant’s Annual Report on Form 10-K for the year ended December 31, 2020 (File No.000-23621), filed with the Securities and Exchange Commission on February 23, 2021.
(28)Incorporated by reference to the Registrant’s Quarterly Report on Form 10-Q for the quarter ended September 30, 2024 (File No. 000-23621), filed with the Securities and Exchange Commission on November 7, 2024.
(29)Incorporated by reference to the Registrant’s Current Report on Form 8-K (File No. 000-23621), filed with the Securities and Exchange Commission on February 11, 2022.
MKS hereby files as exhibits to its Annual Report on Form 10-K those exhibits listed in Item 15(a) above.
Item 16. Form 10-K Summary
Not applicable.
MKS Instruments, Inc.
SCHEDULE II - VALUATION AND QUALIFYING ACCOUNTS
(in millions)
| | | | | | | | | | | | | | | | | | | | | | | | |
| | | | | Additions | | | | | | | |
Description | | Balance at
Beginning of
Year | | | Acquisition
Beginning
Balance | | | Charged to
Costs and
Expenses | | | Charged to
Other
Accounts | | | Deductions | | | Balance at
End of Year | |
Valuation allowance on deferred tax asset: | | | | |
| | | | | | | | | | | | | |
Years ended December 31, | | | | | | | | | | | | | | | | | | |
2024 | | $ | 190 | | | $ | — | | | $ | 2 | | | $ | — | | | $ | (41 | ) | | $ | 151 | |
2023 | | $ | 181 | | | $ | — | | | $ | 12 | | | $ | — | | | $ | (3 | ) | | $ | 190 | |
2022 | | $ | 26 | | | $ | 156 | | | $ | — | | | $ | — | | | $ | (1 | ) | | $ | 181 | |
SIGNATURES
Pursuant to the requirements of Section 13 or 15(d) of the Securities Exchange Act of 1934, the registrant has duly caused this annual report on Form 10-K for the fiscal year ended December 31, 2024 to be signed on its behalf by the undersigned, thereunto duly authorized on the 25th day of February 2025.
MKS INSTRUMENTS, INC.
John T.C. Lee
President and Chief Executive Officer
(Principal Executive Officer)
Pursuant to the requirements of the Securities Exchange Act of 1934, this report has been signed below by the following persons on behalf of the registrant and in the capacities and on the date indicated.
| | | | |
SIGNATURES | | TITLE | | DATE |
/s/ Gerald G. Colella | | Chairman of the Board of Directors | | February 25, 2025 |
Gerald G. Colella | | | |
/s/ John T.C. Lee | | President, Chief Executive Officer and Director
(Principal Executive Officer) | | February 25, 2025 |
John T.C. Lee | | | |
/s/ Ramakumar Mayampurath | | Executive Vice President, Chief Financial Officer and Treasurer (Principal Financial Officer) | | February 25, 2025 |
Ramakumar Mayampurath | | | |
/s/ Michelle M. McCarthy | | Vice President and Chief Accounting Officer (Principal Accounting Officer) Director | | February 25, 2025 |
Michelle M. McCarthy | | | |
/s/ Rajeev Batra | | | February 25, 2025 |
Rajeev Batra | | | |
/s/ Peter J. Cannone III | | Director | | February 25, 2025 |
Peter J. Cannone III | | | |
/s/ Joseph B. Donahue | | Director | | February 25, 2025 |
Joseph B. Donahue | | | |
/s/ Wissam G. Jabre | | Director | | February 25, 2025 |
Wissam G. Jabre | | | |
/s/ Jacqueline F. Moloney | | Director | | February 25, 2025 |
Jacqueline F. Moloney | | | |
/s/ Elizabeth A. Mora | | Director | | February 25, 2025 |
Elizabeth A. Mora | | | | |
/s/ Michelle M. Warner | | Director | | February 25, 2025 |
Michelle M. Warner | | | | |