
© Mercury Systems, Inc. SECOND QUARTER FISCAL YEAR 2021 FINANCIAL RESULTS Mark Aslett President and CEO Michael Ruppert Executive Vice President and CFO February 2, 2021, 5:00 pm ET Webcast login at www.mrcy.com/investor Webcast replay available by 7:00 p.m. ET February 2, 2021
© Mercury Systems, Inc.2 Forward-looking safe harbor statement This presentation contains certain forward-looking statements, as that term is defined in the Private Securities Litigation Reform Act of 1995, including those relating to the acquisitions described herein and to fiscal 2021 business performance and beyond and the Company’s plans for growth and improvement in profitability and cash flow. You can identify these statements by the use of the words “may,” “will,” “could,” “should,” “would,” “plans,” “expects,” “anticipates,” “continue,” “estimate,” “project,” “intend,” “likely,” “forecast,” “probable,” “potential,” and similar expressions. These forward-looking statements involve risks and uncertainties that could cause actual results to differ materially from those projected or anticipated. Such risks and uncertainties include, but are not limited to, continued funding of defense programs, the timing and amounts of such funding, general economic and business conditions, including unforeseen weakness in the Company’s markets, effects of epidemics and pandemics such as COVID, effects of any U.S. federal government shutdown or extended continuing resolution, effects of continued geopolitical unrest and regional conflicts, competition, changes in technology and methods of marketing, delays in completing engineering and manufacturing programs, changes in customer order patterns, changes in product mix, continued success in technological advances and delivering technological innovations, changes in, or in the U.S. Government’s interpretation of, federal export control or procurement rules and regulations, market acceptance of the Company’s products, shortages in components, production delays or unanticipated expenses due to performance quality issues with outsourced components, inability to fully realize the expected benefits from acquisitions and restructurings, or delays in realizing such benefits, challenges in integrating acquired businesses and achieving anticipated synergies, increases in interest rates, changes to industrial security and cyber-security regulations and requirements, changes in tax rates or tax regulations, changes to interest rate swaps or other cash flow hedging arrangements, changes to generally accepted accounting principles, difficulties in retaining key employees and customers, unanticipated costs under fixed-price service and system integration engagements, and various other factors beyond our control. These risks and uncertainties also include such additional risk factors as are discussed in the Company’s filings with the U.S. Securities and Exchange Commission, including its Annual Report on Form 10-K for the fiscal year ended July 3, 2020. The Company cautions readers not to place undue reliance upon any such forward-looking statements, which speak only as of the date made. The Company undertakes no obligation to update any forward-looking statement to reflect events or circumstances after the date on which such statement is made. Use of Non-GAAP (Generally Accepted Accounting Principles) Financial Measures In addition to reporting financial results in accordance with generally accepted accounting principles, or GAAP, the Company provides adjusted EBITDA, adjusted income, adjusted EPS, free cash flow, organic revenue and acquired revenue, which are non-GAAP financial measures. Adjusted EBITDA, adjusted income, and adjusted EPS exclude certain non-cash and other specified charges. The Company believes these non-GAAP financial measures are useful to help investors better understand its past financial performance and prospects for the future. However, these non-GAAP measures should not be considered in isolation or as a substitute for financial information provided in accordance with GAAP. Management believes these non-GAAP measures assist in providing a more complete understanding of the Company’s underlying operational results and trends, and management uses these measures along with the corresponding GAAP financial measures to manage the Company’s business, to evaluate its performance compared to prior periods and the marketplace, and to establish operational goals. A reconciliation of GAAP to non-GAAP financial results discussed in this presentation is contained in the Appendix hereto.
© Mercury Systems, Inc.3 Delivered solid fiscal 2021 second quarter Exceeded guidance for total revenue and profitability Design wins of more than $300M in estimated lifetime value Closed POC acquisition December 30, 2020 Outlook positive; raising FY21 revenue, net income and adj. EBITDA guidance Expect 16-19% FY21 revenue growth and high single-digit organic
© Mercury Systems, Inc.4 Strategy and technologies aligned with major industry drivers and trends New business conditions remain robust M&A activity is back; strong balance sheet; well-positioned to pursue Expect contracting environment to improve with signing of NDAA Flat to low single-digit CAGR in overall defense spending forecast unchanged Fiscal stimulus could crowd out defense spending, tempered by bipartisan commitment Expect organic revenue growth rate to remain above defense industry average
© Mercury Systems, Inc.5 Strategy and technologies aligned with major industry drivers and trends Targeting and participating in large, and faster growing market segments Sensor and effector mission systems and C4I modernization driving growth Favorable trends – outsourcing, delayering, flight to quality, trusted microelectronics Uniquely positioned to provide DoD trusted, secure microelectronics solutions Aligns with DoD’s #1 defense technology priority
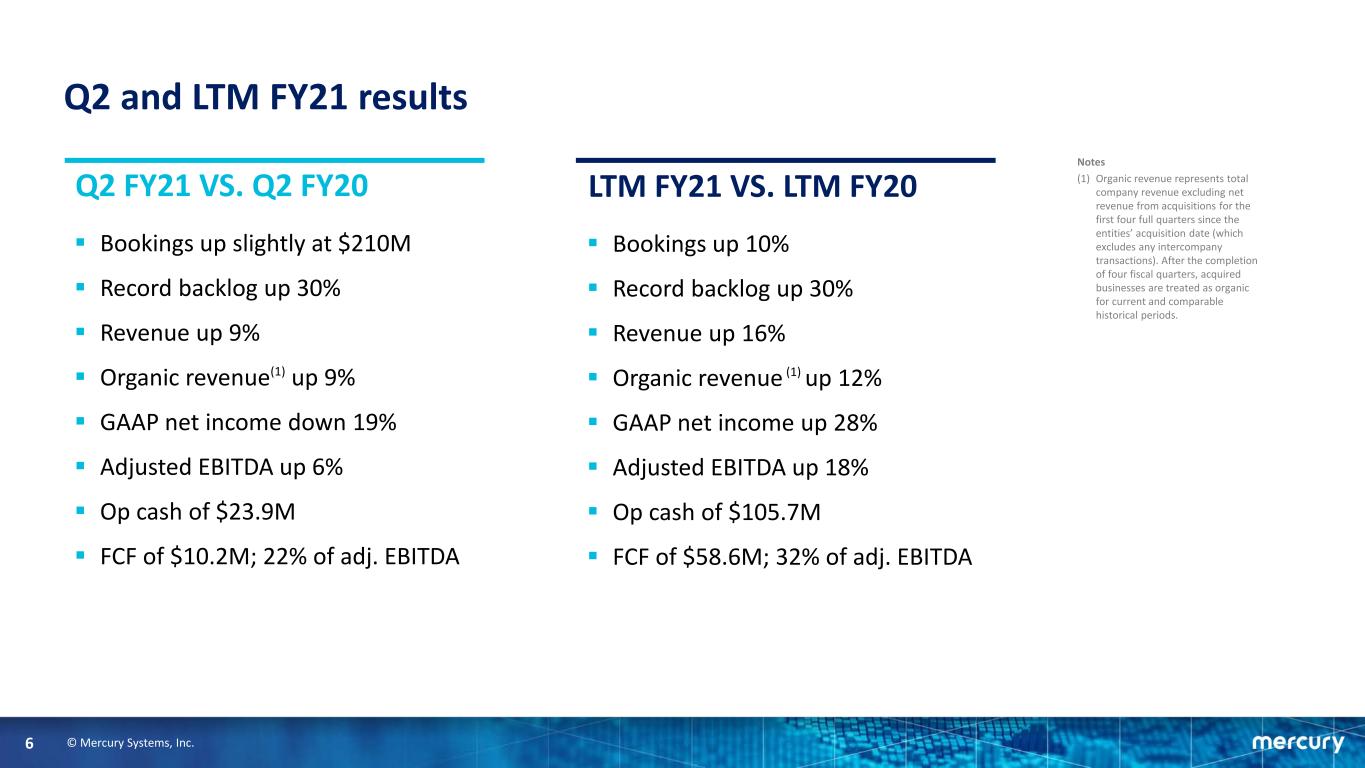
© Mercury Systems, Inc.6 Q2 and LTM FY21 results Bookings up slightly at $210M Record backlog up 30% Revenue up 9% Organic revenue(1) up 9% GAAP net income down 19% Adjusted EBITDA up 6% Op cash of $23.9M FCF of $10.2M; 22% of adj. EBITDA Bookings up 10% Record backlog up 30% Revenue up 16% Organic revenue (1) up 12% GAAP net income up 28% Adjusted EBITDA up 18% Op cash of $105.7M FCF of $58.6M; 32% of adj. EBITDA Notes (1) Organic revenue represents total company revenue excluding net revenue from acquisitions for the first four full quarters since the entities’ acquisition date (which excludes any intercompany transactions). After the completion of four fiscal quarters, acquired businesses are treated as organic for current and comparable historical periods. Q2 FY21 VS. Q2 FY20 LTM FY21 VS. LTM FY20
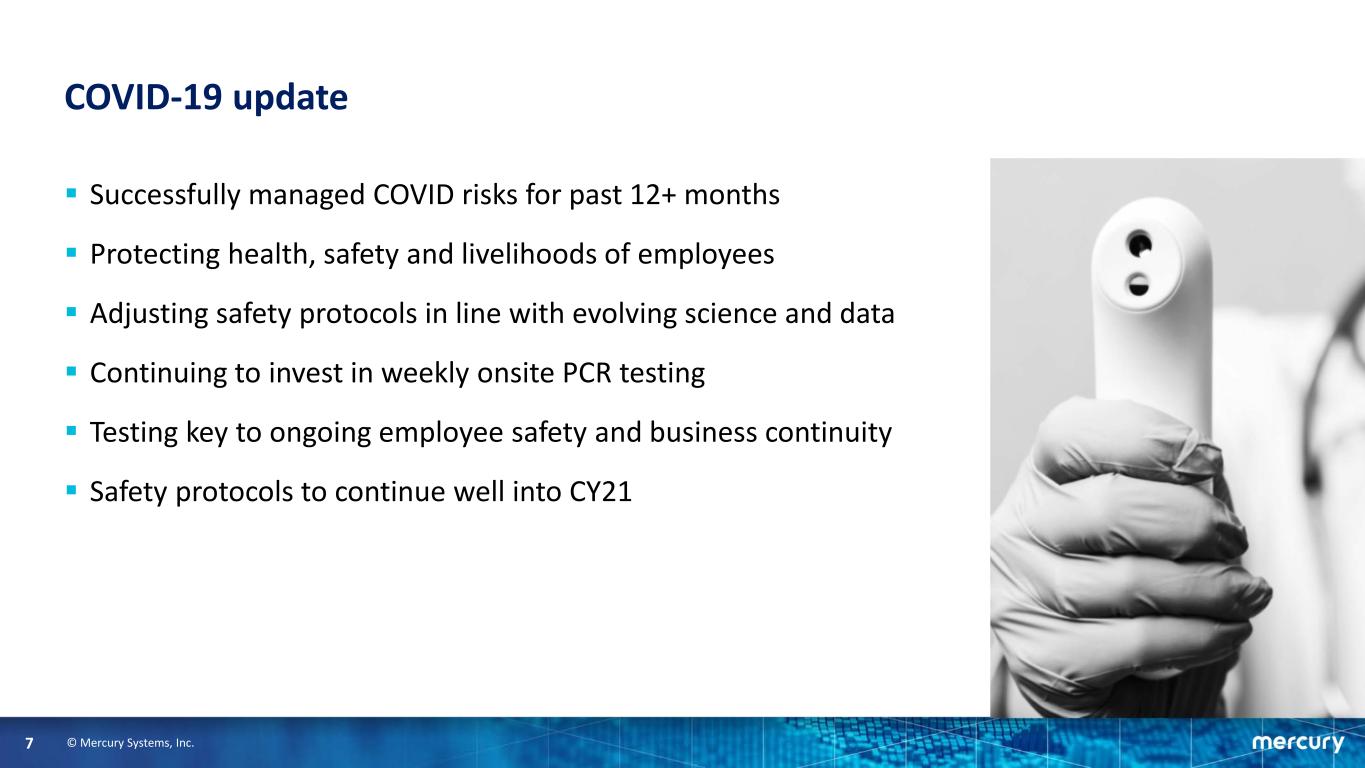
© Mercury Systems, Inc.7 COVID-19 update Successfully managed COVID risks for past 12+ months Protecting health, safety and livelihoods of employees Adjusting safety protocols in line with evolving science and data Continuing to invest in weekly onsite PCR testing Testing key to ongoing employee safety and business continuity Safety protocols to continue well into CY21
© Mercury Systems, Inc.8 M&A update POC acquisition adds scale and strengthens platform and mission management Well-positioned to continue supplementing organic growth with accretive M&A M&A market very active; robust pipeline of future opportunities Perceived as great buyer due to purpose, culture, values, strategy and performance Pursuing deals that are strategically aligned around multiple M&A themes
© Mercury Systems, Inc.9 Continue to execute on strategy: strong margins, organic growth, M&A, full integration 1) Drive ~10% average organic revenue growth supplemented by strategic M&A 2) Invest in people, technologies, facilities, manufacturing assets, business systems 3) Insource more manufacturing; drive stronger operating performance 4) Grow revenues faster than operating expenses to improve operating leverage 5) Fully integrate acquired businesses to generate cost and revenue synergies
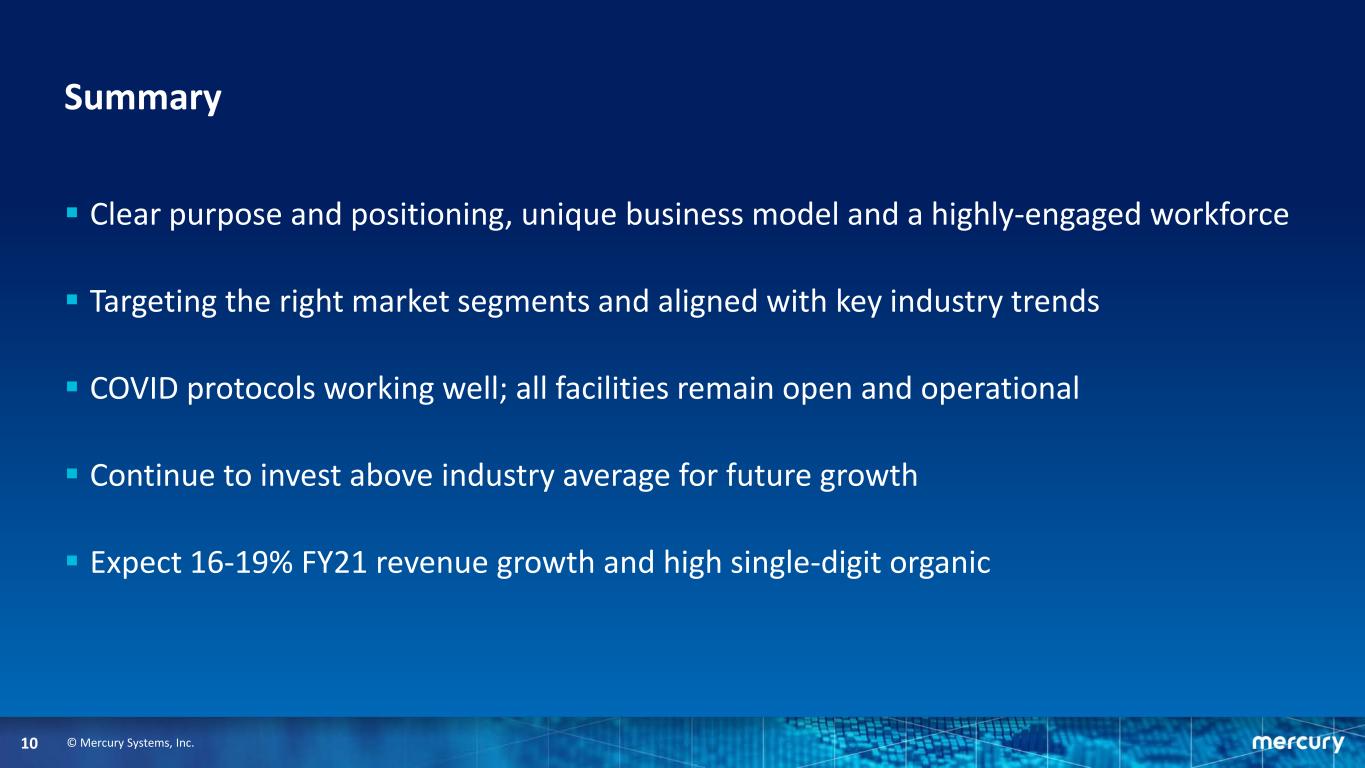
© Mercury Systems, Inc.10 Summary Clear purpose and positioning, unique business model and a highly-engaged workforce Targeting the right market segments and aligned with key industry trends COVID protocols working well; all facilities remain open and operational Continue to invest above industry average for future growth Expect 16-19% FY21 revenue growth and high single-digit organic

© Mercury Systems, Inc.11 Q2 FY21 vs. Q2 FY20 In $ millions, except percentage and per share data Q2 FY20(3) Q2 FY21(3) CHANGE Bookings Book-to-Bill $209.6 1.08 $210.1 1.00 - Backlog 12-Month Backlog $727.5 521.8 $945.3 598.0 30% Revenue Organic Revenue Growth(1) $193.9 12% $210.7 9% 9% Gross Margin 45.6% 42.1% (3.5) pts Operating Expenses Selling, General & Administrative Research & Development Amortization/Restructuring/Acquisition $67.7 32.8 24.7 10.2 $70.6 31.6 28.1 10.8 4% GAAP Net Income Effective Tax Rate $15.7 24.6% $12.7 25.9% (19%) GAAP EPS Weighted Average Diluted Shares $0.29 55.0 $0.23 55.4 (21%) Adjusted EPS(2) $0.53 $0.54 2% Adj. EBITDA(2) % of revenue $42.8 22.1% $45.3 21.5% 6% Operating Cash Flow $32.1 $23.9 (25%) Free Cash Flow(2) % of Adjusted EBITDA $20.7 48% $10.2 22% (51%) Notes (1) Organic revenue represents total company revenue excluding net revenue from acquisitions for the first four full quarters since the entities’ acquisition date (which excludes any intercompany transactions). After the completion of four fiscal quarters, acquired businesses are treated as organic for current and comparable historical periods. (2) Non-GAAP, see reconciliation table. (3) Effective as of July 1, 2019, the Company’s fiscal year has changed to the 52-week or 53- week period ending on the Friday closest to the last day of June. All references in this presentation to the second quarter of fiscal 2020 and full fiscal 2020 are to the quarter ended December 27, 2019 and full fiscal 2020 are to the 53- week period ended July 3, 2020, and to the second quarter of fiscal 2021 and full fiscal 2021 are to the quarter ended January 1, 2021 and 52-week period ending July 2, 2021.
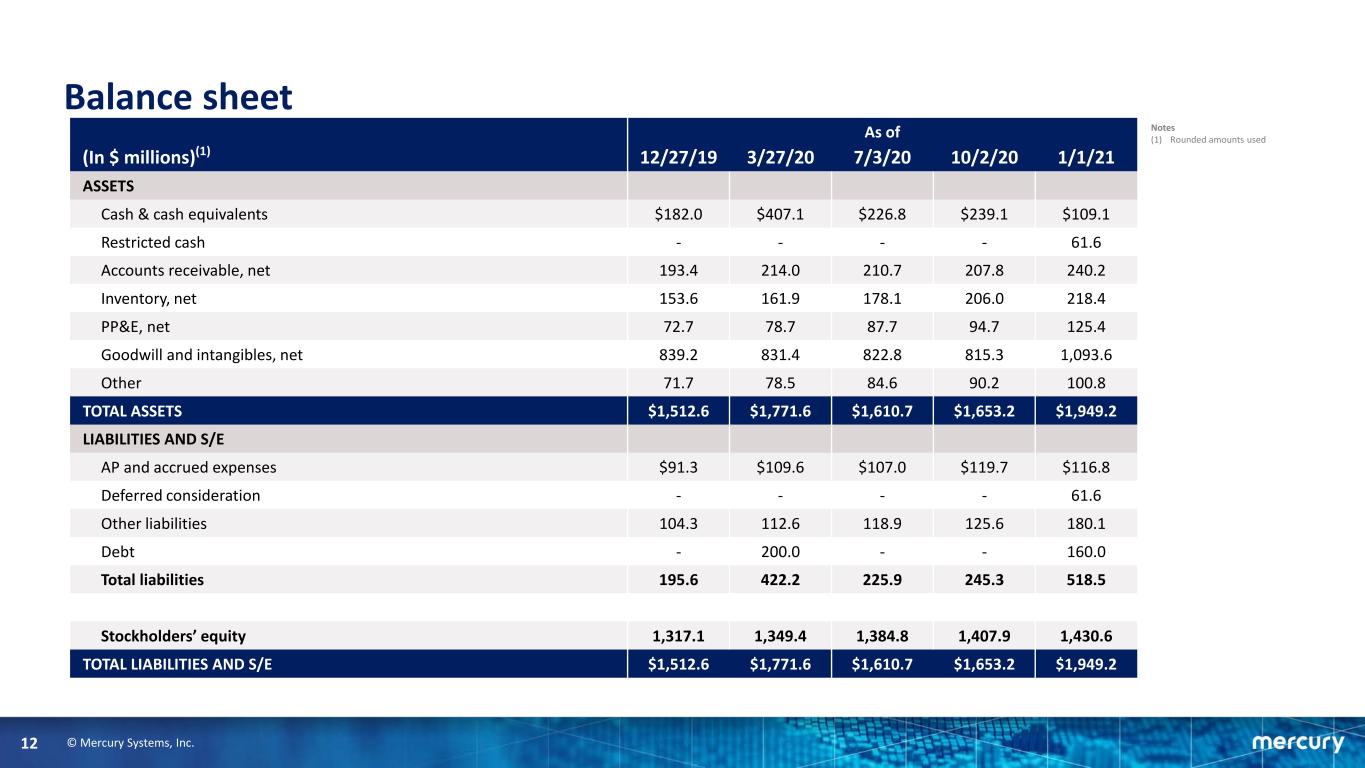
© Mercury Systems, Inc.12 Balance sheet As of (In $ millions)(1) 12/27/19 3/27/20 7/3/20 10/2/20 1/1/21 ASSETS Cash & cash equivalents $182.0 $407.1 $226.8 $239.1 $109.1 Restricted cash - - - - 61.6 Accounts receivable, net 193.4 214.0 210.7 207.8 240.2 Inventory, net 153.6 161.9 178.1 206.0 218.4 PP&E, net 72.7 78.7 87.7 94.7 125.4 Goodwill and intangibles, net 839.2 831.4 822.8 815.3 1,093.6 Other 71.7 78.5 84.6 90.2 100.8 TOTAL ASSETS $1,512.6 $1,771.6 $1,610.7 $1,653.2 $1,949.2 LIABILITIES AND S/E AP and accrued expenses $91.3 $109.6 $107.0 $119.7 $116.8 Deferred consideration - - - - 61.6 Other liabilities 104.3 112.6 118.9 125.6 180.1 Debt - 200.0 - - 160.0 Total liabilities 195.6 422.2 225.9 245.3 518.5 Stockholders’ equity 1,317.1 1,349.4 1,384.8 1,407.9 1,430.6 TOTAL LIABILITIES AND S/E $1,512.6 $1,771.6 $1,610.7 $1,653.2 $1,949.2 Notes (1) Rounded amounts used
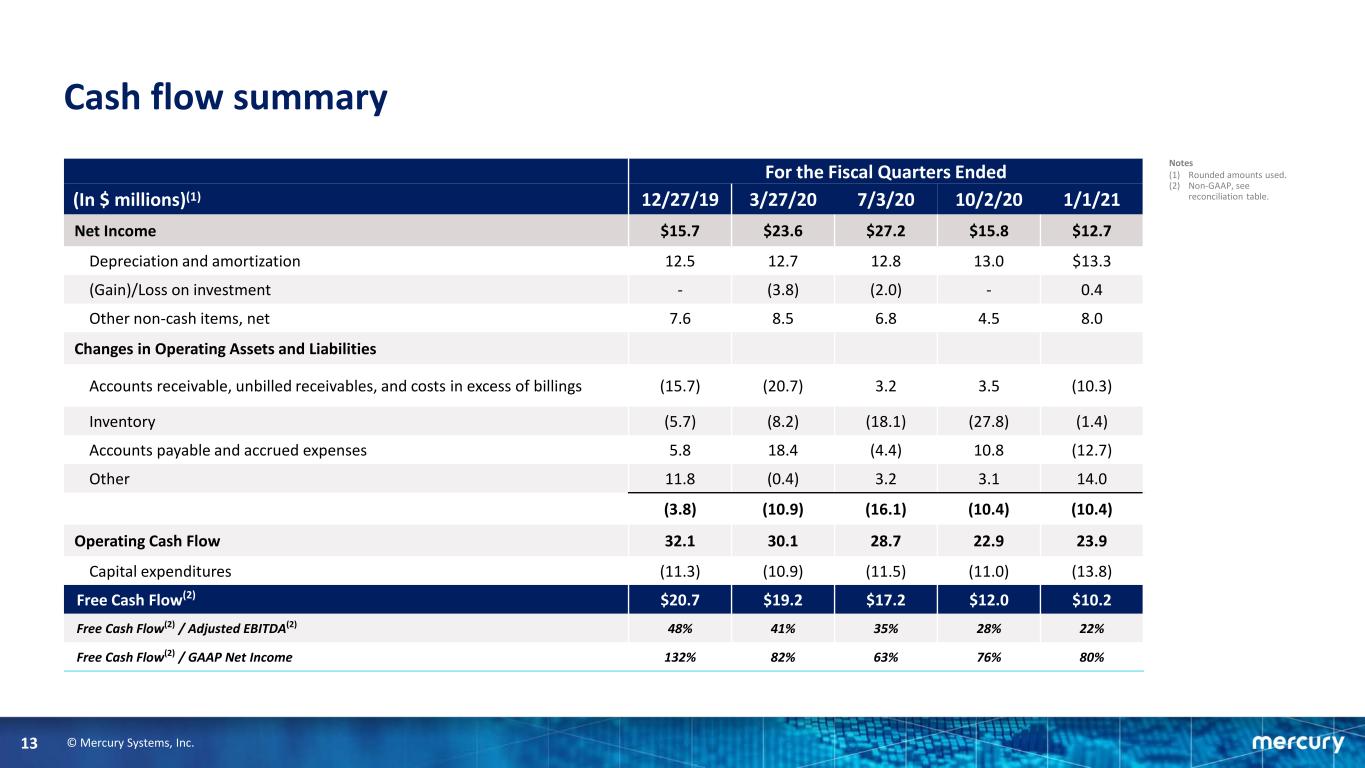
© Mercury Systems, Inc.13 Cash flow summary For the Fiscal Quarters Ended (In $ millions)(1) 12/27/19 3/27/20 7/3/20 10/2/20 1/1/21 Net Income $15.7 $23.6 $27.2 $15.8 $12.7 Depreciation and amortization 12.5 12.7 12.8 13.0 $13.3 (Gain)/Loss on investment - (3.8) (2.0) - 0.4 Other non-cash items, net 7.6 8.5 6.8 4.5 8.0 Changes in Operating Assets and Liabilities Accounts receivable, unbilled receivables, and costs in excess of billings (15.7) (20.7) 3.2 3.5 (10.3) Inventory (5.7) (8.2) (18.1) (27.8) (1.4) Accounts payable and accrued expenses 5.8 18.4 (4.4) 10.8 (12.7) Other 11.8 (0.4) 3.2 3.1 14.0 (3.8) (10.9) (16.1) (10.4) (10.4) Operating Cash Flow 32.1 30.1 28.7 22.9 23.9 Capital expenditures (11.3) (10.9) (11.5) (11.0) (13.8) Free Cash Flow(2) $20.7 $19.2 $17.2 $12.0 $10.2 Free Cash Flow(2) / Adjusted EBITDA(2) 48% 41% 35% 28% 22% Free Cash Flow(2) / GAAP Net Income 132% 82% 63% 76% 80% Notes (1) Rounded amounts used. (2) Non-GAAP, see reconciliation table.

© Mercury Systems, Inc.14 Q3 FY21 guidance In $ millions, except percentage and per share data Q3 FY20(1) Q3 FY21(2)(5) CHANGE Revenue $208.0 $245.0 – $255.0 18% – 23% GAAP Net Income Effective tax rate(3) $23.6 18.5% $15.9 – $17.8 26% (33%) – (25%) GAAP EPS $0.43 $0.29 – $0.32 (33%) – (26%) Weighted-average diluted shares outstanding 55.1 55.7 Adjusted EPS(4) $0.60 $0.59 – $0.63 (2%) – 5% Adj. EBITDA(4) % of revenue $47.1 22.6% $52.0 – $54.5 21.2% – 21.4% 10% – 16% Notes (1) Q3 FY20 figures are as reported in the Company’s earnings release dated April 28, 2020. Q3 FY20 figures included $3.8M, or $0.07 per share, and $1.9M, or $0.03 per share, of other non-operating investment income, and discrete tax benefits, respectively. (2) The guidance included herein is from the Company’s earnings release dated February 2, 2021. Guidance assumes no major supply chain disruptions, extended facility shutdowns or material change in customer behavior or demand. For purposes of modeling and guidance, we have assumed no incremental restructuring, acquisition, other non-operating adjustments or non-recurring financing. (3) The effective tax rate in the guidance included herein excludes discrete items. (4) Non-GAAP, see reconciliation table. (5) Effective as of July 1, 2019, the Company’s fiscal year has changed to the 52-week or 53-week period ending on the Friday closest to the last day of June. All references in this presentation to the third quarter of fiscal 2020 and full fiscal 2020 are to the quarter ended March 27, 2020 and the 53-week period ended July 3, 2020, and to the third quarter of fiscal 2021 and full fiscal 2021 are to the quarter ending April 2, 2021 and 52-week period ending July 2, 2021.
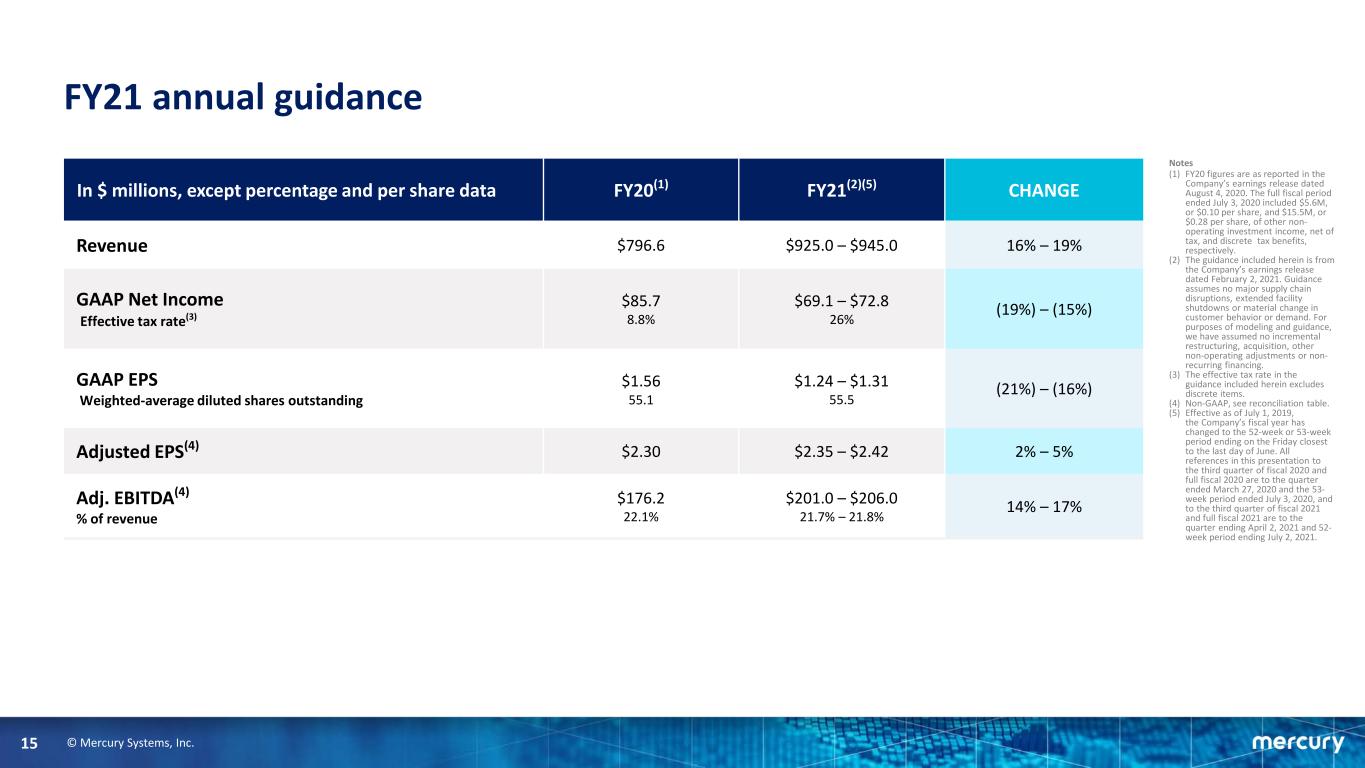
© Mercury Systems, Inc.15 FY21 annual guidance In $ millions, except percentage and per share data FY20(1) FY21(2)(5) CHANGE Revenue $796.6 $925.0 – $945.0 16% – 19% GAAP Net Income Effective tax rate(3) $85.7 8.8% $69.1 – $72.8 26% (19%) – (15%) GAAP EPS $1.56 $1.24 – $1.31 (21%) – (16%) Weighted-average diluted shares outstanding 55.1 55.5 Adjusted EPS(4) $2.30 $2.35 – $2.42 2% – 5% Adj. EBITDA(4) % of revenue $176.2 22.1% $201.0 – $206.0 21.7% – 21.8% 14% – 17% Notes (1) FY20 figures are as reported in the Company’s earnings release dated August 4, 2020. The full fiscal period ended July 3, 2020 included $5.6M, or $0.10 per share, and $15.5M, or $0.28 per share, of other non- operating investment income, net of tax, and discrete tax benefits, respectively. (2) The guidance included herein is from the Company’s earnings release dated February 2, 2021. Guidance assumes no major supply chain disruptions, extended facility shutdowns or material change in customer behavior or demand. For purposes of modeling and guidance, we have assumed no incremental restructuring, acquisition, other non-operating adjustments or non- recurring financing. (3) The effective tax rate in the guidance included herein excludes discrete items. (4) Non-GAAP, see reconciliation table. (5) Effective as of July 1, 2019, the Company’s fiscal year has changed to the 52-week or 53-week period ending on the Friday closest to the last day of June. All references in this presentation to the third quarter of fiscal 2020 and full fiscal 2020 are to the quarter ended March 27, 2020 and the 53- week period ended July 3, 2020, and to the third quarter of fiscal 2021 and full fiscal 2021 are to the quarter ending April 2, 2021 and 52- week period ending July 2, 2021.

© Mercury Systems, Inc.16 Summary Solid results for Q2 driven by strong organic growth and great execution by the team Announced and completed the acquisition of POC Well-positioned to continue to deploy capital for strategic M&A Executing on our long-term financial model with above-industry-average organic revenue and adjusted EBITDA margins

17 APPENDIX
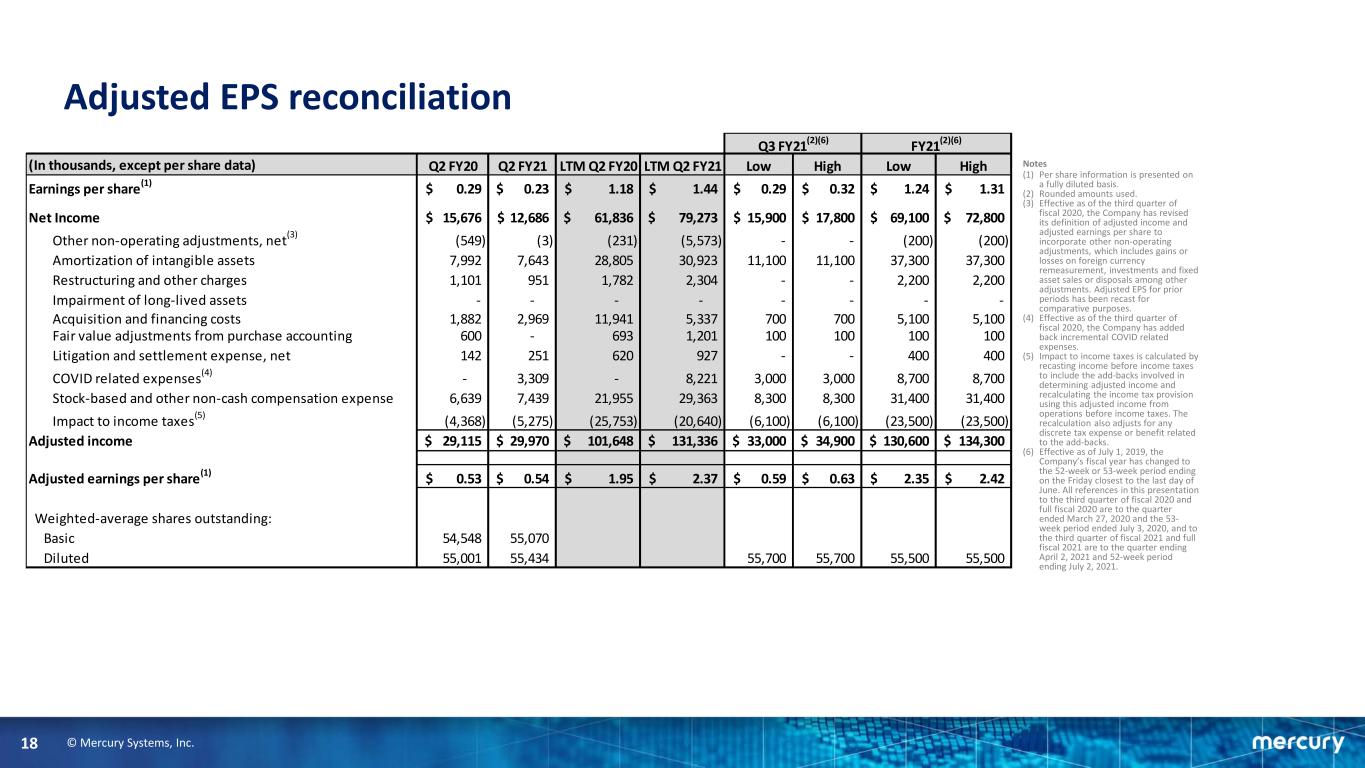
© Mercury Systems, Inc.18 Adjusted EPS reconciliation Notes (1) Per share information is presented on a fully diluted basis. (2) Rounded amounts used. (3) Effective as of the third quarter of fiscal 2020, the Company has revised its definition of adjusted income and adjusted earnings per share to incorporate other non-operating adjustments, which includes gains or losses on foreign currency remeasurement, investments and fixed asset sales or disposals among other adjustments. Adjusted EPS for prior periods has been recast for comparative purposes. (4) Effective as of the third quarter of fiscal 2020, the Company has added back incremental COVID related expenses. (5) Impact to income taxes is calculated by recasting income before income taxes to include the add-backs involved in determining adjusted income and recalculating the income tax provision using this adjusted income from operations before income taxes. The recalculation also adjusts for any discrete tax expense or benefit related to the add-backs. (6) Effective as of July 1, 2019, the Company’s fiscal year has changed to the 52-week or 53-week period ending on the Friday closest to the last day of June. All references in this presentation to the third quarter of fiscal 2020 and full fiscal 2020 are to the quarter ended March 27, 2020 and the 53- week period ended July 3, 2020, and to the third quarter of fiscal 2021 and full fiscal 2021 are to the quarter ending April 2, 2021 and 52-week period ending July 2, 2021. (In thousands, except per share data) Q2 FY20 Q2 FY21 LTM Q2 FY20 LTM Q2 FY21 Low High Low High Earnings per share (1) 0.29$ 0.23$ 1.18$ 1.44$ 0.29$ 0.32$ 1.24$ 1.31$ Net Income 15,676$ 12,686$ 61,836$ 79,273$ 15,900$ 17,800$ 69,100$ 72,800$ Other non-operating adjustments, net (3) (549) (3) (231) (5,573) - - (200) (200) Amortization of intangible assets 7,992 7,643 28,805 30,923 11,100 11,100 37,300 37,300 Restructuring and other charges 1,101 951 1,782 2,304 - - 2,200 2,200 Impairment of long-lived assets - - - - - - - - Acquisition and financing costs 1,882 2,969 11,941 5,337 700 700 5,100 5,100 Fair value adjustments from purchase accounting 600 - 693 1,201 100 100 100 100 Litigation and settlement expense, net 142 251 620 927 - - 400 400 COVID related expenses (4) - 3,309 - 8,221 3,000 3,000 8,700 8,700 Stock-based and other non-cash compensation expense 6,639 7,439 21,955 29,363 8,300 8,300 31,400 31,400 Impact to income taxes (5) (4,368) (5,275) (25,753) (20,640) (6,100) (6,100) (23,500) (23,500) Adjusted income 29,115$ 29,970$ 101,648$ 131,336$ 33,000$ 34,900$ 130,600$ 134,300$ Adjusted earnings per share (1) 0.53$ 0.54$ 1.95$ 2.37$ 0.59$ 0.63$ 2.35$ 2.42$ Weighted-average shares outstanding: Basic 54,548 55,070 Diluted 55,001 55,434 55,700 55,700 55,500 55,500 Q3 FY21 (2)(6) FY21 (2)(6)
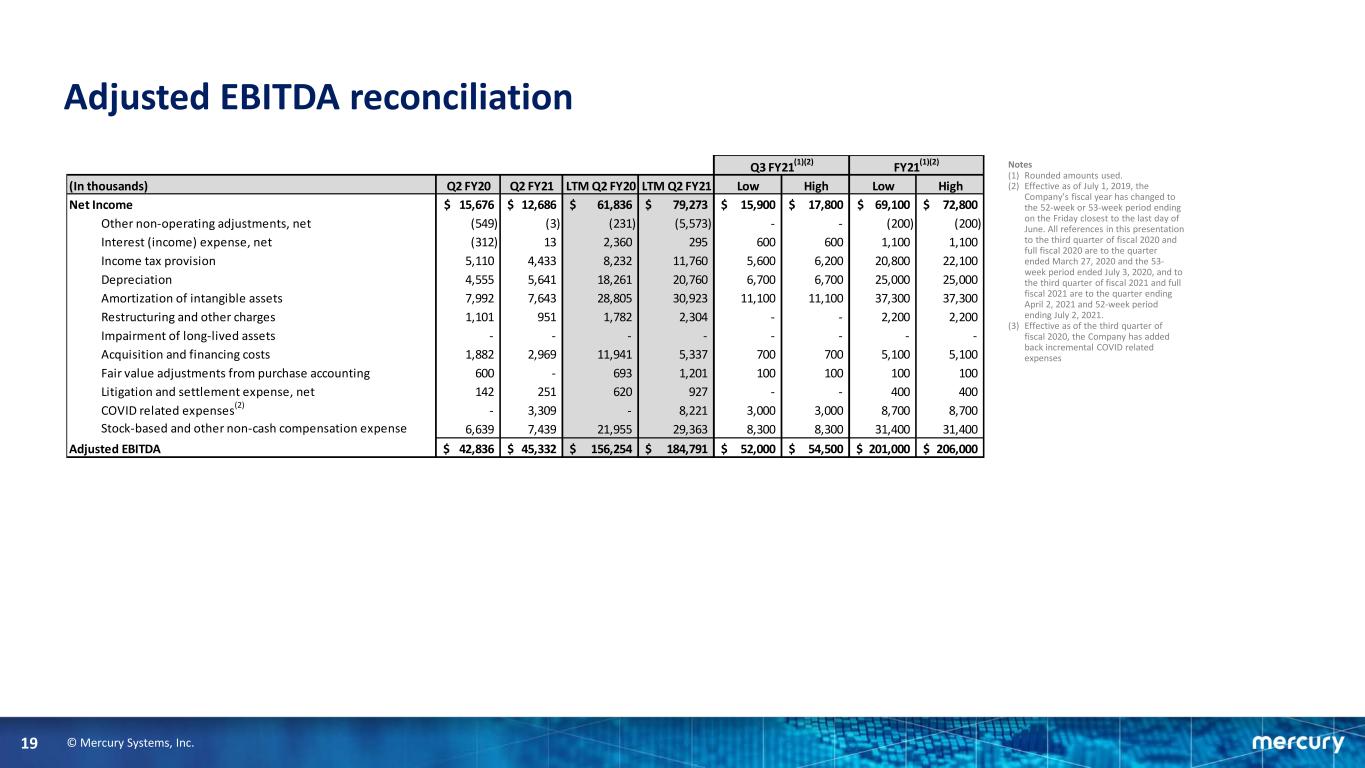
© Mercury Systems, Inc.19 Adjusted EBITDA reconciliation Notes (1) Rounded amounts used. (2) Effective as of July 1, 2019, the Company’s fiscal year has changed to the 52-week or 53-week period ending on the Friday closest to the last day of June. All references in this presentation to the third quarter of fiscal 2020 and full fiscal 2020 are to the quarter ended March 27, 2020 and the 53- week period ended July 3, 2020, and to the third quarter of fiscal 2021 and full fiscal 2021 are to the quarter ending April 2, 2021 and 52-week period ending July 2, 2021. (3) Effective as of the third quarter of fiscal 2020, the Company has added back incremental COVID related expenses (In thousands) Q2 FY20 Q2 FY21 LTM Q2 FY20 LTM Q2 FY21 Low High Low High Net Income 15,676$ 12,686$ 61,836$ 79,273$ 15,900$ 17,800$ 69,100$ 72,800$ Other non-operating adjustments, net (549) (3) (231) (5,573) - - (200) (200) Interest (income) expense, net (312) 13 2,360 295 600 600 1,100 1,100 Income tax provision 5,110 4,433 8,232 11,760 5,600 6,200 20,800 22,100 Depreciation 4,555 5,641 18,261 20,760 6,700 6,700 25,000 25,000 Amortization of intangible assets 7,992 7,643 28,805 30,923 11,100 11,100 37,300 37,300 Restructuring and other charges 1,101 951 1,782 2,304 - - 2,200 2,200 Impairment of long-lived assets - - - - - - - - Acquisition and financing costs 1,882 2,969 11,941 5,337 700 700 5,100 5,100 Fair value adjustments from purchase accounting 600 - 693 1,201 100 100 100 100 Litigation and settlement expense, net 142 251 620 927 - - 400 400 COVID related expenses (2) - 3,309 - 8,221 3,000 3,000 8,700 8,700 Stock-based and other non-cash compensation expense 6,639 7,439 21,955 29,363 8,300 8,300 31,400 31,400 Adjusted EBITDA 42,836$ 45,332$ 156,254$ 184,791$ 52,000$ 54,500$ 201,000$ 206,000$ Q3 FY21 (1)(2) FY21 (1)(2)
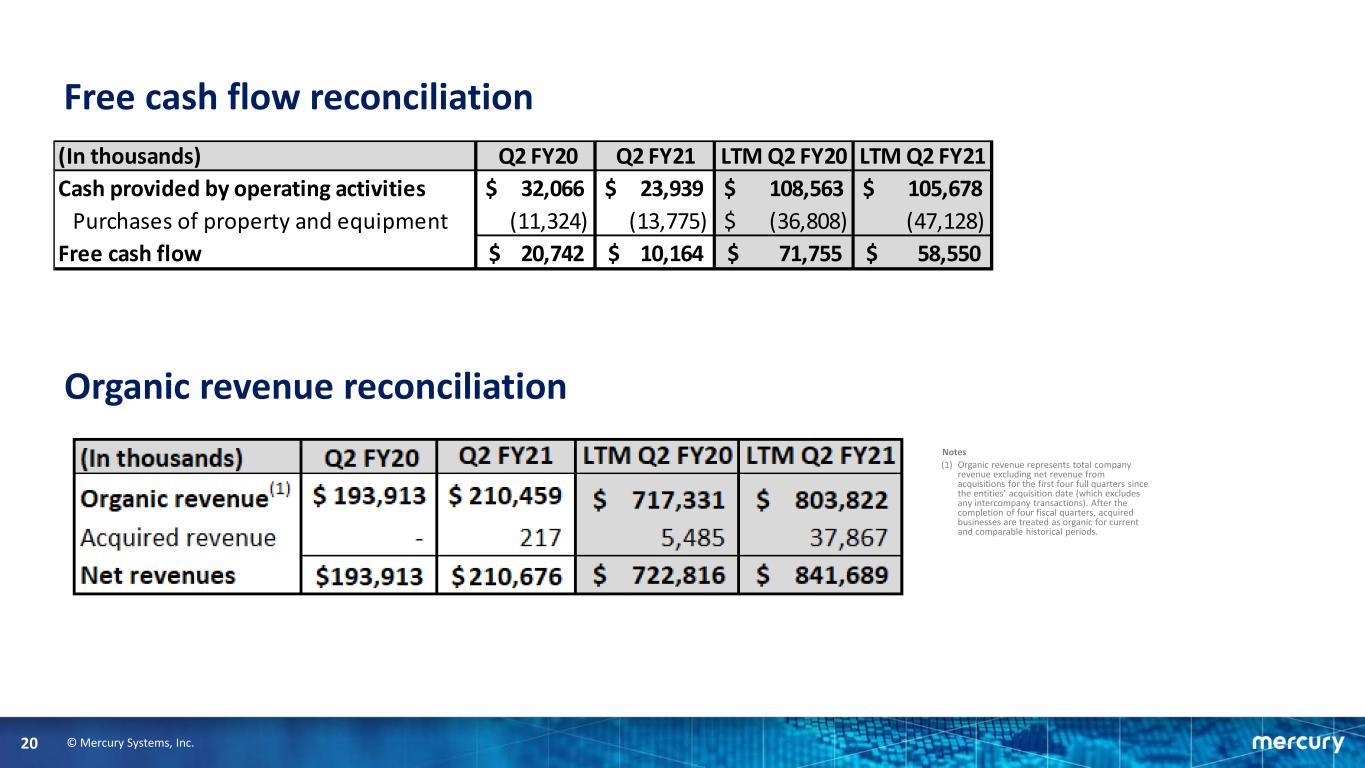
© Mercury Systems, Inc.20 Free cash flow reconciliation Organic revenue reconciliation Notes (1) Organic revenue represents total company revenue excluding net revenue from acquisitions for the first four full quarters since the entities’ acquisition date (which excludes any intercompany transactions). After the completion of four fiscal quarters, acquired businesses are treated as organic for current and comparable historical periods. (In thousands) Q2 FY20 Q2 FY21 LTM Q2 FY20 LTM Q2 FY21 Cash provided by operating activities $ 32,066 $ 23,939 $ 108,563 $ 105,678 Purchases of property and equipment (11,324) (13,775) $ (36,808) (47,128) Free cash flow 20,742$ 10,164$ 71,755$ 58,550$


