
© Mercury Systems, Inc. FOURTH QUARTER AND FISCAL YEAR 2021 FINANCIAL RESULTS Mark Aslett President and CEO Michael Ruppert Executive Vice President and CFO August 3, 2021, 5:00 pm ET Webcast login at www.mrcy.com/investor Webcast replay available by 7:00 p.m. ET August 3, 2021

© Mercury Systems, Inc.2 Forward-looking safe harbor statement This presentation contains certain forward-looking statements, as that term is defined in the Private Securities Litigation Reform Act of 1995, including those relating to the acquisitions described herein and to fiscal 2021 business performance and beyond and the Company’s plans for growth, cost savings, and improvement in profitability and cash flow. You can identify these statements by the use of the words “may,” “will,” “could,” “should,” “would,” “plans,” “expects,” “anticipates,” “continue,” “estimate,” “project,” “intend,” “likely,” “forecast,” “probable,” “potential,” and similar expressions. These forward-looking statements involve risks and uncertainties that could cause actual results to differ materially from those projected or anticipated. Such risks and uncertainties include, but are not limited to, continued funding of defense programs, the timing and amounts of such funding, general economic and business conditions, including unforeseen weakness in the Company’s markets, effects of epidemics and pandemics such as COVID, effects of any U.S. federal government shutdown or extended continuing resolution, effects of continued geopolitical unrest and regional conflicts, competition, changes in technology and methods of marketing, delays in completing engineering and manufacturing programs, changes in customer order patterns, changes in product mix, continued success in technological advances and delivering technological innovations, changes in, or in the U.S. Government’s interpretation of, federal export control or procurement rules and regulations, changes in, or in the interpretation of enforcement of environmental rules and regulations, market acceptance of the Company’s products, shortages in or delays in receiving components, production delays or unanticipated expenses due to performance quality issues with outsourced components, inability to fully realize the expected benefits from acquisitions, restructurings and value creation initiatives such as 1MPACT, or delays in realizing such benefits, challenges in integrating acquired businesses and achieving anticipated synergies, increases in interest rates, changes to industrial security and cyber-security regulations and requirements, changes in tax rates or tax regulations, changes to interest rate swaps or other cash flow hedging arrangements, changes to generally accepted accounting principles, difficulties in retaining key employees and customers, unanticipated costs under fixed-price service and system integration engagements, and various other factors beyond our control. These risks and uncertainties also include such additional risk factors as are discussed in the Company’s filings with the U.S. Securities and Exchange Commission, including its Annual Report on Form 10-K for the fiscal year ended July 3, 2020. The Company cautions readers not to place undue reliance upon any such forward-looking statements, which speak only as of the date made. The Company undertakes no obligation to update any forward-looking statement to reflect events or circumstances after the date on which such statement is made. Use of Non-GAAP (Generally Accepted Accounting Principles) Financial Measures In addition to reporting financial results in accordance with generally accepted accounting principles, or GAAP, the Company provides adjusted EBITDA, adjusted income, adjusted EPS, free cash flow, organic revenue and acquired revenue, which are non-GAAP financial measures. Adjusted EBITDA, adjusted income, and adjusted EPS exclude certain non-cash and other specified charges. The Company believes these non-GAAP financial measures are useful to help investors better understand its past financial performance and prospects for the future. However, these non-GAAP measures should not be considered in isolation or as a substitute for financial information provided in accordance with GAAP. Management believes these non-GAAP measures assist in providing a more complete understanding of the Company’s underlying operational results and trends, and management uses these measures along with the corresponding GAAP financial measures to manage the Company’s business, to evaluate its performance compared to prior periods and the marketplace, and to establish operational goals. A reconciliation of GAAP to non-GAAP financial results discussed in this presentation is contained in the Appendix hereto.

© Mercury Systems, Inc.3 Delivered strong Q4 and fiscal 2021 results FY21: 16% revenue growth, net income down 28%, 15% adjusted EBITDA growth Another strong year for new design wins; estimated lifetime value $1.5 billion Five-year plan remains intact; expect high single-digit to low double-digit organic growth Completed 13 acquisitions since fiscal ’14, creating substantial value for shareholders Launched 1MPACT to achieve full growth, margin expansion and adj. EBITDA potential

© Mercury Systems, Inc.4 Q4 and FY21 results Bookings decreased 7% Backlog increased 9% Revenue up 15% Organic revenue(1) down 3% GAAP net income down 34% Adjusted EBITDA up 19% Op cash of $27.2M FCF of $16.3M; 28% of adj. EBITDA Bookings decreased 8% Backlog increased 9% Revenue up 16% Organic revenue (1) up 5% GAAP net income down 28% Adjusted EBITDA up 15% Op cash of $97.2M FCF of $51.6M; 26% of adj. EBITDA Notes (1) Organic revenue represents total company revenue excluding net revenue from acquisitions for the first four full quarters since the entities’ acquisition date (which excludes any intercompany transactions). After the completion of four fiscal quarters, acquired businesses are treated as organic for current and comparable historical periods. Q4 FY21 VS. Q4 FY20 FY21 VS. FY20
© Mercury Systems, Inc.5 FY22 business outlook Taking more conservative stance on organic growth outlook Further reduced revenues from SEWIP and other Naval upgrades, F-35 and FMS Biggest change since last quarter is LTAMDS has moved to FY23 Now expect flat organic growth and ~10% total company growth Expect total revenue >$1B as well as record adjusted EBITDA and margin expansion Foresee significant bookings growth with positive book-to-bill and substantial backlog growth Anticipate design wins to again total more than $1B in estimated lifetime value Expect FY23 organic growth to rebound to more normal levels – high single-digit to low double-digit

© Mercury Systems, Inc.6 Dramatically scaled and transformed business since FY14 Deployed $1.2B in capital on 13 capability-led acquisitions Grew total company revenue 4.4x, adjusted EBITDA 9x, resulting in 10x market cap Increased estimated lifetime value of top 30 programs 2.4x to more than $11B Crossing $1B revenue threshold is both a milestone and an inflection point for Mercury Launched 1MPACT effort to achieve full growth and EBITDA potential over next 5 years

© Mercury Systems, Inc.7 1MPACT: a 3 year effort to achieve our full growth and EBITDA potential Engaged tier 1 consulting firm to do full company assessment Transforming organizational structure and how we do business to scale Anticipate $22M benefit in FY22 resulting from actions taken in Q4 FY21 & Q1 FY22 Organizational efficiency and scalability, streamlined procurement, facilities optimization, R&D investment efficiency, capital and asset efficiency, scalable processes and systems Expect to realize $30M-$50M incremental adjusted EBITDA by FY25 Selectively reinvesting in people, IT and business systems towards future scalability
© Mercury Systems, Inc.8 M&A update Apply 1MPACT methodologies to future M&A to accelerate value creation Active M&A pipeline with multiple opportunities in line with strategy Disciplined approach in deal pursuits, diligence and integration POC and Pentek integrations on track, businesses performing as expected, growth opportunities Well-positioned to continue supplementing organic growth with accretive M&A

© Mercury Systems, Inc.9 Summary FY21 record total revenue increased 16% with record adjusted EBITDA up 15% year-over-year Expect flat organic growth and ~10% total company growth for FY22 Foresee substantial growth in bookings and backlog in FY22 Anticipate strong FY23 as organic growth rebounds to more normal levels Five-year plan remains intact; expect high single-digit to low double-digit organic growth Strategy unchanged: Strong margins, organic growth, disciplined M&A, full integration Launched 1MPACT to achieve Mercury’s full growth, margin expansion and adj. EBITDA potential

© Mercury Systems, Inc.10 Q4 FY21 vs. Q4 FY20 In $ millions, except percentage and per share data Q4 FY20(3) Q4 FY21(3) CHANGE Bookings Book-to-Bill $278.6 1.28 $260.2 1.04 (7%) Backlog 12-Month Backlog $831.1 567.7 $909.6 530.0 9% Revenue Organic Revenue Growth(1) $217.4 17% $250.8 (3%) 15% Gross Margin 44.4% 41.0% (3.4 bps) Operating Expenses Selling, General & Administrative Research & Development Amortization/Restructuring/Acquisition $70.2 35.5 27.0 7.7 $80.4 31.6 27.7 21.1 15% GAAP Net Income Effective Tax Rate $27.2 (0.9)% $17.9 14.9% (34%) GAAP EPS Weighted Average Diluted Shares $0.49 55.3 $0.32 55.6 (35%) Adjusted EPS(2) $0.72 $0.73 1% Adj. EBITDA(2) % of revenue $49.6 22.8% $59.1 23.5% 19% Operating Cash Flow $28.7 $27.2 (5%) Free Cash Flow(2) % of Adjusted EBITDA $17.2 35% $16.3 28% (5%) Notes (1) Organic revenue represents total company revenue excluding net revenue from acquisitions for the first four full quarters since the entities’ acquisition date (which excludes any intercompany transactions). After the completion of four fiscal quarters, acquired businesses are treated as organic for current and comparable historical periods. (2) Non-GAAP, see reconciliation table. (3) Effective as of July 1, 2019, the Company’s fiscal year has changed to the 52-week or 53- week period ending on the Friday closest to the last day of June. All references in this presentation to the fourth quarter of fiscal 2020 and full fiscal 2020 are to the quarter and the 53-week period ended July 3, 2020, and to the fourth quarter of fiscal 2021 and full fiscal 2021 are to the quarter and 52-week period ended July 2, 2021.

© Mercury Systems, Inc.11 FY21 vs. FY20 Notes (1) Organic revenue represents total company revenue excluding net revenue from acquisitions for the first four full quarters since the entities’ acquisition date (which excludes any intercompany transactions). After the completion of four fiscal quarters, acquired businesses are treated as organic for current and comparable historical periods. (2) Non-GAAP, see reconciliation table. (3) Effective as of July 1, 2019, the Company’s fiscal year has changed to the 52-week or 53- week period ending on the Friday closest to the last day of June. All references in this presentation to the fourth quarter of fiscal 2020 and full fiscal 2020 are to the quarter and the 53-week period ended July 3, 2020, and to the fourth quarter of fiscal 2021 and full fiscal 2021 are to the quarter and 52-week period ended July 2, 2021. In $ millions, except percentage and per share data FY20 FY21(3) CHANGE Bookings Book-to-Bill $954.3 1.20 $881.2 0.95 (8%) Backlog 12-Month Backlog $831.1 567.7 $909.6 530.0 9% Revenue Organic Revenue Growth(1) $796.6 14% $924.0 5% 16% Gross Margin 44.8% 41.7% (3.1 bps) Operating Expenses Selling, General & Administrative Research & Development Amortization/Restructuring/Acquisition $265.8 132.3 98.5 35.0 $304.2 134.3 113.5 56.4 14% GAAP Net Income Effective Tax Rate $85.7 8.8% $62.0 19.6% (28%) GAAP EPS Weighted Average Diluted Shares $1.56 55.1 $1.12 55.5 (28%) Adjusted EPS(2) $2.30 $2.42 5% Adj. EBITDA(2) % of revenue $176.2 22.1% $201.9 21.9% 15% Operating Cash Flow $115.2 $97.2 (16%) Free Cash Flow(2) % of Adjusted EBITDA $71.9 41% $51.6 26% (28%)

© Mercury Systems, Inc.12 Balance sheet As of (In $ millions)(1) 7/3/20 10/2/20 1/1/21 4/2/21 7/2/21 ASSETS Cash & cash equivalents $226.8 $239.1 $109.1 $121.9 $113.8 Restricted cash - - 61.6 - - Accounts receivable, net 210.7 207.8 240.2 264.0 291.7 Inventory, net 178.1 206.0 218.4 226.8 221.6 PP&E, net 87.7 94.7 125.4 128.3 128.5 Goodwill and intangibles, net 822.8 815.3 1,093.6 1,077.3 1,112.5 Other 84.6 90.2 100.8 85.0 87.0 TOTAL ASSETS $1,610.7 $1,653.2 $1,949.2 $1,903.3 $1,955.1 LIABILITIES AND S/E AP and accrued expenses $107.0 $119.7 $116.8 $131.3 $120.1 Deferred consideration - - 61.6 - - Other liabilities 118.9 125.6 180.1 158.0 150.9 Debt - - 160.0 160.0 200.0 Total liabilities 225.9 245.3 518.5 449.3 471.0 Stockholders’ equity 1,384.8 1,407.9 1,430.6 1,454.0 1,484.1 TOTAL LIABILITIES AND S/E $1,610.7 $1,653.2 $1,949.2 $1,903.3 $1,955.1 Notes (1) Rounded amounts used.
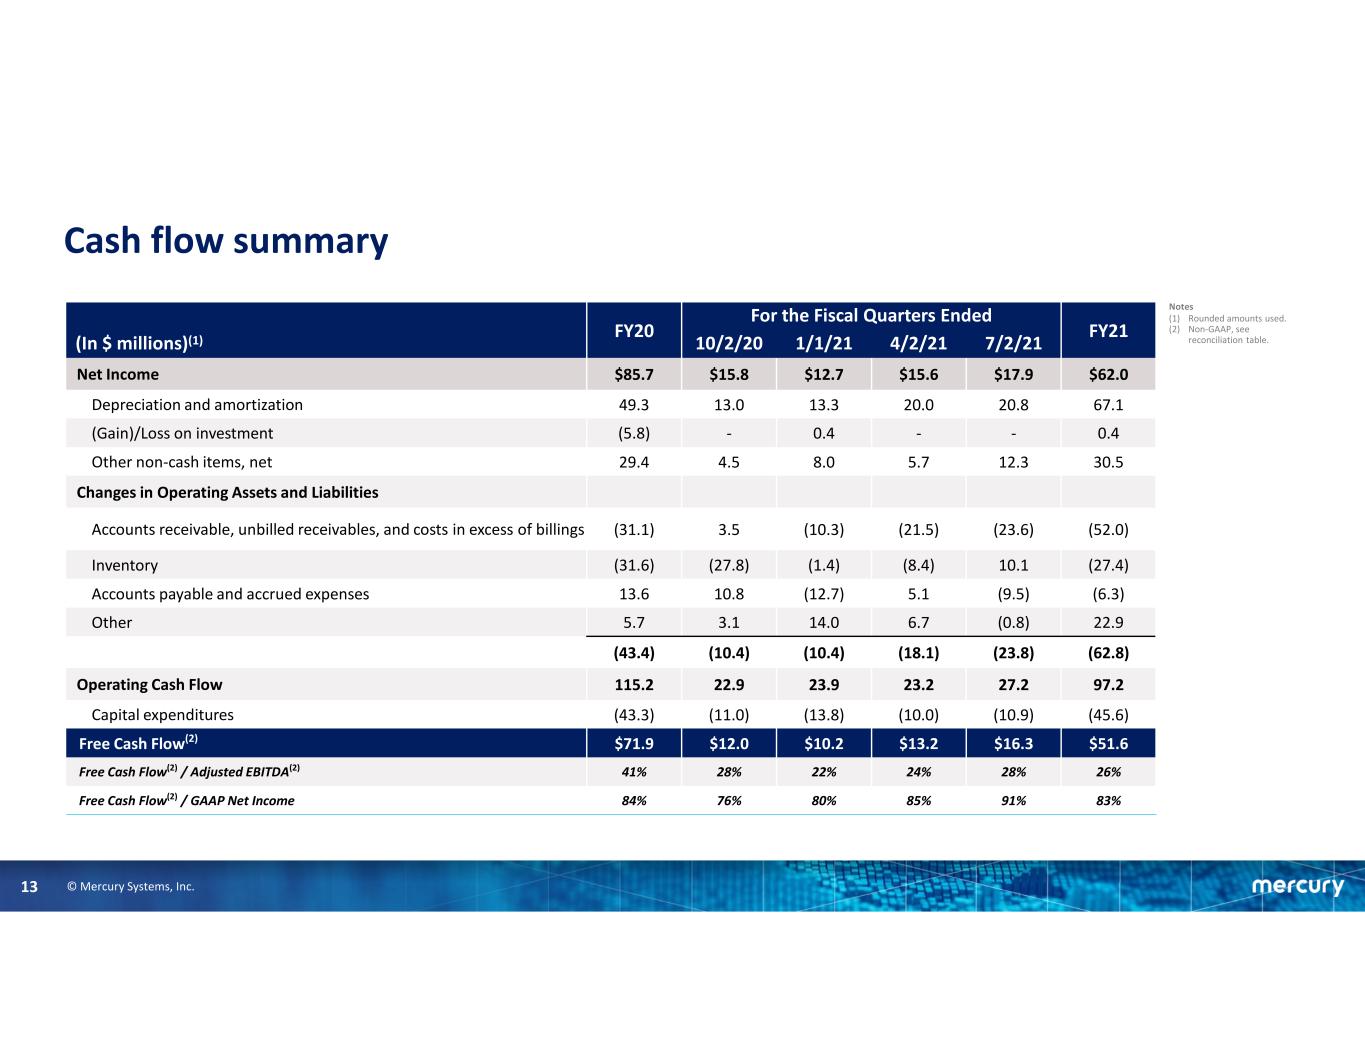
© Mercury Systems, Inc.13 Cash flow summary FY20 For the Fiscal Quarters Ended FY21 (In $ millions)(1) 10/2/20 1/1/21 4/2/21 7/2/21 Net Income $85.7 $15.8 $12.7 $15.6 $17.9 $62.0 Depreciation and amortization 49.3 13.0 13.3 20.0 20.8 67.1 (Gain)/Loss on investment (5.8) - 0.4 - - 0.4 Other non-cash items, net 29.4 4.5 8.0 5.7 12.3 30.5 Changes in Operating Assets and Liabilities Accounts receivable, unbilled receivables, and costs in excess of billings (31.1) 3.5 (10.3) (21.5) (23.6) (52.0) Inventory (31.6) (27.8) (1.4) (8.4) 10.1 (27.4) Accounts payable and accrued expenses 13.6 10.8 (12.7) 5.1 (9.5) (6.3) Other 5.7 3.1 14.0 6.7 (0.8) 22.9 (43.4) (10.4) (10.4) (18.1) (23.8) (62.8) Operating Cash Flow 115.2 22.9 23.9 23.2 27.2 97.2 Capital expenditures (43.3) (11.0) (13.8) (10.0) (10.9) (45.6) Free Cash Flow(2) $71.9 $12.0 $10.2 $13.2 $16.3 $51.6 Free Cash Flow(2) / Adjusted EBITDA(2) 41% 28% 22% 24% 28% 26% Free Cash Flow(2) / GAAP Net Income 84% 76% 80% 85% 91% 83% Notes (1) Rounded amounts used. (2) Non-GAAP, see reconciliation table.

© Mercury Systems, Inc.14 FY22 annual guidance In $ millions, except percentage and per share data FY21(1) FY22(2)(5) CHANGE Revenue $924.0 $1,000.0 – $1,030.0 8% – 11% GAAP Net Income Effective tax rate(4) $62.0 19.6% $60.0 – $65.2 25.0% (3%) – 5% GAAP EPS $1.12 $1.07 – $1.16 (4%) – 4% Weighted-average diluted shares outstanding 55.5 56.1 Adjusted EPS(4) $2.42 $2.45 – $2.55 1% – 5% Adj. EBITDA(4) % of revenue $201.9 21.9% $220.0 – $227.0 22.0% 9% – 12% Notes (1) FY21 figures are as reported in the Company’s earnings release dated August 3, 2021. (2) The guidance included herein is from the Company’s earnings release dated August 3, 2021. (3) The effective tax rate in the guidance included herein excludes discrete items. (4) Non-GAAP, see reconciliation table. (5) Effective as of July 1, 2019, the Company’s fiscal year has changed to the 52-week or 53-week period ending on the Friday closest to the last day of June. All references in this presentation to the fourth quarter of fiscal 2021 and full fiscal 2021 are to the quarter and the 53-week period ended July 2, 2021, and to the first quarter of fiscal 2022 and full fiscal 2022 are to the quarter ending October 1, 2021 and 52-week period ending July 1, 2022.

© Mercury Systems, Inc.15 Q1 FY22 guidance In $ millions, except percentage and per share data Q1 FY21(1) Q1 FY22(2)(5) CHANGE Revenue $205.6 $210.0 – $220.0 2% – 7% GAAP Net Income (Loss) Effective tax rate(3) $15.8 12.2% ($4.4) – ($2.3) 25.0% N.A GAAP Earnings (Loss) Per Share $0.29 ($0.08) – ($0.04) N.A. Weighted-average diluted shares outstanding 55.3 55.9 Adjusted EPS(4) $0.51 $0.38 – $0.41 (25%) – (20%) Adj. EBITDA(4) % of revenue $42.8 20.8% $36.8 – $39.6 17.5% - 18.0% (14%) – (7%) Notes (1) Q1 FY21 figures are as reported in the Company’s earnings release dated November 3, 2020. (2) The guidance included herein is from the Company’s earnings release dated August 3, 2021. (3) The effective tax rate in the guidance included herein excludes discrete items. (4) Non-GAAP, see reconciliation table. (5) Effective as of July 1, 2019, the Company’s fiscal year has changed to the 52-week or 53-week period ending on the Friday closest to the last day of June. All references in this presentation to the fourth quarter of fiscal 2021 and full fiscal 2021 are to the quarter and the 53-week period ended July 2, 2021, and to the first quarter of fiscal 2022 and full fiscal 2022 are to the quarter ending October 1, 2021 and 52-week period ending July 1, 2022.
© Mercury Systems, Inc.16 1MPACT: Estimated magnitude and timing of savings Identifying workstreams and savings estimates across six key focus areas Preliminary run-rate adjusted EBITDA savings estimates of $35-55M by FY25 Reinvesting approximately $5M in the business to support continued growth Ramp-up of savings in FY23 through FY25 Estimated $22M of savings in FY22 guidance for actions taken through Q1 Solid organic revenue and margin expansion supplemented by 1MPACT in FY23 Acceleration of 5-year margin expansion forecast
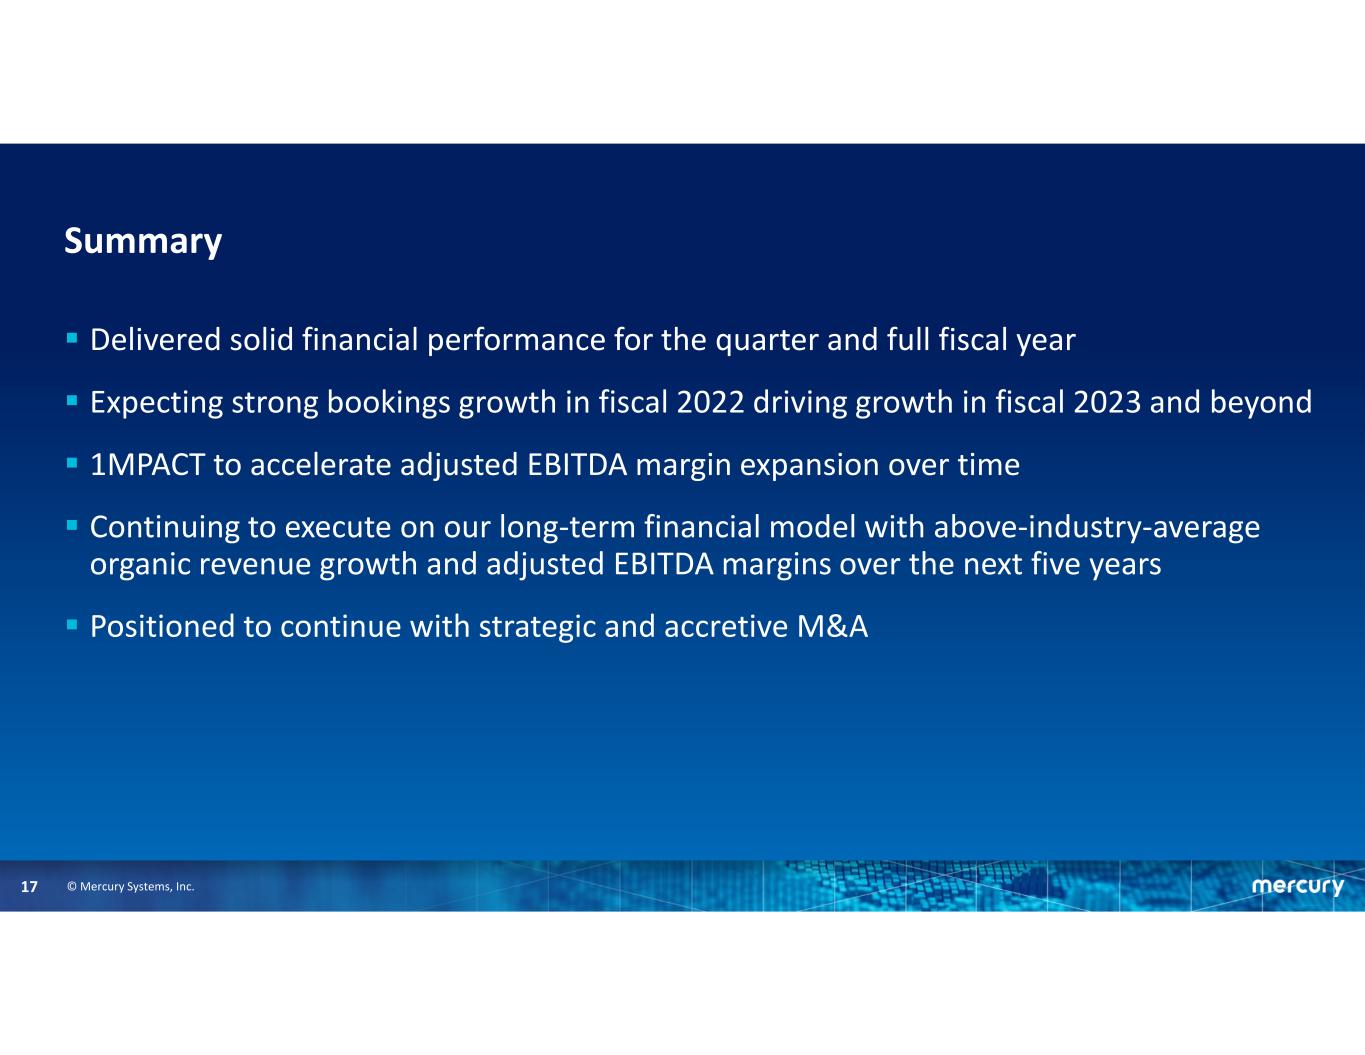
© Mercury Systems, Inc.17 Summary Delivered solid financial performance for the quarter and full fiscal year Expecting strong bookings growth in fiscal 2022 driving growth in fiscal 2023 and beyond 1MPACT to accelerate adjusted EBITDA margin expansion over time Continuing to execute on our long-term financial model with above-industry-average organic revenue growth and adjusted EBITDA margins over the next five years Positioned to continue with strategic and accretive M&A

18 APPENDIX

© Mercury Systems, Inc.19 Adjusted EPS reconciliation Notes (1) Per share information is presented on a fully diluted basis. (2) Rounded amounts used. (3) Impact to income taxes is calculated by recasting income before income taxes to include the add-backs involved in determining adjusted income and recalculating the income tax provision using this adjusted income from operations before income taxes. The recalculation also adjusts for any discrete tax expense or benefit related to the add-backs. (4) Effective as of July 1, 2019, the Company’s fiscal year has changed to the 52-week or 53-week period ending on the Friday closest to the last day of June. All references in this presentation to the fourth quarter of fiscal 2021 and full fiscal 2021 are to the quarter and the 53-week period ended July 2, 2021, and to the first quarter of fiscal 2022 and full fiscal 2022 are to the quarter ending October 1, 2021 and 52-week period ending July 1, 2022. (In thousands, except per share data) Q4 FY20 Q4 FY21 FY20 FY21 Low High Low High Earnings (loss) per share (1) 0.49$ 0.32$ 1.56$ 1.12$ (0.08)$ (0.04)$ 1.07$ 1.16$ Net Income (loss) 27,224$ 17,925$ 85,712$ 62,044$ (4,400)$ (2,300)$ 60,000$ 65,200$ Other non-operating adjustments, net (2,250) 236 (5,636) (724) - - - - Amortization of intangible assets 7,701 13,080 30,560 41,171 13,700 13,700 49,800 49,800 Restructuring and other charges (10) 6,978 1,805 9,222 9,400 9,400 9,400 9,400 Impairment of long-lived assets - - - - - - - - Acquisition and financing costs 636 1,530 5,645 8,600 600 600 2,600 2,600 Fair value adjustments from purchase accounting 601 (472) 1,801 (290) 200 200 700 700 Litigation and settlement expense, net 315 (128) 944 622 - - - - COVID related expenses 2,196 1,570 2,593 9,943 - - - - Stock-based and other non-cash compensation expense 7,640 6,853 26,972 29,224 9,700 9,700 38,800 38,800 Impact to income taxes (3) (4,293) (7,211) (23,634) (25,697) (8,200) (8,200) (23,700) (23,700) Adjusted income 39,760$ 40,361$ 126,762$ 134,115$ 21,000$ 23,100$ 137,600$ 142,800$ Adjusted earnings per share (1) 0.72$ 0.73$ 2.30$ 2.42$ 0.38$ 0.41$ 2.45$ 2.55$ Weighted-average shares outstanding: Basic 54,637 55,180 54,546 55,070 55,400 55,400 Diluted 55,259 55,598 55,115 55,474 55,900 55,900 56,100 56,100 Q1 FY22 (2)(4) FY22 (2)(4)
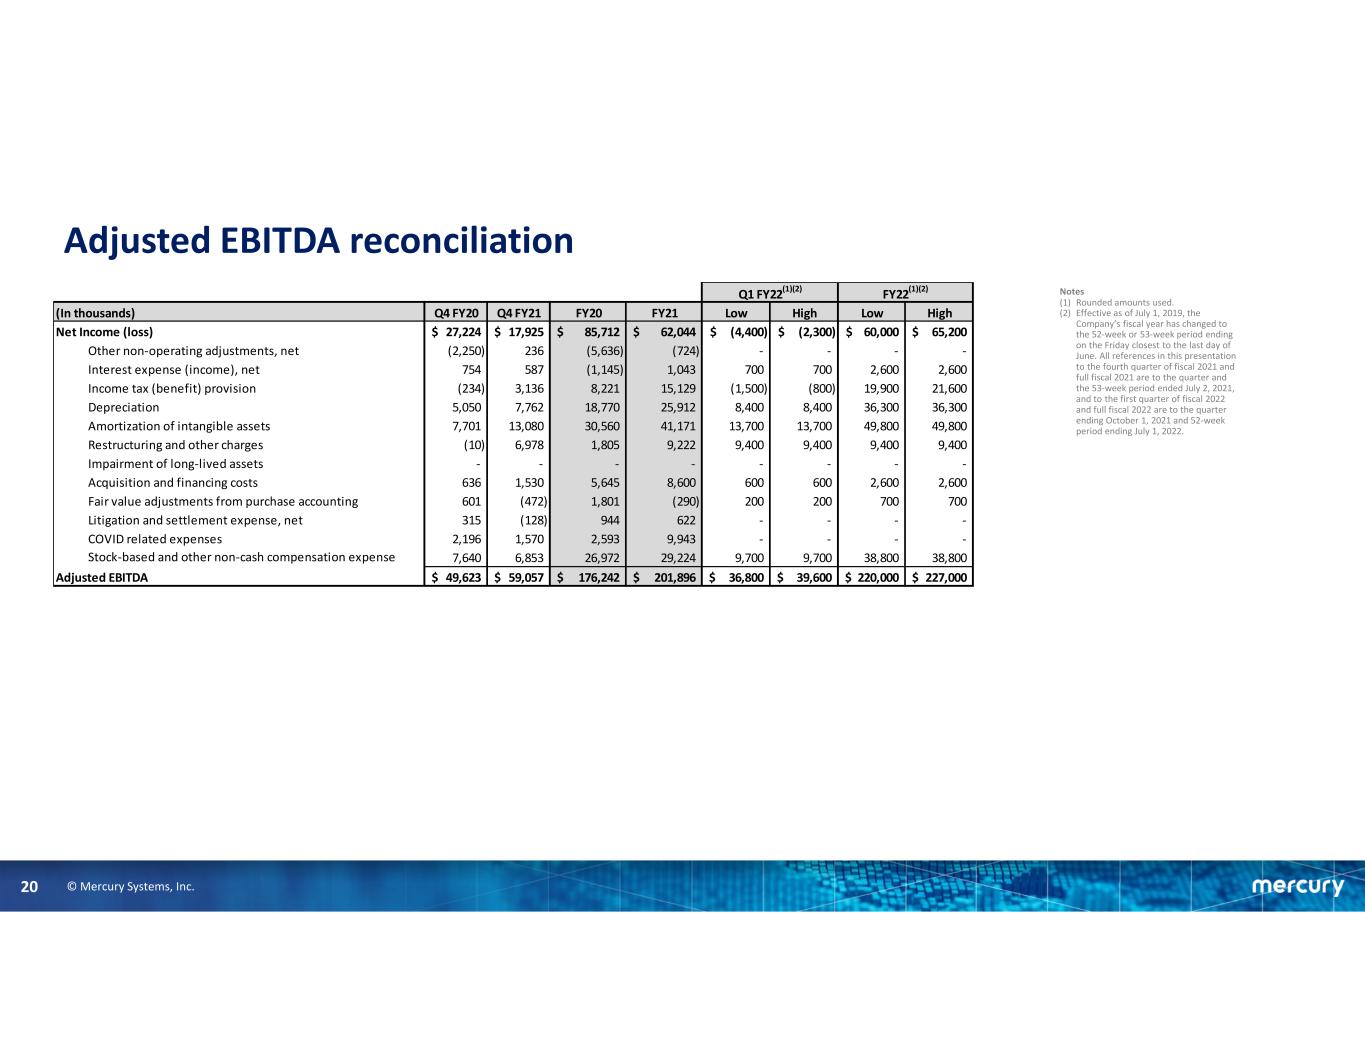
© Mercury Systems, Inc.20 Adjusted EBITDA reconciliation Notes (1) Rounded amounts used. (2) Effective as of July 1, 2019, the Company’s fiscal year has changed to the 52-week or 53-week period ending on the Friday closest to the last day of June. All references in this presentation to the fourth quarter of fiscal 2021 and full fiscal 2021 are to the quarter and the 53-week period ended July 2, 2021, and to the first quarter of fiscal 2022 and full fiscal 2022 are to the quarter ending October 1, 2021 and 52-week period ending July 1, 2022. (In thousands) Q4 FY20 Q4 FY21 FY20 FY21 Low High Low High Net Income (loss) 27,224$ 17,925$ 85,712$ 62,044$ (4,400)$ (2,300)$ 60,000$ 65,200$ Other non-operating adjustments, net (2,250) 236 (5,636) (724) - - - - Interest expense (income), net 754 587 (1,145) 1,043 700 700 2,600 2,600 Income tax (benefit) provision (234) 3,136 8,221 15,129 (1,500) (800) 19,900 21,600 Depreciation 5,050 7,762 18,770 25,912 8,400 8,400 36,300 36,300 Amortization of intangible assets 7,701 13,080 30,560 41,171 13,700 13,700 49,800 49,800 Restructuring and other charges (10) 6,978 1,805 9,222 9,400 9,400 9,400 9,400 Impairment of long-lived assets - - - - - - - - Acquisition and financing costs 636 1,530 5,645 8,600 600 600 2,600 2,600 Fair value adjustments from purchase accounting 601 (472) 1,801 (290) 200 200 700 700 Litigation and settlement expense, net 315 (128) 944 622 - - - - COVID related expenses 2,196 1,570 2,593 9,943 - - - - Stock-based and other non-cash compensation expense 7,640 6,853 26,972 29,224 9,700 9,700 38,800 38,800 Adjusted EBITDA 49,623$ 59,057$ 176,242$ 201,896$ 36,800$ 39,600$ 220,000$ 227,000$ Q1 FY22 (1)(2) FY22 (1)(2)
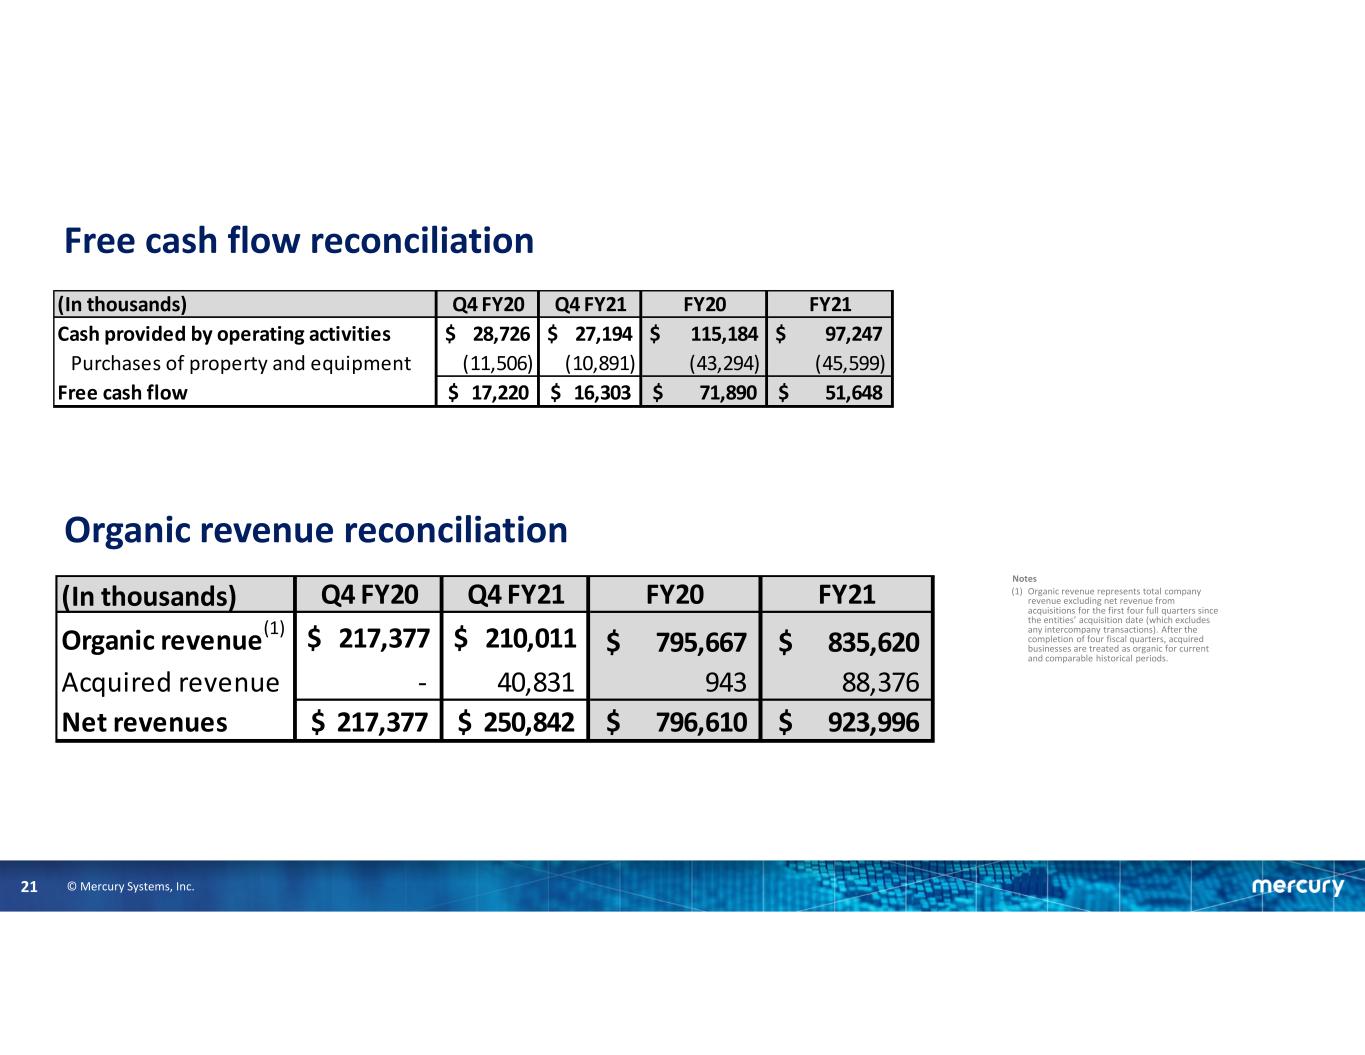
© Mercury Systems, Inc.21 Free cash flow reconciliation Organic revenue reconciliation Notes (1) Organic revenue represents total company revenue excluding net revenue from acquisitions for the first four full quarters since the entities’ acquisition date (which excludes any intercompany transactions). After the completion of four fiscal quarters, acquired businesses are treated as organic for current and comparable historical periods. (In thousands) Q4 FY20 Q4 FY21 FY20 FY21 Organic revenue (1) $ 217,377 $ 210,011 795,667$ 835,620$ Acquired revenue - 40,831 943 88,376 Net revenues 217,377$ 250,842$ 796,610$ 923,996$ (In thousands) Q4 FY20 Q4 FY21 FY20 FY21 Cash provided by operating activities $ 28,726 $ 27,194 $ 115,184 $ 97,247 Purchases of property and equipment (11,506) (10,891) (43,294) (45,599) Free cash flow 17,220$ 16,303$ 71,890$ 51,648$


