Corporate Profile
Cavalry Bancorp, Inc. (the “Company”), a Tennessee corporation, is a bank holding company which owns Cavalry Banking (the “Bank”), the oldest and largest independent community bank in Rutherford County, Tennessee. The Bank is a Federal Reserve member and state chartered commercial bank. The primary Federal regulator for both the Company and the Bank is the Board of Governors of the Federal Reserve System. The Bank is also under the supervision of the Tennessee Department of Financial Institutions. In addition to traditional banking services, the Company and its subsidiaries provide a wide range of other financial products and services. Cavalry Mortgage, a division of the Bank, provides mortgage lending assistance in Rutherford County and the surrounding market area. The Bank’s Main Office location houses a consumer and commercial lending department as well as a newly-expanded construction lending department. Cavalry Investments, another division of the Bank, provides a complete array of investment options, while the Investment and Trust division contributes a full range of trust services. The Bank’s subsidiary, Miller & Loughry Insurance and Services, Inc., offers a complete selection of insurance products, as well as human resource services and personnel assistance. The Company and its subsidiaries are located throughout the Middle Tennessee area at the following locations:
114 West College Street Murfreesboro, TN 37130 615/893-1234 | 123 Cason Lane Murfreesboro, TN 37128 615/893-1812 | 604 North Main Street Shelbyville, TN 37160 931/684-6166 |
| | | |
2035 Southeast Broad Street Murfreesboro, TN 37130 615/895-0905 | 1645 Northwest Broad Street Murfreesboro, TN 37129 615/895-3380 | 269 South Lowry Street Smyrna, TN 37167 615/459-2535 |
| | | |
1745 Memorial Boulevard Murfreesboro, TN 37129 615/890-2919 | 2604 South Church Street Murfreesboro, TN 37127 615/848-1966 | 467 Sam Ridley Parkway West Smyrna, TN 37167 615/459-6828 |
| | | |
Cavalry Financial Center 214 West College Street Murfreesboro, TN 37130 615/893-1234 | | Miller & Loughry Insurance and Services, Inc. 214 West College Street Murfreesboro, TN 37130 615/896-9292 |
| | | |
| | | |
Table of Contents
Letter to Our Shareholders | |
Corporate Information | 1 |
Selected Financial Data | 2 |
Management’s Discussion and Analysis of Financial Condition and Results of Operations | 4 |
Report of Independent Registered Public Accounting Firm | 21 |
Consolidated Financial Statements | 22 |
Notes to Consolidated Financial Statements | 29 |
Board of Directors, Community Board, Officers | Inside Back Cover |
Letter To Our Shareholders:
As our community grows, so grows Cavalry Bancorp, Inc. (the "Company") and Cavalry Banking (the "Bank"). 2004 was a great year!
Located in the heart of Tennessee in Rutherford County, the Bank reaped the benefit of location, location, location, by virtue of calling Murfreesboro, Tennessee home. The market for the Company is among the fastest growing in the United States and quickly gaining regional and national recognition as one of the nation's most attractive markets. Recently, the Nashville Chamber of Commerce credited Rutherford County as one of the major contributors of Nashville being selected the #1 city in the United States for business expansion and relocation.
The year 2004 was a year of historical significance as the Company celebrated its 75th year of serving our communities. New milestones were achieved as the Bank continued double digit growth and ended the year with growth in every area. In 2004, total assets increased 12% to $579 million, total deposits grew 12% to $507 million, and total loans increased 23% to $433 million. Total stockholder equity stood at 9.30% of assets or $53.8 million.
2004 was also an unusual year as it provided a unique opportunity for your Board of Directors to deploy capital management tools by rewarding stockholders with a one-time special dividend of $1.50 per share and increasing the regular quarterly cash dividend by 16.7% to $0.07 per share. The Board also authorized the acceleration of future expense associated with the Employee Stock Ownership Plan and the 1999 Stock Option Plan. This one-time, non-cash charge of $5.3 million will eliminate the expense associated with those plans going forward and should enhance future earnings. Net income was $429,000, or $0.06 per diluted share, and reflects the one-time charge taken in the fourth quarter, as mentioned above and explained in footnotes 12 and 13 of the consolidated financial statements.
The Bank's growth is directly related to its ability to provide more products and services than other institutions in our market. In 2004, CAVBizsolutions became an umbrella for products and services provided to businesses. The coordination of these services positions the Bank as a one-stop solution for all business financial needs, including human resources, insurance, investments, wealth management, and banking. The Cavalry Auction Team began with a committed group of employees dedicated to assisting individuals that purchase property at public auctions and has become a very vibrant source of business opportunities. The Private Banking Group completed its first full year of operation with a degree of success that required the addition of another full time person dedicated to personal service. Another addition was the dedication of a full time person to the Bank@School program which has Cavalry Banks in various schools within our area that promotes the development of financial skills in school age children. We believe that young customers today are the customers of the Bank tomorrow. During 2004, we expanded our offices of Miller and Loughry Insurance with additional highly qualified personnel which has already proven to be a successful decision.
In 2004, the Bank culminated a year of celebrating its 75th anniversary by hosting an outdoor community concert in the street between the main office and the financial center office in Murfreesboro. Tagged as "Boogie In The 'Boro", it was a huge success having an estimated crowd of 7,000. This gift to the community is an example of the Bank's total involvement in its communities. While the Bank is a major participant and contributor toward the Chamber of Commerce, Middle Tennessee Sate University, Special Kids, Boys and Girls Club, Middle Tennessee Medical Foundation, American Heart Association, and others, it is the employees and the thousands of hours they commit to various organizations that help make our communities a better place to live.
We are fortunate to live in a community that is diversified and progressive with a good quality of life. As our community continues to grow, so will Cavalry. The Board of Directors and your management team remain committed to sound growth and increased returns for our investors.
 |  |  |
Ed C. Loughry, Jr. Chairman & Chief Executive Officer | Ronald F. Knight President & Chief Operating Officer | William S. Jones Executive Vice President & Chief Administrative Officer |
Corporate Information
Corporate Address
114 West College Street
Murfreesboro, Tennessee 37130
(615) 893-1234
Transfer Agent and Registrar
Mellon Investor Services LLC
85 Challenger Road
Ridgefield Park, NJ 07660
Independent Registered Public Accounting Firm
Rayburn, Bates & Fitzgerald, P.C.
5200 Maryland Way, Suite 300
Brentwood, Tennessee 37027
Market Price of the Company’s Common
Stock and Related Security Matters
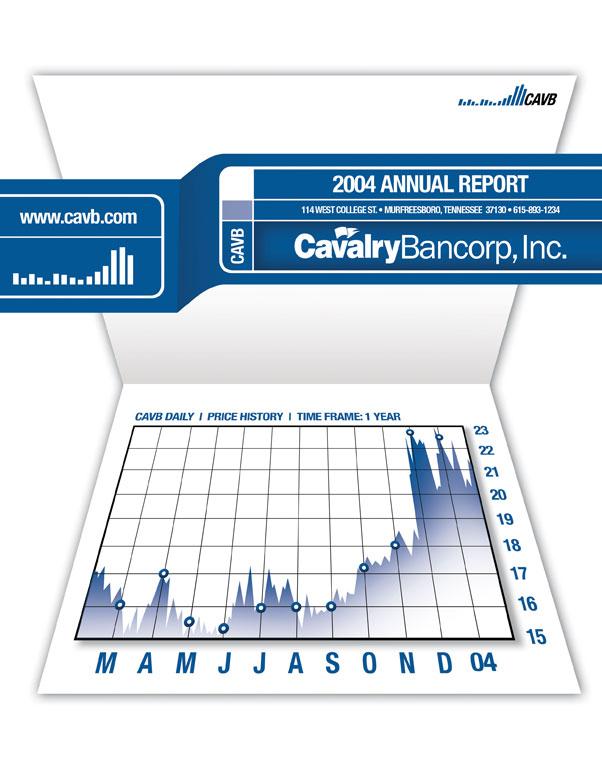
The common stock of Cavalry Bancorp, Inc. is listed on the Nasdaq National Market System under the symbol “CAVB.” The following table discloses on a quarterly basis the high and low bid and closing prices and dividends declared for the stock for the years ended December 31, 2004 and 2003.
| | | 2004 | |
| | | Fourth Quarter | | Third Quarter | | Second Quarter | | First Quarter | |
| Market Price: | | | | | | | | | | | | | |
| High | | $ | 23.94 | | | 17.23 | | | 17.49 | | | 18.99 | |
| Low | | | 16.61 | | | 15.25 | | | 15.00 | | | 14.81 | |
| Close | | | 23.00 | | | 17.10 | | | 15.80 | | | 16.84 | |
| | | | | | | | | | | | | | |
| Dividends Declared | | $ | 1.57 | | | 0.06 | | | 0.06 | | | 0.06 | |
| | | 2003 | |
| | | Fourth Quarter | | Third Quarter | | Second Quarter | | First Quarter | |
| Market Price: | | | | | | | | | | | | | |
| High | | $ | 19.98 | | | 18.75 | | | 18.81 | | | 16.31 | |
| Low | | | 16.66 | | | 15.60 | | | 15.77 | | | 13.10 | |
| Close | | | 17.68 | | | 16.75 | | | 16.98 | | | 16.23 | |
| | | | | | | | | | | | | | |
| Dividends Declared | | $ | 0.06 | | | 0.06 | | | 0.05 | | | 0.05 | |
The Bank may not declare or pay a cash dividend on any of its stock if the effect thereof would cause the Bank’s regulatory capital to be below the amount required for the liquidation account established in connection with the mutual to stock conversion. At the close of business on March 1, 2005, there were approximately 1,200 registered shareholders and 2,400 non-registered or “street name” shareholders of the Company’s common stock.
Annual Meeting
The annual Meeting of Shareholders of Cavalry Bancorp, Inc. will be held at 10:00 a.m. Central Daylight Time, April 28, 2005, in the Fifth Floor Auditorium of the main office of Cavalry Banking, 114 West College Street, Murfreesboro, Tennessee.
A COPY OF THE FORM 10-K, INCLUDING CONSOLIDATED FINANCIAL STATEMENTS, AS FILED WITH THE SECURITIES AND EXCHANGE COMMISSION WILL BE FURNISHED WITHOUT CHARGE TO SHAREHOLDERS AS OF THE RECORD DATE FOR VOTING AT THE ANNUAL MEETING OF SHAREHOLDERS UPON WRITTEN REQUEST TO IRA B. LEWIS, JR., SECRETARY, CAVALRY BANCORP, INC., 114 WEST COLLEGE STREET, MURFREESBORO, TENNESSEE 37130.
The SEC maintains an internet site that contains reports, proxy and information statements and other information about issuers, like us, that file electronically with the SEC. The address of that site is http://www.sec.gov.
Internet Information
Information on the Company’s and the Bank’s history, locations, products and services can be accessed on the internet at http://www.cavb.com.
A link to the Company’s electronic filings with the SEC may also be found at http://www.cavb.com.
Cavalry Bancorp, Inc. and Subsidiaries
Selected Financial Data
The following tables set forth certain information concerning the consolidated financial position and results of operations of the Company at the dates and for the periods indicated.
| | | At December 31, | |
| | | 2004 | | 2003 | | 2002 | | 2001 | | 2000 | |
| | | (Dollars in thousands) | |
Financial Condition Data: | | | | | | | | | | | |
| | | | | | | | | | | | |
| Total assets | | $ | 578,670 | | | 515,172 | | | 464,365 | | | 432,874 | | | 384,285 | |
| Loans receivable, net | | | 430,526 | | | 350,412 | | | 300,524 | | | 280,239 | | | 279,478 | |
| Loans held-for-sale | | | 2,501 | | | 2,648 | | | 17,800 | | | 10,423 | | | 4,183 | |
| Investment securities held-to-maturity | | | - | | | - | | | - | | | 637 | | | 594 | |
| Investment securities available-for-sale | | | 42,183 | | | 55,123 | | | 37,926 | | | 41,808 | | | 32,247 | |
| Cash and cash equivalents | | | 63,135 | | | 70,913 | | | 73,162 | | | 69,281 | | | 45,025 | |
| Deposits | | | 506,534 | | | 454,257 | | | 407,752 | | | 380,990 | | | 336,534 | |
| Borrowings | | | 2,835 | | | 2,889 | | | 2,944 | | | 998 | | | 1,578 | |
| Total shareholders’ equity | | | 53,833 | | | 54,427 | | | 49,746 | | | 48,806 | | | 43,971 | |
| | | | | | | | | | | | | | | | | |
| | | | | | | | | | | | | | | | | |
| | | | For the Year Ended December 31, |
| | | | 2004 | | | 2003 | | | 2002 | | | 2001 | | | 2000 | |
| | | (Dollars in thousands, except per share amounts) |
| | | | | | | | | | | | | | | | | |
Operating Data: | | | | | | | | | | | | | | | | |
| | | | | | | | | | | | | | | | | |
| Interest and dividend income | | $ | 25,068 | | | 21,936 | | | 23,257 | | | 28,108 | | | 29,436 | |
| Interest expense | | | 5,555 | | | 5,616 | | | 7,193 | | | 12,649 | | | 13,070 | |
| | | | | | | | | | | | | | | | | |
| Net interest income | | | 19,513 | | | 16,320 | | | 16,064 | | | 15,459 | | | 16,366 | |
| Provision for loan losses | | | 875 | | | 101 | | | 497 | | | 661 | | | 306 | |
| | | | | | | | | | | | | | | | | |
| Net interest income after provision for loan losses | | | 18,638 | | | 16,219 | | | 15,567 | | | 14,798 | | | 16,060 | |
| | | | | | | | | | | | | | | | | |
| Gains on sale of loans, net | | | 2,773 | | | 5,473 | | | 3,401 | | | 2,537 | | | 1,548 | |
| Other non-interest income | | | 10,125 | | | 9,138 | | | 8,217 | | | 5,763 | | | 4,147 | |
| Non-interest expense | | | 28,573 | | | 23,371 | | | 20,177 | | | 18,664 | | | 14,700 | |
| | | | | | | | | | | | | | | | | |
| Income before income taxes | | | 2,963 | | | 7,459 | | | 7,008 | | | 4,434 | | | 7,055 | |
| Income tax expense | | | 2,534 | | | 2,965 | | | 2,891 | | | 2,435 | | | 3,003 | |
| | | | | | | | | | | | | | | | | |
| Net income | | $ | 429 | | | 4,494 | | | 4,117 | | | 1,999 | | | 4,052 | |
| | | | | | | | | | | | | | | | | |
| Basic earnings per share | | $ | 0.07 | | | 0.70 | | | 0.64 | | | 0.31 | | | 0.64 | |
| Diluted earnings per share | | $ | 0.06 | | | 0.67 | | | 0.62 | | | 0.31 | | | 0.64 | |
| Dividends declared per share | | $ | 1.75 | | | 0.22 | | | 0.20 | | | 0.20 | | | 0.20 | |
Cavalry Bancorp, Inc. and Subsidiaries
Selected Financial Data (Continued)
Key Financial Ratios: | | | | | | | | | | | |
| | | | |
| | | For the Year Ended December 31, | |
| | | 2004 | | 2003 | | 2002 | | 2001 | | 2000 | |
Performance Ratios: | | | | | | | | | | | |
| Return on average assets (1) | | | 0.08 | % | | 0.96 | | | 0.97 | | | 0.50 | | | 1.11 | |
| Return on average equity (2) | | | 0.77 | | | 8.60 | | | 8.36 | | | 4.33 | | | 9.90 | |
| Interest rate spread (tax equivalent) (3) | | | 3.84 | | | 3.68 | | | 4.00 | | | 3.65 | | | 4.22 | |
| Net interest margin (tax equivalent) (4) | | | 4.10 | | | 3.93 | | | 4.28 | | | 4.24 | | | 4.89 | |
| Average interest-earning assets to average interest-bearing liabilities | | | 122.41 | | | 118.10 | | | 114.94 | | | 117.19 | | | 117.19 | |
| Non-interest expense as a percent of average total assets | | | 5.40 | | | 5.00 | | | 4.77 | | | 4.67 | | | 4.02 | |
| Efficiency ratio (5) | | | 88.16 | | | 75.56 | | | 72.89 | | | 78.56 | | | 66.63 | |
| Dividend payout ratio (6) | | | 2,500.00 | | | 31.43 | | | 31.25 | | | 64.52 | | | 31.25 | |
| | | | | | | | | | | | | | | | | |
Asset Quality Ratios: | | | | | | | | | | | | | | | | |
| Non-accrual and 90 days or more past due loans as a percent of total loans, net | | | 0.17 | | | 0.24 | | | 0.17 | | | 0.14 | | | 0.04 | |
| Non-performing assets as a percent of total assets | | | 0.13 | | | 0.17 | | | 0.16 | | | 0.13 | | | 0.05 | |
| Allowance for loan losses as a percent of total loans receivable | | | 1.12 | | | 1.28 | | | 1.46 | | | 1.38 | | | 1.34 | |
| Allowance for loan losses as a percent of non-performing loans | | | 650.13 | | | 526.78 | | | 878.68 | | | 1,134.52 | | | 3,443.09 | |
| Net charge-offs to average outstanding loans | | | 0.14 | | | 0.07 | | | 0.10 | | | 0.15 | | | 0.07 | |
| | | | | | | | | | | | | | | | | |
| | | | | | | | | | | | | | | | | |
Capital Ratios: (7) | | | | | | | | | | | | | | | | |
| Total equity-to-assets ratio | | | 9.30 | | | 10.56 | | | 10.71 | | | 11.27 | | | 11.44 | |
| Average equity to average assets (8) | | | 10.50 | | | 11.17 | | | 11.64 | | | 11.56 | | | 11.19 | |
| (1) | Net income divided by average total assets. |
| (2) | Net income divided by average equity. |
| (3) | Difference between weighted average yield on interest-earning assets and weighted average rate on interest-bearing liabilities. |
| (4) | Net interest income as a percentage of average interest-earning assets. |
| (5) | Other expenses divided by the sum of net interest income and other income. |
| (6) | Dividends per share divided by net income per share. |
| (7) | During 2001, the Company repurchased 25,000 shares for $271,000. During 2002, the Company repurchased 250,064 shares for $3.2 million. During 2003, the Company repurchased 28,112 shares for $461,000. During 2004, the Company repurchased 132,043 shares for $2.0 million. |
| (8) | Average total equity divided by average total assets. |
Cavalry Bancorp, Inc. and Subsidiaries
Management's Discussion & Analysis of Financial Condition
and Results of Operations
General
Management's discussion and analysis of financial condition and results of operations is intended to assist in understanding the financial condition and results of operations of the Company. The information contained in this section should be read in conjunction with the Consolidated Financial Statements and accompanying Notes contained in this Annual Report.
Private Securities Litigation Reform Act Safe Harbor Statement
This Annual Report contains forward-looking statements within the meaning of the federal securities laws. These statements are not historical facts, rather statements based on the Company's expectations regarding its business strategies and their intended results and its future performance. Forward-looking statements are preceded by terms such as "expects," "believes," "anticipates," "intends," and similar expressions.
Forward-looking statements are not guarantees of future performance. Numerous risks and uncertainties could cause the Company's actual results, performance, and achievements to be materially different from those expressed or implied by the forward-looking statements. Factors that may cause or contribute to these differences include, without limitation, general economic conditions, including changes in market interest rates and changes in monetary and fiscal policies of the federal government; changes in market conditions in the Company’s principal market area; adverse changes in the financial condition of the Company’s loan customers; competitive pressures on loan or deposit terms; legislative and regulatory changes; and other factors disclosed periodically in the Company's filings with the Securities and Exchange Commission.
Because of the risks and uncertainties in forward-looking statements, readers are cautioned not to place undue reliance on them, whether included in this report or made elsewhere from time to time by the Company or on its behalf. The Company assumes no obligation to update any forward-looking statements.
The Company’s Business and Strategy
Cavalry Bancorp, Inc. (the “Company”), a Tennessee corporation, is a holding company which owns Cavalry Banking (the “Bank”). The Bank is a Federal Reserve member and state chartered commercial bank whose principal office is located in Murfreesboro, Tennessee. The Bank has nine branch locations throughout the Middle Tennessee area.
The Bank’s operations are divided into four distinct segments: banking, mortgage banking, insurance, and trust services. The Bank is a community-oriented financial institution whose principal business consists of attracting deposits from the general public and utilizing those funds to originate a wide assortment of loans to both individuals and business owners residing in the Middle Tennessee area. The Bank also offers investment management and trust services, brokerage services and annuity services. Additionally, Miller & Loughry Insurance and Services, Inc. (“Miller & Loughry”), a 100%-owned subsidiary of the Bank, offers a complete range of personal and commercial insurance services along with personnel and human resource services. Miller & Loughry also provides comprehensive life and health insurance services for both individuals and companies.
The banking segment offers a vast assortment of deposit options for both individuals and business owners. Services offered include traditional demand deposit and savings accounts, certificates of deposit, individual retirement accounts, and money market products. The banking segment also includes the consumer and commercial lending department which originates consumer loans, commercial real estate and business loans, construction loans, and land acquisition and development loans. This segment also includes the merchant services department, which provides business owners with credit card processing, check collection services, and Web-based bill pay services. An additional component of this segment is an investment brokerage department, which provides various investment opportunities to customers. The banking segment’s profitability relies heavily on net interest income (discussed below) and deposit and other fee income.
The mortgage banking segment originates one-to-four family mortgage loans for sale in the secondary market and also services residential mortgage loans for other investors. This segment’s income is greatly influenced by market rates, outside competition, the general economy of the surrounding market area, and current levels of refinancing. This segment’s profitability depends primarily on its net gains on the sale of loans as well as the collection of fees, such as fees paid for the sale of servicing rights.
The insurance segment is an independent insurance agency offering customers commercial insurance, property and home insurance, life and health insurance, and human resource services. This segment’s profitability is largely generated through commissions earned from the sale of various insurance products. Another important profit component is fee income received for providing human resource services to local small business clients.
Cavalry Bancorp, Inc. and Subsidiaries
Management's Discussion & Analysis of Financial Condition
and Results of Operations (Continued)
The Company’s Business and Strategy (Continued)
The trust segment offers an array of investment management accounts, personal trusts, custodial and corporate trust services, and employee benefit services. This segment’s profitability is wholly dependent on the fees collected for services related to these products.
The Bank’s overall profitability depends significantly on its net interest income, which is the difference between the income it receives on its loan and investment portfolio and its cost of funds, consisting of interest paid on deposits and other borrowings. Net interest income is also affected by the relative amounts of interest-earning assets and interest-bearing liabilities of the Bank. When the amount of interest income earned on interest-earning assets equals or exceeds the interest expense generated by interest-bearing liabilities, a positive interest rate spread is recognized and net interest income is generated.
The Bank’s profitability is also dependent on its other income and expenses. Other income consists of deposit-related fees, merchant services fees, income associated with the origination and sale of mortgage loans, loan servicing fees, commissions from the sales of insurance and financial instruments, and trust fees. Other expenses include compensation and benefits expense, occupancy and equipment charges, advertising and public relations expense, data processing expenses and other general operating costs.
The Bank’s operating results can be significantly impacted by local economic and competitive conditions, fluctuations in the market interest rate, and changes in government legislation and regulatory policies. Deposit balances can be influenced by interest rates paid on competing personal investments and the level of income and savings for the surrounding market area. The level of lending activity can be influenced by the demand for housing and the general economy of the Bank’s market area, as well as outside competition from other lending institutions.
Critical Accounting Policies
The Company’s consolidated financial statements are prepared in conformity with accounting principles generally accepted in the United States of America and follow general practices within the industries in which it operates. The Company’s accounting policies are fundamental to understanding these financial statements. Certain accounting policies involve significant judgments and complex assumptions by management which may have a material impact on the carrying value of certain assets and liabilities; management considers these accounting policies to be critical accounting policies. Based on this definition, management considers the allowance for loan losses to be its most critical accounting policy. The Company’s allowance for loan losses methodology incorporates a variety of risk considerations, both quantitative and qualitative, in establishing an allowance that management believes to be appropriate for each reporting date. Quantitative factors include the Company’s historical loss experience, delinquency and charge-off trends, collateral values, and changes in non-performing loans. The Company also incorporates known information about individual loans, including borrower’s sensitivity to interest rate movements and other relevant factors. Qualitative factors include the general economic environment in the Company’s markets, including economic conditions throughout the Southeast and the state of industries predominant in the Middle Tennessee area. The details of this methodology are discussed in the section of this Management’s Discussion and Analysis entitled “Critical Accounting Estimates.”
Management also considers its policy on non-accrual loans to be a critical accounting policy. Loans are classified as non-accrual loans when principal or interest is delinquent for 90 days or more. Once a loan is categorized as non-accrual, all previously recorded earned income is reversed and income is no longer accrued on an on-going basis. When the deficiency is cured, the loan is taken out of non-accrual status, the related income is recorded on the books, and interest income will start accruing again as usual.
The final critical accounting policy identified by management relates to the sale of loans. The Bank sells mortgage loans for cash proceeds equal to the principal amount of the loans sold but with yield rates which reflect the current market rate. Gain or loss is recorded at the time of sale in an amount reflecting the difference between the contractual interest rates of the loans sold and the current market rate. The gain (or loss) on sales includes any fees received for release of servicing.
Critical Accounting Estimates
The preparation of the financial statements requires management to make certain judgments and assumptions in determining accounting estimates. Accounting estimates are considered critical if (a) the estimate requires management to make assumptions about matters that were highly uncertain at the time the estimate was made, and (b) different estimates reasonably could have been used in the current period that would have a material impact on the presentation of the Company’s financial condition, changes in financial condition, or results of operations. Based on these assumptions, management considers the calculation of the allowance for loan losses to be the Company’s most critical accounting estimate. The following is a discussion of the key elements of the Company’s methodology.
Cavalry Bancorp, Inc. and Subsidiaries
Management’s Discussion & Analysis of Financial Condition
and Results of Operations (Continued)
Critical Accounting Estimates (Continued)
The Company evaluates loans at two levels to arrive at the final allowance for loan losses amount. The first level is the individual loan level. The evaluation process begins with an internal loan review performed by the credit department. This department conveys their recommendations of impaired loans to the asset classification committee, which is an internal team consisting of selected senior management and senior lenders. The asset classification committee, based on those recommendations, evaluates the overall loan portfolio and specifically identifies individual loans for impairment. An independent third party team also evaluates the loan portfolio annually and identifies specific loans they consider impaired. Impairment is evaluated by comparing the outstanding loan amount to (a) the fair value of the underlying collateral or (b) the present value of expected future cash flows. Based on this evaluation, a specific reserve amount is then determined on a loan by loan basis.
The second level of evaluation is the overall portfolio level. All loans that were not specifically evaluated for impairment are classified into one of four categories based on credit risk characteristics. These categories are real estate mortgage loans, real estate construction loans, commercial loans, and installment and other consumer loans. Senior management then assigns factors to each category to reflect (a) historical loss trends; (b) the overall market economy; and (c) growth trends. The Company includes an additional factor over and above the initial assessment for consumer loans and construction development loans, as senior management feels these are traditionally higher risk loans. Based on these evaluations, a general reserve value is derived and added to the specific reserve amount discussed above.
While management uses the best information available to establish the allowance for loan losses, these evaluations are inherently subjective as they require material estimations in many cases. The Company’s methodology may be impacted in future periods by changes in economic conditions or by the discovery of information with respect to borrowers not known by management at the time of their evaluations. Additionally, as an essential part of their examination process, various regulatory agencies review the Company’s allowance for loan losses and may require adjustments based on their assessment of information available to them at the time of their review. As of December 31, 2004, management considers the Company’s methodology for allowance for loan losses to be sound and the balance is considered to be adequate to absorb inherent losses in the loan portfolio.
The following table sets forth an analysis of the Bank's gross allowance for loan losses and activity within the allowance for the periods indicated.
| | | Year Ended December 31, | |
| | | 2004 | | 2003 | | 2002 | | 2001 | | 2000 | |
| | | (Dollars in thousands) | |
| | | | | | | | | | | | |
| Allowance at beginning of period | | $ | 4,525 | | | 4,657 | | | 4,470 | | | 4,235 | | | 4,136 | |
| Provision for loan losses | | | 875 | | | 101 | | | 497 | | | 661 | | | 306 | |
| Recoveries: | | | | | | | | | | | | | | | | |
| Commercial | | | 8 | | | 2 | | | 73 | | | 5 | | | 6 | |
| Real estate - construction | | | - | | | - | | | - | | | - | | | - | |
| Real estate - mortgage | | | - | | | - | | | 113 | | | 2 | | | - | |
| Installment and other consumer | | | 54 | | | 101 | | | - | | | 107 | | | 23 | |
| Total recoveries | | | 62 | | | 103 | | | 186 | | | 114 | | | 29 | |
| | | | | | | | | | | | | | | | | |
| Charge-offs: | | | | | | | | | | | | | | | | |
| Commercial | | | (368 | ) | | (70 | ) | | (188 | ) | | (118 | ) | | (68 | ) |
| Real estate - construction | | | - | | | - | | | - | | | - | | | - | |
| Real estate - mortgage | | | (6 | ) | | (55 | ) | | - | | | (81 | ) | | (48 | ) |
| Installment and other consumer | | | (225 | ) | | (211 | ) | | (308 | ) | | (341 | ) | | (120 | ) |
| Total charge-offs | | | (599 | ) | | (336 | ) | | (496 | ) | | (540 | ) | | (236 | ) |
| Net charge-offs | | | (537 | ) | | (233 | ) | | (310 | ) | | (426 | ) | | (207 | ) |
| Allowance at end of period | | $ | 4,863 | | | 4,525 | | | 4,657 | | | 4,470 | | | 4,235 | |
| Allowance for loan losses as a percentage of total loans receivable at the endof the period | | | 1.12 | % | | 1.28 | | | 1.46 | | | 1.38 | | | 1.34 | |
| Net charge-offs to average loans during the period | | | (0.14 | )% | | (0.07 | ) | | (0.10 | ) | | (0.15 | ) | | (0.07 | ) |
| Allowance for loan losses as a percentage of non-performing loans at end of theperiod | | | 650.13 | % | | 526.78 | | | 878.68 | | | 1,134.52 | | | 3,443.09 | |
Cavalry Bancorp, Inc. and Subsidiaries
Management’s Discussion & Analysis of Financial Condition
and Results of Operations (Continued)
Critical Accounting Estimates (Continued)
The Company has been sufficiently reserved on a consistent basis. Management feels that their past evaluations and estimations have been reasonable and that their methodology for determining this provision is satisfactory. However, a decline in economic conditions or other factors beyond management’s control could significantly alter the amount of losses the Company recognizes in the future.
The following table sets forth the breakdown of the allowance for loan losses by category at the dates indicated.
| | | At December 31, | |
| | | 2004 | | 2003 | | 2002 | | 2001 | | 2000 | |
| | | Amount | | Percent of Loans In Category to Total Loans | | Amount | | Percent of Loans In Category to Total Loans | | Amount | | Percent of Loans In Category to Total Loans | | Amount | | Percent of Loans In Category to Total Loans | | Amount | | Percent of Loans In Category to Total Loans | |
| | | (Dollars in thousands) | |
| | | | | | | | | | | | | | | | | | | | | | |
| Commercial | | $ | 1,188 | | | 41.7 | % | | 1,352 | | | 35.4 | | | 1,833 | | | 32.2 | | | 2,209 | | | 44.1 | | | 2,024 | | | 41.0 | |
| Real estate - construction | | | 1,717 | | | 21.7 | | | 1,800 | | | 19.4 | | | 1,107 | | | 20.7 | | | 844 | | | 16.4 | | | 840 | | | 17.7 | |
| Real estate - mortgage | | | 814 | | | 26.2 | | | 887 | | | 34.4 | | | 1,017 | | | 38.7 | | | 388 | | | 24.1 | | | 406 | | | 23.3 | |
| Installment and other consumer | | | 1,144 | | | 10.4 | | | 486 | | | 10.8 | | | 612 | | | 8.4 | | | 734 | | | 15.4 | | | 777 | | | 18.0 | |
| Unallocated | | | - | | | N/A | | | - | | | N/A | | | 88 | | | N/A | | | 295 | | | N/A | | | 188 | | | N/A | |
| | | | | | | | | | | | | | | | | | | | | | | | | | | | | | | | |
| Total allowance for loan losses | | $ | 4,863 | | | 100.0 | % | | 4,525 | | | 100.0 | | | 4,657 | | | 100.0 | | | 4,470 | | | 100.0 | | | 4,235 | | | 100.0 | |
Comparison of Financial Condition at December 31, 2004 and December 31, 2003
Total Assets. Total assets increased 12.33%, from $515.2 million at December 31, 2003 to $578.7 million at December 31, 2004. This overall increase is due primarily to a 22.86% increase in the loan portfolio. This increase is partially offset by a 23.47% decrease in available-for-sale investments securities. The details of these changes are described below.
Investment Securities. Available-for-sale investment securities decreased from $55.1 million at December 31, 2003 to $42.2 million at December 31, 2004. During 2004, the Company sold lower yielding agency securities and used the proceeds to purchase higher yield mortgage-backed securities and collateralized mortgage obligations. Additionally, the Company sold securities to increase liquidity to help fund the growth in the loan portfolio.
Loans Receivable, Net. Loans receivable, net, increased 22.86%, from $350.4 million at December 31, 2003 to $430.5 million at December 31, 2004. Although the Company’s portfolio increased in most lending areas, commercial lending and construction lending experienced the largest increases. Commercial loans increased 44.40%, from $126.8 million at December 31, 2003 to $183.1 million at December 31, 2004. Construction loans increased 36.87%, from $69.7 million at December 31, 2003 to $95.4 million at December 31, 2004. Consumer loans increased 18.09%, while mortgage loans decreased 7.20%. During 2004, the Bank sold the majority of its mortgage loan production. Additionally, as a result of principal payments and payoffs, the mortgage loan portfolio decreased. The Bank has increased its presence in the construction lending market and, since economic conditions remain favorable in the Bank’s primary market area, the Bank anticipates continuing to increase its portfolio of consumer, commercial and construction loans.
Cavalry Bancorp, Inc. and Subsidiaries
Management’s Discussion & Analysis of Financial Condition
and Results of Operations (Continued)
Comparison of Financial Condition at December 31, 2004 and December 31, 2003 (Continued)
Non-Accrual Loans. Non-accrual loans totaled approximately $748,000 and $859,000 at December 31, 2004 and 2003. These levels are relatively low and are consistent with prior years. See the section of this Management’s Discussion and Analysis entitled “Critical Accounting Policies” and Note 1 of Notes to Consolidated Financial Statements.
The following table sets forth information with respect to the Bank's non-accrual loans and other non-performing assets at the dates indicated.
| | | At December 31, | |
| | | 2004 | | 2003 | | 2002 | | 2001 | | 2000 | |
| | | (Dollars in thousands) | |
| | | | | | | | | | | | |
| Loans accounted for on a nonaccrual basis: | | | | | | | | | | | | | | | | |
| Commercial | | $ | 147 | | | 243 | | | 257 | | | - | | | - | |
| Real estate - construction | | | 317 | | | - | | | - | | | 97 | | | 10 | |
| Real estate - mortgage | | | 222 | | | 574 | | | - | | | 233 | | | 71 | |
| Installment and other consumer | | | 62 | | | 42 | | | 273 | | | 64 | | | 42 | |
| Total | | | 748 | | | 859 | | | 530 | | | 394 | | | 123 | |
| | | | | | | | | | | | | | | | | |
| Accruing loans which are contractually past due 90 days or more | | | - | | | - | | | - | | | - | | | - | |
| | | | | | | | | | | | | | | | | |
| Total of nonaccrual and 90 days past due loans | | | 748 | | | 859 | | | 530 | | | 394 | | | 123 | |
| | | | | | | | | | | | | | | | | |
| Foreclosed assets | | | 16 | | | - | | | 203 | | | 184 | | | 86 | |
| | | | | | | | | | | | | | | | | |
| Total nonperforming assets | | $ | 764 | | | 859 | | | 733 | | | 578 | | | 209 | |
| | | | | | | | | | | | | | | | | |
| Restructured loans | | $ | - | | | - | | | - | | | - | | | - | |
| | | | | | | | | | | | | | | | | |
| Non-accrual and 90 days or more past due loans as a percentage of total loans, net | | | 0.17 | % | | 0.24 | | | 0.17 | | | 0.14 | | | 0.04 | |
| | | | | | | | | | | | | | | | | |
| Non-accrual and 90 days or more past due loans as a percentage of total assets | | | 0.13 | % | | 0.17 | | | 0.11 | | | 0.09 | | | 0.03 | |
| | | | | | | | | | | | | | | | | |
| Non-performing assets as a percentage of total assets | | | 0.13 | % | | 0.17 | | | 0.16 | | | 0.13 | | | 0.05 | |
| | | | | | | | | | | | | | | | | |
| Total loans, net | | $ | 433,027 | | | | | | | | | | | | | |
| | | | | | | | | | | | | | | | | |
| Total assets | | $ | 578,670 | | | | | | | | | | | | | |
Loans Held for Sale. Loans held for sale decreased 3.85%, from $2.6 million at December 31, 2003 to $2.5 million at December 31, 2004. This reflects a decrease in the volume of loans originated during December 2004 compared to December 2003.
Goodwill. On January 4, 2002, the Bank completed the purchase of 100% of the issued and outstanding capital stock of Miller & Loughry for cash of approximately $2.0 million. Miller & Loughry is an independent insurance agency located in Murfreesboro, Tennessee. The transaction resulted in approximately $1.8 million of goodwill (See Note 2 of Notes to Consolidated Financial Statements). Goodwill is not amortized, but is tested for impairment on at least an annual basis in accordance with SFAS 142,Goodwill and Other Intangible Assets. Based on the results of the impairment testing that was performed, the value of the goodwill has not declined and is properly recorded as of December 31, 2004.
Cavalry Bancorp, Inc. and Subsidiaries
Management’s Discussion & Analysis of Financial Condition
and Results of Operations (Continued)
Comparison of Financial Condition at December 31, 2004 and December 31, 2003 (Continued)
Deposits. Customer deposits have increased 11.49%, from $454.3 million at December 31, 2003 to $506.5 million at December 31, 2004. The Bank has experienced continued growth in all deposit categories. Non-interest bearing deposits increased 12.85%, from $72.4 million at December 31, 2003 to $81.7 million at December 31, 2004. Interest bearing demand deposits increased 11.59%, from $208.0 million at December 31, 2003 to $232.1 million at December 31, 2004. Savings deposits increased 10.00%, from $21.0 million at December 31, 2003 to $23.1 million at December 31, 2004. Certificates of deposit increased 10.99%, from $152.8 million at December 31, 2003 to $169.6 million at December 31, 2004. These increases are a direct result of the Company’s continued efforts to promote and grow deposit accounts, particularly transaction accounts.
Borrowings. Total borrowings remained constant from December 31, 2003 to December 31, 2004. During 2004, the Bank maintained three notes with the Federal Home Loan Bank of Cincinnati, Ohio. No new borrowings were entered into during 2004 or 2003.
Shareholders’ Equity. Total shareholder’s equity decreased 1.10%, from $54.4 million at December 31, 2003, to $53.8 million at December 31, 2004. This decrease was primarily the result of lower earnings in 2004 due to the Company taking a one time, non-cash, pre-tax charge of $5.3 million resulting from (a) the remaining unallocated shares of the Employee Stock Ownership Plan (ESOP) being committed to be released as a result of the repayment of a note payable which encumbered these shares; and (b) the acceleration of vesting of all director and officer stock options granted under the 1999 Stock Option Plan (SOP). (See Notes 12 and 13 of the Notes to Consolidated Financial Statements.) This one time charge contributed to the resulting reduced earnings of $429,000 for 2004. Other increases to shareholders’ equity include the allocation of shares under the Bank's ESOP that totaled $6.6 million. In addition, $5.3 million in proceeds was received, along with a $1.5 million tax benefit recognized, from the issuance of common stock as a result of stock options being exercised. These increases were offset by the repurchase and retirement of 132,043 shares of the Company’s common stock for $2.0 million, and dividends of $12.5 million for the year ended December 31, 2004. These dividends include a special dividend of $1.50 per share declared in the fourth quarter, as the Company’s Board of Directors determined that unneeded capital should be returned to shareholders. (See Note 14 of the Notes to Consolidated Financial Statements.) Additionally, the Bank experienced a decline of $111,000 in the valuation allowance for available-for-sale investment securities, net of tax effect. On September 20, 2001, the Company’s Board of Directors authorized the repurchase of up to 710,480 shares of the Company’s outstanding common stock; as of December 31, 2004, 435,219 shares have been repurchased under this repurchase program.
Comparison of Operating Results for the Years Ended December 31, 2004, 2003, and 2002
Presented below is a comparative summary of key income statement components and their related variances for the three years ended December 31, 2004, 2003, and 2002. The significant changes will be discussed in the summary that follows.
| | | | | Dollar Variance | | Percent Variance | |
| | | | | | | | | 2004 | | 2003 | | 2004 | | 2003 | |
| | | For the Year Ended December 31, | | over | | over | | over | | over | |
| | | 2004 | | 2003 | | 2002 | | 2003 | | 2002 | | 2003 | | 2002 | |
| | | (Dollars in thousands, except per share data) | |
| | | | | | | | | | | | | | | | |
| Interest and dividend income | | $ | 25,068 | | | 21,936 | | | 23,257 | | | 3,132 | | | (1,321 | ) | | 14.28 | % | | (5.68 | ) |
| Interest expense | | | 5,555 | | | 5,616 | | | 7,193 | | | (61 | ) | | (1,577 | ) | | (1.09 | ) | | (21.92 | ) |
| Net interest income | | | 19,513 | | | 16,320 | | | 16,064 | | | 3,193 | | | 256 | | | 19.56 | | | 1.59 | |
| Provision for loan losses | | | 875 | | | 101 | | | 497 | | | 774 | | | (396 | ) | | 766.34 | | | (79.68 | ) |
| Non-interest income | | | 12,898 | | | 14,611 | | | 11,618 | | | (1,713 | ) | | 2,993 | | | (11.72 | ) | | 25.76 | |
| Non-interest expense | | | 28,573 | | | 23,371 | | | 20,177 | | | 5,202 | | | 3,194 | | | 22.26 | | | 15.83 | |
| Income taxes | | | 2,534 | | | 2,965 | | | 2,891 | | | (431 | ) | | 74 | | | (14.54 | ) | | 2.56 | |
| | | | | | | | | | | | | | | | | | | | | | | |
| Net income | | $ | 429 | | | 4,494 | | | 4,117 | | | (4,065 | ) | | 377 | | | (90.45 | )% | | 9.16 | |
| | | | | | | | | | | | | | | | | | | | | | | |
| Basic earnings per share | | $ | 0.07 | | | 0.70 | | | 0.64 | | | | | | | | | | | | | |
| Diluted earnings per share | | $ | 0.06 | | | 0.67 | | | 0.62 | | | | | | | | | | | | | |
Cavalry Bancorp, Inc. and Subsidiaries
Management’s Discussion & Analysis of Financial Condition
and Results of Operations (Continued)
Comparison of Operating Results for the Years Ended December 31, 2004, 2003, and 2002 (Continued)
Net Income. Net income increased $377,000 or 9.16% from 2002 to 2003, primarily due to higher net interest income, lower provision for loan losses, and an increase in non-interest income, particularly in the gains on sale of loans. Net income decreased $4.1 million or 90.45% from 2003 to 2004, primarily due to a 22.26% increase in non-interest expense. This increase in non-interest expense is a result of the remaining unallocated shares of the ESOP being committed to be released as a result of the repayment of a note payable which encumbered these shares, as well as the acceleration of vesting of officer and director stock options in the SOP plan. Additionally, non-interest income decreased $1.7 million or 11.72% from 2003 to 2004, primarily due to a $2.7 million or 49.33% decrease in gains on sale of loans. The ESOP and SOP transactions mentioned above resulted in a one time, pre-tax charge of $5.3 million that caused the Company’s financial ratios to decline significantly. Diluted earnings per share increased from $0.62 in 2002 to $0.67 in 2003, then decreased to $0.06 in 2004. Return on average assets has declined from 0.97% in 2002 to 0.96% in 2003, then down to 0.08% for 2004. Although net income for fiscal year 2002 to fiscal year 2003 increased by 9.16%, average assets increased 10.46%, from $423.4 million to $467.7 million, resulting in a slight decrease of 0.01% in the return on average assets ratio. Return on average equity increased from 8.36% in 2002 to 8.60% in 2003, then decreased to 0.77% in 2004.
Net Interest Income. The Bank faced declining interest rate environments during 2002 and 2003, but during 2004 interest rates stabilized and then began to climb. These changing environments caused yields and costs to fluctuate when comparing the three year periods. Net interest income has increased 21.12% over the past three years, from $16.1 million in 2002 to $19.5 million in 2004. Total interest and dividend income has varied, decreasing from $23.3 million in 2002 to $21.9 million in 2003, then increasing to $25.1 million in 2004. The decrease from 2002 to 2003 is due to a decline in average yield on interest-earning assets, from 6.20% in 2002 to 5.28% for 2003. This decrease was partially offset by an increase in average interest-earning assets, which rose from $375.2 million in 2002 to $415.7 million in 2003. This increase from 2002 to 2003 was a result of an increase in available-for-sale investment securities along with an increase in loans receivable. The increase in interest and dividend income from 2003 to 2004 is primarily due to a 21.18% increase in volume of average net loans receivable, along with a 32.64% increase in average yield on investment securities available-for-sale. Average yield on interest-earning assets declined slightly over this same period, from 5.28% in 2003 to 5.26% in 2004.
Average loans receivable have steadily increased over the three year reporting period, from $296.6 million in 2002 to $328.2 million in 2003, and then to $397.7 million in 2004. This increase in volume was offset by a decrease in average yields for the same three year period, with a 2002 yield of 7.08%, a 2003 yield of 6.17%, and a 2004 yield of 5.83%.
Average investment securities available-for-sale have varied over the three year reporting period. The average balance was $36.7 million for 2002, $48.2 million for 2003, and $41.8 million for 2004. Yields have varied as well, from 3.98% in 2002, to 2.39% in 2003, to 3.17% on a tax-equivalent basis for taxable and tax-exempt securities combined in 2004. During 2004, the Bank restructured its portfolio to extend maturities and to increase yields.
Average interest-bearing deposits with other financial institutions has steadily declined over the three year reporting period, with an average balance of $38.5 million in 2002, $36.4 million in 2003, and $34.7 million in 2004. Yields have varied over the three year reporting period, with a 2002 yield of 1.60%, a 2003 yield of 1.05%, and a 2004 yield of 1.35%.
Total interest expense has decreased 22.22% over the three year reporting period, from $7.2 million in 2002, to $5.6 million in 2003 and 2004. Although rates began to increase in 2004, the Company concentrated its growth in lower-costing deposits. Average deposits and borrowings increased 19.45% over the three year reporting period, from $326.4 million in 2002, to $352.0 million in 2003 and $389.9 million in 2004. The Company’s average cost of funds has steadily declined over this three year period, going from 2.20% in 2002, to 1.60% in 2003, to 1.42% in 2004. The Company’s overall interest rate spread has remained consistent over the three year reporting period, from 4.00% in 2002, to 3.68% in 2003, to 3.84% in 2004, on tax equivalent basis. Net interest margin has varied over the three year reporting period, from 4.28% in 2002, to 3.93% in 2003 and 4.10% in 2004, on a tax equivalent basis.
Average Balances, Interest and Average Yields/Costs
The following table sets forth certain information for the periods indicated regarding average balances of assets and liabilities as well as the total dollar amounts of interest income from average interest-earning assets, interest expense on average interest-bearing liabilities, and average yields and costs. Such yields and costs for the periods indicated are derived by dividing income or expense by the average balances of assets or liabilities, respectively, for the periods presented. Average balances are derived from daily balances for the years then ended.
Cavalry Bancorp, Inc. and Subsidiaries
Management’s Discussion & Analysis of Financial Condition
and Results of Operations (Continued)
Comparison of Operating Results for the Years Ended December 31, 2004, 2003, and 2002 (Continued)
Average Balances, Interest and Average Yields/Costs (Continued)
| | | Year ended December 31, | |
| | | 2004 | | 2003 | | 2002 | |
| | | Average Balance | | Interest and Dividends | | Yield/ Cost | | Average Balance | | Interest and Dividends | | Yield/ Cost | | Average Balance | | Interest And Dividends | | Yield/ Cost | |
| | | (Dollars in thousands) | |
| Interest-earning assets: | | | | | | | | | | | | | | | | | | | | | | | | | | | | |
| Loans receivable, net (1) | | $ | 397,742 | | $ | 23,183 | | | 5.83 | % | | 328,227 | | | 20,267 | | | 6.17 | | | 296,600 | | | 21,007 | | | 7.08 | |
| Investment securities available-for-sale, taxable | | | 37,324 | | | 1,171 | | | 3.14 | | | 48,183 | | | 1,152 | | | 2.39 | | | 36,719 | | | 1,462 | | | 3.98 | |
| Investment securities available-for-sale, tax exempt (3) | | | 4,501 | | | 153 | | | 3.40 | | | - | | | - | | | - | | | - | | | - | | | - | |
| Interest-bearing deposits with other financial institutions | | | 34,726 | | | 469 | | | 1.35 | | | 36,380 | | | 383 | | | 1.05 | | | 38,497 | | | 615 | | | 1.60 | |
| Federal Home Loan Bank and Federal Reserve Bank stock | | | 3,051 | | | 144 | | | 4.72 | | | 2,921 | | | 134 | | | 4.59 | | | 3,358 | | | 173 | | | 5.15 | |
| | | | | | | | | | | | | | | | | | | | | | | | | | | | | |
| Total interest-earning assets | | | 477,344 | | | 25,120 | | | 5.26 | | | 415,711 | | | 21,936 | | | 5.28 | | | 375,174 | | | 23,257 | | | 6.20 | |
| Non-interest-earning assets | | | 51,335 | | | | | | | | | 51,985 | | | | | | | | | 48,179 | | | | | | | |
| | | | | | | | | | | | | | | | | | | | | | | | | | | | | |
| Total assets | | | 528,679 | | | | | | | | | 467,696 | | | | | | | | | 423,353 | | | | | | | |
| | | | | | | | | | | | | | | | | | | | | | | | | | | | | |
| Interest-bearing liabilities: | | | | | | | | | | | | | | | | | | | | | | | | | | | | |
| Savings deposits | | | 22,056 | | | 43 | | | 0.20 | | | 19,959 | | | 64 | | | 0.32 | | | 15,816 | | | 77 | | | 0.49 | |
| Demand deposits | | | 208,010 | | | 1,322 | | | 0.64 | | | 179,482 | | | 1,143 | | | 0.64 | | | 159,642 | | | 1,676 | | | 1.05 | |
| Certificates of deposit | | | 157,017 | | | 4,093 | | | 2.61 | | | 149,642 | | | 4,311 | | | 2.88 | | | 149,314 | | | 5,392 | | | 3.61 | |
| Total deposits | | | 387,083 | | | 5,458 | | | 1.41 | | | 349,083 | | | 5,518 | | | 1.58 | | | 324,772 | | | 7,145 | | | 2.20 | |
| | | | | | | | | | | | | | | | | | | | | | | | | | | | | |
| Borrowings | | | 2,860 | | | 97 | | | 3.39 | | | 2,914 | | | 98 | | | 3.36 | | | 1,643 | | | 48 | | | 2.92 | |
| Total interest-bearing liabilities | | | 389,943 | | | 5,555 | | | 1.42 | | | 351,997 | | | 5,616 | | | 1.60 | | | 326,415 | | | 7,193 | | | 2.20 | |
| Non-interest-bearingliabilities (2) | | | 83,244 | | | | | | | | | 63,438 | | | | | | | | | 47,671 | | | | | | | |
| Total liabilities | | | 473,187 | | | | | | | | | 415,435 | | | | | | | | | 374,086 | | | | | | | |
| Shareholders' equity | | | 55,492 | | | | | | | | | 52,261 | | | | | | | | | 49,267 | | | | | | | |
| Total liabilities and shareholders' equity | | $ | 528,679 | | | | | | | | | 467,696 | | | | | | | | | 423,353 | | | | | | | |
| | | | | | | | | | | | | | | | | | | | | | | | | | | | | |
| Net interest income (3) | | | | | $ | 19,565 | | | | | | | | | 16,320 | | | | | | | | | 16,064 | | | | |
| | | | | | | | | | | | | | | | | | | | | | | | | | | | | |
| Interest rate spread (tax equivalent) | | | | | | | | | 3.84 | % | | | | | | | | 3.68 | | | | | | | | | 4.00 | |
| | | | | | | | | | | | | | | | | | | | | | | | | | | | | |
| Net interest margin | | | | | | | | | 4.10 | % | | | | | | | | 3.93 | | | | | | | | | 4.28 | |
| Ratio of average interest-earning assets to average interest-bearing liabilities | | | | | | | | | 122.41 | % | | | | | | | | 118.10 | | | | | | | | | 114.94 | |
| (1) | Does not include interest on loans 90 days or more past due. Includes loans originated for sale. Interest income includes amortization of fees of $1.1 million, $1.0 million and $898,000 for the years ended December 31, 2004, 2003 and 2002, respectively. |
| (2) | Includes non-interest bearing deposits of $77.5 million, $59.9 million and $44.7 million for the years ended December 31, 2004, 2003 and 2002, respectively. |
| (3) | The Company had tax-free investments during the year ended December 31, 2004. Yields and corresponding income amounts are adjusted to a fully taxable equivalent. The Company had no tax-free investments during the years ended December 31, 2003 and 2002. |
Cavalry Bancorp, Inc. and Subsidiaries
Management’s Discussion & Analysis of Financial Condition
and Results of Operations (Continued)
Comparison of Operating Results for the Years Ended December 31, 2004, 2003, and 2002 (Continued)
Yields Earned and Rates Paid
The following table sets forth for the periods and at the dates indicated the weighted average yields earned on the Company’s assets and the weighted average interest rates paid on the Company’s liabilities, together with the interest rate spread and net interest margin on interest-earning assets. Yields are stated on a tax equivalent basis.
| | | At December 31, | | Year Ended December 31, | |
| | | 2004 | | 2004 | | 2003 | | 2002 | |
| Weighted average yield on: | | | | | | | | | | | | | |
| Loans receivable, net | | | 5.77 | % | | 5.83 | | | 6.17 | | | 7.08 | |
| Investment securities available-for-sale, taxable | | | 3.44 | | | 3.14 | | | 2.39 | | | 3.98 | |
| Investment securities available-for-sale, tax exempt | | | 4.73 | | | 3.40 | | | - | | | - | |
| Interest-bearing deposits with other financial institutions | | | 2.11 | | | 1.35 | | | 1.05 | | | 1.60 | |
| Federal Reserve Bank and Federal Home Loan Bank stock | | | 4.80 | | | 4.72 | | | 4.59 | | | 5.15 | |
| All interest-earning assets | | | 5.42 | | | 5.26 | | | 5.28 | | | 6.20 | |
| | | | | | | | | | | | | | |
| Weighted average rate paid on: | | | | | | | | | | | | | |
| Savings deposits | | | 0.20 | | | 0.20 | | | 0.32 | | | 0.49 | |
| Demand deposits | | | 0.88 | | | 0.64 | | | 0.64 | | | 1.05 | |
| Certificates of deposit | | | 2.79 | | | 2.61 | | | 2.88 | | | 3.61 | |
| Borrowings | | | 3.37 | | | 3.39 | | | 3.36 | | | 2.92 | |
| All interest-bearing liabilities | | | 1.60 | | | 1.42 | | | 1.60 | | | 2.20 | |
| | | | | | | | | | | | | | |
| Interest rate spread (spread between weighted average rate on all interest-earning assets and all interest-bearing liabilities) on a tax-equivalent basis | | | 3.82 | % | | 3.84 | | | 3.68 | | | 4.00 | |
| | | | | | | | | | | | | | |
| Net interest margin (net interest income (expense) as a percentage of average interest-earning assets) on a tax-equivalent basis | | | N/A | | | 4.10 | | | 3.93 | | | 4.28 | |
Rate/Volume Analysis
The following table sets forth, on a tax equivalent basis, the effects of changing rates and volumes on net interest income of the Company. Information is provided with respect to (i) effects on interest income attributable to changes in volume (changes in volume multiplied by prior rate) and (ii) effects on interest income attributable to changes in rate (changes in rate multiplied by prior volume). The net change attributable to the combined impact of volume and rate has been allocated proportionately to the change due to volume and the change due to rate.
| | | Year Ended December 31, 2004 Compared to Year Ended December 31, 2003 Increase (Decrease) | | Year Ended December 31, 2003 Compared to Year Ended December 31, 2002 Increase (Decrease) | | Year Ended December 31, 2002 Compared to Year Ended December 31, 2001 Increase (Decrease) | |
| | | Due to | | | | Due to | | | | Due to | | | |
| | | Rate | | Volume | | Total | | Rate | | Volume | | Total | | Rate | | Volume | | Total | |
| | | | | | | | | (Dollars in thousands) | | | | | | | |
| Interest-earning assets: | | | | | | | | | | | | | | | | | | | | | | | | | | | | |
| Loans receivable, net (1) | | $ | (1,373 | ) | | 4,289 | | | 2,916 | | | (2,979 | ) | | 2,239 | | | (740 | ) | | (4,282 | ) | | 1,143 | | | (3,139 | ) |
| Investment securities, taxable | | | 279 | | | (260 | ) | | 19 | | | (766 | ) | | 456 | | | (310 | ) | | (575 | ) | | (567 | ) | | (1,142 | ) |
| Investment securities, tax exempt | | | - | | | 153 | | | 153 | | | - | | | - | | | - | | | - | | | - | | | - | |
| Interest-bearing deposits with other financial institutions | | | 103 | | | (17 | ) | | 86 | | | (198 | ) | | (34 | ) | | (232 | ) | | (825 | ) | | 222 | | | (603 | ) |
| Federal Reserve Bank and Federal Home Loan Bank stock | | | 4 | | | 6 | | | 10 | | | (16 | ) | | (23 | ) | | (39 | ) | | (54 | ) | | 87 | | | 33 | |
| | | | | | | | | | | | | | | | | | | | | | | | | | | | | |
| Total net change in income on interest-earning assets | | | (987 | ) | | 4,171 | | | 3,184 | | | (3,959 | ) | | 2,638 | | | (1,321 | ) | | (5,736 | ) | | 885 | | | (4,851 | ) |
| | | | | | | | | | | | | | | | | | | | | | | | | | | | | |
| Interest-bearing liabilities: | | | | | | | | | | | | | | | | | | | | | | | | | | | | |
| Savings deposits | | | (28 | ) | | 7 | | | (21 | ) | | (33 | ) | | 20 | | | (13 | ) | | (73 | ) | | 20 | | | (53 | ) |
| Demand deposits | | | (4 | ) | | 183 | | | 179 | | | (741 | ) | | 208 | | | (533 | ) | | (2,355 | ) | | 570 | | | (1,785 | ) |
| Certificates of deposit | | | (430 | ) | | 212 | | | (218 | ) | | (1,093 | ) | | 12 | | | (1,081 | ) | | (3,066 | ) | | (569 | ) | | (3,635 | ) |
| Borrowings | | | 1 | | | (2 | ) | | (1 | ) | | 13 | | | 37 | | | 50 | | | 3 | | | 14 | | | 17 | |
| | | | | | | | | | | | | | | | | | | | | | | | | | | | | |
| Total net change in expense on interest-bearing liabilities | | | (461 | ) | | 400 | | | (61 | ) | | (1,854 | ) | | 277 | | | (1,577 | ) | | (5,491 | ) | | 35 | | | (5,456 | ) |
| | | | | | | | | | | | | | | | | | | | | | | | | | | | | |
| Net change in net interest income | | $ | (526 | ) | | 3,771 | | | 3,245 | | | (2,105 | ) | | 2,361 | | | 256 | | | (245 | ) | | 850 | | | 605 | |
(1) Does not include interest on loans 90 days or more past due. Includes loans originated for sale.
Cavalry Bancorp, Inc. and Subsidiaries
Management’s Discussion & Analysis of Financial Condition
and Results of Operations (Continued)
Comparison of Operating Results for the Years Ended December 31, 2004, 2003, and 2002 (Continued)
Provision for Loan Losses. The provision for loan losses is the charge to operating earnings that management determines to be necessary to maintain the allowance for loan losses at an adequate level. This level reflects management’s estimate of probable incurred losses in the loan portfolio based on concentrations, trends in historical loss experience, specifically identified impaired loans and general economic conditions. Please refer to this Management’s Discussion and Analysis, Critical Accounting Estimates section for details on the methodology in calculating this provision. The Bank’s credit management systems have resulted in low loan loss experience; however, there is no guarantee that this experience will continue.
The provision for loan losses has varied over the past three years, decreasing from $497,000 in 2002 to $101,000 in 2003, then increasing to $875,000 in 2004. Charge-offs have varied as well since 2002, dropping from $496,000 to $336,000 in 2003, then increasing to $599,000 in 2004. Recoveries have declined over this three year period, with $186,000 recovered in 2002, $103,000 recovered in 2003, and $62,000 recovered in 2004. The allowance for loan losses has varied over the three year period, with a balance of $4.7 million in 2002, $4.5 million in 2003, and $4.9 million in 2004. Non-accrual loans have increased since 2002, from $530,000 to $748,000 in 2004. Total non-performing assets (which includes non-accrual loans and foreclosed assets) increased 4.23%, from $733,000 in 2002 to $764,000 in 2004. (See Note 6 in Notes to Consolidated Financial Statements.) Non-accrual and 90 days or more past due loans as a percentage of total loans was 0.17%, 0.24% and 0.17% for the years ended December 31, 2002, 2003 and 2004, respectively. Non-performing assets as a percentage of total assets were 0.13%, 0.17% and 0.16% for the years ending December 31, 2004, 2003 and 2002, respectively.
For the three years ended December 31, 2004, management believes the provision for loan losses and the allowance for loan losses to be adequate.
Non-Interest Income. Non-interest income increased 11.21% over the three year reporting period, from $11.6 million in 2002 to $12.9 million in 2004. This increase is attributable to a number of factors. In the banking segment, there was a 42.11% increase over the three year reporting period in deposit servicing fees and charges, from $3.8 million in 2002 to $5.4 million in 2004. This increase occurred evenly over the three year period and is primarily due to a steady increase in the volume of transaction accounts. The increase also reflects an increase in service charges as well as an increase in overdraft and non-sufficient funds fees.
Commissions and other non-banking fees increased 13.64%, from $2.2 million in 2002 to $2.5 million in 2004. This increase is primarily due to an increase in the volume of insurance clients as well as increases in the amount of premiums paid.
The mortgage banking segment experienced varied results over the three year reporting period, with a 60.92% increase in gains on sale of loans from 2002 to 2003, and a 49.33% decline in gains on sale of loans from 2003 to 2004. The increase from 2002 to 2003 was the result of a significant increase in the volume of loans originated and sold during 2003 when compared to 2002. This increase in volume is due to mortgage rates dropping in 2002 and remaining at low levels throughout 2003, causing a surge in refinancing activities. Additionally, the Company continued efforts at expanding the Cavalry Mortgage division during 2003. The decrease from 2003 to 2004 was the result of an overall decline in the volume of mortgage loans originated and sold during 2004 when compared to 2003. This decline in volume is due to a rise in interest rates during 2004 along with a drop in refinancing activity in 2004. Additionally, the Company closed two Nashville-area mortgage offices during 2004 as a result of a declining market for mortgage loan activity.
Non-Interest Expense. Non-interest expense has increased over the three year period ended December 31, 2004, increasing approximately $8.4 million or 41.61% from 2002 to 2004. This increase is mainly attributable to an increase in employee compensation and benefits expense, which has increased 51.18% over the three year reporting period, from $12.7 million in 2002, to $15.2 million in 2003, to $19.2 million in 2004. Reasons for this increase include the opening of a new branch during 2003, which resulted in an increase in personnel. Additionally, the Bank experienced a significant increase in employee health insurance costs, retirement benefits expense, and associated payroll tax expense, causing our overall employee benefit expense to increase 164.71% from $3.4 million in 2002 to $9.0 million in 2004. Included in the retirement expense is the cost of the ESOP. The recorded expense for the ESOP was $6.5 million, $1.7 million and $1.3 million for the years ended December 31, 2004, 2003, and 2002, respectively. Compensation expense is determined by multiplying the per share market price of the Corporation’s stock at the time the shares were committed to be released by the number of shares to be released. The number of shares released annually was based on repayments of the note payable that was acquired at the time of conversion by the ESOP trust to the Company. As previously discussed, the remaining unallocated shares of the ESOP were committed to be released as a result of the repayment of a note payable which encumbered these shares, resulting in a charge of $5.1 million. This program was expected to adversely impact earnings for the next three years, and the adverse impact would increase with increases in the Company’s stock price. In addition, the annual ESOP expense reduced the comparability of the Company’s operating results to those of its peer institutions. Also, the Board of Directors voted to accelerate vesting of all director and officer stock options granted under the 1999 SOP, resulting in a charge of $138,000. (See Note 12 and Note 13 of the Notes to Consolidated Financial Statements.)
Cavalry Bancorp, Inc. and Subsidiaries
Management’s Discussion & Analysis of Financial Condition
and Results of Operations (Continued)
Comparison of Operating Results for the Years Ended December 31, 2004, 2003, and 2002 (Continued)
Non-Interest Expense. (Continued)The Company experienced a 100.00% increase in professional fees, from $514,000 in 2002 to $1.0 million in 2004, due to increased internal audit, external audit, and consulting fees as a result of implementing the internal control requirement of the Sarbanes-Oxley Act of 2002.
Equipment expenses increased by 29.63% over the three year reporting period, from $2.7 million in 2002 to $3.5 million in 2004. This increase is primarily due to an increase of 72.78% in equipment maintenance contracts and an increase of 57.99% in equipment rental and leases. Equipment maintenance contracts increased due to the mid-2002 purchase of equipment to implement new bank-wide software. The equipment associated with this implementation was under a maintenance contract free of charge for the first year of use. Therefore, 2004 was the first full year of maintenance costs associated with this new equipment. Equipment rental and leases expense increased due to an increased number of equipment leases entered into during 2004. Other expenses increased as a result of an increased volume of loan and deposit activity.
Income Tax Expense. Income tax expense was $2.5 million, $3.0 million, and $2.9 million for the years ended December 31, 2004, 2003, and 2002, respectively. The increase from 2002 to 2003 is a result of higher income before taxes for the years ended December 31, 2003 and 2002. The effective tax rate for fiscal year 2004 was 85.5%, fiscal year 2003 was 39.8%, and fiscal year 2002 was 41.1%. The increase in the effective tax rate for 2004 resulted from non-deductible compensation expense recognized as a result of committing to release the remaining encumbered ESOP shares by repaying the note payable. (See Notes 11 and 12 of Notes to Consolidated Financial Statements.)
Contractual Obligations, Commitments, Contingent Liabilities, and Off-Balance Sheet Arrangements
The Company has various financial obligations, including contractual obligations and commitments, which may require future cash payments.
Contractual Obligations. The following table presents, as of December 31, 2004, significant fixed and determinable contractual obligations to third parties by payment date. Further discussion of the nature of each obligation is included in Notes 9, 10 and 19 of Notes to Consolidated Financial Statements as referenced in the table below.
| | | Payments Due In | | | |
| | | One Year or Less | | One to Three Years | | Three to Five Years | | Over Five Years | | Total | |
| | | (Dollars in thousands) | |
| | | | | | | | | | | | |
| Deposits without a stated maturity (a) (note 9) | | $ | 336,928 | | | - | | | - | | | - | | | 336,928 | |
| Certificates of deposits (a) (note 9) | | | 93,421 | | | 54,237 | | | 21,938 | | | 10 | | | 169,606 | |
| Borrowed funds (b) (note 10) | | | 54 | | | 2,108 | | | 108 | | | 565 | | | 2,835 | |
| Operating leases (note 19) | | | 222 | | | 155 | | | 15 | | | - | | | 392 | |
| Purchase obligations | | | 1,180 | | | 1,802 | | | - | | | - | | | 2,982 | |
(a) Excludes interest
(b) Includes interest on fixed rate obligations
The Company’s operating lease obligations represent short and long-term lease and rental payments for certain software and data processing and other equipment. Purchase obligations represent obligations under arrangements to purchase goods or services that are enforceable and legally binding on the Company and that specify all significant terms, including: fixed or minimum quantities to be purchased; fixed, minimum or variable price provisions; and the approximate timing of the transaction.
Cavalry Bancorp, Inc. and Subsidiaries
Management’s Discussion & Analysis of Financial Condition
and Results of Operations (Continued)
Contractual Obligations, Commitments, Contingent Liabilities, and Off-Balance Sheet Arrangements (Continued)
Commitments and Other Off-Balance Sheet Arrangements. The following table details the amounts and expected maturities of significant commitments as of December 31, 2004. Further discussion of these commitments is included below and in Note 17 of Notes to Consolidated Financial Statements.
| | | One Year or Less | | One to Three Years | | Three to Five Years | | Over Five Years | | Total | |
| | | (Dollars in thousands) | |
| Commitments to extend credit: | | | | | | | | | | | | | | | | |
| Residential real estate | | $ | 53,187 | | | - | | | - | | | - | | | 53,187 | |
| Other commercial and consumer lines of credit | | | 40,219 | | | - | | | - | | | - | | | 40,219 | |
| Standby letters of credit | | | 8,261 | | | - | | | - | | | - | | | 8,261 | |
| Net commitments to sell mortgage loans | | | 6,096 | | | - | | | - | | | - | | | 6,096 | |
The Company utilizes financial instruments with off-balance sheet risk in the normal course of business to meet the financing needs of its customers and to reduce its own exposure to fluctuation in interest rates. These financial instruments include commitments to originate fixed and variable rate mortgage loans held-for-investment and held-for-sale, unused lines of credit, and funds committed to construction lending. The contract or notional amounts of those instruments reflect the extent of involvement the Company has in particular classes of financial instruments.
Commitments to originate fixed and variable rate mortgage loans are agreements to lend to a customer as long as there is no violation of any condition established in the commitment. Commitments generally have fixed expiration dates or other termination clauses and may require payment of a fee. Since some commitments expire without being drawn upon, the total commitment amounts do not necessarily represent future cash requirements. Undisbursed lines of credit and standby letters of credit do not necessarily represent future cash requirements, in that these commitments often expire without being drawn upon.
The Company minimizes its exposure to loss under these commitments by requiring that customers meet certain conditions prior to disbursing funds. The Company receives collateral to support commitments for which collateral is deemed necessary. The most significant category of collateral includes real estate properties underlying mortgage loans.
Contingent Liabilities. The Company may also incur liabilities upon the occurrence of certain events. In the opinion of management, the financial position of the Company will not be affected materially as a result of such contingent liabilities as discussed in Note 19 of Notes to Consolidated Financial Statements.
Quantitative and Qualitative Disclosure About Market Risk
Asset and Liability Management
The Company, like other financial institutions, is subject to direct and indirect market risk. Direct market risk exists from changes in interest rates. The Company’s net income is dependent on its net interest income. Net interest income is susceptible to interest rate risk to the degree that interest-bearing liabilities mature or reprice on a different basis than interest-earning assets. When interest-bearing liabilities mature or reprice more quickly than interest-earning assets in a given period, a significant increase in market rates of interest could adversely affect net interest income. Similarly, when interest-earning assets mature or reprice more quickly than interest-bearing liabilities, falling interest rates could result in a decrease in net income.
In an attempt to manage its exposure to changes in interest rates, management monitors the Company’s interest rate risk. The Company has an asset/liability management committee that monitors the Company’s interest rate risk position and profitability and reports this information to the board of directors quarterly. Management also reviews the securities portfolio, formulates investment strategies, and oversees the timing and implementation of transactions to help achieve attainment of the board’s objectives in the most effective manner. Notwithstanding the Company’s interest rate risk management activities, the potential for changing interest rates is an uncertainty that can have an adverse effect on net income.
In adjusting the Company’s asset/liability position, the asset/liability management committee attempts to manage the Company’s interest rate risk while maintaining or enhancing net interest margins. At times, depending on the level of general interest rates, the relationship between long-term and short-term interest rates, market conditions and competitive factors, the board and management may decide to increase the Company’s interest rate risk position to increase its net interest margin. The Company’s results of operations and net portfolio values remain vulnerable to decreases in interest rates and to fluctuations in the differences between long-term and short-term interest rates.
Cavalry Bancorp, Inc. and Subsidiaries
Management’s Discussion & Analysis of Financial Condition
and Results of Operations (Continued)
Quantitative and Qualitative Disclosure About Market Risk (Continued)
Asset and Liability Management (Continued)
One approach used to quantify interest rate risk is the net portfolio value analysis. In essence, this analysis calculates the difference between the present value of liabilities and the present value of expected cash flows from assets and off-balance-sheet contracts. The following table sets forth, at December 31, 2004, an analysis of the Company’s interest rate risk as measured by the estimated changes in the net portfolio value resulting from instantaneous and sustained parallel shifts in the yield curve (+ or - 200 basis points).
Changes (In Basis Points) in Interest Rates | Estimated Change in Net Portfolio Value | Estimated Change in Net Portfolio Value | Board Approved Limits |
| | (Dollars in Thousands) | (Percentage) | (Percentage) |
| | | | |
| +200 bp | (240) | (0.5) | (20) |
| +100 bp | (86) | (0.2) | (10) |
| 0 bp | - | - | - |
| -100 bp | (364) | (0.8) | (10) |
| -200 bp | (1,932) | (4) | (20) |
The above table illustrates, for example, that an instantaneous 100 basis point decrease in market interest rates at December 31, 2004, would reduce the Company’s net portfolio value by approximately $364,000 or 0.8%.
As with any method of measuring interest rate risk, certain shortcomings are inherent in the method of analysis presented in the foregoing table. For example, although certain assets and liabilities may have similar maturities or periods to repricing, they may react in different degrees to changes in market interest rates. Also, the interest rates on certain types of assets and liabilities may fluctuate in advance of changes in market interest rates, while interest rates on other types may lag behind changes in market interest rates. Additionally, certain assets, such as adjustable-rate mortgage loans, have features which restrict changes in interest rates on a short-term basis and over the life of the asset. Furthermore, in the event of a change in interest rates, expected rates of prepayments on loans and early withdrawals from certificates of deposit could deviate significantly from those assumed in calculating the table.
Quantitative Aspects of Market Risk. The principal market risk affecting the Company is risk associated with interest rate volatility ("interest rate risk"). The Company does not maintain a trading account for any class of financial instrument or purchase high-risk derivative instruments, nor has it engaged in hedging activities in the past. Additionally, the Company is not subject to foreign currency exchange rate risk or commodity price risk. Substantially all of the Company's interest rate risk is derived from the Bank's lending and deposit-taking activities. This risk could result in reduced net income, loss in fair values of assets and/or increases in fair values of liabilities due to upward changes in interest rates.
Qualitative Aspects of Market Risk. The Company’s principal financial objective is to achieve long-term profitability while reducing its exposure to fluctuating market interest rates. The Company has sought to reduce the exposure of its earnings to changes in market interest rates by attempting to manage the mismatch between asset and liability maturities and interest rates. The principal element in achieving this objective is to increase the interest-rate sensitivity of the Company’s interest-earning assets by retaining loans with interest rates subject to periodic adjustment to market conditions for its portfolio and selling fixed-rate one- to- four family mortgage loans. In addition, the Company maintains an investment portfolio of U.S. Government and agency securities, mortgage-backed securities and collateralized mortgage obligations, and state and municipal securities, all with contractual maturities of between zero and ten years. The Company relies on retail deposits as its primary source of funds. Management believes retail deposits, compared to brokered deposits, reduce the effects of its interest rate fluctuations because they generally represent a more stable source of funds. As part of its interest rate risk management strategy, the Bank promotes demand accounts and certificates of deposit with primarily terms of up to four years.
Interest Rate Sensitivity. The following table provides information about the Company’s financial instruments at December 31, 2004 that are sensitive to changes in interest rates including off-balance sheet items. For financial instruments, the table presents principal cash flows and related average interest rates by expected maturity dates with estimated fair values.
Cavalry Bancorp, Inc. and Subsidiaries
Management’s Discussion & Analysis of Financial Condition
and Results of Operations (Continued)
Quantitative and Qualitative Disclosure About Market Risk (Continued)
Asset and Liability Management (Continued)
Since this presentation is a snapshot of the financial instruments as of December 31, 2004, there are material limitations in not fully reflecting market risk exposures. The table does not consider the effects of interest rate changes on the embedded options on loans and deposit liabilities. Changes in interest rates may cause borrowers to exercise the option to prepay loans before the scheduled maturity. Depositors have the option to withdraw deposits before maturity, which is the case with certificates of deposits, or to withdraw funds anytime from accounts with no stated maturity such as savings accounts. This table also does not take into consideration the effects on reinvestment of maturing financial instruments.
This presentation does not consider that all rate changes do not affect assets or liabilities in the same maturity range by equal amounts. When interest rates change, all rates do not change in equal amounts nor do they change at the same time. Some financial instruments have indefinite maturities, in the sense that a clear maturity date is not present.
As of December 31, 2004, the Company’s greatest exposure would be to falling rates. The Company has more assets maturing than liabilities during the one-year time frame, which can decrease the yield on assets faster than the cost of funds on liabilities would decrease. In order to mitigate this exposure to declining rates and to become less asset sensitive, the Bank has purchased some longer maturity investments consisting of mortgage-backed securities, collateralized mortgage obligations, and municipal securities.
Cavalry Bancorp, Inc. and Subsidiaries
Management’s Discussion & Analysis of Financial Condition
and Results of Operations (Continued)
| | | Within One Year | | One Year To 3 Years | | After 3 Years To 5 Years | | After 5 Years To 10 Years | | Beyond 10 Years | | Total | | Fair Value | |
| | | (Dollars in Thousands, Except Percentages) | |
| Interest-Sensitive Assets: | | | | | | | | | | | | | | | |
Fixed rate loans | | $ | 72,069 | | | 45,601 | | | 142,226 | | | 9,676 | | | 11,512 | | | 281,084 | | | | |
| Average Rate | | | 5.602 | % | | 6.546 | | | 5.676 | | | 8.113 | | | 6.830 | | | 5.929 | | | | |
| Adjustable rate loans | | | 75,740 | | | 20,052 | | | 11,717 | | | 8,926 | | | 35,508 | | | 151,943 | | | | |
| Average Rate | | | 5.455 | | | 5.613 | | | 5.560 | | | 5.421 | | | 5.459 | | | 5.483 | | | |
| Total loans | | | 147,809 | | | 65,653 | | | 153,943 | | | 18,602 | | | 47,020 | | | 433,027 | | | 431,393 | |
Fixed rate investments (1) | | | 11,809 | | | 4,606 | | | 5,323 | | | 11,031 | | | 3,257 | | | 36,026 | | | | |
| Average Rate | | | 2.456 | | | 3.785 | | | 3.585 | | | 3.704 | | | 3.757 | | | 3.294 | | | | |
| Adjustable rate investments | | | 117 | | | 348 | | | 268 | | | 767 | | | 4,657 | | | 6,157 | | | | |
| Average Rate | | | 3.911 | | | 3.318 | | | 3.911 | | | 3.912 | | | 3.910 | | | 3.877 | | | | |
| Total investments | | | 11,926 | | | 4,954 | | | 5,591 | | | 11,798 | | | 7,914 | | | 42,183 | | | 42,183 | |
FHLB and FRB Stock | | | 3,125 | | | - | | | - | | | - | | | - | | | 3,125 | | | 3,125 | |
| Average Rate | | | 4.803 | | | - | | | - | | | - | | | - | | | 4.803 | | | | |
Interest-bearing deposits with other Financial Institutions | | | 38,816 | | | - | | | - | | | - | | | - | | | 38,816 | | | 38,816 | |
| Average Rate | | | 2.110 | | | - | | | - | | | - | | | - | | | 2.110 | | | | |
Total Interest-Sensitive Assets | | $ | 201,676 | | | 70,607 | | | 159,534 | | | 30,400 | | | 54,934 | | | 517,151 | | | | |
Interest-Sensitive Liabilities: | | | | | | | | | | | | | | | | | | | | | | |
Deposits with no stated maturity: | | | | | | | | | | | | | | | | | | | | | | |
Demand deposits | | $ | 46,424 | | | 92,851 | | | 92,851 | | | - | | | - | | | 232,126 | | | 232,126 | |
| Average Rate | | | 0.883 | | | 0.883 | | | 0.883 | | | - | | | - | | | 0.883 | | | | |
Savings deposits | | | 4,617 | | | 9,233 | | | 9,233 | | | - | | | - | | | 23,083 | | | 23,083 | |
| Average Rate | | | 0.198 | | | 0.198 | | | 0.198 | | | - | | | - | | | 0.198 | | | | |
Deposits with stated maturities: | | | | | | | | | | | | | | | | | | | | | | |
Fixed rate | | | | | | | | | | | | | | | | | | | | | | |
| Certificates of deposit | | | 92,710 | | | 54,204 | | | 21,938 | | | 10 | | | - | | | 168,862 | | | | |
| Average Rate | | | 2.199 | | | 3.390 | | | 3.824 | | | 5.000 | | | - | | | 2.793 | | | | |
| Adjustable rate | | | | | | | | | | | | | | | | | | | | | | |
| Certificates of deposit | | | 711 | | | 33 | | | - | | | - | | | - | | | 744 | | | | |
| Average Rate | | | 2.318 | | | 1.740 | | | - | | | - | | | - | | | 2.293 | | | | |
| Total Certificates of deposit | | | 93,421 | | | 54,237 | | | 21,938 | | | 10 | | | - | | | 169,606 | | | 171,175 | |
Fixed Rate Borrowings | | | 54 | | | 2,108 | | | 108 | | | 270 | | | 295 | | | 2,835 | | | 2,720 | |
| Average Rate | | | 2.250 | | | 3.755 | | | 2.250 | | | 2.250 | | | 2.250 | | | 3.370 | | | | |
Total Interest Sensitive Liabilities | | $ | 144,516 | | | 158,429 | | | 124,130 | | | 280 | | | 295 | | | 427,650 | | | | |
Off-Balance Sheet Items: | | | | | | | | | | | | | | | | | | | | | | |
Commitments to extend credit | | $ | 53,187 | | | | | | | | | | | | | | | | | | 53,187 | |
| Average Rate | | | 5.466 | % | | | | | | | | | | | | | | | | | | |
| Unused lines of credit | | $ | 40,219 | | | | | | | | | | | | | | | | | | 40,219 | |
| Average Rate | | | 5.734 | % | | | | | | | | | | | | | | | | | | |
(1) Tax-exempt securities are not stated on a tax-equivalent basis.
Cavalry Bancorp, Inc. and Subsidiaries
Management’s Discussion & Analysis of Financial Condition
and Results of Operations (Continued)
Liquidity and Capital Resources
The Company’s primary sources of funds are customer deposits, proceeds from loan principal and interest payments, sale of loans, maturing securities and FHLB advances. While maturities and scheduled amortization of loans are a predictable source of funds, deposit flows and mortgage prepayments are greatly influenced by general interest rates, economic conditions and competition.
The Company must maintain an adequate level of liquidity to ensure the availability of sufficient liquidity to fund loan originations and deposit withdrawals, to satisfy other financial commitments and to take advantage of investment opportunities. The Company generally maintains sufficient cash and short-term investments to meet short-term liquidity needs. At December 31, 2004, cash and cash equivalents totaled $63.1 million or 10.90% of total assets. At December 31, 2004, the Bank also maintained an available line of credit of $50.0 million with the FHLB of Cincinnati that may be used as an additional source of liquidity.
At December 31, 2004, the Bank’s commitments to extend funds consisted of unused lines of credit of $40.2 million and standby letters of credit of $8.3 million issued primarily to municipalities as performance bonds. Also included are commitments to originate variable rate loans of $41.6 million and commitments to originate fixed rate loans of $11.6 million at interest rates ranging from 4.00% to 6.25% for the fixed rate loan commitments.
The Bank to a large extent originates real estate mortgage loans for sale in the secondary market. During the years ended December 31, 2004, 2003, and 2002, the Bank originated $130.3 million, $221.3 million, and $183.0 million of such loans, respectively. During the years ended December 31, 2004, 2003, and 2002, the Bank sold in the secondary market $133.3 million, $241.9 million, and $179.0 million of these loans. At December 31, 2004, the Bank had loan commitments totaling $53.2 million that were made up completely of undisbursed loans in process. The Bank anticipates that it will have sufficient funds available to meet current loan commitments. At December 31, 2004, the Bank held $6.1 million in locked-rate mortgage loan commitments to be sold in the secondary market. These locked-rate loan commitments are considered to be derivative instruments. Certificates of deposit that are scheduled to mature in less than one year from December 31, 2004 totaled $93.4 million. Historically, the Bank has been able to retain a significant amount of its certificates of deposits as they mature.
Net cash provided by operating activities totaled $10.7 million in 2004, $22.6 million in 2003, and $2.5 million in 2002. The large increase between 2002 and 2003 is primarily due to a timing difference in the funding of our loans held for sale. At December 31, 2002, the Company had $17.8 million in loans held for sale compared to $2.6 million at December 31, 2003. This contributed to the $241.9 million received in proceeds from sales of loans during 2003, which is $20.6 million greater than the $221.3 million of loans originated and held for sale during 2003. The large decrease between 2003 and 2004 is primarily due to the decrease in volume of loans originated in 2003 compared to 2004. Originations decreased from $221.3 million during 2003 to $130.3 million during 2004, which resulted in proceeds decreasing from $241.9 million for 2003 to $133.3 million for 2004. Please refer to this Management’s Discussion and Analysis, Comparison of Operating Results section under Non-Interest Income for further discussion of these changes.
Net cash used in investing activities totaled $72.4 million in 2004, $70.0 million in 2003, and $22.8 million in 2002. During 2003, the primary source of funds in this category was proceeds from maturities of available-for-sale investment securities. The Company used these proceeds as well as funds from increased deposits to purchase $82.1 million of available-for-sale investment securities. Additionally, the Company’s loans receivable, net increased 16.61% from 2002 to 2003. During 2004, the primary source of funds in this category was proceeds from sales and maturities of available-for-sale investment securities. The Company used these funds to purchase additional available-for-sale investment securities, resulting in a redistribution of types of investments in the portfolio. Additionally, the Company’s loans receivable, net increased 22.86% from 2003 to 2004.
Net cash provided by financing activities totaled $53.9 million in 2004, $45.1 million in 2003, and $24.2 million in 2002. These cash flows are heavily dependent on the Company’s level of deposits. Due to an increased emphasis on growing deposit accounts during 2003 and 2004, the Bank’s deposits increased 11.40% from 2002 to 2003 and 11.51% from 2003 to 2004. Two other items significantly impacted these cash flows during 2004: (1) $5.3 million in stock options were exercised during 2004, compared to only $325,000 in 2003; and (2) $2.0 million of common stock was repurchased and retired during 2004 compared to only $461,000 during 2003.
The Company and the Bank are required to comply with the capital adequacy standards established by the Federal Reserve Bank. The Federal Reserve Bank has established a risk-based and a leverage capital measure of capital adequacy for bank holding companies and state member banks. As of December 31, 2004, the Company and the Bank complied with all regulatory capital requirements as of that date with tier 1 leverage, tier 1 risk-based and total risk-based capital ratios. At December 31, 2004, the Company’s ratios were 9.3%, 11.7% and 12.7%, respectively, while the Bank’s ratios were 8.2%, 10.2% and 11.3%, respectively.
Cavalry Bancorp, Inc. and Subsidiaries
Management’s Discussion & Analysis of Financial Condition
and Results of Operations (Continued)
Liquidity and Capital Resources (Continued)
The primary source of funds for the Company is dividends from the Bank. The Federal Reserve Act imposes limitations on the amount of dividends that may be paid by state member banks. Generally, member banks may pay dividends out of their undivided profits, in such amounts and at such times as the Bank’s Board of Directors deem prudent. Without prior Federal Reserve approval, however, state member banks may not pay dividends in any calendar year that, in the aggregate, exceed the Bank’s calendar year-to-date net income plus the Bank’s retained net income for the two preceding years. In addition, the Bank may not declare or pay a cash dividend if the effect would cause the Bank’s regulatory capital to be below the amount required for the liquidation account established in connection with the Bank’s mutual stock conversion in 1998. The Bank paid dividends to the Corporation totaling $4.0 million during the year ended December 31, 2004.
As the primary function of the Company is to own the stock of the Bank, expenses of the Company are limited. These expenses include fees paid to members of the Board of Directors for meetings, expenses paid for investor services such as transfer agency fees, fees paid for listing on the NASDAQ exchange, fees paid to the Bank for management services, and postage.
RAYBURN, BATES & FITZGERALD, P.C.
▬▬▬▬CERTIFIED PUBLIC ACCOUNTANTS▬▬▬▬
SUITE 300
5200 MARYLAND WAY
BRENTWOOD, TENNESSEE 37027
REPORT OF INDEPENDENT REGISTERED PUBLIC ACCOUNTING FIRM
To the Board of Directors and Shareholders
of Cavalry Bancorp, Inc.
Murfreesboro, Tennessee
We have audited the accompanying consolidated balance sheets of Cavalry Bancorp, Inc. and subsidiaries (the “Company”) as of December 31, 2004 and 2003 and the related consolidated statements of income, comprehensive income, changes in shareholders’ equity and cash flows for each of the years in the three-year period ended December 31, 2004. These consolidated financial statements are the responsibility of the Company’s management. Our responsibility is to express an opinion on these consolidated financial statements based on our audits.
We conducted our audits in accordance with the standards of the Public Company Accounting Oversight Board (United States). Those standards require that we plan and perform the audit to obtain reasonable assurance about whether the financial statements are free of material misstatement. An audit includes examining, on a test basis, evidence supporting the amounts and disclosures in the financial statements. An audit also includes assessing the accounting principles used and significant estimates made by management, as well as evaluating the overall financial statement presentation. We believe that our audits provide a reasonable basis for our opinion.
In our opinion, the consolidated financial statements referred to above present fairly, in all material respects, the financial position of Cavalry Bancorp, Inc. and subsidiaries as of December 31, 2004 and 2003, and the results of its operations and its cash flows for each of the years in the three-year period ended December 31, 2004 in conformity with accounting principles generally accepted in the United States of America.
Brentwood, Tennessee
January 27, 2005
Cavalry Bancorp, Inc. and Subsidiaries
Consolidated Balance Sheets
December 31, 2004 and 2003
| | | 2004 | | 2003 | |
| | | (Dollars in Thousands) | |
| Assets: | | | | | | | |
| Cash (note 3) | | $ | 24,319 | | | 32,946 | |
| Interest-bearing deposits with other financial institutions | | | 38,816 | | | 37,967 | |
| Cash and cash equivalents | | | 63,135 | | | 70,913 | |
| Investment securities available-for-sale (note 4) | | | 42,183 | | | 55,123 | |
| Loans held for sale, at estimated fair value (note 6) | | | 2,501 | | | 2,648 | |
| Loans receivable, net (notes 6 and 10) | | | 430,526 | | | 350,412 | |
| Accrued interest receivable | | | 1,985 | | | 1,668 | |
| Office properties and equipment, net (note 7) | | | 17,607 | | | 18,431 | |
| Required investment in stock of Federal Home Loan Bank and Federal Reserve Bank, at cost (note 8) | | | 3,125 | | | 2,992 | |
| Deferred tax asset, net (note 11) | | | 1,690 | | | 1,300 | |
| Foreclosed assets | | | 16 | | | - | |
| Intangible asset (note 2) | | | 138 | | | 166 | |
| Bank owned life insurance | | | 11,604 | | | 8,308 | |
| Goodwill (note 2) | | | 1,772 | | | 1,772 | |
| Other assets | | | 2,388 | | | 1,439 | |
| Total assets | | $ | 578,670 | | | 515,172 | |
| Liabilities and Shareholders’ Equity | | | | | | | |
| Liabilities: | | | | | | | |
| Deposits: (note 9) | | | | | | | |
| Non-interest-bearing | | $ | 81,719 | | | 72,443 | |
| Interest-bearing | | | 424,815 | | | 381,814 | |
| | | | 506,534 | | | 454,257 | |
| Advances from Federal Home Loan Bank of Cincinnati (note 10) | | | 2,835 | | | 2,889 | |
| Dividends payable | | | 11,332 | | | 410 | |
| Accrued expenses and other liabilities (notes 11 and 12) | | | 4,136 | | | 3,189 | |
| Total liabilities | | | 524,837 | | | 460,745 | |
| Shareholders’ equity (notes 12, 13, 14 and 15): | | | | | | | |
| Preferred stock, no par value: | | | | | | | |
| Authorized - 250,000 shares, none issued or outstanding at December 31, 2004 and 2003 | | | - | | | - | |
| Common stock, no par value: | | | | | | | |
| Authorized - 49,750,000 shares; issued and outstanding: 7,217,565 and 6,834,873 shares at December 31, 2004 and 2003, respectively | | | 19,354 | | | 10,175 | |
| Retained earnings | | | 34,598 | | | 46,633 | |
| Unallocated ESOP shares | | | - | | | (2,373 | ) |
| Accumulated other comprehensive loss, net of taxes | | | (119 | ) | | (8 | ) |
| | | | | | | | |
| Total shareholders’ equity | | | 53,833 | | | 54,427 | |
| | | | | | | | |
| Total liabilities and shareholders’ equity | | $ | 578,670 | | | 515,172 | |
Commitments and contingencies (notes 3, 12, 13, and 19)
See accompanying notes to consolidated financial statements.
Cavalry Bancorp, Inc. and Subsidiaries
Consolidated Statements of Income
Years Ended December 31, 2004, 2003 and 2002
| | | 2004 | | 2003 | | 2002 | |
| | | (Dollars in Thousands) | |
| Interest and dividend income: | | | | | | | | | | |
| Loans | | | 23,183 | | | 20,267 | | | 21,007 | |
| Investment securities: | | | | | | | | | | |
| Taxable | | | 1,315 | | | 1,286 | | | 1,635 | |
| Non-taxable | | | 101 | | | - | | | - | |
| Other | | | 469 | | | 383 | | | 615 | |
| | | | | | | | | | | |
| Total interest and dividend income | | | 25,068 | | | 21,936 | | | 23,257 | |
| | | | | | | | | | | |
| Interest expense: | | | | | | | | | | |
| Deposits (note 9) | | | 5,458 | | | 5,518 | | | 7,145 | |
| Advances from Federal Home Loan Bank of Cincinnati | | | 97 | | | 98 | | | 48 | |
| | | | | | | | | | | |
| Total interest expense | | | 5,555 | | | 5,616 | | | 7,193 | |
| | | | | | | | | | | |
| Net interest income | | | 19,513 | | | 16,320 | | | 16,064 | |
| | | | | | | | | | | |
| Provision for loan losses (note 6) | | | 875 | | | 101 | | | 497 | |
| | | | | | | | | | | |
| Net interest income after provision for loan losses | | | 18,638 | | | 16,219 | | | 15,567 | |
| | | | | | | | | | | |
| Non-interest income: | | | | | | | | | | |
| Servicing income | | | 186 | | | 212 | | | 237 | |
| Gain on sale of loans, net | | | 2,773 | | | 5,473 | | | 3,401 | |
| Gain on sale of office properties and equipment | | | - | | | - | | | 46 | |
| Gain on sale of investment securities, net | | | - | | | 11 | | | 4 | |
| Deposit servicing fees and charges | | | 5,362 | | | 4,596 | | | 3,825 | |
| Trust service fees | | | 1,097 | | | 988 | | | 1,086 | |
| Commissions and other non-banking fees | | | 2,477 | | | 2,452 | | | 2,195 | |
| Other | | | 1,003 | | | 879 | | | 824 | |
| | | | | | | | | | | |
| Total non-interest income | | | 12,898 | | | 14,611 | | | 11,618 | |
See accompanying notes to consolidated financial statements.
Cavalry Bancorp, Inc. and Subsidiaries
Consolidated Statements of Income (Continued)
Years Ended December 31, 2004, 2003 and 2002
| | | 2004 | | 2003 | | 2002 | |
| | | (Dollars in Thousands, Except Per Share Amounts) | |
| Non-interest expenses: | | | | | | | | | | |
| Salaries and employee benefits (notes 12 and 13) | | $ | 19,205 | | | 15,214 | | | 12,695 | |
| Occupancy expense | | | 1,395 | | | 1,304 | | | 1,179 | |
| Supplies, communications and other office expenses | | | 946 | | | 1,042 | | | 1,084 | |
| Advertising expense | | | 578 | | | 501 | | | 495 | |
| Professional fees | | | 1,033 | | | 515 | | | 514 | |
| Equipment and service bureau expense | | | 3,507 | | | 2,989 | | | 2,682 | |
| Loss on sale of investment securities, net | | | 22 | | | - | | | - | |
| Other | | | 1,887 | | | 1,806 | | | 1,528 | |
| | | | | | | | | | | |
| Total non-interest expenses | | | 28,573 | | | 23,371 | | | 20,177 | |
| | | | | | | | | | | |
| Income before income tax expense | | | 2,963 | | | 7,459 | | | 7,008 | |
| | | | | | | | | | | |
| Income tax expense (note 11) | | | 2,534 | | | 2,965 | | | 2,891 | |
| | | | | | | | | | | |
| Net income | | $ | 429 | | | 4,494 | | | 4,117 | |
| | | | | | | | | | | |
| Basic earnings per share (note 16) | | $ | 0.07 | | | 0.70 | | | 0.64 | |
| Diluted earnings per share (note 16) | | $ | 0.06 | | | 0.67 | | | 0.62 | |
See accompanying notes to consolidated financial statements.
Cavalry Bancorp, Inc. and Subsidiaries
Consolidated Statements of Comprehensive Income
Years Ended December 31, 2004, 2003 and 2002
| | | 2004 | | 2003 | | 2002 | |
| | | (Dollars in Thousands) | |
| | | | | | | | |
| Net income | | $ | 429 | | | 4,494 | | | 4,117 | |
| | | | | | | | | | | |
| Other comprehensive loss, net of tax (note 22): | | | | | | | | | | |
| | | | | | | | | | | |
| Unrealized loss on investment securities available-for-sale | | | (111 | ) | | (130 | ) | | (24 | ) |
| | | | | | | | | | | |
| Comprehensive income | | $ | 318 | | | 4,364 | | | 4,093 | |
See accompanying notes to consolidated financial statements.
Cavalry Bancorp, Inc. and Subsidiaries
Consolidated Statements of Changes in Shareholders' Equity
Years Ended December 31, 2004, 2003 and 2002
| | | Common Shares | | Common Stock | | Retained Earnings | | Unallocated ESOP Shares | | Accumulated Other Comprehensive Income (Loss) | | Total | |
| | | (Dollars in Thousands, Except Per Share Amounts) | |
| | | | | | | | | | | | | | |
| Balance, December 31, 2001 | | | 7,079,801 | | $ | 11,683 | | | 40,700 | | | (3,723 | ) | | 146 | | | 48,806 | |
Net income | | | - | | | - | | | 4,117 | | | - | | | - | | | 4,117 | |
| Change in valuation allowance for investment securities available-for-sale, net of income taxes of $16 | | | - | | | - | | | - | | | - | | | (24 | ) | | (24 | ) |
| ESOP shares committed for release(note 12) | | | - | | | 664 | | | - | | | 666 | | | - | | | 1,330 | |
| Purchase and retirement of common stock (note 14) | | | (250,064 | ) | | (3,221 | ) | | - | | | - | | | - | | | (3,221 | ) |
| Proceeds from issuance of common stock as a result of stock options exercised | | | 942 | | | 12 | | | - | | | - | | | - | | | 12 | |
| Dividends ($0.20 per share) | | | - | | | - | | | (1,274 | ) | | - | | | - | | | (1,274 | ) |
| Balance, December 31, 2002 | | | 6,830,679 | | | 9,138 | | | 43,543 | | | (3,057 | ) | | 122 | | | 49,746 | |
Net income | | | - | | | - | | | 4,494 | | | - | | | - | | | 4,494 | |
| Change in valuation allowance for investment securities available-for-sale, net of income taxes of $81 | | | - | | | - | | | - | | | - | | | (130 | ) | | (130 | ) |
| ESOP shares committed for release(note 12) | | | - | | | 1,066 | | | - | | | 684 | | | - | | | 1,750 | |
| Purchase and retirement of common stock (note 14) | | | (28,112 | ) | | (461 | ) | | - | | | - | | | - | | | (461 | ) |
| Proceeds and accompanying tax benefit from issuance of common stock as a result of stock options exercised (note 13) | | | 32,306 | | | 432 | | | - | | | - | | | - | | | 432 | |
| Dividends ($0.22 per share) | | | - | | | - | | | (1,404 | ) | | - | | | - | | | (1,404 | ) |
| Balance, December 31, 2003 | | | 6,834,873 | | | 10,175 | | | 46,633 | | | (2,373 | ) | | (8 | ) | | 54,427 | |
Net income | | | - | | | - | | | 429 | | | - | | | - | | | 429 | |
| Change in valuation allowance for investment securities available-for-sale, net of income taxes of $69 | | | - | | | - | | | - | | | - | | | (111 | ) | | (111 | ) |
| ESOP shares committed for release(note 12) | | | - | | | 4,257 | | | - | | | 2,373 | | | - | | | 6,630 | |
| Purchase and retirement of common stock (note 14) | | | (132,043 | ) | | (2,044 | ) | | - | | | - | | | - | | | (2,044 | ) |
| Proceeds and accompanying tax benefit from issuance of common stock as a result of stock options exercised (note 13) | | | 514,735 | | | 6,966 | | | - | | | - | | | - | | | 6,966 | |
| Dividends ($1.75 per share) | | | - | | | - | | | (12,464 | ) | | - | | | - | | | (12,464 | ) |
Balance, December 31, 2004 | | | 7,217,565 | | $ | 19,354 | | | 34,598 | | | - | | | (119 | ) | | 53,833 | |
See accompanying notes to consolidated financial statements.
Cavalry Bancorp, Inc. and Subsidiaries
Consolidated Statements of Cash Flows
Years Ended December 31, 2004, 2003 and 2002
| | | 2004 | | 2003 | | 2002 | |
| | | (Dollars in Thousands) | |
| Operating activities: | | | | | | | | | | |
| Net income | | $ | 429 | | | 4,494 | | | 4,117 | |
| Adjustments to reconcile net income to net cash provided by operating activities: | | | | | | | | | | |
| Provision for loan losses | | | 875 | | | 101 | | | 497 | |
| Loss (gain) on sales of foreclosed assets, net | | | 3 | | | 14 | | | (44 | ) |
| Gain on sales of loans, net | | | (2,773 | ) | | (5,473 | ) | | (3,401 | ) |
| Gain on sale of office properties and equipment | | | (25 | ) | | - | | | (46 | ) |
| Loss (gain) on sale of investment securities, net | | | 22 | | | (11 | ) | | (4 | ) |
| Contribution of foreclosed asset, at cost | | | - | | | - | | | 15 | |
| Depreciation and amortization on office properties and equipment | | | 1,711 | | | 1,772 | | | 1,514 | |
| Amortization of intangible asset | | | 28 | | | 27 | | | 28 | |
| Allocation of ESOP shares at fair value | | | 6,630 | | | 1,750 | | | 1,330 | |
| Tax benefit realized on exercise of non-qualified stock options | | | 1,523 | | | 107 | | | - | |
| Compensation cost related to stock options | | | 138 | | | - | | | - | |
| Net amortization of investment securities premiums and discounts | | | 241 | | | 273 | | | 312 | |
| Accretion of deferred loan origination fees | | | (1,137 | ) | | (1,027 | ) | | (898 | ) |
| Loan fees collected | | | 1,110 | | | 1,389 | | | 968 | |
| Deferred income tax provision (benefit) | | | (390 | ) | | 100 | | | (105 | ) |
| Increase in cash surrender value of bank owned life insurance | | | (296 | ) | | (387 | ) | | (421 | ) |
| Stock dividends on Federal Home Loan Bank stock | | | (98 | ) | | (92 | ) | | (101 | ) |
| Proceeds from sales of loans | | | 133,258 | | | 241,917 | | | 179,030 | |
| Origination of loans held for sale | | | (130,338 | ) | | (221,292 | ) | | (183,006 | ) |
| Decrease (increase) in accrued interest receivable | | | (317 | ) | | (91 | ) | | 562 | |
| Decrease (increase) in other assets | | | (880 | ) | | (529 | ) | | 613 | |
| Increase (decrease) in accrued expenses and other liabilities | | | 947 | | | (319 | ) | | 1,548 | |
| Net cash provided by operating activities | | | 10,661 | | | 22,723 | | | 2,508 | |
See accompanying notes to consolidated financial statements.
Cavalry Bancorp, Inc. and Subsidiaries
Consolidated Statements of Cash Flows (Continued)
Years Ended December 31, 2004, 2003 and 2002
| | | 2004 | | 2003 | | 2002 | |
| | | (Dollars in Thousands) | |
| Investing activities: | | | | | | | | | | |
| Increase in loans receivable, net | | $ | (81,001 | ) | | (50,715 | ) | | (21,179 | ) |
| Principal payments on investment securities available-for-sale and held-to-maturity | | | 3,839 | | | 11,098 | | | 4,441 | |
| Proceeds from the sales of office properties and equipment | | | 33 | | | 3 | | | 59 | |
| Purchases of investment securities available-for-sale | | | (65,077 | ) | | (82,077 | ) | | (45,207 | ) |
| Proceeds from maturities of investment securities available-for-sale | | | 26,030 | | | 50,789 | | | 40,500 | |
| Proceeds from sales of investment securities available-for-sale | | | 47,705 | | | 2,520 | | | 4,020 | |
| Proceeds from sales of investment securities held-to-maturity | | | - | | | - | | | 417 | |
| Purchases of office properties and equipment | | | (895 | ) | | (2,098 | ) | | (4,002 | ) |
| Proceeds from sale of foreclosed assets | | | 20 | | | 553 | | | 355 | |
| Improvements on foreclosed assets | | | - | | | - | | | (18 | ) |
| Purchase of bank owned life insurance | | | (3,000 | ) | | - | | | - | |
| Purchase of stock in Federal Reserve Bank | | | (35 | ) | | (26 | ) | | (1,240 | ) |
| Redemption of stock in Federal Reserve Bank | | | - | | | - | | | 626 | |
| Cash paid for acquisition of Miller & Loughry Insurance and Services, Inc., net of cash acquired | | | - | | | - | | | (1,611 | ) |
| Net cash used in investing activities | | | (72,381 | ) | | (69,953 | ) | | (22,839 | ) |
| Financing activities: | | | | | | | | | | |
| Net increase in deposits | | | 52,277 | | | 46,505 | | | 26,762 | |
| Advances from Federal Home Loan Bank of Cincinnati | | | - | | | - | | | 2,000 | |
| Repayment of advances from Federal Home Loan Bank of Cincinnati | | | (54 | ) | | (55 | ) | | (54 | ) |
| Retirement of common stock | | | (2,044 | ) | | (461 | ) | | (3,221 | ) |
| Proceeds from exercise of stock options | | | 5,305 | | | 325 | | | 12 | |
| Dividends paid | | | (1,542 | ) | | (1,333 | ) | | (1,287 | ) |
| Net cash provided by financing activities | | | 53,942 | | | 44,981 | | | 24,212 | |
| Increase (decrease) in cash and cash equivalents | | | (7,778 | ) | | (2,249 | ) | | 3,881 | |
| Cash and cash equivalents, beginning of year | | | 70,913 | | | 73,162 | | | 69,281 | |
| Cash and cash equivalents, end of year | | $ | 63,135 | | | 70,913 | | | 73,162 | |
| | | | | | | | | | | |
Supplemental Disclosures of Cash Flow Information: | | | | | | | | | | |
| Payments during the period for: | | | | | | | | | | |
| Interest | | $ | 5,439 | | | 5,678 | | | 7,209 | |
| Income taxes | | $ | 2,195 | | | 3,565 | | | 3,050 | |
Supplemental Disclosures of Noncash Investing and Financing Activities: | | | | | | | | | | |
| Foreclosures and in substance foreclosures of loans during year | | $ | 39 | | | 416 | | | 327 | |
| Net unrealized gains (losses) on investment securities available-for-sale | | $ | (180 | ) | | (211 | ) | | (40 | ) |
| Increase in deferred tax asset (liability) related to unrealized gain (loss) on investments | | $ | 69 | | | 81 | | | 16 | |
| Investment securities transferred from held-to-maturity to available-for-sale | | $ | - | | | - | | | 100 | |
| Dividends declared and payable | | $ | 11,332 | | | 410 | | | 339 | |
See accompanying notes to consolidated financial statements.
Cavalry Bancorp, Inc. and Subsidiaries
Notes to Consolidated Financial Statements
December 31, 2004, 2003 and 2002
(1) Summary of Significant Accounting Policies:
Nature of Operations and Customer Concentration
Cavalry Bancorp, Inc. (the Corporation) is a bank holding company incorporated in the state of Tennessee. The Company’s principal business activities are conducted through it’s wholly-owned subsidiary, Cavalry Banking (the Bank), which is a state chartered commercial bank engaged in the business of accepting deposits and providing mortgage, consumer, construction and commercial loans to the general public through its retail banking offices. The Bank’s business activities are primarily limited to within Rutherford County and adjacent counties of Tennessee. The Bank is subject to competition from other financial institutions. Deposits at the Bank are insured up to the applicable limits by the Federal Deposit Insurance Corporation (FDIC). The Bank is subject to comprehensive regulation, examination and supervision by the Tennessee Department of Financial Institutions, the Board of Governors of the Federal Reserve System (FRB) and the FDIC. Effective January 1, 2002, the Bank and Corporation converted to their current charters. Prior to this date, the Corporation was a unitary thrift holding company and the Bank was a federally chartered savings bank. The Bank was at that time regulated by the Office of Thrift Supervision (OTS) and the FDIC.
A substantial portion of the Bank’s loans are secured by real estate in the Middle Tennessee market. In addition, foreclosed real estate is located in this same market. Accordingly, the ultimate collectibility of a substantial portion of the Bank’s loan portfolio and the recovery of a substantial portion of the carrying amount of foreclosed real estate is susceptible to changes in local market conditions.
Management believes that the allowance for loan losses is adequate. While management uses available information to recognize losses on loans and foreclosed real estate, future additions to the allowances may be necessary based on changes in local economic conditions. In addition, regulatory agencies, as an integral part of their examination process, periodically review the Bank’s allowances for losses on loans and foreclosed real estate. Such agencies may require the Bank to recognize additions to the allowances based on their judgments about information available to them at the time of their examination.
Principles of Consolidation
The consolidated financial statements include the accounts of the Corporation, the Bank and its wholly-owned subsidiary Miller & Loughry Insurance and Services, Inc. and other insignificant subsidiaries (collectively the Company). Significant intercompany balances and transactions have been eliminated in consolidation under the equity method.
Accounting
The accounting and reporting policies of the Company are in accordance with accounting principles generally accepted in the United States of America and conform to general practices in the banking industry.
Estimates
In preparing the consolidated financial statements, management is required to make estimates and assumptions that affect the reported amounts of assets and liabilities as of the date of the consolidated balance sheet and revenues and expenses for the year. Actual results could differ significantly from those estimates. Material estimates that are particularly susceptible to significant change relate to the determination of the allowance for loan losses and the valuation of real estate acquired in connection with foreclosures or in satisfaction of loans. In connection with the determination of the allowances for loan losses and foreclosed real estate, management obtains independent appraisals for significant properties.
Cavalry Bancorp, Inc. and Subsidiaries
Notes to Consolidated Financial Statements (Continued)
December 31, 2004, 2003 and 2002
(1) Summary of Significant Accounting Policies: (Continued)
Cash Equivalents
Cash equivalents include cash and demand and time deposits at other financial institutions, including federal funds sold, with remaining maturities of three months or less.
Investment Securities
In accordance with Statement of Financial Accounting Standards No. (SFAS) 115,Accounting for Certain Investments in Debt and Equity Securities, the Company is required to report debt, readily-marketable equity, mortgage-backed and mortgage related securities in one of the following categories: (i) “held-to-maturity” (management has a positive intent and ability to hold to maturity) which are to be reported at amortized cost adjusted, in the case of debt securities, for the amortization of premiums and accretion of discounts; (ii) “trading” (held for current resale) which are to be reported at fair value, with unrealized gains and losses included in earnings; and (iii) “available-for-sale” (all other debt, equity, mortgage-backed and mortgage related securities) which are to be reported at fair value, with unrealized gains and losses reported net of tax as a separate component of shareholders’ equity. At the time of new securities purchases, a determination is made as to the appropriate classification. Realized and unrealized gains and losses on trading securities are included in net income. Unrealized gains and losses on securities available-for-sale are recognized as direct increases or decreases in shareholders’ equity, net of any tax effect. Realized gains or losses from the sale of securities are recognized upon realization using the specific identification method. Premiums and discounts on securities are amortized and accreted to income as an adjustment to the securities’ yields using the interest method.
Loans Receivable
Loans are stated at unpaid principal balances, less the allowance for loan losses and net deferred loan fees and unearned discounts. Unearned discounts on installment loans are recognized as income over the term of the loans using the interest method.
Loan origination and commitment fees, as well as certain origination costs, are deferred and amortized as a yield adjustment over the lives of the related loans adjusted for estimated prepayments based on the Company’s historical prepayment experience, using the interest method. Loans are considered past due based on contractual terms. Loans are placed on nonaccrual status when doubt as to timely collection of principal or interest exists, or when principal or interest is delinquent for 90 days or more unless such loans are well-secured and in the process of collection. The decision to place a loan on nonaccrual status is also based on an evaluation of the borrower’s financial condition, collateral, liquidation value, and other factors that affect the borrower’s ability to pay. Generally, at the time a loan is placed on nonaccrual status, any unpaid interest previously accrued on these loans is reversed from income. Thereafter, interest on nonaccrual loans is recognized as interest income only to the extent that cash is received and future collection of principal is not in doubt. If the collectibility of outstanding principal is doubtful, such cash received is applied as a reduction of principal. A nonaccrual loan may be restored to an accruing status when principal and interest are no longer past due and unpaid and future collection of principal and interest on a timely basis is not in doubt.
The allowance for loan losses is maintained at a level which, in management’s judgment, is adequate to absorb losses inherent in the loan portfolio. The amount of the allowance is based on management’s evaluation of the collectibility of the loan portfolio, including the nature of the portfolio, credit concentrations, trends in historical loss experience, specific impaired loans, and economic conditions. Allowances for impaired loans are generally determined based on collateral values or the present value of estimated cash flows. The allowance is increased by a provision for loan losses, which is charged to expense, and reduced by charge-offs, net of recoveries. Changes in the allowance relating to impaired loans are charged or credited to the provision for loan losses.
The Company follows the provisions of SFAS No. 114,Accounting by Creditors for impairment of a Loan and SFAS No. 118,Accounting by Creditors for Impairment of a Loan - Income Recognition and Disclosures. The pronouncements apply to impaired loans except for large groups of smaller-balance homogeneous loans that are collectively evaluated for impairment including residential mortgage and installment loans.
Cavalry Bancorp, Inc. and Subsidiaries
Notes to Consolidated Financial Statements (Continued)
December 31, 2004, 2003 and 2002
(1) Summary of Significant Accounting Policies: (Continued)
Loans Receivable (Continued)
Loans are considered to be impaired when, in management’s judgment, it is probable that the Company will be unable to collect the scheduled payments of principal or interest due under the contractual terms of the loan agreement. When conducting loan evaluations, management considers various factors such as historical loan performance, the financial condition of the borrower and adequacy of collateral to determine if a loan is impaired.
Loans not on nonaccrual status are classified as impaired in certain cases when there is inadequate protection by the current net worth and financial capacity of the borrower or of the collateral pledged, if any. In those cases, such loans have a well-defined weakness that might jeopardize the liquidation of the debt, and if such deficiencies are not corrected, there is a probability that the Company will sustain some loss. In such cases, interest income continues to accrue as long as the loan does not meet the Company’s criteria for nonaccrual status.
The measurement of impaired loans generally is based on the present value of future cash flows discounted at the historical effective interest rate, except that collateral-dependent loans generally are measured for impairment based on the fair value of the collateral. When the measured amount of an impaired loan is less than the recorded investment in the loan, the impairment is recorded as a charge to income and a valuation allowance which is included as a component of the allowance for loan losses. The charge-off policy for impaired loans is similar to the charge-off policy for all loans in that loans are charged off in the month when they are considered uncollectible.
Mortgage loans originated and held for sale in the secondary market are carried at the lower of cost or market value, which is determined by outstanding commitments from investors at the balance sheet date. These loans are valued on an aggregate basis. Net unrealized losses are recognized in a valuation allowance through charges to income. Gains and losses on the sale of loans held for sale are determined using the specific identification method.
Foreclosed Assets
Foreclosed assets include property acquired through foreclosure and deeds in lieu of foreclosure. Property acquired by deed in lieu of foreclosure results when a borrower voluntarily transfers title to the Company in full settlement of the related debt in an attempt to avoid foreclosure. Foreclosed assets are valued at the date of acquisition and thereafter at the lower of fair value less costs to sell or the Company’s net investment in the loan and subsequent improvements to the property. Costs relating to the development and improvement of the property are capitalized, while holding costs of the property are charged to expense in the period incurred. Gains or losses resulting from the disposition of property are recognized in the current period’s operations.
Office Properties and Equipment
Depreciation and amortization are provided over the estimated useful lives of the respective assets which range from 3 to 40 years. All office properties and equipment are recorded at cost and are depreciated on the straight-line method. Gain or loss on items retired or otherwise disposed of is credited or charged to operations and cost and related accumulated depreciation are removed from the asset and accumulated depreciation accounts.
Expenditures for major renewals and improvements of premises and equipment are capitalized and those for maintenance and repairs are charged to earnings as incurred.
Goodwill
Beginning January 1, 2002 with the adoption of SFAS 142,Goodwill and Other Intangible Assets, goodwill is no longer amortized, but instead tested for impairment at least annually.
Intangible Asset
The intangible asset for insurance contracts is amortized using the straight-line method over the estimated period of benefit of eight years. The Company periodically evaluates the recoverability of the intangible asset and takes into account events or circumstances that warrant a revised estimate of the useful life or indicates that an impairment exists.
Advertising
The Company expenses the production cost of advertising as incurred.
Cavalry Bancorp, Inc. and Subsidiaries
Notes to Consolidated Financial Statements (Continued)
December 31, 2004, 2003 and 2002
(1) Summary of Significant Accounting Policies: (Continued)
Income Taxes
Under the asset and liability method of SFAS 109,Accounting for Income Taxes, deferred tax assets and liabilities are recognized for the future tax consequences attributable to differences between the financial statement carrying amounts of existing assets and liabilities and their respective tax bases. To the extent that current available evidence about the future raises doubt about the realization of a deferred tax asset, a valuation allowance must be established.
Deferred tax assets and liabilities are measured using enacted tax rates expected to apply to taxable income in the years in which those temporary differences are expected to be recovered or settled. The effect on deferred tax assets and liabilities of a change in tax rates is recognized in income in the period that includes the enactment date.
The Company files consolidated federal income and combined state franchise and excise tax returns. All taxes are accrued on a separate entity basis.
Fair Values of Financial Instruments
SFAS 107,Disclosures about Fair Value of Financial Instruments, requires disclosure of fair value information about financial instruments, whether or not recognized in the consolidated balance sheets for which it is practicable to estimate that value. In cases where quoted market prices are not available, fair values are based on estimates using present value or other valuation techniques. Those techniques are significantly affected by the assumptions used, including the discount rate and estimates of future cash flows. In that regard, the derived fair value estimates cannot be substantiated by comparison to independent markets and, in many cases, could not be realized in immediate settlement of the instruments. Fair value estimates are made at a point in time, based on relevant market information and information about the financial instrument. Accordingly, such estimates involve uncertainties and matters of judgment and therefore cannot be determined with precision. SFAS 107 excludes certain financial instruments and all non-financial instruments from its disclosure requirements. Accordingly, the aggregate fair value amounts presented do not represent the underlying value of the Company.
The following are the more significant methods and assumptions used by the Company in estimating its fair value disclosures for financial instruments:
Cash and cash equivalents: The carrying amounts reported in the consolidated balance sheets for cash and cash equivalents approximate those assets’ fair values, because they mature within 90 days or less and do not present credit risk concerns.
Investment securities available-for-sale: Fair values for investment securities available-for-sale are based on quoted market prices, where available. If quoted market prices are not available, fair values are based on quoted market prices of comparable instruments.
Loans receivable: The fair values for loans receivable are estimated using discounted cash flow analysis which considers future repricing dates and estimated repayment dates, and further using interest rates currently being offered for loans with similar terms to borrowers of similar credit quality. Loan fair value estimates include judgments regarding future expected loss experience and risk characteristics.
Loans held for sale: Fair value is based on investor commitments, or in the absence of such commitments, on current investor yield requirements.
Accrued interest receivable: Fair value is estimated to approximate the carrying amount because such amounts are expected to be received within 90 days or less and any credit concerns have been previously considered in the carrying value.
Deposits: The fair values disclosed for deposits with no stated maturity such as demand deposits, interest-bearing checking accounts and savings accounts are, by definition, equal to the amount payable on demand at the reporting date (that is, their carrying amounts). The fair values for certificates of deposit and other fixed maturity time deposits are estimated using a discounted cash flow calculation that applies interest rates currently being offered on such type accounts to a schedule of aggregated contractual maturities on such time deposits.
Advances from the FHLB: The fair value of these advances is estimated by discounting the future cash flows of these advances using the current rates at which similar advances could be obtained.
Cavalry Bancorp, Inc. and Subsidiaries
Notes to Consolidated Financial Statements (Continued)
December 31, 2004, 2003 and 2002
(1) Summary of Significant Accounting Policies: (Continued)
Fair Values of Financial Instruments (Continued)
Commitments to extend credit: Commitments to extend credit were evaluated and fair value was estimated using the fees currently charged to enter into similar agreements, taking into account the remaining terms of the agreements and the present creditworthiness of the counterparties. For fixed-rate loan commitments, fair value also considers the difference between current levels of interest rates and the committed rates.
Sale and Servicing of Mortgage Loans
The Company sells mortgage loans for cash proceeds equal to the principal amount of the loans sold but with yield rates which reflect the current market rate. Gain or loss is recorded at the time of sale in an amount reflecting the difference between the contractual interest rates of the loans sold and the current market rate. Certain loans are sold with the servicing retained by the Company. Servicing income is recognized as collected and is based on the normal agency servicing fee as defined by Federal National Mortgage Association or Federal Home Loan Mortgage Corporation. For mortgage servicing rights that are created through the origination of mortgage loans, and where the loans are subsequently sold or securitized with servicing rights retained, the Company allocates the total cost of the mortgage loans to the mortgage servicing rights and the loans based on their relative fair values. The Company periodically makes an assessment of capitalized mortgage servicing rights for impairment based on the current fair value of those rights.
Fees earned for servicing loans are reported as income when the related mortgage loan payments are collected. Mortgage servicing rights (MSRs) are amortized, as a reduction to loan service fee income, using the interest method over the estimated remaining life of the underlying mortgage loans. MSR assets are carried at fair value and impairment, if any, is recognized through a valuation allowance.
Earnings Per Share
Earnings per share (EPS) consists of two separate components, basic EPS and diluted EPS. Basic EPS is computed by dividing net income by the weighted average number of common shares outstanding for each period presented. Diluted EPS is calculated by dividing net income by the weighted average number of common shares outstanding plus dilutive common stock equivalents (CSE). CSE consists of dilutive stock options granted through the Company’s stock option plan. Common stock equivalents which are considered antidilutive are not included for the purposes of this calculation. During the fourth quarter of 2004, the Corporation had stock options that were not included in the quarterly computation of diluted earnings per share because their impact was antidilutive. For the years ended December 31, 2004, 2003 and 2002, all outstanding stock options were included in the computation of diluted earnings per share.
Employee Stock Ownership Plan
The Company accounted for the original issuance of its Employee Stock Ownership Plan (ESOP) as a component of equity recorded in a contra-equity account. Compensation expense is recognized over the allocation period based upon the fair value of shares committed to be released to employees. The Company accounts for the shares acquired by the ESOP in accordance with Statement of Position 93-6 and, therefore, shares controlled by the ESOP are not considered in the weighted average shares outstanding until the shares are committed to be released.
Stock Options
The Company accounts for its stock option plans in accordance with the provisions of Accounting Principles Board (APB) Opinion No. 25,Accounting for Stock Issued to Employees, and related interpretations, as permitted by SFAS 123,Accounting for Stock-Based Compensation. As such, compensation expense is recorded on the date of grant only if the current market price of the underlying stock exceeds the exercise price. SFAS 123 requires entities which continue to apply the provisions of APB Opinion No. 25 to provide pro-forma earnings per share disclosure for stock option grants made in 1995 and subsequent years as if the fair value based method defined in SFAS 123 had been applied. SFAS 148,Accounting for Stock-Based Compensation - Transition and Disclosure-an amendment of FASB No. 123, provides that an entity that has transitioned to the accounting treatment prescribed by SFAS 123 may use the intrinsic value method in lieu of the fair value based method for determining the fair value of stock options at the date of grant. SFAS 148 requires disclosure in addition to SFAS 123 if APB opinion No. 25 is currently being applied.
Cavalry Bancorp, Inc. and Subsidiaries
Notes to Consolidated Financial Statements (Continued)
December 31, 2004, 2003 and 2002
(1) Summary of Significant Accounting Policies: (Continued)
Stock Options (Continued)
The Company applies APB Opinion No. 25 and related interpretations in accounting for the plan. No compensation cost has been recognized for the plan because the stock option price is equal to or greater than the fair value at the grant date. Following is a reconciliation of reported and pro forma net income and earnings per share had compensation cost for the plan been determined based on the fair value of SFAS 123,Accounting for Stock-Based Compensation, as amended:
| | | Year Ended December 31, | |
| | | 2004 | | 2003 | | 2002 | |
| | | (Dollars in Thousands,Except Per Share Amounts) | |
| Net income: | | | | | | | | | | |
| As reported | | $ | 429 | | | 4,494 | | | 4,117 | |
| | | | | | | | | | | |
| Add: Stock-based employee compensation expense included in reported net income, net of related tax effects | | | 138 | | | - | | | - | |
| | | | | | | | | | | |
| Deduct: Total stock-based employee compensation expense determined under fair value based method for all awards granted, net of related tax effects | | | (870 | ) | | (365 | ) | | (133 | ) |
| | | | | | | | | | | |
| Pro forma net income (loss) | | $ | (303 | ) | | 4,129 | | | 3,984 | |
| | | | | | | | | | | |
| Earnings per share: | | | | | | | | | | |
| Basic - as reported | | $ | 0.07 | | | 0.70 | | | 0.64 | |
| Basic - pro forma | | | (0.05 | ) | | 0.64 | | | 0.62 | |
| | | | | | | | | | | |
| Diluted - as reported | | $ | 0.06 | | | 0.67 | | | 0.62 | |
| Diluted - pro forma | | | (0.05 | ) | | 0.62 | | | 0.60 | |
Derivative Financial Instruments
It is the policy of the Company to record all derivative financial instruments at fair value in the consolidated financial statements. The Bank has derivative financial instruments in the form of locked-rate mortgage loan commitments that are carried at their current market value and changes in their current market value are recorded in the consolidated statements of income during the current period.
Off-Balance Sheet Financial Instruments
In the ordinary course of business, the Company has entered into off-balance sheet financial instruments consisting of commitments to extend credit, standby letters of credit, and mortgage loan commitments. Such financial instruments are recorded in the financial statements when they are funded or related fees are incurred or received.
Effect of New Accounting Pronouncements
In January 2003, the Financial Accounting Standards Board (FASB) issued Financial Interpretation (FIN) 46,Consolidation of Variable Interest Entities,which clarifies the application of Accounting Research Bulletin (ARB) No. 51,Consolidated Financial Statements, to certain entities (called variable interest entities) in which equity investors do not have the characteristics of controlling financial interest or do not have sufficient equity at risk for the entity to finance its activities without additional subordinate financial support from other parties. The effects of FIN 46 did not have a material impact on the consolidated financial statements.
In May 2003, the FASB issued SFAS 150,Accounting for Certain Financial Instruments with Characteristics of both Liabilities and Equity. This Statement establishes standards for how an issuer classifies and measures certain financial instruments with characteristics of both liabilities and equity. It requires that an issuer classify a financial instrument that is within its scope as a liability (or an asset in some circumstances). Many of those instruments were previously classified as equity. This statement is effective for financial instruments entered into or modified after May 31, 2003, and otherwise is effective at the beginning of the first interim period beginning after June 15, 2003. The adoption of SFAS 150 did not have a material impact on the Company’s financial position, results of operations or cash flows.
Cavalry Bancorp, Inc. and Subsidiaries
Notes to Consolidated Financial Statements (Continued)
December 31, 2004, 2003 and 2002
(1) Summary of Significant Accounting Policies: (Continued)
Effect of New Accounting Pronouncements (Continued)
In December 2003, the FASB revised SFAS 132,Employers' Disclosures about Pensions and Other Postretirement Benefits. This Statement retains the disclosures required by the original SFAS 132 and requires additional disclosures about the assets, obligations, cash flows and net periodic benefit cost of defined benefit pension and postretirement plans. In addition, this Statement requires interim period disclosure of the components of net period benefit cost and contributions if significantly different from previously reported amounts. All new disclosure requirements for the domestic plans of publicly traded entities are effective for years ending after December 15, 2003. The adoption of SFAS 132R did not have a material impact on the Company’s financial position, results of operations or cash flows.
On March 9, 2004, the Securities and Exchange Commission (SEC) issued Staff Accounting Bulletin (SAB) 105,Application of Accounting Principles to Loan Commitments, stating that the fair value of loan commitments is to be accounted for as a derivative instrument under SFAS 133, but the valuation of such commitment should not consider expected future cash flows related to servicing of the future loan. The guidance in SAB 105 must be applied to interest rate locks initiated after March 31, 2004 and is to be applied prospectively. The adoption of SAB 105 did not have a material impact on financial position, results of operations, or cash flows.
In March 2004, the FASB Emerging Issues Task Force (EITF) released Issue 03-01,Meaning of Other Than Temporary Impairment, which addressed other-than-temporary impairment for certain debt and equity investments. The recognition and measurement requirements of Issue 03-01, and other disclosure requirements not already implemented, were effective for periods beginning after June 15, 2004. In September 2004, the FASB staff issued FASB Staff Position (FSP) EITF 03-1-1, which delayed the effective date for certain measurement and recognition guidance contained in Issue 03-1. The FSP requires the application of pre-existing other-than-temporary guidance during the period of delay until a final consensus is reached. Management does not anticipate the issuance of the final consensus will have a material impact on financial position, results of operations, or cash flows.
In December 2004, the FASB issued SFAS 153,Exchanges of Nonmonetary Assets, an amendment of APB Opinion No. 29,Accounting for Nonmonetary Transactions. This statement amends the principle that exchanges of nonmonetary assets should be measured based on the fair value of the assets exchanged and more broadly provides for exceptions regarding exchanges of nonmonetary assets that do not have commercial substance. This Statement is effective for nonmonetary asset exchanges occurring in fiscal periods beginning after June 15, 2005. The adoption of SFAS 153 is not expected to have a material impact on the Company’s financial position, results of operations or cash flows.
In December 2004, the FASB revised SFAS 123, Accounting for Stock-Based Compensation. SFAS 123R establishes accounting requirements for share-based compensation to employees and carries forward prior guidance on accounting for awards to non-employees. The provisions of this statement will become effective July 1, 2005 for all equity awards granted after the effective date. SFAS 123R requires an entity to recognize compensation expense based on an estimate of the number of awards expected to actually vest, exclusive of awards expected to be forfeited.The adoption of SFAS 123R is not expected to have a material impact on the Company’s financial position, results of operations or cash flows.
Reclassification
Certain 2003 and 2002 amounts have been reclassified to conform to the December 31, 2004 presentation.
(2) Acquisition:
The Bank completed the purchase of 100% of the capital stock issued and outstanding of Miller & Loughry Insurance and Services, Inc. (MLI&S) on January 4, 2002 for cash totaling approximately $2.0 million. MLI&S is an independent insurance agency located in Murfreesboro, Tennessee.
The consolidated statement of income of the Company for the year ended December 31, 2002, includes the results of operations for MLI&S from the January 4, 2002 acquisition date. The acquisition resulted in approximately $1.8 million of goodwill, of which no amount is deductible for tax purposes, and approximately $220,000 in an identified intangible asset for insurance contracts. The amount allocated to the identified intangible asset for insurance contracts was determined by an annual owner’s cash valuation method and is being amortized over the estimated useful life of eight years using a straight-line amortization method.
Cavalry Bancorp, Inc. and Subsidiaries
Notes to Consolidated Financial Statements (Continued)
December 31, 2004, 2003 and 2002
(2) Acquisition: (Continued)
The following table summarizes the estimated fair values of the assets acquired and liabilities assumed at the date of acquisition:
(Dollars in Thousands)
| Current assets | | $ | 250 | |
| Office equipment | | | 79 | |
| Total assets acquired | | | 329 | |
| Current liabilities | | | (324 | ) |
| Total liabilities assumed | | | (324 | ) |
| Net assets acquired | | $ | 5 | |
(3) Cash:
The Company is required to maintain cash on hand or in the Federal Reserve Bank account for various regulatory purposes. During 2004 and 2003, such required cash averaged approximately $5,158,000 and $8,165,000, respectively.
(4) Investment Securities Available-for-Sale:
The amortized cost and estimated fair values of investment securities available-for-sale at December 31, 2004 and 2003 are as follows:
| | | December 31, 2004 | |
| | | Amortized Cost | | Gross Unrealized Gains | | Gross Unrealized Losses | | Estimated Fair Value | |
| | | (Dollars in Thousands) | |
| | | | | | | | | | |
| Obligations of U.S. Government agencies | | $ | 9,297 | | | 1 | | | 3 | | | 9,295 | |
| Collateralized mortgage obligations and mortgage-backed securities | | | 29,459 | | | 32 | | | 227 | | | 29,264 | |
| State and political subdivisions | | | 3,195 | | | 18 | | | 14 | | | 3,199 | |
| Certificate of deposit | | | 100 | | | - | | | - | | | 100 | |
| Other security | | | 325 | | | - | | | - | | | 325 | |
| | | $ | 42,376 | | | 51 | | | 244 | | | 42,183 | |
| | | December 31, 2003 | |
| | | Amortized Cost | | Gross Unrealized Gains | | Gross Unrealized Losses | | Estimated Fair Value | |
| | | (Dollars in Thousands) | |
| | | | | | | | | | |
| Obligations of U.S. Government agencies | | $ | 50,132 | | | 95 | | | 107 | | | 50,120 | |
| Collateralized mortgage obligations and mortgage-backed securities | | | 4,579 | | | 13 | | | 14 | | | 4,578 | |
| Certificate of deposit | | | 100 | | | - | | | - | | | 100 | |
| Other security | | | 325 | | | - | | | - | | | 325 | |
| | | $ | 55,136 | | | 108 | | | 121 | | | 55,123 | |
Cavalry Bancorp, Inc. and Subsidiaries
Notes to Consolidated Financial Statements (Continued)
December 31, 2004, 2003 and 2002
(4) Investment Securities Available-for-Sale: (Continued)
The amortized cost and estimated fair value of investment securities available-for-sale at December 31, 2004 by contractual maturity, are shown below.
| | | Amortized Cost | | Estimated Fair Value | |
| | | (Dollars in Thousands) | |
Obligations of U.S. Government agencies, state and political subdivisions and certificate of deposit: | | | | | | | |
| Maturing within one year | | $ | 9,095 | | | 9,093 | |
| Maturing within one through five years | | | 780 | | | 771 | |
| Maturing within five through ten years | | | 2,717 | | | 2,730 | |
| | | | 12,592 | | | 12,594 | |
| | | | | | | | |
| Collateralized mortgage obligations and mortgage-backed securities | | | 29,459 | | | 29,264 | |
| Other security | | | 325 | | | 325 | |
| | | $ | 42,376 | | | 42,183 | |
| | | | | | | | |
The amortized cost and estimated fair value of investment securities available-for-sale at December 31, 2003 by contractual maturity, are shown below.
| | | Amortized Cost | | Estimated Fair Value | |
| | | (Dollars in Thousands) | |
| Obligations of U.S. Government agencies and certificate of deposit: | | | | | |
| Maturing within one year | | $ 7,163 | | 7,156 | |
| Maturing within one through five years | | 43,069 | | 43,064 | |
| | | 50,232 | | 50,220 | |
| | | | | | | | |
| Collateralized mortgage obligations and mortgage-backed securities | | | 4,579 | | | 4,578 | |
| Other security | | | 325 | | | 325 | |
| | | | | | | | |
| | | $ | 55,136 | | | 55,123 | |
The estimated fair value and unrealized loss amounts of temporarily impaired investments as of December 31, 2004 are as follows:
| | | Less than 12 months | | 12 months or longer | | Total | |
| | | Estimated Fair Value | | Unrealized Losses | | Estimated Fair Value | | Unrealized Losses | | Estimated Fair Value | | Unrealized Losses | |
| | | (Dollars in Thousands) | |
| Obligations of U.S. Government agencies | | $ | 5,308 | | $ | 3 | | $ | - | | $ | - | | $ | 5,308 | | $ | 3 | |
| Collateralized mortgage obligations and mortgage-backed securities | | | 22,768 | | | 220 | | | 1,459 | | | 7 | | | 24,227 | | | 227 | |
| State and political subdivisions | | | 1,736 | | | 14 | | | - | | | - | | | 1,736 | | | 14 | |
Management does not believe any individual unrealized loss as of December 31, 2004 represents an other-than-temporary impairment. These unrealized losses are primarily attributable to changes in interest rates and individually were 2% or less of their respective amortized cost basis. The Company has both the intent and ability to hold the securities contained in the previous table for a time necessary to recover the amortized cost.
Certain securities, with amortized cost of $28.1 million and estimated fair value of $28.0 million at December 31, 2004 and amortized cost and estimated fair value of $12.0 million at December 31, 2003, were pledged as collateral as permitted or required by law.
Cavalry Bancorp, Inc. and Subsidiaries
Notes to Consolidated Financial Statements (Continued)
December 31, 2004, 2003 and 2002
(4) Investment Securities Available-for-Sale: (Continued)
During 2004, the Company sold investment securities classified as available-for-sale for proceeds of $47.7 million resulting in gross gains of $95,000 and gross losses of $117,000. The Company sold investment securities classified as available-for-sale for proceeds of $2.5 million resulting in gross gains of $11,000 during 2003. The Company sold investment securities classified as available-for-sale for proceeds of $4.0 million resulting in gross gains of $20,000 during 2002.
(5) Investment Securities Held-to-Maturity:
During the year ended December 31, 2002, the Company sold investment securities classified as held-to-maturity with amortized cost of $433,000, resulting in gross realized losses of $16,000. These investment securities held-to-maturity were sold as a majority of the principal had been collected and with the increase in prepayments on mortgage loans, yields on these securities had reduced significantly and Management of the Company felt it prudent to utilize other investment opportunities. Management’s intent was to invest these funds in investment securities available-for-sale with shorter terms as the securities sold had on average 15 years remaining until maturity. As a result of the sales, one certificate of deposit classified as held-to-maturity was transferred to the available-for sale classification at its amortized cost of $100,000 as the amortized cost approximated estimated fair value at the time of the transfer. There were no investment securities held-to-maturity as of December 31, 2004 and 2003.
(6) Loans Receivable:
The composition of the loan portfolio as of December 31, 2004 and 2003 is presented as follows:
| | | 2004 | | 2003 | |
| | | (Dollars in Thousands) | |
| | | | | | |
| Commercial | | $ | 183,129 | | | 126,833 | |
| Real estate loans held for sale | | | 2,501 | | | 2,648 | |
| Real estate - mortgage | | | 112,244 | | | 120,927 | |
| Real estate - construction | | | 95,449 | | | 69,667 | |
| Installment and other consumer | | | 45,739 | | | 38,709 | |
| | | | 439,062 | | | 358,784 | |
| Less deferred loan fees, net | | | (1,172 | ) | | (1,199 | ) |
| Less allowance for loan losses | | | (4,863 | ) | | (4,525 | ) |
| | | $ | 433,027 | | | 353,060 | |
Loans serviced for the benefit of others totaled approximately $37.1 million, $40.9 million and $64.9 million at December 31, 2004, 2003 and 2002, respectively. Servicing loans for others generally consists of collecting mortgage payments, maintaining escrow amounts, disbursing payments to investors and foreclosure processing.
Qualified one-to-four family first mortgage loans are pledged to the Federal Home Loan Bank of Cincinnati as discussed in note 10.
Impaired loans and related valuation allowance amounts at December 31, 2004 and 2003 were as follows:
| | | 2004 | | 2003 | |
| | | (Dollars in Thousands) |
| | | | | | | | |
| Recorded investment | | $ | 2,566 | | | 2,225 | |
| Valuation allowance | | $ | 840 | | | 643 | |
The average recorded investment in impaired loans for the years ended December 31, 2004, 2003 and 2002 was $2,307,000, $4,419,000, and $4,156,000, respectively. Interest income recognized on impaired loans was not significant during the years ended December 31, 2004, 2003 and 2002.
Cavalry Bancorp, Inc. and Subsidiaries
Notes to Consolidated Financial Statements (Continued)
December 31, 2004, 2003 and 2002
(6) Loans Receivable: (Continued)
Activity in the allowance for loan losses consisted of the following:
| | | 2004 | | 2003 | | 2002 | |
| | | (Dollars in Thousands) | |
| | | | | | | | |
| Balance at beginning of period | | $ | 4,525 | | | 4,657 | | | 4,470 | |
| Provision for loan losses | | | 875 | | | 101 | | | 497 | |
| Recoveries | | | 62 | | | 103 | | | 186 | |
| Charge-offs | | | (599 | ) | | (336 | ) | | (496 | ) |
Balance at end of period | | $ | 4,863 | | | 4,525 | | | 4,657 | |
Non-accrual loans totaled approximately $748,000 and $859,000 at December 31, 2004 and 2003, respectively. Interest income foregone on such loans was not significant during the years ended December 31, 2004, 2003 and 2002. The Company is not committed to lend additional funds to borrowers whose loans have been placed on a non-accrual basis.
There were no loans three months or more past due which were still accruing interest as of December 31, 2004 and 2003.
The Company originates loans to officers and directors and their affiliates at terms substantially identical to those available to other borrowers. Mortgage and consumer loans to officers and directors and their affiliates at December 31, 2004 and 2003 were approximately $4,923,000 and $1,922,000, respectively. At December 31, 2004, funds committed that were undisbursed to officers and directors and their affiliates approximated $4,940,000.
The following summarizes activity of loans to officers and directors for the years ended December 31, 2004 and 2003:
| | | 2004 | | 2003 | |
| | | (Dollars in Thousands) | |
| | | | | | |
| Balance at beginning of period | | $ | 1,922 | | | 926 | |
| New loans | | | 11,324 | | | 4,758 | |
| Principal repayments | | | (8,323 | ) | | (3,762 | ) |
| | | | | | | | |
| Balance at end of period | | $ | 4,923 | | | 1,922 | |
(7) Office Properties and Equipment, Net:
Office properties and equipment, less accumulated depreciation and amortization, consisted of the following at December 31, 2004 and 2003:
| | | 2004 | | 2003 | |
| | (Dollars in Thousands) |
| | | | | | | | |
| Land | | $ | 3,855 | | | 3,864 | |
| Office buildings | | | 12,809 | | | 12,809 | |
| Furniture, fixtures, and equipment | | | 13,017 | | | 12,515 | |
| Leasehold improvements | | | 481 | | | 481 | |
| Automobiles | | | 109 | | | 109 | |
| Construction in process | | | 108 | | | 26 | |
| | | | 30,379 | | | 29,804 | |
| Less accumulated depreciation and amortization | | | 12,772 | | | 11,373 | |
Office properties and equipment, net | | $ | 17,607 | | | 18,431 | |
(8) Required Investment in Stock of Federal Home Loan Bank and Federal Reserve Bank:
The Bank is a member of the Federal Home Loan Bank (FHLB). As a member of this system, the Bank is required to maintain an investment in capital stock of the Federal Home Loan Bank of Cincinnati in an amount equal to the greater of 1% of residential mortgage loans and mortgage-backed securities, or .3% of total assets of the Bank. At December 31, 2004, no additional investments are required.
Cavalry Bancorp, Inc. and Subsidiaries
Notes to Consolidated Financial Statements (Continued)
December 31, 2004, 2003 and 2002
(8) Required Investment in Stock of Federal Home Loan Bank and Federal Reserve Bank: (Continued)
No ready market exists for the stock, and it has no quoted market value, but may be redeemed for face value by the FHLB if the Bank withdraws its membership. Accordingly, this investment is carried at the Bank’s historical cost.
Effective January 1, 2002, the Corporation and the Bank became members of the Federal Reserve System. Membership requirements for the Corporation and the Bank are set forth in Regulation Y and Regulation H, respectively. The Bank is required to own stock in the Federal Reserve Bank to be a member of the Federal Reserve System. No ready market exists for the stock, and it has no quoted market value, but may be redeemed for face value by the Federal Reserve Bank if the Bank withdraws its membership. Accordingly, this investment is carried at the Bank’s historical cost.
(9) Deposits:
Deposit account balances at December 31, 2004 and 2003, are summarized as follows:
| | | 2004 | | 2003 | |
| | | (Dollars in Thousands) | |
| | | | | | |
| Non-interest bearing | | $ | 81,719 | | | 72,443 | |
| Interest-bearing demand | | | 232,126 | | | 208,049 | |
| Savings deposits | | | 23,083 | | | 21,008 | |
| Certificates of deposit | | | 169,606 | | | 152,757 | |
| | | $ | 506,534 | | | 454,257 | |
The aggregate amount of certificates of deposit each with a minimum denomination of $100,000, was $76,166,000 and $61,887,000 as of December 31, 2004 and 2003, respectively.
The aggregate amount of overdrafts reclassified as loans receivable was $2.9 million and $2.4 million at December 31, 2004 and 2003, respectively.
As of December 31, 2004, the scheduled maturities of certificates of deposit were as follows:
Year Ended December 31 | | (Dollars in Thousands) | |
| 2005 | | $ | 93,421 | |
| 2006 | | | 36,875 | |
| 2007 | | | 17,362 | |
| 2008 | | | 12,596 | |
| 2009 | | | 9,342 | |
| Thereafter | | | 10 | |
| | | $ | 169,606 | |
Interest expense on deposit balances for the years ended December 31, 2004, 2003 and 2002 is summarized as follows:
| | | 2004 | | 2003 | | 2002 | |
| | | (Dollars in Thousands) | |
| | | | | | | | |
| Savings deposits | | $ | 43 | | | 64 | | | 77 | |
| Interest-bearing demand | | | 1,322 | | | 1,143 | | | 1,676 | |
| Certificates of deposit | | | 4,093 | | | 4,311 | | | 5,392 | |
| | | $ | 5,458 | | | 5,518 | | | 7,145 | |
Cavalry Bancorp, Inc. and Subsidiaries
Notes to Consolidated Financial Statements (Continued)
December 31, 2004, 2003 and 2002
(10) Advances from the Federal Home Loan Bank of Cincinnati:
FHLB advances are summarized as follows:
| | | December 31, | |
| | | 2004 | | 2003 | |
| Type of Advances | | Amount | | Weighted Average Rate | | Amount | | Weighted Average Rate | |
| | | (Dollars in Thousands, Except Percentages) | |
| | | | | | | | | | | | | | |
| Fixed-rate | | $ | 2,835 | | | 3.37 | % | | 2,889 | | | 3.38 | % |
Scheduled maturities of FHLB advances as of December 31, 2004 are as follows:
| Year Ended December 31, | | | Amount at Stated Maturity | |
| | | (Dollars in thousands) | |
| | | | | |
| 2005 | | $ | 54 | |
| 2006 | | | 1,054 | |
| 2007 | | | 1,054 | |
| 2008 | | | 54 | |
| 2009 | | | 54 | |
| Thereafter | | | 565 | |
| | | $ | 2,835 | |
The Bank has an approved line of credit of $50,000,000 at December 31, 2004 which is secured by a blanket agreement to maintain residential first mortgage loans with a principal value of 125% of the outstanding advances and has a variable interest rate. The Bank also has a standby letter of credit with the FHLB of $40,000,000, of which $25,000,000 has been issued as of December 31, 2004. The Company can increase its borrowings from the FHLB by $62,468,000 at December 31, 2004.
(11) Income Taxes:
The components of income tax expense (benefit) are as follows:
| | | 2004 | | 2003 | | 2002 | |
| Current income tax expense: | | (Dollars in Thousands) | |
| | | | | | | | | | | |
| Federal | | $ | 2,422 | | | 2,338 | | | 2,492 | |
| State | | | 502 | | | 527 | | | 504 | |
| Total current income tax expense | | | 2,924 | | | 2,865 | | | 2,996 | |
| Deferred income tax expense (benefit): | | | | | | | | | | |
| Federal | | | (327 | ) | | 89 | | | (93 | ) |
| State | | | (63 | ) | | 11 | | | (12 | ) |
| Total deferred income tax expense (benefit) | | | (390 | ) | | 100 | | | (105 | ) |
Income tax expense | | $ | 2,534 | | | 2,965 | | | 2,891 | |
The following table presents a reconciliation of the provision for income taxes as shown in the consolidated statements of income, with that which would be computed by applying the statutory federal income tax rate of 34% to income before income taxes.
Cavalry Bancorp, Inc. and Subsidiaries
Notes to Consolidated Financial Statements (Continued)
December 31, 2004, 2003 and 2002
(11) Income Taxes: (Continued)
| | | 2004 | | 2003 | | 2002 | |
| | | (Dollars in Thousands, Except Percentages) | |
| Tax expense at statutory rates | | $ | 1,007 | | | 34.0 | % | | 2,536 | | | 34.0 | | | 2,383 | | | 34.0 | |
| Increase (decrease) in taxes resulting from: | | | | | | | | | | | | | | | | | | | |
| State income tax, net of federal effect | | | 290 | | | 9.8 | | | 355 | | | 4.8 | | | 325 | | | 4.6 | |
| Nondeductible compensation | | | 1,325 | | | 44.7 | | | 291 | | | 3.9 | | | 303 | | | 4.3 | |
| Increase in bank owned life insurance | | | (100 | ) | | (3.4 | ) | | (132 | ) | | (1.8 | ) | | (143 | ) | | (2.0 | ) |
| Tax-free income | | | (26 | ) | | (0.9 | ) | | - | | | - | | | - | | | - | |
| Other, net | | | 38 | | | 1.3 | | | (85 | ) | | (1.1 | ) | | 23 | | | 0.2 | |
| | | | | | | | | | | | | | | | | | | | |
| Total income tax expense | | $ | 2,534 | | | 85.5 | % | | 2,965 | | | 39.8 | | | 2,891 | | | 41.1 | |
In years ended December 31, 1995 and prior, the Bank was allowed under the Internal Revenue Code to deduct, subject to certain conditions, an annual addition to a reserve for bad debts (reserve method) in determining taxable income. Legislation enacted in August 1996 repealed the reserve method effective for the Bank for the year ended December 31, 1996. Therefore, retained earnings at December 31, 2004 and 2003 includes approximately $2,861,000 which represents such bad debt deductions for which no deferred income taxes have been provided.
The tax effects of temporary differences that give rise to the significant portions of deferred tax assets and liabilities at December 31, 2004 and 2003, are as follows:
| | | 2004 | | 2003 | |
| | | (Dollars in Thousands) | |
| Deferred tax assets: | | | | | | | |
| Loans receivable, allowance for loan losses | | $ | 1,835 | | | 1,706 | |
| Deferred loan fees | | | 449 | | | 459 | |
| Deferred compensation | | | 444 | | | 314 | |
| ESOP limitation | | | 198 | | | - | |
| Other | | | 24 | | | 21 | |
Total deferred tax asset | | | 2,950 | | | 2,500 | |
Deferred tax liabilities: | | | | | | | |
| FHLB stock | | | 634 | | | 596 | |
| Office properties and equipment | | | 623 | | | 539 | |
| Other | | | 3 | | | 65 | |
Total deferred tax liability | | | 1,260 | | | 1,200 | |
Net deferred tax asset | | | 1,690 | | | 1,300 | |
SFAS 109,Accounting for Income Taxes, requires that the tax benefit of deductible temporary differences be recorded as an asset to the extent that management assesses the utilization of such temporary differences to be “more likely than not.” In accordance with SFAS 109, the realization of tax benefits of deductible temporary differences depends on whether the Company has sufficient taxable income within the carryback and carryforward period permitted by tax law to allow for utilization of the deductible amounts. Taxable income in the carryback period and estimates of taxable income in the carryforward period were expected to be sufficient to utilize such differences. As such, no valuation allowance was established at December 31, 2004 and 2003.
(12) Employee Benefit Plans:
401(k) Plan - The Company sponsors a 401(k) plan, which is available to all employees who meet minimum eligibility requirements. Participants may generally contribute up to 15% of earnings, and, in addition, management will match employee contributions up to 4%. Additionally, management may make a discretionary contribution up to 2% of employees’ earnings to the Plan on the employees’ behalf. For the year ended December 31, 2004, no discretionary contribution was made. Expense related to Company contributions amounted to $372,000, $476,000 and $356,000 in the years ended December 31, 2004, 2003 and 2002, respectively.
Employee Stock Ownership Plan - The Cavalry Banking Employee Stock Ownership Plan (ESOP) is a noncontributory retirement plan adopted by the Company effective January 1, 1998 which includes all employees who meet minimum eligibility requirements. The ESOP acquired 603,060 shares of the Corporation’s common stock at the time of conversion at a price of $10 per share with proceeds of a loan from the Corporation in the amount of approximately $6,031,000.
Cavalry Bancorp, Inc. and Subsidiaries
Notes to Consolidated Financial Statements (Continued)
December 31, 2004, 2003 and 2002
(12) Employee Benefit Plans: (Continued)
The Bank made periodic cash contributions to the ESOP in an amount sufficient for the ESOP to make the scheduled payments under the note payable to the Corporation. In connection with a cash distribution, the ESOP received approximately $4.5 million on its shares of the Corporation’s common stock. The ESOP purchased an additional 321,305 shares with the proceeds.
The off-balance sheet note payable had a term of 12 years, bore interest at 8.5% and required a level quarterly payment of principal and interest of approximately $202,000. The note was collateralized by the shares of common stock held by the ESOP. The note payable was paid in full during 2004, thereby releasing the remaining encumbered shares.
As the note was repaid, shares were released from collateral based on the proportion of the payment in relation to total payments required to be made on the loan. The shares released from collateral were then allocated to participants based upon compensation. Compensation expense was determined by multiplying the per share market price of the Corporation’s stock at the time the shares were committed to be released by the number of shares to be released. The value of the released shares was recorded at cost as a deduction to common stock and the value of the released shares at market was recorded as an addition or deduction to unallocated ESOP shares. The Company recognized approximately $6,516,000, $1,668,000, and $1,265,000 in compensation expense in the years ended December 31, 2004, 2003 and 2002, respectively, related to the ESOP of which approximately $2,373,000, $684,000 and $666,000 reduced the cost of unallocated ESOP shares and $4,143,000, $984,000 and $599,000 increased common stock on the balance sheets, respectively. Dividends on allocated ESOP shares of approximately $114,000, $82,000 and $65,000 were utilized to release unallocated shares. As a result of repayment of the note payable and release of the shares during 2004, the Company recorded a one-time, pre-tax charge of $5,144,000.
The cost of the unallocated shares was reflected as a reduction of equity. Unallocated shares were considered neither outstanding shares for computation of basic earnings per share nor potentially dilutive securities for computation of diluted earnings per share. Dividends on unallocated ESOP shares are reflected as a reduction in the note payable. Shares released or committed to be released for allocation during the years ended December 31, 2004 and 2003 totaled 361,812 and 105,870, respectively. At December 31, 2004, there were no shares remaining that were not released or committed to be released for allocation. At December 31, 2003, shares remaining that were not released or committed to be released for allocation totaled 361,812 and had a market value of approximately $6,397,000.
Supplemental Retirement Plan - During 2002, the Company adopted a nonqualified noncontributory Supplemental Retirement Plan (the “Retirement Plan”) for certain of the directors and executive officers of the Company and the Bank. The Company invests in and is the owner of single premium life insurance policies on the life of each participant and is the beneficiary of the policy value. When a participant retires, the accumulated gains on the policy allocated to such participant, if any, will be distributed to the participant in equal installments for 15 years (the “Primary Benefit”). In addition, any annual gains after the retirement date of the participant will be distributed on an annual basis for the lifetime of the participant (the “Secondary Benefit”). The vesting period for the Retirement Plan is the later of five years or an individual specified age.
The Retirement Plan also provides the participants with death benefits, which is a percentage of the net death proceeds for the policy, if any, applicable to the participant. The death benefits are not taxable to the Company or the participant’s beneficiary.
The Retirement Plan contains provisions that provide for certain accelerated payments upon a change of control of the Company. If a participant ceases to be an employee or director of the Bank prior to his normal retirement date but after a change of control, the Company will be obligated to pay the retirement benefits accrued under the Retirement Plan for the participants calculated as if the participant has reached his or her normal retirement age with the Company.
The Company recognized approximately $339,000, $515,000, and $315,000 in compensation expense in the years ended December 31, 2004, 2003 and 2002, respectively, related to the Retirement Plan.
(13) Stock Compensation Plans:
Stock Option Plan - On April 22, 1999, the Corporation's stockholders approved the Cavalry Bancorp, Inc. 1999 Stock Option Plan (SOP). The SOP allows the granting to management and directors the option to purchase common stock of the Corporation (options) aggregating to 753,825 shares. All employees and non-employee directors are eligible to participate in the SOP. Each option has a term of 10 years and the exercise price of each option is equal to the fair market value of the shares on the date of the grant. Options vest in equal installments over a five-year period.
Cavalry Bancorp, Inc. and Subsidiaries
Notes to Consolidated Financial Statements (Continued)
December 31, 2004, 2003 and 2002
(13) Stock Compensation Plans: (Continued)
In the event of a change in control of the Company, if provision is not made for the assumption of the options in connection with the change of control, the SOP provides for cash settlement of any outstanding options. During 2004, the Company accelerated the vesting of all unvested management and director stock options which resulted in a charge of approximately $138,000. This charge represents the value of shares that would have remained unexercised had the plan not been modified.
The following is an analysis of stock option activity:
| | | Options Available For Grant | | Options Outstanding | | Weighted Average Exercise Price | |
| | | | |
| Balance, December 31, 2002 | | | - | | | 752,883 | | $ | 10.09 | |
| | | | | | | | | | | |
| Exercised | | | - | | | (32,306 | ) | | 10.03 | |
| Forfeited | | | 24,230 | | | (24,230 | ) | | 9.99 | |
| | | | | | | | | | | |
| Balance, December 31, 2003 | | | 24,230 | | | 696,347 | | | 10.11 | |
| | | | | | | | | | | |
| Granted | | | (24,230 | ) | | 24,230 | | | 15.55 | |
| Exercised | | | - | | | (514,735 | ) | | 10.31 | |
| Forfeited | | | - | | | - | | | - | |
| Balance, December 31, 2004 | | | - | | | 205,842 | | | 10.26 | |
The following is a summary of stock options outstanding at December 31, 2004:
Exercise Price | Weighted Average Remaining Contractual Life (Years) | Options Outstanding | Options Exercisable |
| $ 10.63 | 6.0 | 92,688 | 92,688 |
| 10.00 | 6.6 | 46,999 | 46,999 |
| 9.75 | 6.6 | 62,575 | 62,575 |
| 13.00 | 7.5 | 3,580 | 3,580 |
| | 205,842 | 205,842 |
The weighted average fair value of options granted in the year ended December 31, 2004 was $2.78 per share. No options were granted during the year ended December 31, 2003. The weighted average fair value of options granted in the year ended December 31, 2002 was $1.97 per share. The fair value of the option grant is estimated on the date of grant using an option pricing model with the following assumptions:
| | Year Ended December 31, 2004 | Year Ended December 31, 2003 | Year Ended December 31, 2002 |
| Dividend yield | 1.54% | - | 1.42% |
| Risk-free interest rate | 3.48% | - | 4.78% |
| Expected volatility | 29% | - | 14% |
| Expected life (years) | 3 | - | 7 |
Cavalry Bancorp, Inc. and Subsidiaries
Notes to Consolidated Financial Statements (Continued)
December 31, 2004, 2003 and 2002
(14) Equity:
Liquidation Account
At the time of the conversion from mutual to a stock form of ownership, the Bank established a liquidation account for the benefit of eligible account holders who continue to maintain their accounts at the Bank after the conversion. The liquidation account is reduced annually to the extent that eligible account holders have reduced their qualifying deposits. Subsequent increases do not restore an eligible account holder’s interest in the liquidation account. In the event of a complete liquidation of the Bank, each eligible account holder is entitled to receive a distribution from the liquidation account in an amount proportionate to the current adjusted qualifying balances for accounts then held before any distribution may be made to the Corporation with respect to the Bank’s capital stock.
Dividends
The Corporation’s sources of income and funds for dividends to its stockholders are earnings on its investments and dividends from the Bank. Federal Reserve Board policy provides that a bank holding company should not pay dividends unless (i) the dividends can be fully funded out of net income from the company’s net earnings over the prior year and (ii) the prospective rate of earnings retention appears consistent with the Company’s (and its subsidiaries’) capital needs, asset quality and overall financial condition. Tennessee law provides that a state bank may not declare dividends in any calendar year that exceeds the total of its net income of that year combined with its retained net income of the preceding two years without the prior approval of the Commissioner of the Tennessee Department of Financial Institutions. In no case will the Bank be allowed to make a capital distribution reducing equity below the required balance of the liquidation account. The Bank paid dividends to the Corporation totaling $4,022,000 during the year ended December 31, 2004. No dividends were paid to the Corporation by the Bank during the years ended December 31, 2003 and 2002. On November 24, 2004, the Corporation declared a special dividend of $1.50, payable on January 3, 2005, to stockholders of record as of the close of business on December 17, 2004. Also on November 24, 2004, the Corporation declared the regular quarterly dividend in the amount of $0.07, payable January 14, 2005, to stockholders of record as of the close of business on December 31, 2004. These two declarations resulted in a dividend payable of approximately $11,332,000 as of December 31, 2004.
Federal Reserve Board policies also place restrictions on the Corporation with respect to repurchases of its common stock. With prior notice to the Federal Reserve Board, the Corporation is allowed to repurchase its outstanding shares. Prior to the Corporation’s charter conversion, the Corporation was regulated by the OTS which also placed restrictions of the repurchase of its common stock. During 2001, the Corporation requested and received regulatory approval to acquire 710,480 shares of its outstanding common stock. As of December 31, 2004, 435,219 shares had been repurchased at a cost of approximately $5,997,000. As of December 31, 2003, 303,176 shares had been repurchased at a cost of approximately $3,953,000. As of December 31, 2002, 275,064 shares had been repurchased at a cost of approximately $3,492,000.
(15) Regulatory Capital Requirements:
The Company (on a consolidated basis) and the Bank are subject to various regulatory capital requirements administered by the federal banking agencies. Failure to meet minimum capital requirements can initiate certain mandatory and possibly additional discretionary actions by regulators that, if undertaken, could have a direct material effect on the Company and the Bank’s financial statements. Under capital adequacy guidelines and the regulatory framework for prompt corrective action, the Company and the Bank must meet specific capital guidelines that involve quantitative measures of their assets, liabilities, and certain off-balance-sheet items as calculated under regulatory accounting practices. The capital amounts and classification are also subject to qualitative judgments by the regulators about components, risk weightings, and other factors. Prompt corrective action provisions are not applicable to bank holding companies.
Cavalry Bancorp, Inc. and Subsidiaries
Notes to Consolidated Financial Statements (Continued)
December 31, 2004, 2003 and 2002
(15) Regulatory Capital Requirements: (Continued)
Quantitative measures established by regulation to ensure capital adequacy require the Bank to maintain minimum amounts and ratios (set forth in the following table) of total and Tier 1 capital (as defined in the regulations) to risk-weighted assets (as defined) and of Tier 1 capital (as defined) to average assets (as defined). Management believes as of December 31, 2004 and 2003, that the Bank met all capital adequacy requirements to which it is subject to.
As of December 31, 2004, the most recent notification from the Federal Deposit Insurance Corporation categorized the Bank as well capitalized under the regulatory framework for prompt corrective action. To be categorized as well capitalized, an institution must maintain minimum total risk-based, Tier 1 risk-based and Tier 1 leverage ratios as set forth in the following tables. There are no conditions or events since the notification that management believes have changed the Bank’s category. The Company’s and Bank’s actual capital amounts and ratios as of December 31, 2004 and 2003 are presented in the table.
| | | Actual | | For Capital Adequacy Purposes | | To be Well Capitalized Under Prompt Corrective Action Provisions | |
| | | Amount | | Ratio | | Amount | | Ratio | | Amount | | Ratio | |
| | | (Dollars in Thousands, Except Percentages) | |
| As of December 31, 2004: | | | | | | | | | | | | | | | | | | | |
| Total risk-based capital(to risk-weighted assets) | | | | | | | | | | | | | | | | | | | |
| Bank | | $ | 49,872 | | | 11.3 | % | $ | 35,384 | | | 8.0 | % | $ | 44,230 | | | 10.0 | % |
| Company | | $ | 56,909 | | | 12.7 | % | $ | 35,728 | | | 8.0 | % | $ | 44,660 | | | 10.0 | % |
| Tier 1 risk-based capital(to risk-weighted assets) | | | | | | | | | | | | | | | | | | | |
| Bank | | $ | 45,005 | | | 10.2 | % | $ | 17,692 | | | 4.0 | % | $ | 26,538 | | | 6.0 | % |
| Company | | $ | 52,042 | | | 11.7 | % | $ | 17,864 | | | 4.0 | % | $ | 26,796 | | | 6.0 | % |
| Tier 1 risk-based capital(to adjusted total assets) | | | | | | | | | | | | | | | | | | | |
| Bank | | $ | 45,005 | | | 8.2 | % | $ | 21,953 | | | 4.0 | % | $ | 27,441 | | | 5.0 | % |
Company | | $ | 52,042 | | | 9.3 | % | $ | 22,451 | | | 4.0 | % | $ | 28,064 | | | 5.0 | % |
| | | | | | | | | | | | | | | | | | | | |
| As of December 31, 2003: | | | | | | | | | | | | | | | | | | | |
| Total risk-based capital(to risk-weighted assets) | | | | | | | | | | | | | | | | | | | |
| Bank | | $ | 48,962 | | | 13.8 | % | $ | 28,444 | | | 8.0 | % | $ | 35,556 | | | 10.0 | % |
| Company | | $ | 56,963 | | | 16.0 | % | $ | 28,579 | | | 8.0 | % | $ | 35,724 | | | 10.0 | % |
| Tier 1 risk-based capital(to risk-weighted assets) | | | | | | | | | | | | | | | | | | | |
| Bank | | $ | 44,517 | | | 12.5 | % | $ | 14,222 | | | 4.0 | % | $ | 21,333 | | | 6.0 | % |
| Company | | $ | 52,497 | | | 14.7 | % | $ | 14,290 | | | 4.0 | % | $ | 21,435 | | | 6.0 | % |
| Tier 1 risk-based capital(to adjusted total assets) | | | | | | | | | | | | | | | | | | | |
| Bank | | $ | 44,517 | | | 9.1 | % | $ | 19,673 | | | 4.0 | % | $ | 24,591 | | | 5.0 | % |
Company | | $ | 52,497 | | | 10.7 | % | $ | 19,568 | | | 4.0 | % | $ | 24,460 | | | 5.0 | % |
Cavalry Bancorp, Inc. and Subsidiaries
Notes to Consolidated Financial Statements (Continued)
December 31, 2004, 2003 and 2002
(16) Earnings Per Share:
Earnings per share of common stock are based on the weighted average number of basic shares and dilutive shares outstanding during the year.
The following is a reconciliation of weighted average common shares for the basic and diluted earnings per share computations:
| | | Years Ended December 31, | |
| | | 2004 | | 2003 | | 2002 | |
| | | | | | | | |
| Basic earnings per share: | | | | | | | | | | |
| Weighted average common shares | | | 6,536,801 | | | 6,407,030 | | | 6,427,576 | |
| | | | | | | | | | | |
| Diluted earnings per share: | | | | | | | | | | |
| Weighted average common shares | | | 6,536,801 | | | 6,407,030 | | | 6,427,576 | |
| Diluted effect of stock options | | | 242,383 | | | 254,810 | | | 163,983 | |
| | | | | | | | | | | |
| Weighted average common and incremental shares | | | 6,779,184 | | | 6,661,840 | | | 6,591,559 | |
(17) Financial Instruments with Off-Balance-Sheet Risk and Derivative Instruments:
The Company is a party to financial instruments with off-balance-sheet risk in the normal course of business to meet the financing needs of its customers and to reduce its own exposure to fluctuations in interest rates. These financial instruments include commitments to extend credit, standby letters of credit, and financial guarantees. Those instruments involve, to varying degrees, elements of credit and interest rate risk in excess of the amount recognized in the consolidated balance sheets. The contract or notional amounts of those instruments reflect the extent of involvement the Company has in particular classes of financial instruments.
The Company’s exposure to credit loss in the event of nonperformance by the other party to the financial instrument for commitments to extend credit and standby letters of credit and financial guarantees written is represented by the contractual notional amount of those instruments. The Company uses the same credit policies in making these commitments and conditional obligations as it does for on-balance-sheet instruments.
| | | December 31, | |
| | | 2004 | | 2003 | |
| | | (Dollars in Thousands) | |
| | | | | | |
| Commitments to extend credit | | $ | 93,406 | | | 75,092 | |
| Standby letters of credit | | | 8,261 | | | 7,457 | |
| Locked-rate mortgage loan commitments | | | 6,096 | | | 12,006 | |
| Mortgage loans sold subject to repurchase provisions | | | 10,201 | | | 17,500 | |
| Commitment to fund civic investment | | | - | | | 50 | |
Commitments to originate loans at December 31, 2004 were $53,187,000, composed of variable rate loans of approximately $41,549,000 and fixed rate loans of approximately $11,638,000. The fixed rate loans had interest rates ranging from 4.00% to 6.25%. Commitments to originate loans at December 31, 2003 were $40,862,000, composed of variable rate loans of approximately $29,839,000 and fixed rate loans of approximately $11,023,000. The fixed rate loans had interest rates ranging from 4.50% to 7.00%. Derivative instruments, consisting of locked-rate mortgage loan commitments to be sold at December 31, 2004 and 2003, were $6,096,000 and $12,006,000, composed of variable rate commitments of $260,000 and $659,000 and fixed rate commitments of $5,836,000 and $11,347,000, respectively. The fixed rate commitments had interest rates ranging from 4.63% and 5.25% to 7.38% and 7.50% for 2004 and 2003, respectively.
Cavalry Bancorp, Inc. and Subsidiaries
Notes to Consolidated Financial Statements (Continued)
December 31, 2004, 2003 and 2002
(17) Financial Instruments with Off-Balance-Sheet Risk and Derivative Instruments: (Continued)
Commitments to extend credit are agreements to lend to a customer as long as there is no violation of any condition established in the contract. Commitments generally have fixed expiration dates or other termination clauses and may require payment of a fee. Since many of the commitments are expected to expire without being drawn upon, the total commitment amounts do not necessarily represent future cash requirements. The Company evaluates each customer’screditworthiness on a case-by-case basis. The amount of collateral obtained, if deemed necessary by the Company upon extension of credit, is based on management’s credit evaluation of the counter-party. Collateral held varies but may include property, plant, and equipment and income-producing commercial properties.
Commitments to originate locked-rate loans to be sold are mortgage loan commitments which have not closed and funds have not been disbursed but have locked into an interest rate. These loans, once originated, are held for sale to a third-party investor.
Standby letters of credit are conditional commitments issued by the Company to guarantee the performance of a customer to a third party. Those guarantees are primarily issued to support public and private borrowing arrangements, including commercial paper, bond financing, and similar transactions. Most guarantees extend from one to two years. The credit risk involved in issuing letters of credit is essentially the same as that involved in extending loan facilities to customers. The fair value of standby letters of credit is estimated using the fees currently charged to enter into similar agreements, taking into account the remaining terms of the agreements, the likelihood of the counterparties drawing on such financial instruments and the present creditworthiness of such counterparties. Such commitments have been made on terms which are competitive in the markets in which the Company operates, thus, the fair value of standby letters of credit equals the carrying value for the purposes of this disclosure. The maximum potential amount of future payments that the Company could be required to make under the guarantees totaled $8.3 million at December 31, 2004.
(18) Fair Value of Financial Instruments:
Information about the fair value of the financial instruments in the consolidated balance sheets, which should be read in conjunction with Note 1 and certain other notes to the consolidated financial statements presented elsewhere herein, is set forth as follows:
| | | 2004 | | 2003 | |
| | | Carrying Amount | | Estimated Fair Value | | Carrying Amount | | Estimated Fair Value | |
| Financial assets: | | (Dollars in Thousands) | |
| | | | | | | | | | |
| Cash and cash equivalents | | $ | 63,135 | | | 63,135 | | | 70,913 | | | 70,913 | |
| Investment securities available-for-sale | | | 42,183 | | | 42,183 | | | 55,123 | | | 55,123 | |
| Loans held for sale | | | 2,501 | | | 2,501 | | | 2,648 | | | 2,648 | |
| Loans receivable, net | | | 430,526 | | | 428,892 | | | 350,412 | | | 355,834 | |
| Accrued interest receivable | | | 1,985 | | | 1,985 | | | 1,668 | | | 1,668 | |
| Required investment in stock of the Federal Home Loan Bank and Federal Reserve Bank | | | 3,125 | | | 3,125 | | | 2,992 | | | 2,992 | |
| Bank owned life insurance | | | 11,604 | | | 11,604 | | | 8,308 | | | 8,308 | |
Financial liabilities: | | | | | | | | | | | | | |
| Deposits with no stated maturity | | | 336,928 | | | 336,928 | | | 301,500 | | | 301,500 | |
| Certificates of deposit | | | 169,606 | | | 171,175 | | | 152,757 | | | 155,524 | |
| Advances from the FHLB | | | 2,835 | | | 2,720 | | | 2,889 | | | 2,840 | |
Off-balance sheet assets (liabilities): | | | | | | | | | | | | | |
| Unused lines of credit | | | - | | | - | | | - | | | - | |
| Standby letters of credit | | | - | | | - | | | - | | | - | |
| Commitments to extend credit | | | - | | | - | | | - | | | - | |
Cavalry Bancorp, Inc. and Subsidiaries
Notes to Consolidated Financial Statements (Continued)
December 31, 2004, 2003 and 2002
(19) Commitments and Contingencies:
In the normal course of the Company’s business, there are outstanding various commitments and contingent liabilities that have not been reflected in the consolidated financial statements. In the opinion of management, the financial position of the Company will not be affected materially as a result of such commitments and contingent liabilities.
The Company had operating lease agreements for two branch offices and certain equipment. The lease agreements for the two branch offices were terminated in 2004. Rental expense under these leases aggregated approximately $436,000, $338,000 and $249,000 for the years ended December 31, 2004, 2003 and 2002, respectively. The aggregate annual minimum equipment rental commitments under the terms of these noncancelable leases at December 31, 2004 are as follows:
| Years Ended December 31, | (Dollars in Thousands) |
| 2005 | $ 222 |
| 2006 | 113 |
| 2007 | 42 |
| 2008 | 15 |
| | $ 392 |
The Company has obligations to purchase services for data processing from a third-party that is enforceable and legally binding and all significant terms are specified. The estimated obligation to purchase such services for data processing from a third-party is approximately $2,982,000 through June 2007.
In the normal course of business, there are various outstanding legal proceedings. In the opinion of management, after consultation with legal counsel, the financial position of the Company will not be affected materially by the outcome of such legal proceedings.
The Company’s profitability depends to a large extent on its net interest income, which is the difference between interest income on loans and investments and interest expense on deposits and borrowings. Like most financial institutions, the Company’s interest income and interest expense are significantly affected by changes in market interest rates and other economic factors beyond its control. The Company’s interest earning assets consist primarily of mortgage loans and investments which adjust more slowly to changes in interest rates than its interest-bearing deposits. Accordingly, the Company’s earnings would be adversely affected during periods of rising interest rates.
The Corporation and the Bank have entered into Employment Agreements with two of the Bank’s executive officers, which provide certain benefits in the event of their termination following a change in control of the Corporation or the Bank. The Employment Agreements provide for an initial term of three years. On each anniversary of the commencement date of the Employment Agreements, the term of each agreement may be extended for an additional year at the discretion of the Board. In the event of a change in control of the Corporation or the Bank, as defined in the agreement, each executive officer will be entitled to a package of cash and/or benefits with a maximum value equal to 2.99 times their average annual compensation during the five-year period preceding the change in control.
The Corporation and the Bank have also entered into Severance Agreements with seven of the Bank’s senior officers, none of whom are covered by an Employment Agreement. Each agreement has an initial term of two years. On each anniversary of the commencement date of the Severance Agreements, the term of each agreement may be extended for an additional year at the discretion of the Board. In the event of a change in control of the Corporation or the Bank, as defined in the agreement, each senior officer will be entitled to a package of cash and/or benefits with a maximum value equal to 2.99 times their average annual compensation during the five-year period preceding the change in control.
Cavalry Bancorp, Inc. and Subsidiaries
Notes to Consolidated Financial Statements (Continued)
December 31, 2004, 2003 and 2002
(19) Commitments and Contingencies: (Continued)
The Corporation and the Bank have entered into a Key Employee Severance Compensation Plan to provide benefits to eligible key employees in the event of a change in control of the Corporation or the Bank. In general all officers except those who have entered into separate Employment or Severance Agreements with the Bank will be eligible to participate in the Severance Plan. In the event of a change in control of the Corporation or the Bank, eligible key employees who are terminated or who terminate employment within 12 months of the effective date of a change in control will be entitled to a payment based on years of service with the Bank, not to exceed an amount equal to three months of their then current compensation.
(20) Condensed Parent Company Only Financial Statements:
The following table presents the condensed balance sheets of the Corporation at December 31, 2004 and 2003, and the condensed statements of income and cash flows for the years ended December 31, 2004, 2003 and 2002:
| Condensed Balance Sheets: | | | | | |
| | | 2004 | | 2003 | |
| Assets: | | (Dollars in Thousands) |
| | | | | | | | |
| Cash and cash equivalents | | $ | 16,787 | | | 8,345 | |
| Investment in Bank | | | 14,983 | | | 11,815 | |
| Note receivable from Bank | | | - | | | 2,820 | |
| Other assets | | | 1,582 | | | 117 | |
Total assets | | $ | 33,352 | | | 23,097 | |
| | | | | | | | |
| Liabilities and Shareholders’ Equity: | | | | | | | |
| Other liabilities | | $ | 11,332 | | | 483 | |
| Shareholders’ equity | | | 22,020 | | | 22,614 | |
| Total liabilities and shareholders’ equity | | $ | 33,352 | | | 23,097 | |
| Condensed Statements of Income: | | | | | | | |
| | | 2004 | | 2003 | | 2002 | |
| | | (Dollars in Thousands) | |
| Investment income: | | | | | | | | | | |
| Interest income | | $ | 294 | | | 362 | | | 503 | |
| Dividend from Bank | | | 4,022 | | | - | | | - | |
| | | | 4,316 | | | 362 | | | 503 | |
| Interest expense | | | - | | | - | | | - | |
| Net interest income | | | 4,316 | | | 362 | | | 503 | |
| Non-interest expense | | | 342 | | | 331 | | | 353 | |
| | | | | | | | | | | |
| Income before income taxes and equity in undistributed earnings of the Bank | | | 3,974 | | | 31 | | | 150 | |
| Income tax expense (benefit) | | | (23 | ) | | 12 | | | 55 | |
| | | | | | | | | | | |
| Income before equity in undistributed earnings of Bank | | | 3,997 | | | 19 | | | 95 | |
| Equity in undistributed earnings (distribution in excess of earnings) of Bank | | | (3,568 | ) | | 4,475 | | | 4,022 | |
Net income | | $ | 429 | | | 4,494 | | | 4,117 | |
Cavalry Bancorp, Inc. and Subsidiaries
Notes to Consolidated Financial Statements (Continued)
December 31, 2004, 2003 and 2002
(20) Condensed Parent Company Only Financial Statements: (Continued)
| Condensed Statements of Cash Flows: | | | | | | | |
| | | 2004 | | 2003 | | 2002 | |
| | | (Dollars in Thousands) | |
| Cash flows from operating activities: | | | | | | | | | | |
| Net income | | $ | 429 | | | 4,494 | | | 4,117 | |
| Adjustments to reconcile net income to net cash provided by (used in) operating activities: | | | | | | | | | | |
| Equity in undistributed earnings of Bank | | | - | | | (4,475 | ) | | (4,022 | ) |
| Distributions in excess of earnings of Bank | | | 3,568 | | | - | | | - | |
| Loss on sale of investment securities, net | | | 21 | | | - | | | - | |
| Net amortization of investment securities premiums and discounts | | | 34 | | | - | | | - | |
| Tax benefit realized on exercise of non-qualified stock options | | | 1,523 | | | 107 | | | - | |
| Net change in other assets and liabilities | | | (1,530 | ) | | (87 | ) | | 162 | |
| | | | | | | | | | | |
| Net cash provided by (used in) operating activities | | | 4,045 | | | 39 | | | 257 | |
| | | | | | | | | | | |
| Cash flows from investing activities: | | | | | | | | | | |
| Purchases of investment securities available-for-sale | | | (3,688 | ) | | - | | | - | |
| Proceeds from sales of investment securities available-for-sale | | | 3,253 | | | - | | | - | |
| Proceeds from maturities of investment securities available-for-sale | | | 380 | | | - | | | - | |
| Investment in Bank | | | (87 | ) | | (97 | ) | | (109 | ) |
| Collection on notes receivable from Bank | | | 2,820 | | | 711 | | | 649 | |
| | | | | | | | | | | |
| Net cash provided by investing activities | | | 2,678 | | | 614 | | | 540 | |
| | | | | | | | | | | |
| Cash flows from financing activities: | | | | | | | | | | |
| Retirement of common stock | | | (2,044 | ) | | (461 | ) | | (3,221 | ) |
| Dividends paid | | | (1,542 | ) | | (1,333 | ) | | (1,287 | ) |
| Proceeds from exercise of stock options | | | 5,305 | | | 325 | | | 12 | |
| | | | | | | | | | | |
| Net cash provided by (used in) financing activities | | | 1,719 | | | (1,469 | ) | | (4,496 | ) |
| | | | | | | | | | | |
| Net increase (decrease) in cash and cash equivalents | | | 8,442 | | | (816 | ) | | (3,699 | ) |
| Cash and cash equivalents at beginning of year | | | 8,345 | | | 9,161 | | | 12,860 | |
| Cash and cash equivalents at end of year | | $ | 16,787 | | | 8,345 | | | 9,161 | |
| | | | | | | | | | | |
Cavalry Bancorp, Inc. and Subsidiaries
Notes to Consolidated Financial Statements (Continued)
December 31, 2004, 2003 and 2002
(21) Quarterly Results of Operations: (Unaudited)
Summarized unaudited quarterly operating results for the years ended December 31, 2004 and 2003 are as follows:
| | | First Quarter | | Second Quarter | | Third Quarter | | Fourth Quarter | |
| December 31, 2004: | �� | (Dollars in Thousands, Except Per Share Amounts) |
| | | | | | | | | | | | | | |
| Interest income | | $ | 5,711 | | | 5,960 | | | 6,482 | | | 6,915 | |
| Interest expense | | | 1,293 | | | 1,269 | | | 1,391 | | | 1,602 | |
| Net interest income | | | 4,418 | | | 4,691 | | | 5,091 | | | 5,313 | |
| Provision for loan losses | | | 101 | | | 75 | | | 176 | | | 523 | |
| Net interest income after provision for loan losses | | | 4,317 | | | 4,616 | | | 4,915 | | | 4,790 | |
| Non-interest income | | | 3,185 | | | 3,251 | | | 3,519 | | | 2,943 | |
| Non-interest expense | | | 5,759 | | | 5,946 | | | 5,961 | | | 10,907 | |
| Income (loss) before income taxes | | | 1,743 | | | 1,921 | | | 2,473 | | | (3,174 | ) |
| Income taxes | | | 727 | | | 754 | | | 994 | | | 59 | |
| Net income (loss) | | $ | 1,016 | | | 1,167 | | | 1,479 | | | (3,233 | ) |
| Basic earnings per share (note 16) | | $ | 0.16 | | | 0.18 | | | 0.23 | | | (0.48 | ) |
| Diluted earnings per share (note 16) | | $ | 0.15 | | | 0.17 | | | 0.22 | | | (0.48 | ) |
| Weighted average shares outstanding - basic (note 16) | | | 6,486,988 | | | 6,463,543 | | | 6,441,148 | | | 6,754,189 | |
| Weighted average shares outstanding - diluted (note 16) | | | 6,732,839 | | | 6,691,848 | | | 6,675,920 | | | 6,754,189 | |
| | | First Quarter | | Second Quarter | | Third Quarter | | Fourth Quarter | |
| December 31, 2003: | | (Dollars in Thousands, Except Per Share Amounts) |
| | | | | | | | | | | | | | |
| Interest income | | $ | 5,433 | | | 5,452 | | | 5,444 | | | 5,607 | |
| Interest expense | | | 1,543 | | | 1,424 | | | 1,328 | | | 1,321 | |
| Net interest income | | | 3,890 | | | 4,028 | | | 4,116 | | | 4,286 | |
| Provision for loan losses | | | 56 | | | 45 | | | - | | | - | |
| Net interest income after provision for loan losses | | | 3,834 | | | 3,983 | | | 4,116 | | | 4,286 | |
| Non-interest income | | | 3,619 | | | 4,015 | | | 4,058 | | | 2,919 | |
| Non-interest expense | | | 5,558 | | | 5,909 | | | 6,059 | | | 5,845 | |
| Income before income taxes | | | 1,895 | | | 2,089 | | | 2,115 | | | 1,360 | |
| Income taxes | | | 727 | | | 811 | | | 835 | | | 592 | |
| Net income | | $ | 1,168 | | | 1,278 | | | 1,280 | | | 768 | |
| Basic earnings per share (note 16) | | $ | 0.18 | | | 0.20 | | | 0.20 | | | 0.12 | |
| Diluted earnings per share (note 16) | | $ | 0.18 | | | 0.19 | | | 0.19 | | | 0.11 | |
| Weighted average shares outstanding - basic (note 16) | | | 6,365,767 | | | 6,392,100 | | | 6,418,261 | | | 6,450,933 | |
| Weighted average shares outstanding - diluted (note 16) | | | 6,579,436 | | | 6,694,136 | | | 6,713,772 | | | 6,729,532 | |
Cavalry Bancorp, Inc. and Subsidiaries
Notes to Consolidated Financial Statements (Continued)
December 31, 2004, 2003 and 2002
(22) Comprehensive Income:
SFAS 130,Reporting Comprehensive Income, established standards for reporting comprehensive income. Comprehensive income includes net income and other comprehensive net income which is defined as non-owner related transactions in shareholders’ equity. The following table sets forth the amounts of other comprehensive income (loss) included in shareholders’ equity along with the related tax effect for the years ended December 31, 2004, 2003 and 2002:
| | | Pre-Tax Amount | | (Expense) Benefit | | Net of Tax Amount | |
| December 31, 2004: | | (Dollars in Thousands) |
| | | | | | | | | | | |
| Unrealized holding losses for the period | | $ | (203 | ) | | 78 | | | (125 | ) |
| Less reclassification adjustment for losses included in net income | | | (23 | ) | | 9 | | | (14 | ) |
| Other comprehensive loss | | $ | (180 | ) | | 69 | | | (111 | ) |
| | | | | | | | | | | |
| December 31, 2003: | | | | | | | | | | |
| Unrealized holding losses for the period | | $ | (200 | ) | | 77 | | | (123 | ) |
| Less reclassification adjustment for gains included in net income | | | 11 | | | (4 | ) | | 7 | |
| Other comprehensive loss | | $ | (211 | ) | | 81 | | | (130 | ) |
| | | | | | | | | | | |
| December 31, 2002: | | | | | | | | | | |
| Unrealized holding losses for the period | | $ | (20 | ) | | 8 | | | (12 | ) |
| Less reclassification adjustment for gains included in net income | | | 20 | | | (8 | ) | | 12 | |
| Other comprehensive loss | | $ | (40 | ) | | 16 | | | (24 | ) |
(23) Business Segments:
The Company’s segments are identified by the products and services offered, principally distinguished as banking, trust, insurance and mortgage banking operations. One unrelated entity purchased approximately 50% of mortgage loans sold in 2004 and 2003.
Segment information is derived from the internal reporting system utilized by management with accounting policies and procedures consistent with those described in Note 1. Segment performance is evaluated by the Company based on profit or loss before income taxes. Revenue, expense and asset levels reflect those which can be specifically identified and those assigned based on internally developed allocation methods. These methods have been consistently applied.
Cavalry Bancorp, Inc. and Subsidiaries
Notes to Consolidated Financial Statements (Continued)
December 31, 2004, 2003 and 2002
(23) Business Segments: (Continued)
| 2004 | | Banking | | Mortgage Banking | | Trust | | Insurance | | Eliminations | | Consolidated | |
| | | (Dollars in Thousands) | |
| | | | | | | | | | | | | | |
| Interest revenue | | $ | 25,068 | | | - | | | - | | | 2 | | | (2 | ) | | 25,068 | |
| Other income - external customers | | | 6,886 | | | 186 | | | 1,097 | | | 2,055 | | | (99 | ) | | 10,125 | |
| Interest expense | | | 5,557 | | | - | | | - | | | - | | | (2 | ) | | 5,555 | |
| Depreciation and amortization | | | 1,459 | | | 154 | | | 67 | | | 31 | | | - | | | 1,711 | |
| Other significant items: | | | | | | | | | | | | | | | | | | | |
| Provision for loan losses | | | 875 | | | - | | | - | | | - | | | - | | | 875 | |
| Gain (loss) on sale of assets | | | (22 | ) | | 2,773 | | | - | | | - | | | - | | | 2,751 | |
| Segment profit (loss) | | | 2,928 | | | (218 | ) | | 189 | | | 249 | | | (185 | ) | | 2,963 | |
| Segment assets | | | 575,618 | | | 2,529 | | | 335 | | | 3,092 | | | (2,904 | ) | | 578,670 | |
| 2003 | | Banking | | Mortgage Banking | | Trust | | Insurance | | Eliminations | | Consolidated | |
| | | (Dollars in Thousands) | |
| | | | | | | | | | | | | | |
| Interest revenue | | $ | 21,936 | | | - | | | - | | | 2 | | | (2 | ) | | 21,936 | |
| Other income - external customers | | | 5,950 | | | 212 | | | 988 | | | 2,153 | | | (176 | ) | | 9,127 | |
| Interest expense | | | 5,618 | | | - | | | - | | | - | | | (2 | ) | | 5,616 | |
| Depreciation and amortization | | | 1,289 | | | 357 | | | 65 | | | 61 | | | - | | | 1,772 | |
| Other significant items: | | | | | | | | | | | | | | | | | | | |
| Provision for loan losses | | | 101 | | | - | | | - | | | - | | | - | | | 101 | |
| Gain on sale of assets | | | 11 | | | 5,473 | | | - | | | - | | | - | | | 5,484 | |
| Segment profit (loss) | | | 7,136 | | | (5 | ) | | 228 | | | 228 | | | (128 | ) | | 7,459 | |
| Segment assets | | | 511,080 | | | 2,896 | | | 332 | | | 2,801 | | | (1,937 | ) | | 515,172 | |
| 2002 | | Banking | | Mortgage Banking | | Trust | | Insurance | | Eliminations | | Consolidated | |
| | | (Dollars in Thousands) | |
| | | | | | | | | | | | | | |
| Interest revenue | | $ | 23,257 | | | - | | | - | | | 1 | | | (1 | ) | | 23,257 | |
| Other income-external customers | | | 5,117 | | | 237 | | | 1,086 | | | 1,769 | | | (86 | ) | | 8,123 | |
| Interest expense | | | 7,194 | | | - | | | - | | | - | | | (1 | ) | | 7,193 | |
| Depreciation and amortization | | | 1,149 | | | 258 | | | 58 | | | 49 | | | - | | | 1,514 | |
| Other significant items: | | | | | | | | | | | | | | | | | | | |
| Provisions for loan losses | | | 497 | | | - | | | - | | | - | | | - | | | 497 | |
| Gain on sale of assets | | | 94 | | | 3,401 | | | - | | | - | | | - | | | 3,495 | |
| Segment profit (loss) | | | 6,786 | | | (5 | ) | | 192 | | | 163 | | | (128 | ) | | 7,008 | |
| Segment assets | | | 445,895 | | | 17,990 | | | 373 | | | 2,577 | | | (2,470 | ) | | 464,365 | |
Board of Directors
Ed C. Loughry, Jr. Chairman and Chief Executive Officer Cavalry Banking | Gary Brown Vice Chairman of the Board President, Roscoe Brown, Inc. | Tim Durham Owner Durham Realty & Auction, Inc. | James C. Cope Attorney Murfree, Cope, Hudson & Scarlett |
Ronald F. Knight President and Chief Operating Officer Cavalry Banking | Kent Coleman Attorney Rucker, Rucker & Coleman | Terry G. Haynes Chief Executive Officer Haynes Bros. Lumber Co. | W.H. Huddleston, IV President Huddleston-Steele Engineering, Inc. |
Community Business Development Board
Golena Bell Murfreesboro City Schools | Walter C. Chitwood, Jr., DDS. Dentist | Stephen H. Farrer Farrer Construction Company | Monica Floyd The Guidance Center |
Chip Haynes Jennings & Ayers Funeral Home | Kathy Hoover Daily News Journal | John C. Jones, III Coldwell Banker Snow & Wall | Thomas P. Landers Landers Tire |
Carl Montgomery Comas Montgomery Realty & Auction | Shannon Parsons Woodfin Memorial Chapel | Joey Peay Murfreesboro Medical Clinic | Candy Roberts Middle Tennessee Association of Realtors |
Claire P. Tuma Homemaker | David Weaver, DMV Brogli Lane Weaver Animal Hospital | Davis Young Murfreesboro Pure Milk Co. | |
Corporate Officers
Senior Officers
Ed C. Loughry, Jr. Chairman & Chief Executive Officer | Ronald F. Knight President & Chief Operating Officer | William S. Jones Executive Vice President & Chief Administrative Officer | Hillard C. Gardner, CPA Senior Vice President & Chief Financial Officer | R. Dale Floyd Senior Vice President |
David W. Hopper Senior Vice President & Trust Officer | M. Glenn Layne Senior Vice President | Joy B. Jobe Senior Vice President | Ira B. Lewis, Jr. Senior Vice President | |
Vice Presidents
Barry Allen | Rodney G. Barrett | William T. (Bill) Bell | Pam H. Bullock | Gena Dix |
Donna K. Davis | Linda F. Eakes | P. David Edwards | Gary E. Green, CPA Controller | Peggy A. Hollandsworth |
Billy Jakes | Jane H. Lester | E. Cannon Loughry, III Chief Information Officer | Marsha Saalfeld | Mary W. Schneider |
Rhonda P. Smith | James O. Sweeney, III | Cheryl White | Roger D. White | |
Assistant Vice Presidents
Catherine L. Braswell, CPA | Lisa Burkhart | Jimmy Craig | Jo Ann Fann | W. Alan Gauger |
Donna Gregory | James V. Gregory | Andy Herzer | Robert R. Jacobs | John L. Kea, II |
Lisa R. Knight | Steve Loughlin | Laura MacDermott | Cindy S. May | Suzanne S. McClaran |
Deborah K. Morgan | Randy Odom | Lyndell L. Parks | Vallie M. Reed | Charles H. Simmons |
Bruce Simms | Mickey Rumsey | Wendy C. Tompkins | Debbie L. Vaughn | James Vinson |
James Terry Walker, II | Mary Beth Wilson | | | |
Banking Officers
M. Garth Bentley | Rebecca L. Bratcher | Linda Bucy | Chad M. Butler | Peggy F. Gilbert |
Carrolyn A. Gilley | Julie Haun | Jane K. Lewellen | Gale D. Magee | Barb Moser |
Karen B. Messick | | | | |
Miller & Loughry Insurance and Services, Inc
W. Ken Halliburton, Jr. | Edward E. Miller, III |