SECURITIES AND EXCHANGE COMMISSION
Washington, D.C. 20549
FORM 6-K
Report of Foreign Private Issuer
Pursuant to Rule 13a-16 or 15d-16 of the
Pursuant to Rule 13a-16 or 15d-16 of the
Securities Exchange Act of 1934
For the month of June, 2020
Commission File Number 1-14732COMPANHIA SIDERÚRGICA NACIONAL
(Exact name of registrant as specified in its charter)
National Steel Company
(Translation of Registrant's name into English)
Av. Brigadeiro Faria Lima 3400, 20º andar
São Paulo, SP, Brazil
04538-132
São Paulo, SP, Brazil
04538-132
(Address of principal executive office)
Indicate by check mark whether the registrant files or will file annual reports
under cover Form 20-F or Form 40-F. Form 20-F ___X___ Form 40-F _______
under cover Form 20-F or Form 40-F. Form 20-F ___X___ Form 40-F _______
Indicate by check mark whether the registrant by furnishing the information contained in this Form is also thereby furnishing the information to the Commission pursuant to Rule 12g3-2(b) under the Securities Exchange Act of 1934.
Yes _______ No ___X____CONVENIENCE TRANSLATION INTO ENGLISH FROM THE ORIGINAL PREVIOUSLY ISSUED IN PORTUGUESE
Quarterly Financial Information - March 31, 2020 – CIA SIDERURGICA NACIONAL | Version: 1 |
Table of Contents
Company Information |
|
Capital Breakdown | 1 |
Parent Company Financial Statements |
|
Balance Sheet – Assets | 2 |
Balance Sheet – Liabilities | 3 |
Statement of Income | 4 |
Statement of Comprehensive Income | 5 |
Statement of Cash Flows | 6 |
Statement of Changes in Shareholders’ Equity |
|
01/01/2020 to 03/31/2020 | 7 |
01/01/2019 to 03/31/2019 | 8 |
Statement of Value Added | 9 |
Consolidated Financial Statements |
|
Balance Sheet - Assets | 10 |
Balance Sheet - Liabilities | 11 |
Statement of Income | 12 |
Statement of Comprehensive Income | 13 |
Statement of Cash Flows | 14 |
Statement of Changes in Shareholders’ Equity |
|
01/01/2020 to 03/31/2020 | 15 |
01/01/2019 to 03/31/2019 | 16 |
Statement of Value Added | 17 |
Comments on the Company’s Consolidated Performance | 18 |
Notes to the quarterly financial information | 34 |
Comments on the Performance of Business Projections | 82 |
Reports and Statements |
|
Unqualified Independent Auditors’ Review Report | 85 |
Officers Statement on the Financial Statements | 87 |
Officers Statement on Auditor’s Report | 88 |
CONVENIENCE TRANSLATION INTO ENGLISH FROM THE ORIGINAL PREVIOUSLY ISSUED IN PORTUGUESE
Quarterly Financial Information - March 31, 2020 – CIA SIDERURGICA NACIONAL | Version: 1 |
Company Information / Capital Breakdown
Number of Shares (Units) | Current Quarter 03/31/2020 |
|
Paid-in Capital |
|
|
Common | 1,387,524,047 |
|
Preferred | 0 |
|
Total | 1,387,524,047 |
|
Treasury Shares |
|
|
Common | 7,409,500 |
|
Preferred | 0 |
|
Total | 7,409,500 |
|
Page 1
CONVENIENCE TRANSLATION INTO ENGLISH FROM THE ORIGINAL PREVIOUSLY ISSUED IN PORTUGUESE
Quarterly Financial Information - March 31, 2020 – CIA SIDERURGICA NACIONAL | Version: 1 |
Parent Company Financial Statements / Balance Sheet - Assets | |||
(R$ thousand) | |||
Code | Description | Current Quarter 03/31/2020 | Previous Year 12/31/2019 |
1 | Total Assets | 46,214,834 | 44,814,611 |
1.01 | Current assets | 9,986,891 | 9,719,866 |
1.01.01 | Cash and cash equivalents | 1,425,986 | 392,107 |
1.01.02 | Financial investments | 1,639,699 | 2,596,424 |
1.01.02.01 | Financial investments measured a fair value through profit or loss | 1,152,266 | 2,114,620 |
1.01.02.01.03 | Financial investments measured a fair value through profit or loss – Usiminas’ shares | 1,152,266 | 2,114,620 |
1.01.02.03 | Financial investments at amortized cost | 487,433 | 481,804 |
1.01.03 | Trade receivables | 2,053,614 | 1,691,643 |
1.01.04 | Inventory | 3,470,304 | 3,736,716 |
1.01.08 | Other current assets | 1,397,288 | 1,302,976 |
1.01.08.03 | Others | 1,397,288 | 1,302,976 |
1.01.08.03.01 | Recoverable taxes | 1,208,099 | 1,129,584 |
1.01.08.03.02 | Prepaid expenses | 103,720 | 82,664 |
1.01.08.03.03 | Dividends receivable | 33,351 | 33,447 |
1.01.08.03.04 | Others | 52,118 | 57,281 |
1.02 | Non-current assets | 36,227,943 | 35,094,745 |
1.02.01 | Long-term assets | 7,299,609 | 7,374,332 |
1.02.01.03 | Financial investments at amortized cost | 121,027 | 95,719 |
1.02.01.07 | Deferred taxes assets | 2,435,855 | 2,435,551 |
1.02.01.10 | Other non-current assets | 4,742,727 | 4,843,062 |
1.02.01.10.03 | Recoverable taxes | 1,746,032 | 1,907,420 |
1.02.01.10.04 | Judicial deposits | 223,398 | 224,300 |
1.02.01.10.05 | Prepaid expenses | 98,731 | 110,099 |
1.02.01.10.06 | Receivable from related parties | 1,648,448 | 1,558,194 |
1.02.01.10.07 | Others | 1,026,118 | 1,043,049 |
1.02.02 | Investments | 18,614,972 | 17,402,191 |
1.02.02.01 | Equity interest | 18,468,033 | 17,316,463 |
1.02.02.02 | Investment Property | 146,939 | 85,728 |
1.02.03 | Property, plant and equipment | 10,263,175 | 10,266,084 |
1.02.03.01 | Property, plant and equipment in operation | 10,224,167 | 10,221,911 |
1.02.03.02 | Right of use in leases | 39,008 | 44,173 |
1.02.04 | Intangible assets | 50,187 | 52,138 |
Page 2
CONVENIENCE TRANSLATION INTO ENGLISH FROM THE ORIGINAL PREVIOUSLY ISSUED IN PORTUGUESE
Quarterly Financial Information - March 31, 2020 – CIA SIDERURGICA NACIONAL | Version: 1 |
Parent Company Financial Statements / Balance Sheet – Liabilities | |||
(R$ thousand) | |||
Code | Description | Current Quarter 03/31/2020 | Previous Year 12/31/2019 |
2 | Total Liabilities | 46,214,834 | 44,814,611 |
2.01 | Current liabilities | 9,293,987 | 9,224,591 |
2.01.01 | Payroll and related taxes | 156,175 | 170,792 |
2.01.02 | Trade payables | 2,833,119 | 2,506,244 |
2.01.03 | Tax payables | 84,615 | 78,911 |
2.01.04 | Borrowings and financing | 4,299,929 | 4,396,840 |
2.01.05 | Other payables | 1,882,455 | 2,019,788 |
2.01.05.02 | Others | 1,882,455 | 2,019,788 |
2.01.05.02.04 | Dividends and interests on shareholder´s equity | 13,116 | 13,252 |
2.01.05.02.05 | Advances from clients | 64,046 | 72,404 |
2.01.05.02.06 | Trade payables – Drawee risk | 937,576 | 1,121,312 |
2.01.05.02.07 | Lease liabilities | 14,897 | 17,269 |
2.01.05.02.08 | Other payables | 852,820 | 795,551 |
2.01.06 | Provisions | 37,694 | 52,016 |
2.01.06.01 | Provision for tax, social security, labor and civil risks | 37,694 | 52,016 |
2.02 | Non-current liabilities | 32,750,837 | 25,415,476 |
2.02.01 | Borrowings and financing | 25,608,213 | 19,702,620 |
2.02.02 | Other payables | 428,804 | 356,942 |
2.02.02.02 | Others | 428,804 | 356,942 |
2.02.02.02.03 | Lease liabilities | 26,078 | 28,671 |
2.02.02.02.04 | Derivative financial instruments | 94,909 | - |
2.02.02.02.05 | Other payables | 307,817 | 328,271 |
2.02.04 | Provisions | 6,713,820 | 5,355,914 |
2.02.04.01 | Provision for tax, social security, labor and civil risks | 374,935 | 370,703 |
2.02.04.02 | Other provisions | 6,338,885 | 4,985,211 |
2.02.04.02.03 | Provision for environmental liabilities and decommissioning of assets | 175,875 | 164,464 |
2.02.04.02.04 | Pension and healthcare plan | 912,184 | 912,184 |
2.02.04.02.05 | Provision for losses on investments | 5,250,826 | 3,908,563 |
2.03 | Shareholders’ equity | 4,170,010 | 10,174,544 |
2.03.01 | Share Capital | 4,540,000 | 4,540,000 |
2.03.02 | Capital reserves | 32,720 | 32,720 |
2.03.04 | Profit reserves | 4,431,200 | 4,431,200 |
2.03.04.01 | Legal reserve | 278,576 | 278,576 |
2.03.04.02 | Earnings reserves | 4,210,888 | 4,210,888 |
2.03.04.09 | Treasury shares | (58,264) | (58,264) |
2.03.05 | Accumulated profit/(losses) | (1,360,851) | - |
2.03.08 | Other comprehensive income | (3,473,059) | 1,170,624 |
Page 3
CONVENIENCE TRANSLATION INTO ENGLISH FROM THE ORIGINAL PREVIOUSLY ISSUED IN PORTUGUESE
Quarterly Financial Information - March 31, 2020 – CIA SIDERURGICA NACIONAL | Version: 1 |
Parent Company Financial Statements / Statement of Income (R$ thousand) | |||
Code | Description | Year to date 01/01/2020 to 31/03/2020 | YTD previous year 01/01/2019 to 31/03/2019 |
3.01 | Revenues from sale of goods and rendering of services | 3,031,309 | 3,021,217 |
3.02 | Costs from sale of goods and rendering of services | (2,778,380) | (2,833,088) |
3.03 | Gross profit | 252,929 | 188,129 |
3.04 | Operating (expenses)/income | (1,262,912) | 308,308 |
3.04.01 | Selling expenses | (162,239) | (120,144) |
3.04.02 | General and administrative expenses | (50,192) | (56,117) |
3.04.04 | Other operating income | 74,847 | 219,694 |
3.04.05 | Other operating expenses | (534,638) | (284,595) |
3.04.06 | Equity in results of affiliated companies | (590,690) | 549,470 |
3.05 | Profit before financial income (expenses) and taxes | (1,009,983) | 496,437 |
3.06 | Financial income (expenses) | (351,172) | (458,764) |
3.06.01 | Financial income | 53,376 | 101,370 |
3.06.02 | Financial expenses | (404,548) | (560,134) |
3.06.02.01 | Net exchange differences over financial instruments | 931,016 | (72,099) |
3.06.02.02 | Financial expenses | (1,335,564) | (488,035) |
3.07 | Profit (loss) before taxes | (1,361,155) | 37,673 |
3.08 | Income tax and social contribution | 304 | (45,245) |
3.09 | Profit (loss) from continued operations | (1,360,851) | (7,572) |
3.11 | Profit (loss) for the year | (1,360,851) | (7,572) |
3.99 | Earnings per share – (Reais / Share) | - | - |
3.99.01 | Basic earnings per share | - | - |
3.99.01.01 | Common shares | (0.98604) | (0.00551) |
3.99.02 | Diluted earnings per share | - | - |
3.99.02.01 | Common shares | (0.98604) | (0.00551) |
Page 4
CONVENIENCE TRANSLATION INTO ENGLISH FROM THE ORIGINAL PREVIOUSLY ISSUED IN PORTUGUESE
Quarterly Financial Information - March 31, 2020 – CIA SIDERURGICA NACIONAL | Version: 1 |
Parent Company Financial Statements / Statement of Comprehensive Income | |||
(R$ thousand) | |||
Code | Description | Year to date 01/01/2020 to 31/03/2020 | YTD previous year 01/01/2019 to 31/03/2019 |
4.01 | (Loss) profit for the year | (1,360,851) | (7,572) |
4.02 | Other comprehensive income | (4,643,683) | 150,183 |
4.02.01 | Actuarial gains over pension plan of subsidiaries, net of taxes | 31 | 30 |
4.02.02 | Cumulative translation adjustments for the year | 380,042 | (21,804) |
4.02.04 | Losses in cash flow hedge | (5,390,043) | (18,440) |
4.02.05 | Cash flow hedge reclassified to income upon realization | 364,818 | 184,217 |
4.02.06 | Gain (Loss) on net investment hedge from investments in subsidiaries | 1,469 | 6,180 |
4.03 | Comprehensive income for the year | (6,004,534) | 142,611 |
Page 5
CONVENIENCE TRANSLATION INTO ENGLISH FROM THE ORIGINAL PREVIOUSLY ISSUED IN PORTUGUESE
Quarterly Financial Information - March 31, 2020 – CIA SIDERURGICA NACIONAL | Version: 1 |
Parent Company Financial Statements / Statements of Cash Flows – Indirect Method (R$ thousand) | |||
Code | Description | Year to date 01/01/2020 to 31/03/2020 | YTD previous year 01/01/2019 to 31/03/2019 |
6.01 | Net cash from operating activities | (43,913) | (948,165) |
6.01.01 | Cash from operations | 145,068 | 82,028 |
6.01.01.01 | Profit (loss) for the period | (1,360,851) | (7,572) |
6.01.01.02 | Financial charges in borrowing and financing raised | 276,982 | 349,039 |
6.01.01.03 | Financial charges in borrowing and financing granted | (16,540) | (12,414) |
6.01.01.04 | Charges on lease liabilities | 956 | 965 |
6.01.01.05 | Equity in results of affiliated companies | 590,690 | (549,470) |
6.01.01.06 | Deferred tax | (304) | 45,256 |
6.01.01.07 | Provision for tax, social security, labor, civil and environmental risks | (10,090) | (69,429) |
6.01.01.08 | Monetary and exchange variations, net | (547,893) | 259,413 |
6.01.01.09 | Write-off of property, plant and equipment and Intangible assets | - | 13,542 |
6.01.01.10 | Provision for environmental liabilities and decommissioning of assets | 11,411 | (5,158) |
6.01.01.11 | Updated shares – Fair value through profit or loss | 962,561 | (127,653) |
6.01.01.12 | Depreciation, amortization and depletion | 209,495 | 158,007 |
6.01.01.13 | Accrued/(reversal) for consumption and services | 21,527 | 19,504 |
6.01.01.16 | Others provisions | 7,124 | 7,998 |
6.01.02 | Changes in assets and liabilities | (188,981) | (1,030,193) |
6.01.02.01 | Trade receivables - third parties | (19,768) | 16,862 |
6.01.02.02 | Trade receivables - related parties | (394,990) | (275,407) |
6.01.02.03 | Inventories | 266,412 | (371,991) |
6.01.02.04 | Receivables - related parties/dividends | 814 | (635) |
6.01.02.05 | Tax assets | 82,873 | (54,342) |
6.01.02.06 | Judicial deposits | 902 | (11,405) |
6.01.02.09 | Trade payables | 326,875 | (118,919) |
6.01.02.10 | Trade payables – Drawee Risk | (183,736) | 235,181 |
6.01.02.11 | Payroll and related taxes | (14,616) | 4,512 |
6.01.02.12 | Taxes in installments – REFIS | 5,679 | (65,858) |
6.01.02.13 | Payables to related parties | 113,756 | (6,136) |
6.01.02.14 | Advance with related parties | (20,289) | - |
6.01.02.15 | Interest paid | (268,170) | (368,593) |
6.01.02.16 | Interest received | 198 | - |
6.01.02.19 | Others | (84,921) | (13,462) |
6.02 | Net cash investment activities | (297,419) | (104,805) |
6.02.01 | Investments / AFAC / Acquisitions of Shares | (2,180) | (4,847) |
6.02.02 | Purchase of property, plant and equipment and intangible assets | (196,628) | (158,189) |
6.02.05 | Intercompany loans granted | (98,614) | (49,698) |
6.02.06 | Intercompany loans received | 4,076 | - |
6.02.08 | Financial Investments, net of redemption | (4,073) | 107,929 |
6.03 | Net cash used in financing activities | 1,375,211 | 807,103 |
6.03.01 | Borrowings and financing raised | 80,744 | 2,246,890 |
6.03.02 | Transactions cost - Borrowings and financing | (1,980) | (28,810) |
6.03.03 | Borrowings and financing – related parties | 2,205,145 | 1,581,639 |
6.03.04 | Amortization of borrowings and financing | (889,247) | (2,763,750) |
6.03.05 | Amortization of borrowings and financing - related parties | (13,053) | (222,553) |
6.03.06 | Amortization of leases | (6,262) | (6,313) |
6.03.07 | Dividends and interest on shareholder’s equity | (136) | - |
6.05 | Increase (decrease) in cash and cash equivalents | 1,033,879 | (245,867) |
6.05.01 | Cash and equivalents at the beginning of the year | 392,107 | 539,853 |
6.05.02 | Cash and equivalents at the end of the year | 1,425,986 | 293,986 |
Page 6
CONVENIENCE TRANSLATION INTO ENGLISH FROM THE ORIGINAL PREVIOUSLY ISSUED IN PORTUGUESE
Quarterly Financial Information - March 31, 2020 – CIA SIDERURGICA NACIONAL | Version: 1 |
Parent Company Financial Statements / Statement of Changes in Equity - 01/01/2020 to 03/31/2020 (R$ thousand) | |||||||
Code | Description | Paid-in capital | Capital reserve, granted options and treasury shares | Earnings reserve | Retained earnings (accumulated losses) | Other comprehensive income | Shareholders’ equity |
5.01 | Opening balances | 4,540,000 | 32,720 | 4,431,200 | - | 1,170,624 | 10,174,544 |
5.03 | Adjusted opening balances | 4,540,000 | 32,720 | 4,431,200 | - | 1,170,624 | 10,174,544 |
5.05 | Total comprehensive income | - | - | - | (1,360,851) | (4,643,683) | (6,004,534) |
5.05.01 | Profit (loss) for the period | - | - | - | (1,360,851) | - | (1,360,851) |
5.05.02 | Other comprehensive income | - | - | - | - | (4,643,683) | (4,643,683) |
5.05.02.04 | Translation adjustments for the year | - | - | - | - | 380,042 | 380,042 |
5.05.02.06 | Actuarial gains/(losses) on pension plan, net of taxes | - | - | - | - | 31 | 31 |
5.05.02.07 | (Loss) / gain on the percentage change in investments | - | - | - | - | (5,025,225) | (5,025,225) |
5.05.02.08 | (Loss) / gain on cash flow hedge accounting, net of taxes | - | - | - | - | 1,469 | 1,469 |
5.07 | Closing balance | 4,540,000 | 32,720 | 4,431,200 | (1,360,851) | (3,473,059) | 4,170,010 |
Page 7
CONVENIENCE TRANSLATION INTO ENGLISH FROM THE ORIGINAL PREVIOUSLY ISSUED IN PORTUGUESE
Quarterly Financial Information - March 31, 2020 – CIA SIDERURGICA NACIONAL | Version: 1 |
Parent Company Financial Statements / Statement of Changes in Equity - 01/01/2019 to 03/31/2019 | |||||||||||
(R$ thousand) | |||||||||||
Code | Description | Paid-in capital | Capital reserve, granted options and treasury shares | Earnings reserve | Retained earnings (accumulated losses) | Other comprehensive income | Shareholders’ equity | ||||
5.01 | Opening balances | 4,540,000 | 32,720 | 3,064,827 | - | 1,065,188 | 8,702,735 | ||||
5.03 | Adjusted opening balances | 4,540,000 | 32,720 | 3,064,827 | - | 1,065,188 | 8,702,735 | ||||
5.05 | Total comprehensive income | - | - | - | (7,572) | 150,183 | 142,611 | ||||
5.05.01 | Profit (loss) for the period | - | - | - | (7,572) | - | (7,572) | ||||
5.05.02 | Other comprehensive income | - | - | - | - | 150,183 | 150,183 | ||||
5.05.02.04 | Translation adjustments for the year | - | - | - | - | (21,804) | (21,804) | ||||
5.05.02.06 | Actuarial gains/(losses) on pension plan, net of taxes | - | - | - | - | 30 | 30 | ||||
5.05.02.07 | (Loss) / gain on the percentage change in investments | - | - | - | - | 165,777 | 165,777 | ||||
5.05.02.08 | (Loss) / gain on cash flow hedge accounting, net of taxes | - | - | - | - | 6,180 | 6,180 | ||||
5.07 | Closing balance | 4,540,000 | 32,720 | 3,064,827 | (7,572) | 1,215,371 | 8,845,346 | ||||
Page 8
CONVENIENCE TRANSLATION INTO ENGLISH FROM THE ORIGINAL PREVIOUSLY ISSUED IN PORTUGUESE
Quarterly Financial Information - March 31, 2020 – CIA SIDERURGICA NACIONAL | Version: 1 |
Parent Company Financial Statements / Statement of Value Added | ||||||
(R$ thousand) | ||||||
Code | Description | Year to date 01/01/2020 to 31/03/2020 | YTD previous year 01/01/2019 to 31/03/2019 | |||
7.01 | Revenues | 3,772,385 | 3,901,138 | |||
7.01.01 | Sales of products and rendering of services | 3,769,699 | 3,751,792 | |||
7.01.02 | Other revenues | 4,729 | 127,754 | |||
7.01.04 | Allowance for (reversal of) doubtful debts | (2,043) | 21,592 | |||
7.02 | Raw materials acquired from third parties | (3,469,351) | (3,373,861) | |||
7.02.01 | Cost of sales and services | (2,878,256) | (3,060,346) | |||
7.02.02 | Materials, electric power, outsourcing and other | (585,281) | (304,580) | |||
7.02.03 | Impairment/recovery of assets | (5,814) | (8,935) | |||
7.03 | Gross value added | 303,034 | 527,277 | |||
7.04 | Retentions | (209,001) | (158,007) | |||
7.04.01 | Depreciation, amortization and depletion | (209,001) | (158,007) | |||
7.05 | Wealth created | 94,033 | 369,270 | |||
7.06 | Value added received | (392,985) | 657,660 | |||
7.06.01 | Equity in results of affiliates companies | (590,690) | 549,470 | |||
7.06.02 | Financial income | 53,376 | 101,370 | |||
7.06.03 | Others | 144,329 | 6,820 | |||
7.06.03.01 | Others and exchange gains | 144,329 | 6,820 | |||
7.07 | Wealth for distribution | (298,952) | 1,026,930 | |||
7.08 | Wealth distributed | (298,952) | 1,026,930 | |||
7.08.01 | Personnel | 355,029 | 347,839 | |||
7.08.01.01 | Salaries and wages | 249,708 | �� 241,697 | |||
7.08.01.02 | Benefits | 69,873 | 70,631 | |||
7.08.01.03 | Severance payment (FGTS) | 35,448 | 35,511 | |||
7.08.02 | Taxes, fees and contributions | 156,377 | 119,424 | |||
7.08.02.01 | Federal | 113,851 | 60,064 | |||
7.08.02.02 | State | 42,526 | 59,360 | |||
7.08.03 | Remuneration on third-party capital | 550,493 | 567,239 | |||
7.08.03.01 | Interest | 1,335,564 | 488,035 | |||
7.08.03.02 | Rental | 1,618 | 1,030 | |||
7.08.03.03 | Others | (786,689) | 78,174 | |||
7.08.03.03.01 | Others and exchange losses | (786,689) | 78,174 | |||
7.08.04 | Remuneration on Shareholders' capital | (1,360,851) | (7,572) | |||
7.08.04.03 | Retained earnings (accumulated losses) | (1,360,851) | (7,572) | |||
Page 9
CONVENIENCE TRANSLATION INTO ENGLISH FROM THE ORIGINAL PREVIOUSLY ISSUED IN PORTUGUESE
Quarterly Financial Information - March 31, 2020 – CIA SIDERURGICA NACIONAL | Version: 1 |
Consolidated Financial Statements / Balance Sheet - Assets | |||
(R$ thousand) | |||
Code | Description | Current Quarter 03/31/2020 | Previous Year 12/31/2019 |
1 | Total assets | 52,723,083 | 50,869,276 |
1.01 | Current assets | 14,385,591 | 12,725,805 |
1.01.01 | Cash and cash equivalents | 3,281,138 | 1,088,955 |
1.01.02 | Financial investments | 1,644,460 | 2,633,173 |
1.01.02.01 | Financial investments measured a fair value through profit or loss | 1,152,266 | 2,114,620 |
1.01.02.01.03 | Financial investments measured a fair value through profit or loss – Usiminas’ shares | 1,152,266 | 2,114,620 |
1.01.02.03 | Financial investments at amortized cost | 492,194 | 518,553 |
1.01.03 | Trade receivables | 2,205,944 | 2,047,931 |
1.01.04 | Inventory | 5,465,046 | 5,282,750 |
1.01.08 | Other current assets | 1,789,003 | 1,672,996 |
1.01.08.03 | Others | 1,789,003 | 1,672,996 |
1.01.08.03.01 | Recoverable taxes | 1,388,468 | 1,282,415 |
1.01.08.03.02 | Prepaid expenses | 208,868 | 107,428 |
1.01.08.03.03 | Dividends receivable | 44,554 | 44,554 |
1.01.08.03.04 | Derivative financial instruments | 4,579 | 1,364 |
1.01.08.03.05 | Others | 142,534 | 237,235 |
1.02 | Non-current assets | 38,337,492 | 38,143,471 |
1.02.01 | Long-term assets | 7,558,528 | 7,626,577 |
1.02.01.03 | Financial investments at amortized cost | 121,027 | 95,719 |
1.02.01.07 | Deferred taxes assets | 2,475,496 | 2,473,304 |
1.02.01.10 | Other non-current assets | 4,962,005 | 5,057,554 |
1.02.01.10.03 | Recoverable taxes | 1,956,660 | 2,119,940 |
1.02.01.10.04 | Judicial deposits | 333,120 | 328,371 |
1.02.01.10.05 | Prepaid expenses | 129,562 | 126,213 |
1.02.01.10.06 | Receivable from related parties | 1,365,520 | 1,274,972 |
1.02.01.10.07 | Others | 1,177,143 | 1,208,058 |
1.02.02 | Investments | 3,600,997 | 3,584,169 |
1.02.02.01 | Equity interest | 3,438,752 | 3,482,974 |
1.02.02.02 | Investment Property | 162,245 | 101,195 |
1.02.03 | Property, plant and equipment | 19,857,633 | 19,700,944 |
1.02.03.01 | Property, plant and equipment in operation | 19,392,387 | 19,228,599 |
1.02.03.02 | Right of use in leases | 465,246 | 472,345 |
1.02.04 | Intangible assets | 7,320,334 | 7,231,781 |
Page 10
CONVENIENCE TRANSLATION INTO ENGLISH FROM THE ORIGINAL PREVIOUSLY ISSUED IN PORTUGUESE
Quarterly Financial Information - March 31, 2020 – CIA SIDERURGICA NACIONAL | Version: 1 |
Consolidated Financial Statements / Balance Sheet – Liabilities | ||||
(R$ thousand) | ||||
Code | Description | Current Quarter 03/31/2020 | Previous Year 12/31/2019 | |
2 | Total Liabilities | 52,723,083 | 50,869,276 | |
2.01 | Current liabilities | 11,970,831 | 11,619,957 | |
2.01.01 | Payroll and related taxes | 308,501 | 317,510 | |
2.01.02 | Trade payables | 3,451,945 | 3,012,654 | |
2.01.03 | Tax payables | 486,766 | 541,027 | |
2.01.04 | Borrowings and financing | 5,314,667 | 5,125,843 | |
2.01.05 | Other payables | 2,325,921 | 2,526,444 | |
2.01.05.02 | Others | 2,325,921 | 2,526,444 | |
2.01.05.02.04 | Dividends and interests on shareholder´s equity | 13,116 | 13,252 | |
2.01.05.02.05 | Advances from clients | 809,173 | 787,604 | |
2.01.05.02.06 | Trade payables – Drawee risk | 937,576 | 1,121,312 | |
2.01.05.02.07 | Lease liabilities | 31,807 | 35,040 | |
2.01.05.02.09 | Other payables | 534,249 | 569,236 | |
2.01.06 | Provisions | 83,031 | 96,479 | |
2.01.06.01 | Provision for tax, social security, labor and civil risks | 83,031 | 96,479 | |
2.02 | Non-current liabilities | 35,345,710 | 27,887,387 | |
2.02.01 | Borrowings and financing | 30,305,393 | 22,841,193 | |
2.02.02 | Other payables | 2,426,514 | 2,493,702 | |
2.02.02.02 | Others | 2,426,514 | 2,493,702 | |
2.02.02.02.03 | Advances from clients | 1,699,617 | 1,845,248 | |
2.02.02.02.04 | Lease liabilities | 434,640 | 439,350 | |
2.02.02.02.05 | Derivative financial instruments | 94,909 | - | |
2.02.02.02.06 | Other payables | 197,348 | 209,104 | |
2.02.03 | Deferred taxes assets | 620,227 | 589,539 | |
2.02.04 | Provisions | 1,993,576 | 1,962,953 | |
2.02.04.01 | Provision for tax, social security, labor and civil risks | 536,751 | 526,768 | |
2.02.04.02 | Other provisions | 1,456,825 | 1,436,185 | |
2.02.04.02.03 | Provision for environmental liabilities and decommissioning of assets | 544,641 | 524,001 | |
2.02.04.02.04 | Pension and healthcare plan | 912,184 | 912,184 | |
2.03 | Shareholders’ equity | 5,406,542 | 11,361,932 | |
2.03.01 | Share Capital | 4,540,000 | 4,540,000 | |
2.03.02 | Capital reserves | 32,720 | 32,720 | |
2.03.04 | Profit reserves | 4,431,200 | 4,431,200 | |
2.03.04.01 | Legal reserve | 278,576 | 278,576 | |
2.03.04.02 | Earnings reserves | 4,210,888 | 4,210,888 | |
2.03.04.09 | Treasury shares | (58,264) | (58,264) | |
2.03.05 | Accumulated profit/(losses) | (1,360,851) | - | |
2.03.08 | Other comprehensive income | (3,473,059) | 1,170,624 | |
2.03.09 | Profit attributable to the non-controlling interests | 1,236,532 | 1,187,388 | |
Page 11
CONVENIENCE TRANSLATION INTO ENGLISH FROM THE ORIGINAL PREVIOUSLY ISSUED IN PORTUGUESE
Quarterly Financial Information - March 31, 2020 – CIA SIDERURGICA NACIONAL | Version: 1 |
Consolidated Financial Statements / Statements of Income | |||||
(R$ thousand) | |||||
Code | Description | Year to date 01/01/2020 to 31/03/2020 | YTD previous year 01/01/2019 to 31/03/2019 | ||
3.01 | Revenues from sale of goods and rendering of services | 5,334,653 | 6,005,466 | ||
3.02 | Costs from sale of goods and rendering of services | (4,017,707) | (4,021,495) | ||
3.03 | Gross profit | 1,316,946 | 1,983,971 | ||
3.04 | Operating (expenses)/income | (1,221,313) | (803,252) | ||
3.04.01 | Selling expenses | (390,915) | (573,484) | ||
3.04.02 | General and administrative expenses | (119,055) | (120,181) | ||
3.04.04 | Other operating income | 102,689 | 228,952 | ||
3.04.05 | Other operating expenses | (768,924) | (364,372) | ||
3.04.06 | Equity in results of affiliated companies | (45,108) | 25,833 | ||
3.05 | Profit before financial income (expenses) and taxes | 95,633 | 1,180,719 | ||
3.06 | Financial income (expenses) | (1,201,138) | (635,099) | ||
3.06.01 | Financial income | 65,131 | 111,314 | ||
3.06.02 | Financial expenses | (1,266,269) | (746,413) | ||
3.06.02.01 | Net exchange differences over financial instruments | 364,882 | (113,564) | ||
3.06.02.02 | Financial expenses | (1,631,151) | (632,849) | ||
3.07 | Profit (loss) before taxes | (1,105,505) | 545,620 | ||
3.08 | Income tax and social contribution | (206,204) | (458,857) | ||
3.09 | Profit (loss) from continued operations | (1,311,709) | 86,763 | ||
3.11 | Consolidated Profit (loss) for the year | (1,311,709) | 86,763 | ||
3.11.01 | Profit attributable to the controlling interests | (1,360,851) | (7,572) | ||
3.11.02 | Profit attributable to the non-controlling interests | 49,142 | 94,335 | ||
3.99 | Earnings per share – (Reais / Share) | - | - | ||
3.99.01 | Basic earnings per share | - | - | ||
3.99.01.01 | Common shares | (0.98604) | (0.00551) | ||
3.99.02 | Diluted earnings per share | - | - | ||
3.99.02.01 | Common shares | (0.98604) | (0.00551) | ||
| |||||
Page 12
CONVENIENCE TRANSLATION INTO ENGLISH FROM THE ORIGINAL PREVIOUSLY ISSUED IN PORTUGUESE
Quarterly Financial Information - March 31, 2020 – CIA SIDERURGICA NACIONAL | Version: 1 |
Consolidated Financial Statements / Statement of Comprehensive Income | ||||
(R$ thousand) | ||||
Code | Description | Year to date 01/01/2020 to 31/03/2020 | YTD previous year 01/01/2019 to 31/03/2019 | |
4.01 | Consolidated profit (loss) for the year | (1,311,709) | 86,763 | |
4.02 | Other comprehensive income | (4,643,681) | 150,183 | |
4.02.01 | Actuarial gains over pension plan of subsidiaries, net of taxes | 33 | 30 | |
4.02.02 | Cumulative translation adjustments for the year | 380,042 | (21,804) | |
4.02.04 | Losses in cash flow hedge | (5,390,043) | (18,440) | |
4.02.05 | Cash flow hedge reclassified to income upon realization | 364,818 | 184,217 | |
4.02.06 | (Loss)/gain on hedge of net investment in foreign operations. | 1,469 | 6,180 | |
4.03 | Consolidated comprehensive income for the year | (5,955,390) | 236,946 | |
4.03.01 | Profit attributable to the controlling interests | (6,004,534) | 142,611 | |
4.03.02 | Profit attributable to the non-controlling interests | 49,144 | 94,335 | |
| ||||
Page 13
CONVENIENCE TRANSLATION INTO ENGLISH FROM THE ORIGINAL PREVIOUSLY ISSUED IN PORTUGUESE
Quarterly Financial Information - March 31, 2020 – CIA SIDERURGICA NACIONAL | Version: 1 |
Consolidated Financial Statements / Statements of Cash Flows – Indirect Method | |||
(R$ thousand) | |||
Code | Description | Year to date 01/01/2020 to 31/03/2020 | YTD previous year 01/01/2019 to 31/03/2019 |
6.01 | Net cash from operating activities | 466,933 | 1,185,970 |
6.01.01 | Cash from operations | 1,166,186 | 1,018,203 |
6.01.01.01 | Profit attributable to the controlling interests | (1,360,851) | (7,572) |
6.01.01.02 | Results of non-controlling shareholders | 49,142 | 94,335 |
6.01.01.03 | Financial charges in borrowing and financing raised | 470,990 | 465,928 |
6.01.01.04 | Financial charges in borrowing and financing granted | (11,481) | (13,946) |
6.01.01.05 | Charges on lease liabilities | 13,056 | 4,957 |
6.01.01.06 | Equity in results of affiliated companies | 45,108 | (25,833) |
6.01.01.07 | Deferred taxes assets | (11,351) | 89,039 |
6.01.01.08 | Provision for tax, social security, labor, civil and environmental risks | (8,685) | (69,853) |
6.01.01.09 | Monetary and exchange variations, net | 522,571 | 239,582 |
6.01.01.10 | Write-off of property, plant and equipment and Intangible assets | 1,400 | 13,712 |
6.01.01.11 | Provision for environmental liabilities and decommissioning of assets | 20,640 | 7,592 |
6.01.01.12 | Updated shares – Fair value through profit or loss | 962,561 | (127,653) |
6.01.01.13 | Depreciation, amortization and depletion | 437,507 | 328,070 |
6.01.01.14 | Accrued/(reversal) for consumption and services | 37,158 | 8,853 |
6.01.01.17 | Other provisions | (1,579) | 10,992 |
6.01.02 | Changes in assets and liabilities | (699,253) | 167,767 |
6.01.02.01 | Trade receivables - third parties | (89,849) | (713,057) |
6.01.02.02 | Trade receivables - related party | (31,572) | (92,283) |
6.01.02.03 | Inventory | (13,512) | (653,465) |
6.01.02.04 | Receivables - related parties/dividends | �� - | 447 |
6.01.02.05 | Tax assets | 57,227 | (41,211) |
6.01.02.06 | Judicial deposits | (4,749) | (11,569) |
6.01.02.08 | Trade payables | 341,567 | (170,461) |
6.01.02.09 | Trade payables – Drawee risk | (183,736) | 235,181 |
6.01.02.10 | Payroll and related taxes | (14,420) | 14,014 |
6.01.02.11 | Taxes in installments – REFIS | (61,612) | 282,973 |
6.01.02.12 | Payables to related parties | (20,572) | (30,173) |
6.01.02.13 | Advances from clients | (130,568) | 1,935,831 |
6.01.02.14 | Interest paid | (511,242) | (590,621) |
6.01.02.16 | Others | (36,215) | 2,161 |
6.02 | Net cash investment activities | (404,851) | (220,750) |
6.02.02 | Purchase of property, plant and equipment and intangible assets | (353,698) | (313,579) |
6.02.04 | Receipt/(payment) in derivative transactions | - | (372) |
6.02.07 | Intercompany loans granted | (82,089) | (40,643) |
6.02.08 | Intercompany loans received | 3,022 | 16,796 |
6.02.09 | Financial Investments, net of redemption | 27,914 | 117,048 |
6.03 | Net cash used in financing activities | 2,157,127 | (514,817) |
6.03.01 | Borrowings and financing raised | 4,553,970 | 2,465,845 |
6.03.02 | Transactions cost - Borrowings and financing | (9,131) | (28,810) |
6.03.03 | Amortization of borrowings and financing | (2,363,666) | (2,939,145) |
6.03.04 | Dividends and interest on shareholder’s equity | (136) | - |
6.03.05 | Amortization of leases | (23,910) | (12,707) |
6.04 | Exchange rate on translating cash and cash equivalents | (27,026) | 3,670 |
6.05 | Increase (decrease) in cash and cash equivalents | 2,192,183 | 454,073 |
6.05.01 | Cash and equivalents at the beginning of the year | 1,088,955 | 2,248,004 |
6.05.02 | Cash and equivalents at the end of the year | 3,281,138 | 2,702,077 |
Page 14
CONVENIENCE TRANSLATION INTO ENGLISH FROM THE ORIGINAL PREVIOUSLY ISSUED IN PORTUGUESE
Quarterly Financial Information - March 31, 2020 – CIA SIDERURGICA NACIONAL | Version: 1 |
Consolidated Financial Statements / Statements of Changes in Equity - 01/01/2020 to 03/31/2020 | |||||||||
(R$ thousand) | |||||||||
Code | Description | Paid-in capital | Capital reserve, granted options and treasury shares | Earnings reserve | Retained earnings (accumulated losses) | Other comprehensive income | Shareholders’ equity | Non-controlling interests | Shareholders’ equity |
5.01 | Opening balances | 4,540,000 | 32,720 | 4,431,200 | - | 1,170,624 | 10,174,544 | 1,187,388 | 11,361,932 |
5.03 | Adjusted opening balances | 4,540,000 | 32,720 | 4,431,200 | - | 1,170,624 | 10,174,544 | 1,187,388 | 11,361,932 |
5.05 | Total comprehensive income | - | - | - | (1,360,851) | (4,643,683) | (6,004,534) | 49,144 | (5,955,390) |
5.05.01 | (Loss) profit for the year | - | - | - | (1,360,851) | - | (1,360,851) | 49,142 | (1,311,709) |
5.05.02 | Other comprehensive income | - | - | - | - | (4,643,683) | (4,643,683) | 2 | (4,643,681) |
5.05.02.04 | Translation adjustments for the year | - | - | - | - | 380,042 | 380,042 | - | 380,042 |
5.05.02.06 | Actuarial (loss)/gain on pension plan, net of taxes | - | - | - | - | 31 | 31 | 2 | 33 |
5.05.02.07 | (Loss) / gain on cash flow hedge accounting, net of taxes | - | - | - | - | (5,025,225) | (5,025,225) | - | (5,025,225) |
5.05.02.08 | (Loss) / gain on hedge of net investment in foreign operations | - | - | - | - | 1,469 | 1,469 | - | 1,469 |
5.07 | Closing balance | 4,540,000 | 32,720 | 4,431,200 | (1,360,851) | (3,473,059) | 4,170,010 | 1,236,532 | 5,406,542 |
Page 15
CONVENIENCE TRANSLATION INTO ENGLISH FROM THE ORIGINAL PREVIOUSLY ISSUED IN PORTUGUESE
Quarterly Financial Information - March 31, 2020 – CIA SIDERURGICA NACIONAL | Version: 1 |
Consolidated Financial Statements / Statements of Changes in Equity - 01/01/2019 to 03/31/2019 | |||||||||
(R$ thousand) | |||||||||
Code | Description | Paid-in capital | Capital reserve, granted options and treasury shares | Earnings reserve | Retained earnings (accumulated losses) | Other comprehensive income | Shareholders’ equity | Non-controlling interests | Shareholders’ equity |
5.01 | Opening balances | 4,540,000 | 32,720 | 3,064,827 | - | 1,065,188 | 8,702,735 | 1,310,705 | 10,013,440 |
5.03 | Adjusted opening balances | 4,540,000 | 32,720 | 3,064,827 | - | 1,065,188 | 8,702,735 | 1,310,705 | 10,013,440 |
5.05 | Total comprehensive income | - | - | - | (7,572) | 150,183 | 142,611 | 94,335 | 236,946 |
5.05.01 | (Loss) profit for the year | - | - | - | (7,572) | - | (7,572) | 94,335 | 86,763 |
5.05.02 | Other comprehensive income | - | - | - | - | 150,183 | 150,183 | - | 150,183 |
5.05.02.04 | Translation adjustments for the year | - | - | - | - | (21,804) | (21,804) | - | (21,804) |
5.05.02.06 | Actuarial (loss)/gain on pension plan, net of taxes | - | - | - | - | 30 | 30 | - | 30 |
5.05.02.07 | (Loss) / gain on cash flow hedge accounting, net of taxes | - | - | - | - | 165,777 | 165,777 | - | 165,777 |
5.05.02.08 | (Loss) / gain on hedge of net investment in foreign operations | - | - | - | - | 6,180 | 6,180 | - | 6,180 |
5.06 | Internal changes in shareholders’ equity | - | - | - | - | - | - | 2 | 2 |
5.06.04 | Non-controlling interests in subsidiaries | - | - | - | - | - | - | 2 | 2 |
5.07 | Closing balance | 4,540,000 | 32,720 | 3,064,827 | (7,572) | 1,215,371 | 8,845,346 | 1,405,042 | 10,250,388 |
Page 16
CONVENIENCE TRANSLATION INTO ENGLISH FROM THE ORIGINAL PREVIOUSLY ISSUED IN PORTUGUESE
Quarterly Financial Information - March 31, 2020 – CIA SIDERURGICA NACIONAL | Version: 1 |
Consolidated Financial Statements / Statements of Value Added | ||||||
(R$ thousand) | ||||||
Code | Description | Year to date 01/01/2020 to 31/03/2020 | YTD previous year 01/01/2019 to 31/03/2019 | |||
7.01 | Revenues | 6,143,475 | 6,948,101 | |||
7.01.01 | Sales of products and rendering of services | 6,137,834 | 6,795,881 | |||
7.01.02 | Other revenues | 6,962 | 131,521 | |||
7.01.04 | Allowance for (reversal of) doubtful debts | (1,321) | 20,699 | |||
7.02 | Raw materials acquired from third parties | (4,758,610) | (4,677,204) | |||
7.02.01 | Cost of sales and services | (3,776,787) | (3,742,381) | |||
7.02.02 | Materials, electric power, outsourcing and other | (961,472) | (893,674) | |||
7.02.03 | Impairment/recovery of assets | (20,351) | (41,149) | |||
7.03 | Gross value added | 1,384,865 | 2,270,897 | |||
7.04 | Retentions | (436,293) | (328,070) | |||
7.04.01 | Depreciation, amortization and depletion | (436,293) | (328,070) | |||
7.05 | Wealth created | 948,572 | 1,942,827 | |||
7.06 | Value added received | 698,088 | 95,823 | |||
7.06.01 | Equity in results of affiliated companies | (45,108) | 25,833 | |||
7.06.02 | Financial income | 65,131 | 111,314 | |||
7.06.03 | Others | 678,065 | (41,324) | |||
7.06.03.01 | Others and exchange gains | 678,065 | (41,324) | |||
7.07 | Wealth for distribution | 1,646,660 | 2,038,650 | |||
7.08 | Wealth distributed | 1,646,660 | 2,038,650 | |||
7.08.01 | Personnel | 584,191 | 610,988 | |||
7.08.01.01 | Salaries and wages | 432,137 | 457,968 | |||
7.08.01.02 | Benefits | 108,569 | 108,793 | |||
7.08.01.03 | Severance payment (FGTS) | 43,485 | 44,227 | |||
7.08.02 | Taxes, fees and contributions | 424,401 | 631,219 | |||
7.08.02.01 | Federal | 352,361 | 551,594 | |||
7.08.02.02 | State | 63,146 | 74,681 | |||
7.08.02.03 | Municipal | 8,894 | 4,944 | |||
7.08.03 | Remuneration on third-party capital | 1,949,777 | 709,680 | |||
7.08.03.01 | Interest | 1,631,151 | 632,849 | |||
7.08.03.02 | Rental | 5,441 | 5,342 | |||
7.08.03.03 | Others | 313,185 | 71,489 | |||
7.08.03.03.01 | Others and exchange losses | 313,185 | 71,489 | |||
7.08.04 | Remuneration on Shareholders' capital | (1,311,709) | 86,763 | |||
7.08.04.03 | Retained earnings (accumulated losses) | (1,360,851) | (7,572) | |||
7.08.04.04 | Non-controlling interests in retained earnings | 49,142 | 94,335 | |||
Page 17
CONVENIENCE TRANSLATION INTO ENGLISH FROM THE ORIGINAL PREVIOUSLY ISSUED IN PORTUGUESE | ||
Quarterly Financial Information –June30, 2019 – CIA SIDERURGICA NACIONAL | Version: 1 | |
Comments on the Company’s Consolidated Performance
São Paulo, May 23, 2020
Results for the First Quarter of 2020
Companhia Siderúrgica Nacional (“CSN”) (B3 S.A. – Brasil, Bolsa e Balcão: CSNA3) (NYSE: SID)announces its results for the first quarter of 2020 (1Q20) in Brazilian Reais, in accordance with International Financial Reporting Standards (IFRS) issued by the International Accounting Standards Board (IASB), and with Brazilian accounting practices, which are fully convergent with international accounting standards, issued by the Accounting Pronouncements Committee (CPC) and approved by the Brazilian Securities and Exchange Commission (CVM), pursuant to CVM Instruction 485 of 09/01/10.
All comments presented herein refer to the Company’s consolidated results for thefirst quarter of 2020 (1Q20) and comparisons refer to the fourth quarter of 2019 (4Q19) and the first quarter of 2019 (1Q19). The Real/U.S. dollar exchange rate was R$5.1987 on 03/31/2020, R$4.0307 on 12/31/2019 and R$3.8967 on 03/31/2019.
Operating and Financial Highlights in 1Q20
· Adjusted EBITDAreachedR$1,331 million in1Q20, even with a lower iron ore production.
· Adjusted Free Cash FlowreachedR$506MM,reflecting actions for liquidity protection.
· Iron ore productiontotaled 5.9 million tons in the 1Q20, 39% lower YoY, due to heavy rains in the region and delay in new mining fronts.
· Steel Sales Volumereached 1,140 thousand tons,2% higher than in 4Q19.Steel EBITDA showed sequentialgrowth of 68%, totalling R$298MM.
· Net debt/EBITDA reached 4.78x,or 1.01x higher than 4Q19, due to strong exchange rate variation.
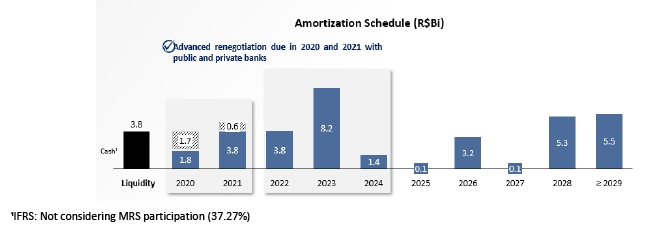
· NewBondsissued due 2028 in the amount of US$1.0 billion, providing significant increase in debt’s maturities.
Highlights | 1Q19 | 4Q19 | 1Q20 |
|
| Variation | ||||||||
1Q20 | x | 1Q19 | 1Q20 | x | 4Q19 |
|
|
| ||||||
Steel Sales (thousand tons) | 1,175 | 1,117 | 1,140 |
|
| (3%) | 2% |
| ||||||
- Domestic Market | 811 | 819 | 775 |
|
| (4%) | (5%) |
| ||||||
- Subsidiaries Abroad | 340 | 283 | 356 |
|
| 5% | 26% |
| ||||||
- Exports | 24 | 14 | 8 |
|
| (64%) | (41%) |
| ||||||
|
|
|
|
|
|
|
|
|
|
|
|
|
| |
Iron Ore Sales (thousand tons) | 8,859 | 10,334 | 5,609 |
|
| (37%) | (46%) |
| ||||||
- Domestic Market | 1,169 | 953 | 1,806 |
|
| (7%) | 14% |
| ||||||
- Exports | 7,690 | 9,382 | 4,524 |
|
| (41%) | (52%) |
| ||||||
|
|
|
|
|
|
|
|
|
|
|
|
|
| |
Consolidated Results (R$ millions) |
|
|
|
|
|
|
|
|
|
|
|
|
|
|
Net Revenue | 6,005 | 6,524 | 5,335 |
|
| (11%) | (18%) |
| ||||||
Gross Profit | 1,948 | 2,108 | 1,317 |
|
| (32%) | (38%) |
| ||||||
Adjusted EBITDA¹ | 1,724 | 1,580 | 1,331 |
|
| (23%) | (16%) |
| ||||||
|
|
|
|
|
|
|
|
|
|
|
|
|
| |
Adjusted Net Debt² | 25,772 | 27,360 | 32,804 |
|
| 27% | 20% |
| ||||||
Adjusted Cash and Cash Equivalents² | 3,601 | 1,857 | 4,129 |
|
| 15% | 122% |
| ||||||
Net Debt / Adjusted EBITDA | 4.07x | 3.77x | 4.78x |
|
| 0.71x | 1.01x |
| ||||||
¹ Adjusted EBITDA is calculated based on net profit/loss, plus depreciation and amortization, income tax, net financial result, share of profit (loss) of investees and other operating income (expenses), and includes the proportionate share of EBITDA of jointly owned subsidiaries MRS Logística and CBSI. Adjusted EBITDA includes stakes of 100% in CSN Mineração, 37.27% in MRS and 50% in CBSI (until November/2019).
² Adjusted net debt and adjusted cash and cash equivalents includes the stakes of 100% in CSN Mineração, 37.27% in MRS and 50% in CBSI (until November/2019), excluding forfaiting and drawee risk operations.
Page 18
CONVENIENCE TRANSLATION INTO ENGLISH FROM THE ORIGINAL PREVIOUSLY ISSUED IN PORTUGUESE | ||
Quarterly Financial Information –June30, 2019 – CIA SIDERURGICA NACIONAL | Version: 1 | |
CSN’s Consolidated Result
· Net revenuein 1Q20 totaled R$5,335 million, 11% and 8% less than 1Q19 and 4Q19, respectively. The decrease in iron ore sales volume was due to the heavy rainfall and delay in new mining fronts.
· In1Q20,cost of goods sold totaled R$4,018 million, 9.3% lower than the previous quarter.
· In1Q20,gross profitreached R$1,317 million, a 34% contraction compared to 1Q19. Gross margin decreased 8.3 p.p. versus 1Q19, to 24.7% in 1Q20, due to a punctual drop in iron ore volumes.
· In 1Q20, selling,general and administrative expensestotaled R$510 million, 26.5% lower YoY, while net revenue, in the same comparison basis, reached 11%.Selling expensesstrongly decreased by 32% in1Q20, whilegeneral and administrative expensesdropped 2.8% in the same period, corresponding 2.1% of net revenue, stable when compared to 1Q19.
· Other operating income and expenseswas negative by R$666MM, mainly due to cash flow hedging and to idle capacity in mining equipment.
· Financial resultwas negative by R$1,201MM, impacted by the exchange rate variation and Usiminas’ shares drop providing negative results without cash impact in the amount of R$962MM.
Financial Result (R$ million) | 1Q19 | 4Q19 | 1Q20 |
Financial Result - IFRS | (635) | (298) | (1,201) |
Financial Revenue | 111 | 68 | 65 |
Financial Expenses | (746) | (366) | (1,266) |
Financial Expenses (ex-exchange rate variation) | (633) | (624) | (1,631) |
Result with Exchange Rate Variation | (113) | 258 | 365 |
Monetary and Exchange Rate Variation | (125) | 605 | (4,928) |
Hedge Accounting | 12 | (355) | 5,389 |
Derivative Result | 0 | 8 | (96) |
· Equity result of affiliated companies was negative by R$45 million in1Q20 versus a positive amount of R$7 million in 4Q19, mainly due to the negative result from MRS caused by a strong reduction of cargoes with heavy rains above historical average.
Equity Results of Affiliated Companies | 1Q19 | 4Q19 | 1Q20 |
MRS Logística | 43 | 16 | (34) |
CBSI | 1 | 2 | - |
TLSA | (6) | (2) | (6) |
Arvedi Metalfer BR | - | (1) | (1) |
Eliminações | (12) | (8) | (4) |
Equity in Results of Affiliated companies | 26 | 7 | (45) |
Page 19
CONVENIENCE TRANSLATION INTO ENGLISH FROM THE ORIGINAL PREVIOUSLY ISSUED IN PORTUGUESE | ||
Quarterly Financial Information –June30, 2019 – CIA SIDERURGICA NACIONAL | Version: 1 | |
· In1Q20, the Company registered a net loss of R$1,312 million, versus a net gain of R$87 million in 1Q19, mainly due to non-operational issues and non-cash such as hedge accounting and market value loss in Usiminas shares.
Adjusted EBITDA (R$ million) | 1Q19 | 4Q19 | 1Q20 | Variation | |||||
1Q20 | x | 1Q19 | 1Q20 | X | 4Q19 | ||||
Net Profit /(Loss) for the period | 87 | 1,134 | (1,312) | (1,608%) | (216%) | ||||
(-) Depreciation | 306 | 432 | 415 | 36% | (4%) | ||||
(+) Income tax and social contribution | 459 | (474) | 206 | (55%) | (143%) | ||||
(+) Net financial result | 635 | 298 | 1,201 | 89% | 303% | ||||
EBITDA (ICVM 527) | 1,487 | 1,390 | 511 | (66%) | (63%) | ||||
(+) Other Operating Income/Expenses | 135 | 103 | 666 | 393% | 547% | ||||
(+) Equity in Results of Affiliated Companies | (26) | (7) | 45 | (273%) | (743%) | ||||
(-) Proportional EBITDA of Jointly Owned Subsidiaries | 127 | 94 | 109 | (14%) | 16% | ||||
Adjusted EBITDA | 1,724 | 1,580 | 1,331 | (23%) | (16%) | ||||
*The Company discloses adjusted EBITDA excluding interests in investments and other operating income (expenses) with the understanding that these items should not be considered when calculating recurring operating cash flow.
· Adjusted EBITDA reached R$1,331 million in1Q20, versus R$1,580 million in 4Q19, due to low iron ore production as a result of severe rain, although partially compensated by the gradual evolution of steel’s result. Adjusted EBITDA margin reached 24.1%, or 0.6 p.p. higher in the same comparison basis.
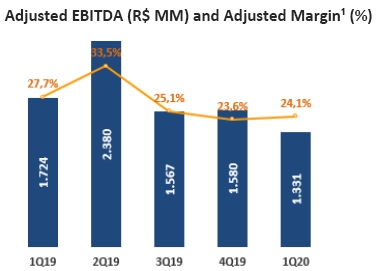
¹Adjusted EBITDA margin is calculated as the ratio between adjusted EBITDA and adjusted net revenue, which considers stakes of 100% in CSN Mineração and 37.27% in MRS and 50% in CBSI (until November/19).
Adjusted Free Cash Flow¹
Adjusted Free Cash Flow in 1Q20 reached R$506MM, negatively influenced by lower cash generation measured by EBITDA in mining segment, due to severe rain in the period.
Page 20
CONVENIENCE TRANSLATION INTO ENGLISH FROM THE ORIGINAL PREVIOUSLY ISSUED IN PORTUGUESE | ||
Quarterly Financial Information –June30, 2019 – CIA SIDERURGICA NACIONAL | Version: 1 | |
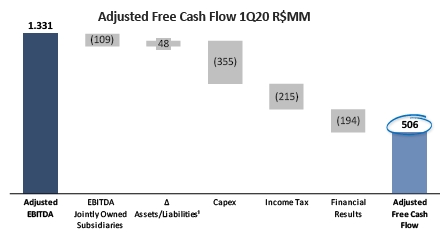
¹ Adjusted free cash flow is calculated from adjusted EBITDA less EBITDA of joint ventures, Capex, Income tax, financial result and variation of working capital ¹, excluding the impact of Glencore’s prepay.
²Adjusted Working Capital comprises the variation in NWC (-R$ 187 million), plus variation in long-term asset and liability accounts (+ R$ 192 million, mainly reclassification of PIS / COFINS credits), and adjusted by following non-cash launches in the period: (i) Receipt of Property in Payment (-R$ 61 million), and (ii) Recognition of Tax Credits (+ R$ 104 million).
Debt
On 03/31/2020, consolidated net debt was R$32,804 million, while net debt/EBITDA, reached 4.78x, or 1.01x higher than in 4Q19. Debt evolution in the quarter was impacted by the exchange rate variation, with no cash impact, considering a longer duration of debt in dollars.
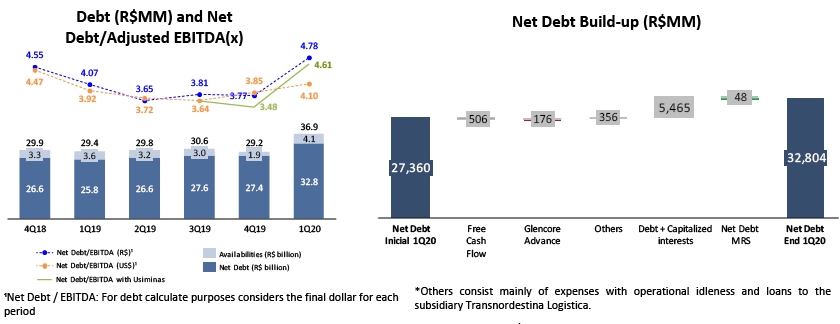
In 1Q20, the Company issued new Bonds due in 2028 in the amount of US$1.0 billion, obtaining an increase in its debt duration. Additionally, the liquidity support obtained solves the Company’s short-term financial obligations.
Page 21
CONVENIENCE TRANSLATION INTO ENGLISH FROM THE ORIGINAL PREVIOUSLY ISSUED IN PORTUGUESE | ||
Quarterly Financial Information –June30, 2019 – CIA SIDERURGICA NACIONAL | Version: 1 | |
Foreign Exchange Exposure
Net FX exposure on the consolidated balance sheet on 03/31/2020 was US$374 million, as shown in the table below.
Foreign Exchange Exposure | 03/31/2019 | 12/31/2019 | 03/31/2020 |
(in US$ ‘000) | IFRS | IFRS | IFRS |
Cash | 99 | 105 | 293 |
Accounts Receivable | 486 | 346 | 323 |
Other | 7 | 4 | 3 |
Total Assets | 593 | 455 | 619 |
Loans and Financing | (4,053) | (4,097) | (4,730) |
Trade Payables | (125) | (69) | (87) |
Other Payables | (3) | (3) | (3) |
Total Liabilities | (3,181) | (4,169) | (4,819) |
|
|
| |
Natural Foreign Exchange Exposure (Assets - Liabilities) | (2,589) | (3,714) | (4,200) |
Cash Flow Hedge Accounting | 1,862 | 2,531 | 4,641 |
Swap CDI x Dollar | - | (67) | (67) |
Net Foreign Exchange Exposure | (1,726) | (1,250) | 374 |
Hedge Accounting adopted by CSN correlates projected export in dollars with scheduled debt payments in the same currency. Therefore, the exchange rate variation of the dollar-denominated debt is temporarily accounted for under shareholders’ equity, being recorded in the income statement when dollar revenues from exports are received.
Investments
A total of R$354 million were invested in1Q20, due to the slowdown in expenses in several sustaining projects in the steel segment, within the context of the stoppage of blast furnace #3 which occurred during 2Q19. In mining, investments were related mostly with operational continuity.
Investments (R$ million) | 2018 | 1Q19 | 2Q19 | 3Q19 | 4Q19 | 2019 | 1Q20 |
|
|
|
Steel | 637 | 160 | 212 | 405 | 576 | 1,353 | 170 |
|
|
|
Mining | 505 | 118 | 190 | 165 | 174 | 647 | 132 |
|
|
|
Other | 175 | 35 | 44 | 40 | 96 | 215 | 51 |
|
|
|
Total Investments - IFRS | 1,318 | 314 | 446 | 610 | 846 | 2,216 | 354 |
|
|
|
Net Working Capital
Net Working Capital invested in the business totaledR$3,826 million in 1Q20, raising the financial cycle in 8 days when compared to 4Q19, due to higher accounts receivable and inventory balance, but partially offset by trade payables.
Net Working Capital analysis applied to the business disregard Glencore’s advance, as shown in the table below:
Net Working Capital (R$ million) | 1Q19 | 4Q19 | 1Q20 | Variation | ||||||
1Q20 | x | 1Q19 | 1Q20 | X | 4Q19 | |||||
Assets | 10,293 | 8,997 | 9,451 | (842) | 454 | |||||
Accounts Receivable | 2,838 | 2,048 | 2,206 | (632) | 158 | |||||
Inventories | 5,663 | 5,283 | 5,465 | (198) | 182 | |||||
Prepaid Taxes | 764 | 828 | 889 | 125 | 61 | |||||
Credit from PIS/COFINS | 658 | 455 | 500 |
| (158) | 45 | ||||
Anticipated Expenses | 194 | 204 | 209 |
| 15 | 5 | ||||
Dividends Receivable | 45 | 44 | 44 |
| (2) | - | ||||
Other AssetsNWC¹ | 131 | 137 | 139 |
| 9 | 3 | ||||
Liabilities | 5,696 | 5,359 | 5,625 | (71) | 267 | |||||
Trade Payables | 3,528 | 4,134 | 4,390 | 862 | 255 | |||||
Payroll and Related Taxes | 415 | 429 | 461 | 46 | (18) | |||||
Taxes Payable | 181 | 222 | 271 | 89 | 49 | |||||
Advances from Customers | 106 | 104 | 110 | 4 | 77 | |||||
Provision for Consumption | 298 | 162 | 186 |
| (112) | 24 | ||||
Other LiabilitiesNWC² | 1,168 | 258 | 208 |
| (960) | (50) | ||||
Net Working Capital | 4,596 | 3,639 | 3,826 | (771) | 187 | |||||
Average Term (days) | 1Q19 | 4Q19 | 1Q20 | Variation | ||||||
1Q20 | x | 1Q19 | 1Q20 | X | 4Q19 | |||||
Receivables | 37 | 25 | 32 | (5) | 7 | |||||
Payables | 76 | 84 | 95 | 19 | 11 | |||||
Inventories³ | 109 | 92 | 104 | (5) | 12 | |||||
Financial Cycle | 70 | 33 | 41 | (29) | 8 | |||||
¹Other Assets NWC: Consider: Advances and other Accounts Receivable
²Other Liabilities NWC: Consider Other payable accounts, payable dividends, installment taxes and other provisions.
³ Invetories term average term doesn’t consider Warehouse.
Page 22
CONVENIENCE TRANSLATION INTO ENGLISH FROM THE ORIGINAL PREVIOUSLY ISSUED IN PORTUGUESE | ||
Quarterly Financial Information –June30, 2019 – CIA SIDERURGICA NACIONAL | Version: 1 | |
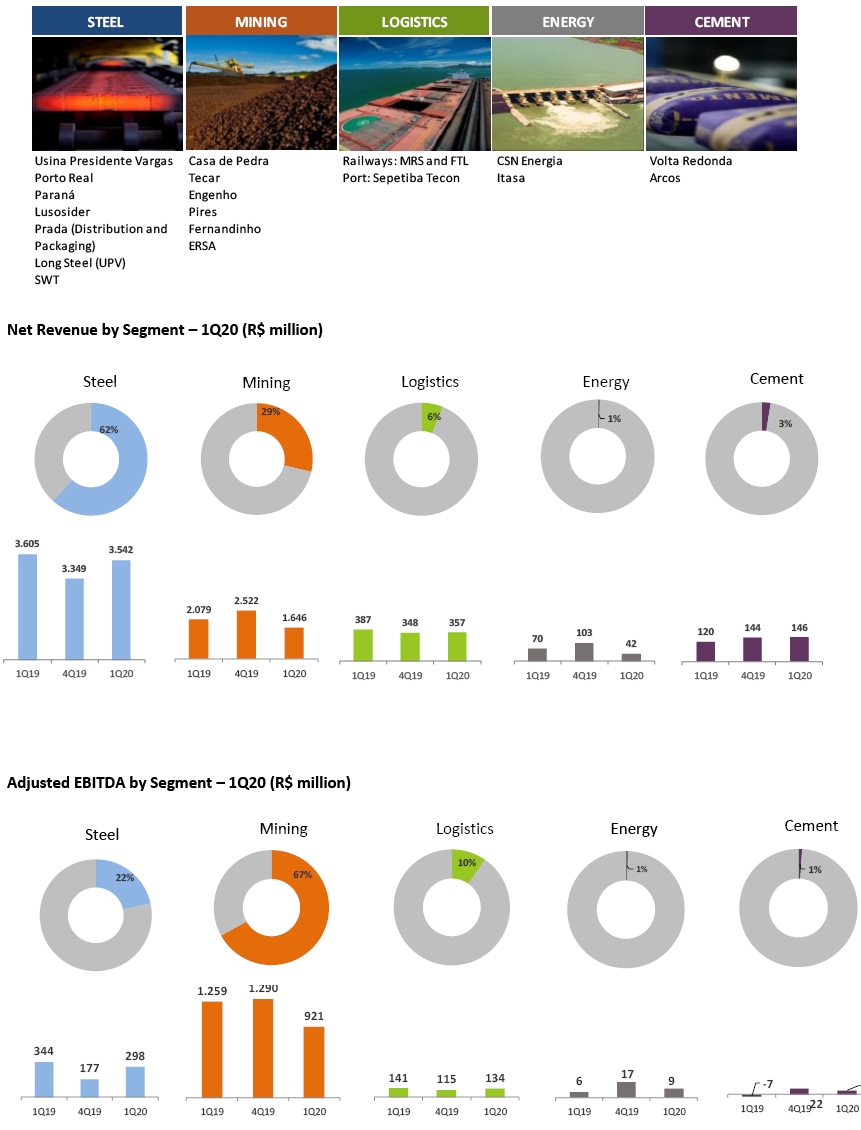
Results by Business Segment
The Company maintains integrated operations in five business segments: Steel, Mining, Logistics, Energy and Cement. The main assets and/or companies comprising each segment are presented below:
Page 23
CONVENIENCE TRANSLATION INTO ENGLISH FROM THE ORIGINAL PREVIOUSLY ISSUED IN PORTUGUESE | ||
Quarterly Financial Information –June30, 2019 – CIA SIDERURGICA NACIONAL | Version: 1 | |
1Q20 Results | Steel | Mining | Port Logistics | Railway Logistics | Energy | Cement | Corporate Expenses/ Eliminations | Consolidated |
(R$ million) | ||||||||
Net Revenue | 3,542 | 1,646 | 75 | 282 | 42 | 146 | (398) | 5,335 |
Domestic Market | 2,511 | 263 | 75 | 282 | 42 | 146 | (581) | 2,738 |
Foreign Market | 1,031 | 1,382 | - | - | - | - | 184 | 2,597 |
COGS | (3,237) | (823) | (49) | (270) | (29) | (145) | 537 | (4,018) |
Gross Profit | 305 | 823 | 25 | 12 | 13 | 1 | 139 | 1,317 |
SG&A | (214) | (46) | (10) | (26) | (8) | (23) | (183) | (510) |
Depreciation | 207 | 145 | 8 | 124 | 4 | 36 | (110) | 415 |
Proportional EBITDA of jointly owned subsidiaries | - | - | - | - | - | 109 | 109 | |
Adjusted EBITDA | 298 | 921 | 23 | 111 | 9 | 14 | (45) | 1,331 |
4Q19 Results | Steel | Mining | Port Logistics | Railway Logistics | Energy | Cement | Corporate Expenses/ Eliminations | Consolidated |
(R$ million) | ||||||||
Net Revenue | 3,349 | 2,522 | 55 | 292 | 103 | 144 | 57 | 6,524 |
Domestic Market | 2,529 | 242 | 55 | 292 | 103 | 144 | (606) | 2,761 |
Foreign Market | 820 | 2,280 | - | - | - | - | 663 | 3,763 |
COGS | (3,171) | (1,323) | (39) | (260) | (84) | (141) | 590 | (4,429) |
Gross Profit | 178 | 1,199 | 16 | 32 | 20 | 3 | 646 | 2,095 |
SG&A | (230) | (43) | (9) | (32) | (7) | (24) | (696) | (1,041) |
Depreciation | 228 | 134 | 7 | 100 | 4 | 43 | (85) | 432 |
Proportional EBITDA of jointly owned subsidiaries | - | - | - | - | - | - | 94 | 94 |
Adjusted EBITDA | 177 | 1,290 | 15 | 100 | 17 | 22 | (41) | 1,580 |
1Q19 Results | Steel | Mining | Port Logistics | Railway Logistics | Energy | Cement | Corporate Expenses/ Eliminations | Consolidated |
(R$ million) | ||||||||
Net Revenue | 3,605 | 2,079 | 52 | 335 | 70 | 120 | (255) | 6,005 |
Domestic Market | 2,567 | 245 | 52 | 335 | 70 | 120 | (629) | 2,760 |
Foreign Market | 1,038 | 1,834 | - | - | - | - | 374 | 3,245 |
COGS | (3,222) | (870) | (47) | (261) | (61) | (138) | 577 | (4,021) |
Gross Profit | 383 | 1,209 | 5 | 74 | 9 | (18) | 322 | 1,984 |
SG&A | (197) | (42) | (9) | (27) | (7) | (21) | (390) | (694) |
Depreciation | 157 | 92 | 7 | 92 | 4 | 32 | (79) | 306 |
Proportional EBITDA of jointly owned subsidiaries | - | - | - | - | - | - | 127 | 127 |
Adjusted EBITDA | 344 | 1,259 | 3 | 138 | 6 | (7) | (19) | 1,724 |
Steel Results
According to the World Steel Association (WSA), global crude steel production totaled 443.0 million tons (Mton) in1Q20, 1.4% lower YoY. Asia produced 315.2 Mton, drop of 0.3%, while the European Union and North America reduced by 10% and 4.0%, respectively YoY.
· In1Q20, CSN’s slab productiontotaled 884 thousand tons, 14% higher than in 4Q19, normalizing production after the revamp of blast furnace #3 in 2H19.
Steel Production | 1Q19 | 4Q19 | 1Q20 | Variation | |||||
(thousand tons) | 1Q20 | x | 1Q19 | 1Q20 | x | 4Q19 | |||
Total Slabs (UPV + Third parties) | 1,040 | 934 | 943 | (9%) | 1% | ||||
Slab Production | 830 | 775 | 884 | 7% | 14% | ||||
Third-party Slabs | 210 | 160 | 58 | (72%) | (64%) | ||||
Total Flat Rolled Products | 927 | 845 | 928 | - | 10% | ||||
Total Long Rolled Products | 51 | 61 | 51 | - | (17%) | ||||
Page 24
CONVENIENCE TRANSLATION INTO ENGLISH FROM THE ORIGINAL PREVIOUSLY ISSUED IN PORTUGUESE | ||
Quarterly Financial Information –June30, 2019 – CIA SIDERURGICA NACIONAL | Version: 1 | |
In1Q20, total sales reached1,140 thousand tons,2% higher compared to 4Q19, mainly due to higher sales in the foreign market. Domestic sales started to slowdown in the third week of March, due to the COVID-19 pandemic effects in some important segments.
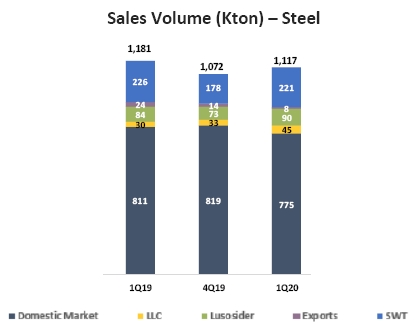
| · | In1Q20, volume of steel sold in thedomestic markettotaled 775 thousand tons, 5% less than 4Q19. Of this total, 720 thousand tons are flat steel and 55 thousand tons were long steel. According to the Brazilian Steel Institute (IABr), apparent consumption reached 5.1 million tons, decreasing 0.6% versus 1Q19. Brazilian crude steel production reached 8 million tons, decreasing 7% YoY. | 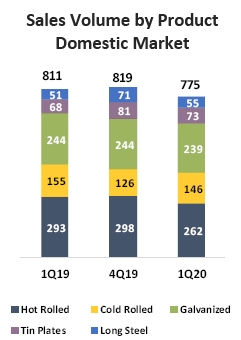 | |
| · | In foreign markets,sales in1Q20totaled 365 thousand tons, 22% higher QoQ, due to seasonality at SWT/Lusosider/LLC. In this period, 8 thousand tons were exported directly, and 356 thousand tons were sold through subsidiaries overseas, with 45 thousand tons by LLC, 221 thousand tons by SWT, and 90 thousand tons by Lusosider. | 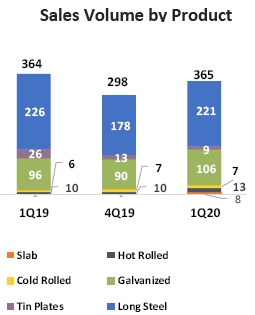 | |
Page 25
CONVENIENCE TRANSLATION INTO ENGLISH FROM THE ORIGINAL PREVIOUSLY ISSUED IN PORTUGUESE | ||
Quarterly Financial Information –June30, 2019 – CIA SIDERURGICA NACIONAL | Version: 1 | |
· In1Q20, CSN maintained a highshare of coated products of its total sales volume, following the strategy of adding more value to its product mix. Sales of coated products such as galvanized and tin plates accounted for 49% of flat steel sales, considering all the markets in which the Company operates. In the domestic market, coated products maintained 43% of flat steel sales in 1Q20.
According to ANFAVEA (National Association of Automobile Manufacturers),in 1Q20, the production of automobiles, light commercial vehicles, trucks and busesreached 585,889 thousand units, decreasing 16% YoY. Exports recorded a lower performance, totaling sales of 88,998 thousand vehicles, a 14.9% reduction in volume YoY.
According toABRAMAT (Construction Material Manufacturers’ Association), sales of construction materials increased 2.4% in 1Q20 on a YoY basis.
According toIBGE(Brazilian Institute of Geography and Statistics), production of home appliances increased by 11.8% in the last twelve months until March 2020, versus the same period in 2019. | 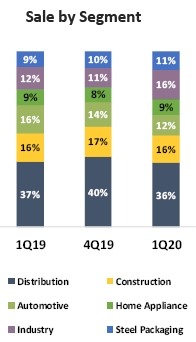 |
| · | Net revenuefrom Steel operations reached R$3,542 million in1Q20, 6% higher than in4Q19. This was due to higher sales volume in the foreign market and higher prices in both, domestic and foreign markets. Theaverage pricein domestic market was4% highercompared to the previous quarter, due to an increasing in steel prices. In the foreign market, the average price was 3% higher in the same comparison basis. |
|
| · | Cost of goods soldincreased by 2% in1Q20 over 4Q19, totaling R$3,237 million. | |
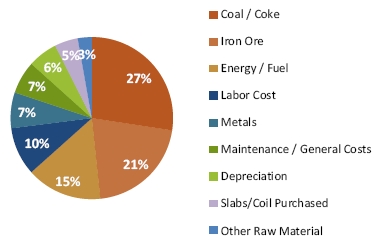
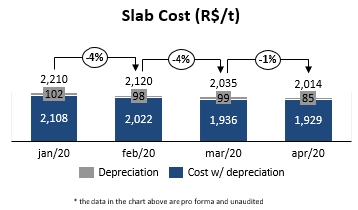
| · | Slab production cost in1Q20reached R$2,036/t, impacted by (1) power outage by utility company due to technical malfunction at a substation in January; (2) high humidity of raw materials impacted performance of the blast furnace in February. | |
| · | Since January, with production volumes stabilizing, slab cost has been positively evolving in a consistent way. | |
| · | Adjusted EBITDAreached R$298 million in1Q20, 68% higher than in 4Q19, with EBITDA margin at 8.4% in 1Q20. |
Page 26
CONVENIENCE TRANSLATION INTO ENGLISH FROM THE ORIGINAL PREVIOUSLY ISSUED IN PORTUGUESE | ||
Quarterly Financial Information –June30, 2019 – CIA SIDERURGICA NACIONAL | Version: 1 | |
Earnning Results
In1Q20, resilient steel demand in China (+1.4% YoY of gross steel production) and the prospect of an iron ore balance deficit, due to the heavy rainfall in Minas Gerais, had a lightly positive effect on prices. Within this context,iron ore reached an average price of US$89.00/dmt (Platts, Fe62%, N. China), stable when compared with the 4Q19 (US$88.61/dmt).
As for maritime freight, the BCI-C3 (Tubarão-Qingdao) route reached an average of US$13.79/wmt in 1Q20, 33% lower than the previous quarter, influenced by balanced supply and demand of vessels, as well as, oil prices at lower levels.
· In1Q20,iron ore production totaled 5.9 million tons, 39% lower YoY due to heavy rainfall in the region and delay in new mining fronts.
· In1Q20,sales volume reached 5.6 million tons, 37% lower YoY due to production restrictions, even with good availability of iron ore from third parties.
Mining Production Volume and Sales | 1Q19 | 4Q19 | 1Q20 | Variation | ||||||
(thousand tons) | 1Q20 | x | 1Q19 |
| 1Q20 | x | 4Q19 | |||
Total Production | 9,719 | 8,859 | 5,942 | (39%) |
| (33%) | ||||
Sales to UPV | 1,169 | 953 | 1,086 | (7%) | 14% | |||||
Volume Sold to Third Parties | 7,690 | 9,382 | 4,524 | (41%) | (52%) | |||||
Total Sales | 8,859 | 10,334 | 5,609 | (37%) |
| (46%) | ||||
Production volumes includes third party iron ore purchases.
Production and sales volumes includes CSN’s 100% stake in CSN Mineração.
· In1Q20,net revenuefrom mining operations totaled R$1,646 million, 35% lower than the previous quarter, due to lower sales volume (-37%).
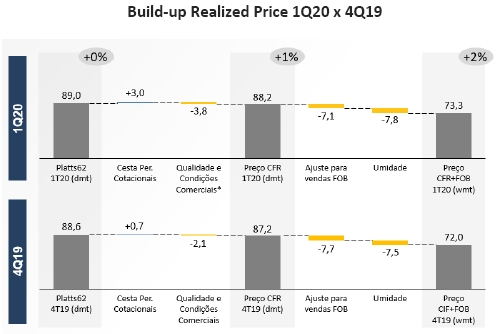
· The Platts 62 index reachedUS$89.0/dmt stable when compared to the previous quarter. CIF+FOB prices reachedUS$73.3/wmt, 2% higher than the previous quarter. The positive variation in 1Q20 is explained by the pricing basket of the quotational period and for a lower reduction on FOB freights.
· Cost of goods soldin the mining segment totaledR$823 million in1Q20, decreasing 5.4% on a YoY comparison. The FOB Cash Cost was USD21.3/t in 1Q20, or 11% higher YoY due to lower production volumes and a lower operational fixed dilution, that must return to normalized levels in the upcoming quarters.
· EBITDA reached R$921 million in 1Q20, with an EBITDA margin of 56%, providing a good quarter result even with a lower sales volume.
Page 27
CONVENIENCE TRANSLATION INTO ENGLISH FROM THE ORIGINAL PREVIOUSLY ISSUED IN PORTUGUESE | ||
Quarterly Financial Information –June30, 2019 – CIA SIDERURGICA NACIONAL | Version: 1 | |
CSN’s Logistics Results
Railway Logistics: In1Q20,net revenuereached R$282 million, withEBITDAof R$111 million andEBITDA marginof 39.2%.
Port Logistics: In1Q20, Sepetiba Tecon shipped 112 thousand tons of steel products, in addition to 2 thousand tons of general cargo, approximately 37 thousand containers and 488 thousand tons of bulk cargo.Net revenuereached R$75 million, with anEBITDAof R$23 million, andEBITDA marginof 31.1%.
Sepetiba TECON Highlights | 1Q19 | 4Q19 | 1Q20 | Variation | ||||||||||
1Q20 | x | 1Q19 | 1Q20 | x | 4Q19 | |||||||||
Container Volume (thousand units) | 43 | 39 | 37 |
|
| (14%) | (4%) |
| ||||||
Steel Volume (thousand tons) | 162 | 137 | 112 |
|
| (31%) | (18%) |
| ||||||
General Cargo Volume (thousand tons) | 1 | 3 | 2 |
|
| 229% | (31%) |
| ||||||
Bulk Volume (thousand tons) | 56 | 16 | 488 |
|
| 772% | 3003% |
| ||||||
Vehicles Volume (thousand units) | - | 2 | - |
|
| - | - |
| ||||||
CSN’s Energy Results
According to EPE (Energy Research Company), electricity consumption in Brazil decreased by 0.9% in 1Q20, versus the same period in 2019. The industrial segment reduced by 0.4% in the quarter, while residential and commercial segments decreased by 0.3% and 2.2%, respectively in the same comparison basis.
In 1Q20,the volume of energy traded decreased, totaling anet revenueof R$42 million, withEBTIDAof R$9 million andEBITDA margin of 22.3%.
CSN’s Cement Results
In 1Q20, domestic cement sales totaled 12.6 million tons, according to preliminary data from SNIC (National Cement Industry Association). This amount represents a decrease of 0.3% over the same period in 2019.
In 1Q20,net revenuereached R$146 million, 1.4% more than the previous quarter and 20.2% higher than in the same period in 2019, due to higher sales volume (+19%) compared to 1Q19, in addition to higher prices, generating anEBITDA of R$14 million andEBITDA margin of 9.7%%.
Page 28
CONVENIENCE TRANSLATION INTO ENGLISH FROM THE ORIGINAL PREVIOUSLY ISSUED IN PORTUGUESE | ||
Quarterly Financial Information –June30, 2019 – CIA SIDERURGICA NACIONAL | Version: 1 | |
Capital Markets
In 1Q20, CSN’s share depreciated 52.48%, while the Ibovespa decreased 15.49%. Daily traded volume (CSNA3) on B3 was R$159 million. On the New York Stock Exchange (NYSE), CSN’s American Depositary Receipts (ADR’s) depreciated 63.81% while the Dow Jones moved down 24.08%. On the NYSE, the average daily traded value of CSN’s ADR (SID) was US$12 million.
4Q19 | 1Q20 | |
Number of shares (in thousands) | 1,387,524 | 1,387,524 |
Market Cap |
|
|
Closing price (R$/share) | 14.11 | 6.98 |
Closing price (US$/ADR) | 3.45 | 1.31 |
Market cap (R$ million) | 20,805 | 9,685 |
Market cap (US$ million) | 5,230 | 1,818 |
Total return including Dividends and Interest on Equity |
|
|
CSNA3 | 6.73% | (52.48%) |
SID | 8.83% | (63.81%) |
Ibovespa | 11.14% | (15.49%) |
Dow Jones | 7.40% | (24.08%) |
Volume |
|
|
Daily average (thousand shares) | 10,651 | 14,491 |
Daily average (R$ thousand) | 137,760 | 158,635 |
Daily average (thousand ADRs) | 3,505 | 4,447 |
Daily average (US$ thousand) | 10,901 | 12,056 |
Source: Bloomberg | ||
Webcast - 1Q20 Earnings Presentation Investor Relations Team
Conference Call in Portuguese with Simultaneous Translation into English | CFO and IRO–Marcelo Cunha Ribeiro Leo Shinohara (leonardo.shinohara@csn.com.br) José Henrique Triques (jose.triques@csn.com.br) Sandra Saad (sandra.saad@csn.com.br) Guilherme Vinco (guilherme.vinco@csn.com.br)
|
May 15, 2020 | |
03:00 p.m. (US EDT) | |
04:00 p.m. (Brasilia Time) | |
Phone.:+1 929 378-3440 / +1 516 300-1066 | |
Code: CSN | |
Replay Phone: +55 113127-4999 | |
Replay Code:11977050 | |
Webcast:click here | |
| |
Some of the statements contained herein are forward-looking statements that express or imply expected results, performance or events. These include future results that may be implied by historical results and the statements under ‘Outlook’. Actual results, performance or events may differ materially from those expressed or implied by the forward-looking statements as a result of several factors, such as the general and economic conditions in Brazil and other countries, interest rate and exchange rate levels, protectionist measures in the USA, Brazil and other countries, changes in laws and regulations and general competitive factors (on a global, regional or national basis). |
Page 29
CONVENIENCE TRANSLATION INTO ENGLISH FROM THE ORIGINAL PREVIOUSLY ISSUED IN PORTUGUESE | ||
Quarterly Financial Information –June30, 2019 – CIA SIDERURGICA NACIONAL | Version: 1 | |
CONSOLIDATED SALES VOLUME (in thousands of tons)
| 1Q19 | 4Q19 | 1Q20 | Variation | ||||||
| 1Q20 | x | 1Q19 |
| 1Q20 | x | 4Q19 | |||
Flat Steel | 760 | 748 | 720 | (40) |
| (28) | ||||
Slab | - | - | - | - | - | |||||
Hot Rolled | 293 | 298 | 262 | (31) | (36) | |||||
Cold Rolled | 155 | 126 | 146 | (9) | 20 | |||||
Galvanized | 244 | 244 | 239 | (5) | (5) | |||||
Tin Plates | 68 | 81 | 73 | 5 | (8) | |||||
UPV Long Steel | 51 | 71 | 55 | 4 | (16) | |||||
DOMESTIC MARKET | 811 | 819 | 775 | (36) |
| (44) | ||||
| ||||||||||
| 1Q19 | 4Q19 | 1Q20 | 1Q20 | x | 1Q19 |
| 1Q20 | x | 4Q19 |
Flat Steel | 137 | 119 | 144 | 7 |
| 25 | ||||
Slab | - | - | 8 | 8 | 8 | |||||
Hot Rolled | 10 | 10 | 13 | 3 | 3 | |||||
Cold Rolled | 6 | 7 | 7 | 1 | - | |||||
Galvanized | 96 | 90 | 106 | 10 | 16 | |||||
Tin Plates | 26 | 13 | 9 | (17) | (4) | |||||
Long Steel Profiles | 226 | 178 | 221 | (5) |
| 43 | ||||
FOREIGN MARKET | 364 | 298 | 365 | 1 |
| 67 | ||||
|
|
|
| |||||||
| 1Q19 | 4Q19 | 1Q20 | 1Q20 | x | 1Q19 |
| 1Q20 | x | 4Q19 |
Flat Steel | 897 | 867 | 864 | (33) |
| (3) | ||||
Slab | - | - | 8 | 8 | 8 | |||||
Hot Rolled | 303 | 307 | 276 | (27) | (31) | |||||
Cold Rolled | 161 | 133 | 153 | (8) | 20 | |||||
Galvanized | 340 | 334 | 345 | 5 | 11 | |||||
Tin Plates | 94 | 94 | 82 | (12) | (12) | |||||
UPV Long Steel | 51 | 71 | 55 | 4 | (16) | |||||
Long Steel Profiles | 226 | 178 | 221 | (5) |
| 43 | ||||
TOTAL MARKET | 1,175 | 1,117 | 1,140 | (35) |
| 23 | ||||
Page 30
CONVENIENCE TRANSLATION INTO ENGLISH FROM THE ORIGINAL PREVIOUSLY ISSUED IN PORTUGUESE | ||
Quarterly Financial Information –June30, 2019 – CIA SIDERURGICA NACIONAL | Version: 1 | |
INCOME STATEMENT | |||
CONSOLIDATED – Brazilian Corporate Law (in thousands of reais) | |||
| 1Q19 | 4Q19 | 1Q20 |
Net Sales Revenue | 6,005,466 | 6,523,816 | 5,334,653 |
Domestic Market | 2,760,089 | 2,760,705 | 2,737,944 |
Foreign Market | 3,245,377 | 3,763,111 | 2,596,709 |
Costs of Goods Sold (COGS) | (4,021,495) | (4,429,143) | (4,017,707) |
COGS, excluding Depreciation and Depletion | (3,722,830) | (4,009,168) | (3,614,107) |
Depreciation/Depletion allocated to COGS | (298,665) | (419,975) | (403,600) |
Gross Profit | 1,983,971 | 2,094,673 | 1,316,946 |
Gross Margin (%) | 33% | 32% | 25% |
Selling Expenses | (572,205) | (907,221) | (387,639) |
General and Administrative Expenses | (113,959) | (121,879) | (110,750) |
Depreciation and Amortization Expenses | (7,501) | (11,798) | (11,581) |
Other Income (Expenses), net | (135,420) | (102,574) | (666,235) |
Equity in Results of Affiliated Companies | 25,833 | 6,747 | (45,108) |
Operating Income Before the Financial Result | 1,180,719 | 957,948 | 95,633 |
Net Financial Result | (635,099) | (298,335) | (1,201,138) |
Income before Income Tax and Social Contribution | 545,620 | 659,613 | (1,105,505) |
Income Tax and Social Contribution | (458,857) | 474,329 | (206,204) |
Profit for the Period | 86,763 | 1,133,942 | (1,311,709) |
Page 31
CONVENIENCE TRANSLATION INTO ENGLISH FROM THE ORIGINAL PREVIOUSLY ISSUED IN PORTUGUESE | ||
Quarterly Financial Information –June30, 2019 – CIA SIDERURGICA NACIONAL | Version: 1 | |
BALANCE SHEET |
CONSOLIDATED – Brazilian Corporate Law (in thousands of reais) |
12/31/2019 | 03/31/2020 | |
Current assets | 12,725,805 | 14,385,591 |
Cash and cash equivalents | 1,088,955 | 3,281,138 |
Financial Investments | 2,633,173 | 1,644,460 |
Accounts Receivable | 2,047,931 | 2,205,944 |
Inventory | 5,282,750 | 5,465,046 |
Other Current Assets | 1,672,996 | 1,789,003 |
Taxes to recover | 1,282,415 | 1,388,468 |
Prepaid expenses | 203,733 | 208,868 |
Dividends receivable | 44,554 | 44,554 |
Derivative financial instruments | 1,364 | 4,579 |
Others | 140,930 | 142,534 |
Non-current Assets | 38,143,471 | 38,337,492 |
Long-term Assets | 7,626,577 | 7,558,528 |
Financial Investments valued at amortized cost | 95,719 | 121,027 |
Deferred Taxex | 2,473,304 | 2,475,496 |
Other non-current assets | 5,057,554 | 4,962,005 |
Tax to recover | 2,119,940 | 1,956,660 |
Judicial deposits | 328,371 | 333,120 |
Prepaid expenses | 139,927 | 129,562 |
Credts Related Parties | 1,274,972 | 1,365,520 |
Others | 1,194,344 | 1,177,143 |
Investments | 3,584,169 | 3,600,997 |
Shareholdings | 3,482,974 | 3,438,752 |
Investment Properties | 101,195 | 162,245 |
Property, plant and equipmet | 19,700,944 | 19,857,633 |
Fixed Assets in Operation | 19,228,599 | 19,392,387 |
Lease | 472,345 | 465,246 |
Intangible Assets | 7,231,781 | 7,320,334 |
TOTAL ASSETS | 50,869,276 | 52,723,083 |
Current Liabilities | 11,619,957 | 11,970,831 |
Payroll and Related Taxes | 317,510 | 308,501 |
Trade Payables | 3,012,654 | 3,451,945 |
Taxes Payable | 541,027 | 486,766 |
Loans and Financing | 5,125,843 | 5,314,667 |
Other Payables | 2,526,444 | 2,325,921 |
Dividends and JCP Payable | 13,252 | 13,116 |
Customer Advances | 787,604 | 809,173 |
Payables – Drawee Risk | 1,121,312 | 937,576 |
Lease Liabilities | 35,040 | 31,807 |
Other Payables | 569,236 | 534,249 |
Provisions for Tax, Social Security, Labor and Civil Risks | 96,479 | 83,031 |
Non-current Liabilities | 27,887,387 | 35,345,710 |
Loans, Financing and Debentures | 22,841,193 | 30,305,393 |
Other Payables | 2,493,702 | 2,426,514 |
Customer Advances | 1,845,248 | 1,699,617 |
Lease Liabilities | 439,350 | 434,640 |
Derivative financial instruments |
| 94,909 |
Other Payables | 209,104 | 197,348 |
Deferred Taxes | 589,539 | 620,227 |
Provisions for Tax, Social Security, Labor and Civil Risks | 526,768 | 536,51 |
Other Provisions | 1,436,185 | 1,456,825 |
Provisions for Environmental Liabilities and Deactivation | 524,001 | 544,641 |
Pension and Health Plan | 912,184 | 912,184 |
Equity | 11,361,932 | 5,406,542 |
Paid-up Capital | 4,540,000 | 4,540,000 |
Capital Reserve | 32,720 | 32,720 |
Profit Reserve | 4,431,200 | 4,431,200 |
Accumulated Earnings | (1,360,851) | |
Other Comprehensive Income | 1,170,624 | (3,473,059) |
Non-controlling Interest | 1,187,388 | 1,236,532 |
TOTAL LIABILITIES AND EQUITY | 50,869,276 | 52,723,083 |
Page 32
CONVENIENCE TRANSLATION INTO ENGLISH FROM THE ORIGINAL PREVIOUSLY ISSUED IN PORTUGUESE | ||
Quarterly Financial Information –June30, 2019 – CIA SIDERURGICA NACIONAL | Version: 1 | |
CASH FLOW
CONSOLIDATED – Brazilian Corporate Law (in thousands of reais)
1Q19 | 4Q19 | 1Q20 | |
Net Cash generated by Operating Activities | 1,185,970 | 1,111,510 | 466,933 |
Net income (loss) for the period attributable to controlling shareholders | (7,572) | 1,044,514 | (1,360,851) |
Net income attributable to non-controlling shareholders | 94,335 | 89,428 | 49,142 |
Charges on loans and financing raised | 465,928 | 410,529 | 470,990 |
Charges on loans and financing granted | (13,946) | (13,509) | (11,481) |
Charges on lease liabilities | 4,957 | 16,177 | 13,056 |
Depreciation, depletion and amortization | 328,070 | 454,075 | 437,507 |
Equity in results of affiliated companies | (25,833) | (6,747) | 45,108 |
Deferred taxes | 89,039 | (777,754) | (11,351) |
Provisions for tax, social security, labor, civil and environmental risk | (69,853) | (31,638) | (8,685) |
Monetary and exchange rate variation, net | 239,582 | (65,389) | 522,571 |
Write-off of fixed and intangible assets | 13,712 | 74,797 | 1,400 |
Actuarial liability provision | - | (20,194) | - |
Adjusted shares – VJR | (127,653) | (246,525) | 962,561 |
Provisions for decommissioning and environmental liabilities | 7,592 | 9,233 | 20,640 |
Monetary correction of compulsory loan to Eletrobrás | (1,715) | - | - |
Provisions (reversal) for consumption and services | 8,853 | (181,587) | 37,158 |
Credit from Pis and Cofins | - | (160,609) | - |
Contractual agreements | - | (131,817) | - |
Other provisions | 10,992 | 12,029 | (1,579) |
Working Capital Variation | 758,388 | 1,056,057 | (188,011) |
Accounts receivable – third parties | (713,057) | 211,970 | (89,849) |
Accounts receivable – related parties | (92,283) | 13,551 | (31,572) |
Inventories | (653,465) | 648,224 | (13,512) |
Borrowings – related parties | 447 | 93,956 | - |
Taxes to offset | (41,211) | 210,739 | 57,227 |
Judicial deposits | (11,569) | 22,746 | (4,749) |
Trade payables | (170,461) | (202,903) | 341,567 |
Trade payables – Drawee Risk | 235,181 | 193,134 | (183,736) |
Payroll and related taxes | 14,014 | (65,056) | (14,420) |
Taxes/Refis | 282,973 | 51,037 | (61,612) |
Accounts payable – related parties | (30,173) | 25,494 | (20,572) |
Customer advances | 1,935,831 | (121,136) | (130,568) |
Other | 2,161 | (25,699) | (36,215) |
Other Payments and Receipts | (590,621) | (419,560) | (511,242) |
Interest paid | (590,621) | (419,560) | (511,242) |
Cash Flow from Investing Activities | (220,750) | (919,840) | (404,851) |
Investments/Future Advance for capital increase | - | (153,606) | - |
Acquisition of intangible assets | (313,579) | (838,544) | (353,698) |
Receipt / (payment) in derivative transactions | (372) | 142 | - |
Loans granted - related parties | (40,643) | - | (82,089) |
Loans received - related parties | 16,796 | 3,237 | 3,022 |
Financial application, net of redemption | 117,048 | 90,276 | 27,914 |
Cash used to acquire a stake in CBSI | (21,345) | ||
Cash Flow from Financing Activities | (514,817) | (999,075) | 2,157,127 |
Loans and financing raised | 2,465,845 | 492,789 | 4,553,970 |
Loan amortizations – principal | (2,939,145) | (1,340,202) | (2,363,666) |
Borrowing costs | (28,810) | (15,289) | (9,131) |
Lease amortizations | (12,707) | (37,258) | (23,910) |
Dividends paid | - | (99,115) | (136) |
Exchange Rate Variation on Cash and Cash Equivalents | 3,670 | 497 | (27,026) |
Cash Flow | 454,073 | (806,908) | 2,192,183 |
Page 33
CONVENIENCE TRANSLATION INTO ENGLISH FROM THE ORIGINAL PREVIOUSLY ISSUED IN PORTUGUESE | ||
Quarterly Financial Information –June30, 2019 – CIA SIDERURGICA NACIONAL | Version: 1 | |
(Expressed in thousands of reais – R$, unless otherwise stated)
1. DESCRIPTION OF BUSINESS
Companhia Siderúrgica Nacional “CSN”, also referred to as “the Company” or “Parent Company”, is a publicly-held company incorporated on April 9, 1941, under the laws of the Federative Republic of Brazil (Companhia Siderúrgica Nacional, its subsidiaries, associates and joint ventures are collectively referred to herein as the "Group”). The Company’s registered office is located in São Paulo, SP, Brazil.
CSN is listed on the São Paulo Stock Exchange (B3 S.A.- Brasil, Bolsa, Balcão) and on the New York Stock Exchange (NYSE). Accordingly, the Company reports its information to the Brazilian Securities and Exchange Commission (CVM) and the U.S. Securities and Exchange Commission (SEC).
The Group's main operating activities are divided into five segments as follows:
· Steel:
The Company’s main industrial facility is the Presidente Vargas steelworks (“UPV”), located in the city of Volta Redonda, state of Rio de Janeiro. This segment consolidates all operations related to the production, distribution and sale of flat steel, long steel, metallic containers and galvanized steel. In addition to the facilities in Brazil, CSN has commercial operations in the United States and operations in Portugal and Germany aimed at gaining markets and providing excellent services to end consumers. Its steel is used in home appliances, civil construction and automobile industries.
· Mining:
The production of iron ore is developed in the cities of Congonhas, Ouro Preto and Belo Vale, in the state of Minas Gerais, by the subsidiary CSN Mineração.
Iron ore is sold basically in the international market, especially in Europe and Asia. The prices charged in these markets are historically cyclical and subject to significant fluctuations over short periods of time, driven by several factors related to global demand, strategies adopted by the major steel producers, and the foreign exchange rate. All these factors are beyond the Company’s control. The ore transportation is carried out through Terminal de Carvão e Minérios do Porto de Itaguaí – (“TECAR”), a solid bulk terminal, one of the four terminals that comprise the Itaguaí Port, in State of Rio de Janeiro. Imports of coal and coke are also carried out through this terminal by providing services by CSN Mineração to CSN. The Company´s mining activities also comprise exploitation of tin in the State of Rondônia, to supply the needs of the UPV. The surplus of these raw materials is sold to subsidiaries and third parties.
The Company's mining activities utilize tailings filtering and dams are maintained for contingent situations (power supply shortfalls, sudden interruptions in the beneficiation plant, etc.) for tailing discharges. The Company has invested around R$250 million in two filtering plants. The filtered tailings are placed in piles geotechnically controlled which represents a new trend in iron ore mining without the use of tailing dams. As a result of those measures, decommissioning of dams is the natural path of processing dry tailings.
All of our dams, both mining and hydroelectric dams, are positively certified and comply with the environmental legislation in force.
· Cement:
CSN entered the cement market boosted by the synergy between this activity and its existing businesses. Next to the Presidente Vargas Steelworks (UPV) in Volta Redonda (RJ), the Company installed a new business unit that produces CP-III type cement using slag produced by the UPV’s blast furnaces. It also exploits limestone and dolomite at the Arcos unit in the State of Minas Gerais, to meet the needs of the UPV and of the cement plant. Additionally, the operation clinker production line is located in Arcos/MG. As a result, the Company is self-sufficient in the production of cement, with an installed capacity of 4.7 million tons per year.
· Logistics
Railroads:
CSN has interests in three railroad companies: MRS Logística S.A., which manages the Southeast Railway System of the former Rede Ferroviária Federal S.A. (“RFFSA”), Transnordestina Logística S.A. (“TLSA”) and FTL - Ferrovia Transnordestina Logística S.A. (“FTL”), the last two having the concession to operate the former Northeast Railway System of RFFSA, in the States of Maranhão, Piauí, Ceará, Rio Grande do Norte, Paraíba, Pernambuco, Alagoas and Sergipe, with TLSA being responsible for the rail links of Eliseu Martins-Trindade, Trindade-Salgueiro, Salgueiro-Porto Suape, Salgueiro - Missão Velha and Missão Velha – Pecém (Railway System II),and construction phase, and FTLresponsible for the rail links of São Luís - Altos, Altos - Fortaleza, Fortaleza - Sousa, Sousa - Recife/Jorge Lins, Recife/Jorge Lins - Salgueiro, Jorge Lins - Propriá, Paula Cavalcante - Cabedelo, Itabaiana - Macau (Railway System I).
Page 34
CONVENIENCE TRANSLATION INTO ENGLISH FROM THE ORIGINAL PREVIOUSLY ISSUED IN PORTUGUESE | ||
Quarterly Financial Information –June30, 2019 – CIA SIDERURGICA NACIONAL | Version: 1 | |
Ports:
The Company operates in the State of Rio de Janeiro, through its subsidiary Sepetiba Tecon S.A., the Container Terminal ("TECON”) and through its subsidiary CSN Mineração S.A., TECAR, both at the Itaguaí Port. Locate in the Bay of Sepetiba, they have privileged highway, railroad and maritime access.
TECON handles and stores containers, vehicles, steel products, general cargo, among other products, and TECAR performs the operational activities of loading and unloading of solid bulk ships, storage and distribution (road and rail) of coal, coke, petroleum coke, clinker, zinc concentrate, sulfur, iron ore and other bulk intended for the seaborne market, for own consumption or for different customers.
· Energy:
As energy is fundamental to its production process, the Company has electric energy generation assets to guarantee its self-sufficiency.
Note 23 - “Segment Information” details the financial information per CSN´s business segment.
· Going Concern
The interim financial information was prepared based on the normal continuity of its business.
The negotiations for reprofiling part of the debts remain in constant progress and do not jeopardize the Company's operating continuity. The management does not have any other relevant operational restructuring plan that implies a change to the conclusion of the operational continuity. Except for the statement in the next paragraph, the assumptions adopted on the disclosures on the bases for evaluating the operational continuity included in the financial statements of December 31, 2019 remain unchanged in their majority, being those financial statements approved by Management on March 4, 2020.
The COVID-19 pandemic was a new and important factor that emerged globally, reaching great relevance at the end of the first quarter 2020 causing impacts to the global economy. Our operations had not experienced significant impacts until March 31, 2020, but we expect some adverse effects during the second quarter. However, it is not possible to predict how long the pandemic will continue active and what its effects will be in the global economy as well as in our activities. We haven’t identified any evidences of continuity risks and substantially maintained our primary operating assumptions unchanged, except for the assessment of turning off the blast furnace No.2 anytime during the second half of May 2020 consequently reducing steel production volumes in the Presidente Vargas steelworks. We continue closely monitoring the pandemic unfoldings and, in the case the global business and economic environments further deteriorate significantly, our projections may be revised to face the incoming challenges. Our other operating projections in mining, cement and logistics continue with no significant impacts.
2. SUMMARY OF SIGNIFICANT ACCOUNTING POLICIES
2.a) Basis of preparation and declaration of conformity
The consolidated and parent company condensed interim financial information (“condensed quarterly information”) have been prepared and are being presented in accordance with accounting practices adopted in Brazil based on the provisions of the Brazilian Corporate Law, pronouncements, guidelines and interpretations issued (CPC), approved by CVM, besides the own standards issued by the Brazilian Securities and Exchange Commission (“CVM”) and International Financial Reporting Standards (“IFRS”) issued by the International Accounting Standard Board (IASB) and highlight all the relevant information of the interim financial statements, and only this information, is being disclosed and corresponds to the information used by the Company's management in its activities
Page 35
CONVENIENCE TRANSLATION INTO ENGLISH FROM THE ORIGINAL PREVIOUSLY ISSUED IN PORTUGUESE | ||
Quarterly Financial Information –June30, 2019 – CIA SIDERURGICA NACIONAL | Version: 1 | |
The interim financial information has been prepared and is being presented in accordance with CPC 21 (R1) - “Interim Financial Reporting” and IAS 34 - “Interim Financial Reporting”, consistently with the standards issued by the CVM.
The significant accounting policies applied in this interim financial information are consistent with the policies described in Note 02 to the Company’s financial statements for the year ended December 31, 2019, filed with CVM.
This interim financial information does not include all requirements of annual or full financial statements and, accordingly, should be read in conjunction with the Company’s financial statements for the year ended December 31, 2019.
Therefore, in this interim financial information the following notes are not repeated, either due to redundancy or to the materiality in relation to those already presented in the annual financial statements:
Note 02 – Summary of significant accounting policies
Note 08 - Investments
Note 15 - Taxes in installments
Note 16 - Provision for tax, social security, labor, civil and environmental risks and judicial deposits
Note 26 – Employee benefits
Note 27 – Commitments
The parent company and consolidated interim financial information was approved by Management on May 14, 2020.
2.b) Basis of presentation
The interim financial information is presented in Brazilian reais (R$), which is the Company’s principal functional currency and the Group’s presentation currency.
Transactions in foreign currencies are translated into the functional currency using the exchange rates in effect at the dates of the transactions or valuations when items are remeasured. The asset and liability balances are translated at the exchange rates prevailing at the end of the reporting period. As of March 31, 2020, US$1 is equivalent to R$5.1987 (R$4.0307 as of December 31, 2019) and €1 is equivalent to R$5.7264 (R$4.5305 as of December 31, 2019), according to the rates obtained from the Central Bank of Brazil website.
2.c) Basis of consolidation
The accounting policies have been consistently applied to all consolidated companies. The consolidated financial statements for the period ended March 31, 2020 and year ended December 31, 2019 include the following direct and indirect subsidiaries and joint ventures, as well as the exclusive funds, as described below:
Page 36
CONVENIENCE TRANSLATION INTO ENGLISH FROM THE ORIGINAL PREVIOUSLY ISSUED IN PORTUGUESE | ||
Quarterly Financial Information –June30, 2019 – CIA SIDERURGICA NACIONAL | Version: 1 | |
· Companies
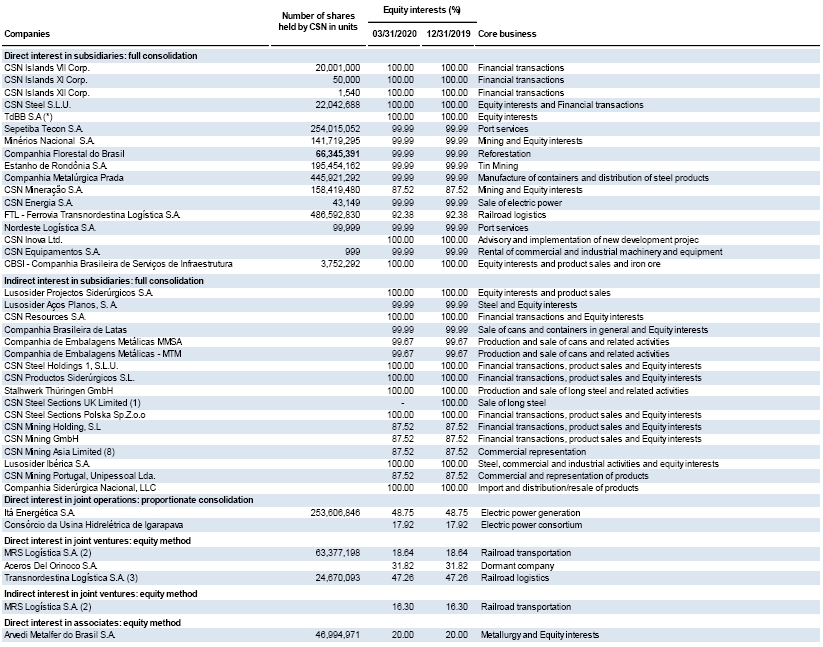
(*) Dormant companies, therefore, they are presented in note 9.a., where information on companies accounted for under the equity method and fair value through profit or loss and comprehensive income are disclosed;
1. The company was liquidated on March 11, 2020;
2. As of March 31, 2020 and December 31, 2019, the Company directly owned 63,377,198 common shares, 26.611,282 preferred shares class A and 36,765,916 preferred shares class B and indirectly owned 63,388,872 common shares, 25.802,872 preferred shares class A and 37,563,000 preferred shares class B of MRS Logistica S.A..
3. As of March 31, 2020,the Company held 24,168,304 common shares and 501,789 preferred shares Class B.
Page 37
CONVENIENCE TRANSLATION INTO ENGLISH FROM THE ORIGINAL PREVIOUSLY ISSUED IN PORTUGUESE | ||
Quarterly Financial Information –June30, 2019 – CIA SIDERURGICA NACIONAL | Version: 1 | |
· Exclusive funds
Equity interests (%) | ||||||
Exclusive funds | 03/31/2020 |
| 12/31/2019 |
| Core business | |
Direct interest: full consolidation |
|
|
|
|
|
|
Diplic II - Private credit balanced mutual fund | 100.00 | 100.00 | Investment fund | |||
Caixa Vértice - Private credit balanced mutual fund |
| 100.00 |
| 100.00 |
| Investment fund |
VR1 - Private credit balanced mutual fund | 100.00 | 100.00 | Investment fund | |||
2.d) COVID-19 effects
As of December 31, 2019, the first cases of Covid-19 arose in many countries and in March 2020 the WHO (World Health Organization) declared the pandemic of the virus. Brazil is one of the countries with community transmission and, accordingly, the Company has adopted several precautionary measures to reduce exposure of its employees and assure the continuity of its businesses.
All employees in conditions of vulnerability (group of risk) have been identified and set on vacations together with many others with the purpose of reducing around 50% of the corporate staff in the Company’s premises. Additionally, we provided masks to our employees, placed hand sanitizers in all of our premises and, also, circulate internal communications with preventive measures with the purpose of reinforcing the hygiene protocols recommended by the authorities.
Also, the Company has permanently assessed in details the effects caused by the Covid-19 pandemic in its businesses due to the sharp decrease in the economic activities in Brazil since the end of March 2020, which imposed restrictions and measures of social distancing with the purpose of reducing the virus circulation. The Company expects some impacts in its businesses, but they may not be measured reliably due to all uncertain in which the Company is inserted.
The Company’s economic activity is directly linked to the steel products demand in the automotive, domestic and civil construction segments, as well as in the iron ore’s in the domestic and international markets. Any reduction in the activities of those segments may affect the demand and the prices of our products and bring relevant impacts in our financial position and results.
The potential economic effects of Covid-19 in the Company are presented below:
a) Operating effects
The 2020 budget of investments has been revised considering the adverse effects of a global economic deacceleratiwe on and, consequently, the amount of investments has been reduced since priority is given to primary sustaining investments to maintain our current conditions in the operating capacity, environmental and security.
The Company considers to turn off the blast furnace No.2 in the Presidente Vargas steelplant (UPV), in the city of Volta Redonda – RJ, due to the weak global economic scenario and CSN is a major supplier of raw material to the automotive, appliances and civil construction industries.However, blast furnace No.3 has been recently refurbished and has the productive capacity to supply the current demand and the growing demand that will arise as the pandemic begins to decline and the global economy starts to recover.
As of March 31, 2020, the pandemic effects had not caused relevant impacts in our steel, mining, cement and others revenues. However, the Company expects to experience an important decrease in the domestic steel demand in the second quarter. Those impacts will be partially offset by shifting its products to the international market with an additional benefit of the strong appreciation of the exchange rates against the Brazilian Real.
The Company’s rail and seaborne logistics are not experiencing any impacts as well as the Company’s supply chain that could cause interruptions in its operating activities.
b) Assets recovery and financial and non-financial liabilities
The pandemic has not caused any significant impacts in the fair value of our assets and liabilities, except for the market value of our Usiminas’ shares that, as of March 31, 2020, had accumulated losses of R$962 million in the quarter. It is not possible to predict the actual impact of the pandemic in the Company’s businesses. In limit situations, certain covenants or special obligations applicable to our debt instruments may be achieved. The Company closely monitors the indicators to avoid the risks to its financial position.
Page 38
CONVENIENCE TRANSLATION INTO ENGLISH FROM THE ORIGINAL PREVIOUSLY ISSUED IN PORTUGUESE | ||
Quarterly Financial Information –June30, 2019 – CIA SIDERURGICA NACIONAL | Version: 1 | |
There are no relevant impacts in the Company’s financial assets. A portion of the receivables has been postponed but it is expected to be fully received until the end of the second quarter of 2020. The default rate of the Company’s receivables has not changed significantly and is not expected to change in the future.
Our portfolio of investments and the nature of our industrial plants have long-term characteristics. The long-term operating and economic context in which the Company is inserted gives us more flexibility in the strategies and plans to mitigate the risks and effects of the pandemic and, accordingly, ensure the maintenance of recoverability expected from our non-financial assets, such as equity instruments, property, plant and equipment and tax credits. We realized stressing tests playing with many assumptions of our business projections, especially for the years 2020 and 2021, and did not identify any impairment losses that should be recognized in our financial information as of March 31, 2020.
According to orientations given by the Brazilian Securities and Exchange Commission (CVM), the Company assessed effects that eventually could have a relationship with its business continuity and accounting estimates. Despite we have perceived some adverse effects, we consider risks of continuity do not exist and changes to our accounting estimates are not necessary that could produce significant effects in the Company’s businesses and, consequently, in the financial position. But, due to the scenario uncertain and for being impossible to predict how long the current situation will last, it is not possible to measure reliably future eventual impacts of the pandemic in our businesses, financial position and results. Despite a few effects perceived in the short-term, the Company maintains in its entirety the production and sales projections for the medium and long terms.
3. CASH AND CASH EQUIVALENTS
|
| Consolidated |
|
| Parent Company | ||
| 03/31/2020 |
| 12/31/2019 | 03/31/2020 | 12/31/2019 | ||
Current |
|
|
|
|
|
|
|
Cash and cash equivalents | |||||||
Cash and banks | 1,710,799 |
| 496,769 |
| 278,413 |
| 99,835 |
Short-term investments |
|
|
|
|
|
|
|
In Brazil: | |||||||
Government securities | 439 |
| 69,093 |
| 77 |
| 735 |
Private securities | 1,517,759 | 462,831 | 1,147,496 | 291,537 | |||
| 1,518,198 |
| 531,924 |
| 1,147,573 |
| 292,272 |
Abroad: | |||||||
Private securities | 52,141 |
| 60,262 |
|
|
|
|
Total short-term investments | 1,570,339 | 592,186 | 1,147,573 | 292,272 | |||
Cash and cash equivalents | 3,281,138 |
| 1,088,955 |
| 1,425,986 |
| 392,107 |
The funds available established in Brazil, are basically invested in private securities and yield interest based on the floating of Certificates of Interbank Deposits (“CDI”) and government securities are basically repurchase agreements backed by National Treasury Notes. The Company invests part of the funds through exclusive fund investments, and their financial statements were consolidated into the Company’s statements.The funds are managed by BNY Mellon Serviços Financeiros DTVM S.A. and Caixa Econômica Federal (CEF).
A significant part of the funds is invested abroad in Time Deposits in banks considered by management as top rated banks and the returns are based on fixed interest rates.
Page 39
CONVENIENCE TRANSLATION INTO ENGLISH FROM THE ORIGINAL PREVIOUSLY ISSUED IN PORTUGUESE | ||
Quarterly Financial Information –June30, 2019 – CIA SIDERURGICA NACIONAL | Version: 1 | |
4. FINANCIAL INVESTMENTS
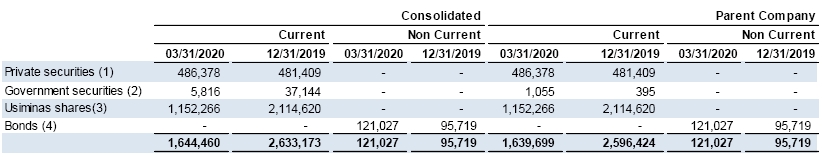
1. Restricted financial investments linked to Bank Certificate of Deposit to secure a letter of guarantee of certain loans.
2. Investments in National Treasury Bills (LFT) managed by its exclusive funds.
3. A portion of the shares is given as guarantee to a portion of the Company’s debt.
4. Bonds issued by Fibra with maturity in February 2028.
5. TRADE RECEIVABLES
Consolidated |
| Parent Company | |||||
03/31/2020 |
| 12/31/2019 |
| 03/31/2020 |
| 12/31/2019 | |
Trade receivables |
|
|
|
|
|
|
|
Third parties |
|
|
|
|
|
|
|
Domestic market | 1,106,924 |
| 1,118,632 |
| 822,577 |
| 852,434 |
Foreign market | 1,151,052 |
| 1,003,905 |
| 61,714 |
| 62,833 |
| 2,257,976 |
| 2,122,537 |
| 884,291 |
| 915,267 |
Allowance for doubtful debts | (254,192) | (245,194) | (169,290) | (167,247) | |||
| 2,003,784 |
| 1,877,343 |
| 715,001 |
| 748,020 |
Related parties (Note 17 a) | 202,160 | 170,588 | 1,338,613 | 943,623 | |||
| 2,205,944 |
| 2,047,931 |
| 2,053,614 |
| 1,691,643 |
In accordance with the sales policy the Group carries out transactions of assignment of receivables without co-obligation in which, after assigning the customer’s trade notes/bills and receiving the amounts from each transaction closed, CSN settles the receivables and becomes entirely free from the credit risk of the transaction. This transaction in the consolidated totals R$20,531 as of March 31, 2020 (R$51,161 as of December 31, 2019) and in the Parent Company R$ 16,242 (R$47,994 as of December 31,2019).
The gross balance of receivables from third parties is comprised as follows:
Consolidated |
| Parent Company | ||||||
03/31/2020 |
| 12/31/2019 |
| 03/31/2020 |
| 12/31/2019 | ||
Current |
| 1,773,461 |
| 1,739,746 |
| 707,345 |
| 731,377 |
Past-due up to 30 days | 244,860 | 132,845 | 36,219 | 9,089 | ||||
Past-due up to 180 days |
| 47,649 |
| 23,877 |
| 2,528 |
| 6,684 |
Past-due over 180 days | 192,006 | 226,069 | 138,199 | 168,117 | ||||
|
| 2,257,976 |
| 2,122,537 |
| 884,291 |
| 915,267 |
The movements in the Company’s allowance for doubtful debts are as follows:
Consolidated |
| Parent Company | ||||||
03/31/2020 |
| 12/31/2019 |
| 03/31/2020 |
| 12/31/2019 | ||
Opening balance |
| (245,194) |
| (237,352) |
| (167,247) |
| (176,855) |
Estimated losses |
| (11,180) |
| (43,313) |
| (3,734) |
| (18,540) |
Recovery of receivables |
| 2,182 |
| 35,471 |
| 1,691 |
| 28,148 |
Closing balance | (254,192) | (245,194) | (169,290) | (167,247) |
Page 40
CONVENIENCE TRANSLATION INTO ENGLISH FROM THE ORIGINAL PREVIOUSLY ISSUED IN PORTUGUESE | ||
Quarterly Financial Information –June30, 2019 – CIA SIDERURGICA NACIONAL | Version: 1 | |
6. INVENTORIES
|
| Consolidated |
|
|
| Parent Company | |
03/31/2020 | 12/31/2019 |
| 03/31/2020 | 12/31/2019 | |||
Finished goods | 1,941,688 |
| 1,691,842 |
| 1,209,187 |
| 1,141,385 |
Work in progress | 1,294,420 | 1,294,369 |
| 1,051,143 | 1,081,050 | ||
Raw materials | 1,368,692 |
| 1,493,129 |
| 691,314 |
| 1,021,350 |
Storeroom supplies | 936,795 | 902,135 |
| 524,208 | 502,591 | ||
Advances to suppliers | 38,826 |
| 35,828 |
| 33,017 |
| 31,541 |
Provision for losses | (115,375) | (134,553) | (38,565) | (41,201) | |||
| 5,465,046 |
| 5,282,750 |
| 3,470,304 |
| 3,736,716 |
The movements in the provision for inventory losses are as follows:
Consolidated |
| Parent Company | ||||||
03/31/2020 |
| 12/31/2019 |
| 03/31/2020 |
| 12/31/2019 | ||
Opening balance |
| (134,553) | (157,754) | (41,201) | (45,076) | |||
Reversal / (losses) for slow-moving and obsolescence |
| 19,178 | 23,201 | 2,636 | 3,875 | |||
Closing balance |
| (115,375) | (134,553) | (38,565) | (41,201) | |||
Page 41
CONVENIENCE TRANSLATION INTO ENGLISH FROM THE ORIGINAL PREVIOUSLY ISSUED IN PORTUGUESE | ||
Quarterly Financial Information –June30, 2019 – CIA SIDERURGICA NACIONAL | Version: 1 | |
7. OTHER CURRENT AND NONCURRENT ASSETS
The group of other current and noncurrent assets is comprised as follows:
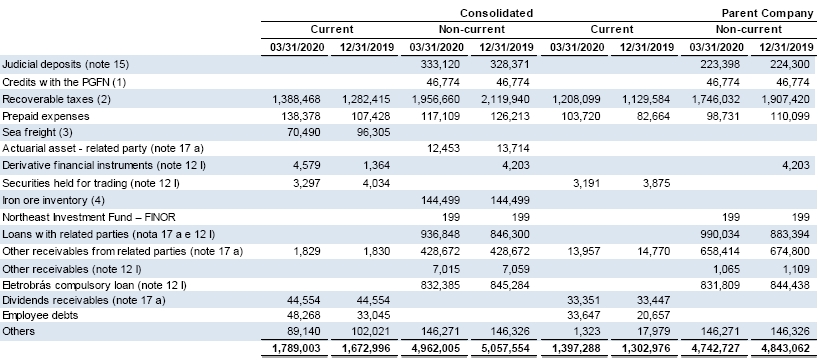
1. Refers to the excess of judicial deposit originated by the 2009 REFIS (Tax Debt Refinancing Program).
2. Refers mainly to PIS / COFINS, ICMS recoverable and income and social contribution taxes to be offset. On September 20, 2018, the writ of mandamus and special appeal filed in 2006, in which CSN and Federal Union were parties, related to the discussion about the non-inclusion of ICMS in the calculation base of PIS and COFINS, confirmed the CSN's right to offset the amounts unduly paid under these taxes from 2001 to 2014.
3. Refers a payment of freight expenses and maritime insurance over revenues didn’t recognized.
4. Long-term iron ore inventories that will be used after the construction of the processing plant, which will produce pellet feed, expected to start operating from the second half of 2021.
5. Refers to a virtually certain receivable, arising from the res judicata favorable decision to the Company, which is irreversible and irrevocable, to apply the STJ's consolidated position on the subject, which culminated in the conviction of Eletrobrás to the payment of the correct interest and monetary adjustment of the Compulsory Loan. The res judicata decision, as well as the certainty about the amounts involved in the liquidation of the sentence (judicial procedure to request the satisfaction of the right), allowed the conclusion that the entry of this value is certain. In addition to this amount recognized, the Company continues seeking alternatives to recover additional unrecognized credits over R$350 million at the Company’s best estimates.
8. INVESTMENTS
The information on the activities of subsidiaries, joint ventures, joint operations, associates and other investments did not have any changes in relation to that disclosed in the Company's financial statements as of December 31, 2019 and, accordingly, the Company decided not to repeat it in the condensed interim financial information as of March 31, 2020.
Page 42
CONVENIENCE TRANSLATION INTO ENGLISH FROM THE ORIGINAL PREVIOUSLY ISSUED IN PORTUGUESE | ||
Quarterly Financial Information –June30, 2019 – CIA SIDERURGICA NACIONAL | Version: 1 | |
8.a) Direct interests in subsidiaries, joint ventures, joint operations, associates and other investments
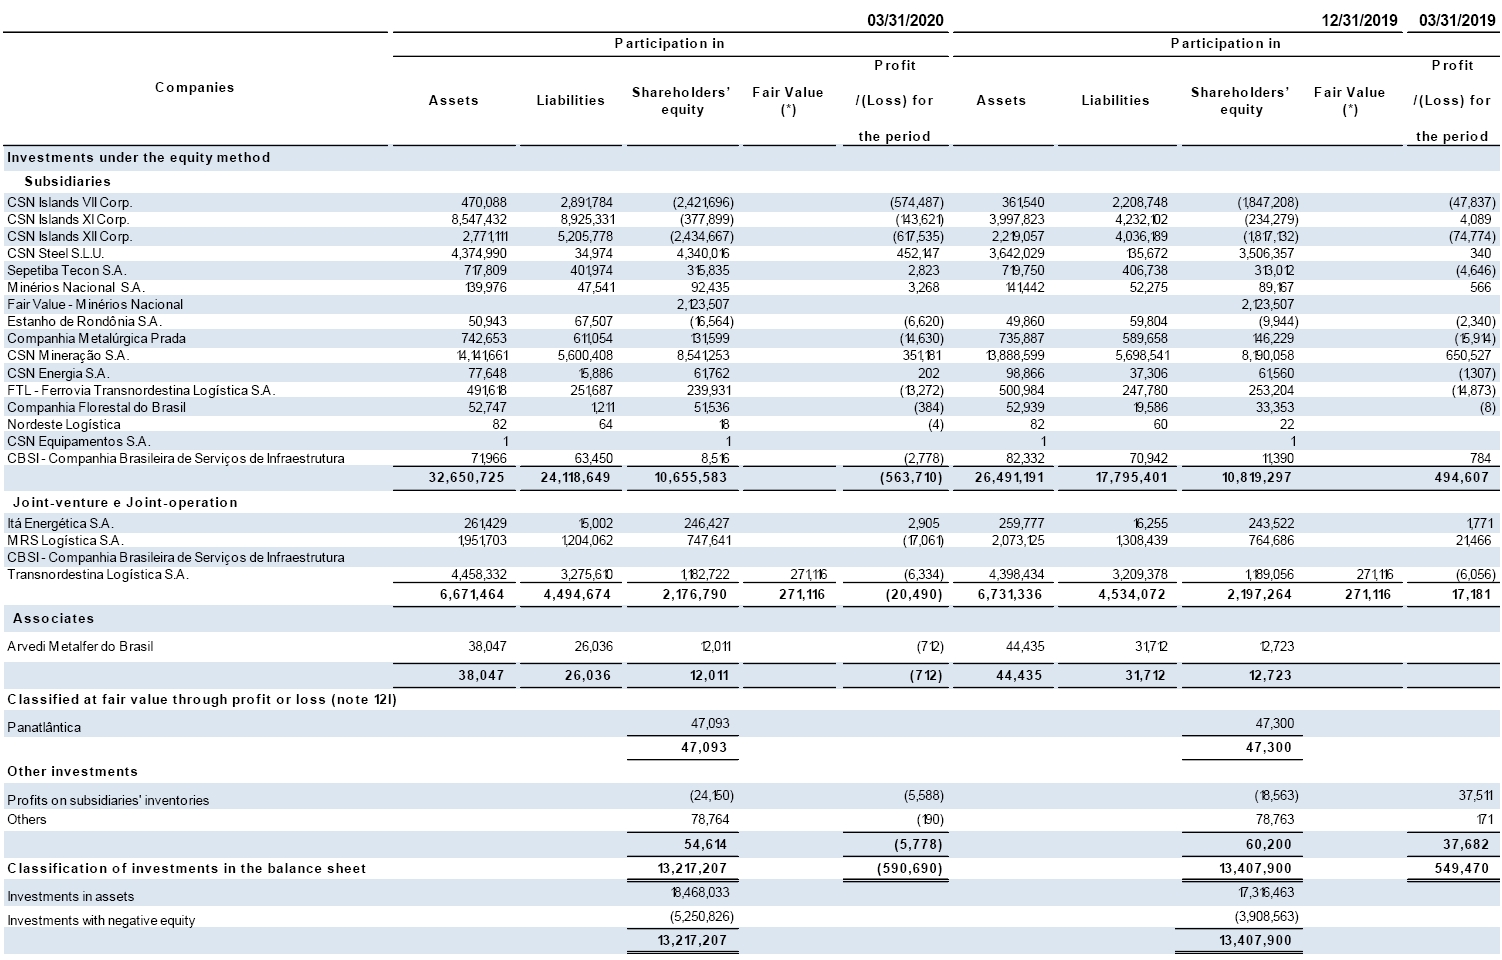
(*) As of March 31, 2020 and December 31, 2019, the net balance of R$271,116 refers to fair value allocation in the loss of control in Transnordestina Logística S.A. in the amount of R$659,105, further impaired in R$387,989 before taxes.
The number of shares, the balances of assets, liabilities and shareholders’ equity, and the amounts of profit/(loss) for the period refer to the interests held by CSN in those companies.
8.b) Movement in investments in subsidiaries, joint ventures, joint operations, associates and other investments
Consolidated | Parent Company | ||||||
03/31/2020 |
| 12/31/2019 |
| 03/31/2020 |
| 12/31/2019 | |
Opening balance of investments | 3,482,974 | 5,630,613 | 17,316,463 | 20,232,005 | |||
Opening balance of loss provisions | (3,908,563) | (3,258,138) | |||||
Capital increase/acquisition of shares | 27,909 | 18,566 | 66,621 | ||||
Dividends | (94,603) | 96 | (4,166,291) | ||||
Comprehensive income (1) | 31 | (2,592) | 381,542 | 31,441 | |||
Equity pickup (2) | (41,159) | 175,524 | (590,690) | 2,720,437 | |||
Update of shares measured at fair value through profit or loss (Note 12 II) | (207) | (118,780) | (207) | (118,780) | |||
Reclassification of Usiminas’ shares | (2,114,620) | (2,114,620) | |||||
Goodwill from acquisition of 50% interest of CBSI (note 8d) | 15,225 | ||||||
Consolidation of CBSI (Note 8d) | (8,775) | ||||||
Amortization of fair value - investment MRS | (2,937) | (11,747) | |||||
Others | 50 | 45 | |||||
Closing balance of investments | 3,438,752 | 3,482,974 | 18,468,033 | 17,316,463 | |||
Balance of provision for investments with negative equity | (5,250,826) | (3,908,563) | |||||
Total | 3,438,752 | 3,482,974 | 13,217,207 | 13,407,900 |
1. Refers to a translation to reporting currency of the foreign investment whose functional currency is not the Real, actuarial gain/loss and gain/loss on investment hedge from investments accounted for under the equity method.
2. The reconciliation of the equity in results of joint ventures and associates and the amount recorded in the statement of income are presented below and derive from the elimination of results of CSN's transactions with these companies:
Page 43
CONVENIENCE TRANSLATION INTO ENGLISH FROM THE ORIGINAL PREVIOUSLY ISSUED IN PORTUGUESE | ||
Quarterly Financial Information –June30, 2019 – CIA SIDERURGICA NACIONAL | Version: 1 | |
Consolidated | |||
03/31/2020 |
| 03/31/2019 | |
Equity in results of affiliated companies |
|
|
|
MRS Logística S.A. | (34,113) | 42,922 | |
CBSI - Companhia Brasileira de Serviços de Infraestrutura | - | 784 | |
Transnordestina Logística S.A. | (6,334) | (6,056) | |
Arvedi Metalfer do Brasil S.A. | (712) | - | |
Others | - | 12 | |
| (41,159) | 37,662 | |
Eliminations | |||
To cost of sales | (1,243) | (13,711) | |
To taxes | 423 | 4,662 | |
Others | - | - | |
Amortizated at fair value - Investment in MRS | (2,937) | (2,937) | |
Others | (192) | 157 | |
Equity in results | (45,108) | 25,833 |
8.c) Investments in joint ventures and joint operations
The balances of the balance sheet and statement of income of joint ventures are presented below and refer to 100% of the companies’ results:
Page 44
CONVENIENCE TRANSLATION INTO ENGLISH FROM THE ORIGINAL PREVIOUSLY ISSUED IN PORTUGUESE | ||
Quarterly Financial Information –June30, 2019 – CIA SIDERURGICA NACIONAL | Version: 1 | |
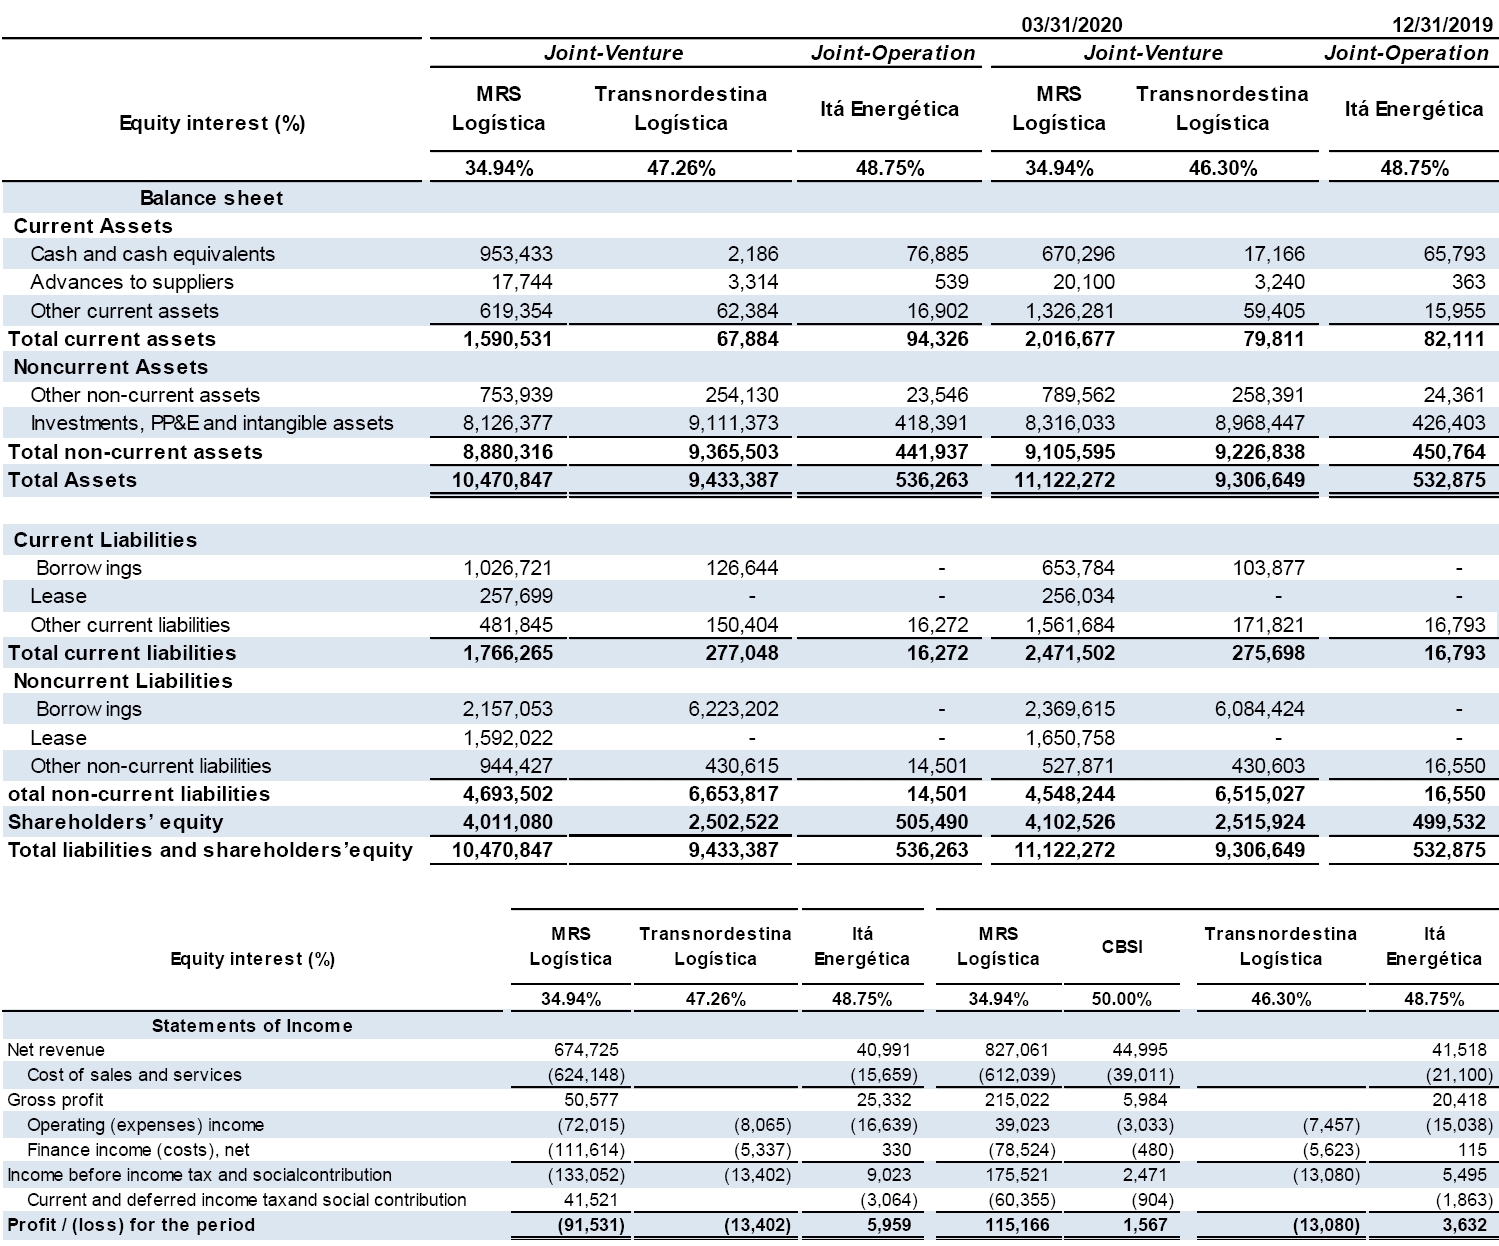
· TRANSNORDESTINA LOGÍSTICA S.A. (“TLSA”)
It is in pre-operational phase and will continue as such until the completion of Railway System II. The approved schedule, which estimated the completion of the work by January 2017, is currently under discussion with the responsible agencies; however, TLSA management believes that new deadlines for project completion will not have material adverse effects on the expected return on the investment. After analyzing this matter, management considered as appropriate the use of the accounting basis of operational continuity (going concern) of the project in the preparation of its financial statements.
The assumptions used to evaluate the impairment test in December 2019 remain valid and there is no event to justify records ofimpairment in the first quarter.
Page 45
CONVENIENCE TRANSLATION INTO ENGLISH FROM THE ORIGINAL PREVIOUSLY ISSUED IN PORTUGUESE | ||
Quarterly Financial Information –June30, 2019 – CIA SIDERURGICA NACIONAL | Version: 1 | |
8.d) Investment properties:
As of March 31, 2020, the balance of investment properties can be shown as follows:
|
|
|
|
Consolidated |
|
|
|
Parent Company | ||||
|
| Land |
| Buildings |
| Total |
| Land |
| Buildings |
| Total |
Balance at December 31, 2019 |
| 68,877 | 32,318 | 101,195 | 65,698 | 20,030 | 85,728 | |||||
Cost | 68,877 | 53,816 | 122,693 | 65,698 | 41,528 | 107,226 | ||||||
Accumulated depreciation |
| - | (21,498) | (21,498) | - | (21,498) | (21,498) | |||||
Balance at December 31, 2019 | 68,877 | 32,318 | 101,195 | 65,698 | 20,030 | 85,728 | ||||||
Acquisitions |
| 28,733 | 32,864 | 61,597 | 28,733 | 32,864 | 61,597 | |||||
Depreciation | (547) | (547) | (386) | (386) | ||||||||
Balance at March 31, 2020 |
| 97,610 | 64,635 | 162,245 | 94,431 | 52,508 | 146,939 | |||||
Cost | 97,610 | 86,681 | 184,291 | 94,431 | 74,392 | 168,823 | ||||||
Accumulated depreciation |
| (22,046) | (22,046) | (21,884) | (21,884) | |||||||
Balance at March 31, 2020 | 97,610 | 64,635 | 162,245 | 94,431 | 52,508 | 146,939 | ||||||
As of March 31, 2020, the Company’s management estimated the market value of the investment properties would be around R$1,843 million in the consolidated (R$1,781million as of December 31, 2019) and R$1,775 million in the Parent Company (R$1,714 million as of December 31, 2019).
The average useful lives are estimated as follows (in years):
Consolidated | Parent Company | ||||||
03/31/2020 |
| 12/31/2019 |
| 03/31/2020 |
| 12/31/2019 | |
Buildings | 21 |
| 21 |
| 21 |
| 21 |
9. PROPERTY, PLANT AND EQUIPMENT
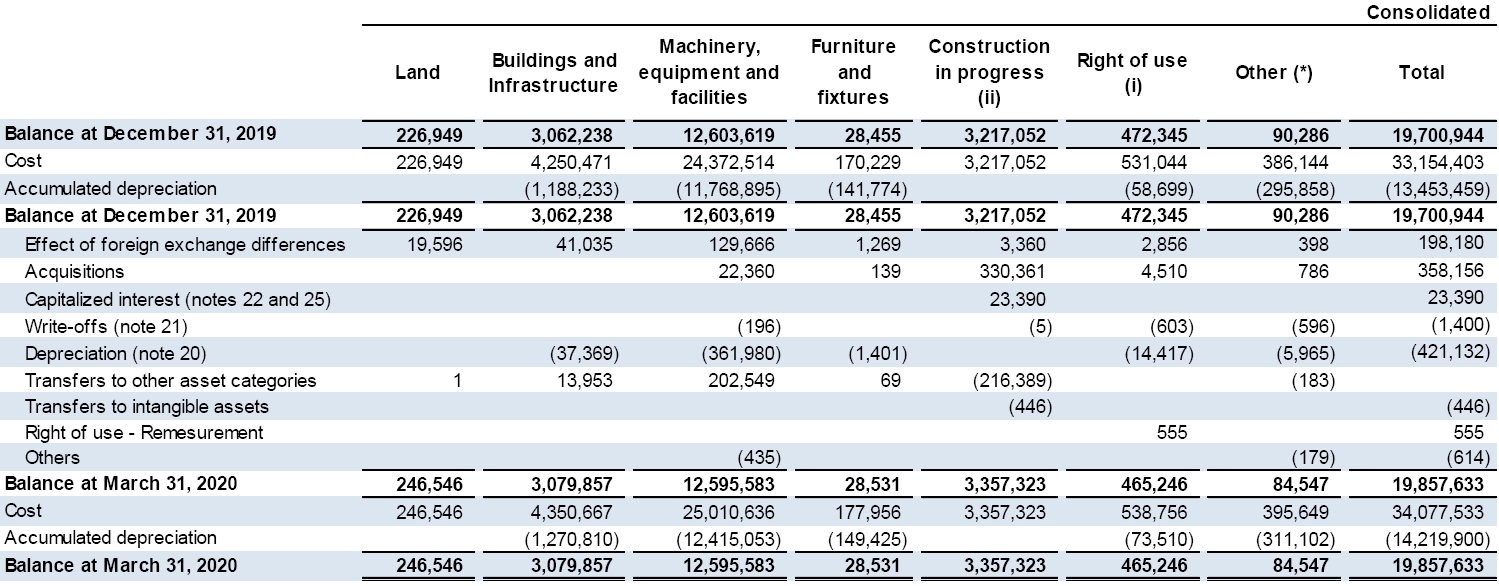
Page 46
CONVENIENCE TRANSLATION INTO ENGLISH FROM THE ORIGINAL PREVIOUSLY ISSUED IN PORTUGUESE | ||
Quarterly Financial Information –June30, 2019 – CIA SIDERURGICA NACIONAL | Version: 1 | |
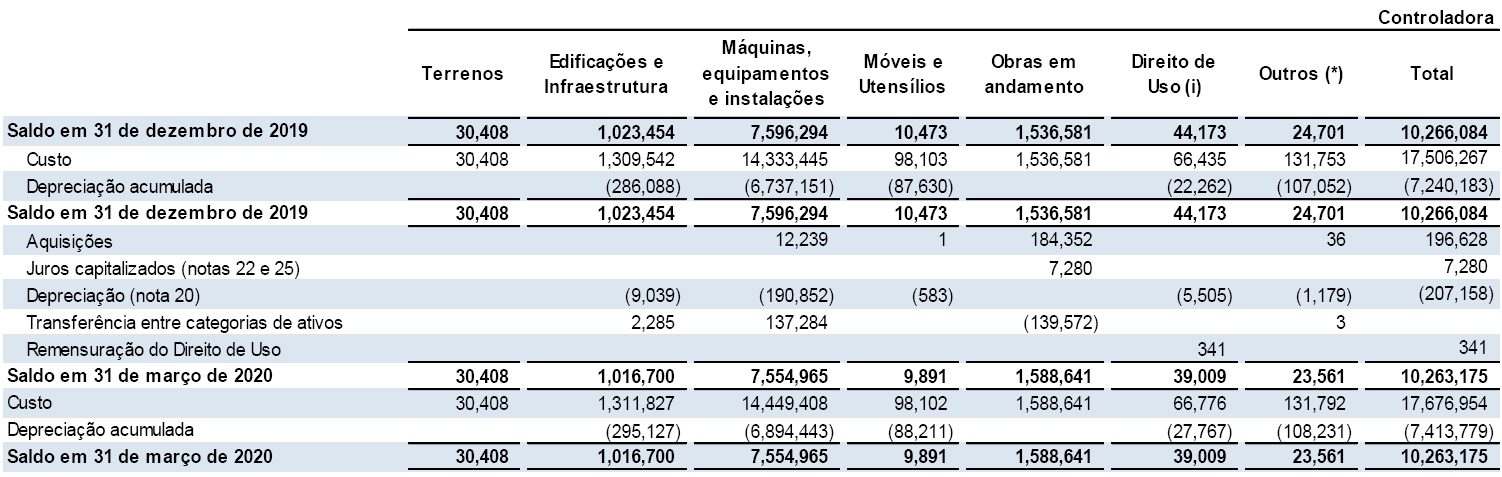
(*) Refer basically to railway assets such as courtyards, tracks and leasehold improvements, vehicles, hardware, mines, ore deposits, and spare part inventories.
(i) Rights of Use
The movement of the rights of use as of March 31, 2020 is as follows:
|
|
|
|
|
|
|
|
| Consolidated |
| Land |
| Buildings and Infrastructure |
| Machinery, equipment and facilities |
| Others |
| Total |
Balance at December 31, 2019 | 380,566 | 64,154 | 24,144 | 3,481 | 472,345 | ||||
Cost | 401,746 | 73,344 | 39,455 | 16,499 | 531,044 | ||||
Accumulated depreciation | (21,180) | (9,190) | (15,311) | (13,018) | (58,699) | ||||
Balance at December 31, 2019 | 380,566 | 64,154 | 24,144 | 3,481 | 472,345 | ||||
Effect of foreign exchange differences | 600 | 2,045 | 211 | 2,856 | |||||
Addition | 4,378 | 132 | 4,510 | ||||||
Remesurement | 555 | 555 | |||||||
Depreciation | (5,984) | (2,154) | (4,298) | (1,981) | (14,417) | ||||
Write-offs | (285) | (318) | (603) | ||||||
Transfers to other asset categories | (4,707) | 3,878 | 829 | ||||||
Balance at March 31, 2020 | 374,297 | 61,953 | 25,769 | 3,227 | 465,246 | ||||
Cost | 401,176 | 71,485 | 47,311 | 18,729 | 538,701 | ||||
Accumulated depreciation | (26,879) | (9,532) | (21,542) | (15,502) | (73,455) | ||||
Balance at March 31, 2020 | 374,297 | 61,953 | 25,769 | 3,227 | 465,246 |
|
|
|
|
|
|
|
| Parent Company |
|
| Land |
| Machinery, equipment and facilities |
| Others |
| Total |
Balance at December 31, 2019 |
| 30,145 |
| 13,580 |
| 448 |
| 44,173 |
Cost | 37,719 | 25,719 | 2,997 | �� 66,435 | ||||
Accumulated depreciation |
| (7,574) |
| (12,139) |
| (2,549) |
| (22,262) |
Balance at December 31, 2019 | 30,145 | 13,580 | 448 | 44,173 | ||||
Remesurement |
|
|
|
|
| 341 |
| 341 |
Depreciation | (2,417) | (3,088) | (5,505) | |||||
Balance at March 31, 2020 |
| 27,728 |
| 10,492 |
| 789 |
| 39,009 |
Cost | 37,719 | 25,719 | 3,338 | 66,776 | ||||
Accumulated depreciation |
| (9,991) |
| (15,227) |
| (2,549) |
| (27,767) |
Balance at March 31, 2020 | 27,728 | 10,492 | 789 | 39,009 |
Page 47
CONVENIENCE TRANSLATION INTO ENGLISH FROM THE ORIGINAL PREVIOUSLY ISSUED IN PORTUGUESE | ||
Quarterly Financial Information –June30, 2019 – CIA SIDERURGICA NACIONAL | Version: 1 | |
(ii) Construction in Progress
The breakdown of the projects comprising construction in progress is as follows:
|
|
|
|
|
|
|
|
|
| Consolidated |
|
| Project description |
| Start date |
| Completion date |
| 03/31/2020 |
| 12/31/2019 |
Logistics |
|
|
|
|
|
|
|
|
|
|
Current investments for maintenance of current operations. |
|
|
| 77,990 | 81,944 | |||||
|
|
|
|
|
|
|
| 77,990 | 81,944 | |
Mining |
| |||||||||
|
| Expansion of Casa de Pedra Mine capacity production. |
| 2007 |
| 2024 | (1) | 893,317 | 883,742 | |
Expansion of TECAR export capacity. | 2009 | 2022 | (2) | 308,125 | 303,965 | |||||
|
| Current investments for maintenance of current operations. |
|
|
|
|
| 463,998 | 389,510 | |
|
|
| 1,665,440 | 1,577,217 | ||||||
Steel |
|
|
|
|
|
|
| |||
Supply of 16 torpedo’s cars for operation in the steel industry | 2008 | 2020 | 76,269 | 75,582 | ||||||
|
| Current investments for maintenance of current operations. |
|
|
|
| (3) | 844,586 | 811,049 | |
| 920,855 | 886,631 | ||||||||
Cement |
|
|
|
|
|
|
| |||
Construction of cement plants. | 2011 | 2023 | (4) | 578,500 | 577,712 | |||||
|
| Current investments for maintenance of current operations. |
|
|
|
|
| 114,538 | 93,548 | |
|
|
| 693,038 | 671,260 | ||||||
Construction in progress |
|
|
|
|
| 3,357,323 | 3,217,052 | |||
(1) Estimated completion date of the Central Plant Step 1;
(2) Estimated completion date of phase 60 Mtpa;
(3) Refers substantially to the technological upgrade of the continuous running machines, productivity increase of the galvanized lines and new equipment;
(4) Refers substantially to the acquisition of new Integrated Cement Plants.
The average estimated useful lives are as follows (in years):
Consolidated | Parent Company | ||||||
03/31/2020 |
| 12/31/2019 |
| 03/31/2020 |
| 12/31/2019 | |
Buildings | 38 |
| 38 |
| 41 |
| 41 |
Machinery, equipment and facilities | 20 | 21 | 22 | 22 | |||
Furniture and fixtures | 12 |
| 12 |
| 12 |
| 12 |
Others | 13 | 14 | 13 | 14 |
9.a) Capitalized Interest
A part of the debt costs were capitalized in the amount of R$23,390 in the consolidated and R$7,280 in the Parent Company as of March 31, 2020 (as of March 31, 2019 R$21,111 in the consolidated and R$5,419 in the Parent Company). Those costs capitalized, basically, in the mining projects such as: (i) expansion of Casa de Pedra (MG) and TECAR (RJ), see Notes 22 and 25. The average interest rates of the unespecified projects in the period ended March 31, 2020 is 1.48% (1.65% as of March 31, 2019).
Page 48
CONVENIENCE TRANSLATION INTO ENGLISH FROM THE ORIGINAL PREVIOUSLY ISSUED IN PORTUGUESE | ||
Quarterly Financial Information –June30, 2019 – CIA SIDERURGICA NACIONAL | Version: 1 | |
10. INTANGIBLE ASSETS
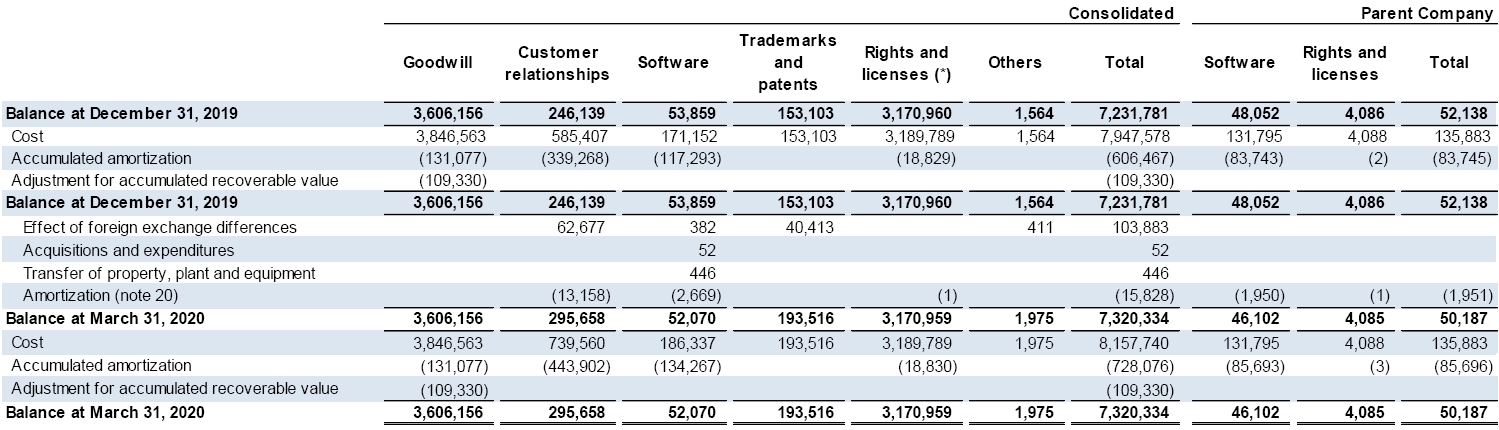
(*) Composed mainly by mineral rights with potential of 1,101 million tons (Not audited or reviewed by independent auditors). Amortization is based on production volume.
The average useful lives by nature are as follows (in years):
Consolidated | Parent Company | ||||||
03/31/2020 |
| 12/31/2019 |
| 03/31/2020 |
| 12/31/2018 | |
Software | 9 |
| 9 |
| 8 |
| 9 |
Customer relationships | 13 | 13 |
Page 49
CONVENIENCE TRANSLATION INTO ENGLISH FROM THE ORIGINAL PREVIOUSLY ISSUED IN PORTUGUESE | ||
Quarterly Financial Information –June30, 2019 – CIA SIDERURGICA NACIONAL | Version: 1 | |
11. BORROWINGS, FINANCING AND DEBENTURES
The balances of borrowings, financing and debentures, which are carried at amortized cost, are as follows:
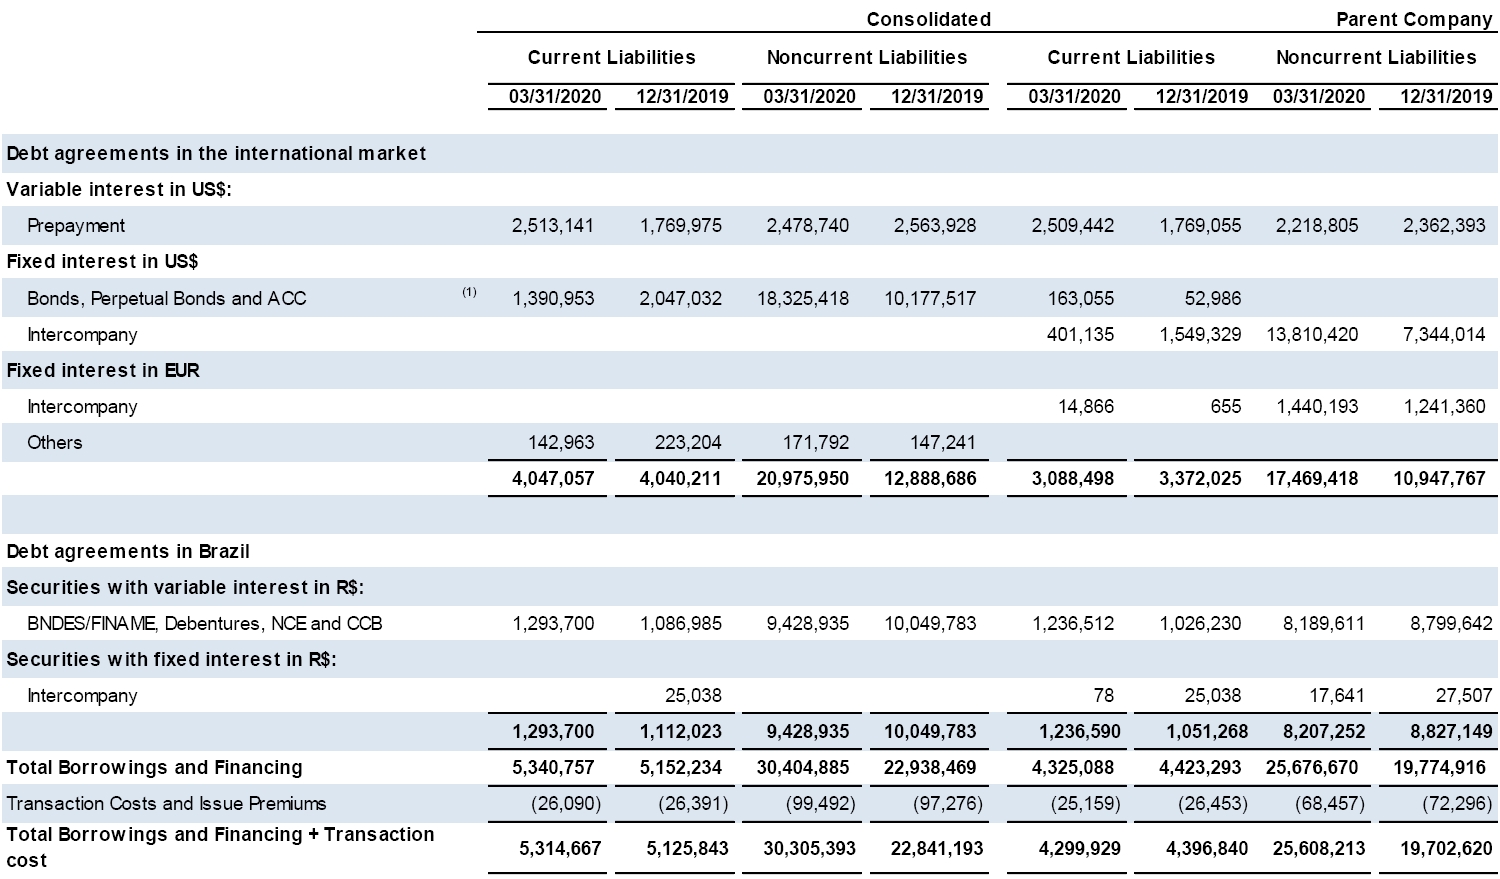
(1) In January 2020, the Company issued debt securities in the foreign market (“Notes”), through its subsidiary CSN IslandsXI Corp, in the amount of US$1 billion, with maturity for 2028 and interest rate of 6.75% per year. A portion of the funds, in the amount of US$263 million, was used to repurchase (“Tender Offer”) the Notes issued by CSN Resources S.A. with maturity for 2020. The Notes are unconditionally and irrevocably guaranteed by the Company.
The following table shows the average interest rate:
|
|
|
| Consolidated |
|
| Parent Company | |
|
|
|
| 03/31/2020 |
|
| 03/31/2020 | |
| Average interest rate (i) | Total debt | Average interest rate (i) | Total debt | ||||
US$ |
| 6.60% |
| 24,708,252 |
| 3.84% |
| 19,102,857 |
EUR | 1.50% | 314,755 | 3.88% | 1,455,059 | ||||
R$ |
| 4.83% |
| 10,722,635 |
| 5.67% |
| 9,443,842 |
|
| 35,745,642 |
| 30,001,758 |
(i) In order to determine the average interest rates for debt contracts with floating rate, the Company used the rates applied as of March 31, 2020. In the parent company was considered the interest rates of intercompany contracts.
11.a) Maturities of borrowings, financing and debentures presented in noncurrent liabilities
As of September 30, 2019, the inflation-adjusted principal of long-term borrowings, financing and debentures by maturity year is as follows:
Consolidated | Parent Company | |||||||||||
|
|
|
|
|
| 03/31/2020 |
|
|
| 03/31/2020 | ||
|
|
| Principal |
|
| Principal | ||||||
| Borrowings and financing in foreign currency | Borrowings and financing in nacional currency | Total | Borrowings and financing in foreign currency | Borrowings and financing in nacional currency |
| Total | |||||
2021 |
| 752,831 | 1,837,248 | 2,590,079 | 709,882 | 1,474,601 | 2,184,483 | |||||
2022 | 758,576 | 2,782,243 | 3,540,819 | 5,235,486 | 2,454,584 | 7,690,070 | ||||||
2023 |
| 5,428,053 | 2,989,612 | 8,417,665 | 1,901,021 | 2,639,255 | 4,540,276 | |||||
2024 | 519,870 | 1,237,113 | 1,756,983 | 4,881,951 | 1,056,101 | 5,938,052 | ||||||
2025 |
| 68,595 | 68,595 | 929,819 | 68,587 | 998,406 | ||||||
After 2025 | 8,317,920 | 514,124 | 8,832,044 | 3,811,259 | 514,124 | 4,325,383 | ||||||
Perpetual bonds |
| 5,198,700 | 5,198,700 | |||||||||
| 20,975,950 | 9,428,935 | 30,404,885 | 17,469,418 | 8,207,252 | 25,676,670 |
Page 50
CONVENIENCE TRANSLATION INTO ENGLISH FROM THE ORIGINAL PREVIOUSLY ISSUED IN PORTUGUESE | ||
Quarterly Financial Information –June30, 2019 – CIA SIDERURGICA NACIONAL | Version: 1 | |
11.b) Borrowings, financing and debentures raised and paid
The table below shows the borrowings, financing and debentures raised and paid during the period:
Consolidated | Parent Company | |||||||
| 03/31/2020 |
| 12/31/2019 | 03/31/2020 |
| 12/31/2019 | ||
Opening balance |
| 27,967,036 | 28,827,074 | 24,099,460 | 24,161,596 | |||
New debts | 4,553,970 | 10,149,381 | 2,285,889 | 6,798,683 | ||||
Repayment |
| (2,350,669) | (11,775,093) | (902,300) | (7,431,176) | |||
Repurchase of debt securities | (12,997) |
|
|
|
|
| ||
Payments of charges |
| (511,078) | (2,039,112) | (268,170) | (1,400,496) | |||
Charges of repurchase of debt securities | (164) |
|
|
|
|
| ||
Accrued charges (Note 22) |
| 494,380 | 1,996,305 | 284,262 | 1,376,862 | |||
Consolidation of CBSI | 19,722 |
|
|
| ||||
Others (1) |
| 5,479,582 | 788,759 | 4,409,001 | 593,991 | |||
Closing balance | 35,620,060 | 27,967,036 | 29,908,142 | 24,099,460 |
1.Includes unrealized exchange and monetary variations and cost of transactions.
As of March 31,2020, the Group raised and paid borrowings as shown below:
· Funding raised and amortizations:
Consolidated | ||||||
|
|
|
|
|
| 03/31/2020 |
Nature | New debts | Repayment | Interest payment | |||
Prepayment |
| (473,633) | (67,993) | |||
Bonds, Perpetual bonds, ACC and Facility | 4,553,970 | (1,646,848) | (343,277) | |||
BNDES/FINAME, Debentures, NCE and CCB |
| (230,188) | (99,808) | |||
| 4,553,970 | (2,350,669) | (511,078) |
· Covenants
The Company’s borrowing agreements provide for the fulfillment of certain non-financial obligations, as well as the maintenance of certain parameters and financial indicators, besides the publication of its audited financial statements within the regulatory terms or payment of commission on assumption of risks in case certain financial indicators reach the levels set out in such agreements. As of March 31, 2020, the Company had recognized in the consolidated and in the parente company R$10,531 (R$10.531 as of December 31, 2019) as commission on assumption of risks, which was settled on April 24, 2020.
Page 51
CONVENIENCE TRANSLATION INTO ENGLISH FROM THE ORIGINAL PREVIOUSLY ISSUED IN PORTUGUESE | ||
Quarterly Financial Information –June30, 2019 – CIA SIDERURGICA NACIONAL | Version: 1 | |
12. FINANCIAL INSTRUMENTS
I - Identification and measurement of financial instruments
The Company can operate with various financial instruments, mainly cash and cash equivalents, including short-term investments, marketable securities, trade receivables, trade payables, and borrowings and financing. The Company also can operate into derivative transactions, currency swap, interest rate swap and commodityswap operations.
Considering the nature of the instruments, the fair value is basically determined by the use of quotations in the open capital market of Brazil and the Commodities and Futures Exchange. The amounts recorded in current assets and liabilities have immediate liquidity or maturity, mostly in terms of short time. Considering the term and the characteristics of these instruments, the book values approximate the fair values.
Page 52
CONVENIENCE TRANSLATION INTO ENGLISH FROM THE ORIGINAL PREVIOUSLY ISSUED IN PORTUGUESE | ||
Quarterly Financial Information –June30, 2019 – CIA SIDERURGICA NACIONAL | Version: 1 | |
· Classification of financial instruments
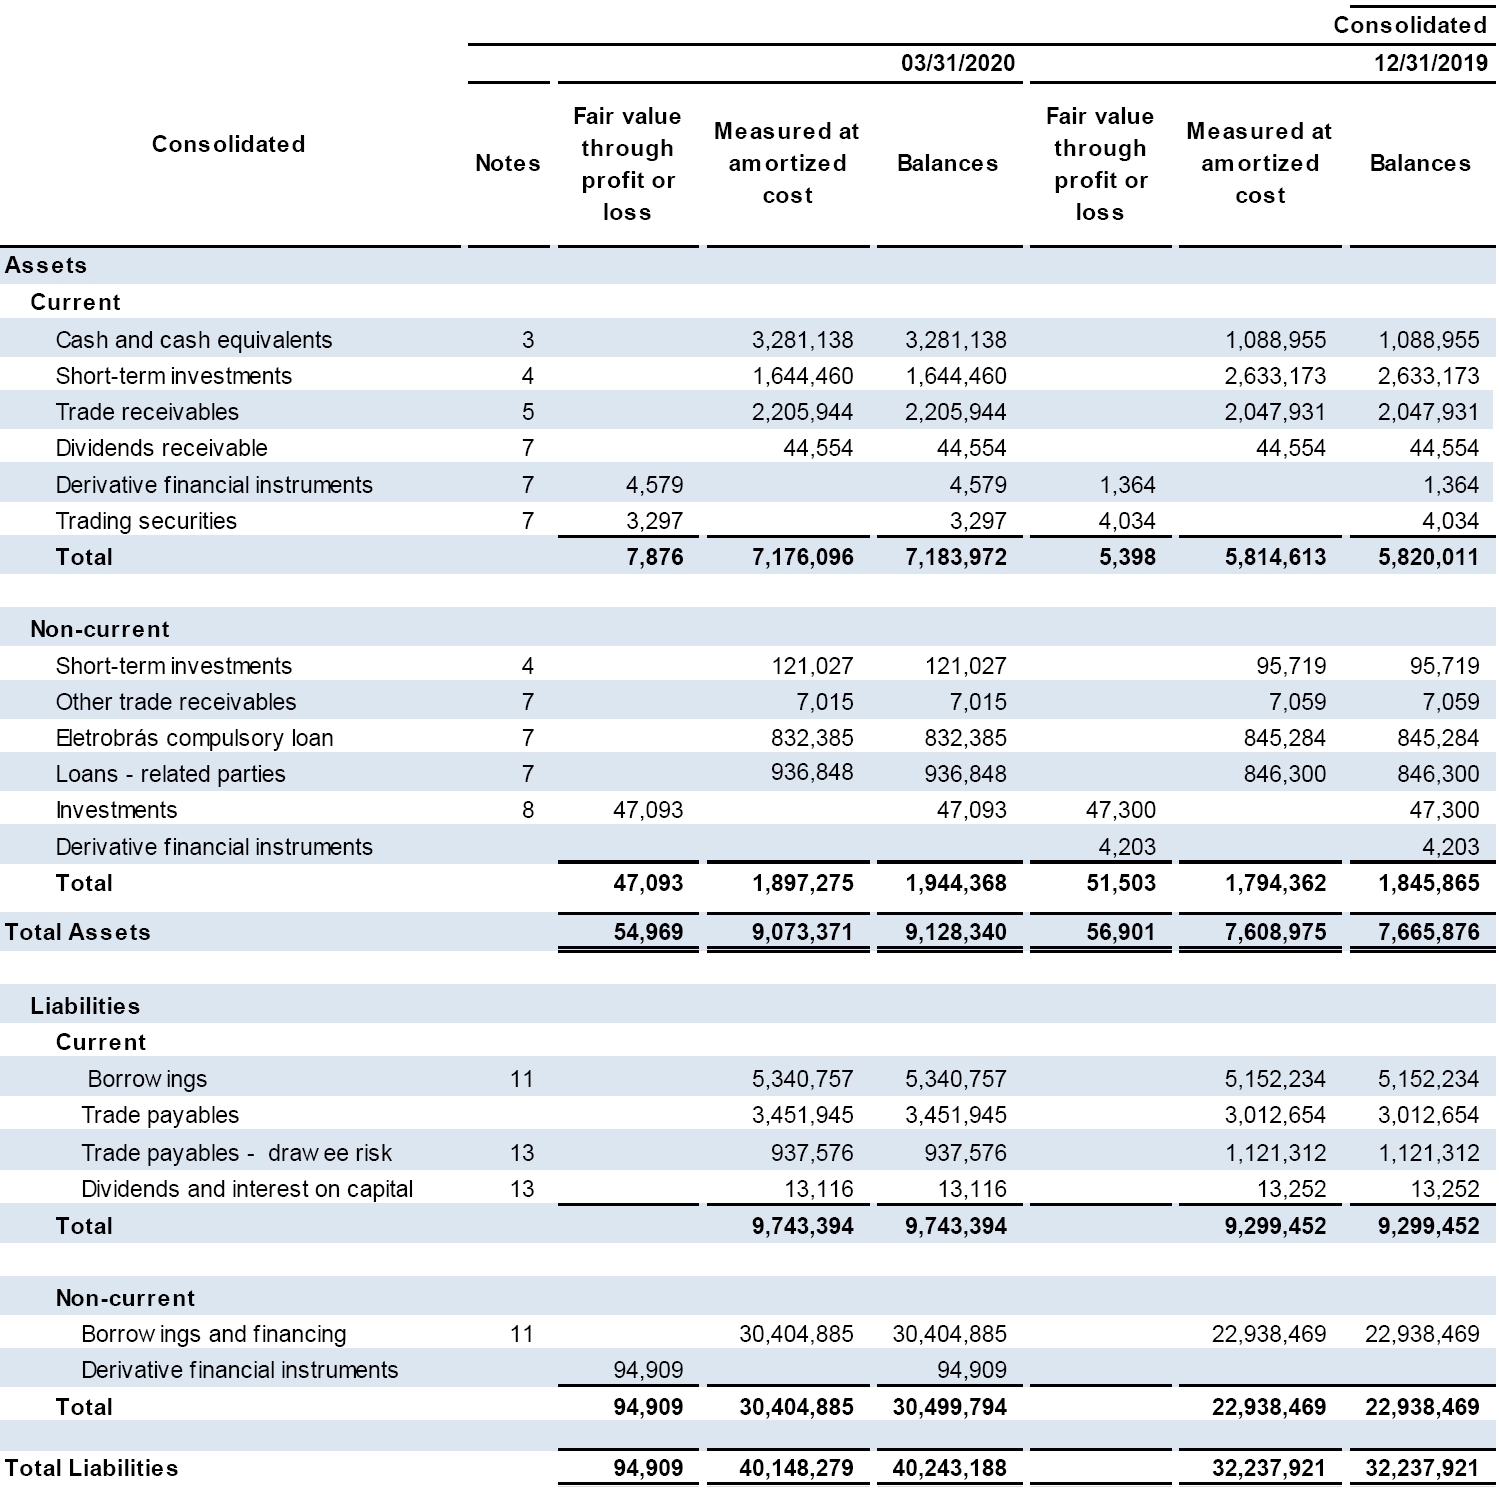
Page 53
CONVENIENCE TRANSLATION INTO ENGLISH FROM THE ORIGINAL PREVIOUSLY ISSUED IN PORTUGUESE | ||
Quarterly Financial Information –June30, 2019 – CIA SIDERURGICA NACIONAL | Version: 1 | |
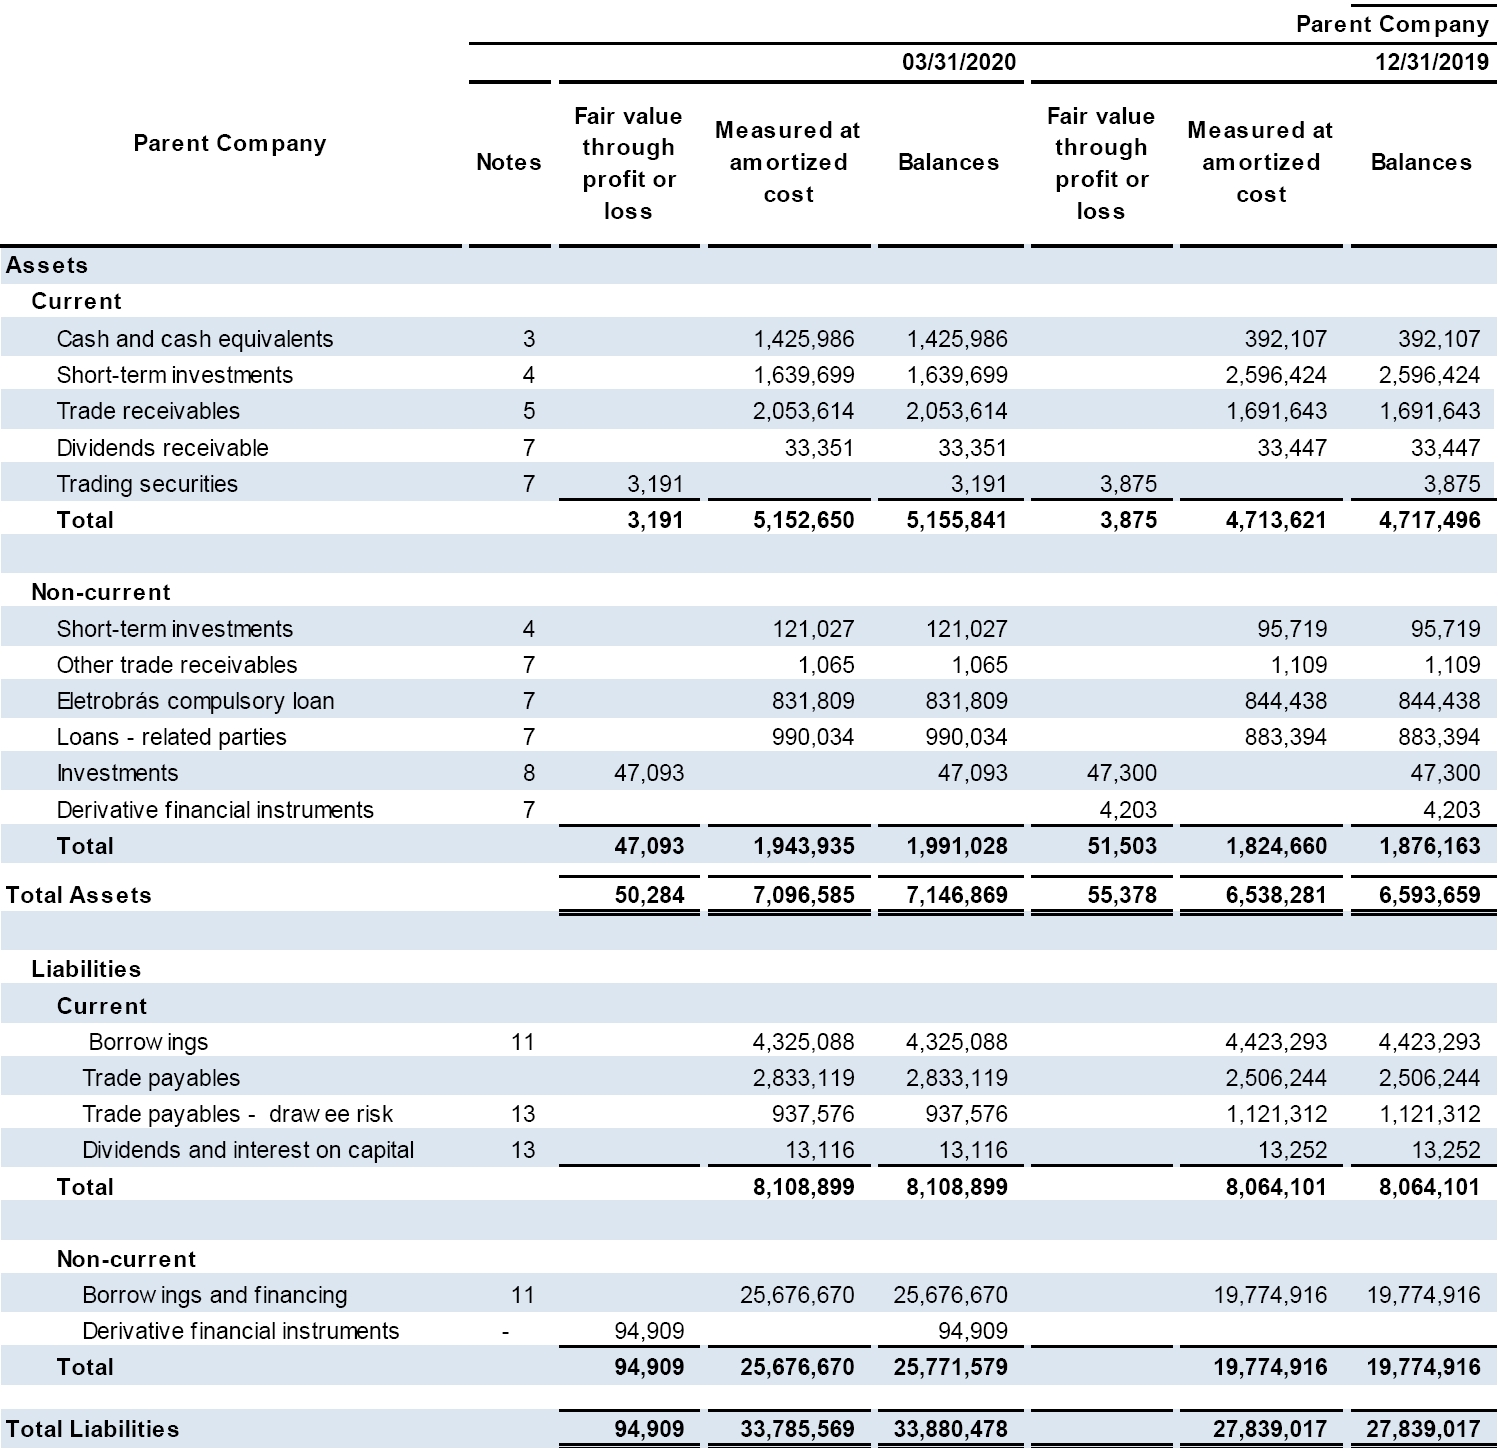
· Fair value measurement
The following table shows the financial instruments recognized at fair value through profit or loss classifying them according to the fair value hierarchy:
Consolidated |
| 03/31/2020 | 12/31/2019 | |||||||||
Level 1 |
| Level 2 |
| Balances | Level 1 |
| Level 2 |
| Balances | |||
Assets |
|
|
|
|
|
|
|
|
|
|
|
|
Current | ||||||||||||
Financial assets at fair value through profit or loss |
|
|
|
|
|
|
|
|
|
|
|
|
Derivative financial instruments | 4,579 | 4,579 | 1,364 | 1,364 | ||||||||
Trading securities |
| 3,297 |
|
|
| 3,297 |
| 4,034 |
|
|
| 4,034 |
Non-current | ||||||||||||
Financial assets at fair value through profit or loss |
|
|
|
|
|
|
|
|
|
|
|
|
Investments | 47,093 | 47,093 | 47,300 | 47,300 | ||||||||
Derivative financial instruments |
|
|
|
|
|
|
|
|
| 4,203 |
| 4,203 |
Total Assets | 50,390 | 4,579 | 54,969 | 51,334 | 5,567 | 56,901 | ||||||
Liabilities |
|
|
|
|
|
|
|
|
|
|
|
|
Non-current | ||||||||||||
Financial liabilities at fair value through profit or loss |
|
|
|
|
|
|
|
|
|
|
|
|
Derivative financial instruments | 94,909 | 94,909 | ||||||||||
Total Liabilities |
|
|
| 94,909 |
| 94,909 |
|
|
|
|
|
|
Page 54
CONVENIENCE TRANSLATION INTO ENGLISH FROM THE ORIGINAL PREVIOUSLY ISSUED IN PORTUGUESE | ||
Quarterly Financial Information –June30, 2019 – CIA SIDERURGICA NACIONAL | Version: 1 | |
Level 1: quoted prices in active markets for identical assets or liabilities.
Level 2: Includes observable inputs in market such as interest rates, exchange etc., but not prices traded in active markets.
There are no assets and liabilities classified as level 3.
II – Investments in securities measured at fair value through profit or loss
The Company has investments in common shares (USIM3), preferred shares (USIM5) of Usiminas (“Ações Usiminas”) and shares of Panatlântica S.A (PATI 3), which are designated as fair value through profit or loss.
Usiminas’ shares are classified as a financial investment in the current asset and Panatlântica’s is recognized as non-current investment and are all recorded at fair value based on the market price quotation on the stock exchange (B3 S.A.).
In accordance with the Company's policy, gains and losses arising from changes in the share prices are recorded directly in the statement of income under financial results (Usiminas’ shares) and Other Operating Income and Expenses (Panatlântica shares).
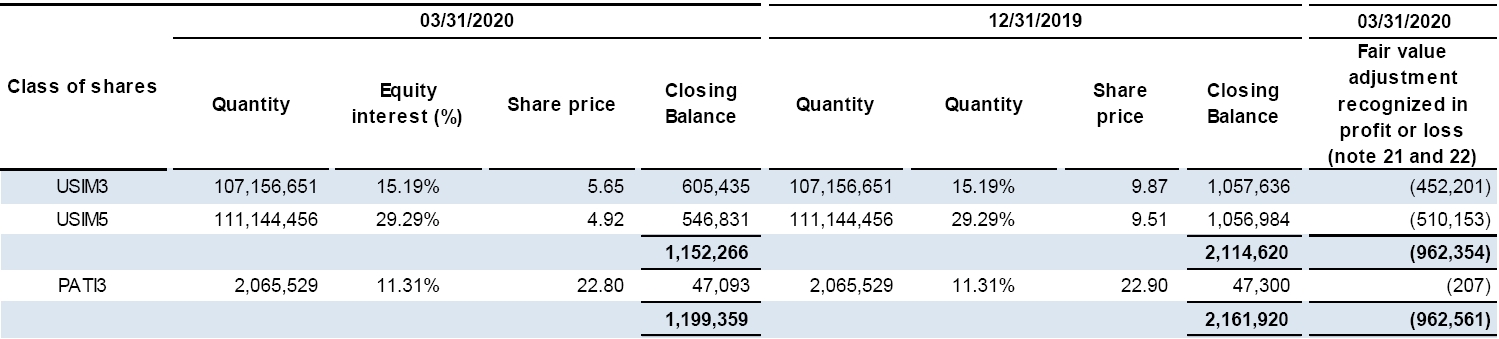
• Share market price risks
The Company is exposed to the risk of changes in the price of the shares due to the investments, valued at fair value through profit or loss that have their prices based on the market price.
III - Financial risk management:
The Company follows risk management strategies, with guidelines in relation to the risks incurred by the company. The nature and general position of financial risks is regularly monitored and managed to assess the results and the financial impact on cash flow. The credit limits and hedge quality of the counterparties are also periodically reviewed.
Market risks are protected when it is considered necessary to support the corporate strategy or when it is necessary to maintain the level of financial flexibility.
The Company may manage some of the risks through the use of derivative instruments, not associated with any speculative trading or short selling.
Page 55
CONVENIENCE TRANSLATION INTO ENGLISH FROM THE ORIGINAL PREVIOUSLY ISSUED IN PORTUGUESE | ||
Quarterly Financial Information –June30, 2019 – CIA SIDERURGICA NACIONAL | Version: 1 | |
13.a) Foreign exchange rate and interest rate risks:
· Foreign exchange rate risk:
The exposure arises from the existence of assets and liabilities denominated in Dollar or Euro, since the Company's functional currency is substantially the Real and is denominated natural currency hedge. The net exposure is the result of offsetting the natural currency exposure by hedging instruments adopted by CSN.
The consolidated net exposure as of March 31, 2020 is as follows:
03/31/2020 | ||||
Foreign Exchange Exposure |
| (Amounts in US$’000) |
| (Amounts in €’000) |
Cash and cash equivalents overseas |
| 292,988 | 3,399 | |
Trade receivables | 323,287 | 1,279 | ||
Other assets |
| 2,978 | 5,268 | |
Total Assets | 619,253 | 9,946 | ||
Borrowings |
| (4,729,641) | - | |
Trade payables | (87,256) | (10,666) | ||
Other liabilities |
| (2,552) | (904) | |
Total Liabilities | (4,819,449) | (11,570) | ||
Foreign exchange exposure |
| (4,200,196) | (1,624) | |
Cash flow hedge accounting | 4,640,920 | |||
Swap CDI x Dollar |
| (67,000) | ||
Net foreign exchange exposure | 373,724 | (1,624) |
CSN uses as strategy hedge accounting, as well as derivative instruments to hedge CSN’s future cash flows.
· Interest rate risk:
The risk arises from short and long-term liabilities with fixed or floating interest rates and inflation indices.
In item 12b) we show the derivatives and hedging strategies to hedge foreign exchange and interest rate risks.
12.b) Hedginginstruments: Derivatives and cash flows hedge accounting and net investment hedge in foreign operations:
CSN uses various instruments to hedge foreign exchange and interest rate risks, as shown in the following topics:
· Portfolioof derivative financial instruments
Exchange rate swapDollar x Euro
The subsidiary Lusosider has derivative operations to hedge its exposure of the dollar against the euro.
Exchange rate swapGBP (Sterling Pound) x Euro
The subsidiary Lusosider has derivative operations to hedge its exposure of the GBP against the euro.
Page 56
CONVENIENCE TRANSLATION INTO ENGLISH FROM THE ORIGINAL PREVIOUSLY ISSUED IN PORTUGUESE | ||
Quarterly Financial Information –June30, 2019 – CIA SIDERURGICA NACIONAL | Version: 1 | |
Exchange rate swapCDI x Dollar
The company has derivative operations with Bradesco Bank to hedge its NCE debt raised in September 2019 with maturity in October 2023 in the amount of US$67million (equivalent to R$267milhões), at a cost consistent with that usually praticed by the Company.
Consolidated | ||||||||||||||
|
|
|
|
03/31/2020 | ||||||||||
Appreciation (R$) | Fair value (market) | Impact on financial income (expenses) in 2020 | ||||||||||||
Counterparties | Maturity | Functional Currency | Notional amount | Asset position | Liability position | Amounts receivable / (payable) | ||||||||
BCP |
| 09/22/2020 |
| Dollar |
| 22,881 |
| 119,591 |
| (115,180) |
| 4,411 |
| 2,757 |
Total dollar-to-euro swap | 22,881 | 119,591 | (115,180) | 4,411 | 2,757 | |||||||||
|
|
|
|
|
|
|
|
|
|
|
|
|
|
|
BCP | 08/03/2020 | GBP | 3,956 | 25,555 | (25,387) | 168 | 168 | |||||||
Total Swap GBP x Euro |
|
|
| 3,956 |
| 25,555 |
| (25,387) |
| 168 |
| 168 | ||
Bradesco |
| 09/22/2020 |
| Dollar |
| (67,000) |
| 292,635 |
| (387,544) |
| (94,909) |
| (99,113) |
Total Swap CDI x dollar | (67,000) | 292,635 | (387,544) | (94,909) | (99,113) | |||||||||
|
|
|
|
|
|
|
|
|
|
|
|
|
|
|
437,781 | (528,111) | (90,330) | (96,188) | |||||||||||
· Classification of the derivatives in the balance sheet and statement of income
|
|
|
|
|
|
|
| 03/31/2020 | 03/31/2019 | |||
Instruments | Assets | Liabilities |
| Financial income (expenses), net (note 22) | ||||||||
Current | Total | Current | Total | |||||||||
Dollar - to - euro swap |
| 4,411 | 4,411 | 2,757 | (354) | |||||||
Great Britain pound-to-euro swap | 168 | 168 | 168 | |||||||||
Swap CDI x Dollar |
| (94,909) | (94,909) | (99,113) | ||||||||
4,579 | 4,579 | (94,909) | (94,909) | (96,188) | (354) | |||||||
· Cash flow hedge accounting
The Company designates cash flow hedging relationships to hedge highly probable future cash flows against U.S. dollar fluctuations.
In order to better reflect the accounting impacts of this foreign exchange hedging strategy on the Company’s results, CSN designated part of its US dollar-denominated liabilities as a hedging instrument of its future exports. As a result, foreign exchange differences arising from designated liabilities will be temporarily recognized in shareholders’ equity and recognized in profit or loss when such exports are carried out, allowing the concurrent recognition of the dollar fluctuations on liabilities and on exports. The adoption of this hedge accounting does not entail entering into any financial instrument.
Page 57
CONVENIENCE TRANSLATION INTO ENGLISH FROM THE ORIGINAL PREVIOUSLY ISSUED IN PORTUGUESE | ||
Quarterly Financial Information –June30, 2019 – CIA SIDERURGICA NACIONAL | Version: 1 | |
In order to support the aforementioned designations, the Company prepared formal documentation indicating how the hedge designation is aligned with CSN's objective and risk management strategy, identifying the hedging instruments used, the hedge object, the nature of the risk to be hedged and demonstrating the expectation of high effectiveness of the designated relations. Debt instruments have been designated in amounts equivalent to the portion of future exports. Therefore, the exchange variation of the instrument and the object are similar. According to the Company's accountingpolicy, continuous evaluations of prospective and retrospective effectiveness should be carried out, comparing the amounts designated with the amounts expected and approved in the Management's budgets, as well as the amounts actually exported.
Through hedge accounting, the exchange gains and losses on debt instruments will not immediately affect the Company’s profit or loss except to the extent that exports are carried out.
Page 58
CONVENIENCE TRANSLATION INTO ENGLISH FROM THE ORIGINAL PREVIOUSLY ISSUED IN PORTUGUESE | ||
Quarterly Financial Information –June30, 2019 – CIA SIDERURGICA NACIONAL | Version: 1 | |
The table below shows a summary of the hedging relationships as of March 31, 2020:
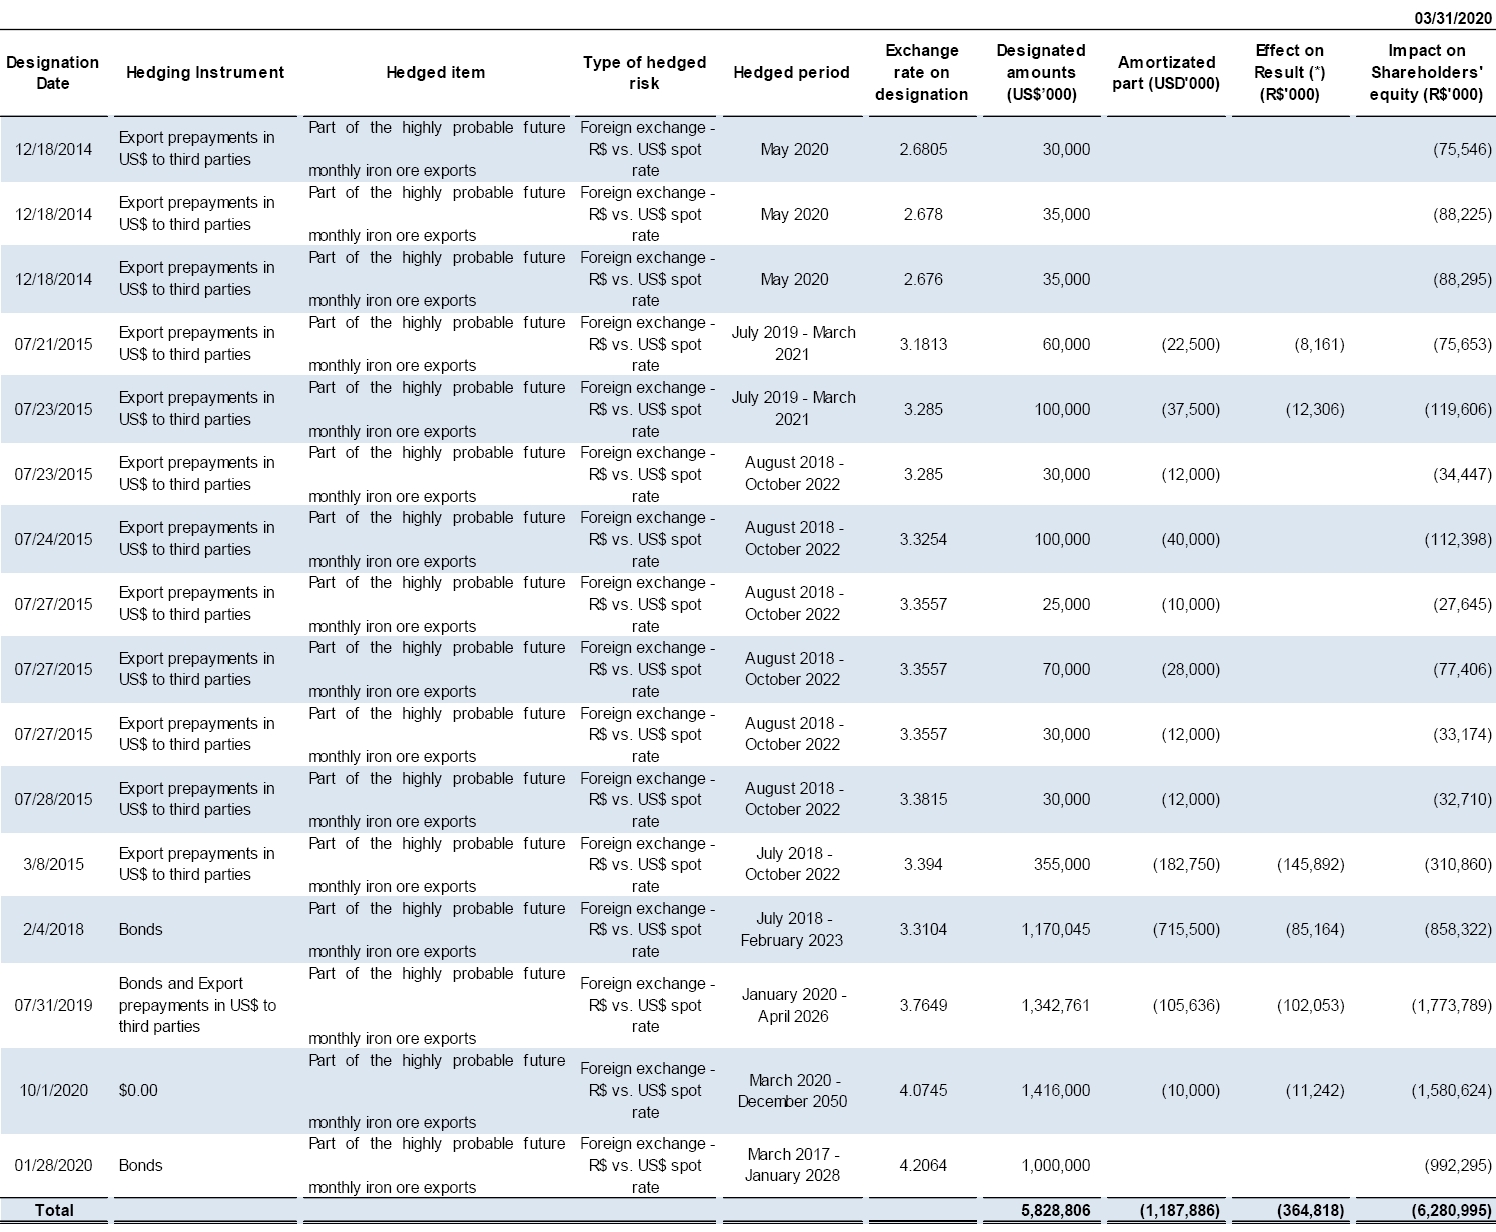
(*) For the three-month period ended March 31, 2020 we recognized R$364,818 in Other Operating Expenses (R$184,217 for the same period of 2019).
In the hedging relationships described above, the amounts of the debt instruments were fully designated for equivalent iron ore export portions.
The movement in the cash flow hedge recognized in shareholders’ equity as of March 31, 2020 is as follows:
12/31/2019 |
| Movement |
| Realization |
| 03/31/2020 | |
Cash flow hedge accounting | 1,255,770 |
| 5,390,043 |
| (364,818) |
| 6,280,995 |
Fair value of cash flow hedge, net of taxes | 1,255,770 | 5,390,043 | (364,818) | 6,280,995 |
As of March 31, 2020, the hedging relationships established by the Company were effective, according to prospective tests performed. Thus, no reversal for hedge accounting ineffectiveness in the cash flow hedge was recognized.
· Hedge of net investment in foreign operation
On January 31, 2020, the Company repaid the Euro-denominated non-derivative financial liability designated as hedged item. The variations of the hedge recognized in the shareholders’ equity as of March 31, 2020 were R$1,469.
Page 59
CONVENIENCE TRANSLATION INTO ENGLISH FROM THE ORIGINAL PREVIOUSLY ISSUED IN PORTUGUESE | ||
Quarterly Financial Information –June30, 2019 – CIA SIDERURGICA NACIONAL | Version: 1 | |
12.c) Sensitivity analysis
We present below the sensitivity analysis of foreign exchange rate and interest rate risks.
· Sensitivity analysis of derivative financial instruments and consolidated foreign exchange exposure
The Company considered scenarios 1 and 2 as 25% and 50% deterioration for currency volatility using as reference the closing exchange rate as of March 31, 2020.
The currencies used in the sensitivity analysis and their scenarios are shown below:
|
|
|
|
|
| 03/31/2020 | ||
Currency | Exchange rate | Probable scenario | Scenario 1 | Scenario 2 | ||||
USD |
| 5.1987 |
| 5.4291 |
| 6.4984 |
| 7.7981 |
EUR | 5.7264 | 5.8922 | 7.1580 | 8.5896 | ||||
USD x EUR |
| 1.0956 |
| 1.0842 |
| 1.3695 |
| 1.6434 |
GBP x EUR | 0.8864 | 0.8738 | 1.1080 | 1.3296 | ||||
|
|
|
| 03/31/2020 | ||||
Interest | Interest rate | Scenario 1 | Scenario 2 | |||||
CDI |
| 3.65% |
| 4.56% |
| 5.48% | ||
TJLP | 5.09% | 6.36% | 7.64% | |||||
LIBOR |
| 1.18% |
| 1.47% |
| 1.76% |
The effects on profit or loss, considering scenarios 1 and 2, are shown below:
|
|
|
|
|
|
|
| 03/31/2020 | ||
Instruments | Notional | Risk | Probable scenario (*) R$ | Scenario 1 R$ | Scenario 2 R$ | |||||
|
|
|
|
|
|
|
|
|
|
|
Currency position | (4,200,196) | Dollar | (967,725) | (5,458,890) | (10,917,780) | |||||
(not including exchange derivatives below) |
|
|
|
|
| |||||
Cash flow hedge accounting of exports |
| 4,640,920 |
| Dollar |
| 1,069,268 | 6,031,688 | 12,063,376 | ||
Swap CDI x Dollar |
| (67,000) |
| Dollar |
| (15,437) | (87,078) | (174,156) | ||
Consolidated exchange position in U$ |
| 373,724 |
| Dollar |
| 86,106 | 485,720 | 971,440 | ||
(including exchange derivatives above) | ||||||||||
|
|
|
|
|
| |||||
Currency position | (1,624) | Euro | (269) | (2,325) | (4,650) | |||||
|
|
|
|
|
| |||||
Consolidated exchange position in €$ | (1,624) | Euro | (269) | (2,325) | (4,650) | |||||
(including exchange derivatives above) |
|
|
|
|
| |||||
| ||||||||||
Dollar-to-euro swap |
| 22,881 |
| Dollar |
| (5,669) | 19,507 | 35,452 | ||
Great Britain pound-to-euro swap |
| 3,956 |
| GBP |
| (538) | 4,943 | 8,350 |
(*) The probable scenarios were calculated considering the following variations for the risks: Real x Dollar – depreciation of Real by 4.43% / Real x Euro – depreciation of Real by 2.90%. Euro x Dollar – appreciation of Euro by 1.04%. Source: quotations from Central Bank of Brazil and Central Bank of Europe on 04/29/2020.
Page 60
CONVENIENCE TRANSLATION INTO ENGLISH FROM THE ORIGINAL PREVIOUSLY ISSUED IN PORTUGUESE | ||
Quarterly Financial Information –June30, 2019 – CIA SIDERURGICA NACIONAL | Version: 1 | |
· Sensitivity analysis of changes in interest rates
The Company considered scenarios 1 and 2 as 25% and 50% of changes in interest volatility as of March 31, 2020.
Consolidated | ||||||||||||
Impact on profit or loss | ||||||||||||
Changes in interest rates | % p.a | Assets | Liabilities | Probable scenario (*) | Scenario 1 |
| Scenario 2 | |||||
TJLP |
| 5.09 |
| (865,977) | (2,292) | (11,020) | (22,040) | |||||
Libor | 1.18 | (4,931,747) | (56,436) | (14,490) | (28,980) | |||||||
CDI |
| 3.65 |
| 1,517,760 | (9,741,264) | (19,829) | (75,039) | (150,078) | ||||
(*) The sensitivity analysis is based on the assumption of maintaining, as a probable scenario, the market values as of March 31, 2020 recognized in the company's assets and liabilities.
12.d) Liquidity risk
It is the risk that the Company does not have sufficient liquid resources to honor its financial commitments, as a result of mismatching of term or volume between expected receipts and payments.
In order to manage the liquidity of the cash in local and foreign currency, premises of disbursements and future receipts are established, being monitored daily by the Treasury area. The payment schedules for the long-term portions of the loans and financing and debentures are presented in Note 11.
The following table shows the contractual maturities of financial liabilities and lease liabilities, including accrued interest.
|
|
|
|
|
|
|
| Consolidated | |
At March 31, 2020 | Less than one year | From one to two years | From two to five yyears | Over five years |
| Total | |||
Borrowings, financing and debentures (note 11) | 5,340,757 |
| 6,130,898 |
| 10,243,243 |
| 14,030,744 |
| 35,745,642 |
Trade payables (note 12I) | 3,451,945 |
|
|
| 3,451,945 | ||||
Trade payables – Drawee risk (note 12I) | 937,576 |
|
|
|
|
|
|
| 937,576 |
Dividends and interest on equity (note 13) | 13,116 |
|
|
| 13,116 |
IV - Fair values of assets and liabilities as compared to their carrying amounts
Financial assets and liabilities measured at fair value through profit or loss are recorded in current and noncurrent assets and liabilities and gains and losses are recorded as financial income and expenses, respectively.
The amounts are recorded in the financial statements at their carrying amount, which are substantially similar to those that would be obtained if they were traded in the market. The fair values of other long-term assets and liabilities do not differ significantly from their carrying amounts, except for the amounts below.
The estimated fair values for certain consolidated long-term borrowings and financing were calculated at prevailing market rates, taking into consideration the nature, terms and risks similar to those of the recorded contracts, according below:
|
| 03/31/2020 |
|
| 12/31/2019 | ||
Closing Balance | Fair value | Closing Balance | Fair value | ||||
Perpetual bonds | 5,205,776 |
| 3,110,070 |
| 4,036,186 |
| 3,706,553 |
Fixed Rate Notes | 14,227,272 | 9,617,195 | 8,090,297 | 8,345,471 |
(*) Source: Bloomberg
Page 61
CONVENIENCE TRANSLATION INTO ENGLISH FROM THE ORIGINAL PREVIOUSLY ISSUED IN PORTUGUESE | ||
Quarterly Financial Information –June30, 2019 – CIA SIDERURGICA NACIONAL | Version: 1 | |
• Credit Risks
The exposure to credit risks of financial institutions complies with the parameters established in the financial policy. The Company has as practice the detailed analysis of the patrimonial and financial situation of its clients and suppliers, the establishment of a credit limit and the permanent monitoring of its outstanding balance.
With respect to financial investments, the Company only makes investments in institutions with low credit risk rated by rating agencies. Since part of the funds is invested in repo operations that are backed by Brazilian government bonds, there is also exposure to the credit risk of the Brazilian State.
Regarding the exposure to credit risk in accounts receivable and other receivables, the company has a credit risk committee, in which each new customer is analyzed individually regarding their financial condition, before granting the credit limit and payment terms and periodically revised, according to the periodicity procedures of each business area.
• Capital Management
The Company seeks to optimize its capital structure in order to reduce its financial costs and maximize the return to its shareholders. The table below shows the evolution of the Company's capital structure, with financing by equity and third-party capital:
Thousands of reais | 03/31/2020 | 03/31/2020 | ||
Shareholder's equity (equity) |
| 5,406,542 |
| 11,361,932 |
Borrowings and Financing (Third-party capital) | 35,620,060 | 27,967,036 | ||
Gross Debit/Shareholder's equity |
| 6.59 |
| 2.46 |
13. OTHER PAYABLES
The group of other payables classified in current and noncurrent liabilities is comprised as follows:
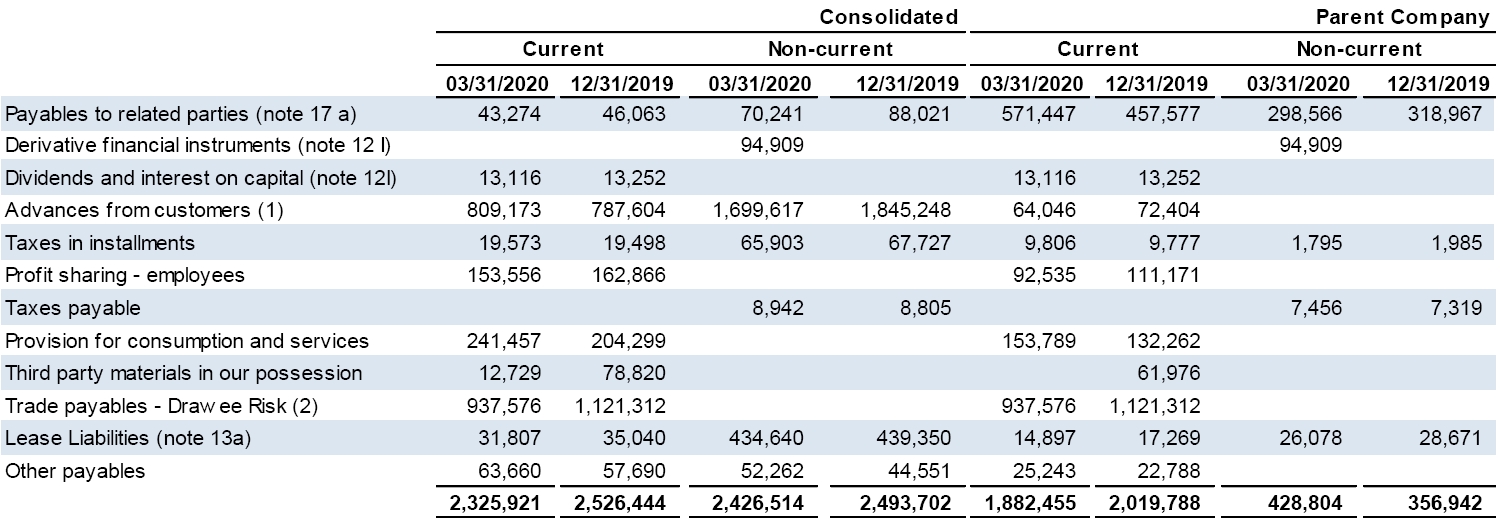
(1)Advances from customers: On March 29, 2019, the Company received in advance through its subsidiary CSN Mineração the amount of US$496 million (R$ 1,951 million) related to a supply contract of approximately 22 million tons of ore to a major international trading, to be executed within 5 years. On July 11, 2019, CSN Mineração entered into an amendment to this contract and received in advance, on August 5, 2019, US$250million (R$956 million) for the additional supply of approximately 11 million tons of iron ore. On September 16, 2019 the contract was amended to reflect some changes in the terms of iron ore delivery.
(2)Trade Payables– Drawee risk: The Company negotiated with financial institutions to anticipate payments from its suppliers, with the objective of lengthening the deadlines. This financial modality is an option of suppliers, and does not require mandatory participation, nor is the Company not reimbursed and / or benefited by the financial institution of discounts for payment executed before the due date agreed with the supplier, there is no change in the degree of subordination of the security in case of judicial execution and no changes in the commercial conditions existing between the Company and its suppliers.
Page 62
CONVENIENCE TRANSLATION INTO ENGLISH FROM THE ORIGINAL PREVIOUSLY ISSUED IN PORTUGUESE | ||
Quarterly Financial Information –June30, 2019 – CIA SIDERURGICA NACIONAL | Version: 1 | |
13.a.) LEASE LIABILITIES
In the quarter, the lease liabilities are presented as follows:
Consolidated | Parent Company | ||||||
03/31/2020 |
| 12/31/2019 | 03/31/2020 |
| 12/31/2019 | ||
Leases | 1,481,248 |
| 1,501,960 |
| 47,417 |
| 53,279 |
Present value adjustment - Leases | (1,014,801) | (1,027,570) | (6,442) | (7,339) | |||
| 466,447 |
| 474,390 |
| 40,975 |
| 45,940 |
Classified: | |||||||
Current | 31,807 |
| 35,040 |
| 14,897 |
| 17,269 |
Non-current | 434,640 | 439,350 | 26,078 | 28,671 | |||
| 466,447 |
| 474,390 |
| 40,975 |
| 45,940 |
The Company has lease agreements for port operations in Itaguaí, the solid bulk terminal – TECAR, used for charges and discharges of coal and iron ore, and the containers terminal – TECON, with remaining terms of 27 and 31 years, respectively. Also, we have lease agreements for railway operations using the Northeast Railway System with a remaining term of 7 years.
Additionally, the Company has real estate lease agreements used for operating premises and sales and administrative offices in several localities where the Company holds operations, with remaining terms of 2, 5 and 16 years.
CSN also has lease agreements for operating equipment used in the mining and steel operations, with remaining terms from 2 to 5 years.
The present value of the future obligations was measured using the implicit rate observed in the contracts and, for the contracts with no explicit rates, the Company applied the Incremental Borrowing Rate – IBR, both in nominal terms.
The incremental borrowing rate was determined by consultations with the banks the Company maintains relationship and and by calculating the average life of its contracts in accordance with orientations given by CVM in the Oficio-Circular/CVM/SNC/SEP nº 02/2019.
The changes in lease liabilities for the three-month period ended March 31, 2020 are shown in the table below:
03/31/2020 | |||
Consolidated | Parent Company | ||
Opening balance | 474,390 |
| 45,940 |
New leases | 1,223 |
| |
Present Value Adjustments - New leases | (322) |
|
|
Contract review | 555 | 341 | |
Write off | (610) |
|
|
Payments | (23,910) | (6,262) | |
Interest appropriated | 13,056 |
| 956 |
Exchange variation | 2,065 |
| |
Net balance | 466,447 |
| 40,975 |
Page 63
CONVENIENCE TRANSLATION INTO ENGLISH FROM THE ORIGINAL PREVIOUSLY ISSUED IN PORTUGUESE | ||
Quarterly Financial Information –June30, 2019 – CIA SIDERURGICA NACIONAL | Version: 1 | |
The minimum future payments estimated to leasing agreements include variable payments, essentially fixed when based on minimum performance and contractually fixed rates and as of March 31, 2020 are as follows:
|
|
| Consolidated | ||||
Less than one year | Between one and five years | Over five years | Total | ||||
Leases | 82,288 |
| 315,624 |
| 1,083,336 |
| 1,481,248 |
Present value adjustment - Leases | (50,481) | (227,874) | (736,446) | (1,014,801) | |||
| 31,807 |
| 87,750 |
| 346,890 |
| 466,447 |
· Recoverable PIS and COFINS
The lease liabilities were remeasured by the payable amounts to the lessors, and did not include the tax credits arisen from such payments. The tax credits embedded in the lease liabilities are shown below:
3/31/2020 | |||
Consolidated | Parent Company | ||
Leases | 1,481,248 |
| 47,417 |
Present value adjustment - Leases | (1,014,801) | (6,442) | |
Potencial PIS and COFINS credit | 137,015 |
| 4,386 |
Present value adjustment – Potential PIS and COFINS credit | (93,869) | (596) |
· Payments of leases not recognized as liabilities:
The Company chose not to recognize lease liabilities in contracts with a maturity of less than twelve months and for assets with low value. The realized payments to these contracts are recognized as expenses, when incurred.
The Company has lease agreements for the use of ports (TECAR) and railways (FTL) which, even if they establish minimum performance, cannot determine their cash flow since these payments are fully variable and will only be known when they occur. In such cases, payments will be recognized as expenses when incurred
The expenses related to payments not included in the measurement of a lease liability in the three-month period ended March 31, 2020 are:
|
| Consolidated |
|
| Parent Company | ||
03/31/2020 | 03/31/2019 | 03/31/2020 | 03/31/2019 | ||||
Contract less than 12 months | 159 |
|
|
| 3,244 |
|
|
Lower Assets value | 1,934 | 760 | 2,019 | 1,593 | |||
Variable lease payments | 45,900 |
| 5,126 |
| 39,675 |
|
|
47,993 | 5,886 | 44,938 | 1,593 |
14. INCOME TAX AND SOCIAL CONTRIBUTION
14.a) Income tax and social contribution recognized in profit or loss:
The income tax and social contribution recognized in profit or loss for the year are as follows:
Consolidated | Parent Company | ||||||
03/31/2020 |
| 03/31/2019 | 03/31/2020 |
| 03/31/2019 | ||
Income tax and social contribution income (expense) | |||||||
Current | (217,555) | (369,818) | 11 | ||||
Deferred | 11,351 | (89,039) | 304 | (45,256) | |||
| (206,204) | (458,857) | 304 | (45,245) |
Page 64
CONVENIENCE TRANSLATION INTO ENGLISH FROM THE ORIGINAL PREVIOUSLY ISSUED IN PORTUGUESE | ||
Quarterly Financial Information –June30, 2019 – CIA SIDERURGICA NACIONAL | Version: 1 | |
The reconciliation of consolidated and parent company income tax and social contribution expenses and the result from applying the tax rate to profit before income tax and social contribution are as follows:
Consolidated | Parent Company | ||||||
03/31/2020 |
| 03/31/2019 | 03/31/2020 |
| 03/31/2019 | ||
(Loss)/Profit before income tax and social contribution | (1,105,505) | 545,620 | (1,361,155) | 37,673 | |||
Tax rate | 34% | 34% | 34% | 34% | |||
Income tax and social contribution at combined statutory rate | 375,872 | (185,511) | 462,793 | (12,809) | |||
Adjustment to reflect the effective rate: | |||||||
Equity in results of affiliated companies | (14,338) | 9,782 | (200,835) | 186,820 | |||
Profit with differentiated rates or untaxed | (291,828) | (47,576) | |||||
Transfer price adjustment | (8,574) | ||||||
Tax loss carryforwards without recognizing deferred taxes | (11,199) | (8,866) | |||||
Indebtdness limit | (5,730) | (6,715) | (5,730) | (6,715) | |||
Unrecorded deferred taxes on temporary differences | (451) | (2,735) | |||||
(Loss)/Reversal for deferred income and social contribution tax credit | (253,261) | (211,848) | (253,261) | (211,848) | |||
Deferred taxes on foreign profit | (14) | ||||||
Tax incentives | 1,625 | 7,462 | |||||
Other permanent deductions (additions) | (6,894) | (4,262) | (2,663) | (693) | |||
Income tax and social contribution in profit for the period | (206,204) | (458,857) | 304 | (45,245) | |||
Effective tax rate | -19% | 84% | 0% | 120% |
14.b) Deferred income tax and social contribution:
The balances of deferred income tax and social contribution can be shown as follows:
Consolidated | |||||||
Opening balance |
| Movement |
| Closing balance | |||
12/31/2019 | Shareholders' |
| P&L | 03/31/2020 | |||
Deferred |
|
|
|
|
|
|
|
Income tax losses | 1,610,801 | 160,566 | 1,771,367 | ||||
Social contribution tax losses | 610,046 | 57,809 | 667,855 | ||||
Temporary differences | (337,082) | (39,847) | (207,024) | (583,953) | |||
- Provision for tax. social security, labor, civil and environmental risks | 264,013 | 3,006 | 267,019 | ||||
- Asset impairment losses | 182,431 | (1,710) | 180,721 | ||||
- (Gains)/losses on financial instruments | 414,495 | 327,436 | 741,931 | ||||
- Actuarial liability (pension and healthcare plan) | 314,601 | 314,601 | |||||
- Accrued supplies and services | 132,411 | 10,432 | 142,843 | ||||
- Unrealized exchange variation (1) | 1,181,501 | (269,677) | 911,824 | ||||
- Gain upon loss of control in Transnordestina | (92,180) | (92,180) | |||||
- Cash flow hedge accounting | 426,961 | 1,708,578 | 2,135,539 | ||||
- Acquisition at fair value of SWT and CBL | (184,513) | (37,889) | 6,283 | (216,119) | |||
- Deferred taxes not computed | (300,819) | (16,563) | (317,382) | ||||
- Estimated (losses)/reversals for deferred income tax and social contribution credits | (1,625,998) | (1,708,578) | (253,261) | (3,587,837) | |||
- Business Combination | (1,023,341) | 1,804 | (1,021,537) | ||||
- Consolidation of CBSI | 50 | (34) | 16 | ||||
- Others | (35,552) | (1,958) | (14,740) | (52,250) | |||
Total | 1,883,765 | (39,847) | 11,351 | 1,855,269 | |||
Total Deferred Assets | 2,473,304 | 2,475,496 | |||||
Total Deferred Liabilities | (589,539) | (620,227) | |||||
Total Deferred | 1,883,765 | 1,855,269 | |||||
Page 65
CONVENIENCE TRANSLATION INTO ENGLISH FROM THE ORIGINAL PREVIOUSLY ISSUED IN PORTUGUESE | ||
Quarterly Financial Information –June30, 2019 – CIA SIDERURGICA NACIONAL | Version: 1 | |
Parent Company | |||||||
Opening balance |
| Movement | Closing balance | ||||
12/31/2019 | Shareholders' |
| P&L |
| 03/31/2020 | ||
Deferred tax assets |
|
|
|
|
|
|
|
Income tax losses | 1,463,981 |
| - |
| 149,461 |
| 1,613,442 |
Social contribution tax losses | 549,026 |
| - |
| 53,805 |
| 602,831 |
Temporary differences | 422,544 | (202,962) | 219,582 | ||||
- Provision for tax. social security, labor, civil and environmental risks | 193,245 |
| - |
| 405 |
| 193,650 |
- Asset impairment losses | 119,645 | - | 1,666 | 121,311 | |||
- (Gains)/losses on financial instruments | 414,495 |
| - |
| 327,435 |
| 741,930 |
- Actuarial liability (pension and healthcare plan) | 317,053 | - | - | 317,053 | |||
- Accrued supplies and services | 121,680 |
| - |
| 9,640 |
| 131,320 |
- Unrealized exchange variation (1) | 1,183,053 | - | (280,984) | 902,069 | |||
- Gain) in control loss on Transnorderstina | (92,180) |
| - |
| - |
| (92,180) |
- Cash flow hedge accounting | 426,961 | 1,708,578 | - | 2,135,539 | |||
- Estimated (losses)/reversals for deferred income tax and social contribution credits | (1,625,998) |
| (1,708,578) |
| (253,261) |
| (3,587,837) |
- Business Combination | (721,992) | - | - | (721,992) | |||
- Outras | 86,582 |
| - |
| (7,863) |
| 78,719 |
Total | 2,435,551 |
| 304 | 2,435,855 | |||
| - |
| - |
| - |
| - |
3,258,542 | 3,258,542 | ||||||
| (822,991) |
|
|
|
|
| (822,687) |
2,435,551 | 2,435,855 | ||||||
(1) The Company taxes exchange differences on a cash basis to calculate income tax and social contribution on net income.
In its corporate structure the Company has foreign subsidiaries whose profits are subject to income tax in the countries where they were established at rates lower than those prevailing in Brazil. In the period from 2015 and 2020, these foreign subsidiaries generated profits amounting to R$1,128,996. If the tax authorities understand that these profits are subject to additional taxation in Brazil in respect of income tax and social contribution, these, if due, would total approximately R$359,555. The Company, based on its legal counsel’s opinion, assessed as possible the likelihood of loss in the event of challenge by the tax authorities and, therefore, no provision was recognized in this interim financial information.
In addition, the management assessed IFRIC 23 – “Uncertainties Over Income Tax Treatments” and considered the tax authorities have no reasons to diverge from the Company’s current tax positions. Accordingly, we did not recognize any additional provisions for income tax and social contribution arisen from the assessment of IFRIC 23 in the interim financial information as of March 31, 2020.
Page 66
CONVENIENCE TRANSLATION INTO ENGLISH FROM THE ORIGINAL PREVIOUSLY ISSUED IN PORTUGUESE | ||
Quarterly Financial Information –June30, 2019 – CIA SIDERURGICA NACIONAL | Version: 1 | |
A sensitivity analysis of tax credit was performed considering a variation of macroeconomics assumptions, operating performance and liquidity events. In this way, considering the results of studies performed, which indicates that it is probable that there will be generated taxable income to use the deferred income and social contribution taxes.
The estimated recovery of deferred tax assets of IRPJ and CSLL is presented by its net amount when they refer to a same tax jurisdiction, as shown below:
In millions of reais | Consolidated | Parent Company | |
2020 | 230 |
| 230 |
2021 | 713 | 713 | |
2022 | 938 |
| 938 |
2023 | 985 | 985 | |
2024 | 432 |
| 393 |
Deferred asset | 3,298 | 3,259 | |
Deferred liabilities - Parent Company | (823) |
| (823) |
Net deferred asset | 2,475 | 2,436 | |
Deferred liabilities - subsidiaries | (620) |
|
|
Deferred liabilities - Parent Company | 1,855 | 2,436 |
14.c) Income statement and social contribution recognized in the shareholders’ equity
The income statement and social contribution recognized directly in the shareholder’s equity are demonstrated below:
Consolidated |
| Parent Company | |||||
03/31/2020 |
| 12/31/2019 |
| 03/31/2020 |
| 12/31/2019 | |
Income tax and social contribution |
|
|
|
|
|
|
|
Actuarial gains on defined benefit pension plan | 215,336 | 215,306 | 217,969 | 217,969 | |||
Estimated losses for deferred income and social contribution tax credits - actuarial gains | (217,969) | (217,969) | (217,969) | (217,969) | |||
Exchange differences on translating foreign operations | (325,350) | (325,350) | (325,350) | (325,350) | |||
Cash flow hedge accounting | 2,135,539 | 426,961 | 2,135,539 | 426,961 | |||
Estimated losses for deferred income and social contribution tax credits - cash flow hedge | (2,135,539) | (426,961) | (2,135,539) | (426,961) | |||
| (327,983) | (328,013) | (325,350) | (325,350) | |||
15. PROVISION FOR TAX, SOCIAL SECURITY, LABOR, CIVIL AND ENVIRONMENTAL RISKS AND JUDICIAL DEPOSITS
Are being discussed in the competent spheres, actions and complaints of various natures. The details of the provisioned amounts and the related judicial deposits are presented below:
|
|
|
|
|
|
Consolidated |
|
|
|
|
|
Parent Company | ||||
|
| Accrued liabilities |
| Judicial deposits |
| Accrued liabilities |
| Judicial deposits | ||||||||
|
| 03/31/2020 |
| 12/31/2019 | 03/31/2020 |
| 12/31/2019 | 03/31/2020 |
| 12/31/2019 | 03/31/2020 |
| 12/31/2019 | |||
Tax |
| 125,615 |
| 128,411 |
| 19,271 |
| 31,060 |
| 52,278 |
| 56,343 |
| 3,043 |
| 15,227 |
Social security | 5,306 | 7,039 |
| 5,102 | 6,447 | |||||||||||
Labor |
| 312,828 |
| 305,309 |
| 238,818 |
| 227,213 |
| 221,575 |
| 217,907 |
| 174,181 |
| 164,580 |
Civil | 158,010 | 138,990 | 55,628 | 53,771 | 122,302 | 105,464 | 43,933 | 42,252 | ||||||||
Environmental |
| 18,023 |
| 43,498 |
| 3,731 |
| 3,731 |
| 11,372 |
| 36,558 |
| 2,241 |
| 2,241 |
Deposit of a guarantee |
|
| 15,672 | 12,596 |
|
|
|
| ||||||||
|
| 619,782 |
| 623,247 |
| 333,120 |
| 328,371 |
| 412,629 |
| 422,719 |
| 223,398 |
| 224,300 |
Classified: | ||||||||||||||||
Current |
| 83,031 |
| 96,479 |
|
|
|
|
| 37,694 |
| 52,016 |
|
|
|
|
Non-current | 536,751 | 526,768 | 333,120 | 328,371 | 374,935 | 370,703 | 223,398 | 224,300 | ||||||||
|
| 619,782 |
| 623,247 |
| 333,120 |
| 328,371 |
| 412,629 |
| 422,719 |
| 223,398 |
| 224,300 |
Page 67
CONVENIENCE TRANSLATION INTO ENGLISH FROM THE ORIGINAL PREVIOUSLY ISSUED IN PORTUGUESE | ||
Quarterly Financial Information –June30, 2019 – CIA SIDERURGICA NACIONAL | Version: 1 | |
The changes in the provisions for tax, social security, labor, civil and environmental risks for the three-month period ended March 31, 2020 were as follows:
Consolidated | ||||||||||
|
|
|
|
|
|
|
|
|
| Current + Non-current |
Nature | 12/31/2019 | Additions | Accrued charges | Net utilization of reversal | 03/31/2020 | |||||
Tax |
| 128,411 | 19,558 | 316 | (22,670) | 125,615 | ||||
Social security | 7,039 | 1,782 | 169 | (3,684) | 5,306 | |||||
Labor |
| 305,309 | 11,923 | 16,588 | (20,992) | 312,828 | ||||
Civil | 138,990 | 21,217 | 4,265 | (6,462) | 158,010 | |||||
Environmental |
| 43,498 | 4,948 | 123 | (30,546) | 18,023 | ||||
623,247 | 59,428 | 21,461 | (84,354) | 619,782 |
|
|
|
|
|
|
|
|
|
| Parent Company |
|
|
|
|
|
|
|
|
|
| Current + Non-current |
Nature |
| 12/31/2019 |
| Additions |
| Accrued charges |
| Net utilization of reversal |
| 03/31/2020 |
Tax |
| 56,343 | 16,721 | 121 | (20,907) | 52,278 | ||||
Social security | 6,447 | 1,578 | 169 | (3,092) | 5,102 | |||||
Labor |
| 217,907 | 6,702 | 9,565 | (12,599) | 221,575 | ||||
Civil | 105,464 | 18,005 | 3,548 | (4,715) | 122,302 | |||||
Environmental |
| 36,558 | 4,935 | 25 | (30,146) | 11,372 | ||||
422,719 | 47,941 | 13,428 | (71,459) | 412,629 |
The provision for tax, social security, labor, civil and environmental risks was estimated by Management and is mainly based on the legal counsel’s assessment. Only lawsuits for which the risk is classified as probable loss are provisioned. Additionally, tax liability from actions initiated by the Company is included in this provision and is subject to SELIC (Central Bank’s policy rate).
§ Possible administrative and judicial proceedings
The table below shows a summary of the main matters classified as possible risk compared with the balances as of March 31, 2020 and December 31, 2019.
Page 68
CONVENIENCE TRANSLATION INTO ENGLISH FROM THE ORIGINAL PREVIOUSLY ISSUED IN PORTUGUESE | ||
Quarterly Financial Information –June30, 2019 – CIA SIDERURGICA NACIONAL | Version: 1 | |
| 03/31/2020 |
| 12/31/2019 | |
Assessment Notice and imposition of fine (AIIM) - Income tax and social contribution - Capital gain on sale of NAMISA's shares. |
| 12,472,256 |
| 12,412,964 |
Assessment Notice and Imposition of fine (AIIM) - Income tax and Social contribution - Disallowance of deductions of goodwill generated in the reverse incorporation of Big Jump by NAMISA. | 3,877,991 | 3,867,663 | ||
Assessment Notice and Imposition of fine (AIIM) - Income tax and Social contribution - Disallowance of interest on prepayment arising from supply contracts of iron ore and port services. |
| 2,409,997 |
| 2,249,708 |
Assessment Notice and imposition of fine (AIIM) - Income tax and social contribution due to profits from foreign subsidiaries for years 2008, 2010, 2011, 2014. | 2,968,671 | 2,946,288 | ||
Tax foreclosures - ICMS - Electricity credits |
| 1,026,947 |
| 1,022,371 |
Offset of taxes that were not approved by the Federal Revenue Service - IRPJ/CSLL, PIS/COFINS and IPI | 1,116,289 | 1,100,564 | ||
Disallowance of the ICMS credits - Transfer of iron ore |
| 570,156 |
| 567,534 |
ICMS - Refers to the transfer of imported raw material at an amount lower than the price disclosed in the import documentation | 311,984 | 310,349 | ||
Disallowance of the tax loss and negative basis of social contribution arising from the adjustments in the SAPLI |
| 540,000 |
| 538,268 |
Assessment Notice- IRRF- Capital Gain of CFM vendors located abroad | 255,972 | 254,850 | ||
CFEM – difference of understanding between CSN and DNPM on the calculation basis |
| 1,034,890 |
| 1,020,266 |
Assessment Notice- ICMS- questions about sales for incentive area | 1,018,596 | 1,015,812 | ||
Other tax lawsuits (federal, state, and municipal) |
| 4,556,997 |
| 4,478,014 |
Social security lawsuits | 277,915 | 325,492 | ||
Action to discuss the balance of the construction contract – Tebas |
| 487,124 |
| 468,776 |
Action related to power supply payment’s charge - Light | 259,558 | 253,569 | ||
Indemnity action due to the supply contract termination - Indumill |
| 221,427 |
| 215,281 |
Enforcement action applied by Brazilian antitrust authorities (CADE) | 93,830 | 93,212 | ||
$0.00 |
| 20,000 |
| 20,000 |
Other civil lawsuits | 778,440 | 764,127 | ||
Labor and social security lawsuits |
| 1,575,714 |
| 1,565,237 |
Tax foreclosures – Fine – Volta Redonda IV (2) | 86,138 | 84,599 | ||
Other environmental lawsuits |
| 241,737 |
| 215,691 |
36,202,629 | 35,790,635 |
(1) In May 2019, the Public Ministry of the state of Minas Gerais judged an ACP to oblige CSN Mineração to adopt measures to mitigate the risks and psichological damages theoretically caused by the dam of Casa de Pedra, relocating families who prefer to move, and assuming rental expenses and social assistance, as well as relocating the kids and children to nursery and school rebuilt in safer locations. By an injunction, the First Instance Magistrate determined the block of R$3 million to rebuild the nursery and school, a decision canceled by the Court of second instance, which determined the Magistrate to reassess all injunctions. The Public Ministry of the state of Minas Gerais also determined the payment of collective moral damages, as well as definitive relocation of the families at the cost of CSN Mineração. The action is in initial stage and no judicial sentence has been given yet.
(2) On April 8, 2013, INEA applied to CSN a fine in the amount of R$35 million related to the aspects of the condominium Volta Grande IV, determining the execution of the actions already weigthed and discussed in the public civil action filed in July 2012. In relation to that fine, an anullment action was filed, distributed to the 10th Civil Court of Rio de Janeiro County in January 2014, with the purpose of cancelling the fine and its effects. Also, INEA filed a tax enforcement action to execute the imposed fine. The tax enforcement action was distributed in May 2014 to the 4th Registry of Active Debt of Volta Redonda, in the state of Rio de Janeiro. Currently, the tax enforcement action is suspended until the judgement of the anullment action in order to avoid conflicting decisions.
The assessments made by the legal counsel define these administrative and judicial proceedings as entailing risk of possible loss and, therefore, no provision was recognized in conformity with Management’s judgment and accounting practices adopted in Brazil.
Page 69
CONVENIENCE TRANSLATION INTO ENGLISH FROM THE ORIGINAL PREVIOUSLY ISSUED IN PORTUGUESE | ||
Quarterly Financial Information –June30, 2019 – CIA SIDERURGICA NACIONAL | Version: 1 | |
16. PROVISION FOR ENVIRONMENTAL LIABILITIES AND ASSET RETIREMENT OBLIGATIONS
The information on provision for environmental liabilities and asset retirement obligations has not changed in relation to that disclosed in the Company's financial statements as of December 31, 2019 and, accordingly, the Company decided not to repeat it in the condensed interim financial information as of March 31, 2020.
The balance of the provision for environmental liabilities and asset retirement obligation (ARO) is as follows:
|
|
| Consolidated |
|
|
| Parent Company |
03/31/2020 |
| 12/31/2019 |
| 03/31/2020 |
| 12/31/2019 | |
Environmental liabilities | 205,271 |
| 192,270 |
| 175,048 |
| 163,659 |
Asset retirement obligations | 339,370 |
| 331,731 |
| 827 |
| 805 |
| 544,641 |
| 524,001 |
| 175,875 |
| 164,464 |
17. RELATED-PARTY BALANCES AND TRANSACTIONS
The information on related-party transactions has not changed significantly in relation to that disclosed in the Company's financial statements as of December 31, 2019.
17.a) Transactions with subsidiaries, joint ventures, associates, exclusive funds and other related parties
· By transaction
Consolidated | ||||||||||||
Current | Non-current | Total | ||||||||||
03/31/2020 |
| 12/31/2019 |
| 03/31/2020 |
| 12/31/2019 |
| 03/31/2020 |
| 12/31/2019 | ||
Assets |
| |||||||||||
Trade receivables(note 5) | 202,160 | 170,588 | 202,160 | 170,588 | ||||||||
Dividends receivable (note 7) |
| 44,554 | 44,554 | 44,554 | 44,554 | |||||||
Actuarial asset (note 7) | 12,453 | 13,714 | 12,453 | 13,714 | ||||||||
Short-term investments |
| 1,298,370 | 2,116,560 | 121,027 | 95,719 | 1,419,397 | 2,212,279 | |||||
Loans (note 7) | 936,848 | 846,300 | 936,848 | 846,300 | ||||||||
Other receivables (note 7) |
| 1,829 | 1,830 | 428,672 | 428,672 | 430,501 | 430,502 | |||||
1,546,913 | 2,333,532 | 1,499,000 | 1,384,405 | 3,045,913 | 3,717,937 | |||||||
Liabilities |
| |||||||||||
Empréstimos e financiamentos | ||||||||||||
Empréstimos Intercompany (nota 11) |
| 25,038 | 25,038 | |||||||||
Other payables (note 13) | ||||||||||||
Accounts payable |
| 21,193 | 23,566 | 70,241 | 88,021 | 91,434 | 111,587 | |||||
Provision for consumption and services | 22,081 | 22,497 | 22,081 | 22,497 | ||||||||
Trade payables |
| 202,900 | 240,984 | - | 202,900 | 240,984 | ||||||
Actuarial liabilities | 19,788 | 19,788 | 19,788 | 19,788 | ||||||||
|
| 246,174 | 312,085 | 90,029 | 107,809 | 336,203 | 419,894 | |||||
|
| 03/31/2020 |
| 03/31/2019 |
P&L | ||||
Revenues |
|
|
|
|
Sales | 331,989 | 264,366 | ||
Interest (note 22) |
| 17,819 |
| 20,161 |
Foreing exchange and monetary variations, net | 26,864 | 504 | ||
Expenses |
|
|
|
|
Purchases | (172,240) | (345,387) | ||
Interest (note 22) |
| (3,402) |
| (3,735) |
Financial investments (nota 22) | (962,354) | - | ||
|
| (761,324) |
| (64,091) |
Page 70
CONVENIENCE TRANSLATION INTO ENGLISH FROM THE ORIGINAL PREVIOUSLY ISSUED IN PORTUGUESE | ||
Quarterly Financial Information –June30, 2019 – CIA SIDERURGICA NACIONAL | Version: 1 | |
· By company
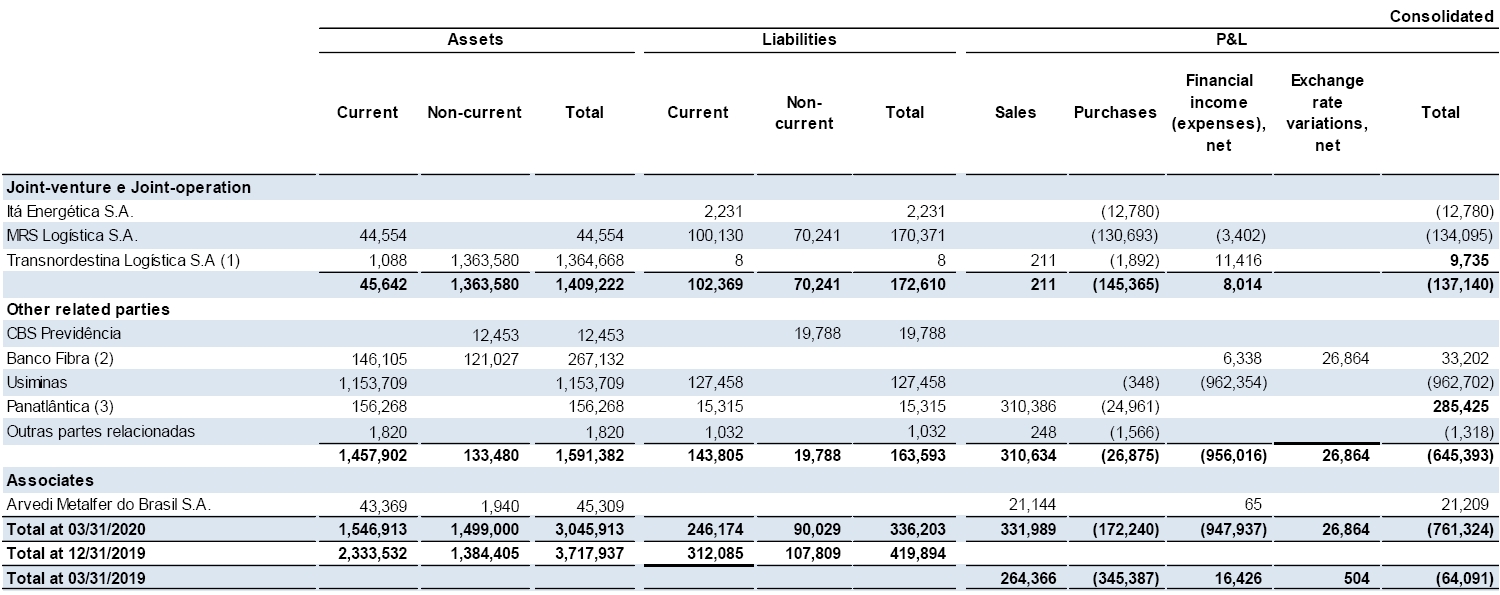
1. Transnordestina Logística S.A: Assets: Refers mainly to loan agreements with interest rate ranging from 125% to 130% of the CDI. As of March 31, 2020, the loans amounted to R$934,908 (R$844,426 as of December 31, 2019) and advances for future capital increase of R$ 428,672 (R$ 428,672 as of December 31, 2019).
2. Banco Fibra S.A:Assets: Refers mainly to Eurobond from Fibra Bank with maturity in February 2028.
3. Panatlântica: Receivables from the sale of steel products.
Page 71
CONVENIENCE TRANSLATION INTO ENGLISH FROM THE ORIGINAL PREVIOUSLY ISSUED IN PORTUGUESE | ||
Quarterly Financial Information –June30, 2019 – CIA SIDERURGICA NACIONAL | Version: 1 | |
· By transaction
|
|
|
|
|
|
|
|
| Parent Company | |||
|
| Current | Non-current | Total | ||||||||
03/31/2020 | 12/31/2019 | 03/31/2020 | 12/31/2019 | 03/31/2020 | 12/31/2019 | |||||||
Assets |
|
|
|
|
|
|
|
|
|
|
|
|
Trade receivables (1) (note 5) | 1,338,613 | 943,623 | 1,338,613 | 943,623 | ||||||||
Dividends receivable (note 7) |
| 33,351 |
| 33,447 |
|
|
|
|
| 33,351 |
| 33,447 |
Loans (note 7) | 990,034 | 883,394 | 990,034 | 883,394 | ||||||||
Financial investments (2) |
| 1,306,049 |
| 2,124,626 |
| 121,027 |
| 95,719 |
| 1,427,076 |
| 2,220,345 |
Other receivables (3) (note 7) | 13,957 | 14,770 | 658,414 | 674,800 | 672,371 | 689,570 | ||||||
|
| 2,691,970 |
| 3,116,466 |
| 1,769,475 |
| 1,653,913 |
| 4,461,445 |
| 4,770,379 |
Liabilities | ||||||||||||
Borrowings |
|
|
|
|
|
|
|
|
|
|
|
|
Prepayment (note11) | 113,260 | 73,334 | 7,915,437 | 6,162,673 | 8,028,697 | 6,236,007 | ||||||
Intercompany Bonds (note 11) |
| 13,185 |
| 2,491 |
| 483,479 |
| 374,855 |
| 496,664 |
| 377,346 |
Intercompany Loans (note11) | 289,634 | 1,499,197 | 6,869,338 | 2,075,353 | 7,158,972 | 3,574,550 | ||||||
|
| 416,079 |
| 1,575,022 |
| 15,268,254 |
| 8,612,881 |
| 15,684,333 |
| 10,187,903 |
Other payables (note 13) | ||||||||||||
Accounts payable |
| 93,531 |
| 92,352 |
| 298,566 |
| 318,967 |
| 392,097 |
| 411,319 |
Provision for consumption and services | 477,916 | 365,225 | 477,916 | 365,225 | ||||||||
Trade payables |
| 941,252 |
| 910,929 |
|
|
|
|
| 941,252 |
| 910,929 |
Actuarial liabilities | 19,788 | 19,788 | 19,788 | 19,788 | ||||||||
|
| 1,512,699 |
| 1,368,506 |
| 318,354 |
| 338,755 |
| 1,831,053 |
| 1,707,261 |
1,928,778 | 2,943,528 | 15,586,608 | 8,951,636 | 17,515,386 | 11,895,164 | |||||||
|
| 03/31/2020 |
| 03/31/2019 | ||||||||
P&L |
| |||||||||||
Revenues |
|
|
|
| ||||||||
Sales/Others | 875,927 | 764,532 | ||||||||||
Interest (note 22) |
| 18,284 |
| 18,344 | ||||||||
Exclusive funds (note 22) | (30) | 683 | ||||||||||
Expenses |
|
|
|
| ||||||||
Purchases | (443,603) | (643,306) | ||||||||||
Interest (note 22) |
| (97,782) |
| (71,100) | ||||||||
Foreing exchange and monetary variations, net | (3,099,824) | (66,033) | ||||||||||
Financial investments (nota 22) |
| (962,354) |
| - | ||||||||
(3,709,382) | 3,120 | |||||||||||
1. Receivables from sales of goods and services between the parent company, subsidiaries and joint ventures.
2. Assets: Financial investments classified in current total are investments in exclusive funds, in the Fibra Bank and in Usiminas’ shares, the last classified as fair value through profit or loss.
3. Noncurrent: Refers mainly to advance for future capital increase, dividends receivable and receivables from acquisition of debentures.
Page 72
CONVENIENCE TRANSLATION INTO ENGLISH FROM THE ORIGINAL PREVIOUSLY ISSUED IN PORTUGUESE | ||
Quarterly Financial Information –June30, 2019 – CIA SIDERURGICA NACIONAL | Version: 1 | |
· By company
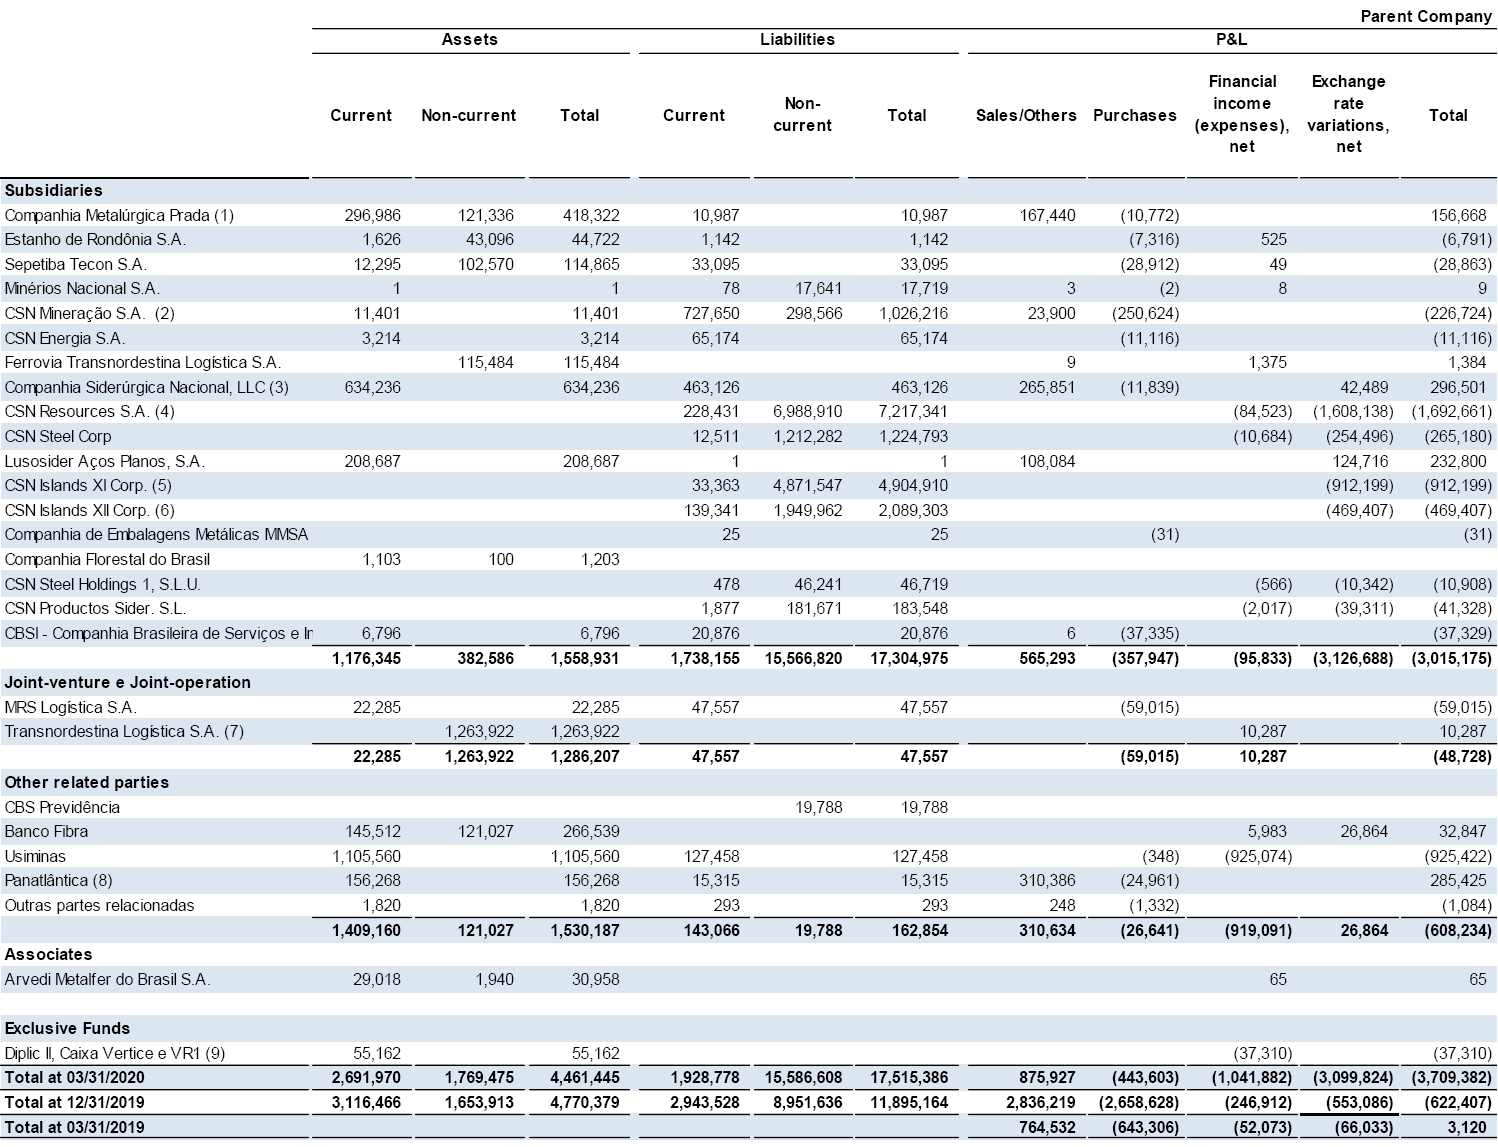
1. Companhia Metalúrgica Prada: Refers mainly to receivables in the amount of R$296,986 (R$278,739 as of December 31,2019), and debentures from the indirect subsidiary CBL in the amount of R$121,336 (R$121,336 as of December 31,2019).
2. CSN Mineração:Liabilities: Payables from purchases of iron ore and port services in the amount of R$727,650 (R$992,267 as of December 31,2019).
3. Companhia Siderurgica Nacional, LLC: Receivables of R$634,236 (R$345,470 as of December 31, 2019), related to sale of steel for resale. Current liabilities refer mainly to commission expenses and logistics in the operations of steel resales in the amount of R$ R$463,126 (R$348,060 as of December 31,2019).
4. CSN Resources SA: Prepayment contracts in dollar andFixed Rate Notes. As of March 31, 2020, the loans amounted toR$7,217,341(R$5,485,880 as of December 31, 2019).
5. CSN Islands XI Corp.:Intercompany contracts in US dollars. As of March 31, 2020, the loans amounted to R$4,904,910(R$1,787,566 as of December 31, 2019).
6. CSN Islands XII Corp.: Refers mainly to Intercompany contracts in dollar. As of March 31, 2020, the loans amounted toR$2,089,303 (R$1,619,896 as of December 31, 2019).
7. Transnordestina Logística S.A: noncurrent assets: refers to loan agreements in the amount of R$835,250 (R$742,875 as of December 31,2019) and advance for future capital increase in the amount of R$428,672 (R$428,672 as of December 31,2019).
8. Panatlântica: current assets: refers to accounts receivable for the supply of flat steel in the amount of R$156,268 (R$128,573 on December 31, 2019).
9. Exclusive funds:Current assets: Refers to investments in Government securities and CDBs, in the amount ofR$8,272 (R$8,301as of December 31,2019). Noncurrent assets: Refers to Usiminas’ shares in the amount ofR$46,890 (R$84,171as of December 31,2019). The funds VR1 and Diplic II are managed by Taquari Asset.
Page 73
CONVENIENCE TRANSLATION INTO ENGLISH FROM THE ORIGINAL PREVIOUSLY ISSUED IN PORTUGUESE | ||
Quarterly Financial Information –June30, 2019 – CIA SIDERURGICA NACIONAL | Version: 1 | |
17.b) Key management personnel
The key management personnel with authority and responsibility for planning, directing and controlling the Company’s activities, include the members of the Board of Directors and statutory directors. The following is information on the compensation of such personnel and the related balances as of March 31, 2020.
03/31/2020 | 03/31/2019 | |||
P&L | ||||
Short-term benefits for employees and officers |
| 6,581 |
| 3,818 |
Post-employment benefits | 9 | 26 | ||
|
| 6,590 |
| 3,844 |
17.c) Guarantees
The Company is responsible for fiduciary guarantees of its subsidiaries, joint-ventures and joint-operations as shown below:
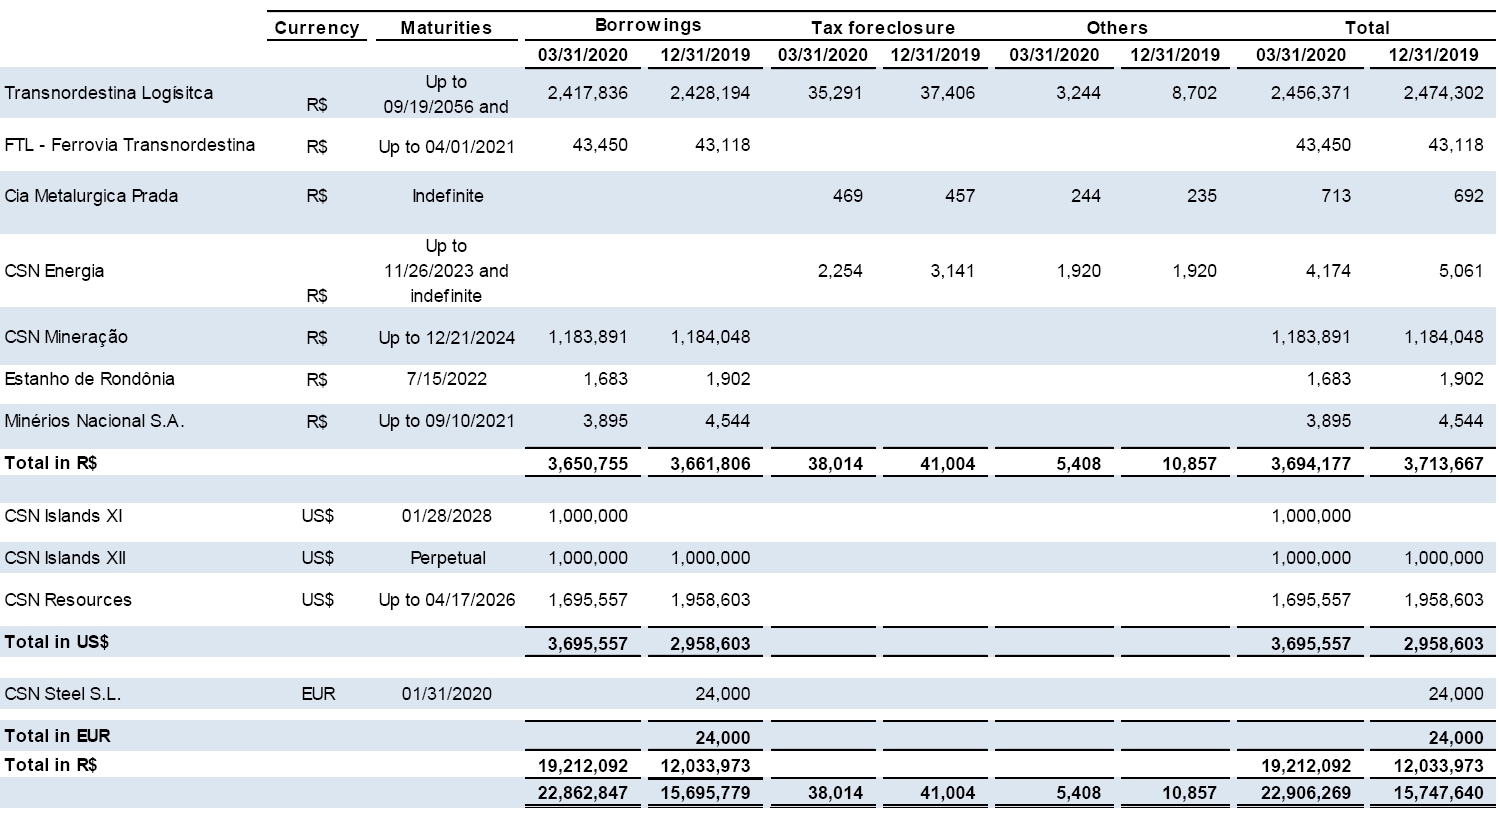
18. SHAREHOLDERS’ EQUITY
18.a) Paid-in capital
Fully subscribed and paid-in capital as of March 31, 2020 and December 31, 2019 is R$4,540,000 represented by 1,387,524,047 book-entry common shares without par value. Each common share entitles to one vote in resolutions of the General Meeting.
18.b) Authorized capital
The Company’s bylaws in effect as of March 31, 2020 determine that the capital can be raised to up to 2,400,000,000 shares by decision of the Board of Directors.
Page 74
CONVENIENCE TRANSLATION INTO ENGLISH FROM THE ORIGINAL PREVIOUSLY ISSUED IN PORTUGUESE | ||
Quarterly Financial Information –June30, 2019 – CIA SIDERURGICA NACIONAL | Version: 1 | |
18.c) Legal reserve
This reserve is recognized at the rate of 5% of the profit for each period, as provided for by Article 193 of Law 6404/76, up to the ceiling of 20% of the share capital.
18.d) shareholder structure
As ofMarch 31, 2020, the Company’s shareholder structure was as follows:
|
|
|
| 03/31/2020 |
|
|
|
| 12/31/2019 | |||
Number of common shares | % of total shares | % of voting capital | Number of common shares | % of total shares | % of voting capital | |||||||
Vicunha Aços S.A. (*) |
| 679,522,254 |
| 48.97% |
| 49.24% |
| 679,522,254 |
| 48.97% |
| 49.24% |
Rio Iaco Participações S.A. (*) |
| 58,193,503 |
| 4.19% |
| 4.22% |
| 58,193,503 |
| 4.19% |
| 4.22% |
NYSE (ADRs) |
| 249,270,033 |
| 17.97% |
| 18.06% |
| 262,206,103 |
| 18.90% |
| 19.00% |
Other shareholders |
| 393,128,757 |
| 28.33% |
| 28.49% |
| 380,192,687 |
| 27.40% |
| 27.55% |
|
| 1,380,114,547 |
| 99.47% |
| 100.00% |
| 1,380,114,547 |
| 99.47% |
| 100.00% |
Treasury shares |
| 7,409,500 |
| 0.53% |
|
|
| 7,409,500 |
| 0.53% |
|
|
Total shares |
| 1,387,524,047 |
| 100.00% |
|
|
| 1,387,524,047 |
| 100.00% |
|
|
(*) Controlling group companies.
18.e) Treasury shares
As of March 31, 2020, the treasury shares were as follows:
Quantity purchased (in units) | Amount paid for the shares | Share price | Share market price as of 03/31/2020 (*) | |||||||
Minimum |
| Maximum |
| Average | ||||||
7,409,500 |
| R$ 58,264 |
| R$ 4.48 |
| R$ 10.07 |
| R$ 7.86 |
| R$ 51,644 |
(*) By using the average price of the shares as of March 31, 2020 of R$6.97 per share.
18.f) Policy on investments and payment of interest on capital and dividends
The Company adopts a profit distribution policy which, in compliance with the provisions in Law 6,404/76, as amended by Law 9,457/97, will entail the allocation of all the profit to the Company’s shareholders, provided that the following priorities are observed, irrespective of their order: (i) carrying out the business strategy; (ii) fulfilling its obligations; (iii) making the required investments; and (iv) maintaining a healthy financial situation of the Company.
18.g) Earnings/(loss) per share:
Basic earnings/(loss) per share were calculated based on the profit/loss attributable to the owners of CSN divided by the weighted average number of common shares outstanding during the period, excluding the common shares purchased and held as treasury shares, as follows:
Parent Company | |||
03/31/2020 |
| 03/31/2019 | |
Common Shares |
|
| |
Loss for the period | (1,360,851) |
| (7,572) |
Weighted average number of shares | 1,380,114,547 | 1,373,250,595 | |
Basic and diluted EPS | (0.98604) |
| (0.00551) |
Page 75
CONVENIENCE TRANSLATION INTO ENGLISH FROM THE ORIGINAL PREVIOUSLY ISSUED IN PORTUGUESE | ||
Quarterly Financial Information –June30, 2019 – CIA SIDERURGICA NACIONAL | Version: 1 | |
The Company does not hold potential dilutable ordinary shares outstanding that could result in dilution of earnings per share
19. NET SALES REVENUE
Net sales revenue is comprised as follows:
Consolidated | Parent Company | |||||||
03/31/2020 |
| 03/31/2019 | 03/31/2020 |
| 03/31/2019 | |||
Gross revenue |
|
|
|
|
|
|
|
|
Domestic market |
| 3,570,496 | 3,563,173 | 3,430,097 | 3,418,248 | |||
Foreign market |
| 2,645,352 | 3,293,102 | 414,945 | 390,842 | |||
|
| 6,215,848 | 6,856,275 | 3,845,042 | 3,809,090 | |||
Deductions |
| |||||||
Sales returns, discounts and rebates | (78,014) | (60,394) | (75,343) | (57,298) | ||||
Taxes on sales |
| (803,181) | (790,415) | (738,390) | (730,575) | |||
(881,195) | (850,809) | (813,733) | (787,873) | |||||
Net revenue |
| 5,334,653 | 6,005,466 | 3,031,309 | 3,021,217 |
20. EXPENSES BY NATURE
|
|
|
|
| Parent Company | |||
03/31/2020 | 03/31/2019 | 03/31/2020 | 03/31/2019 | |||||
Raw materials and inputs |
| (1,622,429) | (1,797,797) | (1,598,255) | (1,762,660) | |||
Labor cost | (689,990) | (630,183) | (326,852) | (293,695) | ||||
Supplies |
| (496,110) | (472,504) | (390,627) | (349,240) | |||
Maintenance cost (services and materials) | (251,076) | (322,986) | (135,578) | (167,491) | ||||
Outsourcing services |
| (603,247) | (540,677) | (231,771) | (204,884) | |||
Freight | (52,970) | (20,553) | (12,601) | (11,186) | ||||
Distribution freight |
| (278,725) | (448,201) | (88,424) | (59,584) | |||
Depreciation, amortization and depletion | (415,181) | (306,166) | (206,703) | (157,112) | ||||
Others |
| (117,949) | (176,093) | (3,497) | ||||
(4,527,677) | (4,715,160) | (2,990,811) | (3,009,349) | |||||
Classified as: |
| |||||||
Cost of sales | (4,017,707) | (4,021,495) | (2,778,380) | (2,833,088) | ||||
Selling expenses |
| (390,915) | (573,484) | (162,239) | (120,144) | |||
General and administrative expenses | (119,055) | (120,181) | (50,192) | (56,117) | ||||
|
| (4,527,677) | (4,715,160) | (2,990,811) | (3,009,349) |
Additions to depreciation, amortization and depletion for the period were distributed as follows:
Consolidated | Parent Company | ||||||
03/31/2020 |
| 03/31/2019 |
| 03/31/2020 |
| 03/31/2019 | |
Production costs (1) | 403,600 |
| 298,665 |
| 200,458 |
| 152,637 |
Selling expenses | 3,276 | 1,279 | 2,729 | 978 | |||
General and administrative expenses | 8,305 |
| 6,222 |
| 3,516 |
| 3,497 |
415,181 | 306,166 | 206,703 | 157,112 | ||||
Other operational (2) | 21,112 |
| 21,904 |
| 2,298 |
| 895 |
436,293 | 328,070 | 209,001 | 158,007 |
1. The production cost line includes PIS and COFINS credits on the lease agréments in the amount of R$1,214 in the consolidated and R$494 in the parent company as of March 31, 2020 in accordance with the orientations of CVM in its Ofício-Circular CVM/SNC/SEP 02/2019.
2. Refer substantially to the depreciation of the investment properties, out-of-work equipment and amortization of SWT’s customers relationship, see Note 21.
Page 76
CONVENIENCE TRANSLATION INTO ENGLISH FROM THE ORIGINAL PREVIOUSLY ISSUED IN PORTUGUESE | ||
Quarterly Financial Information –June30, 2019 – CIA SIDERURGICA NACIONAL | Version: 1 | |
21. OTHER OPERATING INCOME (EXPENSES)
Consolidated | Parent Company | |||||||
03/31/2020 |
| 03/31/2019 | 03/31/2020 |
| 03/31/2019 | |||
Other operating income |
| |||||||
Indemnities | 1,156 | 1,287 | 983 | 1,255 | ||||
Rentals and leases |
| 2,462 | 2,162 | 2,393 | 2,072 | |||
Dividends received | 380 | 380 | ||||||
PIS, COFINS and INSS to compensate (1) |
| 88,390 | 87,394 | 65,092 | 87,394 | |||
Contractual fines | 2,016 | 864 | 1,410 | 686 | ||||
Updated shares – Fair value through profit or loss (Note 12II) |
| (207) | 127,653 | (207) | 127,653 | |||
Other revenues | 8,872 | 9,212 | 5,176 | 254 | ||||
|
| 102,689 | 228,952 | 74,847 | 219,694 | |||
|
|
|
|
|
|
| ||
Other operating expenses | ||||||||
Taxes and fees |
| (5,304) | (5,134) | (2,393) | (1,024) | |||
Expenses with environmental liabilities, net | (15,922) | (8,607) | (2,209) | (3,313) | ||||
Write-off/(Provision) of judicial lawsuits |
| (7,157) | 42,427 | 3,454 | 44,453 | |||
Depreciation of investment property, equipment paralyzed and amortization of intangible assets (note 20) | (21,112) | (21,904) | (2,298) | (895) | ||||
Write- off of PPE and intagible assests (note 9) |
| (1,400) | (13,712) | (13,542) | ||||
Estimated (Loss)/reversal in inventories | (20,351) | (41,149) | (5,814) | (8,935) | ||||
Idleness in stocks and paralyzed equipment (2) |
| (202,240) | (67,261) | (37,043) | (67,261) | |||
Studies and project engineering expenses | (5,075) | (4,919) | (3,840) | (7,108) | ||||
Research and development expenses |
| (197) | (349) | (197) | (349) | |||
Healthcare plan expenses | (28,829) | (29,086) | (28,693) | (28,976) | ||||
Cash flow hedge accounting realized (note 12 b) |
| (364,818) | (184,217) | (364,818) | (184,217) | |||
Other expenses | (96,519) | (30,461) | (90,787) | (13,428) | ||||
|
| (768,924) | (364,372) | (534,638) | (284,595) | |||
Other operating income (expenses), net | (666,235) | (135,420) | (459,791) | (64,901) | ||||
(1) In2020, refers to social security credit recoverable due to benefits granted to employees that should not be included in the basis of calculation of the contribution to the Social Security. In 2019, refers to the exclusion of ICMS in the basis of calculation of PIS and COFINS.
(2) Refers to the idle capacity arisen from production volumes lower than normal. In the parent company was generated from the refurbishment of the blast furnace No.3 and in the consolidated was generated in the iron ore mining operation due to delays in the release of environmental licenses, which postponed the start of new ore mining fronts, as well as new dry tailing processes still in ramp-up stage.
Page 77
CONVENIENCE TRANSLATION INTO ENGLISH FROM THE ORIGINAL PREVIOUSLY ISSUED IN PORTUGUESE | ||
Quarterly Financial Information –June30, 2019 – CIA SIDERURGICA NACIONAL | Version: 1 | |
22. FINANCIAL INCOME (EXPENSES)
Consolidated |
Parent Company | |||||||
03/31/2020 | 03/31/2019 | 03/31/2020 | 03/31/2019 | |||||
Finance income |
|
|
|
|
|
|
|
|
Related parties (note 17 a) | 17,819 | 20,161 | 18,254 | 19,027 | ||||
Income from financial investments |
| 15,788 | 20,110 | 8,533 | 13,406 | |||
Other income (1) | 31,524 | 71,043 | 26,589 | 68,937 | ||||
|
| 65,131 | 111,314 | 53,376 | 101,370 | |||
Financial expenses | ||||||||
Borrowings and financing - foreign currency |
| (348,111) | (252,348) | (57,428) | (77,132) | |||
Borrowings and financing - local currency | (146,269) | (234,691) | (129,052) | (206,226) | ||||
Related parties |
| (97,782) | (71,100) | |||||
Lease liabilities | (12,100) | (891) | ||||||
Capitalised interest (notes 9 and 25) |
| 23,390 | 21,111 | 7,280 | 5,419 | |||
Interest, fines e late payment charges | (23,720) | (58,234) | (19,473) | (56,966) | ||||
Commission and bank fees |
| (30,298) | (44,183) | (27,332) | (42,034) | |||
PIS/COFINS over financial income | (6,233) | (5,366) | (3,431) | (5,342) | ||||
Updated shares – Fair value through profit or loss (Note 12II) |
| (962,354) | (962,354) | |||||
Other financial expenses | (125,456) | (59,138) | (45,101) | (34,654) | ||||
|
| (1,631,151) | (632,849) | (1,335,564) | (488,035) | |||
Foreign exchange and monetary variation, net | ||||||||
Monetary variation, net |
| (9,338) | (11,711) | (4,861) | (961) | |||
Exchange variation, net | 470,408 | (101,499) | 1,034,990 | (71,138) | ||||
Exchange variation on derivatives |
| (96,188) | (354) | (99,113) | ||||
364,882 | (113,564) | 931,016 | (72,099) | |||||
Finance income (costs), net |
| (1,201,138) | (635,099) | (351,172) | (458,764) | |||
(*) Statement of gains and (losses) on derivative transactions (note 12) |
| |||||||
Dollar - to - euro swap | 2,757 | (354) | ||||||
Great Britain pound-to-euro swap |
| 168 | ||||||
Swap CDI x Dollar | (99,113) | (99,113) | ||||||
|
| (96,188) | (354) | (99,113) | ||||
(1) Refers mainly to the monetary adjustment of the Social Security – INSS credit in the amount of R$16,321 and to the recognition of the exclusion of ICMS in the PIS and COFINS basis of calculation in the amount of R$9,866 as of March 31, 2020 (R$61,877 as of March 31, 2019).
(2) As of December 31, 2019, Usiminas’ shares were reclassified to financial investments in the current asset and their price changes are recognized as financial result.
23. SEGMENT INFORMATION
The segment information has not changed in relation to that disclosed in the Company's financial statements as of December 31, 2019. Therefore, management decided not to repeat it in this condensed interim financial information.
According to the Group´s structure, the businesses are distributed and managed in five operating segments as follows:
Page 78
CONVENIENCE TRANSLATION INTO ENGLISH FROM THE ORIGINAL PREVIOUSLY ISSUED IN PORTUGUESE | ||
Quarterly Financial Information –June30, 2019 – CIA SIDERURGICA NACIONAL | Version: 1 | |
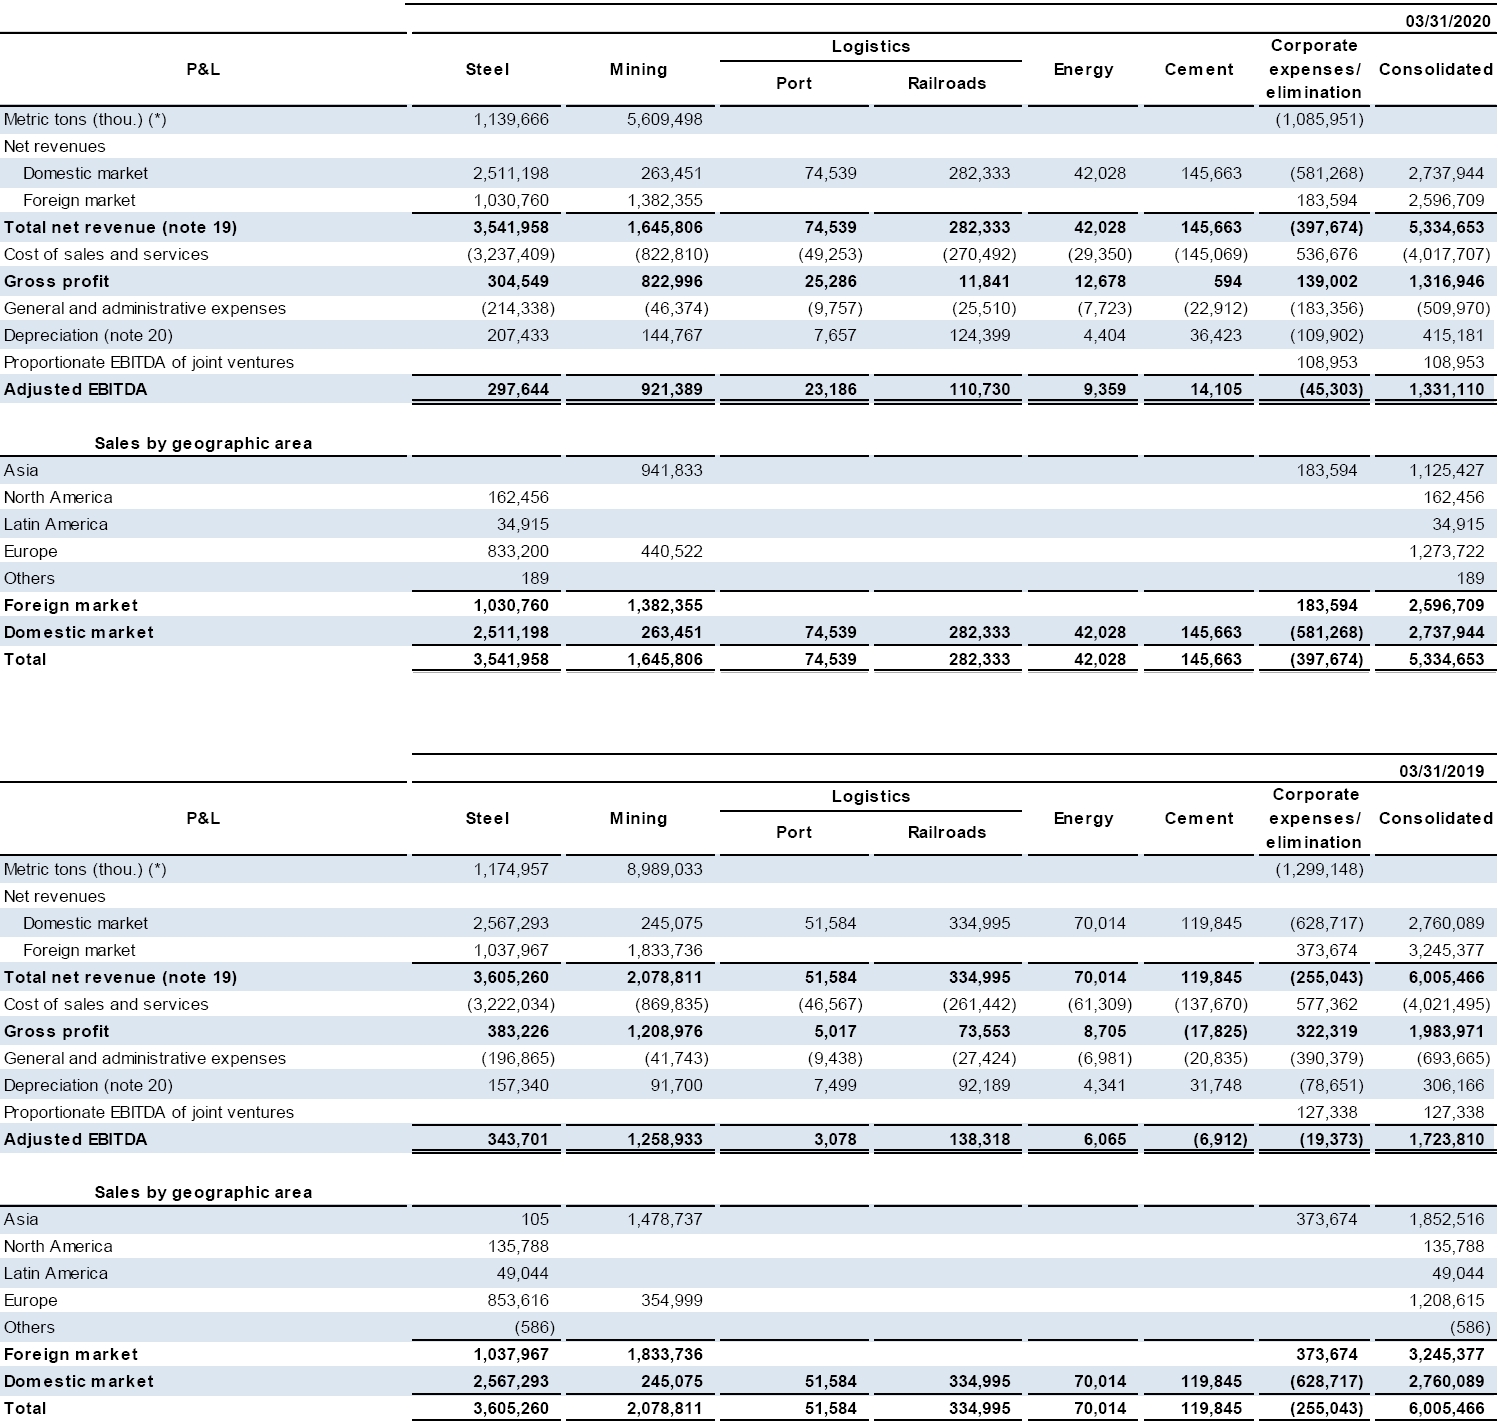
(*) The ore sales volumes presented in this note take into consideration Company sales and the interest in its subsidiaries and joint ventures.
· Adjusted EBITDA
Adjusted EBITDA is the principal measurement through which the chief operating decision maker assesses the segment performance and the capacity to generate recurring operating cash, consisting of profit for the year less net finance income (expenses), income tax and social contribution, depreciation and amortization, equity in results, results of discontinued operations and other operating income (expenses), plus the proportionate EBITDA of joint ventures.
As required by IFRS 8, the table below shows the reconciliation of the measurement used by the chief operating decision maker with the results determined using the accounting practices:
03/31/2020 |
| 03/31/2019 | ||
(Loss)/profit for the period |
| (1,311,709) |
| 86,763 |
Depreciation/Amortization/Depletion (note 20) | 415,181 | 306,166 | ||
Income tax and social contribution (note 14) |
| 206,204 |
| 458,857 |
Financial income (expenses) (note 22) | 1,201,138 | 635,099 | ||
EBITDA |
| 510,814 |
| 1,486,885 |
Other operating (income) expenses (note 21) | 666,235 | 135,420 | ||
Equity in results of affiliated companies (note 8) |
| 45,108 |
| (25,833) |
Proportionate EBITDA of joint ventures | 108,953 | 127,338 | ||
Adjusted EBITDA (*) |
| 1,331,110 |
| 1,723,810 |
(*) The Company discloses its adjusted EBITDA net of its share of investments and other operating income (expenses) because it understands that these should not be considered in the calculation of recurring operating cash generation.
Page 79
CONVENIENCE TRANSLATION INTO ENGLISH FROM THE ORIGINAL PREVIOUSLY ISSUED IN PORTUGUESE | ||
Quarterly Financial Information –June30, 2019 – CIA SIDERURGICA NACIONAL | Version: 1 | |
24. INSURANCE
Aiming to properly mitigate risk and in view of the nature of its operations, the Company and its subsidiaries have taken out several different types of insurance policies. Such policies are contracted in line with the Risk Management policy and are similar to the insurance taken out by other companies operating in the same lines of business as CSN and its subsidiaries. The risks covered under such policies include the following: Domestic Transportation, International Transportation, Life and Casualty, Health, Vehicles Fleet, D&O (Civil Liability Insurance for Directors and Officers), General Civil Liability, Engineering Risks, Named Peril, Export Credit, Surety Bond and Port Operator’s Civil Liability.
In 2019, after negotiation with insurers and reinsurers in Brazil and abroad, an insurance policy was issued of Operational Risk of Property Damages and Loss of Profits, with effect from March 31, 2019 to June 30, 2020. Under the insurance policy, the LMI (Maximum Limit of Indemnity) is US$600 million and deductibles in the amount of US$385million for material damages and 45 days for loss of profits and covers the following Company’s units and subsidiaries: Presidente Vargas Steelworks, CSN Mineração and Sepetiba Tecon.
The risk assumptions adopted, given their nature, are not within the scope of a review of interim financial information and, consequently, were not reviewed by our independent auditors.
25. ADDITIONAL INFORMATION TO CASH FLOWS
The following table provides additional information on transactions related to the statement of cash flows:
Consolidated | Parent Company | ||||||
03/31/2020 |
| 03/31/2019 | 03/31/2020 |
| 03/31/2019 | ||
Income tax and social contribution paid | 231,350 | 8,030 | |||||
Addition to PP&E with interest capitalization (notes 9 and 22) | 23,390 | 21,111 | 7,280 | 5,419 | |||
Initial adoption CPC 06 – Right of use | 640,989 | 61,072 | |||||
Remeasurement – Right of use (note 9.a) | 555 | 341 | |||||
Capitalization in subsidiaries without cash | 18,566 | ||||||
Addition to investment property without cash effect | 61,597 | 61,597 | |||||
| 316,892 | 670,130 | 87,784 | 66,491 |
Page 80
CONVENIENCE TRANSLATION INTO ENGLISH FROM THE ORIGINAL PREVIOUSLY ISSUED IN PORTUGUESE | ||
Quarterly Financial Information –June30, 2019 – CIA SIDERURGICA NACIONAL | Version: 1 | |
26. STATEMENT OF COMPREHENSIVE INCOME
|
| Consolidated |
|
| Parent Company | |||
03/31/2020 |
| 03/31/2019 | 03/31/2020 |
| 03/31/2019 | |||
(Loss) profit for the year |
| (1,311,709) |
| 86,763 |
| (1,360,851) |
| (7,572) |
Other comprehensive income | ||||||||
Items that will not be subsequently reclassified to the statement of income |
|
|
|
|
|
|
|
|
Actuarial of the defined benefit plan from investments in subsidiaries, net of taxes | 33 | 30 | 31 | 30 | ||||
|
| 33 |
| 30 |
| 31 |
| 30 |
Items that could be subsequently reclassified to the statement of income |
|
|
|
|
|
|
|
|
Cumulative translation adjustments for the period | 380,042 | (21,804) | 380,042 | (21,804) | ||||
(Loss)/gain on cash flow hedge accounting |
| (5,390,043) |
| (18,440) |
| (5,390,043) |
| (18,440) |
Realization on cash flow hedge accounting reclassified to income statements | 364,818 | 184,217 | 364,818 | 184,217 | ||||
(Loss)/gain on investments hedge in subsidiaries |
|
|
|
|
| 1,469 |
| 6,180 |
(Loss)/gain on net investment hedge in foreign subsidiaries | 1,469 | 6,180 |
|
| ||||
|
| (4,643,714) |
| 150,153 |
| (4,643,714) |
| 150,153 |
|
| (4,643,681) |
| 150,183 |
| (4,643,683) |
| 150,183 |
Total comprehensive income for the period | (5,955,390) | 236,946 | (6,004,534) | 142,611 | ||||
|
|
|
|
|
|
|
|
|
Attributable to: | ||||||||
Owners of the Company |
| (6,004,534) |
| 142,611 |
| (6,004,534) |
| 142,611 |
Non-controlling interests | 49,144 | 94,335 |
|
| ||||
|
| (5,955,390) |
| 236,946 |
| (6,004,534) |
| 142,611 |
27. SUBSEQUENT EVENTS
· Our Usiminas’ shares classified as financial investment in the current asset (see Note 4) are exposed to price volatility since they are recognized at the fair value through profit and loss and are quoted in the Brazilian Stock Exchange. On May 14, 2020, the common and preferred shares had price decreases in the amount of R$100,060 since the balance sheet date.
Page 81
CONVENIENCE TRANSLATION INTO ENGLISH FROM THE ORIGINAL PREVIOUSLY ISSUED IN PORTUGUESE | ||
Quarterly Financial Information –June30, 2019 – CIA SIDERURGICA NACIONAL | Version: 1 | |
COMMENTS ON THE PERFORMANCE OF BUSINESS PROJECTIONS
Projections
The Company clarifies that the information disclosed in this item represents a mere estimate, hypothetical data and cannot be interpreted as a promise of performance by the Company and/or its Management. The projections listed below include market variables that are not under the Company’s control and, therefore, may change.
a) Purpose of Projection
Update projections of iron ore production for 2020. The Company changed the method of presentation of iron ore production and, accordingly, as from the first quarter of 2020 adds iron ore purchased from third parties to its own production and expects to achieve around 33 to 36 million tons of iron ore produced in the period.
CSN estimates investments in the amount of R$1.1 billion.
b) Period and validity term of the projection.
CSN estimates annual volume of iron ore production from 2020 to 2023 and the annual volumes will be available to the market in the financial statements to be published in each of those years.
c) Assumptions of the projection, indicating which can be influenced by the issuer’s management and which are beyond its control.
All assumptions mentioned below are subject to the influence of external variables, which are beyond the control of the Company’s management. Therefore, in case of relevant changes in those assumptions, the Company may revise its estimates mentioned below, modifying them in comparison with those originally presented.
Volume of Iron Ore Production
The volume of ore production considers our mining plan between 2020 and 2023, with an increase in pellet feed production, in line with the investment projects announced through Material Fact and Corporate Presentation with the market.
d)Values of the indicators that are subject of the forecast.
Net Revenue | 2016 | 2017 | 2018 | 1S19 | 2019 | 2020 E | 2021 E | 2022 E | 2023 E |
Estimate | n.a. | 18,000 | 22,230 | n.a. | n.a. | n.a. | n.a. | n.a. | n.a. |
Actual | 17,149 | 18,525 | 22,969 | n.a. | n.a. | n.a. | n.a. | n.a. | n.a. |
Variation % | - | 3% | 3% | - | - | - | - | - | - |
Adjusted EBITDA | 2016 | 2017 | 2018 | 1S19 | 2019 | 2020 E | 2021 E | 2022 E | 2023 E |
Estimate | n.a. | 5,000 | 5,574 | n.a. | 7,500 | n.a. | n.a. | n.a. | n.a. |
Actual | 4,075 | 4,645 | 5,849 | n.a. | 7,251 | n.a. | n.a. | n.a. | n.a. |
Variation % | - | -7% | 5% | n.a. | -3% | n.a. | n.a. | n.a. | n.a. |
Leverage | 2016 | 2017 | 2018 | 1S19 | 2019 | 2020 E | 2021 E | 2022 E | 2023 E |
Estimate | n.a. | 5.00x | n.a. | 3.50x | 3.00x | n.a. | n.a. | n.a. | n.a. |
Actual | 6.32x | 5.66x | 4.55x | 3.65x | 3.74x | n.a. | n.a. | n.a. | n.a. |
Variation | n.a. | 0.66x | n.a. | 0.15x | 0.74x | n.a. | n.a. | n.a. | n.a. |
Iron ore production volume | 2016 | 2017 | 2018 | 1S19 | 2019 | 2020 E | 2021 E | 2022 E | 2023 E |
Estimate | n.a. | n.a. | 28,500 | n.a. | 33,000 | 25,000-28,000 | 31,200 | 36,600 | 38,000 |
Actual | 32,174 | 29,921 | 27,875 | n.a. | 32,090 | n.a. | n.a. | n.a. | n.a. |
Variation % | n.a. | n.a. | -2% | n.a. | -3% | n.a. | n.a. | n.a. | n.a. |
CAPEX | 2016 | 2017 | 2018 | 1S19 | 2019 | 2020 E | 2021 E | 2022 E | 2023 E |
Estimate | n.a. | n.a. | n.a. | n.a. | n.a. | 1.100 | n.a. | n.a. | n.a. |
Iron ore sales volume | 2016 | 2017 | 2018 | 1S19 | 2019 | 2020 E | 2021 E | 2022 E | 2023 E |
Estimate | n.a. | n.a. | n.a. | n.a. | 40,000 | n.a. | n.a. | n.a. | n.a. |
Actual | n.a. | n.a. | n.a. | n.a. | 38,545 | n.a. | n.a. | n.a. | n.a. |
Variation % | n.a. | n.a. | n.a. | n.a. | -4% | n.a. | n.a. | n.a. | n.a. |
Iron ore production volume New Method (Purchases+Production) | 2016 | 2017 | 2018 | 1S19 | 2019 | 2020 E | 2021 E | 2022 E | 2023 E |
Estimate | n.a. | n.a. | n.a. | n.a. | n.a. | 33,000-36,000 | n.a. | n.a. | n.a. |
Actual | n.a. | n.a. | n.a. | n.a. | n.a. | n.a. | n.a. | n.a. | n.a. |
Variation % | n.a. | n.a. | n.a. | n.a. | n.a. | n.a. | n.a. | n.a. | n.a. |
*E = estimate |
|
|
|
|
|
|
|
|
|
**n.a. = not measured |
|
|
|
|
|
|
| ||
Page 82
CONVENIENCE TRANSLATION INTO ENGLISH FROM THE ORIGINAL PREVIOUSLY ISSUED IN PORTUGUESE | ||
Quarterly Financial Information –June30, 2019 – CIA SIDERURGICA NACIONAL | Version: 1 | |
If the issuer has disclosed, in the last 3 fiscal years, projections over the progress of its indicators:
a) Inform which were being replaced by new projections and which were being repeated.
New estimates:
We estimate our capital expenditures in R$1.1 billion.
Estimates changed:
We adjusted the estimated iron ore production volume in 2020 to 33-36Mton (new method).
Estimates maintained:
CSN estimates iron ore production volume at 31.2Mton in 2021, 36.6Mton in 2022 and 38Mton in 2023.
b) In relation to the projections for periods that have already occured, compare the projection data with the performance indicators, clearly indicating the reasons that led to deviations in the projections.
The adjusted EBITDA in 2019 was 3% lower than the projected R$7.5 billion, impacted by the lower results of the mining segment as a result of lower Platts than budgeted and, also, freight costs higher than projected.
CSN estimated leverage as measured by net debt to adjusted EBITDA close to 3.5x at the end of the year 2019, when we reached 3.74x, materially worse than our initial estimates mainly due to foreign exchange effects that negatively influenced our U.S. dollar denominated debt, Capex above expectations and worse mining results due to higher freight costs and lower Platts as from the third quarter.
The iron ore production was 3% under the projection of 33Mton due to heavy rains on the Southeast in November and December 2019.
The iron ore sales were 4% lower than projected 40Mton due to lower ore production in the fourth quarter of 2019.
Net Revenue | 2016 | 2017 | 2018 | 1S2019 | 2019 |
Estimate | n.a. | 18,000 | 22,230 | n.a. | n.a. |
Actual | 17,149 | 18,525 | 22,969 | n.a. | n.a. |
Variation % | n.a. | 3% | 3% | n.a. | - |
Adjusted EBITDA | 2016 | 2017 | 2018 | 1S2019 | 2019 |
Estimate | n.a. | 5,000 | 5,574 | n.a. | 7,500 |
Actual | 4,075 | 4,645 | 5,849 | n.a. | 7,251 |
Variation % | n.a. | -7% | 5% | n.a. | -3% |
Leverage | 2016 | 2017 | 2018 | 1S2019 | 2019 |
Estimate | n.a. | 5.00x | n.a. | 3.50x | 3.00x |
Actual | 6.32x | 5.66x | 4.55x | 3.65x | 3.74x |
Variation % | n.a. | 13% | n.a. | 0.15x | 0.74x |
Iron Ore Production Volume | 2016 | 2017 | 2018 | 1S2019 | 2019 |
Estimate | n.a. | n.a. | 28,500 | n.a. | 33,000 |
Actual | 32,174 | 29,921 | 27,875 | n.a. | 32,090 |
Variation % | n.a. | n.a. | -2% | n.a. | -3% |
Iron Ore Sales Volume | 2016 | 2017 | 2018 | 1S19 | 2019 |
Estimate | n.a. | n.a. | n.a. | n.a. | 40,000 |
Actual | n.a. | n.a. | n.a. | n.a. | 38,545 |
Variation % | n.a. | n.a. | n.a. | n.a. | -4% |
*E = estimate |
|
|
|
|
|
**n.a. = not measured |
|
|
| ||
Page 83
CONVENIENCE TRANSLATION INTO ENGLISH FROM THE ORIGINAL PREVIOUSLY ISSUED IN PORTUGUESE | ||
Quarterly Financial Information –June30, 2019 – CIA SIDERURGICA NACIONAL | Version: 1 | |
c) In relation to the projections for periods still in progress, inform if the projections remain valid on the date of delivery the form and, when applicable, explain why they were abandoned or replaced.
Ongoing and valid estimates:
CSN estimates iron ore production volume at 33-36 million tons (Mton) in 2020.
CSN estimates iron ore production volume at 31.2million tons (Mton) in 2021, 36.6 Mton in 2022 and 38.0 Mton in 2023. The expected decrease in production volume in 2020 is due to high rainfall in Q1-2020 and delays to start new mining fronts.
Follow-up and changes to projections disclosed
The result of the first quarter of 2020 does not bring any material variation to the projections of results previously presented, which can therefore be maintained.
Page 84
CONVENIENCE TRANSLATION INTO ENGLISH FROM THE ORIGINAL PREVIOUSLY ISSUED IN PORTUGUESE | ||
Quarterly Financial Information –June30, 2019 – CIA SIDERURGICA NACIONAL | Version: 1 | |
(Free translation from the original issued in Portuguese. In the event of any discrepancies, the Portuguese language version shall prevail.)
Independent Limited Review Auditor’s Report on Review of the Interim Financial Information
To the
Shareholders, Directors and Management of
Companhia Siderúrgica Nacional
São Paulo – SP
Introduction
We have reviewed the accompanying individual and consolidated interim financial information of Companhia Siderúrgica Nacional (“Company”), identified as Parent and Consolidated, respectively, included in the Interim Financial Information Form (ITR) for the quarter ended March 31, 2020, which comprises the balance sheet as of March 31, 2020 and the related statement of profit and loss and statement of comprehensive income (loss) and thestatement of changes in equity and statement of cash flows for the three-month period then ended, including a summary of significant accounting policies and other explanatory notes.
Management is responsible for the preparation of the individual and consolidated interim financial information in accordance with Technical Pronouncement CPC 21 (R1) - Interim Financial Reporting and IAS 34 - Interim Financial Reporting, issued by the International Accounting Standards Board (IASB), as well as for the presentation of such information in accordance with the standards issued by the Brazilian Securities and Exchange Commission (CVM) applicable to the preparation of Interim Financial Information (ITR). Our responsibility is to express a conclusion on this interim financial information based on our review.
Scope of review
We conducted our review in accordance with Brazilian and international standards on review of interim financial information (NBC TR 2410 - Review of Interim Financial Information Performed by the Independent Auditor of the Entity and ISRE 2410 - Review of Interim Financial Information Performed by the Independent Auditor of the Entity, respectively). A review of interim financial information consists of making inquiries, primarily of persons responsible for financial and accounting matters, and applying analytical and other review procedures. A review is substantially less in scope than an audit conducted in accordance with the standards on auditing and consequently does not enable us to obtain assurance that we would become aware of all significant matters that might be identified in an audit. Accordingly, we do not express an audit opinion.
Conclusion on the individual and consolidated interim financial information
Based on our review, nothing has come to our attention that causes us to believe that the accompanying individual and consolidated interim financial information included in the Interim Financial Information Form (ITR) referred to above is not prepared, in all material respects, in accordance with CPC 21 (R1) and IAS 34 applicable to the preparation of interim financial information and presented in accordance with the standards issued by the Brazilian Securities and Exchange Commission (CVM).
Emphasis of matter
Ability of the jointly-controlled subsidiary Transnordestina Logística S.A. to continue as a going concern
We draw attention to note 8.c) to the interim financial information, which describes the percentage of completion of the new railway network by the jointly-controlled subsidiary Transnordestina Logística S.A. (TLSA), currently under construction and originally scheduled to be completed by January 2017, is currently being revised and discussed by the relevant regulatory bodies. The completion of the work under the project (and consequent start of operations) is contingent upon receiving ongoing financial contribution from TLSA´s shareholders and third parties. These events and conditions, together with other issues described in note 8.c) to the interim financial information, indicate the existence of significant uncertainty that may raise significant doubt as to TLSA´s ability to continue as a going concern. Our conclusion is not qualified regarding this matter.
Other matters
Interim statement of value added
The quarterly information referred to above includes the individual and consolidated statements of value added for the period of three months ended March 31, 2020, prepared under the responsibility of the Company's management and presented as supplementary information for the purposes of IAS 34.
These statements were submitted to the same review procedures in conjunction with the review of the Company's interim financial information in the order to conclude they are reconciliated to the interim financial information and to the accounting records, as applicable, and whether the structure and content are in accordance with the criteria established in the CPC 09 - Statement of Value Added. Based on our review, nothing has come to our attention that causes us to believe that the accompanying statements of value added were not prepared, in all material respects, in accordance with the individual and consolidated interim financial information taken as a whole.
Page 85
CONVENIENCE TRANSLATION INTO ENGLISH FROM THE ORIGINAL PREVIOUSLY ISSUED IN PORTUGUESE | ||
Quarterly Financial Information –June30, 2019 – CIA SIDERURGICA NACIONAL | Version: 1 | |
São Paulo, May 14, 2020
Nelson Fernandes Barreto Filho
CT CRC 1SP-151.079/O-0
Grant Thornton Auditores Independentes
CRC 2SP-025.583/O-1
Page 86
CONVENIENCE TRANSLATION INTO ENGLISH FROM THE ORIGINAL PREVIOUSLY ISSUED IN PORTUGUESE | ||
Quarterly Financial Information –June30, 2019 – CIA SIDERURGICA NACIONAL | Version: 1 | |
Opinions and Statements / Officers Statement on the Financial Statement
As Executive Officers of Companhia Siderúrgica Nacional, we declare pursuant to Article 25, paragraph 1º, item VI of CVM Instruction 480, of December 7, 2009, as amended, that we reviewed, discussed and agreed with the Company’s Financial Statements for the quarter ended March 31, 2020.
São Paulo, May14th, 2020.
____________________________________________
Benjamin Steinbruch
CEO
____________________________________________
Luis Fernando Barbosa Martinez
Executive Officer
____________________________________________
David Moise Salama
Executive Officer
____________________________________________
Pedro Gutemberg Quariguasi Netto
Executive Officer
____________________________________________
Marcelo Cunha Ribeiro
Executive Officer – CFO and Investors Relations
Page 87
CONVENIENCE TRANSLATION INTO ENGLISH FROM THE ORIGINAL PREVIOUSLY ISSUED IN PORTUGUESE | ||
Quarterly Financial Information –June30, 2019 – CIA SIDERURGICA NACIONAL | Version: 1 | |
Opinions and Statements / Officers Statement on Auditor’s Report
As Executive Officers of Companhia Siderúrgica Nacional, we declare pursuant to Article 25, paragraph 1º, item V of CVM Instruction 480, of December 7, 2009, as amended, that we reviewed, discussed and agreed with the opinion expressed on the Independent Auditors’ Report related to the Company’s Financial Statements for the quarter ended March 31, 2020.
São Paulo, May14th, 2020.
____________________________________________
Benjamin Steinbruch
CEO
____________________________________________
Luis Fernando Barbosa Martinez
Executive Officer
____________________________________________
David Moise Salama
Executive Officer
____________________________________________
Pedro Gutemberg Quariguasi Netto
Executive Officer
____________________________________________
Marcelo Cunha Ribeiro
Executive Officer – CFO and Investors Relations
Page 88
SIGNATURE
Pursuant to the requirements of the Securities Exchange Act of 1934, the registrant has duly caused this report to be signed on its behalf by the undersigned, thereunto duly authorized.
Date: June 12, 2020
| COMPANHIA SIDERÚRGICA NACIONAL | |
| By: | /S/ Benjamin Steinbruch |
Benjamin Steinbruch Chief Executive Officer | |
| By: | /S/ Marcelo Cunha Ribeiro |
Marcelo Cunha Ribeiro Chief Financial and Investor Relations Officer | |
FORWARD-LOOKING STATEMENTS
This press release may contain forward-looking statements. These statements are statements that are not historical facts, and are based on management's current view and estimates of future economic circumstances, industry conditions, company performance and financial results. The words "anticipates", "believes", "estimates", "expects", "plans" and similar expressions, as they relate to the company, are intended to identify forward-looking statements. Statements regarding the declaration or payment of dividends, the implementation of principal operating and financing strategies and capital expenditure plans, the direction of future operations and the factors or trends affecting financial condition, liquidity or results of operations are examples of forward-looking statements. Such statements reflect the current views of management and are subject to a number of risks and uncertainties. There is no guarantee that the expected events, trends or results will actually occur. The statements are based on many assumptions and factors, including general economic and market conditions, industry conditions, and operating factors. Any changes in such assumptions or factors could cause actual results to differ materially from current expectations.