SECURITIES AND EXCHANGE COMMISSION
Washington, D.C. 20549
FORM 6-K
Report of Foreign Private Issuer
Pursuant to Rule 13a-16 or 15d-16 of the
Pursuant to Rule 13a-16 or 15d-16 of the
Securities Exchange Act of 1934
For the month of May, 2021
Commission File Number 1-14732COMPANHIA SIDERÚRGICA NACIONAL
(Exact name of registrant as specified in its charter)
National Steel Company
(Translation of Registrant's name into English)
Av. Brigadeiro Faria Lima 3400, 20º andar
São Paulo, SP, Brazil
04538-132
São Paulo, SP, Brazil
04538-132
(Address of principal executive office)
Indicate by check mark whether the registrant files or will file annual reports
under cover Form 20-F or Form 40-F. Form 20-F ___X___ Form 40-F _______
under cover Form 20-F or Form 40-F. Form 20-F ___X___ Form 40-F _______
Indicate by check mark whether the registrant by furnishing the information contained in this Form is also thereby furnishing the information to the Commission pursuant to Rule 12g3-2(b) under the Securities Exchange Act of 1934.
Yes _______ No ___X____| (CONVENIENCE TRANSLATION INTO ENGLISH FROM THE ORIGINAL PREVIOUSLY ISSUED IN PORTUGUESE) | ||
| Quarterly Financial Information - March 31, 2021 – CIA SIDERURGICA NACIONAL | Version: 1 | |
Table of Contents
| Company Information | |
| Capital Breakdown | 1 |
| Parent Company Financial Statements | |
| Balance Sheet – Assets | 2 |
| Balance Sheet – Liabilities | 3 |
| Statement of Income | 4 |
| Statement of Comprehensive Income | 5 |
| Statement of Cash Flows | 6 |
| Statement of Changes in Shareholders’ Equity | |
| 01/01/2021 to 03/31/2021 | 8 |
| 01/01/2020 to 03/31/2020 | 9 |
| Statement of Value Added | 10 |
| Consolidated Financial Statements | |
| Balance Sheet – Assets | 11 |
| Balance Sheet - Liabilities | 12 |
| Statement of Income | 14 |
| Statement of Comprehensive Income | 15 |
| Statement of Cash Flows | 16 |
| Statement of Changes in Shareholders’ Equity | |
| 01/01/2021 to 03/31/2021 | 18 |
| 01/01/2020 to 03/31/2020 | 19 |
| Statement of Value Added | 20 |
| Comments on the Company’s Consolidated Performance | |
| Notes to the quarterly financial information | 21 |
| Comments on the Performance of Business Projections | |
| Reports and Statements | |
| Unqualified Independent Auditors’ Review Report | 68 |
| (CONVENIENCE TRANSLATION INTO ENGLISH FROM THE ORIGINAL PREVIOUSLY ISSUED IN PORTUGUESE) | ||
| Quarterly Financial Information - March 31, 2021 – CIA SIDERURGICA NACIONAL | Version: 1 | |
Company Information / Capital Breakdown
Number of Shares (Units) | Current quarter 03/31/2021 | |
| Paid-in Capital | ||
| Common | 1,387,524,047 | |
| Preferred | 0 | |
| Total | 1,387,524,047 | |
| Treasury Shares | ||
| Common | 7,409,500 | |
| Preferred | 0 | |
| Total | 7,409,500 |
| 1 |
| (CONVENIENCE TRANSLATION INTO ENGLISH FROM THE ORIGINAL PREVIOUSLY ISSUED IN PORTUGUESE) | ||
| Quarterly Financial Information - March 31, 2021 – CIA SIDERURGICA NACIONAL | Version: 1 | |
| Parent Company Financial Statements / Balance Sheet - Assets | |||
| (R$ thousand) | |||
| Code | Description | Current Quarter 03/31/2021 | Previous Year 12/31/2020 |
| 1 | Total Assets | 55,794,836 | 53,196,550 |
| 1.01 | Current assets | 15,965,807 | 14,879,594 |
| 1.01.01 | Cash and cash equivalents | 5,126,462 | 4,647,125 |
| 1.01.02 | Financial investments | 4,279,964 | 3,780,891 |
| 1.01.02.01 | Financial investments measured a fair value through profit or loss | 3,817,603 | 3,305,109 |
| 1.01.02.01.03 | Financial investments measured a fair value through profit or loss – Usiminas’ shares | 3,817,603 | 3,305,109 |
| 1.01.02.03 | Financial investments at amortized cost | 462,361 | 475,782 |
| 1.01.03 | Trade receivables | 1,699,363 | 1,549,703 |
| 1.01.04 | Inventory | 3,625,618 | 3,014,446 |
| 1.01.06 | Recoverable taxes | 959,735 | 1,381,853 |
| 1.01.08 | Other current assets | 274,665 | 505,576 |
| 1.01.08.03 | Others | 274,665 | 505,576 |
| 1.01.08.03.02 | Prepaid expenses | 116,588 | 94,782 |
| 1.01.08.03.03 | Dividends receivable | 28,156 | 329,413 |
| 1.01.08.03.04 | Others | 129,921 | 81,381 |
| 1.02 | Non-current assets | 39,829,029 | 38,316,956 |
| 1.02.01 | Long-term assets | 8,536,877 | 8,406,417 |
| 1.02.01.03 | Financial investments at amortized cost | 132,635 | 123,409 |
| 1.02.01.07 | Deferred taxes assets | 3,785,791 | 3,799,707 |
| 1.02.01.10 | Other non-current assets | 4,618,451 | 4,483,301 |
| 1.02.01.10.03 | Recoverable taxes | 762,776 | 738,431 |
| 1.02.01.10.04 | Judicial deposits | 224,675 | 221,016 |
| 1.02.01.10.05 | Prepaid expenses | 91,568 | 99,834 |
| 1.02.01.10.06 | Receivable from related parties | 2,019,900 | 1,907,877 |
| 1.02.01.10.07 | Others | 1,519,532 | 1,516,143 |
| 1.02.02 | Investments | 24,080,191 | 19,546,493 |
| 1.02.02.01 | Equity interest | 23,935,793 | 19,401,494 |
| 1.02.02.02 | Investment Property | 144,398 | 144,999 |
| 1.02.03 | Property, plant and equipment | 7,173,674 | 10,315,724 |
| 1.02.03.01 | Property, plant and equipment in operation | 6,210,917 | 8,598,597 |
| 1.02.03.02 | Right of use in leases | 21,769 | 64,659 |
| 1.02.03.03 | Property, plant and equipment in progress | 940,988 | 1,652,468 |
| 1.02.04 | Intangible assets | 38,287 | 48,322 |
| 2 |
| (CONVENIENCE TRANSLATION INTO ENGLISH FROM THE ORIGINAL PREVIOUSLY ISSUED IN PORTUGUESE) | ||
| Quarterly Financial Information - March 31, 2021 – CIA SIDERURGICA NACIONAL | Version: 1 | |
| Parent Company Financial Statements / Balance Sheet – Liabilities | |||
| (R$ thousand) | |||
| Code | Description | Current Quarter 03/31/2021 | Previous Year 12/31/2020 |
| 2 | Total Liabilities | 55,794,836 | 53,196,550 |
| 2.01 | Current liabilities | 11,488,593 | 10,756,084 |
| 2.01.01 | Payroll and related taxes | 135,204 | 138,761 |
| 2.01.02 | Trade payables | 4,167,535 | 4,133,089 |
| 2.01.03 | Tax payables | 339,343 | 289,095 |
| 2.01.04 | Borrowings and financing | 3,547,956 | 3,858,493 |
| 2.01.05 | Other payables | 3,256,079 | 2,302,188 |
| 2.01.05.02 | Others | 3,256,079 | 2,302,188 |
| 2.01.05.02.04 | Dividends and interests on shareholder´s equity | 901,982 | 901,983 |
| 2.01.05.02.05 | Advances from clients | 169,877 | 196,595 |
| 2.01.05.02.06 | Trade payables – Forfaiting and Drawee risk | 1,469,209 | 623,861 |
| 2.01.05.02.07 | Lease liabilities | 7,829 | 26,546 |
| 2.01.05.02.08 | Other payables | 707,182 | 553,203 |
| 2.01.06 | Provisions | 42,476 | 34,458 |
| 2.01.06.01 | Provision for tax, social security, labor and civil risks | 42,476 | 34,458 |
| 2.02 | Non-current liabilities | 29,918,755 | 32,527,015 |
| 2.02.01 | Borrowings and financing | 21,320,194 | 24,423,753 |
| 2.02.02 | Other payables | 513,345 | 771,292 |
| 2.02.02.02 | Others | 513,345 | 771,292 |
| 2.02.02.02.03 | Lease liabilities | 15,771 | 40,561 |
| 2.02.02.02.04 | Derivative financial instruments | 119,306 | 97,535 |
| 2.02.02.02.05 | Trade payables | 145,301 | 376,753 |
| 2.02.02.02.06 | Other payables | 232,967 | 256,443 |
| 2.02.04 | Provisions | 8,085,216 | 7,331,970 |
| 2.02.04.01 | Provision for tax, social security, labor and civil risks | 359,211 | 401,157 |
| 2.02.04.02 | Other provisions | 7,726,005 | 6,930,813 |
| 2.02.04.02.03 | Provision for environmental liabilities and decommissioning of assets | 181,260 | 229,524 |
| 2.02.04.02.04 | Pension and healthcare plan | 758,426 | 758,426 |
| 2.02.04.02.05 | Provision for losses on investments | 6,786,319 | 5,942,863 |
| 2.03 | Shareholders’ equity | 14,387,488 | 9,913,451 |
| 2.03.01 | Paid-up capital | 6,040,000 | 6,040,000 |
| 2.03.02 | Capital reserves | 32,720 | 32,720 |
| 2.03.04 | Earnings reserves | 5,824,350 | 5,824,350 |
| 2.03.04.01 | Legal reserve | 468,291 | 468,291 |
| 2.03.04.02 | Statutory reserve | 5,414,323 | 5,414,323 |
| 2.03.04.09 | Treasury shares | (58,264) | (58,264) |
| 2.03.05 | Accumulated earnings (losses) | 5,240,015 | - |
| 2.03.08 | Other comprehensive income | (2,749,597) | (1,983,619) |
| 3 |
| (CONVENIENCE TRANSLATION INTO ENGLISH FROM THE ORIGINAL PREVIOUSLY ISSUED IN PORTUGUESE) | ||
| Quarterly Financial Information - March 31, 2021 – CIA SIDERURGICA NACIONAL | Version: 1 | |
| Parent Company Financial Statements / Statement of Income | |||
| (R$ thousand) | |||
| Code | Description | Year to date 01/01/2021 to 03/31/2021 | YTD previous year 01/01/2020 to 03/31/2020 |
| 3.01 | Revenues from sale of goods and rendering of services | 5,373,279 | 3,031,309 |
| 3.02 | Costs from sale of goods and rendering of services | (3,689,909) | (2,778,380) |
| 3.03 | Gross profit | 1,683,370 | 252,929 |
| 3.04 | Operating (expenses)/income | 3,302,930 | (1,262,912) |
| 3.04.01 | Selling expenses | (167,212) | (162,239) |
| 3.04.02 | General and administrative expenses | (57,691) | (50,192) |
| 3.04.04 | Other operating income | 2,531,577 | 74,847 |
| 3.04.05 | Other operating expenses | (393,647) | (534,638) |
| 3.04.06 | Equity in results of affiliated companies | 1,389,903 | (590,690) |
| 3.05 | Income before financial income (expenses) and taxes | 4,986,300 | (1,009,983) |
| 3.06 | Financial income (expenses) | 409,488 | (351,172) |
| 3.06.01 | Financial income | 579,338 | 53,376 |
| 3.06.02 | Financial expenses | (169,850) | (404,548) |
| 3.06.02.01 | Net exchange differences over financial instruments | 172,004 | 931,016 |
| 3.06.02.02 | Financial expenses | (341,854) | (1,335,564) |
| 3.07 | Income before income taxes | 5,395,788 | (1,361,155) |
| 3.08 | Income tax and social contribution | (155,773) | 304 |
| 3.09 | Net income from continued operations | 5,240,015 | (1,360,851) |
| 3.11 | Net income for the year | 5,240,015 | (1,360,851) |
| 3.99 | Earnings per share – (Reais / Share) | - | - |
| 3.99.01 | Basic earnings per share | - | - |
| 3.99.01.01 | Common shares | 3.7968 | - 0.9860 |
| 3.99.02 | Diluted earnings per share | - | - |
| 3.99.02.01 | Common shares | 3.7968 | - 0.9860 |
| 4 |
| (CONVENIENCE TRANSLATION INTO ENGLISH FROM THE ORIGINAL PREVIOUSLY ISSUED IN PORTUGUESE) | ||
| Quarterly Financial Information - March 31, 2021 – CIA SIDERURGICA NACIONAL | Version: 1 | |
| Parent Company Financial Statements / Statement of Comprehensive Income | |||||
| (R$ thousand) | |||||
| Code | Description | Year to date 01/01/2021 to 03/31/2021 | YTD previous year 01/01/2020 to 03/31/2020 | ||
| 4.01 | Net income for the year | 5,240,015 | (1,360,851) | ||
| 4.02 | Other comprehensive income | (765,978) | (4,643,683) | ||
| 4.02.01 | Actuarial gains/(losses) over pension plan of subsidiaries, net of taxes | 20 | 31 | ||
| 4.02.02 | Cumulative translation adjustments for the year | 86,119 | 380,042 | ||
| 4.02.03 | (Loss)/gain on the percentage change in investments | 814,285 | - | ||
| 4.02.04 | Losses in cash flow hedge | (1,919,129) | (5,390,043) | ||
| 4.02.05 | Cash flow hedge reclassified to income upon realization | 252,250 | 364,818 | ||
| 4.02.06 | (Loss)/gain cash flow hedge accounting – “Platts”, net taxes, from investments in subsidiaries | 477 | - | ||
| 4.02.07 | (Loss)/ gain in cash flow hedge from investments in subsidiaries | - | 1,469 | ||
| 4.03 | Comprehensive income for the year | 4,474,037 | (6,004,534) | ||
| 5 |
| (CONVENIENCE TRANSLATION INTO ENGLISH FROM THE ORIGINAL PREVIOUSLY ISSUED IN PORTUGUESE) | ||
| Quarterly Financial Information - March 31, 2021 – CIA SIDERURGICA NACIONAL | Version: 1 | |
| Parent Company Financial Statements / Statements of Cash Flows – Indirect Method | |||
| (R$ thousand) | |||
| Code | Description | Year to date 01/01/2021 to 03/31/2021 | YTD previous year 01/01/2020 to 03/31/2020 |
| 6.01 | Net cash from operating activities | 2,702,452 | (43,913) |
| 6.01.01 | Cash from operations | 1,289,494 | 145,068 |
| 6.01.01.01 | Net income for the year | 5,240,015 | (1,360,851) |
| 6.01.01.02 | Financial charges in borrowing and financing raised | 190,877 | 276,982 |
| 6.01.01.03 | Financial charges in borrowing and financing granted | (7,780) | (16,540) |
| 6.01.01.04 | Charges on lease liabilities | 540 | 956 |
| 6.01.01.05 | Equity in results of affiliated companies | (1,389,903) | 590,690 |
| 6.01.01.06 | Deferred taxes assets | 13,916 | (304) |
| 6.01.01.07 | Provision for tax, social security, labor, civil and environmental risks | (33,928) | (10,090) |
| 6.01.01.08 | Monetary and exchange variations, net | 19,420 | (547,893) |
| 6.01.01.09 | Write-off of property, plant and equipment right of use and Intangible assets | 1,680 | - |
| 6.01.01.10 | Provision for environmental liabilities and decommissioning of assets | 19,094 | 11,411 |
| 6.01.01.11 | Updated shares – Fair value through profit or loss | (543,498) | 962,561 |
| 6.01.01.12 | Depreciation, amortization and depletion | 201,989 | 209,495 |
| 6.01.01.13 | Accrued/(reversal) for consumption and services | 25,072 | 21,527 |
| 6.01.01.14 | Net gains on the sale of the shares of the CSN Mineração. | (2,472,497) | - |
| 6.01.01.15 | Receivables by indemnity | (4,428) | - |
| 6.01.01.16 | Other provisions | 28,925 | 7,124 |
| 6.01.02 | Changes in assets and liabilities | 1,412,958 | (188,981) |
| 6.01.02.01 | Trade receivables - third parties | (465,880) | (19,768) |
| 6.01.02.02 | Trade receivables - related parties | 212,549 | (394,990) |
| 6.01.02.03 | Inventory | (775,575) | 266,412 |
| 6.01.02.04 | Receivables - related parties/dividends | 1,234,790 | 814 |
| 6.01.02.05 | Tax assets | 369,455 | 82,873 |
| 6.01.02.06 | Judicial deposits | (9,643) | 902 |
| 6.01.02.09 | Trade payables | 38,566 | 326,875 |
| 6.01.02.10 | Trade payables – Forfaiting and Drawee risk | 845,348 | (183,736) |
| 6.01.02.11 | Payroll and related taxes | 5,896 | (14,616) |
| 6.01.02.12 | Tax payables | 53,558 | 5,679 |
| 6.01.02.13 | Payables to related parties | 21,590 | 113,756 |
| 6.01.02.14 | Advance with related parties | - | (20,289) |
| 6.01.02.15 | Interest paid | (208,835) | (268,170) |
| 6.01.02.16 | Interest received | - | 198 |
| 6.01.02.19 | Others | 91,139 | (84,921) |
| 6 |
| (CONVENIENCE TRANSLATION INTO ENGLISH FROM THE ORIGINAL PREVIOUSLY ISSUED IN PORTUGUESE) | ||
| Quarterly Financial Information - March 31, 2021 – CIA SIDERURGICA NACIONAL | Version: 1 | |
| 6.02 | Net cash investment activities | 2,863,731 | (297,419) |
| 6.02.01 | Investments / AFAC / Acquisitions of Shares | (32,550) | (2,180) |
| 6.02.02 | Purchase of property, plant and equipment, intangible assets and investment property | (195,882) | (196,628) |
| 6.02.05 | Intercompany loans granted | (88,158) | (98,614) |
| 6.02.06 | Intercompany loans received | - | 4,076 |
| 6.02.08 | Financial Investments, net of redemption | 15,709 | (4,073) |
| 6.02.09 | Net cash received from sale of CSN Mineração's shares | 3,164,612 | - |
| 6.03 | Net cash used in financing activities | (5,086,846) | 1,375,211 |
| 6.03.01 | Borrowings and financing raised | 40,903 | 80,744 |
| 6.03.02 | Transactions cost - Borrowings and financing | (11,423) | (1,980) |
| 6.03.03 | Borrowings and financing – related parties | 1,394,275 | 2,205,145 |
| 6.03.04 | Amortization of borrowings and financing | (3,226,111) | (889,247) |
| 6.03.05 | Amortization of borrowings and financing - related parties | (3,282,109) | (13,053) |
| 6.03.06 | Amortization of leases | (2,381) | (6,262) |
| 6.03.07 | Dividends and interest on shareholder’s equity | - | (136) |
| 6.05 | Increase (decrease) in cash and cash equivalents | 479,337 | 1,033,879 |
| 6.05.01 | Cash and equivalents at the beginning of the year | 4,647,125 | 392,107 |
| 6.05.02 | Cash and equivalents at the end of the year | 5,126,462 | 1,425,986 |
| 7 |
| (CONVENIENCE TRANSLATION INTO ENGLISH FROM THE ORIGINAL PREVIOUSLY ISSUED IN PORTUGUESE) | ||
| Quarterly Financial Information - March 31, 2021 – CIA SIDERURGICA NACIONAL | Version: 1 | |
| Parent Company Financial Statements / Statement of Changes in Equity - 01/01/2021 to 03/31/2021 | |||||||
| (R$ thousand) | |||||||
| Code | Description | Paid-up capital | Capital reserve, granted options and treasury shares | Earnings reserve | Retained earnings (accumulated losses) | Other comprehensive income | Shareholders’ equity |
| 5.01 | Opening balances | 6,040,000 | 32,720 | 5,824,350 | - | (1,983,619) | 9,913,451 |
| 5.03 | Adjusted opening balances | 6,040,000 | 32,720 | 5,824,350 | - | (1,983,619) | 9,913,451 |
| 5.05 | Total comprehensive income | - | - | - | 5,240,015 | (765,978) | 4,474,037 |
| 5.05.01 | Net income for the period | - | - | - | 5,240,015 | - | 5,240,015 |
| 5.05.02 | Other comprehensive income | - | - | - | - | (765,978) | (765,978) |
| 5.05.02.04 | Translation adjustments for the year | - | - | - | - | 86,119 | 86,119 |
| 5.05.02.06 | Actuarial gains/(losses) on pension plan, net of taxes | - | - | - | - | 20 | 20 |
| 5.05.02.07 | (Loss) / gain on the percentage change in investments | - | - | - | - | 814,285 | 814,285 |
| 5.05.02.08 | (Loss) / gain on cash flow hedge accounting | - | - | - | - | (1,666,402) | (1,666,402) |
| 5.07 | Closing balance | 6,040,000 | 32,720 | 5,824,350 | 5,240,015 | (2,749,597) | 14,387,488 |
| 8 |
| (CONVENIENCE TRANSLATION INTO ENGLISH FROM THE ORIGINAL PREVIOUSLY ISSUED IN PORTUGUESE) | ||
| Quarterly Financial Information - March 31, 2021 – CIA SIDERURGICA NACIONAL | Version: 1 | |
| Parent Company Financial Statements / Statement of Changes in Equity - 01/01/2020 to 03/31/2020 | |||||||
| (R$ thousand) | |||||||
| Code | Description | Paid-up capital | Capital reserve, granted options and treasury shares | Earnings reserve | Retained earnings (accumulated losses) | Other comprehensive income | Shareholders’ equity |
| 5.01 | Opening balances | 4,540,000 | 32,720 | 4,431,200 | - | 1,170,624 | 10,174,544 |
| 5.03 | Adjusted opening balances | 4,540,000 | 32,720 | 4,431,200 | - | 1,170,624 | 10,174,544 |
| 5.05 | Total comprehensive income | - | - | - | (1,360,851) | (4,643,683) | (6,004,534) |
| 5.05.01 | Net income for the period | - | - | - | (1,360,851) | - | (1,360,851) |
| 5.05.02 | Other comprehensive income | - | - | - | - | (4,643,683) | (4,643,683) |
| 5.05.02.04 | Translation adjustments for the year | - | - | - | - | 380,042 | 380,042 |
| 5.05.02.06 | Actuarial gains/(losses) on pension plan, net of taxes | - | - | - | - | 31 | 31 |
| 5.05.02.07 | (Loss) / gain on cash flow hedge accounting, net of taxes | - | - | - | - | (5,025,225) | (5,025,225) |
| 5.05.02.08 | (Loss) / gain on hedge of net investment in foreign operations | - | - | - | - | 1,469 | 1,469 |
| 5.07 | Closing balance | 4,540,000 | 32,720 | 4,431,200 | (1,360,851) | (3,473,059) | 4,170,010 |
| 9 |
| (CONVENIENCE TRANSLATION INTO ENGLISH FROM THE ORIGINAL PREVIOUSLY ISSUED IN PORTUGUESE) | ||
| Quarterly Financial Information - March 31, 2021 – CIA SIDERURGICA NACIONAL | Version: 1 | |
| Parent Company Financial Statements / Statement of Value Added | |||
| (R$ thousand) | |||
| Code | Description | Year to date 01/01/2021 to 03/31/2021 | YTD previous year 01/01/2020 to 03/31/2020 |
| 7.01 | Revenues | 9,911,533 | 3,772,385 |
| 7.01.01 | Sales of products and rendering of services | 6,704,021 | 3,769,699 |
| 7.01.02 | Other revenues | 3,207,624 | 4,729 |
| 7.01.04 | Allowance for (reversal of) doubtful debts | (112) | (2,043) |
| 7.02 | Raw materials acquired from third parties | (4,924,195) | (3,469,351) |
| 7.02.01 | Cost of sales and services | (3,794,821) | (2,878,256) |
| 7.02.02 | Materials, electric power, outsourcing and other | (1,094,613) | (585,281) |
| 7.02.03 | Impairment/recovery of assets | (34,761) | (5,814) |
| 7.03 | Gross value added | 4,987,338 | 303,034 |
| 7.04 | Retentions | (201,725) | (209,001) |
| 7.04.01 | Depreciation, amortization and depletion | (201,725) | (209,001) |
| 7.05 | Value added created | 4,785,613 | 94,033 |
| 7.06 | Value added received | 2,017,352 | (392,985) |
| 7.06.01 | Equity in results of affiliates companies | 1,389,903 | (590,690) |
| 7.06.02 | Financial income | 579,338 | 53,376 |
| 7.06.03 | Others | 48,111 | 144,329 |
| 7.06.03.01 | Others and exchange gains | 48,111 | 144,329 |
| 7.07 | Value added for distribution | 6,802,965 | (298,952) |
| 7.08 | Value added distributed | 6,802,965 | (298,952) |
| 7.08.01 | Personnel | 290,648 | 335,379 |
| 7.08.01.01 | Salaries and wages | 217,406 | 249,708 |
| 7.08.01.02 | Benefits | 59,829 | 69,873 |
| 7.08.01.03 | Severance payment (FGTS) | 13,413 | 15,798 |
| 7.08.02 | Taxes, fees and contributions | 1,050,027 | 176,027 |
| 7.08.02.01 | Federal | 948,460 | 133,501 |
| 7.08.02.02 | State | 101,567 | 42,526 |
| 7.08.03 | Remuneration on third-party capital | 222,275 | 550,493 |
| 7.08.03.01 | Interest | 341,854 | 1,335,564 |
| 7.08.03.02 | Rental | 4,314 | 1,618 |
| 7.08.03.03 | Others | (123,893) | (786,689) |
| 7.08.03.03.01 | Others and exchange losses | (123,893) | (786,689) |
| 7.08.04 | Remuneration on Shareholders' capital | 5,240,015 | (1,360,851) |
| 7.08.04.03 | Retained earnings (accumulated losses) | 5,240,015 | (1,360,851) |
| 10 |
| (CONVENIENCE TRANSLATION INTO ENGLISH FROM THE ORIGINAL PREVIOUSLY ISSUED IN PORTUGUESE) | ||
| Quarterly Financial Information - March 31, 2021 – CIA SIDERURGICA NACIONAL | Version: 1 | |
| Consolidated Financial Statements / Balance Sheet – Assets | |||
| (R$ thousand) | |||
| Code | Description | Current Quarter 03/31/2021 | Previous Year 12/31/2020 |
| 1 | Total assets | 69,678,932 | 63,002,149 |
| 1.01 | Current assets | 29,770,912 | 23,386,194 |
| 1.01.01 | Cash and cash equivalents | 13,908,238 | 9,944,586 |
| 1.01.02 | Financial investments | 4,282,151 | 3,783,362 |
| 1.01.02.01 | Financial investments measured a fair value through profit or loss | 3,817,603 | 3,305,109 |
| 1.01.02.01.03 | Financial investments measured a fair value through profit or loss – Usiminas’ shares | 3,817,603 | 3,305,109 |
| 1.01.02.03 | Financial investments at amortized cost | 464,548 | 478,253 |
| 1.01.03 | Trade receivables | 4,219,052 | 2,867,352 |
| 1.01.04 | Inventory | 5,673,189 | 4,817,586 |
| 1.01.06 | Recoverable taxes | 1,199,100 | 1,605,494 |
| 1.01.08 | Other current assets | 489,182 | 367,814 |
| 1.01.08.03 | Others | 489,182 | 367,814 |
| 1.01.08.03.02 | Prepaid expenses | 266,824 | 211,027 |
| 1.01.08.03.03 | Dividends receivable | 38,086 | 38,088 |
| 1.01.08.03.04 | Derivative financial instruments | 39,236 | - |
| 1.01.08.03.05 | Others | 145,036 | 118,699 |
| 1.02 | Non-current assets | 39,908,020 | 39,615,955 |
| 1.02.01 | Long-term assets | 9,080,505 | 8,887,158 |
| 1.02.01.03 | Financial investments at amortized cost | 132,635 | 123,409 |
| 1.02.01.05 | Inventory | 381,175 | 347,304 |
| 1.02.01.07 | Deferred taxes assets | 3,929,974 | 3,874,946 |
| 1.02.01.10 | Other non-current assets | 4,636,721 | 4,541,499 |
| 1.02.01.10.03 | Recoverable taxes | 946,792 | 938,452 |
| 1.02.01.10.04 | Judicial deposits | 338,890 | 325,117 |
| 1.02.01.10.05 | Prepaid expenses | 121,513 | 129,455 |
| 1.02.01.10.06 | Receivable from related parties | 1,707,780 | 1,630,070 |
| 1.02.01.10.07 | Others | 1,521,746 | 1,518,405 |
| 1.02.02 | Investments | 3,746,507 | 3,695,780 |
| 1.02.02.01 | Equity interest | 3,587,397 | 3,535,906 |
| 1.02.02.02 | Investment Property | 159,110 | 159,874 |
| 1.02.03 | Property, plant and equipment | 19,759,932 | 19,716,223 |
| 1.02.03.01 | Property, plant and equipment in operation | 15,485,037 | 15,519,233 |
| 1.02.03.02 | Right of use in leases | 523,436 | 516,668 |
| 1.02.03.03 | Property, plant and equipment in progress | 3,751,459 | 3,680,322 |
| 1.02.04 | Intangible assets | 7,321,076 | 7,316,794 |
| 11 |
| (CONVENIENCE TRANSLATION INTO ENGLISH FROM THE ORIGINAL PREVIOUSLY ISSUED IN PORTUGUESE) | ||
| Quarterly Financial Information - March 31, 2021 – CIA SIDERURGICA NACIONAL | Version: 1 | |
| Consolidated Financial Statements / Balance Sheet – Liabilities | |||
| (R$ thousand) | |||
| Code | Description | Current Quarter 03/31/2021 | Previous Year 12/31/2020 |
| 2 | Total Liabilities | 69,678,932 | 63,002,149 |
| 2.01 | Current liabilities | 16,545,529 | 14,725,696 |
| 2.01.01 | Payroll and related taxes | 301,555 | 282,630 |
| 2.01.02 | Trade payables | 6,156,294 | 4,819,539 |
| 2.01.03 | Tax payables | 2,022,024 | 2,058,362 |
| 2.01.04 | Borrowings and financing | 3,617,910 | 4,126,453 |
| 2.01.05 | Other payables | 4,360,314 | 3,357,639 |
| 2.01.05.02 | Others | 4,360,314 | 3,357,639 |
| 2.01.05.02.04 | Dividends and interests on shareholder´s equity | 901,982 | 946,133 |
| 2.01.05.02.05 | Advances from clients | 1,145,238 | 1,100,772 |
| 2.01.05.02.06 | Trade payables – Forfaiting and Drawee risk | 1,469,209 | 623,861 |
| 2.01.05.02.07 | Lease liabilities | 95,287 | 93,626 |
| 2.01.05.02.08 | Derivative financial instruments | - | 8,722 |
| 2.01.05.02.09 | Other payables | 748,598 | 584,525 |
| 2.01.06 | Provisions | 87,432 | 81,073 |
| 2.01.06.01 | Provision for tax, social security, labor and civil risks | 87,432 | 81,073 |
| 2.02 | Non-current liabilities | 35,858,067 | 37,024,948 |
| 2.02.01 | Borrowings and financing | 30,521,280 | 31,144,200 |
| 2.02.02 | Other payables | 2,621,344 | 3,145,336 |
| 2.02.02.02 | Others | 2,621,344 | 3,145,336 |
| 2.02.02.02.03 | Advances from clients | 1,514,256 | 1,725,838 |
| 2.02.02.02.04 | Lease liabilities | 445,209 | 436,505 |
| 2.02.02.02.05 | Derivative financial instruments | 119,306 | 97,535 |
| 2.02.02.02.06 | Trade payables | 225,069 | 543,527 |
| 2.02.02.02.07 | Other payables | 317,504 | 341,931 |
| 2.02.03 | Deferred taxes assets | 602,209 | 618,836 |
| 2.02.04 | Provisions | 2,113,234 | 2,116,576 |
| 2.02.04.01 | Provision for tax, social security, labor and civil risks | 526,991 | 554,315 |
| 2.02.04.02 | Other provisions | 1,586,243 | 1,562,261 |
| 2.02.04.02.03 | Provision for environmental liabilities and decommissioning of assets | 827,817 | 803,835 |
| 2.02.04.02.04 | Pension and healthcare plan | 758,426 | 758,426 |
| 2.03 | Shareholders’ equity | 17,275,336 | 11,251,505 |
| 2.03.01 | Paid-up capital | 6,040,000 | 6,040,000 |
| 2.03.02 | Capital reserves | 32,720 | 32,720 |
| 2.03.04 | Earnings reserves | 5,824,350 | 5,824,350 |
| 2.03.04.01 | Legal reserve | 468,291 | 468,291 |
| 2.03.04.02 | Statutory reserve | 5,414,323 | 5,414,323 |
| 2.03.04.09 | Treasury shares | (58,264) | (58,264) |
| 2.03.05 | Accumulated earnings (losses) | 5,240,015 | - |
| 2.03.08 | Other comprehensive income | (2,749,597) | (1,983,619) |
| 2.03.09 | Earnings attributable to the non-controlling interests | 2,887,848 | 1,338,054 |
| 12 |
| (CONVENIENCE TRANSLATION INTO ENGLISH FROM THE ORIGINAL PREVIOUSLY ISSUED IN PORTUGUESE) | ||
| Quarterly Financial Information - March 31, 2021 – CIA SIDERURGICA NACIONAL | Version: 1 | |
| Consolidated Financial Statements / Statements of Income | |||
| (R$ thousand) | |||
| Code | Description | Year to date 01/01/2021 to 03/31/2021 | YTD previous year 01/01/2020 to 03/31/2020 |
| 3.01 | Revenues from sale of goods and rendering of services | 11,913,328 | 5,334,653 |
| 3.02 | Costs from sale of goods and rendering of services | (6,178,784) | (4,017,707) |
| 3.03 | Gross profit | 5,734,544 | 1,316,946 |
| 3.04 | Operating (expenses)/income | 1,442,516 | (1,221,313) |
| 3.04.01 | Selling expenses | (422,586) | (390,915) |
| 3.04.02 | General and administrative expenses | (134,463) | (119,055) |
| 3.04.04 | Other operating income | 2,560,232 | 102,689 |
| 3.04.05 | Other operating expenses | (574,112) | (768,924) |
| 3.04.06 | Equity in results of affiliated companies | 13,445 | (45,108) |
| 3.05 | Income before financial income (expenses) and taxes | 7,177,060 | 95,633 |
| 3.06 | Financial income (expenses) | (201,507) | (1,201,138) |
| 3.06.01 | Financial income | 585,585 | 65,131 |
| 3.06.02 | Financial expenses | (787,092) | (1,266,269) |
| 3.06.02.01 | Net exchange differences over financial instruments | (56,328) | 364,882 |
| 3.06.02.02 | Financial expenses | (730,764) | (1,631,151) |
| 3.07 | Income before income taxes | 6,975,553 | (1,105,505) |
| 3.08 | Income tax and social contribution | (1,278,240) | (206,204) |
| 3.09 | Net income from continued operations | 5,697,313 | (1,311,709) |
| 3.11 | Consolidated net income for the year | 5,697,313 | (1,311,709) |
| 3.11.01 | Earnings attributable to the controlling interests | 5,240,015 | (1,360,851) |
| 3.11.02 | Earnings it attributable to the non-controlling interests | 457,298 | 49,142 |
| 3.99 | Earnings per share – (Reais / Share) | - | - |
| 3.99.01 | Basic earnings per share | - | - |
| 3.99.01.01 | Common shares | 3.79680 | - 0.98604 |
| 3.99.02 | Diluted earnings per share | - | - |
| 3.99.02.01 | Common shares | 3.79680 | - 0.98604 |
| 13 |
| (CONVENIENCE TRANSLATION INTO ENGLISH FROM THE ORIGINAL PREVIOUSLY ISSUED IN PORTUGUESE) | ||
| Quarterly Financial Information - March 31, 2021 – CIA SIDERURGICA NACIONAL | Version: 1 | |
| Consolidated Financial Statements / Statement of Comprehensive Income | ||||
| (R$ thousand) | ||||
| Code | Description | Year to date 01/01/2021 to 03/31/2021 | YTD previous year 01/01/2020 to 03/31/2020 | |
| 4.01 | Consolidated net income for the year | 5,697,313 | (1,311,709) | |
| 4.02 | Other comprehensive income | (716,987) | (4,643,681) | |
| 4.02.01 | Actuarial gains/(losses) over pension plan of subsidiaries, net of taxes | 371 | 33 | |
| 4.02.02 | Cumulative translation adjustments for the year | 86,119 | 380,042 | |
| 4.02.03 | (Loss)/gain on the percentage change in investments | 862,857 | - | |
| 4.02.04 | Losses in cash flow hedge | (1,919,129) | (5,390,043) | |
| 4.02.05 | Cash flow hedge reclassified to income upon realization | 252,250 | 364,818 | |
| 4.02.06 | Cash flow hedge accounting - "Platts" reclassified to income upon realization | 38,650 | - | |
| 4.02.07 | Losses from cash flow hegde accounting - "Platts", net of taxes | (38,105) | - | |
| 4.02.08 | (Loss)/gain on hedge of net investment in foreign operations. | - | 1,469 | |
| 4.03 | Consolidated comprehensive income for the year | 4,980,326 | (5,955,390) | |
| 4.03.01 | Earnings attributable to the controlling interests | 4,474,037 | (6,004,534) | |
| 4.03.02 | Earnings it attributable to the non-controlling interests | 506,289 | 49,144 | |
| 14 |
| (CONVENIENCE TRANSLATION INTO ENGLISH FROM THE ORIGINAL PREVIOUSLY ISSUED IN PORTUGUESE) | ||
| Quarterly Financial Information - March 31, 2021 – CIA SIDERURGICA NACIONAL | Version: 1 | |
| Consolidated Financial Statements / Statements of Cash Flows – Indirect Method | |||
| (R$ thousand) | |||
| Code | Description | Year to date 01/01/2021 to 03/31/2021 | YTD previous year 01/01/2020 to 03/31/2020 |
| 6.01 | Net cash from operating activities | 3,455,474 | 466,933 |
| 6.01.01 | Cash from operations | 4,262,039 | 1,166,186 |
| 6.01.01.01 | Earnings attributable to the controlling interests | 5,240,015 | (1,360,851) |
| 6.01.01.02 | Earnings attributable to the non-controlling interests | 457,298 | 49,142 |
| 6.01.01.03 | Financial charges in borrowing and financing raised | 471,147 | 470,990 |
| 6.01.01.04 | Financial charges in borrowing and financing granted | (6,541) | (11,481) |
| 6.01.01.05 | Charges on lease liabilities | 14,827 | 13,056 |
| 6.01.01.06 | Equity in results of affiliated companies | (13,445) | 45,108 |
| 6.01.01.07 | Deferred taxes assets | (80,858) | (11,351) |
| 6.01.01.08 | Provision for tax, social security, labor, civil and environmental risks | (22,203) | (8,685) |
| 6.01.01.09 | Monetary and exchange variations, net | 716,123 | 522,571 |
| 6.01.01.10 | Write-off of property, plant and equipment right of use and Intangible assets | 1,838 | 1,400 |
| 6.01.01.11 | Provision for environmental liabilities and decommissioning of assets | 23,982 | 20,640 |
| 6.01.01.12 | Updated shares – Fair value through profit or loss | (543,498) | 962,561 |
| 6.01.01.13 | Depreciation, amortization and depletion | 484,065 | 437,507 |
| 6.01.01.14 | Accrued/(reversal) for consumption and services | 17,039 | 37,158 |
| 6.01.01.15 | Net gains on the sale of the shares of the CSN Mineração. | (2,472,497) | - |
| 6.01.01.16 | Receivables by indemnity | (4,428) | - |
| 6.01.01.17 | Other provisions | (20,825) | (1,579) |
| 6.01.02 | Changes in assets and liabilities | (806,565) | (699,253) |
| 6.01.02.01 | Trade receivables - third parties | (1,190,789) | (89,849) |
| 6.01.02.02 | Trade receivables - related party | (165,806) | (31,572) |
| 6.01.02.03 | Inventory | (813,705) | (13,512) |
| 6.01.02.05 | Recoverable taxes | 398,054 | 57,227 |
| 6.01.02.06 | Judicial deposits | (13,773) | (4,749) |
| 6.01.02.08 | Trade payables | 996,084 | 341,567 |
| 6.01.02.09 | Trade payables – Forfaiting and Drawee risk | 845,348 | (183,736) |
| 6.01.02.10 | Payroll and related taxes | 17,498 | (14,420) |
| 6.01.02.11 | Tax payables | (46,349) | (61,612) |
| 6.01.02.12 | Payables to related parties | (10,141) | (20,572) |
| 6.01.02.13 | Advances from clients | ��(149,884) | (130,568) |
| 6.01.02.14 | Interest paid | (639,045) | (511,242) |
| 6.01.02.15 | Cash flow hedge accounting | (76,150) | - |
| 6.01.02.16 | Others | 42,093 | (36,215) |
| 6.02 | Net cash investment activities | 2,737,117 | (404,851) |
| 6.02.02 | Purchase of property, plant and equipment, intangible assets and investment property | (373,094) | (353,698) |
| 6.02.07 | Intercompany loans granted | (70,394) | (82,089) |
| 6.02.08 | Intercompany loans received | - | 3,022 |
| 6.02.09 | Financial Investments, net of redemption | 15,993 | 27,914 |
| 6.02.10 | Net cash received from sale of CSN Mineração's shares | 3,164,612 | - |
| 15 |
| (CONVENIENCE TRANSLATION INTO ENGLISH FROM THE ORIGINAL PREVIOUSLY ISSUED IN PORTUGUESE) | ||
| Quarterly Financial Information - March 31, 2021 – CIA SIDERURGICA NACIONAL | Version: 1 | |
| 6.03 | Net cash used in financing activities | (2,212,281) | 2,157,127 |
| 6.03.01 | Borrowings and financing raised | 310,141 | 4,553,970 |
| 6.03.02 | Transactions cost - Borrowings and financing | (11,423) | (9,131) |
| 6.03.03 | Amortization of borrowings and financing | (3,653,158) | (2,363,666) |
| 6.03.04 | Dividends and interest on shareholder’s equity | (176,217) | (136) |
| 6.03.05 | Amortization of leases | (29,486) | (23,910) |
| 6.03.06 | Issuance of new CSN Mineração's shares | 1,347,862 | - |
| 6.04 | Exchange rate on translating cash and cash equivalents | (16,658) | (27,026) |
| 6.05 | Increase (decrease) in cash and cash equivalents | 3,963,652 | 2,192,183 |
| 6.05.01 | Cash and equivalents at the beginning of the year | 9,944,586 | 1,088,955 |
| 6.05.02 | Cash and equivalents at the end of the year | 13,908,238 | 3,281,138 |
| 16 |
| (CONVENIENCE TRANSLATION INTO ENGLISH FROM THE ORIGINAL PREVIOUSLY ISSUED IN PORTUGUESE) | ||
| Quarterly Financial Information - March 31, 2021 – CIA SIDERURGICA NACIONAL | Version: 1 | |
| Consolidated Financial Statements / Statements of Changes in Equity - 01/01/2021 to 03/31/2021 | |||||||||
| (R$ thousand) | |||||||||
| Code | Description | Paid-up capital | Capital reserve, granted options and treasury shares | Earnings reserve | Retained earnings (accumulated losses) | Other comprehensive income | Shareholders’ equity | Non-controlling interests | Shareholders’ equity |
| 5.01 | Opening balances | 6,040,000 | 32,720 | 5,824,350 | - | (1,983,619) | 9,913,451 | 1,338,054 | 11,251,505 |
| 5.03 | Adjusted opening balances | 6,040,000 | 32,720 | 5,824,350 | - | (1,983,619) | 9,913,451 | 1,338,054 | 11,251,505 |
| 5.04 | Capital transaction with shareholders | - | - | - | - | - | - | 863,694 | 863,694 |
| 5.04.01 | Capital increase proposed | - | - | - | - | - | - | 863,694 | 863,694 |
| 5.05 | Total comprehensive income | - | - | - | 5,240,015 | (765,978) | 4,474,037 | 536,230 | 5,010,267 |
| 5.05.01 | Net income for the year | - | - | - | 5,240,015 | - | 5,240,015 | 457,298 | 5,697,313 |
| 5.05.02 | Other comprehensive income | - | - | - | - | (765,978) | (765,978) | 78,932 | (687,046) |
| 5.05.02.04 | Translation adjustments for the year | - | - | - | - | 86,119 | 86,119 | - | 86,119 |
| 5.05.02.06 | Actuarial (loss)/gain on pension plan, net of taxes | - | - | - | - | 20 | 20 | 351 | 371 |
| 5.05.02.07 | (Loss)/gain on the percentage change in investments | - | - | - | - | 814,285 | 814,285 | 48,572 | 862,857 |
| 5.05.02.08 | (Loss) / gain on cash flow hedge accounting, net of taxes | - | - | - | - | (1,666,402) | (1,666,402) | 68 | (1,666,334) |
| 5.05.02.09 | (Loss) / gain on business combination | - | - | - | - | - | - | 29,941 | 29,941 |
| 5.06 | Internal changes in shareholders’ equity | - | - | - | - | - | - | 149,870 | 149,870 |
| 5.06.01 | Constitution of reserves | - | - | - | - | - | - | 149,870 | 149,870 |
| 5.07 | Closing balance | 6,040,000 | 32,720 | 5,824,350 | 5,240,015 | (2,749,597) | 14,387,488 | 2,887,848 | 17,275,336 |
| 17 |
| (CONVENIENCE TRANSLATION INTO ENGLISH FROM THE ORIGINAL PREVIOUSLY ISSUED IN PORTUGUESE) | ||
| Quarterly Financial Information - March 31, 2021 – CIA SIDERURGICA NACIONAL | Version: 1 | |
| Consolidated Financial Statements / Statements of Changes in Equity - 01/01/2020 to 03/31/2020 | |||||||||
| (R$ thousand) | |||||||||
| Code | Description | Paid-up capital | Capital reserve, granted options and treasury shares | Earnings reserve | Retained earnings (accumulated losses) | Other comprehensive income | Shareholders’ equity | Non-controlling interests | Shareholders’ equity |
| 5.01 | Opening balances | 4,540,000 | 32,720 | 4,431,200 | - | 1,170,624 | 10,174,544 | 1,187,388 | 11,361,932 |
| 5.03 | Adjusted opening balances | 4,540,000 | 32,720 | 4,431,200 | - | 1,170,624 | 10,174,544 | 1,187,388 | 11,361,932 |
| 5.05 | Total comprehensive income | - | - | - | (1,360,851) | (4,643,683) | (6,004,534) | 49,144 | (5,955,390) |
| 5.05.01 | Net income for the year | - | - | - | (1,360,851) | - | (1,360,851) | 49,142 | (1,311,709) |
| 5.05.02 | Other comprehensive income | - | - | - | - | (4,643,683) | (4,643,683) | 2 | (4,643,681) |
| 5.05.02.04 | Translation adjustments for the year | - | - | - | - | 380,042 | 380,042 | - | 380,042 |
| 5.05.02.06 | Actuarial (loss)/gain on pension plan, net of taxes | - | - | - | - | 31 | 31 | 2 | 33 |
| 5.05.02.07 | (Loss) / gain on cash flow hedge accounting, net of taxes | - | - | - | - | (5,025,225) | (5,025,225) | - | (5,025,225) |
| 5.05.02.08 | (Loss) / gain on hedge of net investment in foreign operations | - | - | - | - | 1,469 | 1,469 | - | 1,469 |
| 5.07 | Closing balance | 4,540,000 | 32,720 | 4,431,200 | (1,360,851) | (3,473,059) | 4,170,010 | 1,236,532 | 5,406,542 |
| 18 |
| (CONVENIENCE TRANSLATION INTO ENGLISH FROM THE ORIGINAL PREVIOUSLY ISSUED IN PORTUGUESE) | ||
| Quarterly Financial Information - March 31, 2021 – CIA SIDERURGICA NACIONAL | Version: 1 | |
| Consolidated Financial Statements / Statements of Value Added | ||||
| (R$ thousand) | ||||
| Code | Description | Year to date 01/01/2021 to 03/31/2021 | YTD previous year 01/01/2020 to 03/31/2020 | |
| 7.01 | Revenues | 16,636,667 | 6,143,475 | |
| 7.01.01 | Sales of products and rendering of services | 13,425,060 | 6,137,834 | |
| 7.01.02 | Other revenues | 3,211,130 | 6,962 | |
| 7.01.04 | Allowance for (reversal of) doubtful debts | 477 | (1,321) | |
| 7.02 | Raw materials acquired from third parties | (7,270,931) | (4,758,610) | |
| 7.02.01 | Cost of sales and services | (5,585,726) | (3,776,787) | |
| 7.02.02 | Materials, electric power, outsourcing and other | (1,621,797) | (961,472) | |
| 7.02.03 | Impairment/recovery of assets | (63,408) | (20,351) | |
| 7.03 | Gross value added | 9,365,736 | 1,384,865 | |
| 7.04 | Retentions | (482,517) | (436,293) | |
| 7.04.01 | Depreciation, amortization and depletion | (482,517) | (436,293) | |
| 7.05 | Value added created | 8,883,219 | 948,572 | |
| 7.06 | Value added received | 1,075,792 | 698,088 | |
| 7.06.01 | Equity in results of affiliated companies | 13,445 | (45,108) | |
| 7.06.02 | Financial income | 585,585 | 65,131 | |
| 7.06.03 | Others | 476,762 | 678,065 | |
| 7.06.03.01 | Others and exchange gains | 476,762 | 678,065 | |
| 7.07 | Value added for distribution | 9,959,011 | 1,646,660 | |
| 7.08 | Value added distributed | 9,959,011 | 1,646,660 | |
| 7.08.01 | Personnel | 534,898 | 564,541 | |
| 7.08.01.01 | Salaries and wages | 415,052 | 432,137 | |
| 7.08.01.02 | Benefits | 99,200 | 108,569 | |
| 7.08.01.03 | Severance payment (FGTS) | 20,646 | 23,835 | |
| 7.08.02 | Taxes, fees and contributions | 2,456,730 | 444,051 | |
| 7.08.02.01 | Federal | 2,248,015 | 372,011 | |
| 7.08.02.02 | State | 198,595 | 63,146 | |
| 7.08.02.03 | Municipal | 10,120 | 8,894 | |
| 7.08.03 | Remuneration on third-party capital | 1,270,070 | 1,949,777 | |
| 7.08.03.01 | Interest | 730,764 | 1,631,151 | |
| 7.08.03.02 | Rental | 6,216 | 5,441 | |
| 7.08.03.03 | Others | 533,090 | 313,185 | |
| 7.08.03.03.01 | Others and exchange losses | 533,090 | 313,185 | |
| 7.08.04 | Remuneration on Shareholders' capital | 5,697,313 | (1,311,709) | |
| 7.08.04.03 | Retained earnings (accumulated losses) | 5,240,015 | (1,360,851) | |
| 7.08.04.04 | Non-controlling interests in retained earnings | 457,298 | 49,142 | |
| 19 |
| (CONVENIENCE TRANSLATION INTO ENGLISH FROM THE ORIGINAL PREVIOUSLY ISSUED IN PORTUGUESE) | ||
| Quarterly Financial Information - March 31, 2021 – CIA SIDERURGICA NACIONAL | Version: 1 | |
| 1. | DESCRIPTION OF BUSINESS |
Companhia Siderúrgica Nacional “CSN”, also referred to as the “Company”, is a publicly-held company incorporated on April 9, 1941, under the laws of the Federative Republic of Brazil (Companhia Siderúrgica Nacional, its subsidiaries, joint ventures, joint operations and associates are collectively referred to herein as the "Group”). The Company’s registered office is located in São Paulo, SP, Brazil.
CSN is listed on the São Paulo Stock Exchange (B3 S.A.- Brasil, Bolsa, Balcão) and on the New York Stock Exchange (NYSE).
The Group's main operating activities are divided into five (5) segments as follows:
| · | Steel: |
The Company’s main industrial facility is the Presidente Vargas steelworks (“UPV”), located in the city of Volta Redonda, State of Rio de Janeiro. This segment consolidates all operations related to the production, distribution and sale of flat steel, long steel, metallic containers and galvanized steel. In addition to the facilities in Brazil, CSN has commercial operations in the United States and operations in Portugal and Germany to achieve markets and providing excellent services for final consumers. Its steel is used in home appliances, civil construction and automobile industries.
| · | Mining: |
The production of iron ore is developed in the cities of Congonhas, Ouro Preto and Belo Vale, State of Minas Gerais – by subsidiary CSN Mineração.
Iron ore is sold basically in the international market, especially in Europe and Asia. The prices charged in these markets are historically cyclical and subject to significant fluctuations over short periods of time, driven by several factors related to global demand, strategies adopted by the major steel producers, and the foreign exchange rate. All these factors are beyond the Company’s control. The ore transportation is carried out through Terminal de Carvão e Minérios do Porto de Itaguai – (“TECAR”), a solid bulk terminal, one of the four terminals that comprise the Port of Itaguai, located in the State of Rio de Janeiro. Imports of coal and coke are also carried out through this terminal by provision of services by CSN Mineração to CSN. The Company´s mining activities also comprises tin exploitation, which is based in the State of Rondônia, to supply the needs of UPV. The excess of raw material is sold to subsidiaries and third parties.
As a pioneer in the use of technologies that result in the possibility of stacking the tailings generated in the iron ore production process, the Company has had its iron ore production since January 2020, 100% independent of tailings dams. After significant investments in recent years to raise the level of reliability, mischaracterization and dry stacking, the Company has moved on to a scenario in which 100% of its waste goes through a dry filtration process and is disposed of in geotechnically controlled batteries, areas exclusively destined for stacking. Approximately R$250 million was invested in the two tailings filtration plants that have a combined total filtration capacity of 9 million tons per year.
As a consequence of these measures, the decommissioning of the dams is the natural way of processing dry waste.
All of our mining dams are positively certified and comply with the environmental legislation in force.
| · | Cements |
CSN entered the cement production market, catapulted by the synergy between this activity and CSN's current business. Beside the UPV facilities, in Volta Redonda / RJ, the Company installed a new business unit, which produces CP-III type cement using the slag produced by the UPV’s own blast furnaces. It also explores limestone and dolomite at the Arcos / MG unit, to meet the needs of the UPV and the cement plant. Additionally, in Arcos / MG, the clinker production operation is located. As a result, the Company is self-sufficient in the production of cement, with an installed capacity of 4.7 million tons per year.
| 20 |
| (CONVENIENCE TRANSLATION INTO ENGLISH FROM THE ORIGINAL PREVIOUSLY ISSUED IN PORTUGUESE) | ||
| Quarterly Financial Information - March 31, 2021 – CIA SIDERURGICA NACIONAL | Version: 1 | |
On January 31, 2021, the Company concluded the drop down of the cement segment and, accordingly, all assets and liabilities related to the cement business were transferred from CSN to its subsidiary recently incorporated CSN Cimentos S.A. (note 10.c).
| · | Logistics: |
Railroads:
CSN has interests in three railroad companies: MRS Logística S.A., which manages the former Southeast Railway System of Rede Ferroviária Federal S.A (“RFFSA”)., Transnordestina Logística S.A. (“TLSA”) and FTL - Ferrovia Transnordestina Logística S.A. (“FTL”), which the the latter two hold the concession to operate the former Northeast Railway System of RFFSA, in the States of Maranhão, Piauí, Ceará, Rio Grande do Norte, Paraíba, Pernambuco, Alagoas and Sergipe, with TLSA being responsible for the rail links of Eliseu Martins – Trindade, Trindade – Salgueiro, Salgueiro – Porto Suape, Salgueiro – Missão Velha and Missão Velha - Pecém (Railway System II), under construction, and FTL being responsible for the rail links of São Luis - Altos, Altos - Fortaleza, Fortaleza – Souza, Souza - Recife/Jorge Lins, Recife/Jorge Lins – Salgueiro, Jorge Lins – Propriá, Paula Cavalcanti – Cabedelo, Itabaiana - Macau (Railway System I).
Ports:
The Company operates in the State of Rio de Janeiro, by means of its subsidiary Sepetiba Tecon S.A., operates the Container Terminal (“TECON”) and by means of its subsidiary CSN Mineração, the TECAR, both located at the Itaguaí Port. Established in the harbor of Sepetiba, the mentioned port has a privileged highway, railroad and maritime access.
(“TECON”) is responsible for the shipments of CSN´s steel products, movement and storage of containers, vehicles, general cargo, among other products; and TECAR performs the operational activities of loading and unloading of solid bulk ships, storage and distribution (road and rail) of coal, coke, zinc concentrate, sulfur, iron ore and other bulk, intended for the seaborne market, for our own operation and for third parties.
| · | Energy: |
Since the energy supply is fundamental in CSN´s production process, the Company owns and operates facilities to generate electric power for guaranteeing its self-sufficiency.
| · | GOING CONCERN |
The Company permanently takes actions to reprofile portions of its debts. Those actions do not affect the Company’s ability to continue as a going concern and, additionally, there are no significant operating restructuring plans which could imply in changes to that ability. The assumptions adopted in the assessment of operating continuity included in the financial statements as of December 31, 2020 remain in place, having been those financial statements approved by the Board of Directors on February 22, 2021. The COVID-19 pandemic was a new important factor raised worldwide, assuming major relevance as from the end of the first quarter of 2020 and impacting the global economy. We perceived some impacts in our activities until the end of the first semester of 2020, especially in our steel operations, which did not prejudice our results and our financial position in 2020 and in the first quarter of 2021.
Although the pandemic effects continue dissipating by the vaccination campaign around the world, Brazil experiences a worsening of the COVID-19 pandemic and, accordingly, the Brazilian authorities have adopted new restriction measures. However, we did not identify any continuity risks and our major operating assumptions remain substantially unchanged.
| 21 |
| (CONVENIENCE TRANSLATION INTO ENGLISH FROM THE ORIGINAL PREVIOUSLY ISSUED IN PORTUGUESE) | ||
| Quarterly Financial Information - March 31, 2021 – CIA SIDERURGICA NACIONAL | Version: 1 | |
| 2. | SUMMARY OF SIGNIFICANT ACCOUNTING POLICIES |
| 2.a) | Declaration of conformity |
The consolidated and parent company condensed interim financial information (“condensed quarterly information”) have been prepared and are being presented in accordance with accounting practices adopted in Brazil based on the provisions of the Brazilian Corporate Law, pronouncements, guidelines and interpretations issued (CPC), approved by CVM, besides the own standards issued by the Brazilian Securities and Exchange Commission (“CVM”) and International Financial Reporting Standards (“IFRS”) issued by the International Accounting Standard Board (IASB) and highlight all the relevant information of the interim financial statements, and only this information, is being disclosed and corresponds to the information used by the Company's management in its activities.
| 2.b) | Basis of presentation |
The interim financial information has been prepared using the historical cost as the basis of value, the net realizable value, the fair value or the recovery value, except when otherwise indicated.
The preparation of this interim financial information requires Management to use certain accounting estimates, judgments and assumptions that affect the application of Accounting Polices and the amounts reported on the balance sheet date of assets, liabilities, income and expenses may differ from actual future results. The assumptions used are based on history and other factors considered relevant and are reviewed by the Company’s management.
The interim financial information has been prepared and is being presented in accordance with CPC 21 (R1) - “Interim Financial Reporting” and IAS 34 - “Interim Financial Reporting”, consistently with the standards issued by the CVM.
This interim financial information does not include all requirements of annual or full financial statements and, accordingly, should be read in conjunction with the Company’s financial statements for the year ended December 31, 2020.The accounting policies and critical estimates, when applicable and relevant, are included in the respective explanatory notes and are consistent with the previous period presented.
Therefore, in this interim financial information the following notes are not repeated, either due to redundancy or to the materiality in relation to those already presented in the annual financial statements:
Note 10 – Consolidation and investment basis
Note 12 – Intangible assets
Note 18 – Income tax and social contributions
Note 19 – Taxes in installments
Note 20 – Provisions for tax, social security, labor, civil, environmental risks and judicial deposits
Note 30 – Employee benefits
Note 31 - Commitments
The interim financial information was approved by the Board of Directors on April 28, 2021.
| 2.c) | Functional currency and presentation currency |
The accounting records included in the interim financial information of each of the Company’s subsidiaries are measured using the currency of the principal of the economic environment in which each subsidiary operates (“the functional currency”). The interim financial information is presented in R$ (reais), which is the Company’s functional and reporting currency.
Foreign currency transactions are translated into the functional currency using the exchange rates prevailing on the transaction or valuation dates, in which the items are remeasured. The balances of the asset and liability accounts are translated using the exchange rate on the balance sheet date. As of March 31, 2021, US$1.00 is equivalent to R$5.6973 (R$5.1967 on December 31, 2020) and €1.00 is equivalent to R$6.6915 (R$6.3779 on December 31, 2020), according to the rates obtained from Central Bank of Brazil website
| 2.d) | Statement of value added |
Pursuant to Law 11,638/07, the presentation of the statement of value added is required for all publicly-held companies. These statements were prepared in accordance with CPC 09 - Statement of Value Added, approved by CVM Resolution 557/08. The IFRS does not require the presentation of this statement and for IFRS purposes is presented as additional information.
| 22 |
| (CONVENIENCE TRANSLATION INTO ENGLISH FROM THE ORIGINAL PREVIOUSLY ISSUED IN PORTUGUESE) | ||
| Quarterly Financial Information - March 31, 2021 – CIA SIDERURGICA NACIONAL | Version: 1 | |
| 3. | IMPACTS OF COVID-19 |
At the end of 2019, the COVID-19 virus spread worldwide, and in March 2020, the WHO (World Health Organization) declared a pandemic of this disease. Since the beginning of the pandemic, the Company has adopted several precautionary measures in all its areas to reduce the exposure of its employees and to guarantee the continuity of its business.
In this sense, in 2020 all employees in chronic conditions of vulnerability (risk group) were mapped and put on vacation together with most other employees in order to reduce their corporate staff by around 50%. In 2021, the most critical stage of the pandemic, the Brazilian authorities adopted more restrictive measures and the Company adopted home office to 80% of its employees who work in administrative roles in São Paulo. In addition, masks were provided in the beginning of the pandemic for all employees, hand sanitizer was made available in all company facilities, and we also released internal communications with preventive measures in order to reinforce the hygiene protocols recommended by the competent authorities.
The Company’s economic activity is directly linked to the demand for steel products in the automotive, domestic and civil construction sectors, as well as iron ore, both in the domestic and international markets. Any reduction in the activity of these sectors could affect the demand and the price of products and have significant impact to the Company’s financial position and results.
Our portfolio of investments and the nature of our industrial plants have long-term characteristics. The long-term operational and economic context to which the Company operates allows greater flexibility in the strategies and plans to mitigate the risks and effects of the pandemic on its business and, consequently, ensure the maintenance of the expected recoverability of its non-financial assets, whether investments, fixed assets and tax credits.
The Company did not experience any significant impact to its railway and maritime logistics. There was also no impact to the availability of supplies that could have interrupted its operational activities.
According to the guidelines of the Brazilian Securities and Exchange Commission (CVM), the Company assessed any effects that are related to business continuity and its accounting estimates. Despite some adverse effects perceived at the beginning of the pandemic, which over the rest of the year had already dissipated, such adverse effects did not bring risks of continuity or the need for adjustments to accounting estimates that produced significant effects on the Company’s business and consequently on its financial position.
The Company maintains all of its medium and long-term production and sales forecasts.
| 23 |
| (CONVENIENCE TRANSLATION INTO ENGLISH FROM THE ORIGINAL PREVIOUSLY ISSUED IN PORTUGUESE) | ||
| Quarterly Financial Information - March 31, 2021 – CIA SIDERURGICA NACIONAL | Version: 1 | |
| 4. | CASH AND CASH EQUIVALENTS |
| Consolidated | Parent Company | ||||||
| 03/31/2021 | 12/31/2020 | 03/31/2021 | 12/31/2020 | ||||
| Cash and banks | |||||||
| In Brazil | 94,224 | 245,185 | 58,528 | 238,509 | |||
| Abroad | 6,265,404 | 3,899,282 | 111,108 | 199,994 | |||
| 6,359,628 | 4,144,467 | 169,636 | 438,503 | ||||
| Investments | |||||||
| In Brazil | 7,498,424 | 5,800,119 | 4,956,826 | 4,208,622 | |||
| Abroad | 50,186 | ||||||
| 7,548,610 | 5,800,119 | 4,956,826 | 4,208,622 | ||||
| 13,908,238 | 9,944,586 | 5,126,462 | 4,647,125 | ||||
Our investments are basically in private and public securities with yields linked to the variation of Interbank Deposit Certificates (CDI) and repo operations backed by National Treasury Notes respectively. The Company invests part of the funds through exclusive investment funds which have been consolidated in these financial statements.
Our investments abroad are in private securities in top-rated banks and are remunerated at pre-fixed rates.
| 5. | FINANCIAL INVESTMENTS |
| Consolidated | Parent Company | |||||||||||||||
| Current | Non Current | Current | Non Current | |||||||||||||
| 03/31/2021 | 12/31/2020 | 03/31/2021 | 12/31/2020 | 03/31/2021 | 12/31/2020 | 03/31/2021 | 12/31/2020 | |||||||||
| Investments (1) | 464,548 | 478,253 | 462,361 | 475,782 | ||||||||||||
| Usiminas shares (2) | 3,817,603 | 3,305,109 | 3,817,603 | 3,305,109 | ||||||||||||
| Bonds (3) | 132,635 | 123,409 | 132,635 | 123,409 | ||||||||||||
| 4,282,151 | 3,783,362 | 132,635 | 123,409 | 4,279,964 | 3,780,891 | 132,635 | 123,409 | |||||||||
| (1) | These are restricted financial investments and linked to a Bank Deposit Certificate (CDB) to guarantee a letter of guarantee from financial institutions and financial investments in Public Securities (LFT - Letras Financeiras do Tesouro) managed by their exclusive funds. |
| (2) | Part of the shares guarantees a portion of the Company's debt. |
| (3) | Bonds with Fibra bank due in February 2028 (see note 21). |
| 6. | TRADE RECEIVABLES |
| Consolidated | Parent Company | ||||||
| 03/31/2021 | 12/31/2020 | 03/31/2021 | 12/31/2020 | ||||
| Trade receivables | |||||||
| Third parties | |||||||
| Domestic market | 1,422,054 | 910,657 | 1,028,802 | 680,340 | |||
| Foreign market | 2,740,206 | 2,063,867 | 92,675 | 65,379 | |||
| 4,162,260 | 2,974,524 | 1,121,477 | 745,719 | ||||
| Allowance for doubtful debts | (230,190) | (228,348) | (140,299) | (143,735) | |||
| 3,932,070 | 2,746,176 | 981,178 | 601,984 | ||||
| Related parties (note 21 a) | 286,982 | 121,176 | 718,185 | 947,719 | |||
| 4,219,052 | 2,867,352 | 1,699,363 | 1,549,703 | ||||
The composition of the gross balance of accounts receivable from third party customers is shown as follows:
| 24 |
| (CONVENIENCE TRANSLATION INTO ENGLISH FROM THE ORIGINAL PREVIOUSLY ISSUED IN PORTUGUESE) | ||
| Quarterly Financial Information - March 31, 2021 – CIA SIDERURGICA NACIONAL | Version: 1 | |
| Consolidated | Parent Company | |||||||
| 03/31/2021 | 12/31/2020 | 03/31/2021 | 12/31/2020 | |||||
| Current | 3,560,087 | 2,537,567 | 946,060 | 535,541 | ||||
| Past-due up to 30 days | 378,747 | 222,972 | 11,011 | 72,890 | ||||
| Past-due up to 180 days | 32,951 | 17,915 | 30,864 | 958 | ||||
| Past-due over 180 days | 190,475 | 196,070 | 133,542 | 136,330 | ||||
| 4,162,260 | 2,974,524 | 1,121,477 | 745,719 | |||||
The changes in expected credit losses are as follows:
| Consolidated | Parent Company | |||||||
| 03/31/2021 | 12/31/2020 | 03/31/2021 | 12/31/2020 | |||||
| Opening balance | (228,348) | (245,194) | (143,735) | (167,247) | ||||
| (Loss)/Reversal estimated | (4,110) | 7,513 | (2,071) | 22,347 | ||||
| Recovery and write-offs of receivables | 2,268 | 9,333 | 1,959 | 1,165 | ||||
| Drop down of Cements (note 10.c) | 3,548 | |||||||
| Closing balance | (230,190) | (228,348) | (140,299) | (143,735) | ||||
| 7. | INVENTORIES |
| Consolidated | Parent Company | ||||||
| 03/31/2021 | 12/31/2020 | 03/31/2021 | 12/31/2020 | ||||
| Finished goods | 1,451,251 | 1,627,676 | 594,973 | 748,918 | |||
| Work in progress | 1,726,453 | 1,358,905 | 1,088,489 | 836,128 | |||
| Raw materials | 1,942,227 | 1,289,653 | 1,433,206 | 876,168 | |||
| Storeroom supplies | 959,880 | 928,158 | 461,301 | 525,114 | |||
| Advances to suppliers | 92,319 | 69,536 | 80,414 | 63,950 | |||
| Provision for losses | (117,766) | (109,038) | (32,765) | (35,832) | |||
| 6,054,364 | 5,164,890 | 3,625,618 | 3,014,446 | ||||
| Classified: | |||||||
| Current | 5,673,189 | 4,817,586 | 3,625,618 | 3,014,446 | |||
| Non-current (1) | 381,175 | 347,304 | |||||
| 6,054,364 | 5,164,890 | 3,625,618 | 3,014,446 | ||||
| 1. | Long-term iron ore inventories that will be used after the construction of the processing plant, which will produce pellet feed, In 2020, the Company defined the construction project for the new plant for processing Itabirito, which until then was considered as waste, and started to be incorporated into the long-term ore inventory. |
.
The changes in estimated losses on inventories are as follows:
| Consolidated | Parent Company | |||||||
| 03/31/2021 | 12/31/2020 | 03/31/2021 | 12/31/2020 | |||||
| Opening balance | (109,038) | (134,553) | (35,832) | (41,201) | ||||
| (Estimated losses) / Reversal of inventories with low turnover and obsolescence | (8,728) | 25,515 | (1,238) | 5,369 | ||||
| Drop down of Cements (note 10.c) | 4,305 | |||||||
| Closing balance | (117,766) | (109,038) | (32,765) | (35,832) | ||||
| 25 |
| (CONVENIENCE TRANSLATION INTO ENGLISH FROM THE ORIGINAL PREVIOUSLY ISSUED IN PORTUGUESE) | ||
| Quarterly Financial Information - March 31, 2021 – CIA SIDERURGICA NACIONAL | Version: 1 | |
| 8. | RECOVERABLE TAXES |
| Consolidated | Parent Company | ||||||
| 03/31/2021 | 12/31/2020 | 03/31/2021 | 12/31/2020 | ||||
| State Value-Added Tax | 994,783 | 1,002,926 | 808,848 | 822,717 | |||
| Brazilian federal contributions (1) | 1,053,486 | 1,417,081 | 831,648 | 1,192,919 | |||
| Other taxes | 97,623 | 123,939 | 82,015 | 104,648 | |||
| 2,145,892 | 2,543,946 | 1,722,511 | 2,120,284 | ||||
| Classified: | |||||||
| Current | 1,199,100 | 1,605,494 | 959,735 | 1,381,853 | |||
| Non-current | 946,792 | 938,452 | 762,776 | 738,431 | |||
| 2,145,892 | 2,543,946 | 1,722,511 | 2,120,284 | ||||
| 1. | Refers mainly to PIS / COFINS (VAT Federal) to be compensated against future payment of the contributions. In respect to PIS and COFINS to be recoverable on September 20, 2018, the writ of mandamus and special appeal filed in 2006, in which CSN and the Federal Union are parties, related to the discussion about the non-inclusion of ICMS in the PIS and COFINS calculation basis, was judged in final court decision, confirmed the right of CSN to offset the amounts unduly paid as a result of the PIS and COFINS base being increased by the inclusion of ICMS in the period from 2001 to 2014. |
| 9. | OTHER CURRENT AND NON-CURRENT ASSETS |
| Consolidated | Parent Company | ||||||||||||||
| Current | Non-current | Current | Non-current | ||||||||||||
| 03/31/2021 | 12/31/2020 | 03/31/2021 | 12/31/2020 | 03/31/2021 | 12/31/2020 | 03/31/2021 | 12/31/2020 | ||||||||
| Judicial deposits (note 19) | 338,890 | 325,117 | 224,675 | 221,016 | |||||||||||
| Prepaid expenses | 157,499 | 136,527 | 107,694 | 115,636 | 116,588 | 94,782 | 91,568 | 98,031 | |||||||
| Prepaid expenses with sea freight (1) | 109,325 | 74,500 | |||||||||||||
| Actuarial asset (note 21 a) | 13,819 | 13,819 | 1,803 | ||||||||||||
| Derivative financial instruments (note 14 I) | 39,236 | ||||||||||||||
| Securities held for trading (note 14 I) | 14,977 | 5,065 | 14,854 | 4,927 | |||||||||||
| Loans with related parties (nota 14 I and 21 a) | 1,043,182 | 966,050 | 59,900 | 53,718 | 1,097,432 | 1,007,677 | |||||||||
| Other receivables from related parties (note 21 a) | 5,176 | 6,242 | 664,598 | 664,020 | 19,705 | 5,717 | 922,468 | 900,200 | |||||||
| Other receivables (note 14 I) | 2,445 | 2,445 | 1,003 | 1,003 | |||||||||||
| Eletrobrás compulsory loan (note 14 I) (2) | 851,485 | 852,532 | 850,714 | 851,713 | |||||||||||
| Dividends receivables (note 21 a) | 38,086 | 38,088 | 28,156 | 329,413 | |||||||||||
| Employee debts | 50,244 | 28,054 | 34,965 | 16,600 | |||||||||||
| Receivables by indemnity (3) | 521,611 | 517,183 | 521,611 | 517,183 | |||||||||||
| Others | 74,639 | 79,338 | 146,205 | 146,245 | 497 | 419 | 146,204 | 146,244 | |||||||
| 489,182 | 367,814 | 3,689,929 | 3,603,047 | 274,665 | 505,576 | 3,855,675 | 3,744,870 | ||||||||
| 1. | Refers to payment of freight expenses and maritime insurance over performance obligations unfulfilled at the balance sheet date. |
| 2. | This is a certain and due amount, arising from the res judicata favorable decision to the Company, which is irreversible and irrevocable, in order to apply the STJ's consolidated position on the subject, which culminated in the conviction of Eletrobrás to the payment of the correct interest and monetary adjustment of the Compulsory Loan. The res judicata decision, as well as the certainty about the amounts involved in the liquidation of the sentence (judicial procedure to request the satisfaction of the right), allowed the conclusion that the entry of this value is certain. In addition to this amount already recorded, the Company continues to seek alternatives for the recovery of additional credits and the estimate can reach an amount greater than R$350 million. |
| 3. | This is a net, certain and enforceable amount, resulting from the final and unappealable decision of the Court in favor of the Company, due to losses and damages resulting from the sinking of the voltage in the supply of energy in the periods from January / 1991 to June / 2002. |
| 10. | BASIS OF CONSOLIDATION AND INVESTMENTS |
The information related to the activities of our joint-ventures, joint-operations, affiliated and other investments did not present changes in relation to that disclosed in the Company’s financial statements as of December 31, 2020. Accordingly, the management opted for not repeating the information in this condensed interim financial information as of March 31, 2021.
The significant events related to our subsidiaries CSN Cimentos S.A. and CSN Mineração S.A are disclosed in the Notes 10.c and 10.d, respectively.
| 26 |
| (CONVENIENCE TRANSLATION INTO ENGLISH FROM THE ORIGINAL PREVIOUSLY ISSUED IN PORTUGUESE) | ||
| Quarterly Financial Information - March 31, 2021 – CIA SIDERURGICA NACIONAL | Version: 1 | |
The consolidated financial statements for the years ended Mach 31, 2021 and 2020 include the following direct and indirect subsidiaries, joint ventures and joint operations, as well as the exclusive funds, as follows:
| Number of shares held by CSN in units | Equity interests (%) | |||||
| Companies | 03/31/2021 | 12/31/2020 | Core business | |||
| Direct interest in subsidiaries: full consolidation | ||||||
| CSN Islands VII Corp. | 20,001,000 | 100.00 | 100.00 | Financial transactions | ||
| CSN Inova Ventures | 50,000 | 100.00 | 100.00 | Financial transactions | ||
| CSN Islands XII Corp. | 1,540 | 100.00 | 100.00 | Financial transactions | ||
| CSN Steel S.L.U. | 22,042,688 | 100.00 | 100.00 | Equity interests and Financial transactions | ||
| TdBB S.A (*) | 100.00 | 100.00 | Equity interests | |||
| Sepetiba Tecon S.A. | 254,015,052 | 99.99 | 99.99 | Port services | ||
| Minérios Nacional S.A. | 141,719,295 | 99.99 | 99.99 | Mining and Equity interests | ||
| Companhia Florestal do Brasil | 66,354,391 | 99.99 | 99.99 | Reforestation | ||
| Estanho de Rondônia S.A. | 195,454,162 | 99.99 | 99.99 | Tin Mining | ||
| Companhia Metalúrgica Prada | 555,142,354 | 99.99 | 99.99 | Manufacture of containers and distribution of steel products | ||
| CSN Mineração S.A. (1) | 4,374,779,493 | 78.24 | 87.52 | Mining | ||
| CSN Energia S.A. | 43,149 | 99.99 | 99.99 | Sale of electric power | ||
| FTL - Ferrovia Transnordestina Logística S.A. (2) | 510,726,198 | 92.71 | 92.38 | Railroad logistics | ||
| Nordeste Logística S.A. | 99,999 | 99.99 | 99.99 | Port services | ||
| CSN Inova Ltd. | 10,000 | 100.00 | 100.00 | Advisory and implementation of new development projec | ||
| CBSI - Companhia Brasileira de Serviços de Infraestrutura | 4,669,986 | 99.99 | 99.99 | Equity interests and product sales and iron ore | ||
| CSN Cimentos S.A. (3) | 2,956,094,581 | 99.99 | 90.00 | Manufacturing and sale of cement | ||
| Indirect interest in subsidiaries: full consolidation | ||||||
| Lusosider Projectos Siderúrgicos S.A. | 100.00 | 100.00 | Equity interests and product sales | |||
| Lusosider Aços Planos, S. A. | 99.99 | 99.99 | Steel and Equity interests | |||
| CSN Resources S.A. | 100.00 | 100.00 | Financial transactions and Equity interests | |||
| Companhia Brasileira de Latas | 99.99 | 99.99 | Sale of cans and containers in general and Equity interests | |||
| Companhia de Embalagens Metálicas MMSA | 99.67 | 99.67 | Production and sale of cans and related activities | |||
| Companhia de Embalagens Metálicas - MTM | 99.67 | 99.67 | Production and sale of cans and related activities | |||
| CSN Steel Holdings 1, S.L.U. | 100.00 | 100.00 | Financial transactions, product sales and Equity interests | |||
| CSN Productos Siderúrgicos S.L. | 100.00 | 100.00 | Financial transactions, product sales and Equity interests | |||
| Stalhwerk Thüringen GmbH | 100.00 | 100.00 | Production and sale of long steel and related activities | |||
| CSN Steel Sections Polska Sp.Z.o.o | 100.00 | 100.00 | Financial transactions, product sales and Equity interests | |||
| CSN Mining Holding, S.L | 78.24 | 87.52 | Financial transactions, product sales and Equity interests | |||
| CSN Mining GmbH | 78.24 | 87.52 | Financial transactions, product sales and Equity interests | |||
| CSN Mining Asia Limited | 78.24 | 87.52 | Commercial representation | |||
| Lusosider Ibérica S.A. | 100.00 | 100.00 | Steel, commercial and industrial activities and equity interests | |||
| CSN Mining Portugal, Unipessoal Lda. | 78.24 | 87.52 | Commercial and representation of products | |||
| Companhia Siderúrgica Nacional, LLC | 100.00 | 100.00 | Import and distribution/resale of products | |||
| CSN Cimentos S.A. (3) | - | 10.00 | Manufacturing and sale of cement | |||
| Direct interest in joint operations: proportionate consolidation | ||||||
| Itá Energética S.A. | 253,606,846 | 48.75 | 48.75 | Electric power generation | ||
| Consórcio da Usina Hidrelétrica de Igarapava | 17.92 | 17.92 | Electric power consortium | |||
| Direct interest in joint ventures: equity method | ||||||
| MRS Logística S.A. (4) | 63,377,198 | 18.64 | 18.64 | Railroad transportation | ||
| Aceros Del Orinoco S.A. | 31.82 | 31.82 | Dormant company | |||
| Transnordestina Logística S.A. (5) | 24,670,093 | 47.26 | 47.26 | Railroad logistics | ||
| Equimac S.A | 1,117 | 50.00 | 50.00 | Rental of commercial and industrial machinery and equipment | ||
| Indirect interest in joint ventures: equity method | ||||||
| MRS Logística S.A. (4) | 14.58 | 16.30 | Railroad transportation | |||
| Direct interest in associates: equity method | ||||||
| Arvedi Metalfer do Brasil S.A. | 49,074,882 | 20.00 | 20.00 | Metallurgy and Equity interests | ||
| Exclusive funds: full consolidation | ||||||
| Diplic II - Fundo de investimento multimercado crédito privado | 100.00 | 100.00 | Investment fund | |||
| Caixa Vértice - Fundo de investimento multimercado crédito privado | 100.00 | 100.00 | Investment fund | |||
| VR1 - Fundo de investimento multimercado crédito privado | 100.00 | 100.00 | Investment fund | |||
(*) Dormant companies.
| 1. | As of December 31, 2020, CSN held 158,419,480 shares of CSN Mineração S.A.. On February 17, 2021, it occurred a stock split of the shares, at a ratio of 1:30, by which the number of shares held by CSN changes to 4,752,584,400 shares. Subsequently, upon the public offering of the shares of CSN Mineração, CSN’s interest was diluted and the number of shares after the split changed to 4,374,779,493 shares. |
| 2. | As of December 31,2020, the Company had 486.592.830 common shares in FTL - Ferrovia Transnordestina Logística S.A. |
| 3. | As of December 31, 2020, CSN held 90 shares of CSN Cimentos S.A. On January 31, 2021, CSN subscribed capital in CSN Cimentos S.A., which was paid-up by transfer of assets and liabilities related to the operations of cement in CSN. Consequently, the number of shares held by CSN increased (see Note 10.c). |
| 4. | As of March 31, 2021 and December 31, 2020 the Company directly held 63,377,198 shares, of which 26,611,282 common and 36,765,916 preferred, and its direct subsidiary, CSN Mineração S.A., held 63,338,872, of which 25,802,872 common shares and 37,536,000 preferred, of MRS Logística S.A. |
| 5. | As of December 31, 2020, the Company had 24,168,304 common shares and 501,789 Class B preferred shares. |
| 27 |
| (CONVENIENCE TRANSLATION INTO ENGLISH FROM THE ORIGINAL PREVIOUSLY ISSUED IN PORTUGUESE) | ||
| Quarterly Financial Information - March 31, 2021 – CIA SIDERURGICA NACIONAL | Version: 1 | |
| 10.a) | Investments in joint ventures, joint operations, associates and other investments |
The number of shares, the balances of assets and liabilities, shareholders’ equity and the profit / (loss) amounts for the period in those investees are as follows:
| 03/31/2021 | 03/31/2020 | |||||||||||||||
| Companies | Participation in | Participation in | ||||||||||||||
| Assets | Liabilities | Shareholders’ equity | Profit /(Loss) for the period | Assets | Liabilities | Shareholders’ equity | Profit /(Loss) for the period | |||||||||
| Investments under the equity method | ||||||||||||||||
| Subsidiaries | ||||||||||||||||
| CSN Islands VII Corp. | 531,764 | 3,289,139 | (2,757,375) | (258,952) | 481,327 | 2,979,749 | (2,498,422) | (574,487) | ||||||||
| CSN Inova Ventures | 9,591,849 | 10,519,332 | (927,483) | (217,757) | 9,534,299 | 10,244,025 | (709,726) | (143,621) | ||||||||
| CSN Islands XII Corp. | 2,637,854 | 5,705,057 | (3,067,203) | (360,600) | 2,497,173 | 5,203,776 | (2,706,603) | (617,535) | ||||||||
| CSN Steel S.L.U. | 4,847,452 | 25,551 | 4,821,901 | 241,834 | 4,522,589 | 28,642 | 4,493,947 | 452,147 | ||||||||
| Sepetiba Tecon S.A. | 748,723 | 444,770 | 303,953 | 4,461 | 731,294 | 431,801 | 299,493 | 2,823 | ||||||||
| Minérios Nacional S.A. | 352,364 | 163,139 | 189,225 | 48,955 | 292,708 | 152,438 | 140,270 | 3,268 | ||||||||
| Valor Justo - Minérios Nacional S.A. | - | - | 2,123,507 | - | - | - | 2,123,507 | - | ||||||||
| Estanho de Rondônia S.A. | 103,888 | 138,146 | (34,258) | (6,147) | 103,484 | 131,596 | (28,112) | (6,620) | ||||||||
| Companhia Metalúrgica Prada | 817,938 | 621,588 | 196,350 | 49,874 | 750,130 | 603,654 | 146,476 | (14,630) | ||||||||
| CSN Mineração S.A. | 17,053,347 | 6,690,346 | 10,363,001 | 1,896,260 | 17,166,329 | 7,887,964 | 9,278,992 | 351,181 | ||||||||
| CSN Energia S.A. | 118,641 | 72,004 | 46,637 | (286) | 130,642 | 83,718 | 46,924 | 202 | ||||||||
| FTL - Ferrovia Transnordestina Logística S.A. | 467,350 | 254,292 | 213,058 | (15,215) | 471,952 | 254,510 | 217,442 | (13,272) | ||||||||
| Companhia Florestal do Brasil | 51,872 | 3,106 | 48,766 | (781) | 52,073 | 2,526 | 49,547 | (384) | ||||||||
| Nordeste Logística S.A. | 69 | 59 | 10 | (4) | 69 | 55 | 14 | (4) | ||||||||
| CBSI - Companhia Brasileira de Serviços de Infraestrutura | 115,157 | 90,961 | 24,196 | 3,874 | 118,553 | 98,231 | 20,322 | (2,778) | ||||||||
| Ágio - CBSI - Companhia Brasileira de Serviços de Infraestrutura | - | - | 15,225 | - | - | - | 15,225 | - | ||||||||
| CSN Cimentos S.A. | 3,512,433 | 478,600 | 3,033,833 | 48,611 | - | - | - | - | ||||||||
| 40,950,701 | 28,496,090 | 14,593,343 | 1,434,127 | 36,852,622 | 28,102,685 | 10,889,296 | (563,710) | |||||||||
| Joint-venture and Joint-operation | ||||||||||||||||
| Itá Energética S.A. | 280,203 | 21,474 | 258,729 | 7,647 | 268,447 | 17,365 | 251,082 | 2,905 | ||||||||
| MRS Logística S.A. | 1,974,636 | 1,156,665 | 817,971 | 14,072 | 2,088,151 | 1,284,265 | 803,886 | (17,061) | ||||||||
| Transnordestina Logística S.A. | 4,717,847 | 3,562,305 | 1,155,542 | (4,562) | 4,657,691 | 3,497,587 | 1,160,104 | (6,334) | ||||||||
| Fair Value (*) - Transnordestina | - | - | 271,116 | - | - | - | 271,116 | - | ||||||||
| Equimac S.A | 7,553 | 413 | 7,140 | (96) | 7,536 | 301 | 7,235 | - | ||||||||
| 6,980,239 | 4,740,857 | 2,510,498 | 17,061 | 7,021,825 | 4,799,518 | 2,493,423 | (20,490) | |||||||||
| Associates | ||||||||||||||||
| Arvedi Metalfer do Brasil S.A. | 40,088 | 32,160 | 7,928 | (110) | 40,528 | 32,490 | 8,038 | (712) | ||||||||
| 40,088 | 32,160 | 7,928 | (110) | 40,528 | 32,490 | 8,038 | (712) | |||||||||
| Classified at fair value through profit or loss (note 14 II) | ||||||||||||||||
| Panatlântica | 90,883 | 59,879 | ||||||||||||||
| 90,883 | 59,879 | |||||||||||||||
| Other investments | ||||||||||||||||
| Profits on subsidiaries' inventories | (116,714) | (61,171) | (55,543) | (5,588) | ||||||||||||
| Investment property | 144,398 | - | 144,999 | - | ||||||||||||
| Others | 63,536 | (4) | 63,538 | (190) | ||||||||||||
| 91,220 | (61,175) | 152,994 | (5,778) | |||||||||||||
| Total investments | 17,293,872 | 1,389,903 | 13,603,630 | (590,690) | ||||||||||||
| Classification of investments in the balance sheet | ||||||||||||||||
| Investments in assets | 23,935,793 | 19,401,494 | ||||||||||||||
| Investments with negative equity | (6,786,319) | (5,942,863) | ||||||||||||||
| Investment property | 144,398 | 144,999 | ||||||||||||||
| 17,293,872 | 13,603,630 | |||||||||||||||
(*) As of March 31, 2021 and December 31, 2020, the net balance of R$271,116 refers to the Fair Value generated by the loss of control of Transnordestina Logística SA in the amount of R$659,105 and impairment of R$387,989.
| 28 |
| (CONVENIENCE TRANSLATION INTO ENGLISH FROM THE ORIGINAL PREVIOUSLY ISSUED IN PORTUGUESE) | ||
| Quarterly Financial Information - March 31, 2021 – CIA SIDERURGICA NACIONAL | Version: 1 | |
| 10.b) | Changes in investments in subsidiaries, jointly controlled companies, joint operations, associates and other investments |
| Consolidated | Parent Company | ||||||
| 03/31/2021 | 12/31/2020 | 03/31/2021 | 12/31/2020 | ||||
| Opening balance of investments (assets) | 3,535,906 | 3,482,974 | 19,401,494 | 17,316,463 | |||
| Opening balance of loss provisions (liabilities) | (5,942,863) | (3,908,563) | |||||
| Total | 3,535,906 | 3,482,974 | 13,458,631 | 13,407,900 | |||
| Capital increase/acquisition of shares (1) | 3,400 | 2,996,083 | 60,361 | ||||
| Dividends (2) | (82,642) | (934,934) | (2,496,422) | ||||
| Comprehensive income (3) | 31 | 6,895 | 84,757 | 581,514 | |||
| Update of shares measured at fair value through profit or loss (Note 14 II) | 31,004 | 12,579 | 31,004 | 12,579 | |||
| Sales of equity interest (note 10.d) (4) | (692,115) | ||||||
| Net gain due to increased capital and issued new shares in n investments (note 10.d) (5) | 816,176 | ||||||
| Equity in results of affiliated companies (6) | 23,368 | 124,324 | 1,389,903 | 1,892,686 | |||
| Amortization of fair value - investment MRS | (2,937) | (11,747) | |||||
| Others | 25 | 123 | (31) | 13 | |||
| Closing balance of investments (assets) | 3,587,397 | 3,535,906 | 23,935,793 | 19,401,494 | |||
| Balance of provision for investments with negative equity (liabilities) | (6,786,319) | (5,942,863) | |||||
| Total | 3,587,397 | 3,535,906 | 17,149,474 | 13,458,631 | |||
| 1. | In January 2021 there was an increase in capital of our subsidiary CSN Cimentos by CSN transfer of net assets (see Note 10.c). |
| 2. | In 2021, it mainly refers to dividends of the subsidiary CSN Mineração SA in the amount of R$934,934 (R$2,437,482 on December 31, 2020). |
| 3. | Refers to translation to the reporting currency of the foreign investments of which functional currency is not the Brazilian Reais, actuarial gain/loss and gain/loss on investment hedge from investments accounted for under the equity method. |
| 4. | Refers to the cost of the shares sold in the Initial Public Offering of the subsidiary CSN Mineração S.A. (see Note 10.d) |
| 5. | Refers to the gain in the sale of shares in the Initial Public Offering of the subsidiary CSN Mineração S.A., after the issuance of the shares in the amount of R$816,176. |
| 6. | The table below shows the reconciliation of the equity in results of affiliated companies classified as joint venture and associates and the amount disclosed in the income statement and it is due to the elimination of the results of the CSN´s transactions with these companies. |
| Consolidated | |||
| 03/31/2021 | 03/31/2020 | ||
| Equity in results of affiliated companies | |||
| MRS Logística S.A. | 28,136 | (34,113) | |
| Transnordestina Logística S.A. | (4,562) | (6,334) | |
| Arvedi Metalfer do Brasil S.A. | (110) | (712) | |
| Equimac S.A. | (96) | ||
| 23,368 | (41,159) | ||
| Eliminations | |||
| To cost of sales | (10,576) | (1,243) | |
| To taxes | 3,596 | 423 | |
| Others | |||
| Amortizated at fair value - Investment in MRS | (2,937) | (2,937) | |
| Others | (6) | (192) | |
| Equity in results | 13,445 | (45,108) | |
| 10.c) | Drop down - Cement |
Our cement operations began in May 2009 with a crushing unit in Volta Redonda/RJ, motivated by the sinergy between that activity and the generation of slag produced in our blast furnaces in the Presidente Vargas steel plant (“UPV”), a material used as raw material in the production of cement. Located within the UPV premises, in Volta Redonda/RJ, that business unit has an annual capacity of 2.4 million tons of cement type CP-III.
| 29 |
| (CONVENIENCE TRANSLATION INTO ENGLISH FROM THE ORIGINAL PREVIOUSLY ISSUED IN PORTUGUESE) | ||
| Quarterly Financial Information - March 31, 2021 – CIA SIDERURGICA NACIONAL | Version: 1 | |
In 2011, our self-production of clinker was initiated after the installation of a furnace in Arcos/MG, with a daily capacity of 2,500 tons, using calcitic limestone extracted in the Bocaina mine, existing in the same location that also supplies steel limestone to UPV. The clinker produced is prioritarily cargoed by rail to our cement plant in Volta Redonda/RJ.
In 2015, the unit in Arcos/MG stared its production of cement with the installation of two vertical crushers with an annual capacity of 2.3 million tons, rising our annual installed capacity to 4.7 million tons. In 2016 a second production line of clinker was assembled, with a furnace for 6,500 tons per day reaching full independence for clinker in the production of cement.
The production in Arcos is primarily of cement type CP-II, basically composed of clinker, slag, limestone and plaster, and the composition of those materials varies depending on the final product intendend. Also, in Arcos, there is extraction of limestone and dolomite destined to UPV.
The cement activities were held by the parent company and, recently, the Company decided to drop down the net assets of cement to a subsidiary named CSN Cimentos. The drop down occurred on January 31, 2021 by an increase in capital of R$2,956,094, upon issuance of 2,956,094,491 common shares, subscribed and paid-up at the same date by CSN through the transfer of net assets related to the cement activities, as detailed described in the Valuation Report approved in the Extraordinary General Meeting.
Find below the breakdown of the net assets contributed:
| 12/31/2020 | 01/31/2021 | |||
| Assets | appraisal reports | Close balance | ||
| Trade receivables | 37,171 | 54,684 | ||
| Inventories | 134,309 | 164,460 | ||
| Other assets | 29,186 | 30,228 | ||
| Property, plant and equipment | 3,151,349 | 3,129,161 | ||
| Intangíible assets | 8,086 | 8,086 | ||
| Liabilities | ||||
| Trade payables | (253,186) | (278,539) | ||
| Other payables current | (42,074) | (34,301) | ||
| Lease liabilities | (42,257) | (24,430) | ||
| Other provisions | (66,490) | (64,125) | ||
| Net assets | 2,956,094 | 2,985,225 |
| 10.d) | Initial Public Offering of the subsidiary CSN Mineração |
On February 17, 2021, the subsidiary CSN Mineração concluded its initial public offering at B3 – Brasil, Bolsa, Balcão. The final prospectus of the public offering consisted of: (i) primary distribution of 161,189,078 shares (“Primary Offering”); and (ii) secondary distribution of 422,961,066 shares, being initially 372,749,743 shares (“Secondary Offering”), increased by 50,211,323 supplementary shares held by CSN (“Supplementary Shares”).
The price per share (“Price per Share”) was fixed at R$8.50 after the collection of intention of investments collected from institutional buyers in Brasil and abroad.
Upon conclusion of the offering, the Company’s interest in the subsidiary CSN Mineração changed from 87.52% to 78.24%.
| · | Primary Distribution of Shares |
Upon the primary distribution, CSN Mineração issued 161,189,078 shares (“Primary Offering”) and capitalized the total amount of R$1,370,107 (R$1,347,862, net of transaction costs).
| 30 |
| (CONVENIENCE TRANSLATION INTO ENGLISH FROM THE ORIGINAL PREVIOUSLY ISSUED IN PORTUGUESE) | ||
| Quarterly Financial Information - March 31, 2021 – CIA SIDERURGICA NACIONAL | Version: 1 | |
The issuance of 161,189,078 shares diluted the Company’s interest in the capital of CSN Mineração and, accordingly, the Company recognized in other comprehensive income a gain from the change of ownership percentage.
The impact of the transaction is presented below:
| Gain on participation in the capital increase | 1,054,613 |
| Loss due to dilution of participation with issue of new shares | (231,044) |
| Equity adjustment by dilution of share percentage | (7,393) |
| Net gain from the transaction | 816,176 |
| · | Secondary Distribution of Shares |
Upon the secondary distribution of shares, the Company sold 327,593,584 common shares and, additionally, in March 2021 sold supplementary 50,211,323 common shares, totaling 377,804,907 or 9.3% of shares previously held, in the total amount of R$3,211,342 (R$3,164,612, net of transaction costs). The gain for the sale was recognized as Other Operating Income.
The main impacts of the transaction are presented as follows:
| Equity in the transaction | 9,947,525 | |
| Number of share before initial public offering | 5,430,057,060 | |
| Cost per share | R$ 1.83 | |
| Number of shares sold by CSN | 377,804,907 | |
| Price per share | R$ 8.50 | |
| (+) Net cash generated in the transaction | 3,211,342 | |
| (-) Transaction cost | ��(46,730) | |
| (=) net cahs reveivable (a) | 3,164,612 | |
| (-) Cost of shares (b) | (692,115) | |
| (=) Net gain from the transaction (a)+(b) | 2,472,497 |
| 10.e) | Joint ventures and joint operations financial information |
The balance sheet and income statement balances of the companies whose control is shared are shown below and refer to 100% of the companies’ results:
| 31 |
| (CONVENIENCE TRANSLATION INTO ENGLISH FROM THE ORIGINAL PREVIOUSLY ISSUED IN PORTUGUESE) | ||
| Quarterly Financial Information - March 31, 2021 – CIA SIDERURGICA NACIONAL | Version: 1 | |
| 03/31/2021 | 12/31/2020 | |||||||||||||||
| Joint-Venture | Joint-Operation | Joint-Venture | Joint-Operation | |||||||||||||
| Equity interest (%) | MRS Logística | Transnordestina Logística | Equimac S.A. | Itá Energética | MRS Logística | Transnordestina Logística | Equimac S.A. | Itá Energética | ||||||||
| 33.22% | 47.26% | 50.00% | 48.75% | 34.94% | 47.26% | 50.00% | 48.75% | |||||||||
| Balance sheet | ||||||||||||||||
| Current Assets | ||||||||||||||||
| Cash and cash equivalents | 951,179 | 905 | 1,088 | 79,431 | 1,206,484 | 1,390 | 1,351 | 48,919 | ||||||||
| Advances to suppliers | 27,997 | 1,830 | 595 | 27,312 | 1,948 | 742 | ||||||||||
| Other current assets | 488,141 | 52,095 | 2,975 | 90,395 | 823,204 | 51,793 | 2,356 | 89,521 | ||||||||
| Total current assets | 1,467,317 | 54,830 | 4,063 | 170,421 | 2,057,000 | 55,131 | 3,707 | 139,182 | ||||||||
| Noncurrent Assets | ||||||||||||||||
| Other non-current assets | 648,302 | 224,273 | 20,592 | 608,878 | 225,492 | 20,807 | ||||||||||
| Investments, PP&E and intangible assets | 8,478,265 | 9,703,392 | 11,043 | 383,763 | 8,537,009 | 9,574,588 | 11,365 | 390,672 | ||||||||
| Total non-current assets | 9,126,567 | 9,927,665 | 11,043 | 404,355 | 9,145,887 | 9,800,080 | 11,365 | 411,479 | ||||||||
| Total Assets | 10,593,884 | 9,982,495 | 15,106 | 574,776 | 11,202,887 | 9,855,211 | 15,072 | 550,661 | ||||||||
| Current Liabilities | ||||||||||||||||
| Borrowings and financing | 806,745 | 247,212 | 828,439 | 241,029 | ||||||||||||
| Lease liabilities | 304,093 | 317,526 | ||||||||||||||
| Other current liabilities | 688,575 | 129,993 | 826 | 27,312 | 1,117,975 | 125,794 | 602 | 19,721 | ||||||||
| Total current liabilities | 1,799,413 | 377,205 | 826 | 27,312 | 2,263,940 | 366,823 | 602 | 19,721 | ||||||||
| Noncurrent Liabilities | ||||||||||||||||
| Borrowings and financing | 1,951,084 | 6,494,594 | 2,162,657 | 6,368,070 | ||||||||||||
| Lease liabilities | 1,649,300 | 1,674,594 | ||||||||||||||
| Other non-current liabilities | 805,690 | 665,683 | 16,738 | 788,862 | 665,653 | 15,900 | ||||||||||
| Total non-current liabilities | 4,406,074 | 7,160,277 | 16,738 | 4,626,113 | 7,033,723 | 15,900 | ||||||||||
| Shareholders’ equity | 4,388,397 | 2,445,013 | 14,280 | 530,726 | 4,312,834 | 2,454,665 | 14,470 | 515,040 | ||||||||
| Total liabilities and shareholders’ equity | 10,593,884 | 9,982,495 | 15,106 | 574,776 | 11,202,887 | 9,855,211 | 15,072 | 550,661 | ||||||||
| 01/01/2021 a 03/31/2021 | 01/01/2020 a 03/31/2020 | |||||||||||||
| Joint-Venture | Joint-Operation | Joint-Venture | Joint-Operation | |||||||||||
| Equity interest (%) | MRS Logística | Transnordestina Logística | Equimac S.A. | Itá Energética | MRS Logística | Transnordestina Logística | Itá Energética | |||||||
| 33.22% | 47.26% | 50.00% | 48.75% | 34.94% | 47.26% | 48.75% | ||||||||
| Statements of Income | ||||||||||||||
| Net revenue | 965,022 | 143 | 1,107 | 59,470 | 674,725 | 40,991 | ||||||||
| Cost of sales and services | (661,441) | (1,092) | (18,749) | (624,148) | (15,659) | |||||||||
| Gross profit | 303,581 | 143 | 15 | 40,721 | 50,577 | - | 25,332 | |||||||
| Operating (expenses) income | (88,723) | (4,617) | (204) | (16,237) | (72,015) | (8,065) | (16,639) | |||||||
| Financial income (expenses), net | (97,514) | (5,178) | (1) | (699) | (111,614) | (5,337) | 330 | |||||||
| Income before income tax and social contribution | 117,344 | (9,652) | (190) | 23,785 | (133,052) | (13,402) | 9,023 | |||||||
| Current and deferred income tax and social contribution | (41,850) | (1) | (8,099) | 41,521 | (3,064) | |||||||||
| Profit / (loss) for the period | 75,494 | (9,652) | (191) | 15,686 | (91,531) | (13,402) | 5,959 | |||||||
| 10.f) | TRANSNORDESTINA LOGÍSTICA SA (“TLSA”) |
It is in the pre-operational phase and should remain so until the completion of Mesh II. The approved schedule, which provided for the completion of the work for January 2017, is currently under discussion with the responsible bodies. Its Management understands that new deadlines for the completion of the project will not substantially negatively imply the expected return on investment.
Management relies on resources from its shareholders and third parties to complete the work, which it expects to be available, based on previously concluded agreements and recent discussions between the parties involved. After evaluating this matter, The Management concluded that the use of the project’s business continuity accounting basis in the preparation of the interim financial information, was considered appropriate.
The assumptions used to evaluate the impairment test in December 2020 remain valid and there is no event to justify the recognition of impairment in the quarter.
| 10.g) | Investment properties: |
The balance of investment properties as of March 31, 2021 is shown below:
| 32 |
| (CONVENIENCE TRANSLATION INTO ENGLISH FROM THE ORIGINAL PREVIOUSLY ISSUED IN PORTUGUESE) | ||
| Quarterly Financial Information - March 31, 2021 – CIA SIDERURGICA NACIONAL | Version: 1 | |
| Consolidated | Parent Company | |||||||||||
| Land | Buildings | Total | Land | Buildings | Total | |||||||
| Balance at December 31, 2020 | 97,610 | 62,264 | 159,874 | 94,431 | 50,568 | 144,999 | ||||||
| Cost | 97,610 | 86,548 | 184,158 | 94,431 | 74,260 | 168,691 | ||||||
| Accumulated depreciation | (24,284) | (24,284) | (23,692) | (23,692) | ||||||||
| Balance at December 31, 2020 | 97,610 | 62,264 | 159,874 | 94,431 | 50,568 | 144,999 | ||||||
| Depreciation | (764) | (764) | (601) | (601) | ||||||||
| Balance at March 31, 2021 | 97,610 | 61,500 | 159,110 | 94,431 | 49,967 | 144,398 | ||||||
| Cost | 97,610 | 86,548 | 184,158 | 94,431 | 74,261 | 168,692 | ||||||
| Accumulated depreciation | (25,048) | (25,048) | (24,294) | (24,294) | ||||||||
| Balance at March 31, 2021 | 97,610 | 61,500 | 159,110 | 94,431 | 49,967 | 144,398 | ||||||
The Company’s estimate of the fair value of investment properties was of R$1,863,563 at March 31, 2021 and December 31, 2020) in the consolidated and R$1,795,553 at the parent company.
The average estimated useful lives for the periods are as follows (in years):
| Consolidated | Parent Company | ||||||
| 03/31/2021 | 12/31/2020 | 03/31/2021 | 12/31/2020 | ||||
| Buildings | 27 | 27 | 28 | 28 | |||
| 11. | PROPERTY, PLANT AND EQUIPMENT |
| Consolidated | |||||||||||||||
| Land | Buildings and Infrastructure | Machinery, equipment and facilities | Furniture and fixtures | Construction in progress | Right of use (i) | Other (*) | Total | ||||||||
| Balance at December 31, 2020 | 257,686 | 2,677,565 | 12,457,383 | 26,297 | 3,680,322 | 516,668 | 100,302 | 19,716,223 | |||||||
| Cost | 257,686 | 4,752,412 | 26,213,225 | 182,974 | 3,680,322 | 634,786 | 414,705 | 36,136,110 | |||||||
| Accumulated depreciation | (2,074,847) | (13,755,842) | (156,677) | (118,118) | (314,403) | (16,419,887) | |||||||||
| Balance at December 31, 2020 | 257,686 | 2,677,565 | 12,457,383 | 26,297 | 3,680,322 | 516,668 | 100,302 | 19,716,223 | |||||||
| Effect of foreign exchange differences | 5,139 | 9,714 | 32,339 | 314 | 2,491 | 625 | 104 | 50,726 | |||||||
| Acquisitions | 52,019 | 621 | 357,359 | 55,549 | 151 | 465,699 | |||||||||
| Capitalized interest (1) (notes 26 and 29) | 15,133 | 15,133 | |||||||||||||
| Write-offs (note 25) | (31) | (2,286) | (38,017) | (130) | (40,464) | ||||||||||
| Depreciation (note 24) | (115) | (39,069) | (396,597) | (1,297) | (18,205) | (7,761) | (463,044) | ||||||||
| Transfers to other asset categories | 116 | 215 | 302,532 | 4 | (310,626) | 7,759 | |||||||||
| Right of use - Remesurement | 6,816 | 6,816 | |||||||||||||
| Others | (18) | 9,066 | (205) | 8,843 | |||||||||||
| Balance at March 31, 2021 | 262,826 | 2,648,425 | 12,447,627 | 25,939 | 3,751,459 | 523,436 | 100,220 | 19,759,932 | |||||||
| Cost | 262,826 | 4,776,117 | 26,690,241 | 185,343 | 3,751,459 | 646,755 | 423,359 | 36,736,100 | |||||||
| Accumulated depreciation | (2,127,692) | (14,242,614) | (159,404) | (123,319) | (323,139) | (16,976,168) | |||||||||
| Balance at March 31, 2021 | 262,826 | 2,648,425 | 12,447,627 | 25,939 | 3,751,459 | 523,436 | 100,220 | 19,759,932 | |||||||
| 33 |
| (CONVENIENCE TRANSLATION INTO ENGLISH FROM THE ORIGINAL PREVIOUSLY ISSUED IN PORTUGUESE) | ||
| Quarterly Financial Information - March 31, 2021 – CIA SIDERURGICA NACIONAL | Version: 1 | |
| Parent Company | ||||||||||||||||
| Land | Buildings and Infrastructure | Machinery, equipment and facilities | Furniture and fixtures | Construction in progress | Right of use (i) | Other (*) | Total | |||||||||
| Balance at December 31, 2020 | 28,953 | 1,014,542 | 7,519,472 | 8,397 | 1,652,468 | 64,659 | 27,233 | 10,315,724 | ||||||||
| Cost | 28,953 | 1,333,345 | 15,039,880 | 98,193 | 1,652,468 | 107,528 | 139,806 | 18,400,173 | ||||||||
| Accumulated depreciation | (318,803) | (7,520,408) | (89,796) | (42,869) | (112,573) | (8,084,449) | ||||||||||
| Balance at December 31, 2020 | 28,953 | 1,014,542 | 7,519,472 | 8,397 | 1,652,468 | 64,659 | 27,233 | 10,315,724 | ||||||||
| Acquisitions | 26,259 | 417 | 169,206 | 570 | 196,452 | |||||||||||
| Capitalized interest (1) (notes 26 and 29) | 6,864 | 6,864 | ||||||||||||||
| Write-offs (note 25) | (17,072) | (17,072) | ||||||||||||||
| Depreciation (note 24) | (5,499) | (188,997) | (440) | (2,997) | (1,506) | (199,439) | ||||||||||
| Drop down of Cements (note 10.c) | (3,350) | (720,068) | (1,643,144) | (687) | (733,706) | (23,697) | (4,509) | (3,129,161) | ||||||||
| Transfers to other asset categories | 153,739 | (153,844) | 105 | |||||||||||||
| Right of use - Remesurement | 306 | 306 | ||||||||||||||
| Balance at March 31, 2021 | 25,603 | 288,975 | 5,867,329 | 7,687 | 940,988 | 21,769 | 21,323 | 7,173,674 | ||||||||
| Cost | 25,603 | 492,390 | 12,905,513 | 94,392 | 940,988 | 36,728 | 125,892 | 14,621,506 | ||||||||
| Accumulated depreciation | (203,415) | (7,038,184) | (86,705) | (14,959) | (104,569) | (7,447,832) | ||||||||||
| Balance at March 31, 2021 | 25,603 | 288,975 | 5,867,329 | 7,687 | 940,988 | 21,769 | 21,323 | 7,173,674 | ||||||||
(*) Refer substantially to: i) in the consolidated picture: assets for railway use, such as yards, rails, mines and dormant;
(1) The cost of capitalized interest is calculated, basically, for Mining projects that substantially refer to the expansion of Casa de Pedra (MG) and TECAR (RJ) - see notes 26 and 29.
| (i) | Right of use |
Below the movements of the right of use recognized on March 31, 2021:
| Consolidated | |||||||||
| Land | Buildings and Infrastructure | Machinery, equipment and facilities | Others | Total | |||||
| Balance at December 31, 2020 | 393,015 | 66,086 | 51,946 | 5,621 | 516,668 | ||||
| Cost | 434,689 | 75,882 | 81,598 | 42,617 | 634,786 | ||||
| Accumulated depreciation | (41,674) | (9,796) | (29,652) | (36,996) | (118,118) | ||||
| Balance at December 31, 2020 | 393,015 | 66,086 | 51,946 | 5,621 | 516,668 | ||||
| Effect of foreign exchange differences | 129 | 412 | 84 | 625 | |||||
| Addition | 145 | 52,563 | 2,841 | 55,549 | |||||
| Remesurement | 395 | (896) | 7,317 | 6,816 | |||||
| Depreciation | (6,120) | (297) | (6,708) | (5,080) | (18,205) | ||||
| Write-offs | (16,940) | (20,944) | (133) | (38,017) | |||||
| Transfers to other asset categories | (7,882) | 7,474 | �� 408 | ||||||
| Balance at March 31, 2021 | 370,350 | 57,285 | 92,060 | 3,741 | 523,436 | ||||
| Cost | 417,838 | 75,261 | 120,669 | 32,987 | 646,755 | ||||
| Accumulated depreciation | (47,488) | (17,976) | (28,609) | (29,246) | (123,319) | ||||
| Balance at March 31, 2021 | 370,350 | 57,285 | 92,060 | 3,741 | 523,436 | ||||
| 34 |
| (CONVENIENCE TRANSLATION INTO ENGLISH FROM THE ORIGINAL PREVIOUSLY ISSUED IN PORTUGUESE) | ||
| Quarterly Financial Information - March 31, 2021 – CIA SIDERURGICA NACIONAL | Version: 1 | |
| Parent Company | ||||||||
| Land | Machinery, equipment and facilities | Others | Total | |||||
| Balance at December 31, 2020 | 21,081 | 42,082 | 1,496 | 64,659 | ||||
| Cost | 37,700 | 64,003 | 5,825 | 107,528 | ||||
| Accumulated depreciation | (16,619) | (21,921) | (4,329) | (42,869) | ||||
| Balance at December 31, 2020 | 21,081 | 42,082 | 1,496 | 64,659 | ||||
| Addition | 570 | 570 | ||||||
| Drop down of Cements (note 10.c) | (1,808) | (21,497) | (392) | (23,697) | ||||
| Remesurement | 306 | 306 | ||||||
| Depreciation | (1,709) | (951) | (337) | (2,997) | ||||
| Write-offs | (16,940) | (132) | (17,072) | |||||
| Transfers to other asset categories | 2,685 | (2,685) | ||||||
| Balance at March 31, 2021 | 3,615 | 16,949 | 1,205 | 21,769 | ||||
| Cost | 16,798 | 17,034 | 2,896 | 36,728 | ||||
| Accumulated depreciation | (13,183) | (85) | (1,691) | (14,959) | ||||
| Balance at March 31, 2021 | 3,615 | 16,949 | 1,205 | 21,769 | ||||
The average estimated useful lives for the periods are as follows (in years):
| Consolidated | Parent Company | ||||||
| 03/31/2021 | 12/31/2020 | 03/31/2021 | 12/31/2020 | ||||
| Buildings and Infrastructure(1) | 34 | 34 | 31 | 42 | |||
| Machinery, equipment and facilities | 20 | 20 | 22 | 21 | |||
| Furniture and fixtures | 12 | 12 | 13 | 13 | |||
| Others | 10 | 10 | 12 | 12 | |||
(1) In the Parent Company the reduction is due to the Drop down of the cement assets from CSN to CSN Cimentos S.A..
| 12. | INTANGIBLE ASSETS |
| Consolidated | Parent Company | ||||||||||||||||||
| Goodwill | Customer relationships | Software | Trademarks and patents | Rights and licenses (*) | Others | Total | Software | Rights and licenses | Total | ||||||||||
| Balance at December 31, 2020 | 3,606,156 | 278,041 | 45,665 | 215,532 | 3,169,349 | 2,051 | 7,316,794 | 40,236 | 8,086 | 48,322 | |||||||||
| Cost | 3,846,563 | 823,540 | 182,059 | 215,532 | 3,193,787 | 2,051 | 8,263,532 | 131,795 | 8,088 | 139,883 | |||||||||
| Accumulated amortization | (131,077) | (545,499) | (136,394) | (24,438) | (837,408) | (91,559) | (2) | (91,561) | |||||||||||
| Adjustment for accumulated recoverable value | (109,330) | (109,330) | |||||||||||||||||
| Balance at December 31, 2020 | 3,606,156 | 278,041 | 45,665 | 215,532 | 3,169,349 | 2,051 | 7,316,794 | 40,236 | 8,086 | 48,322 | |||||||||
| Effect of foreign exchange differences | 13,405 | 132 | 10,597 | 102 | 24,236 | ||||||||||||||
| Acquisitions and expenditures | 303 | 303 | |||||||||||||||||
| Drop down of Cements (note 10.c) | (8,086) | (8,086) | |||||||||||||||||
| Amortization (note 24) | (17,651) | (2,606) | (20,257) | (1,949) | (1,949) | ||||||||||||||
| Balance at March 31, 2021 | 3,606,156 | 273,795 | 43,494 | 226,129 | 3,169,349 | 2,153 | 7,321,076 | 38,287 | 38,287 | ||||||||||
| Cost | 3,846,563 | 863,963 | 172,007 | 226,129 | 3,193,787 | 2,153 | 8,304,602 | 131,795 | 131,795 | ||||||||||
| Accumulated amortization | (131,077) | (590,168) | (128,513) | (24,438) | (874,196) | (93,508) | (93,508) | ||||||||||||
| Adjustment for accumulated recoverable value | (109,330) | (109,330) | |||||||||||||||||
| Balance at March 31, 2021 | 3,606,156 | 273,795 | 43,494 | 226,129 | 3,169,349 | 2,153 | 7,321,076 | 38,287 | 38,287 | ||||||||||
(*) Composed mainly of mining rights. Amortization is based on production volume.
The average useful life by nature is as follows (in years):
| 35 |
| (CONVENIENCE TRANSLATION INTO ENGLISH FROM THE ORIGINAL PREVIOUSLY ISSUED IN PORTUGUESE) | ||
| Quarterly Financial Information - March 31, 2021 – CIA SIDERURGICA NACIONAL | Version: 1 | |
| Consolidated | Parent Company | ||||||
| 03/31/2021 | 12/31/2020 | 03/31/2021 | 12/31/2020 | ||||
| Software | 9 | 9 | 9 | 9 | |||
| Customer relationships | 13 | 13 | |||||
| 12.a) | Goodwill impairment test |
Goodwill arising from expected future profitability of acquired companies and intangible assets with indefinite useful lives (brands) were allocated to CSN’s cash generating units (CGUs) which represent the lowest level of assets or group of assets of the Company. According to CPC 01 (R1) / IAS36, when a CGU has an intangible asset with no defined useful life allocated, the Company must perform an impairment test.
The assumptions used in the calculation of the value in use on December 31, 2020, remain in force and it was not necessary to record impairment losses on the balances of these assets for the period ended March 31, 2021
| 13. | BORROWINGS AND FINANCING |
The balances of loans, financing and debentures that are recorded at amortized cost are as follows:
| Consolidated | Parent Company | |||||||||||||||
| Current Liabilities | Noncurrent Liabilities | Current Liabilities | Noncurrent Liabilities | |||||||||||||
| 03/31/2021 | 12/31/2020 | 03/31/2021 | 12/31/2020 | 03/31/2021 | 12/31/2020 | 03/31/2021 | 12/31/2020 | |||||||||
| Foreign Debt | ||||||||||||||||
| Floating Rates: | ||||||||||||||||
| Prepayment | 1,362,912 | 1,119,558 | 1,626,864 | 3,457,105 | 1,358,622 | 1,118,415 | 1,199,567 | 3,067,352 | ||||||||
| Fixed Rates: | ||||||||||||||||
| Bonds, Perpetual bonds and Advance on Foreign Exchange Contract | 285,167 | 426,676 | 21,840,393 | 19,898,213 | - | 31,969 | ||||||||||
| Intercompany | 436,924 | 475,035 | 12,673,717 | 12,971,249 | ||||||||||||
| Fixed interest in EUR | ||||||||||||||||
| Intercompany | 24,814 | 9,132 | 1,372,986 | 1,595,775 | ||||||||||||
| Facility | 216,104 | 326,970 | 133,830 | 143,503 | ||||||||||||
| 1,864,183 | 1,873,204 | 23,601,087 | 23,498,821 | 1,820,360 | 1,634,551 | 15,246,270 | 17,634,376 | |||||||||
| Debt agreements in Brazil | ||||||||||||||||
| Floating Rate Securities in R$: | ||||||||||||||||
| BNDES/FINAME, Debentures, NCE and CCB | 1,783,622 | 2,282,279 | 6,992,457 | 7,716,307 | 1,739,345 | 2,234,683 | 6,124,047 | 6,838,197 | ||||||||
| Fixed Rate Securities in R$: | ||||||||||||||||
| Intercompany | - | 18,280 | 18,423 | 0 | 0 | |||||||||||
| 1,783,622 | 2,282,279 | 6,992,457 | 7,716,307 | 1,757,625 | 2,253,106 | 6,124,047 | 6,838,197 | |||||||||
| Total Borrowings and Financing | 3,647,805 | 4,155,483 | 30,593,544 | 31,215,128 | 3,577,985 | 3,887,657 | 21,370,317 | 24,472,573 | ||||||||
| Transaction Costs and Issue Premiums | (29,895) | (29,030) | (72,264) | (70,928) | (30,029) | (29,164) | (50,123) | (48,820) | ||||||||
| Total Borrowings and Financing + Transaction cost | 3,617,910 | 4,126,453 | 30,521,280 | 31,144,200 | 3,547,956 | 3,858,493 | 21,320,194 | 24,423,753 | ||||||||
| 13.a) | Borrowing and amortization, financing and debentures |
The following table shows amortization and funding during the period:
| Consolidated | Parent Company | |||||||
| 03/31/2021 | 12/31/2020 | 03/31/2021 | 12/31/2020 | |||||
| Opening balance | 35,270,653 | 27,967,036 | 28,282,246 | 24,099,460 | ||||
| New debts | 347,500 | 8,116,247 | 1,435,178 | 2,502,457 | ||||
| Repayment | (3,653,158) | (6,448,658) | (6,508,220) | (2,907,845) | ||||
| Payments of charges | (639,045) | (1,922,130) | (208,835) | (1,051,557) | ||||
| Accrued charges (Note 26) | 486,280 | 2,002,052 | 197,741 | 1,012,750 | ||||
| Others (1) | 2,326,960 | 5,556,106 | 1,670,040 | 4,626,981 | ||||
| Closing balance | 34,139,190 | 35,270,653 | 24,868,150 | 28,282,246 | ||||
| 1. | Including unrealized exchange and monetary variations and funding cost. |
| 36 |
| (CONVENIENCE TRANSLATION INTO ENGLISH FROM THE ORIGINAL PREVIOUSLY ISSUED IN PORTUGUESE) | ||
| Quarterly Financial Information - March 31, 2021 – CIA SIDERURGICA NACIONAL | Version: 1 | |
On March 31,2021, the Company entered into new debt agreements and amortized borrowings as shown below:
| Consolidated | ||||||
| 03/31/2021 | ||||||
| Nature | New debts | Repayment | Interest payment | |||
| Prepayment (1) | (1,942,732) | (47,188) | ||||
| Bonds, Perpetual bonds, ACC, CCE and Facility | 306,597 | (447,140) | (526,432) | |||
| BNDES/FINAME, Debentures, NCE and CCB (2) | 40,903 | (1,263,286) | (65,425) | |||
| 347,500 | (3,653,158) | (639,045) | ||||
| (1) | During the first quarter of 2021, the Company amortized debts initially scheduled for October 2021 and January 2022 in the amount of US$329 million, equivalent to R$1.9 billion. |
| (2) | The Company repurchased 450,000 debentures in the amount of R$391 million anticipating maturities scheduled from March 2021 to December 2023. |
The following table shows the average interest rates:
| Consolidated | Parent Company | |||||||
| 03/31/2021 | 03/31/2021 | |||||||
| Average interest rate (i) | Total debt | Average interest rate (i) | Total debt | |||||
| US$ | 6.73% | 25,115,336 | 2.48% | 15,668,830 | ||||
| EUR | 1.50% | 349,934 | 3.67% | 1,397,800 | ||||
| R$ | 3.69% | 8,776,079 | 3.67% | 7,881,672 | ||||
| 34,241,349 | 24,948,302 | |||||||
| (i) | To determine the average interest rate on debt contracts with floating rates, the Company used the rates applied on March 31, 2020. In the Parent Company, it considers the interest rate of the contracts intercompany. |
| 13.b) | Maturities of loans, financing and debentures presented in current and non-current liabilities |
| Consolidated | Parent Company | |||||||||||
| 03/31/2021 | 03/31/2021 | |||||||||||
| Principal | Principal | |||||||||||
| Borrowings and financing in foreign currency | Borrowings and financing in national currency | Total | Borrowings and financing in foreign currency | Borrowings and financing in national currency | Total | |||||||
| 2021 | 983,441 | 1,288,267 | 2,271,708 | 891,113 | 1,271,731 | 2,162,844 | ||||||
| 2022 | 1,644,902 | 2,750,256 | 4,395,158 | 2,791,573 | 2,422,127 | 5,213,700 | ||||||
| 2023 | 6,110,368 | 2,901,589 | 9,011,957 | 1,520,002 | 2,551,672 | 4,071,674 | ||||||
| 2024 | 204,389 | 1,245,143 | 1,449,532 | 4,442,773 | 1,045,326 | 5,488,099 | ||||||
| 2025 | 71,348 | 71,348 | 1,018,996 | 71,339 | 1,090,335 | |||||||
| 2026 | 3,418,380 | 71,339 | 3,489,719 | 1,784,077 | 71,339 | 1,855,416 | ||||||
| After 2026 | 7,406,490 | 448,137 | 7,854,627 | 4,618,096 | 448,138 | 5,066,234 | ||||||
| Perpetual bonds | 5,697,300 | 5,697,300 | ||||||||||
| 25,465,270 | 8,776,079 | 34,241,349 | 17,066,630 | 7,881,672 | 24,948,302 |
· Covenants
The Company is compliant with its financial and non-financial obligations (covenants).
| 37 |
| (CONVENIENCE TRANSLATION INTO ENGLISH FROM THE ORIGINAL PREVIOUSLY ISSUED IN PORTUGUESE) | ||
| Quarterly Financial Information - March 31, 2021 – CIA SIDERURGICA NACIONAL | Version: 1 | |
| 14. | FINANCIAL INSTRUMENTS |
I - Identification and valuation of financial instruments
The Company may operate with several financial instruments, with emphasis on cash and cash equivalents, including financial investments, marketable securities, accounts receivable from customers, accounts payable to suppliers and borrowings and financing. Additionally, we may also operate with derivative financial instruments, such as swap exchange rate, swap interest and derivatives with commodities.
Considering the nature of the instruments, the fair value is basically determined by the use of quotations in the capital markets in Brazil and the Mercantile and Futures Exchange. The amounts recorded in current assets and liabilities have immediate liquidity. Considering the term and characteristics of these instruments, fair values do not differ from the recorded amounts.
| · | Classification of financial instruments |
| 38 |
| (CONVENIENCE TRANSLATION INTO ENGLISH FROM THE ORIGINAL PREVIOUSLY ISSUED IN PORTUGUESE) | ||
| Quarterly Financial Information - March 31, 2021 – CIA SIDERURGICA NACIONAL | Version: 1 | |
| Consolidated | ||||||||||||||
| Consolidated | 03/31/2021 | 12/31/2020 | ||||||||||||
| Notes | Fair value through profit or loss | Measured at amortized cost | Balances | Fair value through profit or loss | Measured at amortized cost | Balances | ||||||||
| Assets | ||||||||||||||
| Current | ||||||||||||||
| Cash and cash equivalents | 4 | 13,908,238 | 13,908,238 | 9,944,586 | 9,944,586 | |||||||||
| Short-term investments | 5 | 3,817,603 | 464,548 | 4,282,151 | 3,305,109 | 478,253 | 3,783,362 | |||||||
| Trade receivables | 6 | 4,219,052 | 4,219,052 | 2,867,352 | 2,867,352 | |||||||||
| Dividends and interest on equity | 9 | 38,086 | 38,086 | 38,088 | 38,088 | |||||||||
| Derivative financial instruments | 9 | 39,236 | 39,236 | |||||||||||
| Trading securities | 9 | 14,977 | 14,977 | 5,065 | 5,065 | |||||||||
| Total | 3,871,816 | 18,629,924 | 22,501,740 | 3,310,174 | 13,328,279 | 16,638,453 | ||||||||
| Non-current | ||||||||||||||
| Investments | 5 | 132,635 | 132,635 | 123,409 | 123,409 | |||||||||
| Other trade receivables | 9 | 2,445 | 2,445 | 2,445 | 2,445 | |||||||||
| Eletrobrás compulsory loan | 9 | 851,485 | 851,485 | 852,532 | 852,532 | |||||||||
| Receivables by indemnity | 9 | 521,611 | 521,611 | 517,183 | 517,183 | |||||||||
| Loans - related parties | 9 | 1,043,182 | 1,043,182 | 966,050 | 966,050 | |||||||||
| Investments | 10 | 90,883 | 90,883 | 59,879 | 59,879 | |||||||||
| Total | 90,883 | 2,551,358 | 2,642,241 | 59,879 | 2,461,619 | 2,521,498 | ||||||||
| Total Assets | 3,962,699 | 21,181,282 | 25,143,981 | 3,370,053 | 15,789,898 | 19,159,951 | ||||||||
| Liabilities | ||||||||||||||
| Current | ||||||||||||||
| Borrowings and financing | 13 | 3,647,805 | 3,647,805 | 4,155,483 | 4,155,483 | |||||||||
| Trade payables | 17 | 6,156,294 | 6,156,294 | 4,819,539 | 4,819,539 | |||||||||
| Trade payables - drawee risk | 15 | 1,469,209 | 1,469,209 | 623,861 | 623,861 | |||||||||
| Dividends and interest on capital | 15 | 901,982 | 901,982 | 946,133 | 946,133 | |||||||||
| Leases | 16 | 95,287 | 95,287 | 93,626 | 93,626 | |||||||||
| Derivative financial instruments | 8,722 | 8,722 | ||||||||||||
| Total | 12,270,577 | 12,270,577 | 8,722 | 10,638,642 | 10,647,364 | |||||||||
| Non-current | ||||||||||||||
| Borrowings and financing | 13 | 30,593,544 | 30,593,544 | 31,215,128 | 31,215,128 | |||||||||
| Trade payables | 17 | 225,069 | 225,069 | 543,527 | 543,527 | |||||||||
| Derivative financial instruments | 119,306 | 119,306 | 97,535 | 97,535 | ||||||||||
| Leases | 16 | 445,209 | 445,209 | 436,505 | 436,505 | |||||||||
| Total | 119,306 | 31,263,822 | 31,383,128 | 97,535 | 32,195,160 | 32,292,695 | ||||||||
| Total Liabilities | 119,306 | 43,534,399 | 43,653,705 | 106,257 | 42,833,802 | 42,940,059 | ||||||||
| 39 |
| (CONVENIENCE TRANSLATION INTO ENGLISH FROM THE ORIGINAL PREVIOUSLY ISSUED IN PORTUGUESE) | ||
| Quarterly Financial Information - March 31, 2021 – CIA SIDERURGICA NACIONAL | Version: 1 | |
| Parent Company | ||||||||||||||
| Parent Company | 03/31/2021 | 12/31/2020 | ||||||||||||
| Notes | Fair value through profit or loss | Measured at amortized cost | Balances | Fair value through profit or loss | Measured at amortized cost | Balances | ||||||||
| Assets | ||||||||||||||
| Current | ||||||||||||||
| Cash and cash equivalents | 4 | 5,126,462 | 5,126,462 | 4,647,125 | 4,647,125 | |||||||||
| Short-term investments | 5 | 3,817,603 | 462,361 | 4,279,964 | 3,305,109 | 475,782 | 3,780,891 | |||||||
| Trade receivables | 6 | 1,699,363 | 1,699,363 | 1,549,703 | 1,549,703 | |||||||||
| Dividends and interest on equity | 9 | 28,156 | 28,156 | 329,413 | 329,413 | |||||||||
| Trading securities | 9 | 14,854 | 14,854 | 4,927 | 4,927 | |||||||||
| Loans - related parties | 9 | 59,900 | 59,900 | 53,718 | 53,718 | |||||||||
| Total | 3,832,457 | 7,376,242 | 11,208,699 | 3,310,036 | 7,055,741 | 10,365,777 | ||||||||
| Non-current | ||||||||||||||
| Investments | 5 | 132,635 | 132,635 | 123,409 | 123,409 | |||||||||
| Other trade receivables | 9 | 1,003 | 1,003 | 1,003 | 1,003 | |||||||||
| Eletrobrás compulsory loan | 9 | 850,714 | 850,714 | 851,713 | 851,713 | |||||||||
| Receivables by indemnity | 9 | 521,611 | 521,611 | 517,183 | 517,183 | |||||||||
| Loans - related parties | 9 | 1,097,432 | 1,097,432 | 1,007,677 | 1,007,677 | |||||||||
| Investments | 10 | 90,883 | - | 90,883 | 59,879 | - | 59,879 | |||||||
| Total | 90,883 | 2,603,395 | 2,694,278 | 59,879 | 2,500,985 | 2,560,864 | ||||||||
| Total Assets | 3,923,340 | 9,979,637 | 13,902,977 | 3,369,915 | 9,556,726 | 12,926,641 | ||||||||
| Liabilities | ||||||||||||||
| Current | ||||||||||||||
| Borrowings and financing | 13 | 3,577,985 | 3,577,985 | 3,887,657 | 3,887,657 | |||||||||
| Trade payables | 17 | 4,167,535 | 4,167,535 | 4,133,089 | 4,133,089 | |||||||||
| Trade payables - drawee risk | 15 | 1,469,209 | 1,469,209 | 623,861 | 623,861 | |||||||||
| Dividends and interest on capital | 15 | 901,982 | 901,982 | 901,983 | 901,983 | |||||||||
| Leases | 16 | 7,829 | 7,829 | 26,546 | 26,546 | |||||||||
| Total | 10,124,540 | 10,124,540 | 9,573,136 | 9,573,136 | ||||||||||
| Non-current | ||||||||||||||
| Borrowings and financing | 13 | 21,370,317 | 21,370,317 | 24,472,573 | 24,472,573 | |||||||||
| Trade payables | 17 | 145,301 | 145,301 | 376,753 | 376,753 | |||||||||
| Derivative financial instruments | 119,306 | 119,306 | 97,535 | 97,535 | ||||||||||
| Leases | 16 | 15,771 | 15,771 | 40,561 | 40,561 | |||||||||
| Total | 119,306 | 21,531,389 | 21,650,695 | 97,535 | 24,889,887 | 24,987,422 | ||||||||
| Total Liabilities | 119,306 | 31,655,929 | 31,775,235 | R$ 97,535 | 34,463,023 | 34,560,558 | ||||||||
| · | Fair value measurement |
The table below shows the financial instruments recorded at fair value through profit or loss, classifying them according to the fair value hierarchy:
| 40 |
| (CONVENIENCE TRANSLATION INTO ENGLISH FROM THE ORIGINAL PREVIOUSLY ISSUED IN PORTUGUESE) | ||
| Quarterly Financial Information - March 31, 2021 – CIA SIDERURGICA NACIONAL | Version: 1 | |
| Consolidated | 03/31/2021 | 12/31/2020 | ||||||||||
| Level 1 | Level 2 | Balances | Level 1 | Level 2 | Balances | |||||||
| Assets | ||||||||||||
| Current | ||||||||||||
| Financial assets at fair value through profit or loss | ||||||||||||
| Financial investments | 3,817,603 | 3,817,603 | 3,305,109 | 3,305,109 | ||||||||
| Derivative financial instruments | 39,236 | 39,236 | ||||||||||
| Trading securities | 14,977 | 14,977 | 5,065 | 5,065 | ||||||||
| Non-current | ||||||||||||
| Financial assets at fair value through profit or loss | ||||||||||||
| Investments | 90,883 | 90,883 | 59,879 | 59,879 | ||||||||
| Total Assets | 3,923,463 | 39,236 | 3,962,699 | 3,370,053 | 3,370,053 | |||||||
| Liabilities | ||||||||||||
| Current | ||||||||||||
| Financial liabilities at fair value through profit or loss | ||||||||||||
| Derivative financial instruments | 8,722 | 8,722 | ||||||||||
| Non-current | ||||||||||||
| Financial liabilities at fair value through profit or loss | ||||||||||||
| Derivative financial instruments | 119,306 | 119,306 | 97,535 | 97,535 | ||||||||
| Total Liabilities | 119,306 | 119,306 | 106,257 | 106,257 | ||||||||
Level 1 - Data are prices quoted in an active market for items identical to the assets and liabilities being measured.
Level 2 - Consider inputs observable in the market, such as interest rates, exchange rates, etc., but are not prices negotiated in active markets.
There are no assets or liabilities classified as level 3.
II - Investments in securities valued at fair value through profit or loss
The Company has common shares (USIM3), preferred shares (USIM5) of Usiminas (“Usiminas shares”) and shares of Panatlântica SA (PATI3), which are designated as fair value through profit or loss.
Usiminas shares are classified as current assets in financial investments and Panatlântica shares are classified as non-current assets under the investment item. They are recorded at fair value (fair value), based on the market price quote in B3.
In accordance with the Company’s policy, the gains and losses arising from the variation in the share price are recorded directly in the income statement as financial result in the case of financial investments, or as other operating income and expenses in the case of long-term investments.
| Class of shares | 03/31/2021 | 12/31/2020 | 03/31/2021 | 03/31/2020 | ||||||||||||||||
| Quantity | Equity interest (%) | Share price | Closing Balance | Quantity | Equity interest (%) | Share price | Closing Balance | Fair value adjustment recognized in profit or loss (note 25 and 26) | ||||||||||||
| USIM3 | 107,156,651 | 15.19% | 17.89 | 1,917,032 | 107,156,651 | 15.19% | 15.69 | 1,681,288 | 235,744 | (452,201) | ||||||||||
| USIM5 | 111,144,456 | 20.29% | 17.10 | 1,900,571 | 111,144,456 | 20.29% | 14.61 | 1,623,821 | 276,750 | (510,153) | ||||||||||
| 3,817,603 | 3,305,109 | 512,494 | (962,354) | |||||||||||||||||
| PATI3 | 2,065,529 | 11.31% | 44.00 | 90,883 | 2,065,529 | 11.31% | 28.99 | 59,879 | 31,004 | (207) | ||||||||||
| 3,908,486 | 3,364,988 | 543,498 | (962,561) | |||||||||||||||||
III - Financial risk management:
The Company uses risk management strategies with guidance on the risks incurred by us. The nature and general position of financial risks are regularly monitored and managed in order to assess results and the financial impact on cash flow. Credit limits and hedge quality of counterparties are also reviewed periodically.
| 41 |
| (CONVENIENCE TRANSLATION INTO ENGLISH FROM THE ORIGINAL PREVIOUSLY ISSUED IN PORTUGUESE) | ||
| Quarterly Financial Information - March 31, 2021 – CIA SIDERURGICA NACIONAL | Version: 1 | |
Market risks are hedged when we consider necessary to support the corporate strategy or when it is necessary to maintain the level of financial flexibility.
We are exposed to exchange rate, interest rate, market price and liquidity risks.
The Company may manage some of the risks through the use of derivative instruments not associated with any speculative trading or short selling.
| 14.a) | Exchange rate, market price and interest rate risk: |
| · | Exchange rate risk |
The exposure arises from the existence of assets and liabilities denominated in Dollar or Euro, since the Company’s functional currency is substantially the Real and is called natural exchange exposure. The net exposure is the result of the offsetting of the natural exchange exposure by the instruments of hedge adopted by CSN.
The consolidated net exposure as of March 31, 2021 is shown below:
| 03/31/2021 | ||||
| Foreign Exchange Exposure | (Amounts in US$’000) | (Amounts in €’000) | ||
| Cash and cash equivalents overseas | 1,047,363 | 2,810 | ||
| Trade receivables | 414,755 | 1,991 | ||
| Financial investments | 23,280 | - | ||
| Iron ore derivative | 2,110 | |||
| Other assets | 9,267 | 4,581 | ||
| Total Assets | 1,496,776 | 9,382 | ||
| Borrowings and financing | (4,408,288) | - | ||
| Trade payables | (282,234) | (8,859) | ||
| Other liabilities | (7,328) | (1,114) | ||
| Total Liabilities | (4,697,850) | (9,973) | ||
| Foreign exchange exposure | (3,201,074) | (591) | ||
| Cash flow hedge accounting | 3,762,450 | - | ||
| Dollar - to - real NDF | (100,000) | |||
| Exchange rate swap CDI x Dollar | (67,000) | - | ||
| Net foreign exchange exposure | 394,376 | (591) | ||
CSN uses as a strategy the Hedge Accounting, as well as derivative financial instruments to protect future cash flows.
Sensitivity analysis of Derivative Financial Instruments and Consolidated Foreign Exchange Exposure
The Company considered scenarios 1 and 2 to be 25% and 50% deterioration for currency volatility, using the exchange rate closing rate as of March 31, 2021 as a reference.
The currencies used in the sensitivity analysis and their respective scenarios are shown below:
| 03/31/2021 | ||||||||
| Currency | Exchange rate | Probable scenario | Scenario 1 | Scenario 2 | ||||
| USD | 5.6973 | 5.6445 | 7.1216 | 8.5460 | ||||
| EUR | 6.6915 | 6.7158 | 8.3644 | 10.0373 | ||||
| USD x EUR | 1.1725 | 1.1888 | 1.4656 | 1.7588 |
The effects on the result, considering scenarios 1 and 2 are shown below:
| 42 |
| (CONVENIENCE TRANSLATION INTO ENGLISH FROM THE ORIGINAL PREVIOUSLY ISSUED IN PORTUGUESE) | ||
| Quarterly Financial Information - March 31, 2021 – CIA SIDERURGICA NACIONAL | Version: 1 | |
| 03/31/2021 | ||||||||||
| Instruments | Notional | Risk | Probable scenario (*) R$ | Scenario 1 R$ | Scenario 2 R$ | |||||
| Gross exchange position | (3,201,074) | Dollar | 169,017 | (4,559,370) | (9,118,739) | |||||
| Cash flow hedge accounting | 3,762,450 | Dollar | (198,657) | 5,358,952 | 10,717,903 | |||||
| Dollar - to - real NDF | (100,000) | Dollar | 5,280 | (142,433) | (284,865) | |||||
| Exchange rate swap CDI x Dollar | (67,000) | Dollar | 3,538 | (95,430) | (190,860) | |||||
| Net exchange position | 394,376 | Dollar | (20,822) | 561,719 | 1,123,439 | |||||
| Net exchange position | (591) | Euro | (14) | (989) | (1,978) | |||||
| Exchange rate swap Dollar x Euro | 87,976 | Dollar | 2,542 | (90,991) | (157,936) |
(*) The probable scenarios were calculated considering the following variations for risks: Real x Dollar - appreciation of the Real by 0.93% / Real x Euro - devaluation of the Real by 0.36% / Euro x Dollar - devaluation of Euro by 1.39%. Source: Central Bank of Brazil and European Central Bank quotations on 04/09/2021.
| · | Stock market price risks |
The Company is exposed to the risk of changes in share prices due to investments valued at fair value through the result that are quoted based on the market price at B3.
Sensitivity analysis for stock price risks
We present below the sensitivity analysis for share price risks. The Company considered scenarios 1 and 2 to be 25% and 50% devaluation in the share price using the closing price on March 31, 2021 as a reference. The probable scenario considered a 5% devaluation in the share price.
The effects on the result, considering the probable scenarios, 1 and 2 are shown below:
| 03/31/2021 | ||||||
| Class of shares | Probable scenario | Scenario 1 | Scenario 2 | |||
| USIM3 | (95,852) | (479,258) | (958,516) | |||
| USIM5 | (95,029) | (475,143) | (950,285) | |||
| PATI3 | (4,544) | (22,721) | (45,442) | |||
| · | Interest rate risk: |
This risk arises from financial investments, borrowings and financing and debentures linked to the fixed and floating interest rates of the CDI, TJLP and Libor, exposing these financial assets and liabilities to interest rate fluctuations as shown in the sensitivity analysis table below.
Sensitivity analysis of changes in interest rates
We present below the sensitivity analysis for interest rate risks. The Company considered scenarios 1 and 2 to be 25% and 50% deterioration for interest rate volatility using the closing rate as of March 31, 2021 as a reference.
The interest rates used in the sensitivity analysis and their respective scenarios are shown below:
| 43 |
| (CONVENIENCE TRANSLATION INTO ENGLISH FROM THE ORIGINAL PREVIOUSLY ISSUED IN PORTUGUESE) | ||
| Quarterly Financial Information - March 31, 2021 – CIA SIDERURGICA NACIONAL | Version: 1 | |
| 03/31/2021 | ||||||
| Interest | Interest rate | Scenario 1 | Scenario 2 | |||
| CDI | 2.65% | 3.31% | 3.98% | |||
| TJLP | 4.39% | 5.49% | 6.59% | |||
| LIBOR | 0.21% | 0.26% | 0.31% |
The effects on the result, considering scenarios 1 and 2 are shown below:
| Consolidated | ||||||||||||
| Impact on profit or loss | ||||||||||||
| Changes in interest rates | % p.a | Assets | Liabilities | Probable scenario (*) | Scenario 1 | Scenario 2 | ||||||
| CDI | 2.65 | 7,477,707 | (7,865,137) | (10,681) | (2,567) | (5,134) | ||||||
| TJLP | 4.39 | (843,873) | (2,055) | (9,262) | (18,524) | |||||||
| Libor | 0.21 | (2,952,056) | (37,720) | (1,515) | (3,030) | |||||||
(*) The sensitivity analysis is based on the premise of maintaining the market values as of March 31, 2021 as a probable scenario recorded in the company’s assets and liabilities.
| · | Market price risk: |
The Company is also exposed to market risks related to the volatility of commodity and input prices. In line with its risk management policy, risk mitigation strategies involving commodities can be used to reduce cash flow volatility. These mitigation strategies may incorporate derivative instruments, predominantly forward transactions, futures and options.
Sensitivity analysis for price risks “Platts index”
A operação de Hedge accounting de fluxo de caixa – índice “Platts” foi liquidada em 2 de abril de 2021 no montante de R$11,992 e não ocorreu variação.
| 14.b) | Instruments protection: Derivatives and Hedge accounting cash flow and net investment hedge in foreign subsidiaries |
· Derivative financial instruments portfolio position
Swap exchange rate Dollar x Euro
The subsidiary Lusosider has derivative transactions to hedge its dollar exposure against the euro.
Swap exchange rate CDI x Dollar
The Company has derivative transactions with Banco Bradesco to protect its debt in NCE raised in September 2019 with maturity in October 2023 in the amount of US$67 million (equivalent to R $ 278 million) at a cost compatible with that usually practiced by the Company. Additionally, in 2021, the Company sold US$100 million in NDF (Non-Deliverable Forward) with maturity in June 2021.
| 44 |
| (CONVENIENCE TRANSLATION INTO ENGLISH FROM THE ORIGINAL PREVIOUSLY ISSUED IN PORTUGUESE) | ||
| Quarterly Financial Information - March 31, 2021 – CIA SIDERURGICA NACIONAL | Version: 1 | |
| Consolidated | ||||||||||||||
| 03/31/2021 | ||||||||||||||
| Appreciation (R$) | Fair value (market) | Impact on financial income (expenses) in 2021 | ||||||||||||
| Counterparties | Maturity | Functional Currency | Notional amount | Asset position | Liability position | Amounts receivable / (payable) | ||||||||
| Exchange rate swap Dollar x Real | 06/01/2021 | Dollar | (100,000) | 583,340 | (565,550) | 17,790 | 6,758 | |||||||
| Total dollar x real swap (NDF) | (100,000) | 583,340 | (565,550) | 17,790 | 6,758 | |||||||||
| Exchange rate swap Dollar x Euro | 04/26/2021 to 10/21/2021 | Dollar | 57,176 | 326,308 | (320,671) | 5,637 | 9,514 | |||||||
| Exchange rate swap Dollar x Euro | 05/04/2021 a 08/20/2021 | Dollar | 30,800 | 175,777 | (171,988) | 3,789 | 8,110 | |||||||
| Total dollar-to-euro swap | 87,976 | 502,085 | (492,659) | 9,426 | 17,624 | |||||||||
| Exchange rate swap CDI x Dollar | 02/10/2023 | Dollar | (67,000) | 291,069 | (410,375) | (119,306) | (27,444) | |||||||
| Total Swap CDI x dollar | (67,000) | 291,069 | (410,375) | (119,306) | (27,444) | |||||||||
| 1,376,494 | (1,468,584) | (92,090) | (3,062) | |||||||||||
| · | Cash flow hedge accounting |
Foreign exchange hedge accounting
The table below presents a summary of the relations of foreign exchange hedge accounting as of March 31, 2021:
| 03/31/2021 | ||||||||||||||||||
| Designation Date | Hedging Instrument | Hedged item | Type of hedged risk | Hedged period | Exchange rate on designation | Designated amounts (US$’000) | Amortizated part (USD'000) | Effect on Result (*) (R$'000) | Impact on Shareholders' equity (R$'000) | |||||||||
| 07/21/2015 | Export prepayments in US$ to third parties | Part of the highly probable future monthly iron ore exports | Foreign exchange - R$ vs. US$ spot rate | July 2019 - March 2021 | 3.1813 | 60,000 | (60,000) | (33,016) | - | |||||||||
| 07/23/2015 | Export prepayments in US$ to third parties | Part of the highly probable future monthly iron ore exports | Foreign exchange - R$ vs. US$ spot rate | July 2019 - March 2021 | 3.285 | 100,000 | (100,000) | (52,436) | - | |||||||||
| 07/23/2015 | Export prepayments in US$ to third parties | Part of the highly probable future monthly iron ore exports | Foreign exchange - R$ vs. US$ spot rate | August 2018 - October 2022 | 3.285 | 30,000 | (24,000) | - | (26,531) | |||||||||
| 07/24/2015 | Export prepayments in US$ to third parties | Part of the highly probable future monthly iron ore exports | Foreign exchange - R$ vs. US$ spot rate | August 2018 - October 2022 | 3.3254 | 100,000 | (100,000) | - | (78,764) | |||||||||
| 07/27/2015 | Export prepayments in US$ to third parties | Part of the highly probable future monthly iron ore exports | Foreign exchange - R$ vs. US$ spot rate | August 2018 - October 2022 | 3.3557 | 25,000 | (24,150) | - | (19,730) | |||||||||
| 07/27/2015 | Export prepayments in US$ to third parties | Part of the highly probable future monthly iron ore exports | Foreign exchange - R$ vs. US$ spot rate | August 2018 - October 2022 | 3.3557 | 70,000 | (56,000) | - | (59,925) | |||||||||
| 07/27/2015 | Export prepayments in US$ to third parties | Part of the highly probable future monthly iron ore exports | Foreign exchange - R$ vs. US$ spot rate | August 2018 - October 2022 | 3.3557 | 30,000 | (24,000) | - | (25,683) | |||||||||
| 07/28/2015 | Export prepayments in US$ to third parties | Part of the highly probable future monthly iron ore exports | Foreign exchange - R$ vs. US$ spot rate | August 2018 - October 2022 | 3.3815 | 30,000 | (24,000) | - | (25,373) | |||||||||
| 3/8/2015 | Export prepayments in US$ to third parties | Part of the highly probable future monthly iron ore exports | Foreign exchange - R$ vs. US$ spot rate | July 2018 - October 2022 | 3.394 | 355,000 | (343,000) | (108,874) | (50,446) | |||||||||
| 2/4/2018 | Bonds | Part of the highly probable future monthly iron ore exports | Foreign exchange - R$ vs. US$ spot rate | July 2018 - February 2023 | 3.3104 | 1,170,045 | (820,045) | - | (835,415) | |||||||||
| 07/31/2019 | Bonds and Export prepayments in US$ to third parties | Part of the highly probable future monthly iron ore exports | Foreign exchange - R$ vs. US$ spot rate | January 2020 - April 2026 | 3.7649 | 1,342,761 | (254,161) | (12,148) | (2,103,610) | |||||||||
| 10/1/2020 | Bonds with no maturity date and Export prepayments in US$ to third parties | Part of the highly probable future monthly iron ore exports | Foreign exchange - R$ vs. US$ spot rate | March 2020 - December 2050 | 4.0745 | 1,416,000 | (137,000) | (45,776) | (2,075,560) | |||||||||
| 01/28/2020 | Bonds | Part of the highly probable future monthly iron ore exports | Foreign exchange - R$ vs. US$ spot rate | March 2017 - January 2028 | 4.2064 | 1,000,000 | - | - | (1,490,900) | |||||||||
| Total | 5,728,806 | (1,966,356) | (252,250) | (6,791,937) |
(*) On March 31, 2021, the amount of (R$252.250) was recorded in Other Operating Expenses. As of March 31, 2020, (R$364.818).
| 45 |
| (CONVENIENCE TRANSLATION INTO ENGLISH FROM THE ORIGINAL PREVIOUSLY ISSUED IN PORTUGUESE) | ||
| Quarterly Financial Information - March 31, 2021 – CIA SIDERURGICA NACIONAL | Version: 1 | |
In the hedging relationships described above, the amounts of the debt instruments were fully designated for equivalent iron ore export portions.
The changes in the hedge accounting amounts recognized in shareholders’ equity as of March 31, 2021 are as follows:
| Consolidated and Parent Company | |||||||
| 12/31/2020 | Movement | Realization | 03/31/2021 | ||||
| Cash flow hedge accounting | 5,125,058 | 1,919,129 | (252,250) | 6,791,937 | |||
The realization of Hedge accounting cash flow is recognized in Other operating income and expenses, note 25.
As of March 31, 2021, the hedging relationships established by the Company were effective according to the retrospective and prospective tests performed. Thus, no reversal for hedge accounting ineffectiveness was recognized.
Cash flow hedge accounting - “Platts” index
The Company has iron ore derivative instruments, entered into by its subsidiary CSN Mineração S.A., in order to reduce the volatility of its exposure to the commodity, the transactions were fully paid on April 02, 2021.
The Company formally designated the hedge relationship and, consequently, applied the hedge accounting with the derivative instrument designated as hedging instrument and the Platts index applicable to a portion of its highly probable future sales of iron ore was designated as the hedged item. Accordingly, fluctuations of the “Platts” index will be initially recorded in theshareholders’ equity as Other Comprehensive Income and will be reclassified to the income statement when the referred sales occur.
The table below shows the result of the derivative instrument on March 31, 2021:
| 03/31/2021 | 03/31/2021 | |||||||||||
| Appreciation (R$) | Fair value (market) | Other income and expenses | Exchange variation | |||||||||
| Maturity | Notional | Asset position | Liability position | Amounts receivable / (payable) | ||||||||
| 02/02/2021 (Settled) | Platts | (36,405) | (2,690) | |||||||||
| 03/02/2021 (Settled) | Platts | (34,116) | (2,871) | |||||||||
| 2/4/2021 | Platts | 1,633,459 | (1,621,439) | 12,020 | 11,961 | 59 | ||||||
| 1,633,459 | (1,621,439) | 12,020 | (58,560) | (5,502) | ||||||||
The change in the amounts related to cash flow hedge accounting - “Platts” index recorded in shareholders’ equity on March 31, 2021 is shown as follows:
| 12/31/2020 | Movement | Realization | 03/31/2021 | ||||
| Cash flow hedge accounting – “Platts” | 825 | 57,735 | (58,560) | - | |||
| Income tax and social contribution on cash flow hedge accounting | (280) | (19,630) | 19,910 | - | |||
| Fair Value of cash flow accounting - Platts, net | 545 | 38,105 | (38,650) | - |
Cash flow hedge accounting - index “Platts” has been fully effective since the inception of the derivative instruments.
The Company prepares formal documentation indicating how the designation of the hedge accounting cash flow - “Platts” index is aligned with CSN’s risk management objective and strategy, identifying the hedging instruments used, the hedged item, the nature of the risk to be hedged and demonstrating the effectiveness of the hedge relationships, debt instruments and iron ore derivative instruments (index “Platts”) in amounts equivalent to the portion of future sales, comparing the designated amounts with the expected values in accordance with its budgets.
| 46 |
| (CONVENIENCE TRANSLATION INTO ENGLISH FROM THE ORIGINAL PREVIOUSLY ISSUED IN PORTUGUESE) | ||
| Quarterly Financial Information - March 31, 2021 – CIA SIDERURGICA NACIONAL | Version: 1 | |
| · | Net investment hedge in foreign subsidiaries |
The information related to the net investment hedge did not change in relation to that disclosed in the Company's accounts as of December 31, 2020. The balance recorded on March 31, 2021 and December 31, 2020 is R$6,293.
| · | Classification of derivatives in the balance sheet and income |
| 03/31/2021 | 03/31/2020 | |||||||||||||||||
| Instruments | Assets | Liabilities | Other operating income expenses | Financial income (expenses), net (note 26) | ||||||||||||||
| Current | Non-current | Total | Current | Non-current | Total | |||||||||||||
| Exchange rate swap Dollar x Real | 17,790 | 17,790 | 6,758 | |||||||||||||||
| Exchange rate swap Dollar x Euro | 9,426 | 9,426 | 17,624 | 2,757 | ||||||||||||||
| Exchange rate swap GBP x Euro | 168 | |||||||||||||||||
| Exchange rate swap CDI x Dollar | (119,306) | (119,306) | (27,444) | (99,113) | ||||||||||||||
| Iron ore derivative | 12,020 | 12,020 | (58,560) | (5,502) | ||||||||||||||
| 29,810 | 29,810 | 9,426 | (119,306) | (109,880) | (58,560) | (8,564) | (96,188) | |||||||||||
| 14.c) | Liquidity risk |
It is the risk that the Company may not have sufficient net funds to settle its financial commitments, as a result of the mismatch of term or volume between expected receipts and payments.
Future receipt and payment premises are established to manage cash liquidity in domestic and foreign currencies, which are monitored on a day-to-day basis by the Treasury Department. The payment schedules for long-term installments of borrowings and financing and debentures are presented in note 13.
The following are the contractual maturities of financial liabilities including interest.
| Consolidated | |||||||||
| At March 31, 2021 | Less than one year | From one to two years | From two to five years | Over five years | Total | ||||
| Borrowings, financing and debentures (note 13) | 3,647,805 | 12,031,018 | 5,010,599 | 13,551,927 | 34,241,349 | ||||
| Lease Liabilities (note 16) | 95,287 | 151,478 | 115,200 | 178,531 | 540,496 | ||||
| Derivative financial instruments (note 14 I) | 119,306 | 119,306 | |||||||
| Trade payables (note 17) | 6,156,294 | 197,547 | 27,522 | 6,381,363 | |||||
| Trade payables – Drawee risk (note 14 I) | 1,469,209 | 1,469,209 | |||||||
| Dividends and interest on equity (note 15) | 901,982 | 901,982 | |||||||
| Total | 12,270,577 | 12,380,043 | 5,272,627 | 13,730,458 | 43,653,705 |
IV – Fair values of assets and liabilities in relation to the book value
Financial assets and liabilities measured at fair value through profit or loss are recorded in current and non-current assets and liabilities and gains and losses are recorded as financial income and expenses, respectively.
The amounts are recorded in the financial statements at their amortized cost, which are substantially similar to those that would be obtained if they were traded on the market. The fair values of other long-term assets and liabilities do not differ significantly from their book values, except for the amounts below.
The estimated fair value for certain consolidated long-term borrowings and financing was calculated at current market rates, considering the nature, term and risks similar to those of the registered contracts, as follows:
| 03/31/2021 | 12/31/2020 | ||||||
| Closing Balance | Fair value | Closing Balance | Fair value | ||||
| Perpetual bonds | 5,705,055 | 5,727,268 | 5,203,773 | 5,157,465 | |||
| Fixed Rate Notes | 16,351,452 | 16,974,264 | 15,067,341 | 15,744,067 |
Source: Bloomberg
| 47 |
| (CONVENIENCE TRANSLATION INTO ENGLISH FROM THE ORIGINAL PREVIOUSLY ISSUED IN PORTUGUESE) | ||
| Quarterly Financial Information - March 31, 2021 – CIA SIDERURGICA NACIONAL | Version: 1 | |
| 14.d) | Credit risk |
The exposure to credit risks of financial institutions complies with the parameters established in the financial policy. The Company practices a detailed analysis of the financial position of its customers and suppliers, the determination of a credit limit and the permanent monitoring of its outstanding balance.
With respect to financial investments, the Company only invests in institutions with low credit risk assessed by credit rating agencies. Since part of the funds is invested in repo operations that are backed by Brazilian government bonds, there is also exposure to the credit risk of the country.
As for the exposure to credit risk in accounts receivable and other receivables, the Company has a credit risk committee, in which each new customer is analyzed individually regarding their financial condition, before granting the credit limit and payment terms, and periodically reviewed based on procedures and circumstances of each business area.
| 14.e) | Capital management |
The Company seeks to optimize its capital structure in order to reduce its financial costs and maximize the return to its shareholders. The table below shows the evolution of the Company’s consolidated capital structure, with financing by equity and third-party capital:
| Thousands of reais | 03/31/2021 | 12/31/2020 | ||
| Shareholder's equity (equity) | 17,275,336 | 11,251,505 | ||
| Borrowings and Financing (Third-party capital) | 34,139,190 | 35,270,653 | ||
| Gross Debit/Shareholder's equity | 1.98 | 3.13 |
| 15. | OTHER PAYABLES |
The other obligations classified in current and non-current liabilities have the following composition:
| Consolidated | Parent Company | ||||||||||||||
| Current | Non-current | Current | Non-current | ||||||||||||
| 03/31/2021 | 12/31/2020 | 03/31/2021 | 12/31/2020 | 03/31/2021 | 12/31/2020 | 03/31/2021 | 12/31/2020 | ||||||||
| Payables to related parties (note 21 A) | 79,296 | 70,458 | 59,917 | 78,083 | 270,460 | 250,330 | 200,511 | 222,834 | |||||||
| Derivative financial instruments (note 14 I) | 8,722 | 119,306 | 97,535 | 119,306 | 97,535 | ||||||||||
| Dividends and interest on capital (note 14 I) | 901,982 | 946,133 | 901,982 | 901,983 | |||||||||||
| Advances from customers (1) | 1,145,238 | 1,100,772 | 1,514,256 | 1,725,838 | 169,877 | 196,595 | |||||||||
| Taxes in installments | 43,420 | 45,331 | 154,915 | 160,247 | 9,173 | 9,806 | 1,320 | ||||||||
| Profit sharing - employees | 196,751 | 150,341 | 130,105 | 109,482 | |||||||||||
| Taxes payable | 37,174 | 38,493 | 32,456 | 32,289 | |||||||||||
| Provision for consumption and services | 192,281 | 175,242 | 115,217 | 97,221 | |||||||||||
| Third party materials in our possession | 185,204 | 84,832 | 158,092 | 55,334 | |||||||||||
| Trade payables - Drawee Risk (note 17) | 1,469,209 | 623,861 | 1,469,209 | 623,861 | |||||||||||
| Trade payables (note 17) | 225,069 | 543,527 | 145,301 | 376,753 | |||||||||||
| Lease Liabilities (note 16) | 95,287 | 93,626 | 445,209 | 436,505 | 7,829 | 26,546 | 15,771 | 40,561 | |||||||
| Other payables | 51,646 | 58,321 | 65,498 | 65,108 | 24,135 | 31,030 | |||||||||
| 4,360,314 | 3,357,639 | 2,621,344 | 3,145,336 | 3,256,079 | 2,302,188 | 513,345 | 771,292 | ||||||||
1. Advances from customers: During 2019, the Company received in advance, through its subsidiary CSN Mineração, the total amount of US$746 million (R$2,907 million) related to supply contracts for approximately 33 million tons of iron ore signed with an important international player, the term for the execution of the contracted volumes is 5 years. On July 16, 2020, the Company concluded the contract for the additional supply of approximately 4 million tons of iron ore, and the amount received in advance, on August 28, 2020, was US$ 115 million (R$629 million). The term for the execution of the contract is 3 years.
| 48 |
| (CONVENIENCE TRANSLATION INTO ENGLISH FROM THE ORIGINAL PREVIOUSLY ISSUED IN PORTUGUESE) | ||
| Quarterly Financial Information - March 31, 2021 – CIA SIDERURGICA NACIONAL | Version: 1 | |
| 16. | LEASE LIABILITIES |
Lease liabilities are shown below:
| Consolidated | Parent Company | ||||||
| 03/31/2021 | 12/31/2020 | 03/31/2021 | 12/31/2020 | ||||
| Leases | 1,627,783 | 1,623,523 | 27,268 | 76,333 | |||
| Present value adjustment - Leases | (1,087,287) | (1,093,392) | (3,668) | (9,226) | |||
| 540,496 | 530,131 | 23,600 | 67,107 | ||||
| Classified: | |||||||
| Current | 95,287 | 93,626 | 7,829 | 26,546 | |||
| Non-current | 445,209 | 436,505 | 15,771 | 40,561 | |||
| 540,496 | 530,131 | 23,600 | 67,107 | ||||
The Company has lease agreements for port terminals in Itaguaí, the Solid Bulk Terminal - TECAR, used for loading and unloading coal and iron ores and the Container Terminal - TECON, with remaining terms of 27 and 31 years, respectively , and lease agreement for railway operation using the Northeast network with a remaining term of 7 years.
Additionally, the Company has property lease agreements, used as operational facilities and administrative and sales offices, in several locations where the Company operates, with remaining terms of 2, 5 and 15 years.
CSN also has lease contracts for operating equipment, used in mining operations and in the steel industry, with terms of 2 to 5 years.
The present value of future obligations was measured using the implicit rate observed in the contracts and for contracts that did not have a rate, the Company applied the incremental rate of loans - IBR, both in nominal terms.
The movement of lease liabilities is shown in the table below:
| Consolidated | Parent Company | ||||||
| 03/31/2021 | 12/31/2020 | 03/31/2021 | 12/31/2020 | ||||
| Opening balance | 530,131 | 474,390 | 67,107 | 45,940 | |||
| New leases | 38,959 | 52,835 | 426 | 29,714 | |||
| Present Value Adjustments - New leases | (3,031) | (6,511) | (5) | (3,822) | |||
| Contract review | 27,223 | 63,250 | 304 | 21,503 | |||
| Write-off | (38,626) | (7,757) | (15,392) | (4,465) | |||
| Payments | (29,486) | (103,648) | (2,381) | (25,732) | |||
| Interest appropriated | 14,827 | 54,236 | 540 | 3,969 | |||
| Drop down of Cements (note 10.c) | - | - | (26,999) | - | |||
| Exchange variation | 499 | 3,336 | - | - | |||
| Net balance | 540,496 | 530,131 | 23,600 | 67,107 | |||
The estimated future minimum payments for the lease agreements include determinable variable payments, which are certain to occur, based on minimum performance and contractually fixed rates.
As of March 31, 2021, the expected minimum payments are the following:
| Consolidated | |||||||
| Less than one year | Between one and five years | Over five years | Total | ||||
| Leases | 100,161 | 375,664 | 1,151,958 | 1,627,783 | |||
| Present value adjustment - Leases | (4,874) | (108,986) | (973,427) | (1,087,287) | |||
| 95,287 | 266,678 | 178,531 | 540,496 | ||||
| 49 |
| (CONVENIENCE TRANSLATION INTO ENGLISH FROM THE ORIGINAL PREVIOUSLY ISSUED IN PORTUGUESE) | ||
| Quarterly Financial Information - March 31, 2021 – CIA SIDERURGICA NACIONAL | Version: 1 | |
| · | Recoverable PIS / COFINS |
Lease liabilities were measured at the amount of consideration with suppliers, that is, without considering the tax credits incurred after payment. The potential right of PIS and COFINS embedded in the lease liability is shown below.
| Consolidated | Parent Company | ||||||
| 03/31/2021 | 12/31/2020 | 03/31/2021 | 12/31/2020 | ||||
| Leases | 1,609,566 | 1,603,100 | 25,909 | 70,647 | |||
| Present value adjustment - Leases | (1,085,805) | (1,091,275) | (3,486) | (8,136) | |||
| Potencial PIS and COFINS credit | 148,885 | 148,287 | 2,397 | 6,535 | |||
| Present value adjustment – Potential PIS and COFINS credit | (100,437) | (100,943) | (322) | (753) | |||
| · | Lease payments not recognized as a liability: |
The Company chose not to recognize lease liabilities in contracts with a term of less than 12 months and for low value assets. Payments made for these contracts are recognized as expenses when incurred.
The Company has contracts for the right to use ports (TECAR) and railways (FTL) which, even if they establish minimum performance, it is not possible to determine its cash flow since these payments are fully variable and will only be known when they occur. In such cases, payments will be recognized as expenses when incurred.
The expenses related to payments not included in the measurement of the lease liability are:
| Consolidated | Parent Company | ||||||
| 03/31/2021 | 03/31/2021 | 03/31/2020 | 03/31/2020 | ||||
| Contract less than 12 months | - | 159 | - | 3,244 | |||
| Lower Assets value | 460 | 1,934 | 40 | 2,019 | |||
| Variable lease payments | 118,253 | 45,900 | 1,300 | 39,675 | |||
| 118,713 | 47,993 | 1,340 | 44,938 | ||||
In accordance with the guidelines of CPC 06 (R2) / IFRS 16, the Company uses the discounted cash flow technique to measure and remeasurate liabilities and use rights, without considering the projected inflation in the flows to be discounted.
Considering Circular Letter / CVM / SNC / SEP No. 02/2019, the Company discloses below the comparative balances of lease liabilities, right to use, financial expenses and depreciation expenses with the use of rates in real terms to discount a present value of flows also in real terms.
| 17. | TRADE PAYABLES |
| Consolidated | Parent Company | ||||||
| 03/31/2021 | 12/31/2020 | 03/31/2021 | 12/31/2020 | ||||
| Trade payables | 6,482,092 | 5,487,640 | 4,380,485 | 4,588,207 | |||
| (-) Adjustment present value | (100,729) | (124,574) | (67,649) | (78,365) | |||
| 6,381,363 | 5,363,066 | 4,312,836 | 4,509,842 | ||||
| Classified: | |||||||
| Current | 6,156,294 | 4,819,539 | 4,167,535 | 4,133,089 | |||
| Non-current | 225,069 | 543,527 | 145,301 | 376,753 | |||
| 6,381,363 | 5,363,066 | 4,312,836 | 4,509,842 | ||||
The Company classifies the drawee risk and forfaiting transactions with suppliers as other liabilities (see Note 15). Those are transactions with financial institutions by which the suppliers anticipate the receipt for their sale of goods to us, and we postpone the payment to the financial institutions. The transactions are not mandatory and are dependent upon the acceptance by the suppliers. The Company is not reimbursed and/or benefitted by the financial institutions with discounts for payments realized before maturity dates agreed with the suppliers. Also, in the case of judicial execution, there is no change in the degree of subordination of the invoices nor changes in the commercial conditions agreed between the Company and the suppliers.
| 50 |
| (CONVENIENCE TRANSLATION INTO ENGLISH FROM THE ORIGINAL PREVIOUSLY ISSUED IN PORTUGUESE) | ||
| Quarterly Financial Information - March 31, 2021 – CIA SIDERURGICA NACIONAL | Version: 1 | |
| 18. | INCOME TAX AND SOCIAL CONTRIBUTION |
��
18.a) Tax of income and social contribution recognized in profit or loss:
The income tax and social contribution recognized in net income for the year are as follows:
| Consolidated | Parent Company | ||||||
| 03/31/2021 | 03/31/2020 | 03/31/2021 | 03/31/2020 | ||||
| Income tax and social contribution income (expense) | |||||||
| Current | (1,359,098) | (217,555) | (141,857) | ||||
| Deferred | 80,858 | 11,351 | (13,916) | 304 | |||
| (1,278,240) | (206,204) | (155,773) | 304 | ||||
The reconciliation of income and social contribution expenses and income of the consolidated and parent company and the product of the current tax rate on income before income tax and social contribution are shown below:
| Consolidated | Parent Company | ||||||
| 03/31/2021 | 03/31/2020 | 03/31/2021 | 03/31/2020 | ||||
| Income before income tax and social contribution | 6,975,553 | (1,105,505) | 5,395,788 | (1,361,155) | |||
| Tax rate | 34% | 34% | 34% | 34% | |||
| Income tax and social contribution at combined statutory rate | (2,371,688) | 375,872 | (1,834,568) | 462,793 | |||
| Adjustment to reflect the effective rate: | |||||||
| Equity in results of affiliated companies | 5,572 | (14,338) | 472,567 | (200,835) | |||
| Profit with differentiated rates or untaxed | (205,998) | (291,828) | - | - | |||
| Tax loss carryforwards without recognizing deferred taxes | (3,775) | (11,199) | - | - | |||
| Indebtdness limit | (4,269) | (5,730) | (4,269) | (5,730) | |||
| Unrecorded deferred taxes on temporary differences | 2,347 | (451) | - | - | |||
| Reversal for deferred income tax and social contribution credit | 1,212,345 | (253,261) | 1,212,345 | (253,261) | |||
| Tax incentives | 5,716 | 1,625 | 3,684 | - | |||
| Other permanent deductions (additions) | 81,510 | (6,894) | (5,532) | (2,663) | |||
| Income tax and social contribution in net income for the period | (1,278,240) | (206,204) | (155,773) | 304 | |||
| Effective tax rate | 18% | -19% | 3% | 0% | |||
| 18.b) | Deferred income tax and social contribution |
Deferred income tax and social contribution balances are as follows:
| 51 |
| (CONVENIENCE TRANSLATION INTO ENGLISH FROM THE ORIGINAL PREVIOUSLY ISSUED IN PORTUGUESE) | ||
| Quarterly Financial Information - March 31, 2021 – CIA SIDERURGICA NACIONAL | Version: 1 | |
| Consolidated | |||||||
| Opening balance | Movement | Closing balance | |||||
| 12/31/2020 | Shareholders' Equity | P&L | 03/31/2021 | ||||
| Deferred | |||||||
| Income tax losses | 1,848,999 | (6,995) | 1,842,004 | ||||
| Social contribution tax losses | 688,208 | (2,519) | 685,689 | ||||
| Temporary differences | 718,903 | (9,203) | 90,372 | 800,072 | |||
| - Provision for tax. social security, labor, civil and environmental risks | 279,149 | (15,347) | 263,802 | ||||
| - Asset impairment losses | 161,016 | 4,479 | 165,495 | ||||
| - (Gains)/losses on financial instruments | 5,027 | (129,863) | (124,836) | ||||
| - Actuarial liability (pension and healthcare plan) | 262,457 | 262,457 | |||||
| - Accrued supplies and services | 154,452 | 8,147 | 162,599 | ||||
| - Unrealized exchange variation (1) | 1,152,326 | (1,044,161) | 108,165 | ||||
| - Gain upon loss of control in Transnordestina | (92,180) | (92,180) | |||||
| - Cash flow hedge accounting | 1,742,800 | 566,459 | 2,309,259 | ||||
| - Acquisition at fair value of SWT and CBL | (212,015) | (6,196) | 3,225 | (214,986) | |||
| - Deferred taxes not computed | (317,927) | (24,308) | (342,235) | ||||
| - (Losses) estimated /reversals to deferred taxes credits | (1,347,468) | (566,739) | 1,212,345 | (701,862) | |||
| - Business Combination | (1,015,049) | 2,030 | (1,013,019) | ||||
| - Others | (53,685) | (2,727) | 73,825 | 17,413 | |||
| Total | 3,256,110 | (9,203) | 80,858 | 3,327,765 | |||
| Total Deferred Assets | 3,874,946 | 3,929,974 | |||||
| Total Deferred Liabilities | (618,836) | (602,209) | |||||
| Total Deferred | 3,256,110 | 3,327,765 | |||||
(1) The Company taxes exchange variations on a cash basis to calculate income tax and social contribution on net income.
| Parent Company | |||||||
| Opening balance | Movement | Closing balance | |||||
| 12/31/2020 | Shareholders' Equity | P&L | 03/31/2021 | ||||
| Deferred tax assets | |||||||
| Income tax losses | 1,680,700 | (39,404) | 1,641,296 | ||||
| Social contribution tax losses | 627,382 | (14,185) | 613,197 | ||||
| Temporary differences | 1,491,625 | 39,673 | 1,531,298 | ||||
| - Provision for tax. social security, labor, civil and environmental risks | 202,467 | (10,876) | 191,591 | ||||
| - Asset impairment losses | 100,005 | (3,315) | 96,690 | ||||
| - (Gains)/losses on financial instruments | 5,026 | (129,863) | (124,837) | ||||
| - Actuarial liability (pension and healthcare plan) | 264,192 | - | 264,192 | ||||
| - Accrued supplies and services | 132,892 | 1,645 | 134,537 | ||||
| - Unrealized exchange variation (1) | 1,152,325 | (1,044,387) | 107,938 | ||||
| - Gain) in control loss on Transnorderstina | (92,180) | (92,180) | |||||
| - Cash flow hedge accounting | 1,742,520 | 566,739 | 2,309,259 | ||||
| - (Losses) estimated /reversals to deferred taxes credits | (1,356,021) | (566,739) | 1,212,345 | (710,415) | |||
| - Business Combination | (721,992) | - | (721,992) | ||||
| - Others | 62,391 | 14,124 | 76,515 | ||||
| Total | 3,799,707 | (13,916) | 3,785,791 | ||||
| Total Deferred Assets | 4,627,332 | 4,627,332 | |||||
| Total Deferred Liabilities | (827,625) | (841,541) | |||||
| Total Deferred | 3,799,707 | 3,785,791 | |||||
(1) The Company taxes exchange variations on a cash basis to calculate income tax and social contribution on net income.
The Company has in its corporate structure subsidiaries abroad, whose income are taxed by the income tax in the respective countries where they were constituted at rates lower than those in force in Brazil. In the period between 2015 and 2021, these subsidiaries generated income in the amount of R$1,032,621. If the Brazilian tax authorities understand that these profits are subject to additional taxation in Brazil for income tax and social contribution, these, if due, would reach approximately R$326,788. The Company, based on the position of its legal advisors, assessed only the likelihood of loss as possible in the event of possible tax questioning and, therefore, no provision was recognized in the financial statement.
In addition, management evaluated the precepts of IFRIC 23 - “Uncertainty Over Income Tax Treatments” and considers that there are no reasons for the tax authorities to differ from the tax positions adopted by the Company. Accordingly, no additional provisions for income tax and social contribution were recognized as a result of the assessment of the application of IFRIC 23 in the interim financial information at March 31, 2021.
| 52 |
| (CONVENIENCE TRANSLATION INTO ENGLISH FROM THE ORIGINAL PREVIOUSLY ISSUED IN PORTUGUESE) | ||
| Quarterly Financial Information - March 31, 2021 – CIA SIDERURGICA NACIONAL | Version: 1 | |
A sensitivity analysis of consumption of tax credits was carried out considering a variation in macroeconomic assumptions, operating performance and liquidity events. Thus, considering the results of the study carried out, which indicates that it is probable the existence of taxable profit to use the balance of deferred income tax and social contribution.
The estimated recovery of deferred tax assets of IRPJ and CSLL are netted when referring to a single jurisdiction as shown in the table below:
| Consolidated | Parent Company | |||
| 2021 | 1,017,921 | 1,017,921 | ||
| 2022 | 1,315,426 | 1,315,426 | ||
| 2023 | 1,257,266 | 1,257,266 | ||
| 2024 | 495,211 | 495,211 | ||
| 2025 | 685,691 | 541,508 | ||
| Deferred asset | 4,771,515 | 4,627,332 | ||
| Deferred liabilities - Parent Company | (841,541) | (841,541) | ||
| Net deferred asset | 3,929,974 | 3,785,791 | ||
| Deferred liabilities - subsidiaries | (602,209) | |||
| Net deferred asset | 3,327,765 | 3,785,791 |
| 18.c) | Income tax and social contribution recognized in equity: |
Income tax and social contribution recognized directly in equity are shown below:
| Consolidated | Parent Company | ||||||
| 03/31/2021 | 12/31/2020 | 03/31/2021 | 12/31/2020 | ||||
| Income tax and social contribution | |||||||
| Actuarial gains on defined benefit pension plan | 170,617 | 170,604 | 172,520 | 172,520 | |||
| Estimated losses for deferred income and social contribution tax credits - actuarial gains | (172,520) | (172,520) | (172,520) | (172,520) | |||
| Exchange differences on translating foreign operations | (325,350) | (325,350) | (325,350) | (325,350) | |||
| Cash flow hedge accounting | 2,309,259 | 1,742,765 | 2,309,259 | 1,742,520 | |||
| Estimated losses for deferred income and social contribution tax credits - cash flow hedge | (2,309,259) | (1,742,520) | (2,309,259) | (1,742,520) | |||
| (327,253) | (327,021) | (325,350) | (325,350) | ||||
| 18.d) | Test of recoverability of income tax and social contribution of deferred assets |
The Company’s management constantly evaluates the ability to use its tax credits. In this sense, CSN periodically updates the technical study of the projection of future taxable results to support the realization of tax credits and, consequently, to base the accounting recognition of the credits, the maintenance on the balance sheet or the constitution of a provision for loss in the realization of these credits.
The assumptions used to evaluate the impairment test in December 2020 remain valid and there is no event to justify the recognition of impairment in the quarter.
| 19. | PROVISIONS FOR TAX, SOCIAL SECURITY, LABOR, CIVIL, ENVIRONMENTAL RISKS AND JUDICIAL DEPOSITS |
Claims of different nature are being challenged at the appropriate courts. Details of the accrued amounts and related judicial deposits are as follows :
| 53 |
| (CONVENIENCE TRANSLATION INTO ENGLISH FROM THE ORIGINAL PREVIOUSLY ISSUED IN PORTUGUESE) | ||
| Quarterly Financial Information - March 31, 2021 – CIA SIDERURGICA NACIONAL | Version: 1 | |
| Consolidated | Parent Company | |||||||||||||||
| Accrued liabilities | Judicial deposits | Accrued liabilities | Judicial deposits | |||||||||||||
| 03/31/2021 | 12/31/2020 | 03/31/2021 | 12/31/2020 | 03/31/2021 | 12/31/2020 | 03/31/2021 | 12/31/2020 | |||||||||
| Tax | 132,872 | 134,645 | 68,220 | 67,819 | 62,427 | 61,004 | 49,078 | 49,078 | ||||||||
| Social security | 1,551 | 8,170 | 1,551 | 7,948 | ||||||||||||
| Labor | 314,392 | 328,334 | 225,091 | 212,737 | 210,739 | 234,333 | 162,895 | 159,138 | ||||||||
| Civil | 150,454 | 151,776 | 18,246 | 17,683 | 114,211 | 121,989 | 11,741 | 11,840 | ||||||||
| Environmental | 15,154 | 12,463 | 2,444 | 2,444 | 12,759 | 10,341 | 961 | 960 | ||||||||
| Deposit of a guarantee | 24,889 | 24,434 | ||||||||||||||
| 614,423 | 635,388 | 338,890 | 325,117 | 401,687 | 435,615 | 224,675 | 221,016 | |||||||||
| Classified: | ||||||||||||||||
| Current | 87,432 | 81,073 | 42,476 | 34,458 | ||||||||||||
| Non-current | 526,991 | 554,315 | 338,890 | 325,117 | 359,211 | 401,157 | 224,675 | 221,016 | ||||||||
| 614,423 | 635,388 | 338,890 | 325,117 | 401,687 | 435,615 | 224,675 | 221,016 | |||||||||
The changes in tax, social security, labor, civil and environmental provisions in the year ended March 31, 2021 can be summarized as follows:
| Consolidated | ||||||||||
| Current + Non-current | ||||||||||
| Nature | 12/31/2020 | Additions | Accrued charges | Net utilization of reversal | 03/31/2021 | |||||
| Tax | 134,645 | 1,016 | 2,600 | (5,389) | 132,872 | |||||
| Social security | 8,170 | 2 | (6,621) | 1,551 | ||||||
| Labor | 328,334 | 7,563 | 11,586 | (33,091) | 314,392 | |||||
| Civil | 151,776 | 323 | 8,973 | (10,618) | 150,454 | |||||
| Environmental | 12,463 | - | 2,955 | (264) | 15,154 | |||||
| 635,388 | 8,902 | 26,116 | (55,983) | 614,423 | ||||||
| Parent Company | ||||||||||||
| Current + Non-current | ||||||||||||
| Nature | 12/31/2020 | Additions | Accrued charges | Net utilization of reversal | Drop down of Cements (note 10.c) | 03/31/2021 | ||||||
| Tax | 61,004 | 1,016 | 596 | (189) | 62,427 | |||||||
| Social security | 7,948 | 2 | (6,399) | 1,551 | ||||||||
| Labor | 234,333 | 4,665 | 7,805 | (24,730) | (11,334) | 210,739 | ||||||
| Civil | 121,989 | 39 | 5,901 | (12,012) | (1,706) | 114,211 | ||||||
| Environmental | 10,341 | 2,876 | (260) | (198) | 12,759 | |||||||
| 435,615 | 5,720 | 17,180 | (43,590) | (13,238) | 401,687 | |||||||
The provision for tax, social security, labor, civil and environmental risks was estimated by Management and is mainly based on the legal counsel’s assessment. Only lawsuits for which the risk is classified as probable loss are provisioned. Additionally, tax liability from actions initiated by the Company is included in this provision and is subject to SELIC (Central Bank’s policy rate).
| § | Administrative and judicial proceedings |
The Company does not make provisions for lawsuits, which Management’s expectation, based on the opinion of legal counsel, is a possible loss. The following table shows a summary of the balance of the main matters classified as possible risk compared to the balance at March 31, 2021 and December 31, 2020.
| 54 |
| (CONVENIENCE TRANSLATION INTO ENGLISH FROM THE ORIGINAL PREVIOUSLY ISSUED IN PORTUGUESE) | ||
| Quarterly Financial Information - March 31, 2021 – CIA SIDERURGICA NACIONAL | Version: 1 | |
| Consolidated | ||||
| 03/31/2021 | 12/31/2020 | |||
| Assessment Notice and imposition of fine (AIIM) / Tax Enforcement - Income tax and social contribution - Capital gain on sale of NAMISA's shares | 12,738,987 | 12,694,021 | ||
| Assessment Notice and Imposition of fine (AIIM) - Income tax and Social contribution - Disallowance of deductions of goodwill generated in the reverse incorporation of Big Jump by NAMISA. | 3,940,658 | 3,930,093 | ||
| Assessment Notice and Imposition of fine (AIIM) / Tax Enforcement - Income tax and Social contribution - Disallowance of interest on prepayment arising from supply contracts of iron ore and port services | 1,965,378 | 1,956,898 | ||
| Assessment Notice and imposition of fine (AIIM) - Income tax and social contribution due to profits from foreign subsidiaries for years 2008, 2010, 2011, 2012 and 2014 | 3,474,130 | 3,461,574 | ||
| Tax foreclosures - ICMS - Electricity credits | 845,050 | 841,401 | ||
| Offset of taxes that were not approved by the Federal Revenue Service - IRPJ/CSLL, PIS/COFINS and IPI | 1,652,859 | 1,845,379 | ||
| Disallowance of the ICMS credits - Transfer of iron ore | 602,033 | 624,645 | ||
| ICMS - Refers to the transfer of imported raw material at an amount lower than the price disclosed in the import documentation | 319,038 | 317,848 | ||
| Disallowance of the tax loss and negative basis of social contribution arising from the adjustments in the SAPLI | 585,911 | 583,478 | ||
| Assessment Notice- IRRF- Capital Gain of CFM vendors located abroad | 261,210 | 260,326 | ||
| CFEM – difference of understanding between CSN and DNPM on the calculation basis | 1,053,997 | 1,051,661 | ||
| Assessment Notice- ICMS- questions about sales for incentive area | 1,115,413 | 1,111,034 | ||
| Other tax lawsuits (federal, state, and municipal) | 4,007,450 | 3,886,976 | ||
| Assessment Notice and imposition of fine (AIIM) - Charge of IRRF- RFB - Business combination (year 2015) between Namisa, Congonhas Minérios (current CSN Mineração) and consortium | 866,075 | 862,324 | ||
| Assessment Notice and imposition of fine (AIIM) - SEFAZ/RJ - ICMS on purchases of intermediate products | 547,676 | 498,002 | ||
| Assessment Notice and imposition of fine (AIIM) - RFB - Disallowance of credits PIS/COFINS of inputs and freight | 1,087,226 | 1,082,517 | ||
| Social security lawsuits | 222,263 | 233,116 | ||
| Action to discuss the balance of the construction contract – Tebas | 507,719 | 487,124 | ||
| Action related to power supply payment’s charge - Light | 307,071 | 288,390 | ||
| Indemnity action due to the supply contract termination - Indumill | 246,806 | 237,795 | ||
| Enforcement action applied by Brazilian antitrust authorities (CADE) | 96,239 | 95,833 | ||
| Civil Public Action - Districts / School / Nursery relocation-CdP Dam | 12,857 | 12,207 | ||
| Other civil lawsuits | 806,379 | 777,850 | ||
| Labor and social security lawsuits | 1,515,312 | 1,506,626 | ||
| Tax foreclosures – Fine – Volta Redonda IV | 99,957 | 94,304 | ||
| ACP landfill Márcia | 306,389 | 306,389 | ||
| Other environmental lawsuits | 268,425 | 257,965 | ||
| 39,452,508 | 39,305,776 | |||
During the first quarter of 2021, the Company was notified of an arbitration procedure based on an alleged unfulfillment of iron ore supply contracts. The counterparty asks for approximately US$1 billion and the Company has no knowledge of the bases used in the allegations presented, as well as has no knowledge of the basis for the estimates of the amount asked. As opposed, the Company understands to be a creditor in the contracts. Finally, the Company informs that has responded the arbitration requirements in conjunction with its legal counselors and is currently at the initial stage of its defense. The Company expects the arbitration will be concluded in 2 to 3 years. The relevance of the arbitration to the Company is related to the amount attributed to the cause and its eventual financial impact.
| 55 |
| (CONVENIENCE TRANSLATION INTO ENGLISH FROM THE ORIGINAL PREVIOUSLY ISSUED IN PORTUGUESE) | ||
| Quarterly Financial Information - March 31, 2021 – CIA SIDERURGICA NACIONAL | Version: 1 | |
The Company has been offering judicial guarantees (Guarantee Insurance / Letter of Guarantee) in the total and updated amount of R$4,566,451 as of March 31, 2021 (R$4,542,786 as of December 31,2020), as determined by the procedural legislation in force.
The assessments made by legal advisors define these administrative and judicial proceedings as a possible risk of loss and, consequently, no loss provisions have been recognized in accordance with Management’s judgment and with the Accounting Practices adopted in Brazil.
| 20. | PROVISION FOR ENVIRONMENTAL LIABILITIES AND ASSET RETIREMMENT OBLIGATIONS |
The information related to the provisions for environmental liabilities and deactivation did not change in relation to those disclosed in the financial statements of December 31, 2020. Therefore, the Company decided not to repeat them in the condensed interim financial information as of March 31, 2021.
The balance of provisions for environmental liabilities and deactivation of assets can be shown as follows:
| Consolidated | Parent Company | ||||||
| 03/31/2021 | 12/31/2020 | 03/31/2021 | 12/31/2020 | ||||
| Environmental liabilities | 196,205 | 192,830 | 181,260 | 178,638 | |||
| Asset retirement obligations (1) | 631,612 | 611,005 | 50,886 | ||||
| 827,817 | 803,835 | 181,260 | 229,524 | ||||
(1) On January 31, 2021 The provision fot assets retirement obligation – ARO was transferred to the company CSN Cimentos S.A.
| 21. | RELATED-PARTY BALANCES AND TRANSACTIONS |
The information related to transactions with related parties has not changed significantly in relation to the
disclosed in the financial statements of December 31, 2020.
| 56 |
| (CONVENIENCE TRANSLATION INTO ENGLISH FROM THE ORIGINAL PREVIOUSLY ISSUED IN PORTUGUESE) | ||
| Quarterly Financial Information - March 31, 2021 – CIA SIDERURGICA NACIONAL | Version: 1 | |
21.a) Transactions with subsidiaries, joint ventures, associates, exclusive founds and other related parties
| · | Consolidated |
| Consolidated | ||||||||||||||||
| 03/31/2021 | 12/31/2020 | |||||||||||||||
| Subsidiaries and associates | Joint-ventures e Joint Operation | Other related parties | Total | Subsidiaries and associates | Joint-ventures e Joint Operation | Other related parties | Total | |||||||||
| Assets | ||||||||||||||||
| Current Assets | ||||||||||||||||
| Investments | (1) | 4,128,923 | 4,128,923 | 3,763,603 | 3,763,603 | |||||||||||
| Trade receivables (note 6) | (2) | 12,979 | 13 | 273,990 | 286,982 | 7,686 | 8 | 113,482 | 121,176 | |||||||
| Dividends receivable (note 9) | (3) | 38,086 | 38,086 | 38,088 | 38,088 | |||||||||||
| Other current assets (note 9) | 3,347 | 1,829 | 5,176 | 4,413 | 1,829 | �� 6,242 | ||||||||||
| 12,979 | 41,446 | 4,404,742 | 4,459,167 | 7,686 | 42,509 | 3,878,914 | 3,929,109 | |||||||||
| Noncurrent Assets | ||||||||||||||||
| Investments | (1) | 132,635 | 132,635 | 123,409 | 123,409 | |||||||||||
| Loans (note 9) | (4) | 3,423 | 1,039,759 | 1,043,182 | 3,375 | 962,675 | 966,050 | |||||||||
| Actuarial asset (note 9) | 13,819 | 13,819 | 13,819 | 13,819 | ||||||||||||
| Other non-current assets (note 9) | (5) | 664,598 | 664,598 | 664,020 | 664,020 | |||||||||||
| 3,423 | 1,704,357 | 146,454 | 1,854,234 | 3,375 | 1,626,695 | 137,228 | 1,767,298 | |||||||||
| 16,402 | 1,745,803 | 4,551,196 | 6,313,401 | 11,061 | 1,669,204 | 4,016,142 | 5,696,407 | |||||||||
| Liabilities | ||||||||||||||||
| Current Liabilities | ||||||||||||||||
| Trade payables | 48,446 | 12,035 | 60,481 | 106,946 | 9,455 | 116,401 | ||||||||||
| Accounts payable (note 15) | 12 | 21,191 | 21,203 | 23,555 | 2,437 | 25,992 | ||||||||||
| Provision for consumption (note 15) | 58,093 | 58,093 | 44,466 | 44,466 | ||||||||||||
| 12 | 127,730 | 12,035 | 139,777 | 174,967 | 11,892 | 186,859 | ||||||||||
| Noncurrent Liabilities | ||||||||||||||||
| Accounts payable (note 15) | 59,917 | 59,917 | 78,083 | 78,083 | ||||||||||||
| Actuarial liability (note 15) | 79,546 | 79,546 | 79,546 | 79,546 | ||||||||||||
| 59,917 | 79,546 | 139,463 | 78,083 | 79,546 | 157,629 | |||||||||||
| 12 | 187,647 | 91,581 | 279,240 | 253,050 | 91,438 | 344,488 | ||||||||||
| Consolidated | ||||||||||||||||
| 03/31/2021 | 03/31/2020 | |||||||||||||||
| Subsidiaries and associates | Joint-ventures e Joint Operation | Other related parties | Total | Subsidiaries and associates | Joint-ventures e Joint Operation | Other related parties | Total | |||||||||
| P&L | ||||||||||||||||
| Sales | 67,925 | 412 | 753,544 | 821,881 | 21,144 | 211 | 310,634 | 331,989 | ||||||||
| Cost and expenses | (121) | (298,690) | (23,382) | (322,193) | (145,365) | (26,875) | (172,240) | |||||||||
| Financial income (expenses) | ||||||||||||||||
| Interest (note 26) | 3,721 | 4,999 | 8,720 | 65 | 11,416 | 6,338 | 17,819 | |||||||||
| Exchange rate variations and monetary, net | 26,864 | 26,864 | ||||||||||||||
| Financial investments (note 26) | 512,494 | 512,494 | (962,354) | (962,354) | ||||||||||||
| Other operating income and expenses | (3,402) | (3,402) | ||||||||||||||
| 67,804 | (294,557) | 1,247,655 | 1,020,902 | 21,209 | (137,140) | (645,393) | (761,324) | |||||||||
| 57 |
| (CONVENIENCE TRANSLATION INTO ENGLISH FROM THE ORIGINAL PREVIOUSLY ISSUED IN PORTUGUESE) | ||
| Quarterly Financial Information - March 31, 2021 – CIA SIDERURGICA NACIONAL | Version: 1 | |
| · | Parent Company |
| Parent Company | ||||||||||||||||
| 03/31/2021 | 12/31/2020 | |||||||||||||||
| Subsidiaries and associates | Joint-ventures e Joint Operation | Other related parties and exclusive funds | Total | Controladas e Coligadas | Joint Venture e Joint Operation | Outras Partes Relacionadas e Fundos exclusivos | Total | |||||||||
| Assets | ||||||||||||||||
| Current Assets | ||||||||||||||||
| Investments | (1) | 4,173,978 | 4,173,978 | 3,801,985 | 3,801,985 | |||||||||||
| Trade receivables (note 6) | (2) | 445,478 | 13 | 272,694 | 718,185 | 835,489 | 8 | 112,222 | 947,719 | |||||||
| Loans (note 9) | 59,900 | 59,900 | 53,718 | 53,718 | ||||||||||||
| Dividends receivable (note 9) | (3) | 6,753 | 21,403 | 28,156 | 308,009 | 21,404 | 329,413 | |||||||||
| Other current assets (note 9) | 17,876 | 1,829 | 19,705 | 3,888 | 1,829 | 5,717 | ||||||||||
| 530,007 | 21,416 | 4,448,501 | 4,999,924 | 1,201,104 | 21,412 | 3,916,036 | 5,138,552 | |||||||||
| Noncurrent Assets | ||||||||||||||||
| Investments | (1) | 132,635 | 132,635 | 123,409 | 123,409 | |||||||||||
| Loans (note 9) | (4) | 148,044 | 949,388 | 1,097,432 | 134,892 | 872,785 | 1,007,677 | |||||||||
| Actuarial asset (note 9) | 1,803 | 1,803 | ||||||||||||||
| Other non-current assets (note 9) | (5) | 257,870 | 664,598 | 922,468 | 236,180 | 664,020 | 900,200 | |||||||||
| 405,914 | 1,613,986 | 132,635 | 2,152,535 | 371,072 | 1,536,805 | 125,212 | 2,033,089 | |||||||||
| 935,921 | 1,635,402 | 4,581,136 | 7,152,459 | 1,572,176 | 1,558,217 | 4,041,248 | 7,171,641 | |||||||||
| Liabilities | ||||||||||||||||
| Current Liabilities | ||||||||||||||||
| Intercompany Loans (note 13) | (6) | 480,018 | 480,018 | 502,590 | 502,590 | |||||||||||
| Trade payables | 500,622 | 43,240 | 11,708 | 555,570 | 1,311,358 | 62,698 | 9,299 | 1,383,355 | ||||||||
| Accounts payable (note 15) | 103,854 | 103,854 | 102,361 | 2,437 | 104,798 | |||||||||||
| Provision for consumption (note 15) | 154,289 | 12,317 | 166,606 | 133,215 | 12,317 | 145,532 | ||||||||||
| 1,238,783 | 55,557 | 11,708 | 1,306,048 | 2,049,524 | 75,015 | 11,736 | 2,136,275 | |||||||||
| Noncurrent Liabilities | ||||||||||||||||
| Intercompany Loans (note 13) | (6) | 14,046,703 | 14,046,703 | 14,567,024 | 14,567,024 | |||||||||||
| Accounts payable (note 15) | 200,511 | 200,511 | 222,834 | 222,834 | ||||||||||||
| Actuarial liability (note 15) | 79,546 | 79,546 | 79,546 | 79,546 | ||||||||||||
| 14,247,214 | 79,546 | 14,326,760 | 14,789,858 | 79,546 | 14,869,404 | |||||||||||
| 15,485,997 | 55,557 | 91,254 | 15,632,808 | 16,839,382 | 75,015 | 91,282 | 17,005,679 | |||||||||
| Parent Company | ||||||||||||||||
| 03/31/2021 | 03/31/2020 | |||||||||||||||
| Subsidiaries and associates | Joint-ventures e Joint Operation | Other related parties and exclusive funds | Total | Subsidiaries and associates | Joint-ventures e Joint Operation | Other related parties and exclusive funds | Total | |||||||||
| Net revenue and cost | ||||||||||||||||
| Sales | 616,235 | 744,761 | 1,360,996 | 565,293 | 310,634 | 875,927 | ||||||||||
| Cost and expenses | (1,047,356) | (104,540) | (22,931) | (1,174,827) | (357,947) | (59,015) | (26,641) | (443,603) | ||||||||
| Financial income (expenses) | ||||||||||||||||
| Interest (note 26) | (101,310) | 6,258 | 4,837 | (90,215) | (95,768) | 10,287 | 5,984 | (79,497) | ||||||||
| Exclusive funds (note 26) | 6,827 | 6,827 | (30) | (30) | ||||||||||||
| Financial investments (note 26) | 512,494 | 512,494 | (962,354) | (962,354) | ||||||||||||
| Exchange rate variations and monetary, net | (1,356,059) | (1,356,059) | (3,126,688) | 26,864 | (3,099,824) | |||||||||||
| (1,888,490) | (98,282) | 1,245,988 | (740,784) | (3,015,110) | (48,728) | (645,543) | (3,709,381) | |||||||||
Consolidated and Parent Company Information:
| 1. | Financial investments |
On March 31, 2020 the investments in Usiminas shares are R$3,817,603 (R$3,305,119 in December 2020) and cash and cash equivalents with Banco Fibra totaling R$311,321 (R$458,494 in December 2020) and no current as of March 31, 2021 the amount R$132,635 (R$123,409 in December 2020) from Bonds with an average rate of 98% to 115% of the CDI in the consolidated and holds in the parent company through exclusive funds’ investments in government bonds and CDBs in the amount of R$45,344 on March 31, 2021 (R$38,517 on December 31, 2020).
| 2. | Trade receivable mainly refers to operations of sales of steel products of the Parent Company to affiliates and companies joint venture and joint-operation. |
| 3. | Dividends receivable from the MRS Logística R$38,086 (R$38,088 as of December 31, 2020) in the consolidated and parent company R$ 28,156 (R$329,413 as of December 31, 2020). |
| 4. | Loans (Assets): |
Consolidated refers mainly to loan agreements with an average rate of 125.0% to 130.0% of the CDI with Transnordestina Logística SA of R$1,043,182 (R$962,675 as of December 31, 2020).
| 58 |
| (CONVENIENCE TRANSLATION INTO ENGLISH FROM THE ORIGINAL PREVIOUSLY ISSUED IN PORTUGUESE) | ||
| Quarterly Financial Information - March 31, 2021 – CIA SIDERURGICA NACIONAL | Version: 1 | |
In the Parent Company it refers to loan agreements with Transnordestina Logística SA of R$949,388 and with Ferrovia Transnordestina SA of R$125,307on March 31, 2021 and (R$872,785 and R$112,420 on December 31, 2020, respectively).
| 5. | Others (Assets): Advance for future capital increase with subsidiaries of R$664,598 with Transnordestina Logística SA (R$664,020 on December 31, 2020). |
Controlling company
| 6. | Loans (Liabilities): |
Foreign currency: Intercompany contracts in the amount of R$14,508,441 (R$15,051,191 on December 31, 2020).
National coin: Intercompany contracts in the amount of R$18,280 (R$18,423 on December 31, 2020).
| 21.b) | Key management personal |
The key management personnel with authority and responsibility for planning, directing and controlling the Company’s activities include members of the Board of Directors and statutory officers. The following is information on the compensation of such personnel and the related balances as of March 31, 2021 and 2020.
| 03/31/2021 | 03/31/2020 | |||
| P&L | ||||
| Short-term benefits for employees and officers | 3,404 | 6,581 | ||
| Post-employment benefits | 28 | 9 | ||
| 3,432 | 6,590 | |||
| 21.c) | Guarantees |
The Company is liable for guarantees of its subsidiaries and joint ventures as follows:
| Currency | Maturities | Borrowings | Tax foreclosure | Others | Total | ||||||||||||||
| 03/31/2021 | 12/31/2020 | 03/31/2021 | 12/31/2020 | 03/31/2021 | 12/31/2020 | 03/31/2021 | 12/31/2020 | ||||||||||||
| Transnordestina Logísitca | R$ | Up to 09/19/2056 and Indefinite | 2,481,851 | 2,478,105 | 35,291 | 35,496 | 3,314 | 3,298 | 2,520,456 | 2,516,899 | |||||||||
| Cia Metalurgica Prada | R$ | Indefinite | 197 | 196 | 244 | 244 | 441 | 440 | |||||||||||
| CSN Energia | R$ | Up to 11/26/2023 and indefinite | 1,920 | 1,920 | 1,920 | 1,920 | |||||||||||||
| CSN Mineração | R$ | Up to 12/21/2024 | 846,578 | 846,749 | 846,578 | 846,749 | |||||||||||||
| Estanho de Rondônia | R$ | 07/15/2022 | 966 | 1,154 | 966 | 1,154 | |||||||||||||
| Minérios Nacional S.A. | R$ | Up to 09/10/2021 | 1,297 | 1,946 | 1,297 | 1,946 | |||||||||||||
| Total in R$ | 3,330,692 | 3,327,954 | 35,488 | 35,692 | 5,478 | 5,462 | 3,371,658 | 3,369,108 | |||||||||||
| CSN Inova Ventures | US$ | 01/28/2028 | 1,300,000 | 1,300,000 | 1,300,000 | 1,300,000 | |||||||||||||
| CSN Islands XII | US$ | Perpetual | 1,000,000 | 1,000,000 | 1,000,000 | 1,000,000 | |||||||||||||
| CSN Resources | US$ | Up to 04/17/2026 | 1,525,000 | 1,525,000 | 1,525,000 | 1,525,000 | |||||||||||||
| Total in US$ | 3,825,000 | 3,825,000 | 3,825,000 | 3,825,000 | |||||||||||||||
| Total in R$ | 21,792,173 | 19,877,378 | 21,792,173 | 19,877,378 | |||||||||||||||
| 25,122,865 | 23,205,332 | 35,488 | 35,692 | 5,478 | 5,462 | 25,163,831 | 23,246,486 | ||||||||||||
| 22. | SHAREHOLDERS´ EQUITY |
| 22.a) | Paid-in capital |
The fully subscribed and paid-in capital on March 31, 2021 and December 31, 2020 is the R$6,040 million and divided into 1,387,524,047 common and book-entry shares, with no par value. Each common share entitles its holder to one vote in the resolutions of the General Meetings.
| 22.b) | Authorized capital |
The Company’s bylaws in effect on March 31, 2021 define that the share capital may be increased to up to 2,400,000,000 shares, by decision of the Board of Directors.
| 59 |
| (CONVENIENCE TRANSLATION INTO ENGLISH FROM THE ORIGINAL PREVIOUSLY ISSUED IN PORTUGUESE) | ||
| Quarterly Financial Information - March 31, 2021 – CIA SIDERURGICA NACIONAL | Version: 1 | |
| 22.c) | Legal Reserve |
It is constituted at the rate of 5% of the net income calculated in each fiscal year pursuant to art. 193 of Law 6.404/76, up to a limit of 20% of the capital stock.
| 22.d) | Ownership structure |
As of March 31, 2021, the Company’s ownership structure was as follows:
| 03/31/2021 | 12/31/2020 | |||||||||||
| Number of common shares | % of total shares | % of voting capital | Number of common shares | % of total shares | % of voting capital | |||||||
| Vicunha Aços S.A. (*) | 679,522,254 | 48.97% | 49.24% | 679,522,254 | 48.97% | 49.24% | ||||||
| Rio Iaco Participações S.A. (*) | 52,279,803 | 3.77% | 3.79% | 58,193,503 | 4.19% | 4.22% | ||||||
| NYSE (ADRs) | 248,763,533 | 17.93% | 18.02% | 248,763,533 | 18.90% | 19.00% | ||||||
| Other shareholders | 399,548,957 | 28.80% | 28.95% | 393,635,257 | 27.40% | 27.55% | ||||||
| Outstanding shares | 1,380,114,547 | 99.47% | 100.00% | 1,380,114,547 | 99.47% | 100.00% | ||||||
| Treasury shares | 7,409,500 | 0.53% | 7,409,500 | 0.53% | ||||||||
| Total shares | 1,387,524,047 | 100.00% | 1,387,524,047 | 100.00% |
(*) Controlling group companies.
| 22.e) | Treasury shares |
As of March 31, 2021, the position of treasury shares was as follows:
| Program | Board’s Authorization | Authorized quantity | Program period | Average buyback price | Minimum and maximum buyback price | Sale of shares | Balance in treasury | |||||||
| 04/20/2018 | 30,391,000 | From 4/20/2018 to 4/30/2018 | Not applicable | Not applicable | 22,981,500 | 7,409,500 |
As of March 31, 2021, the position of treasury shares was as follows:
| Quantity purchased (in units) | Amount paid for the shares | Share price | Share market price as of 03/31/2021 (*) | |||||||
| Minimum | Maximum | Average | ||||||||
| 7,409,500 | R$ 58,264 | R$ 4.48 | R$ 10.07 | R$ 7.86 | R$ 280,820 | |||||
(*) The average share price on March 31, 2021 was used in the amount of R$37.90 per share.
22.f) Policy on investments and payment of interest on net equity and dividends
The Company adopts a profit distribution policy which, in compliance with the provisions of Law No. 6,404/76 as amended by Law No. 9,457/97, will imply the allocation of all net income to its shareholders, provided that the following priorities are preserved, regardless of its order: (i) business strategy; (ii) compliance with obligations; (iii) making the necessary investments; and (iv) the maintenance of a good financial situation for the Company.
| 22.g) | Earnings per share |
The earnings per share are shown below:
| 60 |
| (CONVENIENCE TRANSLATION INTO ENGLISH FROM THE ORIGINAL PREVIOUSLY ISSUED IN PORTUGUESE) | ||
| Quarterly Financial Information - March 31, 2021 – CIA SIDERURGICA NACIONAL | Version: 1 | |
| 03/31/2021 | 03/31/2020 | ||
| Common Shares | |||
| Profit for the period | 5,240,015 | (1,360,851) | |
| Weighted average number of shares | 1,380,114,547 | 1,380,114,547 | |
| Basic and diluted earnings (loss) per share | 3.79680 | (0.98604) |
| 23. | NET REVENUE FROM SALES |
Net sales revenue is as follows:
| Consolidated | Parent Company | |||||||
| 03/31/2021 | 03/31/2020 | 03/31/2021 | 03/31/2020 | |||||
| Gross revenue | ||||||||
| Domestic market | 6,725,615 | 3,570,496 | 6,280,868 | 3,430,097 | ||||
| Foreign market | 6,738,681 | 2,645,352 | 569,791 | 414,945 | ||||
| 13,464,296 | 6,215,848 | 6,850,659 | 3,845,042 | |||||
| Deductions | ||||||||
| Sales returns, discounts and rebates | (39,236) | (78,014) | (146,638) | (75,343) | ||||
| Taxes on sales | (1,511,732) | (803,181) | (1,330,742) | (738,390) | ||||
| (1,550,968) | (881,195) | (1,477,380) | (813,733) | |||||
| Net revenue | 11,913,328 | 5,334,653 | 5,373,279 | 3,031,309 | ||||
| 24. | EXPENSES BY NATURE |
| Consolidated | Parent Company | |||||||
| 03/31/2021 | 03/31/2020 | 03/31/2021 | 03/31/2020 | |||||
| Raw materials and inputs | (2,544,833) | (1,622,428) | (2,525,624) | (1,598,255) | ||||
| Outsourcing material | (1,062,124) | (414,451) | ||||||
| Labor cost | (669,536) | (602,766) | (296,987) | (326,852) | ||||
| Supplies | (530,911) | (460,455) | (373,608) | (390,627) | ||||
| Maintenance cost (services and materials) | (297,455) | (204,277) | (148,742) | (135,578) | ||||
| Outsourcing services | (466,064) | (422,820) | (205,140) | (231,771) | ||||
| Freight | (12,042) | (48,268) | (6,152) | (12,601) | ||||
| Distribution freight | (334,841) | (278,725) | (102,733) | (88,424) | ||||
| Depreciation, amortization and depletion | (455,673) | (415,181) | (199,983) | (206,703) | ||||
| Others | (362,354) | (58,306) | (55,843) | |||||
| (6,735,833) | (4,527,677) | (3,914,812) | (2,990,811) | |||||
| Classified as: | ||||||||
| Cost of sales | (6,178,784) | (4,017,707) | (3,689,909) | (2,778,380) | ||||
| Selling expenses | (422,586) | (390,915) | (167,212) | (162,239) | ||||
| General and administrative expenses | (134,463) | (119,055) | (57,691) | (50,192) | ||||
| (6,735,833) | (4,527,677) | (3,914,812) | (2,990,811) | |||||
The depreciation, amortization and depletion additions for the period were distributed as follows.
| 61 |
| (CONVENIENCE TRANSLATION INTO ENGLISH FROM THE ORIGINAL PREVIOUSLY ISSUED IN PORTUGUESE) | ||
| Quarterly Financial Information - March 31, 2021 – CIA SIDERURGICA NACIONAL | Version: 1 | |
| Consolidated | Parent Company | ||||||
| 03/31/2021 | 03/31/2020 | 03/31/2021 | 03/31/2020 | ||||
| Production costs (1) | (445,658) | (403,600) | (194,740) | (200,458) | |||
| Selling expenses | (3,309) | (3,276) | (1,974) | (2,729) | |||
| General and administrative expenses | (6,706) | (8,305) | (3,269) | (3,516) | |||
| (455,673) | (415,181) | (199,983) | (206,703) | ||||
| Other operational (2) | (26,844) | (21,112) | (1,742) | (2,298) | |||
| (482,517) | (436,293) | (201,725) | (209,001) | ||||
(1) - The cost of production includes PIS and COFINS credits on lease agreements on March 31, 2021, in the amount of R$1,549 (R$1.214 on March 31,2020) in the consolidated and R$267 (R$494 on March 31, 2020) in the parent company.
(1) They mainly refer to the depreciation of investment properties, paralyzed equipment and amortization of the SWT Client Portfolio, see note 25.
| 25. | OTHER OPERATING INCOME AND EXPENSES |
| Consolidated | Parent Company | |||||||
| 03/31/2021 | 03/31/2020 | 03/31/2021 | 03/31/2020 | |||||
| Other operating income | ||||||||
| Receivables by indemnity | 765 | 1,156 | 756 | 983 | ||||
| Rentals and leases | 3,283 | 2,462 | 3,170 | 2,393 | ||||
| PIS, COFINS and INSS to compensate (1) | 88,390 | 65,092 | ||||||
| Contractual fines | 765 | 2,016 | 460 | 1,410 | ||||
| Updated shares – Fair value through profit or loss (Note 14 II) | 31,004 | (207) | 31,004 | (207) | ||||
| Net gain in shares sale (note 10 d) (2) | 2,472,497 | 2,472,497 | ||||||
| Other revenues | 51,918 | 8,872 | 23,690 | 5,176 | ||||
| 2,560,232 | 102,689 | 2,531,577 | 74,847 | |||||
| - | - | - | - | |||||
| Other operating expenses | ||||||||
| Taxes and fees | (36,111) | (5,304) | (34,349) | (2,393) | ||||
| Expenses with environmental liabilities, net | 158 | (15,922) | 93 | (2,209) | ||||
| Write-off/(Provision) of judicial lawsuits | 8,623 | (7,157) | 10,622 | 3,454 | ||||
| Depreciation of investment property, equipment paralyzed and amortization of intangible assets (note 24) | (26,844) | (21,112) | (1,742) | (2,298) | ||||
| Write- off of PPE, intagible assests and investment property (note 11) | (40,464) | (1,400) | (17,072) | |||||
| Estimated (Loss)/reversal in inventories | (63,478) | (20,351) | (34,758) | (5,814) | ||||
| Idleness in stocks and paralyzed equipment (3) | (202,240) | (37,043) | ||||||
| Studies and project engineering expenses | (12,101) | (5,075) | (3,578) | (3,840) | ||||
| Research and development expenses | (54) | (197) | (54) | (197) | ||||
| Healthcare plan expenses | (28,916) | (28,829) | (28,611) | (28,693) | ||||
| Cash flow hedge accounting realized (note 14) (4) | (310,810) | (364,818) | (252,250) | (364,818) | ||||
| Other expenses | (64,115) | (96,519) | (31,948) | (90,787) | ||||
| (574,112) | (768,924) | (393,647) | (534,638) | |||||
| Other operating income (expenses), net | 1,986,120 | (666,235) | 2,137,930 | (459,791) | ||||
| 1. | In 2020, consist of the recovery of INSS credit on benefits granted to employees that should not be considered in the contribution calculation basis. |
| 2. | Refers to the public offering of shares of CSN Mineração S.A. (see note 10.d). |
| 3. | In 2020 refers to the idle capacity arisen from production volumes lower than normal it was generated from the refurbishment of the blast furnace No.3 and in the iron ore mining operation due to delays in the release of environmental licenses, which postponed the start of new ore mining fronts, as well as new dry tailing processes still in ramp-up stage. |
| 4. | As of March 31, 2021, foreign exchange cash flow hedge was realized and reclassified from Other Comprehensive Income to Other Operating Expenses (R$252,250) and cash flow hedge of PLATTS index (R$58,560), totaling R$310,810 in the consolidated and R$252,250 in the parent company, see note 14. |
| 62 |
| (CONVENIENCE TRANSLATION INTO ENGLISH FROM THE ORIGINAL PREVIOUSLY ISSUED IN PORTUGUESE) | ||
| Quarterly Financial Information - March 31, 2021 – CIA SIDERURGICA NACIONAL | Version: 1 | |
| 26. | FINANCIAL INCOME (EXPENSES) |
| Consolidated | Parent Company | |||||||
| 03/31/2021 | 03/31/2020 | 03/31/2021 | 03/31/2020 | |||||
| Financial income | ||||||||
| Related parties (note 21 a) | 11,737 | 17,819 | 19,442 | 18,254 | ||||
| Income from financial investments | 34,645 | 15,788 | 26,391 | 8,533 | ||||
| Updated shares – Fair value through profit or loss (Note 14 II) | 512,494 | 512,494 | ||||||
| Other income | 26,709 | 31,524 | 21,011 | 26,589 | ||||
| 585,585 | 65,131 | 579,338 | 53,376 | |||||
| Financial expenses | ||||||||
| Borrowings and financing - foreign currency (note 13) | (421,012) | (348,111) | (36,143) | (57,428) | ||||
| Borrowings and financing - local currency (note 13) | (65,268) | (146,269) | (58,768) | (129,052) | ||||
| Related parties | (3,017) | (102,830) | (97,782) | |||||
| Lease liabilities | (13,794) | (12,100) | (660) | (891) | ||||
| Capitalised interest (notes 11 and 29) | 15,133 | 23,390 | 6,864 | 7,280 | ||||
| Interest and fines | (35,783) | (23,720) | (15,225) | (19,473) | ||||
| (-) Adjustment present value of trade payables | (58,590) | (42,443) | ||||||
| Commission, bank fees, Guarantee and bank fees | (44,245) | (30,298) | (37,538) | (27,332) | ||||
| PIS/COFINS over financial income | (7,071) | (6,233) | (1,682) | (3,431) | ||||
| Updated shares – Fair value through profit or loss (Note 14 II) | (962,354) | (962,354) | ||||||
| Other financial expenses | (97,117) | (125,456) | (53,429) | (45,101) | ||||
| (730,764) | (1,631,151) | (341,854) | (1,335,564) | |||||
| Others financial items, net | ||||||||
| Foreign exchange and monetary variation, net | (53,266) | 461,070 | 199,448 | 1,030,129 | ||||
| Gains and (losses) on exchange derivatives (*) | (3,062) | (96,188) | (27,444) | (99,113) | ||||
| (56,328) | 364,882 | 172,004 | 931,016 | |||||
| (787,092) | (1,266,269) | (169,850) | (404,548) | |||||
| Financial income (expenses), net | (201,507) | (1,201,138) | 409,488 | (351,172) | ||||
| (*) Statement of gains and (losses) on derivative transactions (note 14) | ||||||||
| Dollar - to - real NDF | 6,758 | |||||||
| Exchange rate swap Dollar x Euro | 17,624 | 2,757 | ||||||
| Exchange rate swap GBP x Euro | 168 | |||||||
| Exchange rate swap CDI x Dollar | (27,444) | (99,113) | (27,444) | (99,113) | ||||
| (3,062) | (96,188) | (27,444) | (99,113) | |||||
| 27. | SEGMENT INFORMATION |
The financial information related to the business segments did not change in relation was disclosed in the Company's financial statements on December 31, 2020. Therefore, Management decided not to repeat it in this condensed interim financial information.
| 63 |
| (CONVENIENCE TRANSLATION INTO ENGLISH FROM THE ORIGINAL PREVIOUSLY ISSUED IN PORTUGUESE) | ||
| Quarterly Financial Information - March 31, 2021 – CIA SIDERURGICA NACIONAL | Version: 1 | |
| · | Results by segment |
For the purpose of preparing and presenting the information by business segment, Management decided to maintain the proportional consolidation of the joint ventures as historically presented. For purposes of reconciliation of the consolidated result, the amounts recorded by these companies are not included in the "Corporate expenses/elimination" column.
| 03/31/2021 | ||||||||||||||||
| P&L | Steel | Mining | Logistics | Energy | Cement | Corporate expenses/elimination | Consolidated | |||||||||
| Port | Railroads | |||||||||||||||
| Metric tons (thou.) | 1,316,938 | 8,224,928 | (1,264,055) | |||||||||||||
| Net revenues | ||||||||||||||||
| Domestic market | 4,876,219 | 791,745 | 83,516 | 400,590 | 54,281 | 277,423 | (1,221,370) | 5,262,404 | ||||||||
| Foreign market | 1,796,655 | 4,689,221 | 165,048 | 6,650,924 | ||||||||||||
| Cost of sales and services (note 24) | (4,797,790) | (1,841,259) | (55,539) | (286,743) | (34,939) | (191,446) | 1,028,932 | (6,178,784) | ||||||||
| Gross profit | 1,875,084 | 3,639,707 | 27,977 | 113,847 | 19,342 | 85,977 | (27,390) | 5,734,544 | ||||||||
| General and administrative expenses (note 24) | (282,782) | (54,089) | (8,177) | (28,502) | (7,512) | (24,855) | (151,132) | (557,049) | ||||||||
| Other operating (income) expenses, net (note 25) | (135,271) | (117,913) | (1,439) | (19,676) | (379) | (13,261) | 2,274,059 | 1,986,120 | ||||||||
| Equity in results of affiliated companies (note 10) | 13,445 | 13,445 | ||||||||||||||
| Operating result before Financial Income and Taxes | 1,457,031 | 3,467,705 | 18,361 | 65,669 | 11,451 | 47,861 | 2,108,982 | 7,177,060 | ||||||||
| Sales by geographic area | ||||||||||||||||
| Asia | 2,679,219 | 165,048 | 2,844,267 | |||||||||||||
| North America | 306,230 | 2,010,002 | 2,316,232 | |||||||||||||
| Latin America | 118,392 | 118,392 | ||||||||||||||
| Europe | 1,372,033 | 1,372,033 | ||||||||||||||
| Foreign market | 1,796,655 | 4,689,221 | 165,048 | 6,650,924 | ||||||||||||
| Domestic market | 4,876,219 | 791,745 | 83,516 | 400,590 | 54,281 | 277,423 | (1,221,370) | 5,262,404 | ||||||||
| Total | 6,672,874 | 5,480,966 | 83,516 | 400,590 | 54,281 | 277,423 | (1,056,322) | 11,913,328 | ||||||||
| 03/31/2020 | ||||||||||||||||
| P&L | Steel | Mining | Logistics | Energy | Cement | Corporate expenses/elimination | Consolidated | |||||||||
| Port | Railroads | |||||||||||||||
| Metric tons (thou.) | 1,139,612 | 5,609,498 | (1,085,951) | |||||||||||||
| Net revenues | ||||||||||||||||
| Domestic market | 2,511,198 | 263,451 | 74,539 | 282,333 | 42,028 | 145,663 | (581,268) | 2,737,944 | ||||||||
| Foreign market | 1,030,760 | 1,382,355 | 183,594 | 2,596,709 | ||||||||||||
| Cost of sales and services (note 24) | (3,237,409) | (822,810) | (49,253) | (270,492) | (29,350) | (145,069) | 536,676 | (4,017,707) | ||||||||
| Gross profit | 304,549 | 822,996 | 25,286 | 11,841 | 12,678 | 594 | 139,002 | 1,316,946 | ||||||||
| General and administrative expenses (note 24) | (214,338) | (46,374) | (9,757) | (25,510) | (7,723) | (22,912) | (183,356) | (509,970) | ||||||||
| Other operating (income) expenses, net (note 25) | (113,609) | (183,836) | (1,712) | (6,755) | (373) | (5,420) | (354,530) | (666,235) | ||||||||
| Equity in results of affiliated companies (note 10) | (45,108) | (45,108) | ||||||||||||||
| Operating result before Financial Income and Taxes | (23,398) | 592,786 | 13,817 | (20,424) | 4,582 | (27,738) | (443,992) | 95,633 | ||||||||
| Sales by geographic area | ||||||||||||||||
| Asia | 941,833 | 183,594 | 1,125,427 | |||||||||||||
| North America | 162,456 | 162,456 | ||||||||||||||
| Latin America | 34,915 | 34,915 | ||||||||||||||
| Europe | 833,200 | 440,522 | 1,273,722 | |||||||||||||
| Others | 189 | 189 | ||||||||||||||
| Foreign market | 1,030,760 | 1,382,355 | 183,594 | 2,596,709 | ||||||||||||
| Domestic market | 2,511,198 | 263,451 | 74,539 | 282,333 | 42,028 | 145,663 | (581,268) | 2,737,944 | ||||||||
| Total | 3,541,958 | 1,645,806 | 74,539 | 282,333 | 42,028 | 145,663 | (397,674) | 5,334,653 | ||||||||
| 28. | INSURANCE |
In order to adequately mitigate risks and in view of the nature of its operations, the Company and its Subsidiaries contract several different types of insurance policy. The policies are taken out in line with the Risk Management policy and are similar to the insurance taken out by other companies in the same industry in which CSN and its subsidiaries operate. The coverage of these policies includes: National Transport, International Transport, Life and Personal Accident Insurance, Health, Vehicle Fleet, D&O (Administrators Liability Insurance), General Liability, Engineering Risks, Named Risks, Export Credit, Insurance Warranty and Civil Liability Port Operator.
| 64 |
| (CONVENIENCE TRANSLATION INTO ENGLISH FROM THE ORIGINAL PREVIOUSLY ISSUED IN PORTUGUESE) | ||
| Quarterly Financial Information - March 31, 2021 – CIA SIDERURGICA NACIONAL | Version: 1 | |
In 2020, after negotiations with insurers and reinsurers in Brazil and abroad, an Operational Risk Insurance Policy for Property Damage and Business Interruption was issued, effective from June 30, 2020 to June 30, 2021. Under the policy, the Maximum Indemnity Limit is US$ 600 million and the deductible is US $ 385 million for material damages and 45 days for loss of profits, covering the following units and subsidiaries of the Company: Usina Presidente Vargas, CSN Mineração SA and Sepetiba Tecon.
The risk assumptions adopted, given their nature, are not part of the scope of an audit of the financial statements, and consequently were not examined by our independent auditors.
| 29. | ADDITIONAL INFORMATION TO CASH FLOWS |
The following table presents additional information on transactions related to the statement of cash flows:
| Consolidated | Parent Company | ||||||
| 03/31/2021 | 03/31/2020 | 03/31/2021 | 03/31/2020 | ||||
| Income tax and social contribution paid | 1,466,584 | 231,350 | |||||
| Addition to PP&E with interest capitalization (notes 11 and 26) | 15,133 | 23,390 | 6,864 | 7,280 | |||
| Remeasurement and addition – Right of use (note 11 a) | 62,365 | 555 | 876 | 341 | |||
| Addition to PP&E without adding cash | 37,359 | ||||||
| Capitalization in subsidiaries without cash | 18,566 | ||||||
| Addition to investment property without cash effect | 61,597 | 61,597 | |||||
| 1,581,441 | 316,892 | 7,740 | 87,784 | ||||
| 30. | COMPREHENSIVE INCOME STATEMENT |
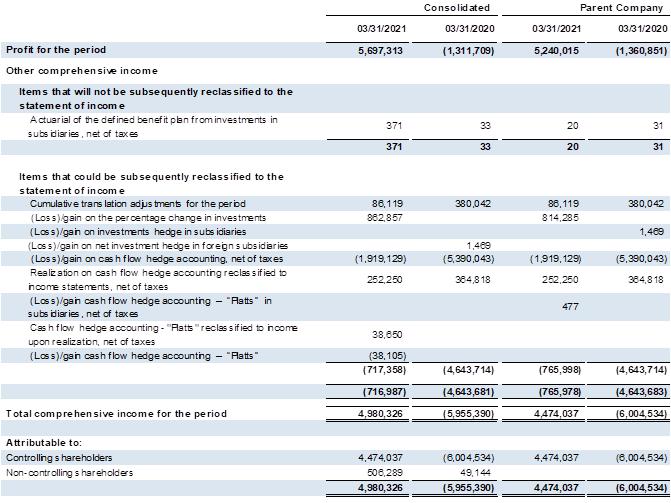
| 65 |
| (CONVENIENCE TRANSLATION INTO ENGLISH FROM THE ORIGINAL PREVIOUSLY ISSUED IN PORTUGUESE) | ||
| Quarterly Financial Information - March 31, 2021 – CIA SIDERURGICA NACIONAL | Version: 1 | |
| 31. | SUBSEQUENT EVENTS |
| · | The Usiminas’ shares classified as financial investments (see note 4) are exposed to changes in the share price due to the securities adopted at fair value through profit or loss according to quotations on the Stock Exchange. On April 27, 2021, common and preferred shares appreciated in the global amount of R$1,319,411 since the balance sheet closing date. |
| · | In April 2021, the subsidiary CSN Mineração opted for a cash flow hedge accounting applied to a portion of its iron ore sales to mitigate the risk of volatility of the Platts index, for a limited amount of 1,9 million tons iron ore to be shipped from second quarter to 2021 |
| 66 |
| (CONVENIENCE TRANSLATION INTO ENGLISH FROM THE ORIGINAL PREVIOUSLY ISSUED IN PORTUGUESE) | ||
| Quarterly Financial Information - March 31, 2021 – CIA SIDERURGICA NACIONAL | Version: 1 | |
Independent Auditor’s Report on the Financial Information
(Free translation from the original issued in Portuguese. In the event of any discrepancies, the Portuguese language version shall prevail.)
To the Shareholders, Directors and Management of
Companhia Siderurgica Nacional
São Paulo - SP
Introduction
We have reviewed the accompanying individual and consolidated interim financial information of Companhia Siderurgica Nacional (“Company”), identified as Parent and Consolidated, respectively, included in the Interim Financial Information Form (ITR) for the quarter ended March 31, 2021, which comprises the balance sheet as of March 31, 2021 and the related statement of profit and loss and statement of comprehensive income (loss) and the statement of changes in equity and statement of cash flows for the three-month period then ended, including a summary of significant accounting policies and other explanatory notes.
Management is responsible for the preparation of the individual and consolidated interim financial information in accordance with Technical Pronouncement CPC 21 (R1) - Interim Financial Reporting and IAS 34 - Interim Financial Reporting, issued by the International Accounting Standards Board (IASB), as well as for the presentation of such information in accordance with the standards issued by the Brazilian Securities and Exchange Commission (CVM) applicable to the preparation of Interim Financial Information (ITR). Our responsibility is to express a conclusion on this interim financial information based on our review.
Scope of review
We conducted our review in accordance with Brazilian and international standards on review of interim financial information (NBC TR 2410 - Review of Interim Financial Information Performed by the Independent Auditor of the Entity and ISRE 2410 - Review of Interim Financial Information Performed by the Independent Auditor of the Entity, respectively). A review of interim financial information consists of making inquiries, primarily of persons responsible for financial and accounting matters, and applying analytical and other review procedures. A review is substantially less in scope than an audit conducted in accordance with the standards on auditing and consequently does not enable us to obtain assurance that we would become aware of all significant matters that might be identified in an audit. Accordingly, we do not express an audit opinion.
Conclusion on the individual and consolidated interim financial information
Based on our review, nothing has come to our attention that causes us to believe that the accompanying individual and consolidated interim financial information included in the Interim Financial Information Form (ITR) referred to above is not prepared, in all material respects, in accordance with CPC 21 (R1) and IAS 34 applicable to the preparation of interim financial information and presented in accordance with the standards issued by the Brazilian Securities and Exchange Commission (CVM).
Emphasis of matter
Ability of the jointly controlled subsidiary Transnordestina Logística S.A. to continue as a going concern
We draw attention to note 10.f) to the individual and consolidated financial statements, which describes the percentage of completion of the new railway network by the jointly controlled subsidiary Transnordestina Logística S.A. (TLSA), currently under construction and originally scheduled to be completed by January 2017, is currently being revised and discussed by the relevant regulatory bodies. The completion of the work under the project (and consequent start of operations) is contingent upon receiving ongoing financial contribution from TLSA´s shareholders and third parties. These events and conditions, together with other issues described in said Note indicate the existence of significant uncertainty that may raise significant doubt as to TLSA´s ability to continue as a going concern. Our conclusion is not qualified regarding this matter.
| 67 |
| (CONVENIENCE TRANSLATION INTO ENGLISH FROM THE ORIGINAL PREVIOUSLY ISSUED IN PORTUGUESE) | ||
| Quarterly Financial Information - March 31, 2021 – CIA SIDERURGICA NACIONAL | Version: 1 | |
Other matters
Interim statement of value added
The quarterly information referred to above includes the individual and consolidated statements of value added for the period of nine months ended September 30, 2020, prepared under the responsibility of the Company's management and presented as supplementary information for the purposes of IAS 34. These statements were submitted to the same review procedures in conjunction with the review of the Company's interim financial information in the order to conclude they are reconciliated to the interim financial information and to the accounting records, as applicable, and whether the structure and content are in accordance with the criteria established in the NBC TG 09 - Statement of Value Added. Based on our review, nothing has come to our attention that causes us to believe that the accompanying statements of value added were not prepared, in all material respects, in accordance with the individual and consolidated interim financial information taken as a whole.
São Paulo, April 28, 2021
Nelson Fernandes Barreto Filho
CT CRC 1SP-151.079/O-0
Grant Thornton Auditores Independentes
CRC 2SP-025.583/O-1
| 68 |
SIGNATURE
Pursuant to the requirements of the Securities Exchange Act of 1934, the registrant has duly caused this report to be signed on its behalf by the undersigned, thereunto duly authorized.
Date: May 6, 2021
| COMPANHIA SIDERÚRGICA NACIONAL | |
| By: | /S/ Benjamin Steinbruch |
Benjamin Steinbruch Chief Executive Officer | |
| By: | /S/ Marcelo Cunha Ribeiro |
Marcelo Cunha Ribeiro Chief Financial and Investor Relations Officer | |
FORWARD-LOOKING STATEMENTS
This press release may contain forward-looking statements. These statements are statements that are not historical facts, and are based on management's current view and estimates of future economic circumstances, industry conditions, company performance and financial results. The words "anticipates", "believes", "estimates", "expects", "plans" and similar expressions, as they relate to the company, are intended to identify forward-looking statements. Statements regarding the declaration or payment of dividends, the implementation of principal operating and financing strategies and capital expenditure plans, the direction of future operations and the factors or trends affecting financial condition, liquidity or results of operations are examples of forward-looking statements. Such statements reflect the current views of management and are subject to a number of risks and uncertainties. There is no guarantee that the expected events, trends or results will actually occur. The statements are based on many assumptions and factors, including general economic and market conditions, industry conditions, and operating factors. Any changes in such assumptions or factors could cause actual results to differ materially from current expectations.