SECURITIES AND EXCHANGE COMMISSION
Washington, D.C. 20549
FORM 6-K
Report of Foreign Private Issuer
Pursuant to Rule 13a-16 or 15d-16 of the
Pursuant to Rule 13a-16 or 15d-16 of the
Securities Exchange Act of 1934
For the month of August, 2022
Commission File Number 1-14732COMPANHIA SIDERÚRGICA NACIONAL
(Exact name of registrant as specified in its charter)
National Steel Company
(Translation of Registrant's name into English)
Av. Brigadeiro Faria Lima 3400, 20º andar
São Paulo, SP, Brazil
04538-132
São Paulo, SP, Brazil
04538-132
(Address of principal executive office)
Indicate by check mark whether the registrant files or will file annual reports
under cover Form 20-F or Form 40-F. Form 20-F ___X___ Form 40-F _______
under cover Form 20-F or Form 40-F. Form 20-F ___X___ Form 40-F _______
Indicate by check mark whether the registrant by furnishing the information contained in this Form is also thereby furnishing the information to the Commission pursuant to Rule 12g3-2(b) under the Securities Exchange Act of 1934.
Yes _______ No ___X____ 
 | 2Q22 RESULTS |
São Paulo, August 15, 2022 - Companhia Siderúrgica Nacional ("CSN") (B3: CSNA3) (NYSE: SID) discloses its second quarter of 2022 (2Q22) financial results in Brazilian Reais, with all financial statements consolidated in accordance with accounting practices adopted in Brazil issued by the Accounting Pronouncements Committee ("CPC"), approved by the Brazilian Securities and Exchange Commission ("CVM") and the Federal Accounting Council ("CFC") and in accordance with international financial reporting standards (“IFRS”), issued by the International Accounting Standards Board (“IASB”).
The comments address the Company's consolidated results in the second quarter of 2022 (2Q22) and the comparisons are in relation to the second quarter of 2021 (2Q21) and the first quarter of 2022 (1Q22). The BRL/USD exchange rate was 5.00 on 06/30/2021; 4.74 on 03/31/2022 and 5.24 on 06/30/2022.
Operational and financial highlights of 2Q22

For more information, please visit our website: https://ri.csn.com.br/en | 2 |
| | 2Q22 RESULTS |
Consolidated Table - Highlights

¹ Adjusted EBITDA is calculated from net income (loss), plus depreciation and amortization, taxes on income, net financial result, income from investment participation, income from other operating income/expenses and includes a proportional participation of 37.27% of the EBITDA of the joint subsidiary MRS Logística.
² Adjusted Ebitda Margin is calculated from Adjusted Ebitda divided by Management Net Revenue.
³ Adjusted Net Debt and Adjusted Cash/Availability consider 37.27% of MRS, in addition to not considering Forfaiting and Cashed Risk transactions.
Consolidated Results
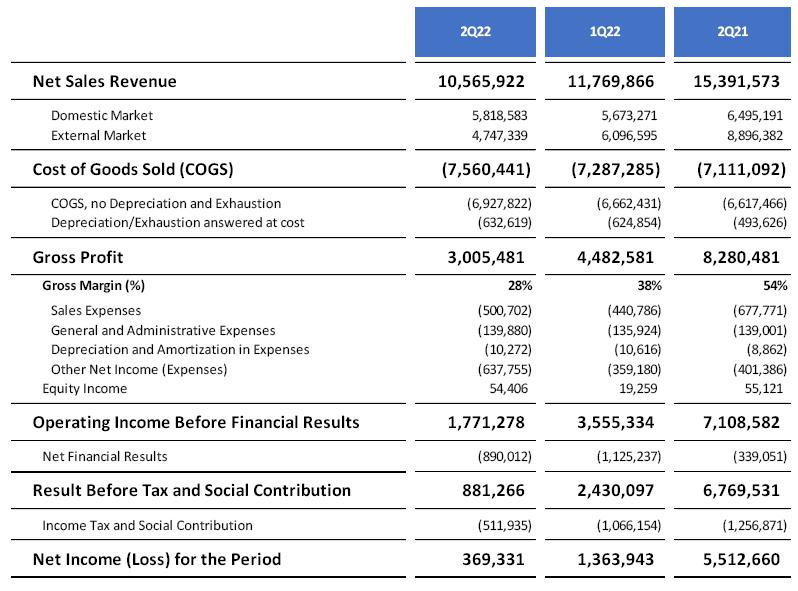
· Net revenue accrued BRL 10,566 million in 2Q22, representing a 10.2% decline when compared to 1Q22. This result is mainly a consequence of Platts’ negative price adjustments in the mining segment, that ended up offsetting the higher sales volume in the period.
· The cost of goods sold (COGS) totaled BRL 7,560 million in 2Q22, representing an increase of 3.7% compared to 1Q22, as a result of historical price increases of some raw materials such as coal and coke, as well as higher costs of fleet movement in the mining and steel operations, with the rise of fuel prices.
· The decrease in revenue, with higher cost pressure, negatively impacted the gross margin that reached 28% in 2Q22 and was 9.6 p.p. lower than 1Q22. This performance mainly reflects the price contraction observed in the mining segment.
· In 2Q22, sales, general and administrative expenses totaled BRL 651 million, a level 10.8% higher than 1Q22, as a consequence of the better commercial activity observed in the period for the mining and cement segments, generating a higher freight expense, further enhanced by the increase in the C3 route in the quarter.
· The group of other operating income and expenses was negative in BRL 638 million in 2Q22, mainly affected by the hedge accounting cash flow operations that totaled BRL 342 million in the period.
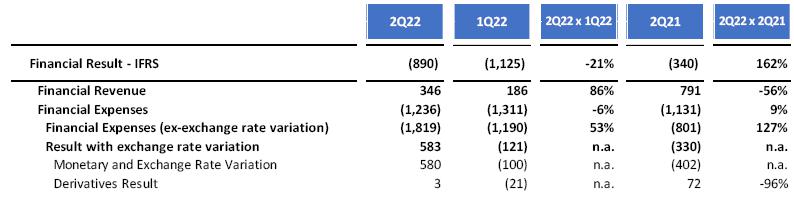
· The financial result was BRL 890 million negative in 2Q22, representing a 21% decline compared to the previous quarter, as a consequence of the currency exchange rate, but partially offset by the devaluation of Usiminas shares.
For more information, please visit our website: https://ri.csn.com.br/en | 3 |
| | 2Q22 RESULTS |
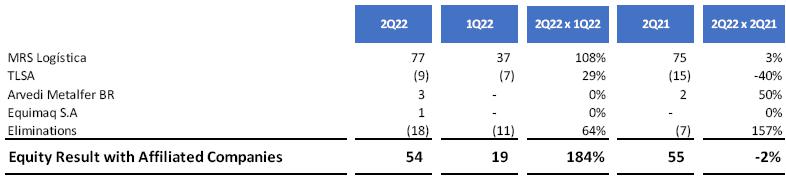
· The equity result was positive at BRL 54 million in 2Q22, a performance 184% higher than in the previous quarter, as a consequence of the MRS results recovery of levels closer to those recorded last year.
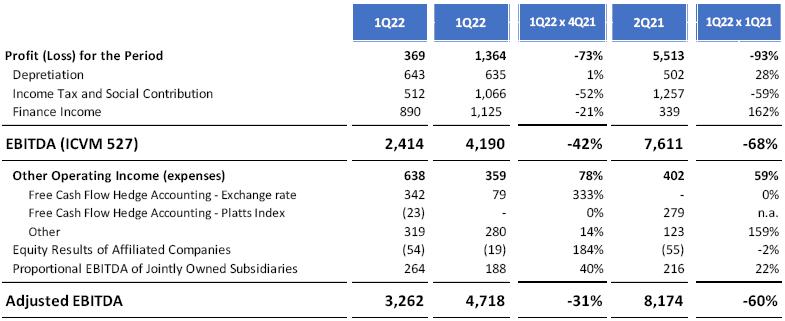
· In 2Q22, the Company's net income was BRL 369 million, a result 73% lower than last quarter, highlighting the Platts price adjustment impact in the Company, which was partially offset by solid steel results and record cement results.
Adjusted EBITDA
* The Company discloses its adjusted EBITDA excluding participation in investments and other operating income (expenses), understanding that it should not be considered in the calculation of recurring Operational Cash generation.
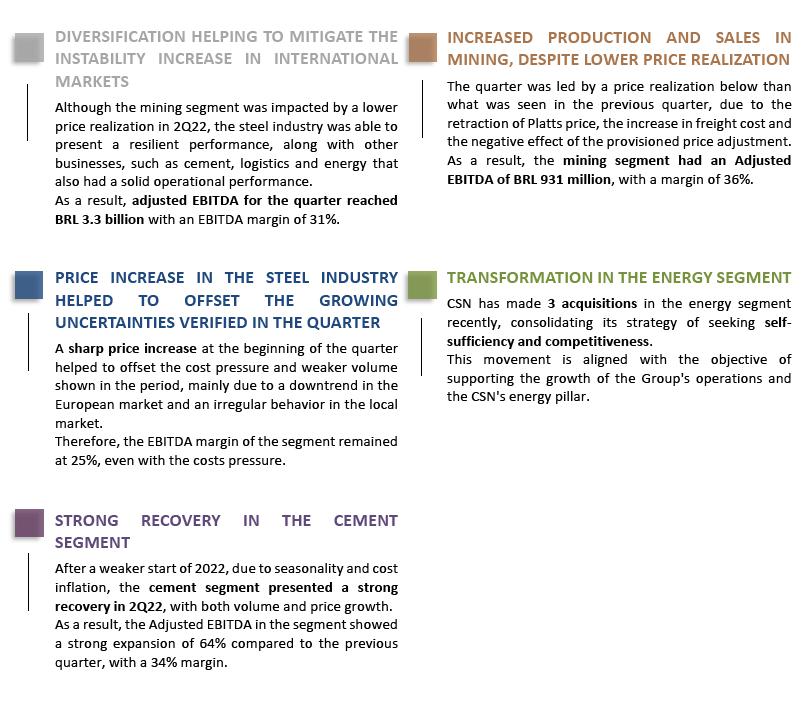
· In 2Q22, Adjusted EBITDA was BRL 3,262 million, with an Adjusted EBITDA margin of 29.7% or 9.2 p.p. below than last quarter. This reduction in profitability is a direct consequence of the performance in the mining segment, there is stability in the steel industry and a strong recovery in profitability for cement, which once again presented margins above 30% (it was 34.2% in 2Q22).
For more information, please visit our website: https://ri.csn.com.br/en | 4 |
| | 2Q22 RESULTS |
Adjusted EBITDA (BRL MM) and Adjusted Margin¹ (%)

¹ Adjusted EBITDA Margin is calculated from the division between Adjusted EBITDA and Adjusted Net Revenue, which considers 100% of the stakes in CSN Mineração's consolidation and 37.27% in MRS.
Adjusted Cash Flow¹
Adjusted Cash Flow in 2Q22 reached BRL 830 million in 2Q22, reversing the negative result observed in the previous quarter with the normalization of working capital and the seasonality in the payment of taxes verified in 1Q22. Additionally, the cash flow of 2Q22 was positively impacted by the reduction in working capital that was able to mitigate the lower operating result with a reduction in accounts receivable, even considering increases in CAPEX and financial expenses.
Adjusted cash flow¹ in 2Q22 (BRL MM)
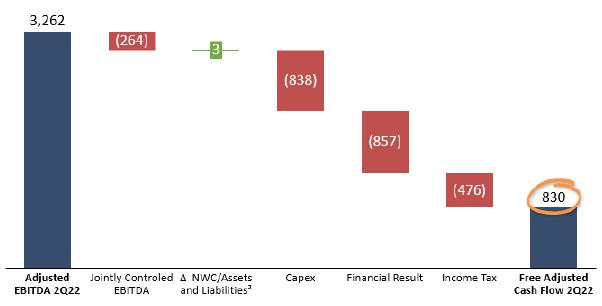
¹ The concept of adjusted cash flow is calculated from adjusted Ebitda, subtracting Ebitda from Jointly Controlled Companies, CAPEX, IT, Financial Results and Changes in Assets and Liabilities², excluding the effect of the Glencore advance.
² Adjusted Working Capital is composed by the change in Net Working Capital, plus the change in accounts of long-term assets and liabilities and disregarding the net change in IT and SC.
Debt
On June 30, 2022, consolidated net debt reached BRL 21,034 million, with the maintenance of high cash levels, and with the leverage indicator measured by the Net Debt/EBITDA ratio reaching 1.31x. This increase in leverage is a consequence of the exchange rate variation and disbursements made in the period, such as the payment of dividends and interests on equity, in addition to the acquisition of the Santa Ana and Sacre SHPs.
For more information, please visit our website: https://ri.csn.com.br/en | 5 |
| | 2Q22 RESULTS |
Debt (BRL Billion) and
Net Debt / Adjusted EBITDA (x)
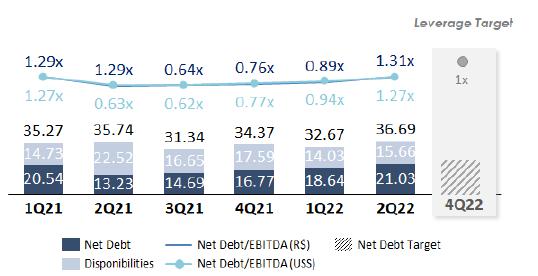
¹ Net Debt / EBITDA: To calculate the debt, please consider the final dollar of each period and for net debt and EBITDA the average dollar of the period.
The Company remains very active in its objective of extending its debt: during the second quarter of 2022, CSN concluded a long-term operation with SACE in the amount of USD 375 MM through its subsidiary CMIN, which also issued its 2nd infrastructure debenture operation of BRL 1.4 billion. These resources will be used in capacity expansion projects in the mining segment.
Amortization Schedule (BRL Bi)
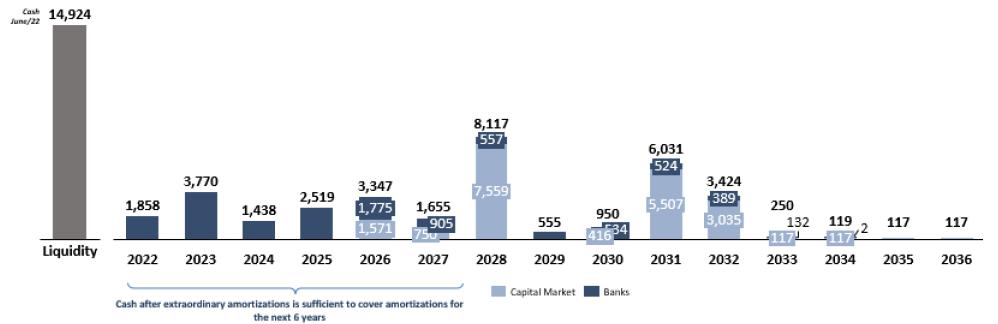
¹ IFRS: does not consider participation in MRS (37.27%).
² Gross Debt/Management Net considers participation in MRS (37.27%) and gross interest.
3 Medium term after completion of the Liability Management Plan.
Foreign Exchange Exposure
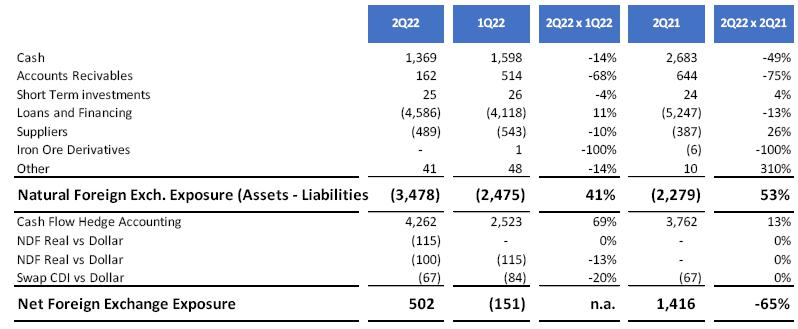
The accrued net foreign exchange exposure in the consolidated Balance Sheet of 2Q22 was USD 502 million, as shown in the table below, in line with the company's policy of minimizing the impacts of exchange rate volatility on its results. The Hedge Accounting adopted by CSN correlates with the projected dollar exports flow of future debt maturities in the same currency. Therefore, the dollar debt exchange variation is temporarily recorded in the equity, being brought to the result when the dollar revenues from said exports occur.
For more information, please visit our website: https://ri.csn.com.br/en | 6 |
| | 2Q22 RESULTS |
Investments
A total of BRL 838 million was invested in 2Q22, an increase of 20% compared to the previous quarter, as a result of the advances in mining expansion projects (Itabirito, tailings filtration and port expansion), as well as repairs of UPV's steel operations and coke batteries.

Net Working Capital
The Net Working Capital applied to the business totaled BRL 4,301 million in 2Q22, a decrease of 2% when compared to 1Q22, with the reduction in receivables partially offset by punctually high inventories due to the costs of the raw material.
The calculation of the Net Working Capital applied to the business does not take Glencore's advance, as shown in the following table:
For more information, please visit our website: https://ri.csn.com.br/en | 7 |
| | 2Q22 RESULTS |
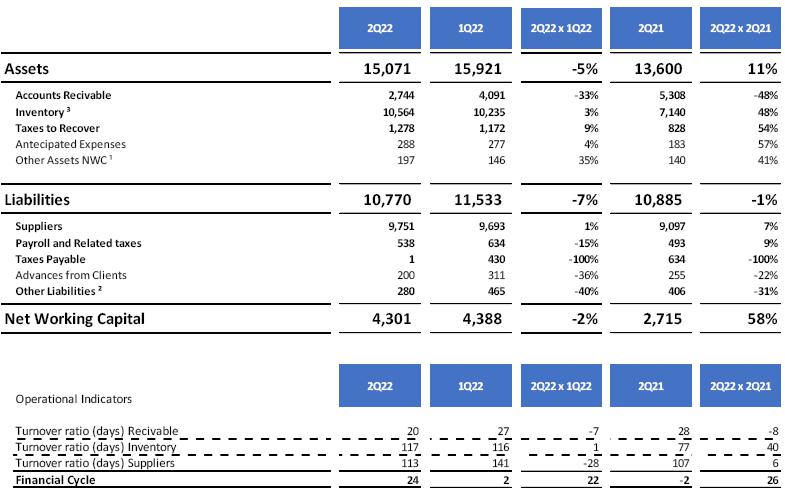
¹ Other CCL Assets: Considers employees advances and other accounts receivable.
² Other CCL Liabilities: Considers other accounts payable, dividends payable, installment taxes and other provisions.
³ Inventories: Does not consider the effect of the provision for inventory losses. For the calculation of the SME, warehouse balances are not considered
Acquisitions in the Energy Sector
Recently, the Company announced the acquisition of 3 different assets in the energy segment, consolidating its strategy of achieving self-sufficiency in energy. On April 8, 2022, the Company announced to the market the acquisition of SHP's Santa Ana and Sacre, which has an installed capacity of 36.3 MW, with the closing of this acquisition occurring on 06/30/22 and the assets being directed to cement operations. Also, the acquisition of the Quebra-Queixo Hydroelectric Powerplant announcement was made on 07/25/2022 and the conclusion is still pending on regulatory approvals. This asset has an installed capacity of 120 MW (guaranteed capacity of 57.4 MW) and will support the energy supply for mining expansion projects. Finally, on 07/29/2022, the Company won the privatization auction of CEEE-G, a relevant renewable generation platform in Rio Grande do Sul, with 15 own assets (HEPs and SHPs), a total installed capacity of 920 MW and an average physical guaranteed capacity of 399 MW, along with 11 minor participations and 3 wind projects under development.
For more information, please visit our website: https://ri.csn.com.br/en | 8 |
| | 2Q22 RESULTS |
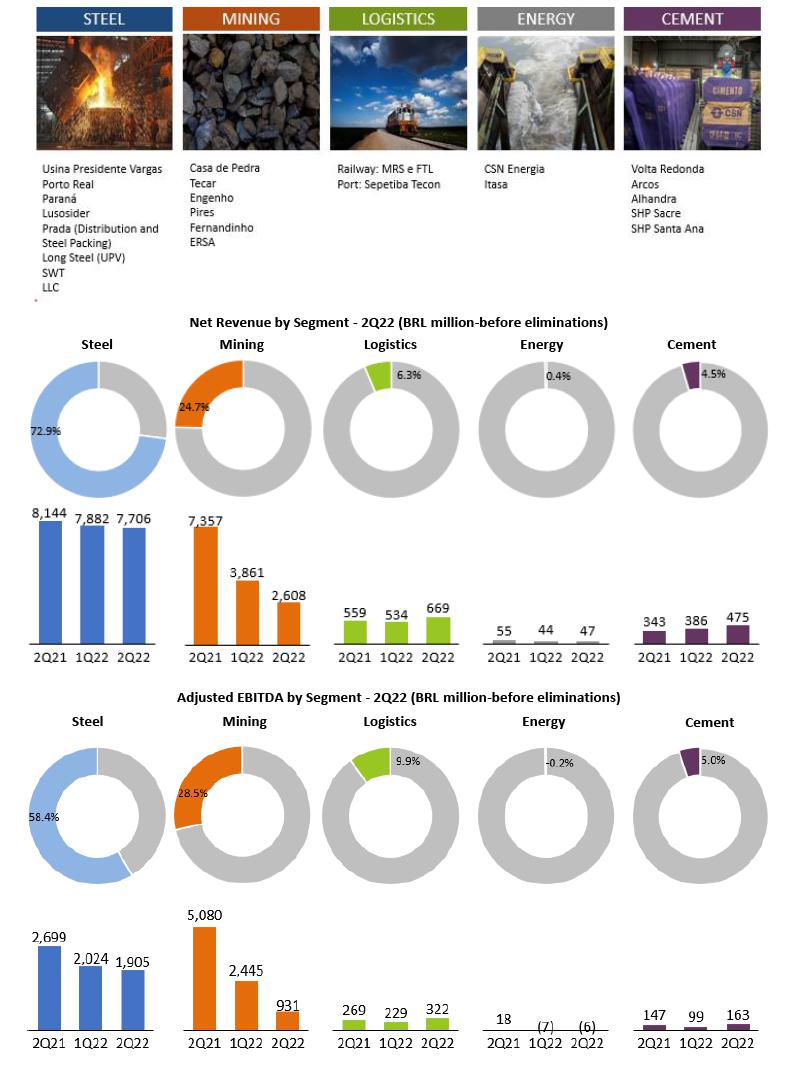
Results by Business Segments
For more information, please visit our website: https://ri.csn.com.br/en | 9 |
| | 2Q22 RESULTS |
| 2Q22 Results (BRL million) | Steel | Mining | Logistics (Port) | Logistics (Railway) | Energy | Cement | Corporate Expenses/Elimination | Consolidated |
| Net Revenue | 7,706 | 2,608 | 77 | 592 | 47 | 475 | (940) | 10,566 |
| Internal Market | 5,248 | 411,20 | 77 | 592 | 47 | 475 | (1,032) | 5,819 |
| Foreign Market | 2,458 | 2,196 | - | - | - | - | 93 | 4,747 |
| COGS | (5,789) | (1,832) | (53) | (386) | (49) | (301) | 849 | (7,560) |
| Gross profit | 1,917 | 776 | 24 | 206 | (2) | 174 | (90) | 3,005 |
| DGA/DVE | (313) | (87.03) | (8) | (34) | (8) | (69) | (132) | (651) |
| Depreciation | 301 | 242 | 8 | 126 | 4 | 57 | (95) | 643 |
| Proportional EBITDA of joint contr. | - | - | - | - | - | 265 | 265 | |
| Adjusted EBITDA | 1,905 | 931 | 24 | 298 | (6) | 163 | (52) | 3,262 |
| 1Q22 Results (BRL million) | Steel | Mining | Logistics (Port) | Logistics (Railway) | Energy | Cement | Corporate Expenses/Elimination | Consolidated |
| Net Revenue | 7,882 | 3,861 | 76 | 458 | 44 | 386 | (938) | 11,770 |
| Internal Market | 5,185 | 515,38 | 76 | 458 | 44 | 386 | (991) | 5,673 |
| Foreign Market | 2,697 | 3,346 | - | - | - | - | 53 | 6,097 |
| COGS | (5,827) | (1,595) | (55) | (342) | (47) | (272) | 850 | (7,287) |
| Gross profit | 2,055 | 2,266 | 21 | 117 | (3) | 114 | (88) | 4,483 |
| DGA/DVE | (327) | (62.42) | (10) | (31) | (9) | (69) | (80) | (587) |
| Depreciation | 295 | 242 | 9 | 123 | 4 | 54 | (92) | 635 |
| Proportional EBITDA of joint contr. | - | - | - | - | - | 187 | 187 | |
| Adjusted EBITDA | 2,024 | 2,445 | 20 | 209 | (7) | 99 | (72) | 4,718 |
| 2Q21 Results (BRL million) | Steel | Mining | Logistics (Port) | Logistics (Railway) | Energy | Cement | Corporate Expenses/Elimination | Consolidated |
| Net Revenue | 8,144 | 7,357 | 72 | 487 | 55 | 343 | (1,067) | 15,392 |
| Internal Market | 6,050 | 904 | 72 | 487 | 55 | 343 | (1,415) | 6,495 |
| Foreign Market | 2,094 | 6,453 | - | - | - | - | 349 | 8,896 |
| COGS | (5,452) | (2,312) | (52) | (312) | (35) | (204) | 1,255 | (7,111) |
| Gross profit | 2,693 | 5,045 | 20 | 175 | 21 | 139 | 188 | 8,280 |
| DGA/DVE | (250) | (141) | (11) | (31) | (8) | (33) | (352) | (826) |
| Depreciation | 256 | 176 | 9 | 108 | 4 | 42 | (92) | 502 |
| Proportional EBITDA of joint contr. | - | - | - | - | - | 217 | 217 | |
| Adjusted EBITDA | 2,699 | 5,080 | 17 | 252 | 18 | 147 | (39) | 8,174 |
Steel Result
According to the World Steel Association (WSA), global crude steel production totaled 490.3 million tons (Mt) in the quarter, 4.2% below the same period in 2021 as a result of the impacts from the conflict between Russia and Ukraine and the outcome of stricter social distancing policies in some Chinese cities. China produced 57% of the global volume (280.1 Mt), which represents a reduction of 3.8% compared to the same period in 2021. Despite this slowdown, the Chinese government has sought to increase investment in infrastructure through economic stimulus that should keep demand at a high level throughout this year. Brazil produced 8.8 Mt in the quarter, which corresponds to an annual decline of 6.4%, as a result of the cost pressure suffered by the industry in the first half, in addition to the increase in uncertainties regarding the demand sustainability. For 2022, the global market is expected to have a stable production of approximately 1,840 Mton.
Steel Production (thousand tons)
CSN’s plate production on the 2Q22 totaled 890,000 tons, a stable performance compared to the previous quarter. However, the production of flat laminates, our main market of operation, reached 767 kton, which represents a contraction of 7.3% in relation to 1Q22, due to planned maintenance on the production line.
For more information, please visit our website: https://ri.csn.com.br/en | 10 |
| | 2Q22 RESULTS |
Sales Volume (Kton) - Steel
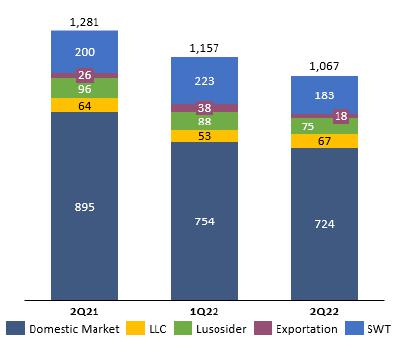
Total sales reached 1,067.000 tons in the second quarter of 2022, a volume 7.8% lower than last quarter. When analyzing the evolution in the different markets, it is noticed that domestic sales totaled 724,000 tons of steel products and were 4% lower than in 1Q22, as a result of uncertainties regarding price dynamics and demand behavior. In the foreign market, 2Q22 sales accrued 342,000 tons, 15% below the 1Q22 volume, as a consequence of a lower commercial activity in the operations of SWT and Lusosider, resulting from the lower consumption of steel in the European market and all the instability brought by the conflict between Russia and Ukraine. In the quarter, 18,000 tons were exported directly, and 324,000 tons were sold by our subsidiaries abroad, with 67,000 tons by LLC (25% quarterly increase), 183,000 tons by SWT and 75,000 tons by Lusosider.
In relation to the total sales volume, in 2Q22, compared to the previous quarter, the automotive (+40%), home appliances (+40%) and general industry (+35%) segments were the main positive highlights of the quarter, and ended up compensating for the more uncertain period experienced by the distribution sector.
According to ANFAVEA (National Association of Motor Vehicle Manufacturers), the production in the second quarter registered 596,000 units, a 20% increase when compared to last quarter and an 8.1% increase compared to the same period of 2021. The Association also projects a 4.1% growth in production for 2022, with a production of 2,340,000 vehicles units.
According to the Brazil Steel Institute (IABr) data, crude steel production in the quarter accrued 8.8Mt, a performance 4.7% lower than in the same period last year. Apparent Consumption was 6.1 Mton, a 15.6% retraction compared to 2Q21. Also, the Steel Industry Confidence Indicator (ICIA) of June was 45.4 points, a drop of 5.7 p.p. compared to March and below the 50-point dividing line, which indicates lower confidence for the next six months in the local market.
According to the IBGE data, the monthly index of household appliance production in the first two months of the quarter recorded a 16.9% decline compared to the same period of the previous year. For this year, the home appliances market is expected to have a moderate growth after the strong sales volume seen in the sector in 2020 and 2021. | Sale by Market Segment
|

| · | Net revenue in Steel reached BRL 7,706 million in 2Q22, 2% lower than in 1Q22. As commented earlier, the increase in the sales price was eventually offset by the reduction in the volume sold. In this sense, the average domestic market price in 2Q22 was 5.3% higher than in 1Q22, a performance that accompanies the increase in the prices of raw materials for steel production. Moreover, the average foreign market price was 7.1% higher compared to last quarter, a performance pulled by U.S. and Germany domestic prices, which showed a strong growth at the beginning of the quarter. |
For more information, please visit our website: https://ri.csn.com.br/en | 11 |
| | 2Q22 RESULTS |
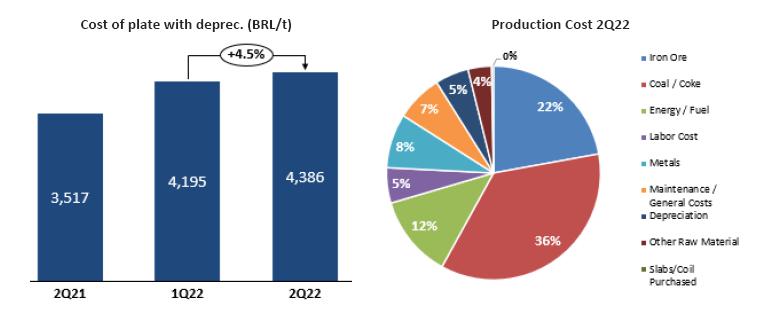
| · | The cost of consumed plate in 2Q22 reached BRL 4,386/t, which represents a 4.5% increase over the previous quarter as a result of (i) the increase in the coal price, (ii) the increase in the price of gas used for the manufacture of steel, and (iii) the lower dilution of fixed costs due to the lower volume of production. |
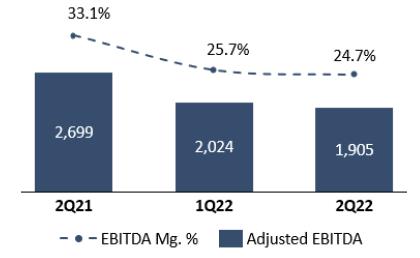
| · | The Company's steel Adjusted EBITDA reached BRL 1,905 million in 2Q22 and was 5.8% lower than in 1Q22, with an EBITDA margin of 24.7% (-0.9 p.p.). Despite the lower profitability and increased cost pressure of some raw materials at the beginning of the year, this performance reinforces the Company's resilience and the ability to generate results even in an environment of inflationary pressure and economic uncertainties. |
Adjusted EBITDA and Steel Margin (BRL MM and %) |
Mining Result
The quarter in China was marked by the maintenance of stimulus to the infrastructure sector, lower than expected performance in the real estate market and maintenance of the Covid Zero policy that eventually resulted in the isolation of several major cities, bringing instability and uncertainty regarding the economic impacts and prospects. In addition, the conflict between Russia and Ukraine, the inflationary effects and the increase of interest rates have also backed-up the raising concern about iron ore demand and energy supply to European countries, contributing yet another component of instability to the transoceanic market. In this context, the price of iron ore ended 2Q22 on a downward trend, returning to November/21 levels and undergoing adjustments throughout the quarter. However, the 2Q22 average price did not vary as much, performing on USD 137.9/dmt (Platts, Fe62%, N. China), 2.6% lower than 1Q22 (USD 141.6/dmt), but 31% below 2Q21 (USD 200.01/dmt).
For more information, please visit our website: https://ri.csn.com.br/en | 12 |
| | 2Q22 RESULTS |
In relation to sea freight, the BCI-C3 Route (Tubarão-Qingdao) observed a more significant impact, reaching an average of $30.2/wmt in 2Q22, which represented a 32% increase compared to the previous quarter, mainly driven by the higher bulk costs.
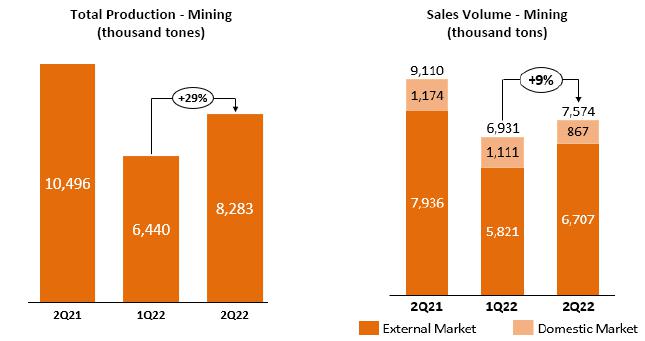
| · | Iron ore production totaled 8,283 ktons in 2Q22, an 29% increase compared to 1Q22, as a result of improved production with the reduction of impacts of rain volumes in the period. |
| · | Sales volume reached 7,574 ktons in 2Q22, a performance 9.3% higher than the previous quarter as a result of the drier period observed throughout the quarter, enabling an increase in port shipments. To contextualize this performance, the sales volume for the foreign market was 15.2% higher than in 1Q22. However, it is important to highlight that this performance could have been even better if it were not for the still high volume of rainfall in April, especially in the State of Rio de Janeiro where the Company’s Port is located, delaying a more consistent recovery. |
| · | In 2Q22, net revenue totaled BRL 2,608 million and was 32.5% lower than in the last quarter, as a result of a lower price realization that offset the increase in production and commercial activity presented in the period. Unitary net revenue was $72.03 per wet ton, down 33% from 1Q22, a performance that reflects not only the lower price of the index benchmark, but also the impact of more expensive sea freight and a negative realization of provisioned price from previous quarters in the period. |
· The cost of goods sold from mining totaled BRL 1,832 million in 2Q22, an increase of 14.8% compared to the previous quarter, as a result of the higher volume produced in the period, in addition to the higher costs of diesel used in the mine fleet and the increase in rail transport costs. The C1 Cost was USD 24.3/t in 2Q22, 3.8% higher when compared to 1Q22, mainly a result of the factors mentioned above. This ended up compensating for the greater dilution of fixed cost due to the increase in the volume produced, the exchange rate impact and the reduction of the cost in TECAR.
· Adjusted EBITDA reached BRL 931 million in 2Q22, with quarterly EBITDA margin of 35.7% or 27.6 p.p. lower than that recorded in 1Q22. The lower performance of the realized prices, together with increases in C1 costs, freight and greater participation of third-party volumes were the main responsible for the decrease in mining margins in the period.
For more information, please visit our website: https://ri.csn.com.br/en | 13 |
| | 2Q22 RESULTS |

Cement Result
After a challenging start of 2022 with a seasonality accentuated by the high volume of rainfall in January and February, the cement segment continued to face challenges in 2Q22 with raw material cost pressures and commercial activity limited by high inflation and interest rates. However, it has already been possible to verify a resumption of construction and, according to the National Union of the Cement Industry (SNIC), cement sales reached 15.9 Mton in 2Q22 and was 6.7% higher compared to the previous quarter, but still 3.0% below the same period from last year. In this context, the real estate market has been resilient with the increase in real estate units sold throughout the quarter, according to the Brazilian Chamber of the Construction Industry (CBIC), and the Industrial Entrepreneur Confidence Index (ICEI) presenting values above 50 in all indicators.
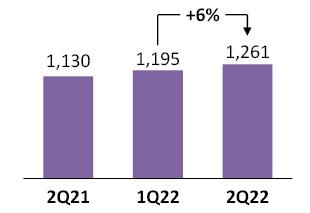
in the case of CSN Cimentos, the recovery came from both commercial activity and the strong price adjustment applied at the beginning of the quarter, an adjustment that was necessary to offset the higher production costs in the period. Sales on the 2Q22 accrued 1,261 kton and were 6% higher than in the previous quarter, as a result of the assertive commercial strategy, in addition to seasonality, with a drier quarter.
Sales Volume - Cements (thousand tones) |
* Alhandra's operations were integrated in September 2021.
| · | Net revenue reached an all-time high of BRL 475 million in 2Q22, a performance 23.1% higher than last quarter, driven by volume recovery with higher prices applied in the period. |
| · | Unitary costs also rose in the quarter as a result of the price increase of imported coke and freight distribution costs. |
| · | After all, Adjusted EBITDA increased by 64.1% compared to the previous quarter, reaching BRL 163 million in 2Q22 and with an Adjusted EBITDA margin of 34.2%, or 8.6 p.p. above the margin recorded in 1Q22. This improvement reflects the Company's ability to generate results even in a period of inflationary pressure, highlighting not only the strength of the brand, but also all the operational efficiency of CSN's plants. |
For more information, please visit our website: https://ri.csn.com.br/en | 14 |
| | 2Q22 RESULTS |
Logistics Result
Rail Logistics: In 2Q22, net revenue reached BRL 592 million, with Adjusted EBITDA of BRL 298 million and Adjusted EBITDA margin of 50.3%. Compared to 1Q22, net revenue increased 30% due to increased prices of transported goods. In the same comparison line, Adjusted EBITDA was 42% higher.
Port Logistics: In 2Q22, 308,000 tons of steel products were shipped by Sepetiba Tecon, in addition to 15,000 containers, 4,000 tons of general cargo and 219,000 tons of bulk. Compared to the previous quarter, the two most significant variations were in the volume of steel products, with an increase of 24%, and in the bulk sales, which reported a 40% decline. As a result, net revenue of the port segment was 2% higher than in the last quarter, reaching BRL 77 million in 2Q22. Additionally, there was a decline in sales and administrative expenses that led the Adjusted EBITDA to increase 21.5% in the quarter, reaching BRL 24 million and an Adjusted EBITDA margin of 31.3% in the period, or 5.1 p.p. superior.
Energy Result
In 2Q22, the volume of energy traded generated net revenue of R$47 million, with negative adjusted EBITDA of R$6 million. Compared to 1Q22, net revenue increased by 7% due to lower exposure to the short-term market. This reflects a greater adherence of energy consumption carried out by industrial plants, which also resulted in an EBITDA improvement of 17% in the period.
For more information, please visit our website: https://ri.csn.com.br/en | 15 |
| | 2Q22 RESULTS |
ESG - Environmental, Social & Governance
ESG COMMITMENTS - CSN GROUP
| AXIS | ESG Goals |
Capital Natural
| Climate Change |
| ü Reduction of 10% of CO2e emissions per ton of crude steel by 2035, WSA (World Steel Association) methodology compared to 2018. | |
| ü Reduction of 20% of CO2e emissions per ton of crude steel by 2035, WSA (World Steel Association) methodology compared to 2018. | |
| ü Reduction of 28% of CO2e emissions per ton of cement by 2030, reaching 375 kgCO2e/t cement, CSI (Cement Sustainability Initiative) methodology. Equivalent to the target set in the CSI roadmap for the sector in 2050, base year 2020. | |
| ü Reduction of 30% in CO2e emissions per ton of ore produced by 2035 (scopes 1 and 2), base year 2019. | |
| ü Net Zero by 2044 in the emissions of scopes 1 and 2 of CSN Mineração. | |
| Atmospheric Emissions | |
| ü Reduction of 40% of particulate matter emissions per ton of crude steel produced at UPV by 2030, base year 2019. | |
| Efficiency in Water Use and Effluent Management | |
| ü Reduce new water consumption for iron ore production by at least 10% per ton of ore produced by 2030 compared to the base year 2018. | |
Intellectual Capital
| Innovation |
| ü Between 2020 and 2022, develop two new products/services on the ESG theme. | |
| ü By 2022, we will conduct six weeks of training in innovation, ESG and Venture Capital in the CSN Group units in relation to 2020. | |
| Governance, Ethics and Compliance | |
| ü Continuously increase our Compliance Index to the best governance practices provided for in CVM Resolution No. 80/2022 (considered Practice and Partial Practice). | |
Human and Social Capital
| Social Responsibility |
| ü By 2022, increase by 39% the care of children and adolescents by the Garoto Cidadão project in relation to 2020. | |
| Health and safety at work | |
| ü Continuously achieve the zero-fatality rate throughout the CSN Group (own and third parties). | |
| ü Reduce by 30% the accident frequency rate (CAF+SAF – own and third parties) by 2030 in the CSN Group compared to 2020. (factor of 1 million HHT) | |
| ü Reduce by 30% the number of days of sick leave by accident with own employees by 2030 compared to 2021. | |
| Dam Management and Mischaracterization | |
| ü Perform the complete mischaracterization of the dams built upstream of CSN Mineração by 2030. | |
| Diversity and Inclusion | |
| ü Achieve 28% female representation in the CSN Group by 2025 compared to 2020. |


For more information, please visit our website: https://ri.csn.com.br/en | 16 |
| | 2Q22 RESULTS |
ESG PERFORMANCE - CSN
Starting in the second quarter of 2022, CSN begins a new format for disclosing its ESG shares and performance. The new model allows stakeholders to have access to key results, quarterly indicators and can now follow them effectively and even more agilely.
The information included in this release was selected based on relevance and materiality to the company. Quantitative indicators are presented in comparison with the period that best represents the metric for monitoring these. Thus, some are compared with the same quarter of the previous year, and others will be with the average of the previous period, ensuring a comparison based on seasonality and periodicity.
More detailed historical data on CSN's performance and initiatives can be verified in the Integrated Report 2021, released in June 2022 (esg.csn.com.br/nossa-empresa/relatorio-integrado-gri). The assurance of ESG indicators occurs annually for the closing of the Integrated Report, so the information contained in the quarterly releases is subject to adjustments arising from this process.
The Integrated Report 2021 released in June 2022, follows internationally recognized guidelines and frameworks, such as GRI, IIRC, SASB and TCFD and are presented with due correlation with the SDGs and Principles of the Global Compact.
With the completion of the survey and integration of CSN's risks and climate opportunities to its internal risk matrix, the Integrated Report for 2021 was the first in which CSN carried out the structured disclosure based on TCFD reporting format.
Also in this quarter, expanding the partnership between ITOCHU Corporation and CSN Group in 2021, the two parties signed a Memorandum of Understanding (MOU) with Shell International Petroleum Company Ltd. to work jointly in the development of solutions for decarbonization of the operations of the CSN group. The main objective of this collaboration is the advancement in the decarbonization strategy through the application of new technologies focused mainly on the Steel and Mining segment.
Also, in this period the new ESG website was launched with the proposal to present in a more agile and transparent way the Actions and ESG indicators of the Company. Go to esg.csn.com.br.
ESG RATINGS
In the second half of 2022 there was an evolution in the Company's performance in the MSCI and Mood's ESG - V.E. and TPI (Transition Pathway Initiative) global initiative that assesses the maturity of companies in relation to the transition to a low-carbon economy.

For more information, please visit our website: https://ri.csn.com.br/en | 17 |
| | 2Q22 RESULTS |
PERFORMANCE OF THE MAIN ESG TARGETS
| Indicators | Unit | 2021 | Accumulated 2022 | Status | Goal | Goal (Year) | |
| Environmental | Steel Emission Intensity (WSA)¹ | tCO2e/t raw steel | 1.98 | 2.13 |  | 1.68 | 2035 |
| Intensity of Emission Cements (CSI)² | kg CO2e/t cement | 483 | 486 |  | 374 | 2030 | |
| Mining Emission Intensity (GHG)³ | kgCO2e /ton of ore4 | 6.26 | 6.91 | | 4.04 | 2035 | |
| Social | Frequency Rate5 | CAF+SAF | 2.4 | 1.9 | | 0.74 | 2030 |
| Governance | Diversity (women in the functional framework) | % | 17.5 | 19.2 | | 28% | 2025 |
¹ Considers the scope 1+2 emissions and production of the UPV and SWT units
²Considers the emissions of scopes 1 and 2 divided per ton of iron ore produced at CSN Mineração, according to the methodology of the Brazilian GHG Protocol Program.
³ Considers emissions only from CSN Mining Scope 1 mobile combustion category. They represent 95% of CSN Mineração's Scope 1 emissions, noting that scope 2 emission is zero due to electricity consumption coming from 100% renewable sources. The data reported in the Company's Integrated Report 2021, considers the total emissions of the company CSN Mineração, scope 1 and 2. The emission intensity was reported 6.58 kgCO2e/ton of ore produced.
4 For the year 2022 Alhandra came to be considered in the data management of CSN Cimentos.
5 Rate considers (CAF+SAF - own and third/1 million hours worked)
ENVIRONMENTAL MANAGEMENT
Mining and Cements
Electrification of vehicles in Casa de Pedra and CSN Cimentos
In July 2022, in a ceremony held in Congonhas, 2 electric trucks produced by Sany were symbolic delivery and that will be used in the movement of tailings in the Casa de Pedra mine. These equipment’s are part of the company's fleet renewal plan. The forecast is initially to electrify the fleet of lighter vehicles within 4 years.
Also in a pioneering way, CSN Cimentos has partnered with Sany to test a 100% electric truck in its operations. The truck will be used in limestone mining activities, making the company the first cement company in Brazil to use electric trucks in its fleet.
Co-processing in Arcos
CSN Cimentos, arcos unit, started waste co-processing operations in June 2022.
The new process seeks to optimize the fossil fuel matrix, reducing the consumption of petroleum coke, with partial replacement by solid waste (pieces of wood, tire chip, among others), contributing to the reduction of CO2 emissions. With the implementation of the co-processing process in oven 2, the intensity of GHG emissions decreased by 5% compared to May 2022, considering only 15 days of operation. Thus, the expectation is that even more expressive results will be achieved in the coming months, with a significant reduction in emissions for the year 2022.
NATURAL CAPITAL - ENVIRONMENTAL INDICATORS
| · | Management of air quality indicators |
| Air quality CSN¹ | Unit | 2Q21 | 2Q22 | Δ% |
| NOX Emission | t | 1,489 | 1,118 | -25 |
| SOX issue | t | 930 | 798 | -14 |
| MP issue | t | 835 | 867 | +4 |
For more information, please visit our website: https://ri.csn.com.br/en | 18 |
| | 2Q22 RESULTS |
| · | Water management |
| CSN² Water Management | Unit | 2Q21 | 2Q22 | Δ% |
| Water catchment | Megaliters | 22,461 | 22,045 | -2 |
| Water disposal | Megaliters | 16,977 | 17,872 | +5 |
| Water consumption | Megaliters | 5,421 | 4,173 | -23 |
(2) Considers all steel units and cement plants in Brazil
| CSN Water Management | Unit | 2021 | Accumulated 2022 | Δ% |
| Intensity by steel production | M³ /ton of steel | 18.94 | 20.33 | +7 |
| Intensity per cement production | M³/ton of cement | 0.07 | 0.06 | -14 |
| Intensity by ore production | M³/ton of ore | 0.21 | 0.25 | +20 |
| · | Waste management |
| Waste Management CSN³ | Unit | 2Q21 | 2Q22 | Δ% |
| Waste generation Class 14 | Tons | 2,805.35 | 4,920.03 | +75 |
| Class 2 waste generation | Tons | 642,440.92 | 651,592.65 | +1 |
| Percentage sent for reuse and reprocessing | % | 96% | 90% | -6 |
(3) Considers all steel units and cement plants in Brazil
(4) Due to the demolition and refurbishment of the coke Battery #3 in the UPV, there was an increase in Class I Residue in the unit.
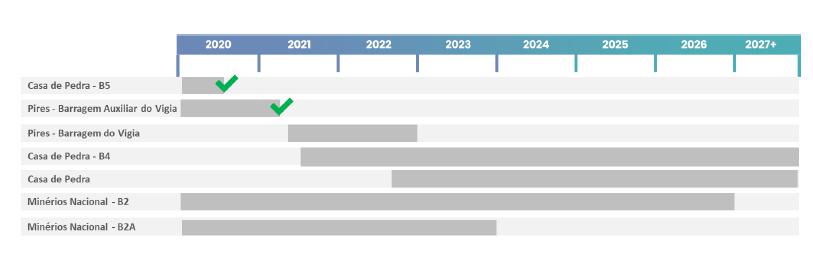
DAM MANAGEMENT
In the second quarter of 2022, the Vigia Auxiliary Dam was definitively disregarded and deregistered as a dam of FEAM (State Environmental Foundation) and ANM (National Mining Agency) which removed the structure of the SIGBM (Integrated Mining Dam Management System) register.
Next quarter, it is expected to be completed the decharacterization work of the Vigia Dam, belonging to the Casa de Pedra Complex.
For more information, please visit our website: https://ri.csn.com.br/en | 19 |
| | 2Q22 RESULTS |
SOCIAL DIMENSION
HEALTH AND SAFETY AT WORK
| Health and safety at work | 2Q21 | 2Q22 | Δ% |
| Number of accidents with and without leave (own) | 30 | 23 | -23 |
| Number of accidents with and without leave (third parties) | 20 | 14 | -30 |
| Fatality (own) | 0 | 1 | - |
| Fatality (third parties) | 0 | 0 | - |
| Frequency rate of mandatory reporting accidents (factor of 200,000 HHT) | 0.52 | 0.38 | -27 |
| Frequency rate of mandatory communication work accidents (factor 1 MM HHT) | 2.60 | 1.91 | -27 |
| Accident severity rate (factor of 200,000 HHT) | 18 | 72 | +300 |
| Accident severity rate (1MM HHT factor) | 88 | 360 | +309 |
PEOPLE MANAGEMENT
| Employment¹ | Unit | 2Q21 | 2Q22 | Δ% |
| Women on staff | % | 16.4 | 19.2 | +17 |
| Women in leadership positions | % | 11.1 | 11.8 | +6 |
| People with disabilities | % | 1.1 | 1.3 | +18 |
| Racial Diversity | ||||
| • Yellow | % | 1.3 | 1.4 | +8 |
| • White | % | 43.4 | 42.7 | -2 |
| • Indigenous | % | 0.3 | 0.3 | 0 |
| • Black | % | 14.3 | 14.8 | +3 |
| • Brown | % | 37.0 | 38.2 | +3 |
| • Not informed | % | 3.52 | 2.6 | -26 |
| Turnover | % | 1.2 | 1.3 | +8 |
¹ The data does not consider employees "Non-CLT" and "Internship Program"
| Training | Unit | 2Q21 | 2Q22 | Δ% |
| Training hours | Hours | 103,560 | 101,917 | -2 |
| Trained employees | Number | 8,471 | 7,592 | -10 |
| Investment in training | BRL | 557,719 | 697,261 | +25 |
VALUE CHAIN
| Sustainable Value Chain | Unit | 2Q21 | 2Q22 | Δ% |
| Purchases from local suppliers | % | 33.5 | 30.6 | -8.7 |
For more information, please visit our website: https://ri.csn.com.br/en | 20 |
| | 2Q22 RESULTS |
SOCIAL RESPONSABILITY
With the commitment to transform lives and communities around CSN's operations in the second quarter of 2022, the CSN Foundation participated in the "Walk for Peace", with approximately 4,000 people. Event held in conjunction with UNAS (Union of Nuclei, Associations of Residents of Heliopolis and Region), of which it is a partner of Garoto Cidadão, a project of the CSN Foundation active in the three CCAS of the Heliopolis region.
In Congonhas, we conducted a training in partnership with the Municipal Council for the Rights of Children and Adolescents (CMDCA), the Department of Education and the Secretariat of Social Assistance, to dialogue on children's rights and their understanding of their rights. In addition, the "Know to prevent" questionnaire was applied, with the intention of diagnosing the understanding of children and adolescents regarding the violation of their rights, in all we obtained approximately 1,200 responses.
The CSN Foundation materializes the SDDs in its programs and projects, with the involvement in the dissemination of knowledge about the SDDs and the 2030 Agenda.
In addition to these actions, the Foundation maintained its projects, obtaining at the end of the second quarter of 2022:
| 1Q22 | 2Q22 | |
| Impacted young people¹ | 3.483 | 3.981 |
| Public cultural initiatives | 3.387 | 69.673 |
¹ Young people impacted by the projects Citizen Boy, Empower, Young Apprentice, Internship, Steel Drums and Football ² Public present in the public presentations, carried out by the projects: Citizen Boy, Truck, Steel Drums, Cultural Center and Stories that stay. | ||
The CSN Foundation also acts in support of CSN with the selection of projects from other entities to expand its social performance through tax incentive laws. Thus, we analyze external projects for CSN to evaluate and select projects that will be sponsored through tax incentive laws. The initiative must be aligned with the company's objectives in transforming people's society and lives. BRL 1.03 million were invested by the end of the second quarter of 2022.
For more information, please visit our website: https://ri.csn.com.br/en | 21 |
| | 2Q22 RESULTS |
Capital Markets
In the second quarter of 2022, CSN shares devalued 40.6%, while the Ibovespa index fell 18.06%. The average daily value of CSNA3 shares traded at B3 was BRL 309.6 million. On the New York Stock Exchange (NYSE), the Company's American Depositary Receipts (ADRs) devaluation was 45.9%, while Dow Jones fell 11.2%. The average daily ADRs (SID) trading on the NYSE was USD 25.8 million.
| 2Q22 | |
| Number of shares in thousands | 1.326,094,0 |
| Market Value | |
| Closing Quote (BRL/share) | 15.44 |
| Closing Quote (USD/ADR) | 2.93 |
| Market Value (BRL million) | 20,475 |
| Market Value (USD million) | 3,885 |
| Change in period | |
| CSNA3 (BRL) | -40.6% |
| SID (USD) | -45.9% |
| Ibovespa (BRL) | -18.1% |
| Dow Jones (USD) | -11.2% |
| Volume | |
| Daily average (thousand shares) | 11,899 |
| Daily average (BRL thousand) | 309,605 |
| Daily average (thousand ADRs) | 5,101 |
| Daily average (USD thousand) | 25,767 |
Source: Bloomberg
| |
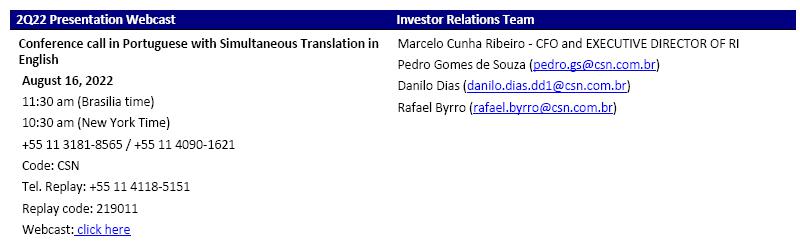
Results Conference Call:
Some of the statements contained herein are future perspectives that express or imply expected results, performance or events. These perspectives include future results that may be influenced by historical results and statements made in 'Perspectives'. Current results, performance and events may differ significantly from hypotheses and perspectives and involve risks such as: general and economic conditions in Brazil and other countries; interest rate and exchange rate levels, protectionist measures in the U.S., Brazil and other countries, changes in laws and regulations, and general competitive factors (globally, regionally or nationally).
For more information, please visit our website: https://ri.csn.com.br/en | 22 |
| | 2Q22 RESULTS |
INCOME STATEMENT
CONSOLIDATED - Corporate Law - In Thousands of Reais
For more information, please visit our website: https://ri.csn.com.br/en | 23 |
| | 2Q22 RESULTS |
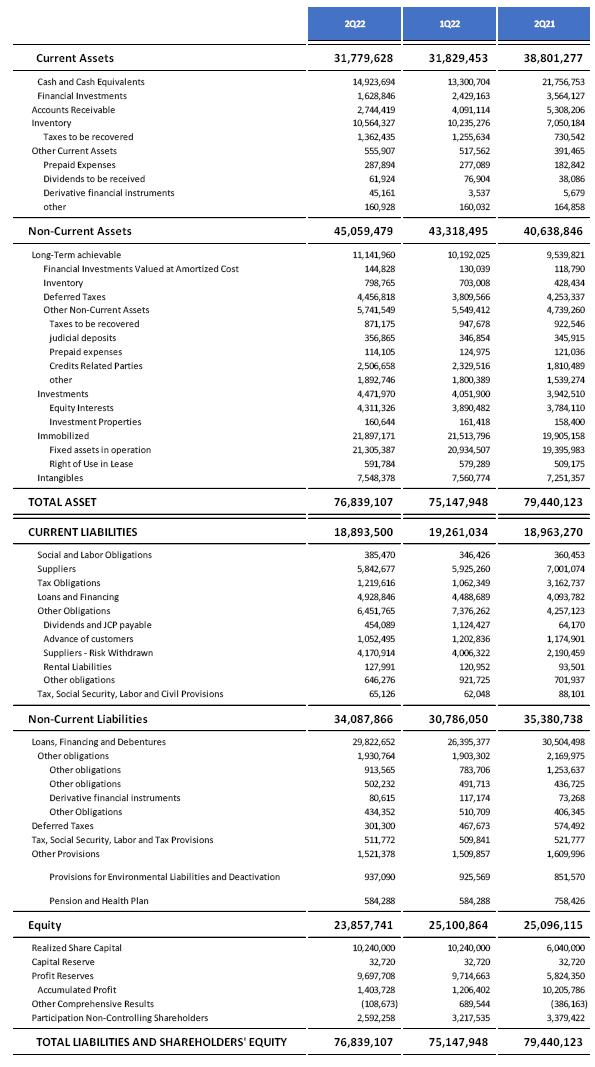
BALANCE SHEET
CONSOLIDATED - Corporate Law - In Thousands of Reais
For more information, please visit our website: https://ri.csn.com.br/en | 24 |
| | 2Q22 RESULTS |
CASH FLOW STATEMENT
CONSOLIDATED - Corporate Law - In Thousands of Reais

For more information, please visit our website: https://ri.csn.com.br/en | 25 |
SIGNATURE
Pursuant to the requirements of the Securities Exchange Act of 1934, the registrant has duly caused this report to be signed on its behalf by the undersigned, thereunto duly authorized.
Date: August 15, 2022
| COMPANHIA SIDERÚRGICA NACIONAL | |
| By: | /S/ Benjamin Steinbruch |
Benjamin Steinbruch Chief Executive Officer | |
| By: | /S/ Marcelo Cunha Ribeiro |
Marcelo Cunha Ribeiro Chief Financial and Investor Relations Officer | |
FORWARD-LOOKING STATEMENTS
This press release may contain forward-looking statements. These statements are statements that are not historical facts, and are based on management's current view and estimates of future economic circumstances, industry conditions, company performance and financial results. The words "anticipates", "believes", "estimates", "expects", "plans" and similar expressions, as they relate to the company, are intended to identify forward-looking statements. Statements regarding the declaration or payment of dividends, the implementation of principal operating and financing strategies and capital expenditure plans, the direction of future operations and the factors or trends affecting financial condition, liquidity or results of operations are examples of forward-looking statements. Such statements reflect the current views of management and are subject to a number of risks and uncertainties. There is no guarantee that the expected events, trends or results will actually occur. The statements are based on many assumptions and factors, including general economic and market conditions, industry conditions, and operating factors. Any changes in such assumptions or factors could cause actual results to differ materially from current expectations.