Exhibit 99.2
July 28, 2022 1 2Q 2022 Financial Results
Forward Looking Statements 2 Certain statements contained in this presentation are not historical facts and may constitute forward - looking statements within the meaning of Section 27A of the Securities Act of 1933, as amended, and Section 21E of the Securities Exchange Act of 1934, as amended, and are intended to be covered by the safe harbor provisions of the Private Securities Litigation Reform Act of 1995. We may also make forward - looking statements in other documents we file with the Securities and Exchange Commission ("SEC"), in our annual reports to shareholders, in press releases and other written materials, and in oral statements made by our officers, directors or employees. You can identify forward looking statements by the use of the words “believe,” “expect,” “anticipate,” “intend,” “estimate, ”assume,” “outlook,” “will,” “should,” and other expressions that predict or indicate future events and trends and which do not relate to historical matters, including statements regard the potential effects of the COVID - 19 pandemic on the Company’s business, credit quality, financial condition, liquidity and results of operations. Forward - looking statements involve risks and uncertainties. The Company’s actual results could differ materially from those projected in the forward - looking statements as a result of, among other factors, ongoing disruptions due to the COVID - 19 pandemic, general business and economic conditions on a national basis and in the local markets in which the Company operates; changes in consumer behavior due to changing political business and economic conditions or legislative or regulatory initiatives; the possibility that future credit losses may be higher than currently expected; reputational risk relating to the Company’s participation in the Paycheck Protection Program and other pandemic - related legislative and regulatory initiatives and programs; and turbulence in capital and debt markets; and the risks outlined in the Company’s Annual Report on Form 10 - K, as updated by its Quarterly Reports on Form 10 - Q and other filings submitted to the SEC. The Company does not undertake any obligation to update any forward - looking statement to reflect circumstances or events that occur after the date the forward - looking statements are made.
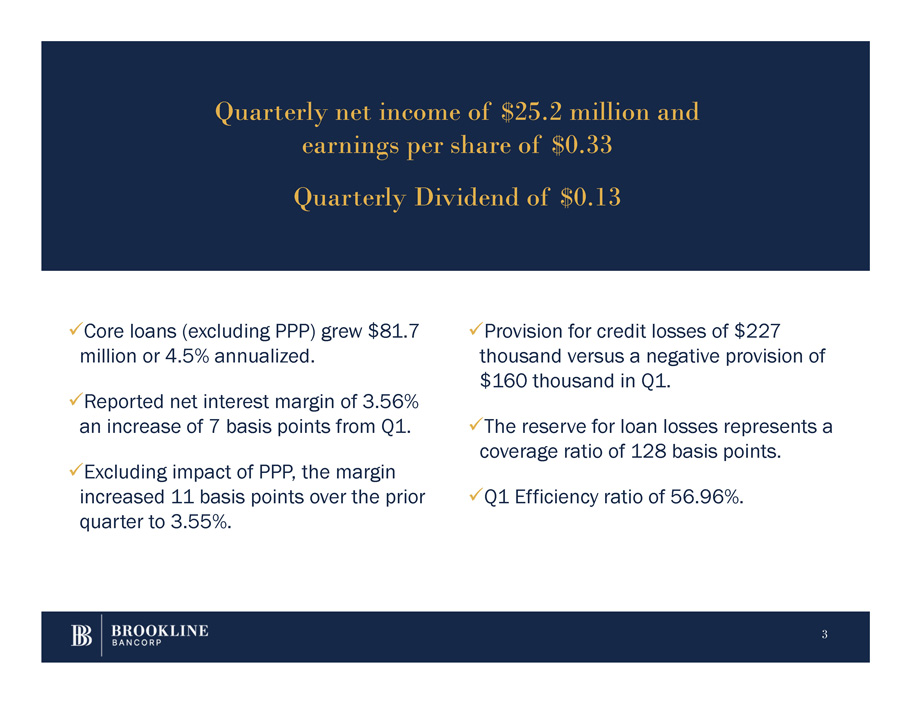
x Core loans (excluding PPP) grew $81.7 million or 4.5% annualized. 3 x Reported net interest margin of 3.56% an increase of 7 basis points from Q1. x Excluding impact of PPP, the margin increased 11 basis points over the prior quarter to 3.55%. x Provision for credit losses of $227 thousand versus a negative provision of $160 thousand in Q1. x The reserve for loan losses represents a coverage ratio of 128 basis points. x Q1 Efficiency ratio of 56.96%. Quarterly net income of $25.2 million and earnings per share of $0.33 Quarterly Dividend of $0.13

Summary Income Statement ▪ Net Income of $25.2 million or $0.33 per share. ▪ Net interest income increased $ 2 . 1 million due to higher loan balances and expanding margin as rates rise . Fee income increased $ 1 . 4 million from Q 1 driven by higher derivative activity and deposit fees . ▪ Expenses increased $1.9 million due ▪ Merger expenses of $ 535 thousand related to the PCSB acquisition . ▪ Pre - provision net revenue increased $ 1 . 1 million from the prior quarter . ▪ The provision for credit losses was $227 thousand for the quarter driven by portfolio growth. Noninterest expense 44.4 42.5 1.9 4% 38.0 6.4 17% ▪ Merger expense 0.5 - 0.5 - - 0.5 - Pretax, Preprov. Net Rev. 33.9 32.8 1.1 3% 39.0 (5.1) - 13% Provision for credit losses 0.2 (0.2) 0.4 - 200% (3.3) 3.5 - 106% Pretax income 33.7 33.0 0.7 2% 42.3 (8.6) - 20% to higher compensation costs. Provision for taxes 8.5 8.3 0.2 2% 10.7 (2.2) - 21% Net Income $ 25.2 $ 24.7 $ 0.5 2% $ 31.6 $ (6.4) - 20% EPS $ 0.33 $ 0.32 $ 0.01 3% $ 0.40 $ (0.07) - 18% Avg diluted shares (000s) 77,419 77,927 (508) - 1% 78,470 (1,051) - 1% Linked Quarter (LQ) Year over Year (YoY) $m, except per share amts 2Q22 1Q22 Δ %Δ 2Q21 Δ %Δ Net interest income $ 71.9 $ 69.8 $ 2.1 3% $ 71.1 $ 0.8 1% Noninterest income 6.9 5.5 1.4 25% 5.9 1.0 17% Security gains (losses) - - - - - - - Total Revenue 78.8 75.3 3.5 5% 77.0 1.8 2% Return on Assets 1.18% 1.16% 0.02% 1.48% - 0.30% Return on Tangible Equity 12.38% 11.84% 0.54% 15.92% - 3.54% Net Interest Margin 3.56% 3.49% 0.07% 3.52% 0.04% Efficiency Ratio 56.96% 56.37% 0.59% 49.30% 7.66% 4
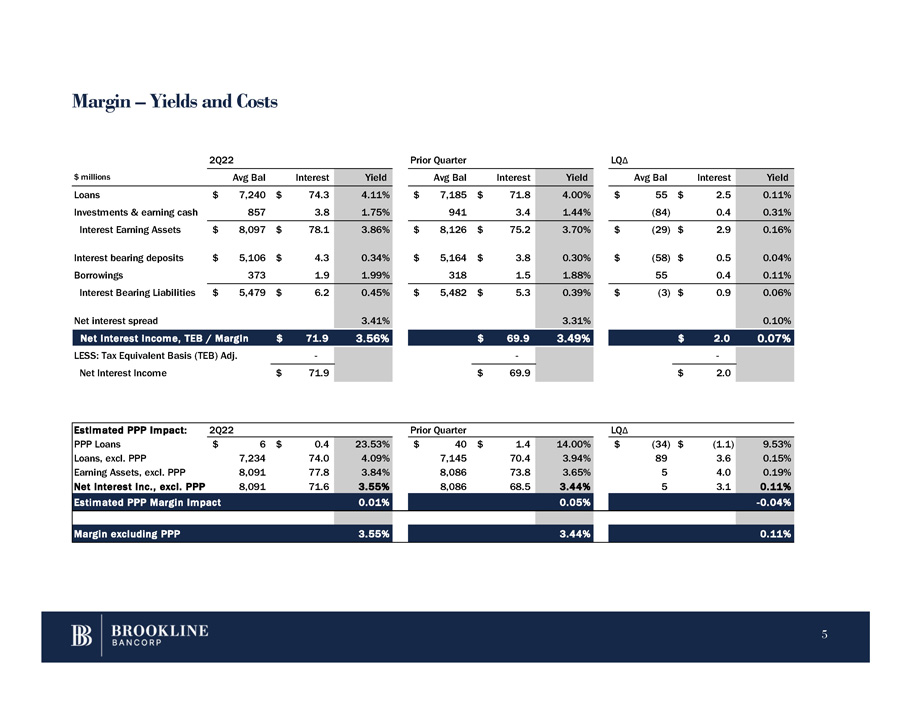
Margin – Yields and Costs 2Q22 Prior Quarter LQ Δ $ millions Avg Bal Interest Yield Avg Bal Interest Yield Avg Bal Interest Yield Loans $ 7,240 $ 74.3 4.11% $ 7,185 $ 71.8 4.00% $ 55 $ 2.5 0.11% Investments & earning cash 857 3.8 1.75% 941 3.4 1.44% (84) 0.4 0.31% Interest Earning Assets $ 8,097 $ 78.1 3.86% $ 8,126 $ 75.2 3.70% $ (29) $ 2.9 0.16% Interest bearing deposits $ 5,106 $ 4.3 0.34% $ 5,164 $ 3.8 0.30% $ (58) $ 0.5 0.04% Borrowings 373 1.9 1.99% 318 1.5 1.88% 55 0.4 0.11% Interest Bearing Liabilities $ 5,479 $ 6.2 0.45% $ 5,482 $ 5.3 0.39% $ (3) $ 0.9 0.06% Net interest spread 3.41% 3.31% 0.10% Net interest income, TEB / Margin $ 71.9 3.56% $ 69.9 3.49% $ 2.0 0.07% LESS: Tax Equivalent Basis (TEB) Adj. - - - Net Interest Income $ 71.9 $ 69.9 $ 2.0 Estimated PPP Impact: 2Q22 Prior Quarter LQ Δ PPP Loans $ 6 $ 0.4 23.53% $ 40 $ 1.4 14.00% $ (34) $ (1.1) 9.53% Loans, excl. PPP 7,234 74.0 4.09% 7,145 70.4 3.94% 89 3.6 0.15% Earning Assets, excl. PPP 8,091 77.8 3.84% 8,086 73.8 3.65% 5 4.0 0.19% Net Interest Inc., excl. PPP 8,091 71.6 3.55% 8,086 68.5 3.44% 5 3.1 0.11% Estimated PPP Margin Impact 0.01% 0.05% - 0.04% Margin excluding PPP 3.55% 3.44% 0.11% 5

Summary Balance Sheet ▪ Loans increased $69 million in the quarter driven by solid core net loan growth. ▪ Improving credit outlook is recognized in the modest decline of ▪ ALLL coverage of 1.28%. ▪ Deposits decreased $200 million. ▪ Borrowings increased $85 million. ▪ Stockholders’ Equity declined $14 Cash & equivalents 90 293 (203) - 277% 320 (230) - 72% $2 million in the Allowance for Loan Intangibles 162 163 (1) - 2% 163 (1) - 1% Losses. Other assets 345 319 26 33% 371 (26) - 7% Linked Quarter (LQ) Year over Year (YoY) $m, except per share amts 2Q22 1Q22 Δ %Δ annual. 2Q21 Δ %Δ Gross Loans, investment $ 7,292 $ 7,223 $ 69 4% $ 7,020 $ 272 4% Allowance for loan losses (93) (95) 2 - 8% (106) 13 - 12% Net Loans 7,199 7,128 71 4% 6,914 285 4% Securities 718 731 (13) - 7% 694 24 3% Total Assets $ 8,514 $ 8,634 $ (120) - 6% $ 8,462 $ 52 1% Deposits $ 6,894 $ 7,094 $ (200) - 11% $ 6,895 $ (1) 0% Borrowings 478 393 85 87% 363 115 32% Reserve for unfunded loans 18 16 2 50% 13 5 38% Other Liabilities 156 149 7 19% 219 (63) - 29% Total Liabilities 7,546 7,652 (106) - 6% 7,490 56 1% million due to the accounting Stockholders' Equity 968 982 (14) - 6% 972 (4) 0% impact of marking to market Total Liabilities & Equity $ 8,514 $ 8,634 $ (120) - 6% $ 8,462 $ 943 11% securities classified as available for sale and share buybacks. TBV per share $ 10.51 $ 10.56 $ (0.05) - 2% $ 10.35 $ 0.16 2% Actual shares outstanding (000) 76,673 77,622 (949) - 5% 78,155 (1,482) - 2% ▪ Shares outstanding declined by 949 thousand. Tang. Equity / Tang. Assets 9.65% 9.67% - 0.02% 9.75% - 0.10% Loans / Deposits 105.77% 101.82% 3.95% 101.81% 3.96% ALLL / Gross Loans 1.28% 1.32% - 0.04% 1.52% - 0.24% 6

Loan and Deposit Composition Linked Quarter (LQ) 58% 10% 16% $ millions 2Q22 1Q22 Δ %Δ an. 2Q21 Δ %Δ CRE $ 4,226 $ 4,235 $ (9) - 1% 3,815 $ 411 11% Commercial 710 679 31 18% 617 93 15% N S PPP Loans 1 14 (13) - 371% 348 (347) - 100% LO A Equipment Finance 1,149 1,108 41 15% 1,074 75 7% Consumer 1,206 1,187 19 6% 1,166 40 3% 16% Total Loans $ 7,292 $ 7,223 $ 69 4% $ 7,020 $ 272 4% Loans 27% 9% 35% 14% 2% CRE C&I Equipment Consumer Deposits 13% DDA NOW Savings MMkt CDs Brkd Demand deposits $ 1,845 $ 1,903 $ (58) - 12% 1,927 $ (82) - 4% NOW 629 628 1 1% 496 133 27% ITS Savings 895 967 (72) - 30% 782 113 14% PO S Money market 2,403 2,432 (29) - 5% 2,251 152 7% D E CDs 1,006 1,048 (42) - 16% 1,178 (172) - 15% Brokered deposits 116 116 - 0% 261 (145) - 56% Total Deposits $ 6,894 $ 7,094 $ (200) - 11% $ 6,895 $ (1) 0% Year over Year (YoY) ▪ Total loans increased $69 million driven by $82 million in core loan growth as PPP loans declined $13 million in the quarter. 7 ▪ Total deposits decreased $200 million driven primarily by tax payments, large real estate purchases and transfers to personal investment accounts.
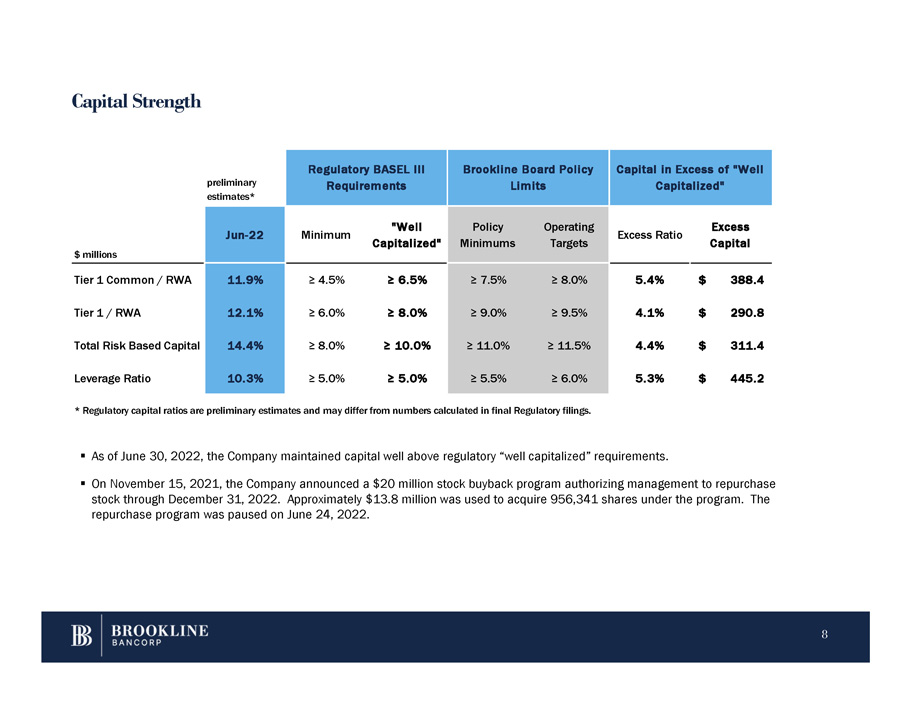
Capital Strength 8 ▪ As of June 30, 2022, the Company maintained capital well above regulatory “well capitalized” requirements. ▪ On November 15, 2021, the Company announced a $20 million stock buyback program authorizing management to repurchase stock through December 31, 2022. Approximately $13.8 million was used to acquire 956,341 shares under the program. The repurchase program was paused on June 24, 2022. preliminary estimates* Regulatory BASEL III Requirements Brookline Board Policy Limits Capital in Excess of "Well Capitalized" $ millions Jun - 22 Minimum "Well Capitalized" Policy Minimums Operating Targets Excess Ratio Excess Capital Tier 1 Common / RWA 11.9% ≥ 4.5% ≥ 6.5% ≥ 7.5% ≥ 8.0% 5.4% $ 388.4 Tier 1 / RWA 12.1% ≥ 6.0% ≥ 8.0% ≥ 9.0% ≥ 9.5% 4.1% $ 290.8 Total Risk Based Capital 14.4% ≥ 8.0% ≥ 10.0% ≥ 11.0% ≥ 11.5% 4.4% $ 311.4 Leverage Ratio 10.3% ≥ 5.0% ≥ 5.0% ≥ 5.5% ≥ 6.0% 5.3% $ 445.2 * Regulatory capital ratios are preliminary estimates and may differ from numbers calculated in final Regulatory filings.
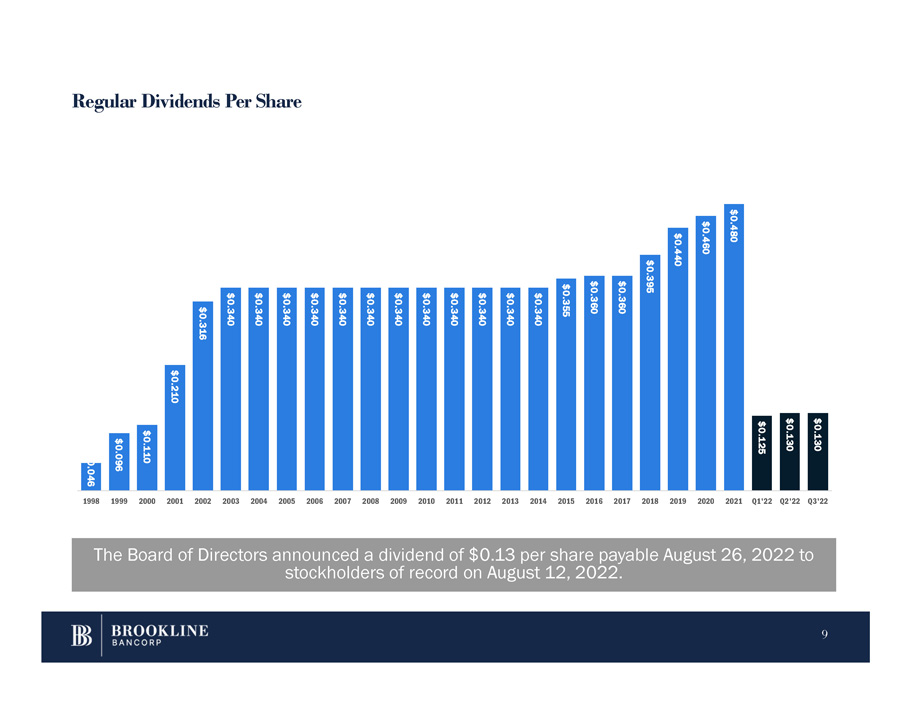
Regular Dividends Per Share The Board of Directors announced a dividend of $0.13 per share payable August 26, 2022 to stockholders of record on August 12, 2022. $0.046 9 $0.096 $0.110 $0.210 $0.316 $0.340 $0.340 $0.340 $0.340 $0.340 $0.340 $0.340 $0.340 $0.340 $0.340 $0.340 $0.340 $0.355 $0.360 $0.360 $0.395 $0.440 $0.460 $0.480 $0.125 $0.130 $0.130 1998 1999 2000 2001 2002 2003 2004 2005 2006 2007 2008 2009 2010 2011 2012 2013 2014 2015 2016 2017 2018 2019 2020 2021 Q1'22 Q2'22 Q3'22
QUESTIONS Paul A. Perrault, Chairman and Chief Executive Officer Carl M. Carlson, Co - President and Chief Financial Officer Thank You. 10

APPENDIX 11

Non Performing Assets and Net Charge Offs 12 2Q22 1Q22 Δ 2Q21 Δ Non Performing Assets (NPAs), in milli ons CRE $ 6.5 $ 8.3 $ (1.8) $ 11.7 $ (5.2) C&I 11.2 13.1 (1.9) 18.1 (6.9) Consumer 3.1 4.1 (1.0) 4.4 (1.3) Total Non Performing Loans (NPLs) 20.8 25.5 (4.7) 34.2 (13.4) Other real estate owned - - - - - Other repossessed assets 0.5 1.0 (0.5) 0.4 0.1 Total NPAs $ 21.3 $ 26.5 $ (5.2) $ 34.6 $ (13.3) NPLs / Total Loans 0.28% 0.35% - 0.07% 0.49% - 0.21% NPAs / Total Assets 0.25% 0.31% - 0.06% 0.41% - 0.16% Net Charge Offs (NCOs), in millions CRE loans $ - $ - $ - $ - $ - C&I loans 1.2 1.9 (0.7) 0.7 0.5 Consumer loans - - - (0.1) 0.1 Total Net Charge Offs $ 1.2 $ 1.9 $ (0.7) $ 0.6 $ 0.6 NCOs / Loans (annualized) 0.07% 0.11% - 0.04% 0.03% 0.04% Linked Quarter (LQ) Year over Year (YoY)
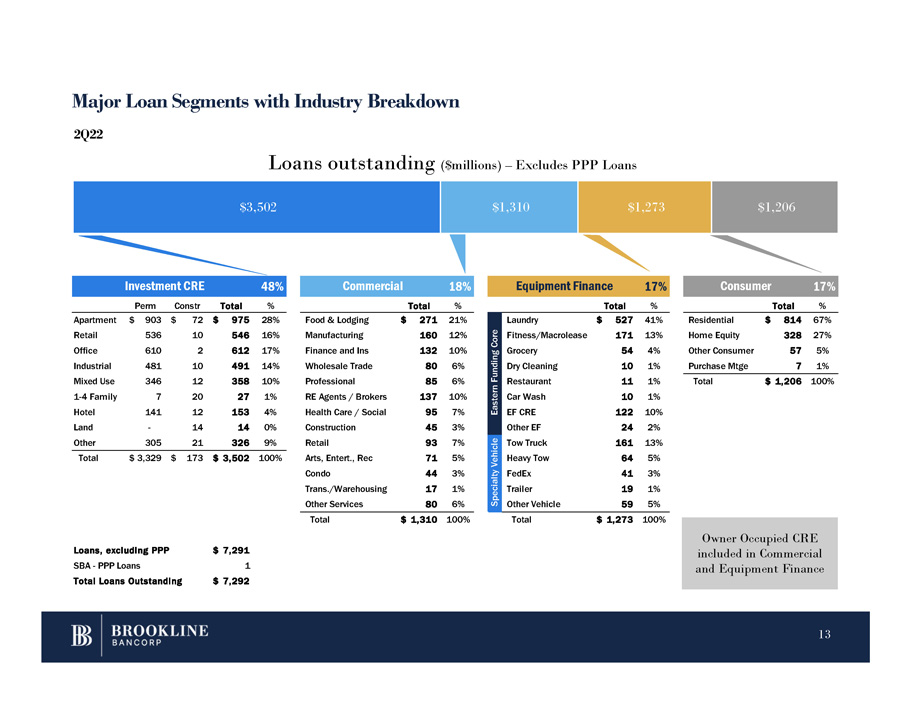
Investment CRE 48% Commercial 18% Equipment Finance 17% Consumer 17% Perm Constr Total % Total % Total % Total % Food & Lodging Manufacturing Finance and Ins Wholesale Trade Professional RE Agents / Brokers Health Care / Social Construction Retail Arts, Entert., Rec Condo Trans./Warehousing Other Services $ 271 21% 160 12% 132 10% 80 6% 85 6% 137 10% 95 7% 45 3% 93 7% 71 5% 44 3% 17 1% 80 6% Residential Home Equity Other Consumer Purchase Mtge $ 814 67% 328 27% 57 5% 7 1% Total $ 1,206 100% - Apartment Retail Office Industrial Mixed Use 1 - 4 Family Hotel Land Other 305 $ 903 $ 72 $ 975 28% 536 10 546 16% 610 2 612 17% 481 10 491 14% 346 12 358 10% 7 20 27 1% 141 12 153 4% 14 14 0% 21 326 9% Total $ 3,329 $ 173 $ 3,502 100% Total $ 1,310 100% Total $ 1,273 100% Eastern Funding Core Laundry $ 527 41% Fitness/Macrolease 171 13% Grocery 54 4% Dry Cleaning 10 1% Restaurant 11 1% Car Wash 10 1% EF CRE 122 10% Other EF 24 2% Specialty Vehicle Tow Truck 161 13% Heavy Tow 64 5% FedEx 41 3% Trailer 19 1% Other Vehicle 59 5% Loans, excluding PPP SBA - PPP Loans Total Loans Outstanding $ 7,291 1 $ 7,292 Major Loan Segments with Industry Breakdown $3,502 $1,310 $1,273 $1,206 2Q22 Loans outstanding ($millions) – Excludes PPP Loans Owner Occupied CRE included in Commercial and Equipment Finance 13
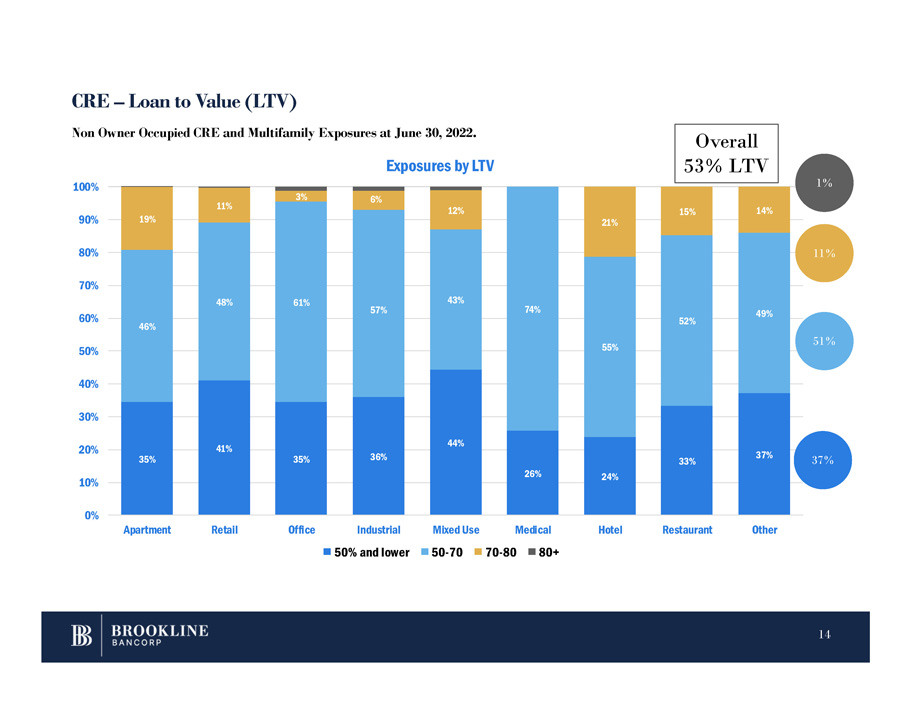
CRE – Loan to Value (LTV) 35% 41% 35% 36% 44% 26% 24% 33% 37% 46% 48% 61% 57% 43% 74% 55% 52% 49% 19% 11% 3% 6% 12% 21% 15% 14% 0% 10% 20% 30% 40% 50% 60% 70% 80% 90% 100% Apartment Retail Office Medical Hotel Restaurant Other Exposures by LTV Industrial 50% and lower Mixed Use 50 - 70 70 - 80 80+ Non Owner Occupied CRE and Multifamily Exposures at June 30, 2022. 37% 51% 1% 11% Overall 53% LTV 14
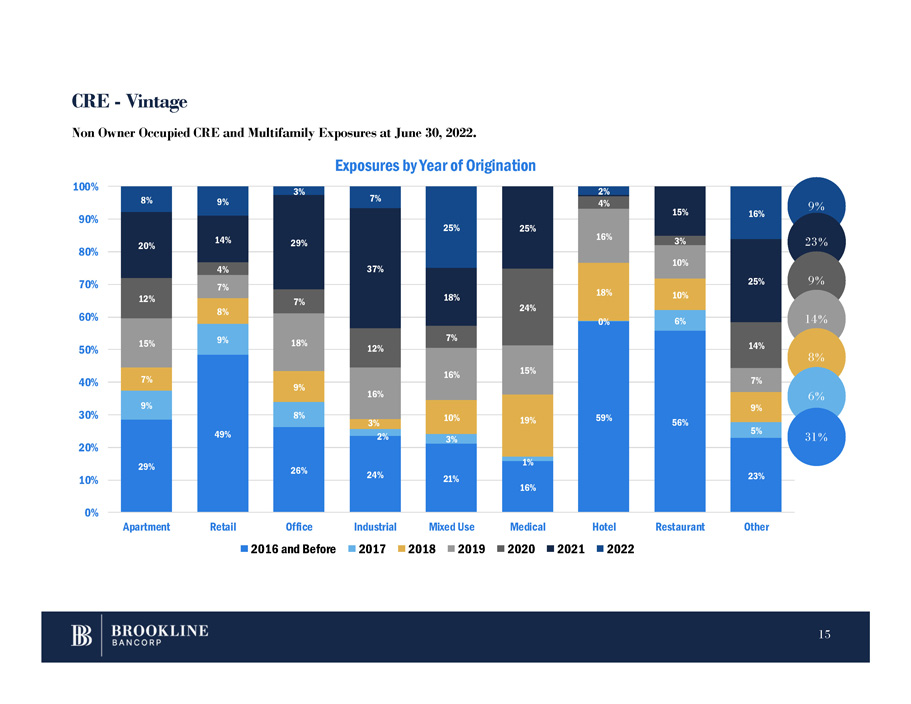
29% 49% 26% 24% 21% 16% 59% 56% 23% 9% 9% 8% 2% 3% 1% 0% 6% 5% 7% 8% 9% 3% 10% 19% 18% 10% 9% 15% 7% 18% 16% 16% 15% 16% 10% 7% 12% 4% 7% 12% 7% 24% 4% 3% 14% 20% 14% 29% 37% 18% 25% 15% 25% 8% 9% 3% 7% 25% 2% 16% 0% 10% 20% 30% 40% 50% 60% 70% 80% 90% 100% Apartment Retail Office 2016 and Before Restaurant Other Non Owner Occupied CRE and Multifamily Exposures at June 30, 2022. Exposures by Year of Origination Industrial Mixed Use Medical Hotel 2017 2018 2019 2020 2021 2022 9 % CRE - Vintage 23 % 9 % 14 % 8 % 6 % 31 % 15
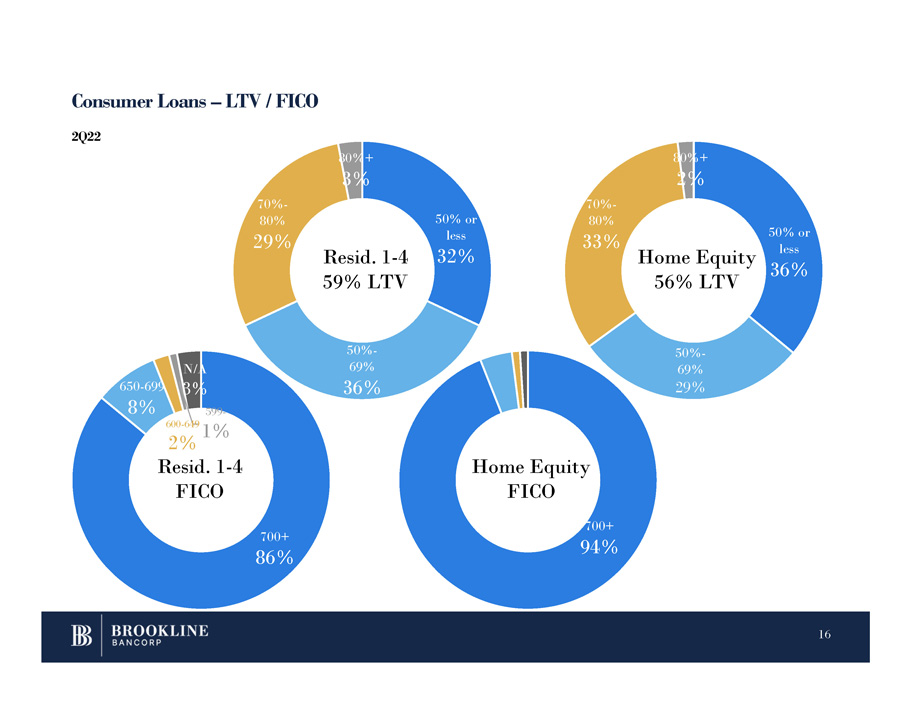
Consumer Loans – LTV / FICO 16 700+ 86% 650 - 699 8% 600 - 649 1% N/A 3% 599 - 50% or less 32% 50% - 69% 36% 70% - 80% 29% 80%+ 3% 700+ 94% 50% or less 36% 50% - 69% 29% 70% - 80% 33% 80%+ 2% Resid. 1 - 4 59% LTV 2% Resid. 1 - 4 FICO Home Equity FICO Home Equity 56% LTV 2Q22
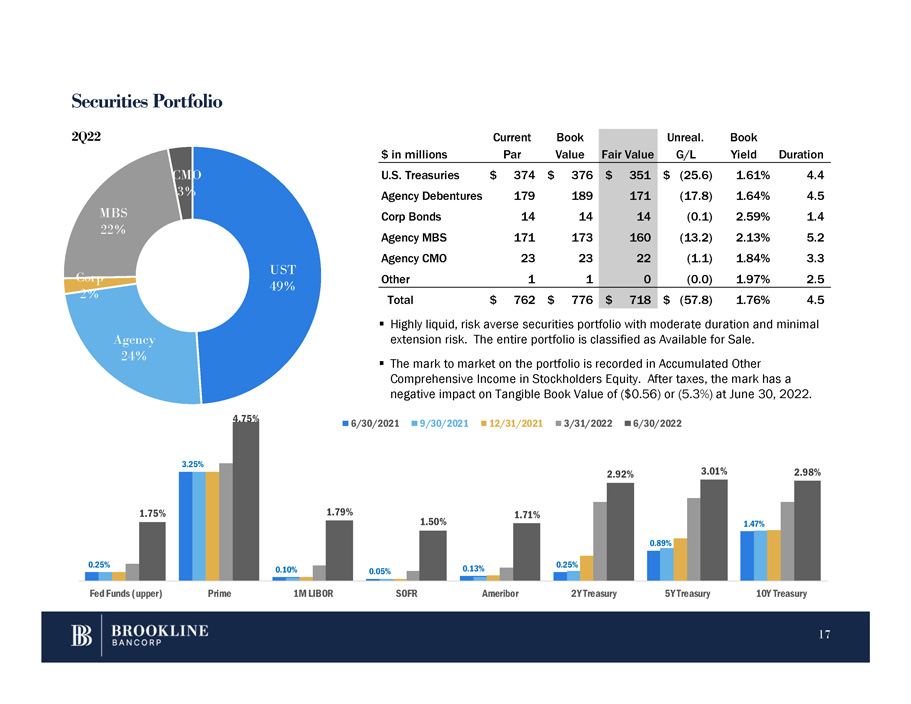
Securities Portfolio 0.25% 3.25% 0.10% 0.05% 0.13% 0.25% 0.89% 1.47% 1.75% 4.75% 1.79% 1.50% 1.71% 2.92% 3.01% 2.98% Fed Funds (upper) Prime 1M LIBOR SOFR Ameribor 2Y Treasury 5Y Treasury 10Y Treasury ▪ Highly liquid, risk averse securities portfolio with moderate duration and minimal extension risk. The entire portfolio is classified as Available for Sale. ▪ The mark to market on the portfolio is recorded in Accumulated Other Comprehensive Income in Stockholders Equity. After taxes, the mark has a negative impact on Tangible Book Value of ($0.56) or (5.3%) at June 30, 2022. 6/30/2021 9/30/2021 12/31/2021 3/31/2022 6/30/2022 UST 49% 17 Agency 24% Corp 2% CMO 3% MBS 22% 2Q22 $ in millions Current Par Book Value Fair Value Unreal. G/L Book Yield Duration U.S. Treasuries $ 374 $ 376 $ 351 $ (25.6) 1.61% 4.4 Agency Debentures 179 189 171 (17.8) 1.64% 4.5 Corp Bonds 14 14 14 (0.1) 2.59% 1.4 Agency MBS 171 173 160 (13.2) 2.13% 5.2 Agency CMO 23 23 22 (1.1) 1.84% 3.3 Other 1 1 0 (0.0) 1.97% 2.5 Total $ 762 $ 776 $ 718 $ (57.8) 1.76% 4.5
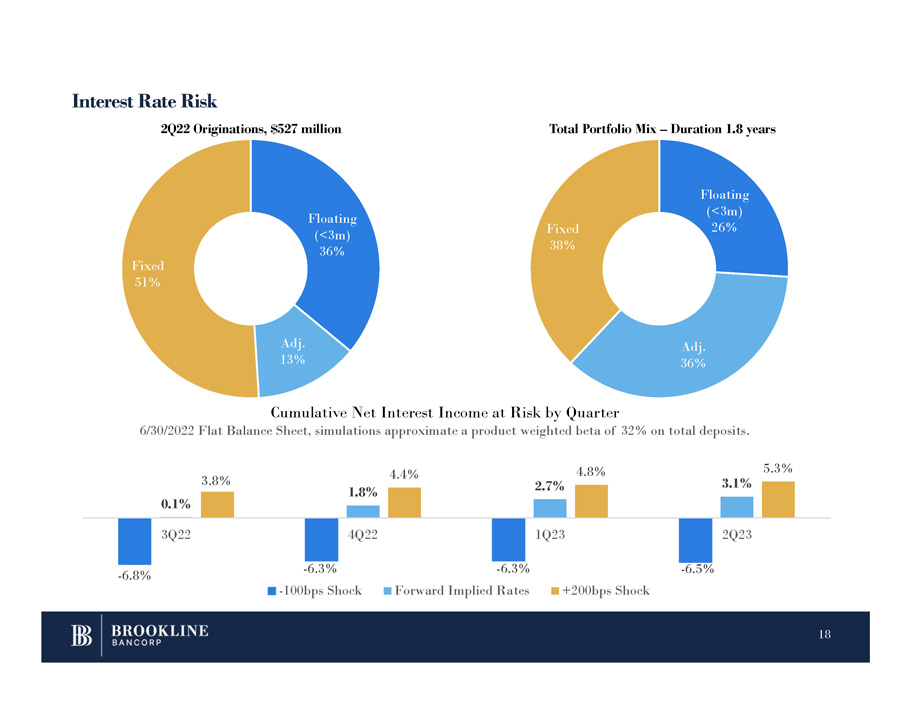
Interest Rate Risk Floating (<3m) 36% Adj. 13% Fixed 51% Floating (<3m) 26% Adj. 36% Fixed 38% 2Q22 Originations, $527 million Total Portfolio Mix – Duration 1.8 years - 6.8% - 6.5% 0.1% 1.8% 2.7% 3.1% 3.8% 4.4% 4.8% 5.3% 3Q22 4Q22 1Q23 2Q23 - 6.3% - 100bps Shock - 6.3% Forward Implied Rates Cumulative Net Interest Income at Risk by Quarter 6/30/2022 Flat Balance Sheet, simulations approximate a product weighted beta of 32% on total deposits. +200bps Shock 18
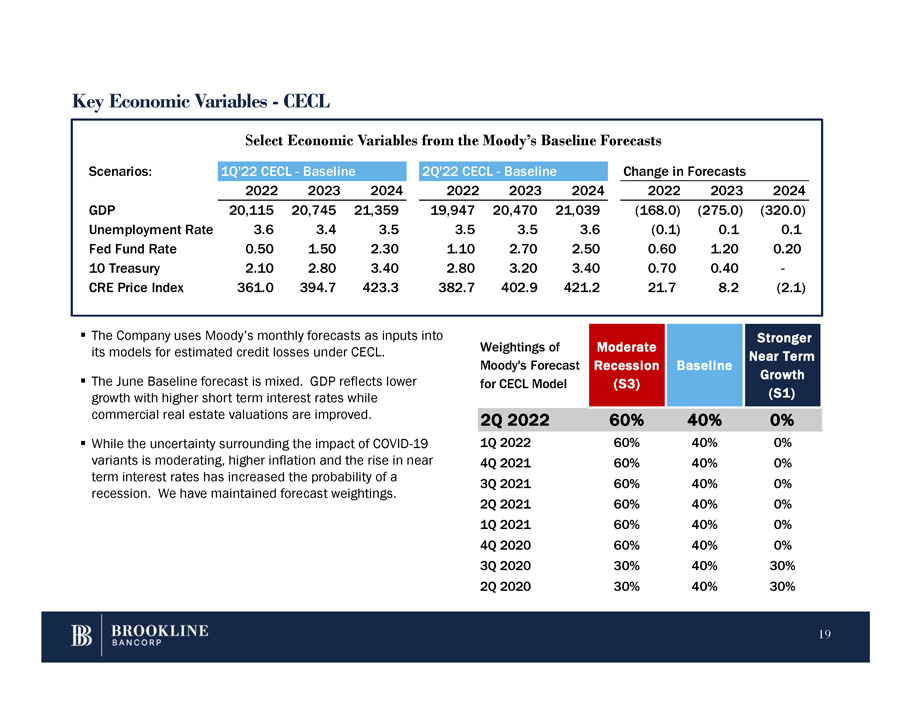
Key Economic Variables - CECL Select Economic Variables from the Moody’s Baseline Forecasts ▪ The Company uses Moody’s monthly forecasts as inputs into its models for estimated credit losses under CECL. ▪ The June Baseline forecast is mixed. GDP reflects lower growth with higher short term interest rates while commercial real estate valuations are improved. ▪ While the uncertainty surrounding the impact of COVID - 19 variants is moderating, higher inflation and the rise in near term interest rates has increased the probability of a recession. We have maintained forecast weightings. 19 Scenarios: 1Q'22 CECL - Baselin e 2Q'22 CECL - Baselin e Change in Forecasts 2022 2023 2024 2022 2023 2024 2022 2023 2024 GDP 20,115 20,745 21,359 19,947 20,470 21,039 (168.0) (275.0) (320.0) Unemployment Rate 3.6 3.4 3.5 3.5 3.5 3.6 (0.1) 0.1 0.1 Fed Fund Rate 0.50 1.50 2.30 1.10 2.70 2.50 0.60 1.20 0.20 10 Treasury 2.10 2.80 3.40 2.80 3.20 3.40 0.70 0.40 - CRE Price Index 361.0 394.7 423.3 382.7 402.9 421.2 21.7 8.2 (2.1) Weightings of Moody's Forecast Moderate Recession Baseline Stronger Near Term Growth for CECL Model (S3) (S1) 2Q 2022 60% 40% 0% 1Q 2022 60% 40% 0% 4Q 2021 60% 40% 0% 3Q 2021 60% 40% 0% 2Q 2021 60% 40% 0% 1Q 2021 60% 40% 0% 4Q 2020 60% 40% 0% 3Q 2020 30% 40% 30% 2Q 2020 30% 40% 30%