EXHIBIT 99.2
October 27, 2022 1 3Q 2022 Financial Results
Forward Looking Statements 2 Certain statements contained in this press release that are not historical facts may constitute forward - looking statements within the meaning of Section 27A of the Securities Act of 1933, as amended, and Section 21E of the Securities Exchange Act of 1934, as amended, and are intended to be covered by the safe harbor provisions of the Private Securities Litigation Reform Act of 1995. We may also make forward - looking statements in other documents we file with the Securities and Exchange Commission ("SEC"), in our annual reports to shareholders, in press releases and other written materials, and in oral statements made by our officers, directors or employees. You can identify forward looking statements by the use of the words “believe,” “expect,” “anticipate,” “intend,” “estimate,” “assume,” “outlook,” “will,” “should,” and other expressions that predict or indicate future events and trends and which do not relate to historical matters, including statements regarding the Company’s business, credit quality, financial condition, liquidity and results of operations. Forward - looking statements may differ, possibly materially, from what is included in this press release due to factors and future developments that are uncertain and beyond the scope of the Company’s control. These included, but are not limited to, general business and economic conditions on a national basis and in the local markets in which the Company operates; the Company and PCSB’s ability to achieve the synergies and value creation contemplated by the proposed acquisition; the Company and PCSB’s ability to successfully integrate operations in the proposed acquisition; the effect of the announcement of the proposed acquisition on the ability of PCSB to maintain relationships with its key partners, customers and employees, and on its operating business generally, changes in consumer behavior due to changing political business and economic conditions (including inflation); and ongoing turbulence in capital and debt markets. Forward - looking statements involve risks and uncertainties which are difficult to predict. The Company’s actual results could differ materially from those projected in the forward - looking statements as a result of, among others, the risks outlined in the Company’s Annual Report on Form 10 - K, as updated by its Quarterly Reports on Form 10 - Q and other filings submitted to the SEC. The Company does not undertake any obligation to update any forward - looking statement to reflect circumstances or events that occur after the date the forward - looking statements are made.
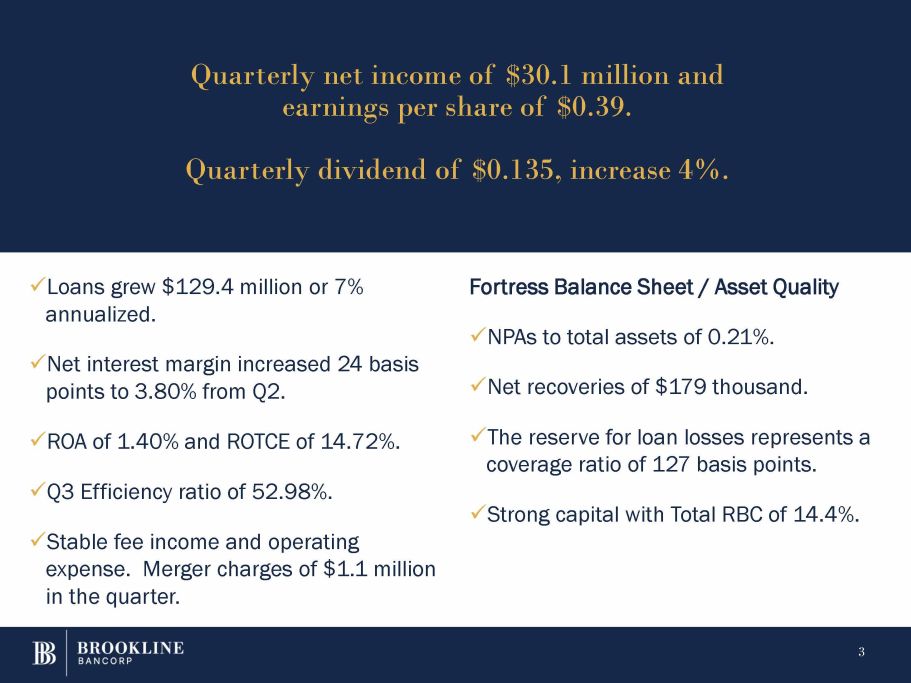
x Loans grew $129.4 million or 7% annualized. 3 x Net interest margin increased 24 basis points to 3.80% from Q2. x ROA of 1.40% and ROTCE of 14.72%. Fortress Balance Sheet / Asset Quality x NPAs to total assets of 0.21%. x Net recoveries of $179 thousand. x The reserve for loan losses represents a coverage ratio of 127 basis points. x Q3 Efficiency ratio of 52.98%. x Strong capital with Total RBC of 14.4%. x Stable fee income and operating expense. Merger charges of $1.1 million in the quarter. Quarterly net income of $30.1 million and earnings per share of $0.39. Quarterly dividend of $0.135, increase 4%.
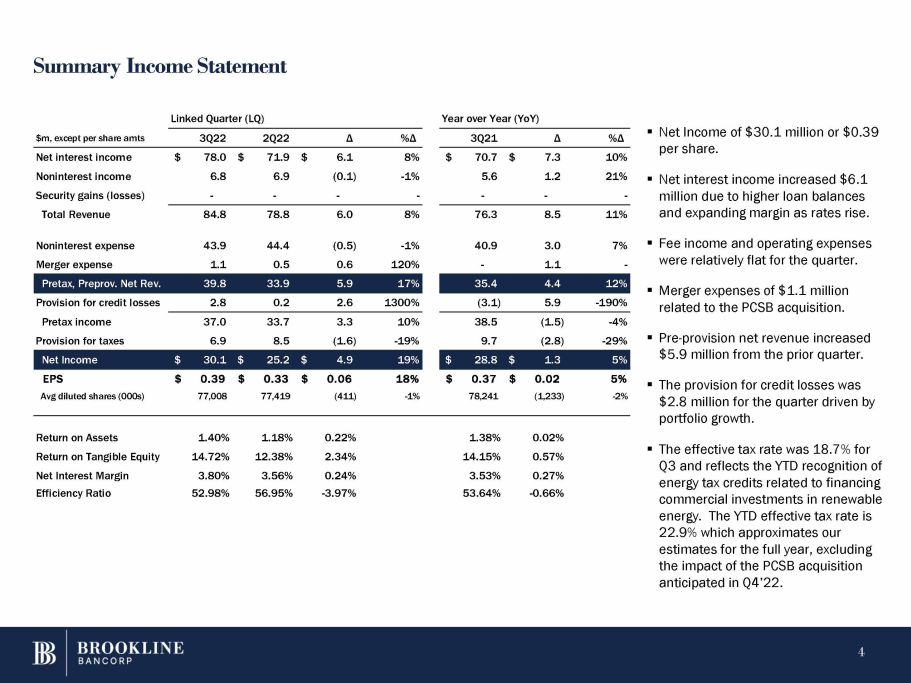
Summary Income Statement ▪ Net Income of $30.1 million or $0.39 per share. ▪ Net interest income increased $ 6 . 1 million due to higher loan balances and expanding margin as rates rise . Fee income and operating expenses were relatively flat for the quarter. ▪ Merger expenses of $1.1 million related to the PCSB acquisition. $5.9 million from the prior quarter. ▪ The provision for credit losses was $2.8 million for the quarter driven by portfolio growth. ▪ The effective tax rate was 18.7% for Q3 and reflects the YTD recognition of energy tax credits related to financing commercial investments in renewable energy. The YTD effective tax rate is 22.9% which approximates our estimates for the full year, excluding the impact of the PCSB acquisition anticipated in Q4’22. Noninterest expense 43.9 44.4 (0.5) - 1% 40.9 3.0 7% ▪ Merger expense 1.1 0.5 0.6 120% - 1.1 - Pretax, Preprov. Net Rev. 39.8 33.9 5.9 17% 35.4 4.4 12% Provision for credit losses 2.8 0.2 2.6 1300% (3.1) 5.9 - 190% Pretax income 37.0 33.7 3.3 10% 38.5 (1.5) - 4% Provision for taxes 6.9 8.5 (1.6) - 19% 9.7 (2.8) - 29% ▪ Pre - provision net revenue increased Net Income $ 30.1 $ 25.2 $ 4.9 19% $ 28.8 $ 1.3 5% EPS $ 0.39 $ 0.33 $ 0.06 18% $ 0.37 $ 0.02 5% Avg diluted shares (000s) 77,008 77,419 (411) - 1% 78,241 (1,233) - 2% Linked Quarter (LQ) Year over Year (YoY) $m, except per share amts 3Q22 2Q22 Δ %Δ 3Q21 Δ %Δ Net interest income $ 78.0 $ 71.9 $ 6.1 8% $ 70.7 $ 7.3 10% Noninterest income 6.8 6.9 (0.1) - 1% 5.6 1.2 21% Security gains (losses) - - - - - - - Total Revenue 84.8 78.8 6.0 8% 76.3 8.5 11% Return on Assets 1.40% 1.18% 0.22% 1.38% 0.02% Return on Tangible Equity 14.72% 12.38% 2.34% 14.15% 0.57% Net Interest Margin 3.80% 3.56% 0.24% 3.53% 0.27% Efficiency Ratio 52.98% 56.95% - 3.97% 53.64% - 0.66% 4
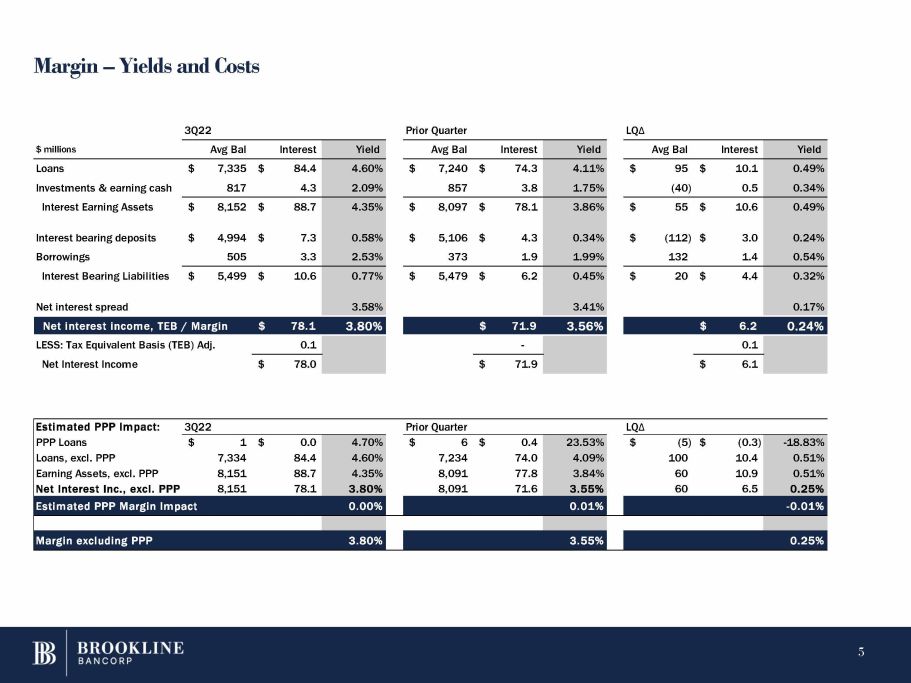
Margin – Yields and Costs 3Q22 Prior Quarter LQ Δ $ millions Avg Bal Interest Yield Avg Bal Interest Yield Avg Bal Interest Yield Loans $ 7,335 $ 84.4 4.60% $ 7,240 $ 74.3 4.11% $ 95 $ 10.1 0.49% Investments & earning cash 817 4.3 2.09% 857 3.8 1.75% (40) 0.5 0.34% Interest Earning Assets $ 8,152 $ 88.7 4.35% $ 8,097 $ 78.1 3.86% $ 55 $ 10.6 0.49% Interest bearing deposits $ 4,994 $ 7.3 0.58% $ 5,106 $ 4.3 0.34% $ (112) $ 3.0 0.24% Borrowings 505 3.3 2.53% 373 1.9 1.99% 132 1.4 0.54% Interest Bearing Liabilities $ 5,499 $ 10.6 0.77% $ 5,479 $ 6.2 0.45% $ 20 $ 4.4 0.32% Net interest spread 3.58% 3.41% 0.17% Net interest income, TEB / Margin $ 78.1 3.80% $ 71.9 3.56% $ 6.2 0.24% LESS: Tax Equivalent Basis (TEB) Adj. 0.1 - 0.1 Net Interest Income $ 78.0 $ 71.9 $ 6.1 Estimated PPP Impact: 3Q22 Prior Quarter LQ Δ PPP Loans $ 1 $ 0.0 4.70% $ 6 $ 0.4 23.53% $ (5) $ (0.3) - 18.83% Loans, excl. PPP 7,334 84.4 4.60% 7,234 74.0 4.09% 100 10.4 0.51% Earning Assets, excl. PPP 8,151 88.7 4.35% 8,091 77.8 3.84% 60 10.9 0.51% Net Interest Inc., excl. PPP 8,151 78.1 3.80% 8,091 71.6 3.55% 60 6.5 0.25% Estimated PPP Margin Impact 0.00% 0.01% - 0.01% Margin excluding PPP 3.80% 3.55% 0.25% 5
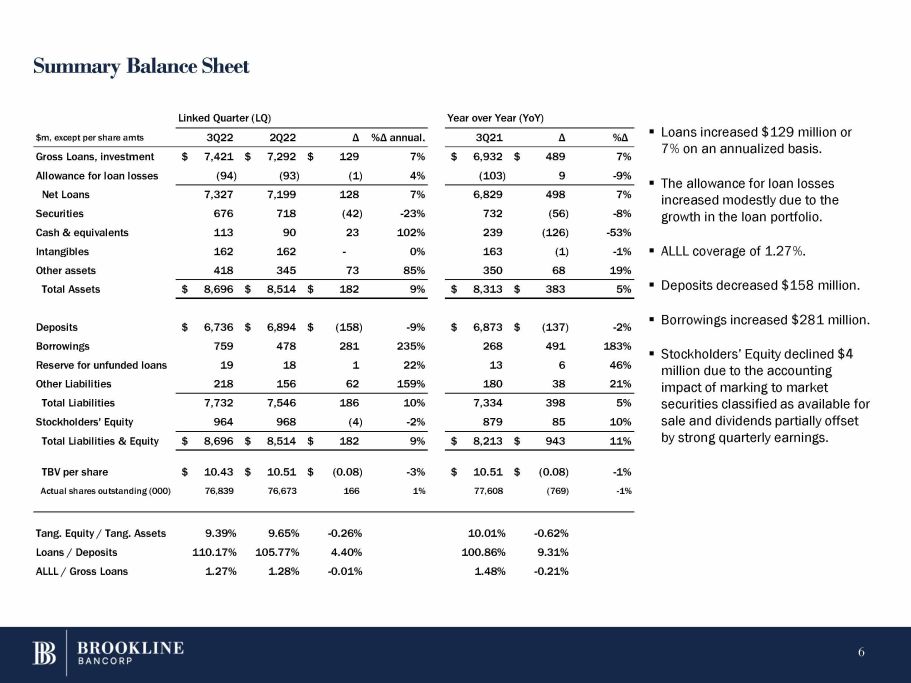
Summary Balance Sheet ▪ Loans increased $129 million or 7% on an annualized basis. ▪ The allowance for loan losses increased modestly due to the growth in the loan portfolio. ALLL coverage of 1.27%. ▪ Deposits decreased $158 million. Securities 676 718 (42) - 23% 732 (56) - 8% Cash & equivalents 113 90 23 102% 239 (126) - 53% Intangibles 162 162 - 0% 163 (1) - 1% ▪ Other assets 418 345 73 85% 350 68 19% ▪ Borrowings increased $281 million. ▪ Stockholders’ Equity declined $4 million due to the accounting impact of marking to market Linked Quarter (LQ) Year over Year (YoY) $m, except per share amts 3Q22 2Q22 Δ %Δ annual. 3Q21 Δ %Δ Gross Loans, investment $ 7,421 $ 7,292 $ 129 7% $ 6,932 $ 489 7% Allowance for loan losses (94) (93) (1) 4% (103) 9 - 9% Net Loans 7,327 7,199 128 7% 6,829 498 7% Total Assets $ 8,696 $ 8,514 $ 182 9% $ 8,313 $ 383 5% Deposits $ 6,736 $ 6,894 $ (158) - 9% $ 6,873 $ (137) - 2% Borrowings 759 478 281 235% 268 491 183% Reserve for unfunded loans 19 18 1 22% 13 6 46% Other Liabilities 218 156 62 159% 180 38 21% Total Liabilities 7,732 7,546 186 10% 7,334 398 5% securities classified as available for Stockholders' Equity 964 968 (4) - 2% 879 85 10% sale and dividends partially offset Total Liabilities & Equity $ 8,696 $ 8,514 $ 182 9% $ 8,213 $ 943 11% by strong quarterly earnings. TBV per share $ 10.43 $ 10.51 $ (0.08) - 3% $ 10.51 $ (0.08) - 1% Actual shares outstanding (000) 76,839 76,673 166 1% 77,608 (769) - 1% Tang. Equity / Tang. Assets 9.39% 9.65% - 0.26% 10.01% - 0.62% Loans / Deposits 110.17% 105.77% 4.40% 100.86% 9.31% ALLL / Gross Loans 1.27% 1.28% - 0.01% 1.48% - 0.21% 6
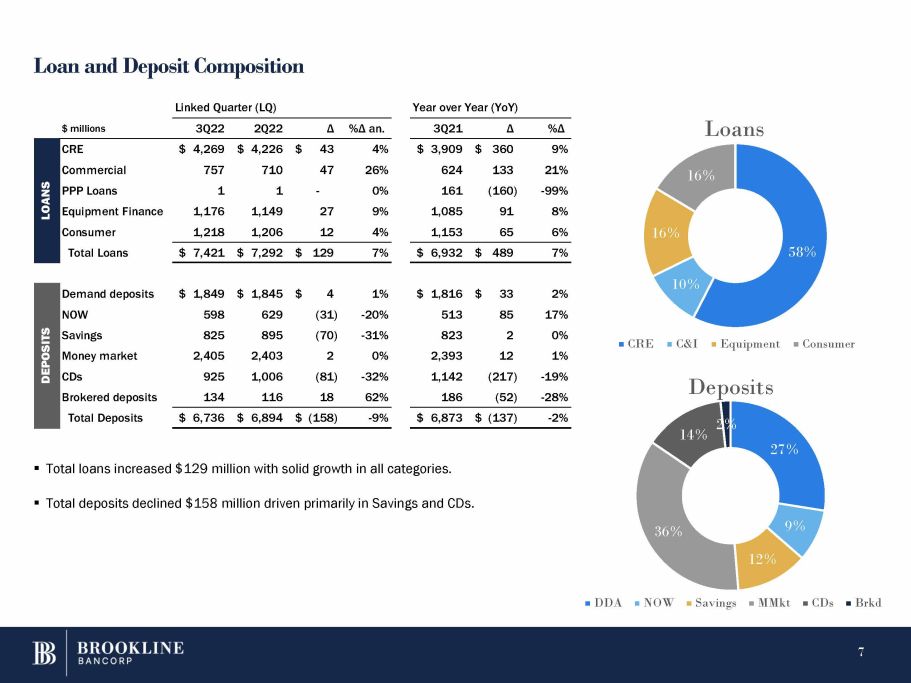
Loan and Deposit Composition 58% 16% Loans 16% 27% 9% 36% 14% 2% 10% CRE C&I Equipment Consumer Deposits 12% DDA NOW Savings MMkt CDs Brkd Demand deposits $ 1,849 $ 1,845 $ 4 1% $ 1,816 $ 33 2% NOW 598 629 (31) - 20% 513 85 17% ITS Savings 825 895 (70) - 31% 823 2 0% PO S Money market 2,405 2,403 2 0% 2,393 12 1% D E CDs 925 1,006 (81) - 32% 1,142 (217) - 19% Brokered deposits 134 116 18 62% 186 (52) - 28% Total Deposits $ 6,736 $ 6,894 $ (158) - 9% $ 6,873 $ (137) - 2% $ millions 3Q22 2Q22 Δ %Δ an. 3Q21 Δ %Δ $ 3,909 624 161 1,085 1,153 $ 360 9% 133 21% (160) - 99% 91 8% 65 6% - $ 4,269 757 1 1,176 1,218 $ 4,226 $ 43 710 47 1 1,149 1,206 27 12 4% 26% 0% 9% 4% CRE Commercial PPP Loans Equipment Finance Consumer Total Loans $ 7,421 $ 7,292 $ 129 7% $ 6,932 $ 489 7% Linked Quarter (LQ) Year over Year (YoY) LOANS ▪ Total loans increased $129 million with solid growth in all categories. ▪ Total deposits declined $158 million driven primarily in Savings and CDs. 7

Capital Strength 8 ▪ As of September 30, 2022, the Company maintained capital well above regulatory “well capitalized” requirements. ▪ On November 15, 2021, the Company announced a $20 million stock buyback program authorizing management to repurchase stock through December 31, 2022. Approximately $13.8 million was used to acquire 956,341 shares under the program. The repurchase program was paused on June 24, 2022 and will expire at the end of the year. preliminary estimates* Regulatory BASEL III Requirements Brookline Board Policy Limits Capital in Excess of "Well Capitalized" $ millions Sep - 22 Minimum "Well Capitalized" Policy Minimums Operating Targets Excess Ratio Excess Capital Tier 1 Common / RWA 12.0% ≥ 4.5% ≥ 6.5% ≥ 7.5% ≥ 8.0% 5.5% $ 399.8 Tier 1 / RWA 12.1% ≥ 6.0% ≥ 8.0% ≥ 9.0% ≥ 9.5% 4.1% $ 300.1 Total Risk Based Capital 14.4% ≥ 8.0% ≥ 10.0% ≥ 11.0% ≥ 11.5% 4.4% $ 319.7 Leverage Ratio 10.5% ≥ 5.0% ≥ 5.0% ≥ 5.5% ≥ 6.0% 5.5% $ 462.2 * Regulatory capital ratios are preliminary estimates and may differ from numbers calculated in final Regulatory filings.

Regular Dividends Per Share The Board of Directors announced a dividend of $0.135 per share payable November 25, 2022 to stockholders of record on November 11, 2022. 0.046 $0.096 $0.110 $0.210 $0.316 $0.340 $0.340 $0.340 $0.340 $0.340 $0.340 $0.340 $0.340 $0.340 $0.340 $0.340 $0.340 $0.355 $0.360 $0.360 $0.395 $0.440 $0.460 $0.480 $0.125 $0.130 $0.130 $0.135 1998 1999 2000 2001 2002 2003 2004 2005 2006 2007 2008 2009 2010 2011 2012 2013 2014 2015 2016 2017 2018 2019 2020 2021 Q1'22 Q2'22 Q3'22 Q4'22 Full Year $0.52 +8.3% YoY The Board has increased the quarterly dividend twice a year since 2018, with a pause in 2020 due to pandemic uncertainty. 9

QUESTIONS Paul A. Perrault, Chairman and Chief Executive Officer Carl M. Carlson, Co - President and Chief Financial Officer Thank You. 10
APPENDIX 11
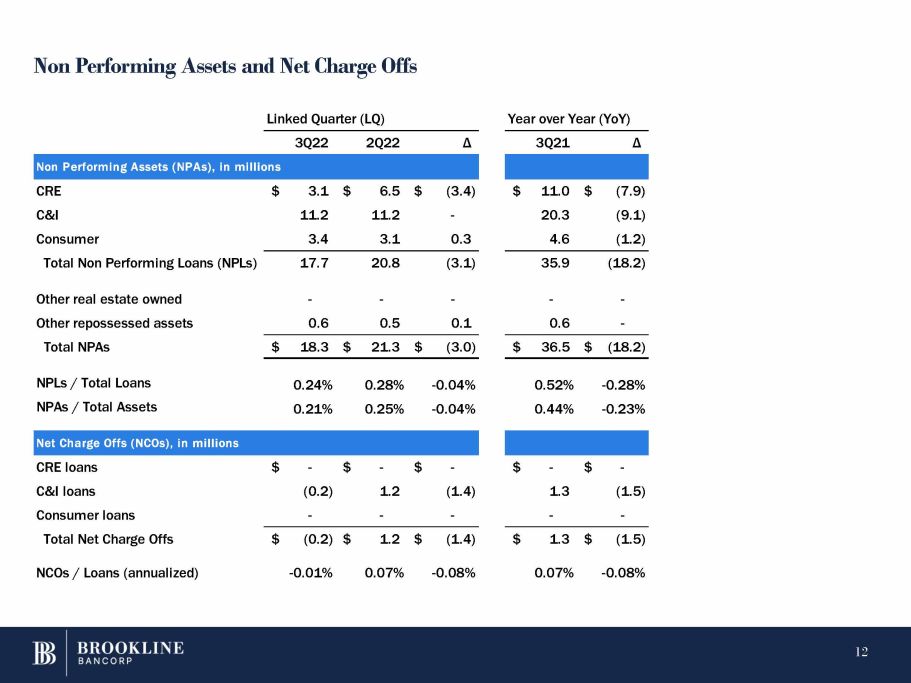
Non Performing Assets and Net Charge Offs 12 3Q22 2Q22 Δ 3Q21 Δ Non Performing Assets (NPAs), in milli ons CRE $ 3.1 $ 6.5 $ (3.4) $ 11.0 $ (7.9) C&I 11.2 11.2 - 20.3 (9.1) Consumer 3.4 3.1 0.3 4.6 (1.2) Total Non Performing Loans (NPLs) 17.7 20.8 (3.1) 35.9 (18.2) Other real estate owned - - - - - Other repossessed assets 0.6 0.5 0.1 0.6 - Total NPAs $ 18.3 $ 21.3 $ (3.0) $ 36.5 $ (18.2) NPLs / Total Loans 0.24% 0.28% - 0.04% 0.52% - 0.28% NPAs / Total Assets 0.21% 0.25% - 0.04% 0.44% - 0.23% Net Charge Offs (NCOs), in millions CRE loans $ - $ - $ - $ - $ - C&I loans (0.2) 1.2 (1.4) 1.3 (1.5) Consumer loans - - - - - Total Net Charge Offs $ (0.2) $ 1.2 $ (1.4) $ 1.3 $ (1.5) NCOs / Loans (annualized) - 0.01% 0.07% - 0.08% 0.07% - 0.08% Linked Quarter (LQ) Year over Year (YoY)
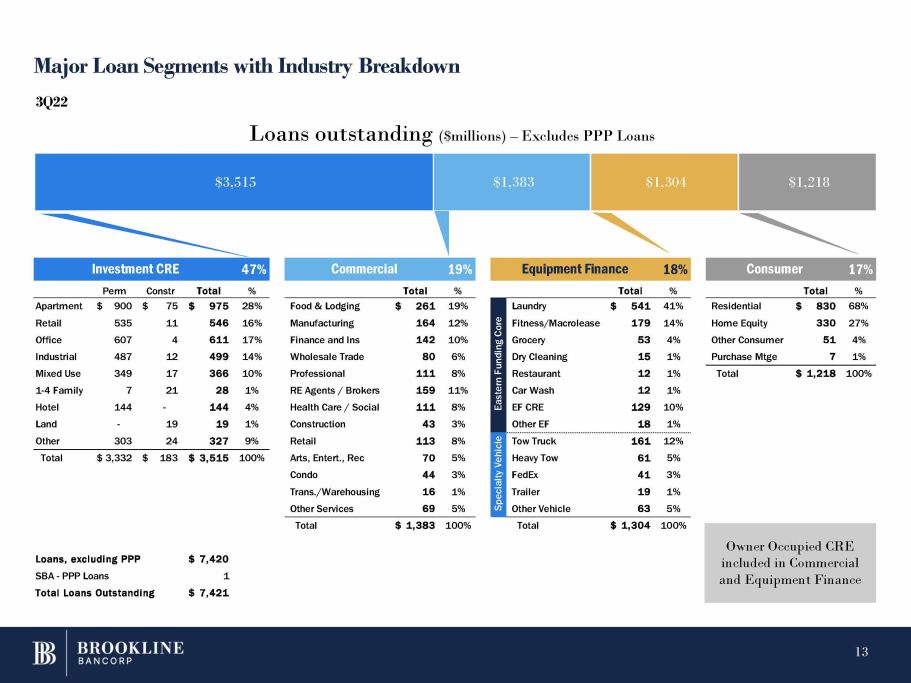
Investment CRE 47% Commercial 19% Equipment Finance 18% Consumer 17% Perm Constr Total % Total % Total % Total % Apartment $ 900 $ 75 $ 975 28% Food & Lodging $ 261 19% Retail 535 11 546 16% Manufacturing 164 12% Office 607 4 611 17% Finance and Ins 142 10% Industrial 487 12 499 14% Wholesale Trade 80 6% Mixed Use 349 17 366 10% Professional 111 8% 1 - 4 Family 7 21 28 1% RE Agents / Brokers 159 11% Hotel 144 - 144 4% Health Care / Social 111 8% Land - 19 19 1% Construction 43 3% Other 303 24 327 9% Retail 113 8% Total $ 3,332 $ 183 $ 3,515 100% Arts, Entert., Rec 70 5% Condo 44 3% Trans./Warehousing 16 1% Other Services 69 5% Residential Home Equity Other Consumer Purchase Mtge $ 830 68% 330 27% 51 4% 7 1% Total $ 1,218 100% Total $ 1,383 100% Total $ 1,304 100% Eastern Funding Core Laundry $ 541 41% Fitness/Macrolease 179 14% Grocery 53 4% Dry Cleaning 15 1% Restaurant 12 1% Car Wash 12 1% EF CRE 129 10% Other EF 18 1% Specialty Vehicle Tow Truck 161 12% Heavy Tow 61 5% FedEx 41 3% Trailer 19 1% Other Vehicle 63 5% Loans, excluding PPP SBA - PPP Loans Total Loans Outstanding $ 7,420 1 $ 7,421 Major Loan Segments with Industry Breakdown $3,515 $1,383 $1,304 $1,218 3Q22 Loans outstanding ($millions) – Excludes PPP Loans Owner Occupied CRE included in Commercial and Equipment Finance 13
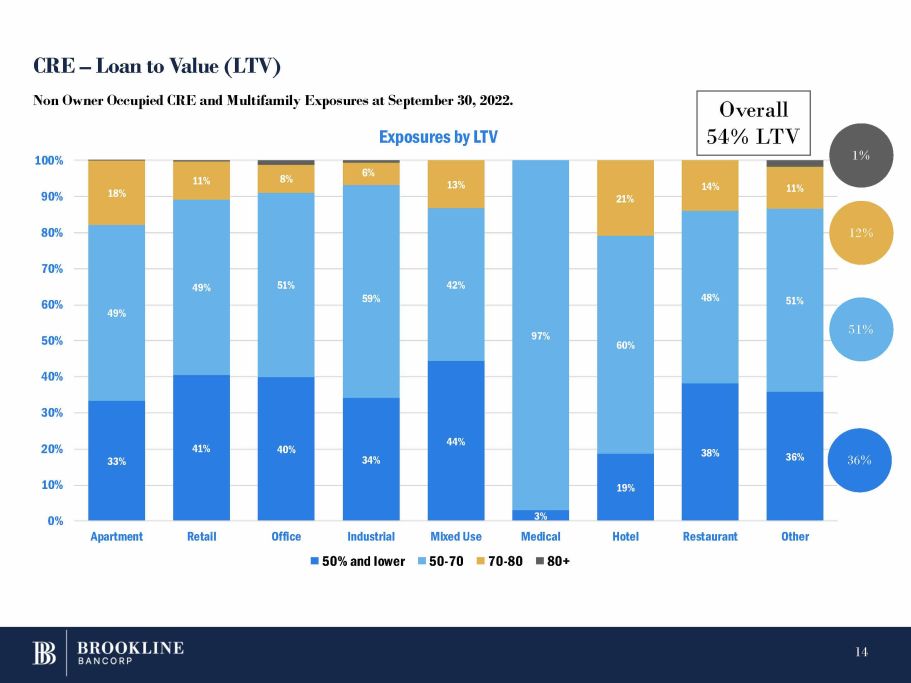
CRE – Loan to Value (LTV) 33% 41% 40% 34% 44% 3% 19% 38% 36% 49% 49% 51% 59% 42% 97% 60% 48% 51% 18% 11% 8% 6% 13% 21% 14% 11% 0% 10% 20% 30% 40% 50% 60% 70% 80% 90% 100% Apartment Retail Office Medical Hotel Restaurant Other Exposures by LTV Industrial 50% and lower Mixed Use 50 - 70 70 - 80 80+ Non Owner Occupied CRE and Multifamily Exposures at September 30, 2022. 36% 51% 1% 12% 14 Overall 54% LTV

27% 47% 26% 23% 21% 21% 52% 54% 22% 9% 9% 8% 2% 3% 2% 0% 6% 5% 7% 8% 9% 11% 25% 16% 9% 9% 15% 7% 18% 9% 3% 16% 20% 25% 10% 6% 12% 4% 5% 14% 7% 0% 4% 3% 13% 20% 14% 29% 36% 19% 33% 13% 24% 10% 10% 5% 12% 22% 2% 21% 0% 10% 20% 30% 40% 50% 60% 70% 80% 90% 100% Apartment Retail Office 2016 and Before Restaurant Other Non Owner Occupied CRE and Multifamily Exposures at September 30, 2022. Exposures by Year of Origination Industrial Mixed Use Medical Hotel 2017 2018 2019 2020 2021 2022 11 % CRE - Vintage 23 % 9 % 13 % 8 % 6 % 30 % 15
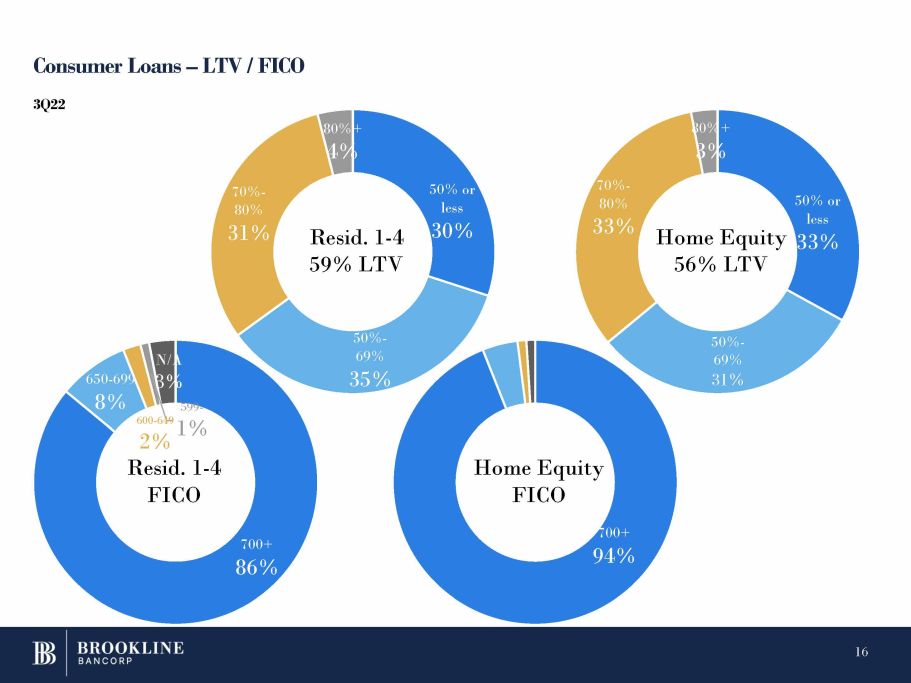
Consumer Loans – LTV / FICO 16 700+ 86% 650 - 699 8% 600 - 649 1% N/A 3% 599 - 50% or less 30% 50% - 69% 35% 70% - 80% 31% 80%+ 4% 700+ 94% 50% - 69% 31% 70% - 80% 33% 80%+ 3% Resid. 1 - 4 59% LTV 2% Resid. 1 - 4 FICO Home Equity FICO 50% or less Home Equity 33% 56% LTV 3Q22
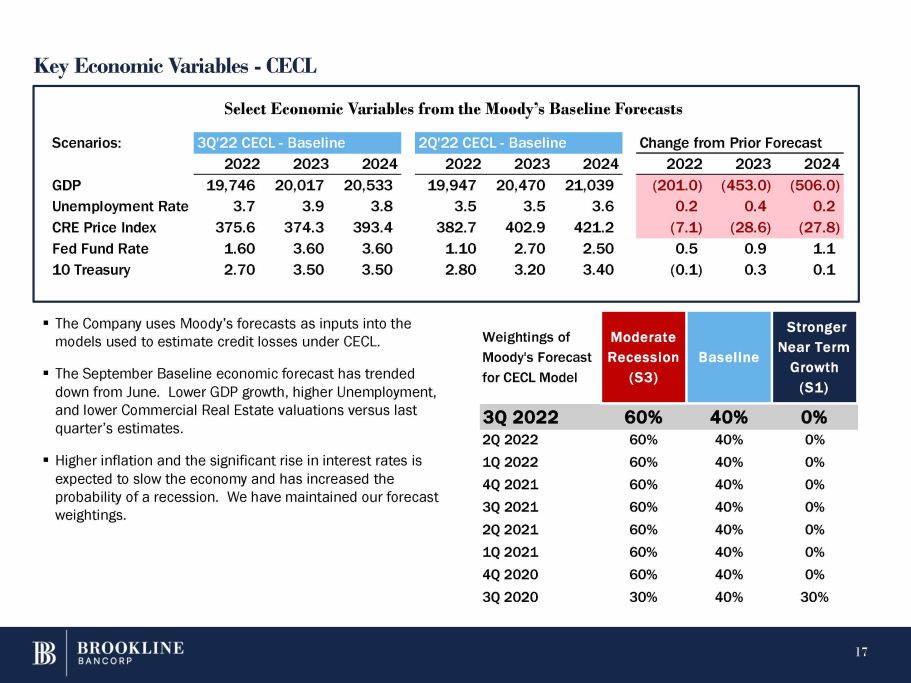
Key Economic Variables - CECL ▪ The Company uses Moody’s forecasts as inputs into the models used to estimate credit losses under CECL. ▪ The September Baseline economic forecast has trended down from June. Lower GDP growth, higher Unemployment, and lower Commercial Real Estate valuations versus last quarter’s estimates. ▪ Higher inflation and the significant rise in interest rates is expected to slow the economy and has increased the probability of a recession. We have maintained our forecast weightings. Select Economic Variables from the Moody’s Baseline Forecasts Scenarios: 3Q'22 CECL - Baseline 2Q'22 CECL - Baseline Change from Prior Forecast 2022 2023 2024 2022 2023 2024 2022 2023 2024 GDP 19,746 20,017 20,533 19,947 20,470 21,039 (201.0) (453.0) (506.0) Unemployment Rate 3.7 3.9 3.8 3.5 3.5 3.6 0.2 0.4 0.2 CRE Price Index 375.6 374.3 393.4 382.7 402.9 421.2 (7.1) (28.6) (27.8) Fed Fund Rate 1.60 3.60 3.60 1.10 2.70 2.50 0.5 0.9 1.1 10 Treasury 2.70 3.50 3.50 2.80 3.20 3.40 (0.1) 0.3 0.1 17 Weightings of Moody's Forecast for CECL Model Moderate Recession (S3) Baseline Stronger Near Term Growth (S1) 3Q 2022 60% 40% 0% 2Q 2022 60% 40% 0% 1Q 2022 60% 40% 0% 4Q 2021 60% 40% 0% 3Q 2021 60% 40% 0% 2Q 2021 60% 40% 0% 1Q 2021 60% 40% 0% 4Q 2020 60% 40% 0% 3Q 2020 30% 40% 30%

Securities Portfolio 0.25% 3.25% 0.08% 0.05% 0.10% 0.28% 0.97% 1.49% 3.25% 6.25% 3.14% 2.98% 3.22% 4.59% 4.09% 3.83% Fed Funds (upper) Prime 1M LIBOR SOFR Ameribor 2Y Treasury 5Y Treasury 10Y Treasury ▪ Highly liquid, risk averse securities portfolio with moderate duration and minimal extension risk. The entire investment portfolio is classified as Available for Sale. ▪ The mark to market on the portfolio is recorded in Accumulated Other Comprehensive Income in Stockholders Equity on an after tax basis and represents a reduction of approximately - 6.3%. There is no impact on regulatory capital. 9/30/2021 12/31/2021 3/31/2022 6/30/2022 9/30/2022 UST 50% 18 Agency 24% Corp 2% CMO 3% MBS 21% 3Q22 $ in millions Current Par Book Value Fair Value Unreal. G/L Book Yield Duration U.S. Treasuries $ 374 $ 376 $ 337 $ (39) 1.62% 4.1 Agency Debentures 176 185 160 (25) 1.64% 4.6 Corp Bonds 14 14 14 - 2.59% 1.3 Agency MBS 164 166 145 (21) 2.15% 5.0 Agency CMO 21 21 19 (2) 1.86% 3.2 Other 1 1 1 - 1.97% 2.2 Total $ 750 $ 763 $ 676 $ (87) 1.77% 4.3
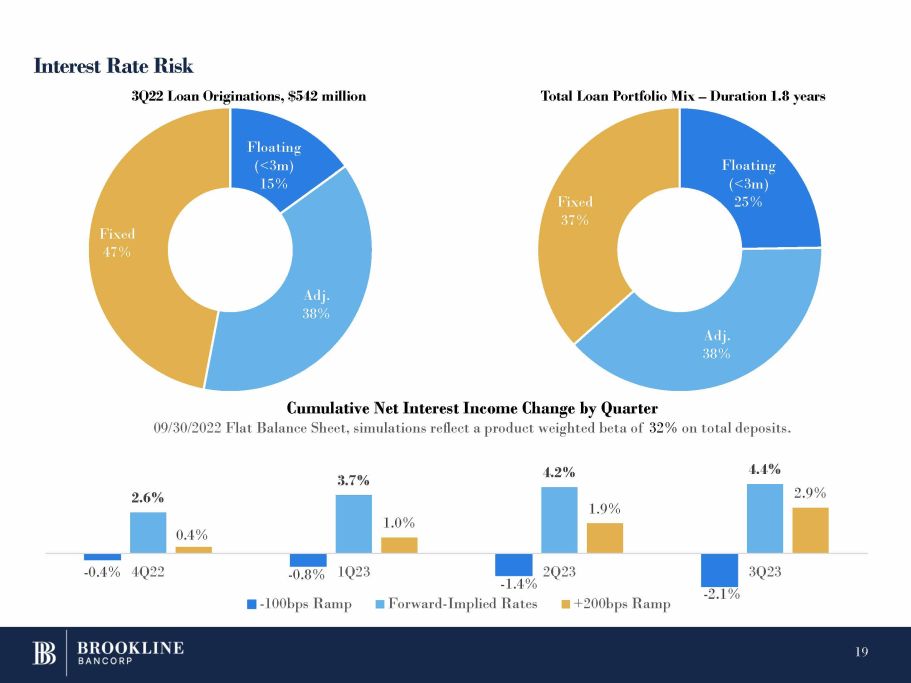
Interest Rate Risk Floating (<3m) 15% Adj. 38% Fixed 47% Floating (<3m) 25% Fixed 37% Adj. 38% Cumulative Net Interest Income Change by Quarter 09/30/2022 Flat Balance Sheet, simulations reflect a product weighted beta of 32% on total deposits. 3Q22 Loan Originations, $542 million Total Loan Portfolio Mix – Duration 1.8 years - 0.8% - 2.1% 2.6% 3.7% 4.2% 4.4% 0.4% 1.0% 1.9% 2.9% - 0.4% 4Q22 1Q23 2Q23 - 1.4% 3Q23 - 100bps Ramp Forward - Implied Rates +200bps Ramp 19
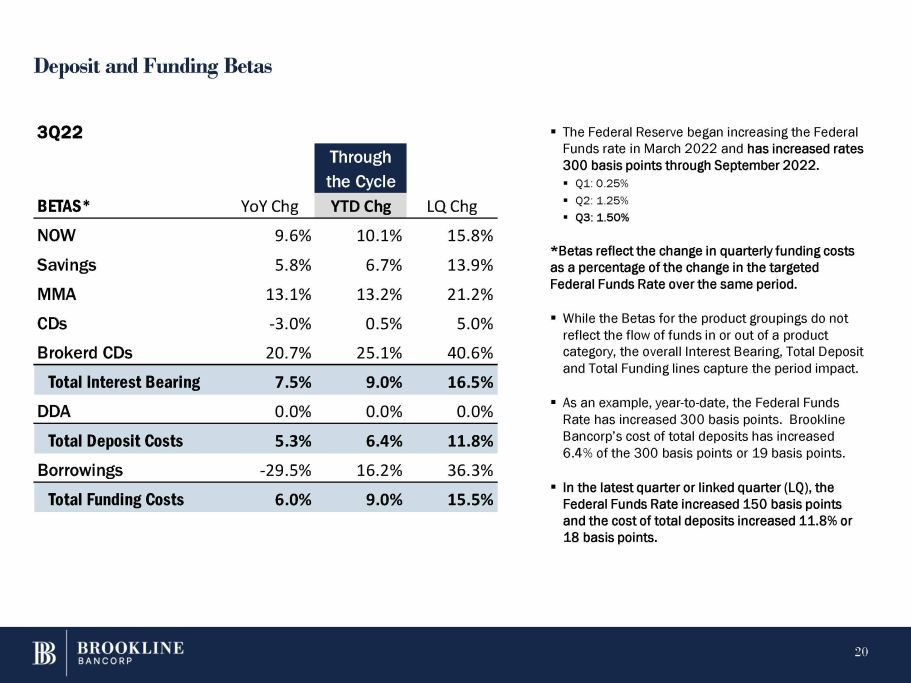
Deposit and Funding Betas NOW 9.6% 10.1% 15.8% Savings 5.8% 6.7% 13.9% MMA 13.1% 13.2% 21.2% CDs - 3.0% 0.5% 5.0% Brokerd CDs 20.7% 25.1% 40.6% Total Interest Bearing 7.5% 9.0% 16.5% DDA 0.0% 0.0% 0.0% Total Deposit Costs 5.3% 6.4% 11.8% Borrowings - 29.5% 16.2% 36.3% Total Funding Costs 6.0% 9.0% 15.5% 3Q22 Through the Cycle BETAS* YoY Chg YTD Chg LQ Chg ▪ The Federal Reserve began increasing the Federal Funds rate in March 2022 and has increased rates 300 basis points through September 2022. ▪ Q1: 0.25% ▪ Q2: 1.25% ▪ Q3: 1.50% 20 *Betas reflect the change in quarterly funding costs as a percentage of the change in the targeted Federal Funds Rate over the same period. ▪ While the Betas for the product groupings do not reflect the flow of funds in or out of a product category, the overall Interest Bearing, Total Deposit and Total Funding lines capture the period impact. ▪ As an example, year - to - date, the Federal Funds Rate has increased 300 basis points. Brookline Bancorp’s cost of total deposits has increased 6.4% of the 300 basis points or 19 basis points. ▪ In the latest quarter or linked quarter (LQ), the Federal Funds Rate increased 150 basis points and the cost of total deposits increased 11.8% or 18 basis points.