EXHIBIT 99.2
April 26, 2023 1 1Q 2023 Financial Results
Forward Looking Statements 2 Certain statements contained in this press release that are not historical facts may constitute forward - looking statements within the meaning of Section 27A of the Securities Act of 1933, as amended, and Section 21E of the Securities Exchange Act of 1934, as amended, and are intended to be covered by the safe harbor provisions of the Private Securities Litigation Reform Act of 1995. We may also make forward - looking statements in other documents we file with the Securities and Exchange Commission ("SEC"), in our annual reports to shareholders, in press releases and other written materials, and in oral statements made by our officers, directors or employees. You can identify forward looking statements by the use of the words “believe,” “expect,” “anticipate,” “intend,” “estimate,” “assume,” “outlook,” “will,” “should,” and other expressions that predict or indicate future events and trends and which do not relate to historical matters, including statements regarding the Company’s business, credit quality, financial condition, liquidity and results of operations. Forward - looking statements may differ, possibly materially, from what is included in this press release due to factors and future developments that are uncertain and beyond the scope of the Company’s control. These include, but are not limited to, the Company’s ability to achieve the synergies and value creation contemplated by the acquisition of PCSB; turbulence in the capital and debt markets; changes in interest rates and concerns about liquidity; competitive pressures from other financial institutions; general economic conditions (including inflation) on a national basis or in the local markets in which the Company operates; changes in consumer behavior due to changing political, business and economic conditions, or legislative or regulatory initiatives; changes in the value of securities and other assets in the Company’s investment portfolio; increases in loan and lease default and charge - off rates; the adequacy of allowances for loan and lease losses; decreases in deposit levels that necessitate increases in borrowing to fund loans and investments; operational risks including, but not limited to, cybersecurity incidents, fraud, natural disasters, and future pandemics; changes in regulation; the possibility that future credit losses may be higher than currently expected due to changes in economic assumptions and adverse economic developments; the risk that goodwill and intangibles recorded in the Company’s financial statements will become impaired; and changes in assumptions used in making such forward - looking statements. Forward - looking statements involve risks and uncertainties which are difficult to predict. The Company’s actual results could differ materially from those projected in the forward - looking statements as a result of, among others, the risks outlined in the Company’s Annual Report on Form 10 - K, as updated by its Quarterly Reports on Form 10 - Q and other filings submitted to the SEC. The Company does not undertake any obligation to update any forward - looking statement to reflect circumstances or events that occur after the date the forward - looking statements are made.
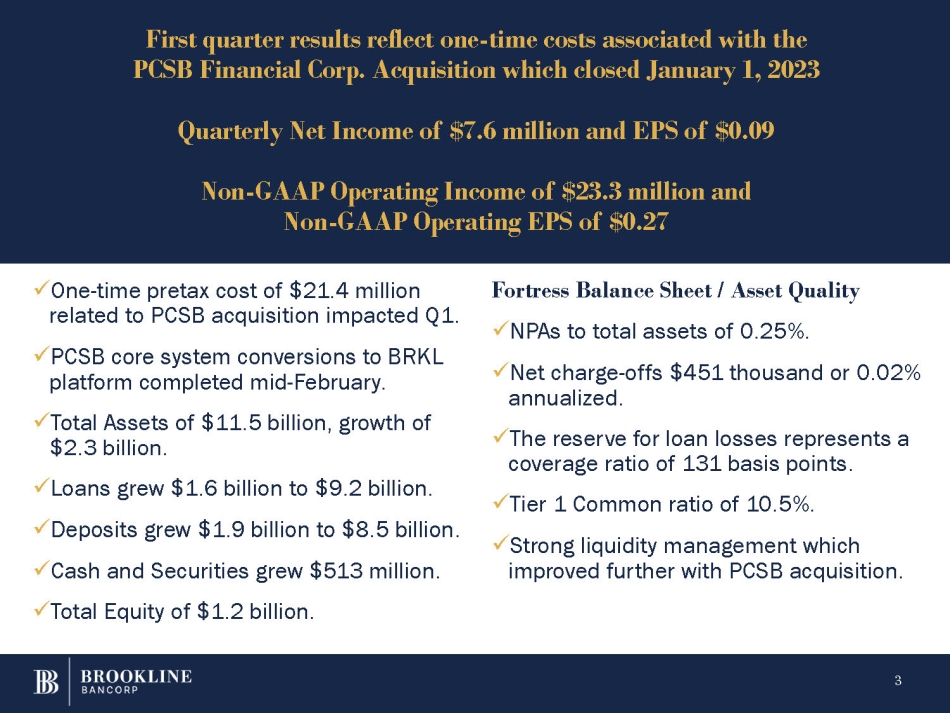
x One - time pretax cost of $21.4 million related to PCSB acquisition impacted Q1. x PCSB core system conversions to BRKL platform completed mid - February. x Total Assets of $11.5 billion, growth of $2.3 billion. x Loans grew $1.6 billion to $9.2 billion. x Deposits grew $1.9 billion to $8.5 billion. x Cash and Securities grew $513 million. x Total Equity of $1.2 billion. 3 Fortress Balance Sheet / Asset Quality x NPAs to total assets of 0.25%. x Net charge - offs $451 thousand or 0.02% annualized. x The reserve for loan losses represents a coverage ratio of 131 basis points. x Tier 1 Common ratio of 10.5%. x Strong liquidity management which improved further with PCSB acquisition. First quarter results reflect one - time costs associated with the PCSB Financial Corp. Acquisition which closed January 1, 2023 Quarterly Net Income of $7.6 million and EPS of $0.09 Non - GAAP Operating Income of $23.3 million and Non - GAAP Operating EPS of $0.27
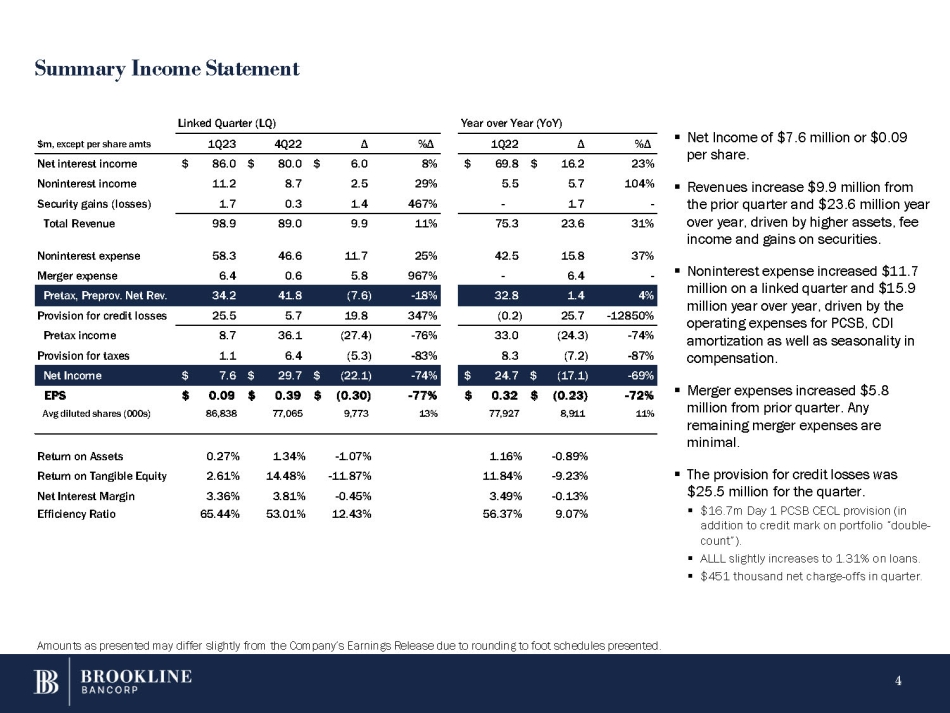
Summary Income Statement ▪ Net Income of $7.6 million or $0.09 per share. ▪ Revenues increase $9.9 million from the prior quarter and $23.6 million year - 1.7 - 467% 1.4 0.3 1.7 Security gains (losses) over year, driven by higher assets, fee income and gains on securities. 31% 23.6 75.3 11% 9.9 89.0 98.9 Total Revenue ▪ Noninterest expense increased $11.7 million on a linked quarter and $15.9 million year over year, driven by the operating expenses for PCSB, CDI amortization as well as seasonality in compensation. ▪ Merger expenses increased $5.8 million from prior quarter. Any remaining merger expenses are minimal. ▪ The provision for credit losses was $25.5 million for the quarter. ▪ $16.7m Day 1 PCSB CECL provision (in addition to credit mark on portfolio “double - count”). ▪ ALLL slightly increases to 1.31% on loans. ▪ $451 thousand net charge - offs in quarter. 37% 15.8 42.5 25% 11.7 46.6 58.3 Noninterest expense - 6.4 - 967% 5.8 0.6 6.4 Merger expense 4% 1.4 32.8 - 18% (7.6) 41.8 34.2 Pretax, Preprov. Net Rev. - 12850% 25.7 (0.2) 347% 19.8 5.7 25.5 Provision for credit losses - 74% (24.3) 33.0 - 76% (27.4) 36.1 8.7 Pretax income - 87% (7.2) 8.3 - 83% (5.3) 6.4 1.1 Provision for taxes - 69% $ (17.1) $ 24.7 - 74% $ (22.1) $ 29.7 $ 7.6 Net Income - 72% $ (0.23) $ 0.32 - 77% $ (0.30) $ 0.39 $ 0.09 EPS 11% 8,911 77,927 13% 9,773 77,065 86,838 Avg diluted shares (000s) Year over Year (YoY) Linked Quarter (LQ) %Δ 1Q22 Δ %Δ Δ 1Q23 4Q22 $m, except per share amts 23% $ 69.8 $ 16.2 8% $ 6.0 $ 86.0 $ 80.0 Net interest income 104% 5.5 5.7 29% 2.5 11.2 8.7 Noninterest income Return on Assets Return on Tangible Equity Net Interest Margin Efficiency Ratio 0.27% 2.61% 3.36% 65.44% 1.34% 14.48% 3.81% 53.01% - 1.07% - 11.87% - 0.45% 12.43% 1.16% 11.84% 3.49% 56.37% - 0.89% - 9.23% - 0.13% 9.07% Amounts as presented may differ slightly from the Company’s Earnings Release due to rounding to foot schedules presented. 4
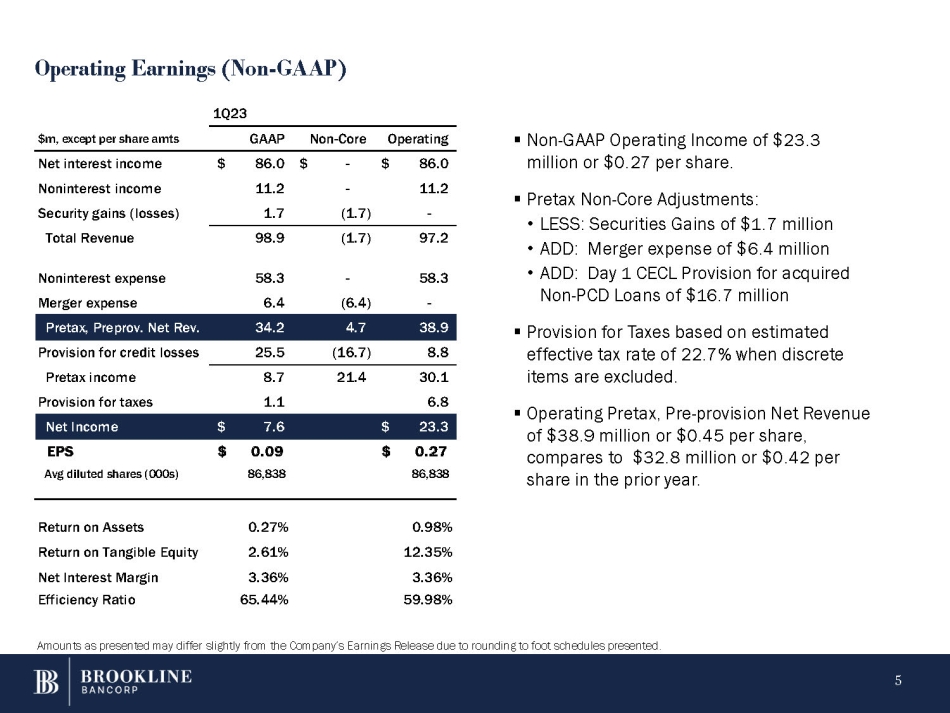
Operating Earnings (Non - GAAP) ▪ Non - GAAP Operating Income of $23.3 million or $0.27 per share. ▪ Pretax Non - Core Adjustments: • LESS: Securities Gains of $1.7 million • ADD: Merger expense of $6.4 million • ADD: Day 1 CECL Provision for acquired Non - PCD Loans of $16.7 million ▪ Provision for Taxes based on estimated effective tax rate of 22.7% when discrete items are excluded. ▪ Operating Pretax, Pre - provision Net Revenue of $38.9 million or $0.45 per share, compares to $32.8 million or $0.42 per share in the prior year. $ 86.0 $ - $ 86.0 Net interest income 11.2 - 11.2 Noninterest income - (1.7) 1.7 Security gains (losses) 97.2 (1.7) 98.9 Total Revenue 58.3 - 58.3 Noninterest expense - (6.4) 6.4 Merger expense 38.9 4.7 34.2 Pretax, Preprov. Net Rev. 8.8 (16.7) 25.5 Provision for credit losses 30.1 21.4 8.7 Pretax income 6.8 1.1 Provision for taxes $ 23.3 $ 7.6 Net Income $ 0.27 $ 0.09 EPS 86,838 86,838 Avg diluted shares (000s) 0.98% 0.27% Return on Assets 12.35% 2.61% Return on Tangible Equity 3.36% 3.36% Net Interest Margin 59.98% 65.44% Efficiency Ratio $m, except per share amts GAAP Non - Core Operating 1Q23 Amounts as presented may differ slightly from the Company’s Earnings Release due to rounding to foot schedules presented. 5

Margin – Yields and Costs LQ Δ Prior Quarter 1Q23 Yield Interest Avg Bal Yield Interest Avg Bal Yield Interest Avg Bal $ millions 0.13% $ 23.5 $ 1,586 5.20% $ 98.5 $ 7,565 5.33% $ 122.0 $ 9,151 Loans 0.89% 5.7 461 2.53% 5.0 793 3.42% 10.7 1,254 Investments & earning cash 0.14% $ 29.2 $ 2,047 4.96% $ 103.5 $ 8,358 5.10% $ 132.7 $ 10,405 Interest Earning Assets 0.75% $ 15.2 $ 1,425 1.17% $ 14.2 $ 4,793 1.92% $ 29.4 $ 6,218 Interest bearing deposits 0.84% 7.9 538 3.71% 9.2 969 4.55% 17.1 1,507 Borrowings 0.83% $ 23.1 $ 1,963 1.61% $ 23.4 $ 5,762 2.44% $ 46.5 $ 7,725 Interest Bearing Liabilities - 0.69% 3.35% 2.66% Net interest spread - 0.45% $ 6.1 3.81% $ 80.1 3.36% $ 86.2 Net interest income, TEB / Margin 0.1 0.1 0.2 LESS: Tax Equivalent Basis (TEB) Adj. 6.0 $ 80.0 $ 86.0 $ Net Interest Income 3/31/2023 12/31/2022 9/30/2022 6/30/2022 3/31/2022 8.00% 0.50% 3.50% 0.45% 0.29% 0.39% 2.34% 2.46% 2.34% 4.50% 7.50% 4.39% 4.30% 4.64% 4.43% 4.00% 3.88% 5.00% 4.86% 4.87% 5.15% 4.03% 3.58% 3.47% Fed Funds (upper) Prime 1M LIBOR SOFR Ameribor 2Y Treasury 5Y Treasury 10Y Treasury Amounts as presented may differ slightly from the Company’s Earnings Release due to rounding to foot schedules presented. 6
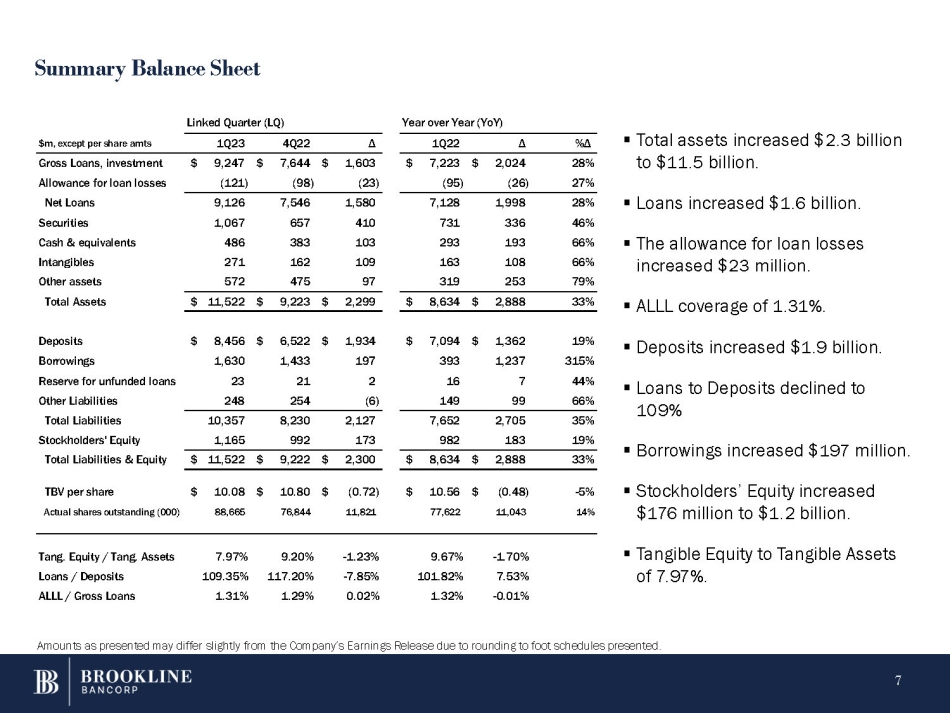
Summary Balance Sheet ▪ Total assets increased $2.3 billion %Δ Δ 1Q22 Δ 4Q22 1Q23 $m, except per share amts to $11.5 billion. 28% $ 2,024 $ 7,223 $ 1,603 $ 7,644 $ 9,247 Gross Loans, investment 27% (26) (95) (23) (98) (121) Allowance for loan losses ▪ Loans increased $1.6 billion. 28% 1,998 7,128 1,580 7,546 9,126 Net Loans 46% 336 731 410 657 1,067 Securities ▪ The allowance for loan losses 66% 193 293 103 383 486 Cash & equivalents increased $23 million. 66% 108 163 109 162 271 Intangibles ▪ ALLL coverage of 1.31%. ▪ Deposits increased $1.9 billion. ▪ Loans to Deposits declined to 109% ▪ Borrowings increased $197 million. ▪ Stockholders’ Equity increased $176 million to $1.2 billion. quity to Tangible Assets ▪ Tangible E - 1.70% 9.67% - 1.23% 9.20% 7.97% Tang. Equity / Tang. Assets of 7.97%. 7.53% 101.82% - 7.85% 117.20% 109.35% Loans / Deposits - 0.01% 1.32% 0.02% 1.29% 1.31% ALLL / Gross Loans 79% 253 319 97 475 572 Other assets 33% $ 2,888 $ 8,634 $ 2,299 $ 9,223 $ 11,522 Total Assets 19% $ 1,362 $ 7,094 $ 1,934 $ 6,522 $ 8,456 Deposits 315% 1,237 393 197 1,433 1,630 Borrowings 44% 7 16 2 21 23 Reserve for unfunded loans 66% 99 149 (6) 254 248 Other Liabilities 35% 2,705 7,652 2,127 8,230 10,357 Total Liabilities 19% 183 982 173 992 1,165 Stockholders' Equity 33% $ 2,888 $ 8,634 $ 2,300 $ 9,222 $ 11,522 Total Liabilities & Equity - 5% $ (0.48) $ 10.56 $ (0.72) $ 10.80 $ 10.08 TBV per share 14% 11,043 77,622 11,821 76,844 88,665 Actual shares outstanding (000) Linked Quarter (LQ) Year over Year (YoY) Amounts as presented may differ slightly from the Company’s Earnings Release due to rounding to foot schedules presented. 7
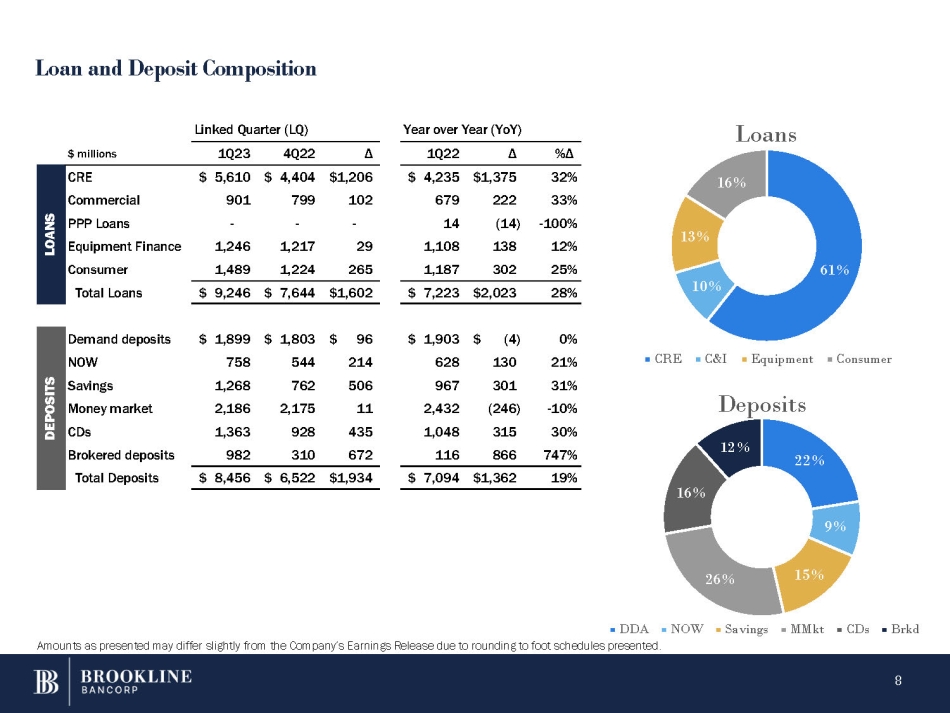
Loan and Deposit Composition 61% 10% 13% Loans 16% 22% 9% 15% 26% 16% 12% CRE C&I Equipment Consumer Deposits DDA NOW Savings MMkt CDs Brkd $ millions 1Q23 4Q22 Δ 1Q22 Δ %Δ $ 5,610 901 $ 4,404 799 $1,206 102 $ 4,235 679 14 1,108 1,187 $1,375 32% 222 33% (14) - 100% 138 12% 302 25% - - - 1,246 1,489 1,217 1,224 29 265 CRE Commercial PPP Loans Equipment Finance Consumer Total Loans $ 9,246 $ 7,644 $1,602 $ 7,223 $2,023 28% Demand deposits NOW Savings Money market CDs Brokered deposits Total Deposits $ 1,899 758 1,268 2,186 1,363 982 $ 1,803 $ 96 544 214 762 506 2,175 11 928 435 310 672 $ 1,903 628 967 2,432 1,048 116 $ (4) 0% 130 21% 301 31% (246) - 10% 315 30% 866 747% $ 8,456 $ 6,522 $1,934 $ 7,094 $1,362 19% Linked Quarter (LQ) Year over Year (YoY) LOANS DEPOSITS Amounts as presented may differ slightly from the Company’s Earnings Release due to rounding to foot schedules presented. 8
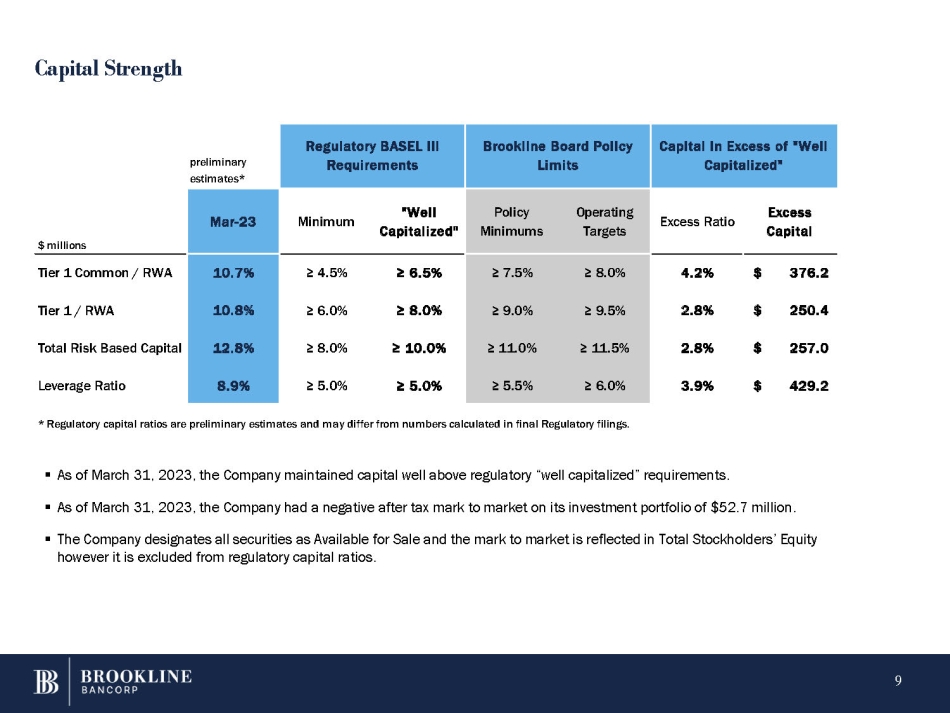
Capital Strength 9 ▪ As of March 31, 2023, the Company maintained capital well above regulatory “well capitalized” requirements. ▪ As of March 31, 2023, the Company had a negative after tax mark to market on its investment portfolio of $52.7 million. ▪ The Company designates all securities as Available for Sale and the mark to market is reflected in Total Stockholders’ Equity however it is excluded from regulatory capital ratios. Capital in Excess of "Well Capitalized" Brookline Board Policy Limits Regulatory BASEL III Requirements preliminary estimates* Excess Capital Excess Ratio Operating Targets Policy Minimums "Well Capitalized" Minimum Mar - 23 $ millions $ 376.2 4.2% ≥ 8.0% ≥ 7.5% ≥ 6.5% ≥ 4.5% 10.7% Tier 1 Common / RWA $ 250.4 2.8% ≥ 9.5% ≥ 9.0% ≥ 8.0% ≥ 6.0% 10.8% Tier 1 / RWA $ 257.0 2.8% ≥ 11.5% ≥ 11.0% ≥ 10.0% ≥ 8.0% 12.8% Total Risk Based Capital $ 429.2 3.9% ≥ 6.0% ≥ 5.5% ≥ 5.0% ≥ 5.0% 8.9% Leverage Ratio * Regulatory capital ratios are preliminary estimates and may differ from numbers calculated in final Regulatory filings.
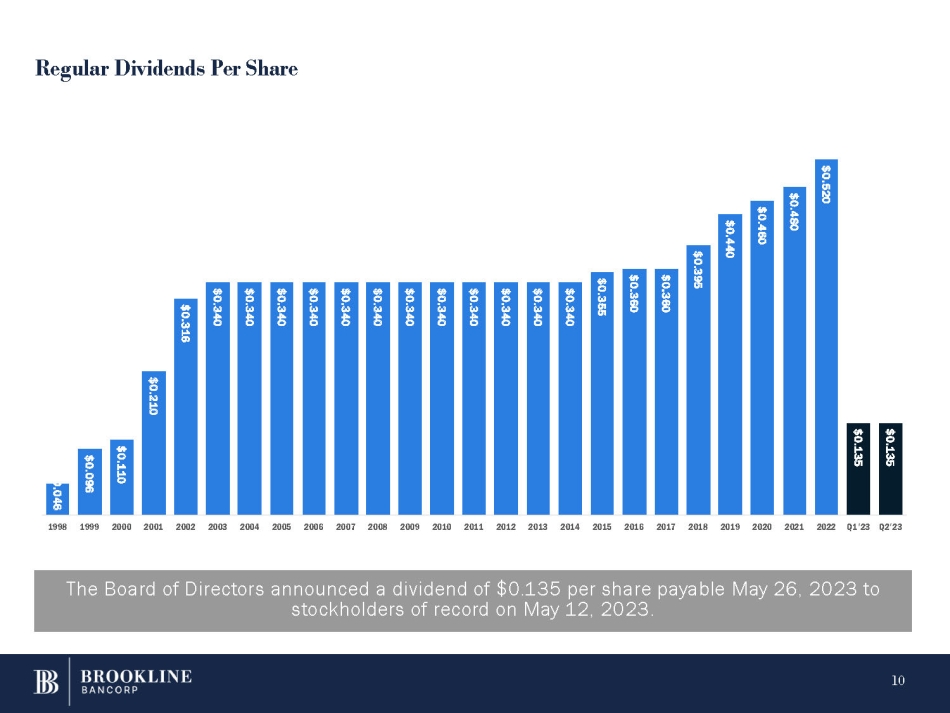
Regular Dividends Per Share The Board of Directors announced a dividend of $0.135 per share payable May 26, 2023 to stockholders of record on May 12, 2023. 0.046 10 $0.096 $0.110 $0.210 $0.316 $0.340 $0.340 $0.340 $0.340 $0.340 $0.340 $0.340 $0.340 $0.340 $0.340 $0.340 $0.340 $0.355 $0.360 $0.360 $0.395 $0.440 $0.460 $0.480 $0.520 $0.135 $0.135 1998 1999 2000 2001 2002 2003 2004 2005 2006 2007 2008 2009 2010 2011 2012 2013 2014 2015 2016 2017 2018 2019 2020 2021 2022 Q1'23 Q2'23
QUESTIONS Paul A. Perrault, Chairman and Chief Executive Officer Carl M. Carlson, Co - President and Chief Financial Officer Thank You. 11
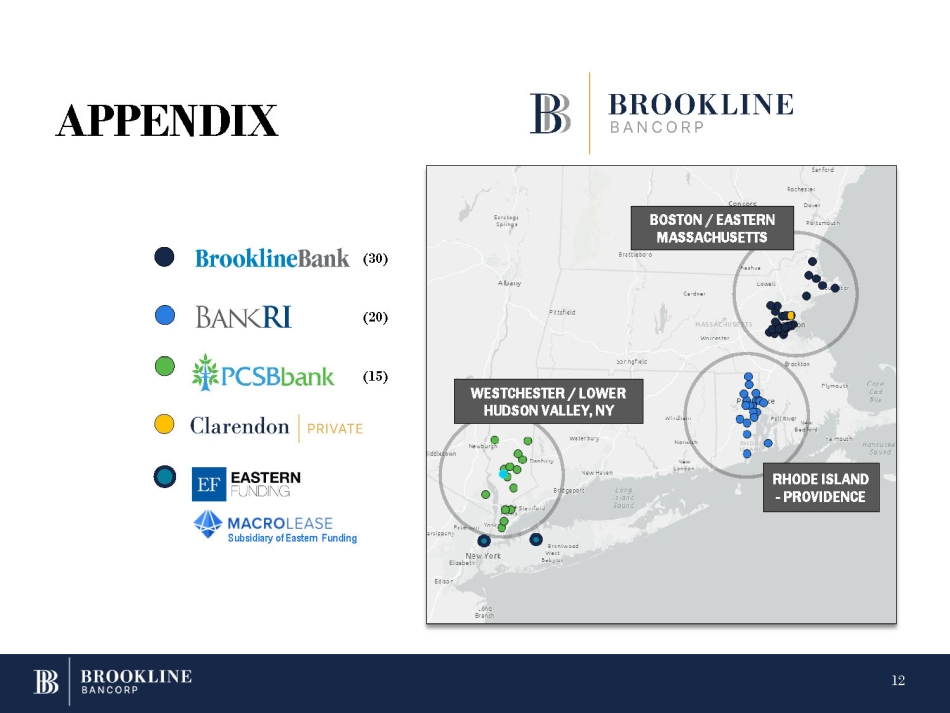
APPENDIX RHODE ISLAND - PROVIDENCE WESTCHESTER / LOWER HUDSON VALLEY, NY BOSTON / EASTERN MASSACHUSETTS (30) (20) (15) Subsidiary of Eastern Funding 12
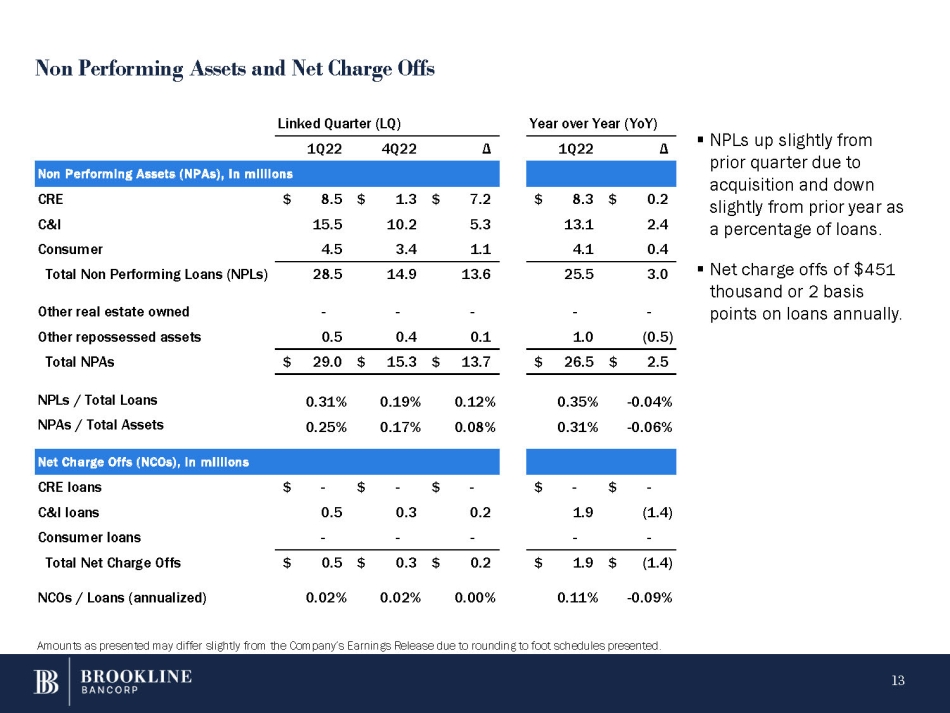
Non Performing Assets and Net Charge Offs Non Performing Assets (NPAs), in millions $ 0.2 $ 8.3 $ 7.2 $ 1.3 $ 8.5 CRE 2.4 13.1 5.3 10.2 15.5 C&I 0.4 4.1 1.1 3.4 4.5 Consumer 3.0 - 25.5 - 13.6 - 14.9 - Total Non Performing Loans (NPLs) 28.5 Other real estate owned - (0.5) 1.0 0.1 0.4 Other repossessed assets 0.5 $ 2.5 $ 26.5 $ 13.7 $ 15.3 Total NPAs $ 29.0 - 0.04% 0.35% 0.12% 0.19% NPLs / Total Loans 0.31% - 0.06% 0.31% 0.08% 0.17% NPAs / Total Assets 0.25% Net Charge Offs (NCOs), in millions $ - $ - $ - $ - $ - CRE loans (1.4) 1.9 0.2 0.3 0.5 C&I loans - - - - - Consumer loans $ (1.4) $ 1.9 $ 0.2 $ 0.3 $ 0.5 Total Net Charge Offs - 0.09% 0.11% 0.00% 0.02% 0.02% NCOs / Loans (annualized) Linked Quarter (LQ) 1Q22 4Q22 Year over Year (YoY) Δ 1Q22 Δ Amounts as presented may differ slightly from the Company’s Earnings Release due to rounding to foot schedules presented. 13 ▪ NPLs up slightly from prior quarter due to acquisition and down slightly from prior year as a percentage of loans. ▪ Net charge offs of $451 thousand or 2 basis points on loans annually.
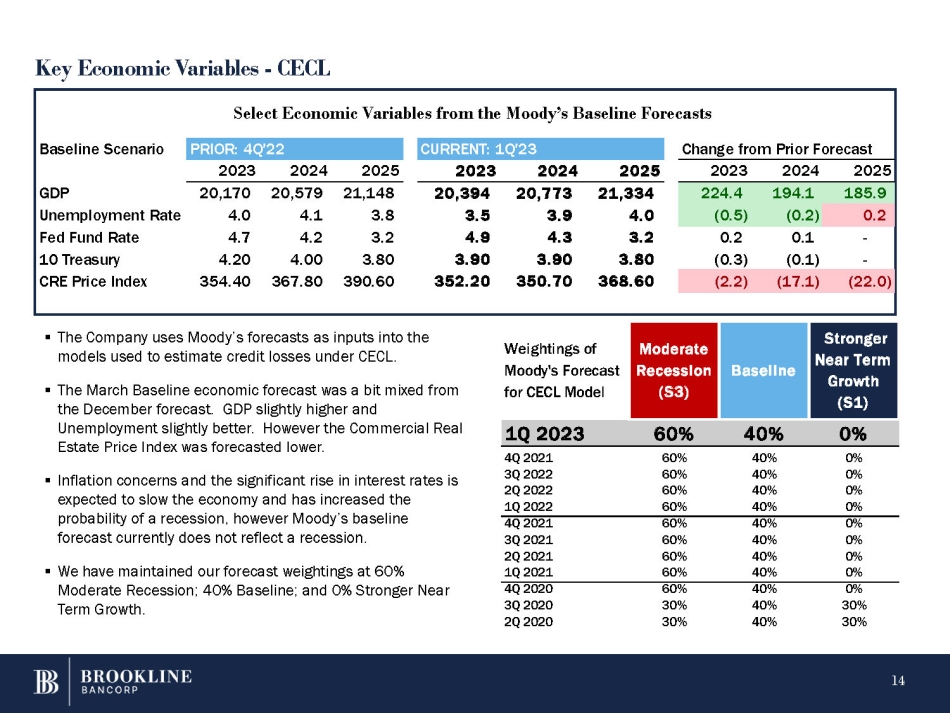
Key Economic Variables - CECL ▪ The Company uses Moody’s forecasts as inputs into the models used to estimate credit losses under CECL. ▪ The March Baseline economic forecast was a bit mixed from the December forecast. GDP slightly higher and Unemployment slightly better. However the Commercial Real Estate Price Index was forecasted lower. ▪ Inflation concerns and the significant rise in interest rates is expected to slow the economy and has increased the probability of a recession, however Moody’s baseline forecast currently does not reflect a recession. ▪ We have maintained our forecast weightings at 60% Moderate Recession; 40% Baseline; and 0% Stronger Near Term Growth. Select Economic Variables from the Moody’s Baseline Forecasts Baseline Scenario PRIOR: 4Q'22 CURRENT: 1Q'23 Change from Prior Forecast 2025 2024 2023 2025 2024 2023 2025 2024 2023 185.9 194.1 224.4 21,334 20,773 20,394 21,148 20,579 20,170 GDP 0.2 (0.2) (0.5) 4.0 3.9 3.5 3.8 4.1 4.0 Unemployment Rate - 0.1 0.2 3.2 4.3 4.9 3.2 4.2 4.7 Fed Fund Rate - (0.1) (0.3) 3.80 3.90 3.90 3.80 4.00 4.20 10 Treasury (22.0) (17.1) (2.2) 368.60 350.70 352.20 390.60 367.80 354.40 CRE Price Index Stronger Near Term Growth (S1) Baseline Moderate Recession (S3) Weightings of Moody's Forecast for CECL Model 0% 40% 60% 2023 1Q 14 0% 40% 60% 4Q 2021 0% 40% 60% 3Q 2022 0% 40% 60% 2Q 2022 0% 40% 60% 1Q 2022 0% 40% 60% 4Q 2021 0% 40% 60% 3Q 2021 0% 40% 60% 2Q 2021 0% 40% 60% 1Q 2021 0% 40% 60% 4Q 2020 30% 40% 30% 3Q 2020 30% 40% 30% 2Q 2020
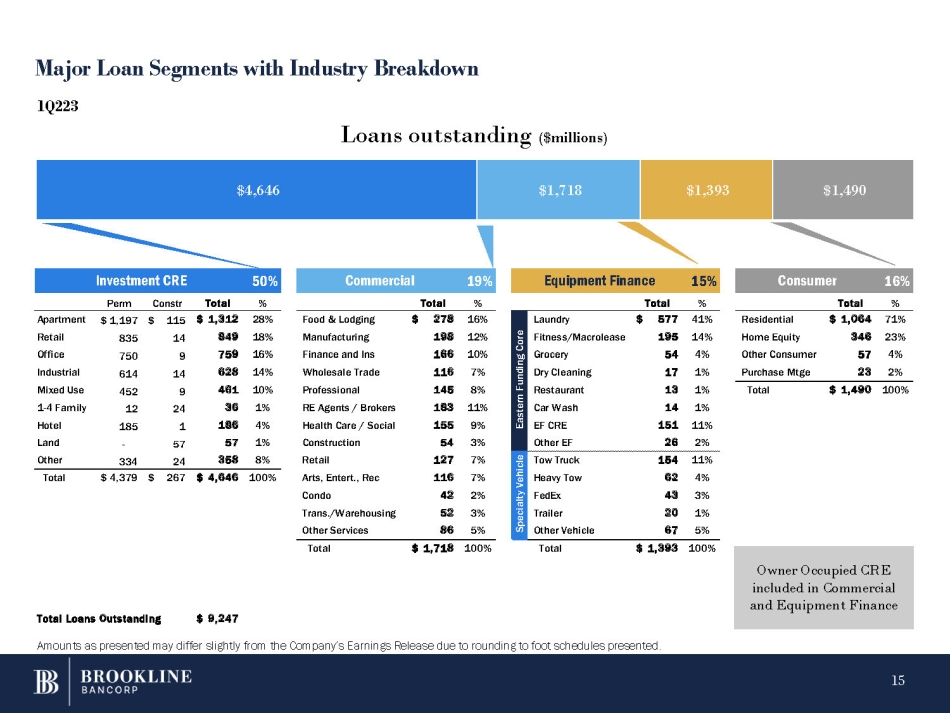
Investment CRE 50% Commercial 19% Equipment Finance 15% Consumer 16% Perm Constr Total % Total % Total % Total % Food & Lodging Manufacturing Finance and Ins Wholesale Trade Professional RE Agents / Brokers Health Care / Social Construction Retail Arts, Entert., Rec Condo Trans./Warehousing Other Services $ 278 16% 198 12% 166 10% 116 7% 145 8% 183 11% 155 9% 54 3% 127 7% 116 7% 42 2% 52 3% 86 5% Residential Home Equity Other Consumer Purchase Mtge $ 1,064 71% 346 23% 57 4% 23 2% Total $ 1,490 100% - Apartment Retail Office Industrial Mixed Use 1 - 4 Family Hotel Land Other 334 $ 1,197 $ 115 835 14 750 9 614 14 452 9 12 24 185 1 57 24 $ 1,312 28% 849 18% 759 16% 628 14% 461 10% 36 1% 186 4% 57 1% 358 8% Total $ 4,379 $ 267 $ 4,646 100% Total $ 1,718 100% Total $ 1,393 100% 41% $ 577 Laundry Eastern Funding Core 14% 195 Fitness/Macrolease 4% 54 Grocery 1% 17 Dry Cleaning 1% 13 Restaurant 1% 14 Car Wash 11% 151 EF CRE 2% 26 Other EF 11% 154 Tow Truck Specialty Vehicle 4% 62 Heavy Tow 3% 43 FedEx 1% 20 Trailer 5% 67 Other Vehicle Total Loans Outstanding $ 9,247 Amounts as presented may differ slightly from the Company’s Earnings Release due to rounding to foot schedules presented. Major Loan Segments with Industry Breakdown $4,646 $1,718 $1,393 $1,490 1Q223 Loans outstanding ($millions) Owner Occupied CRE included in Commercial and Equipment Finance 15
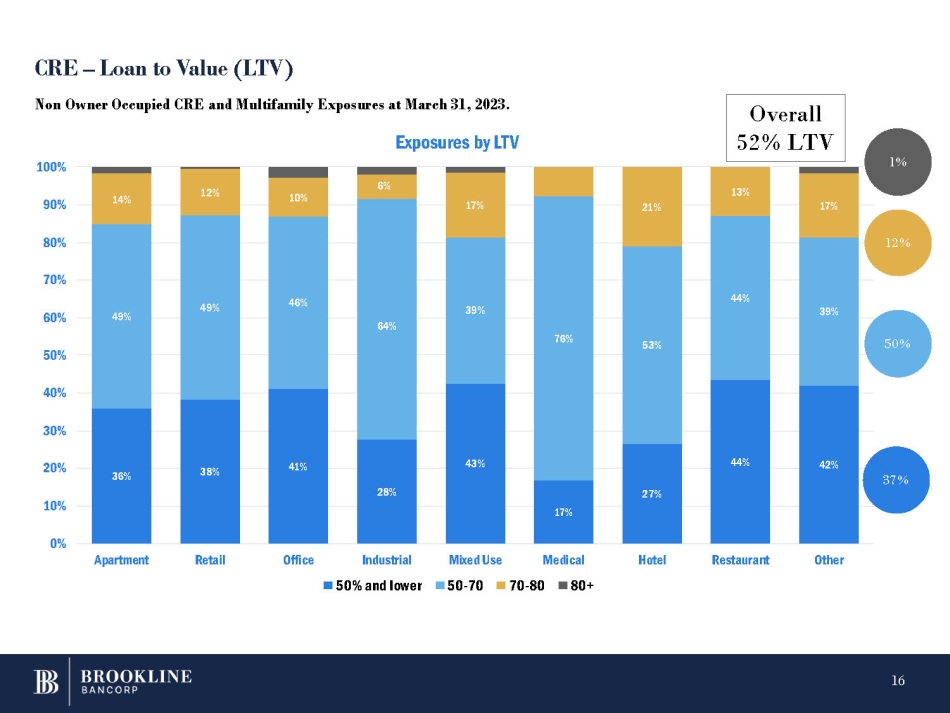
CRE – Loan to Value (LTV) 36% 38% 41% 28% 43% 17% 27% 44% 42% 49% 49% 46% 64% 39% 76% 53% 44% 39% 14% 12% 10% 6% 17% 21% 13% 17% 0% 10% 20% 30% 40% 50% 60% 70% 80% 90% 100% Apartment Retail Office Medical Hotel Restaurant Other Exposures by LTV Industrial 50% and lower Mixed Use 50 - 70 70 - 80 80+ Non Owner Occupied CRE and Multifamily Exposures at March 31, 2023. 37% 50% 1% 12% 16 Overall 52% LTV
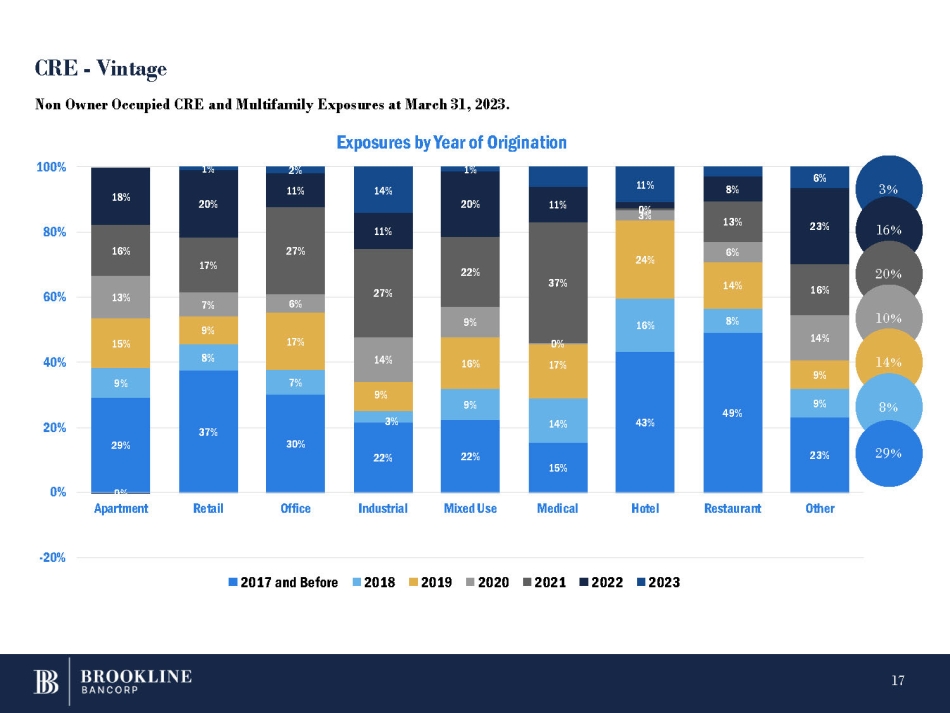
29% 37% 30% 22% 22% 15% 43% 49% 23% 9% 8% 7% 9% 14% 16% 8% 9% 15% 9% 17% 9% 3% 16% 17% 24% 14% 9% 13% 7% 6% 14% 9% 0% 6% 14% 16% 17% 27% 27% 22% 37% 0 3 % 13% 16% 18% 11% 11% 20% 11% 8% 23% 0% 1% 20% 2% 14% 1% 11% 6% - 20% 0% 20% 40% 60% 80% 100% Apartment Retail Office Industrial Mixed Use Medical Hotel Restaurant Other Non Owner Occupied CRE and Multifamily Exposures at March 31, 2023. Exposures by Year of Origination 2017 and Before 2018 2019 2020 2021 2022 2023 3 % CRE - Vintage 16 % 20 % 10 % 14 % 8 % 29 % 17
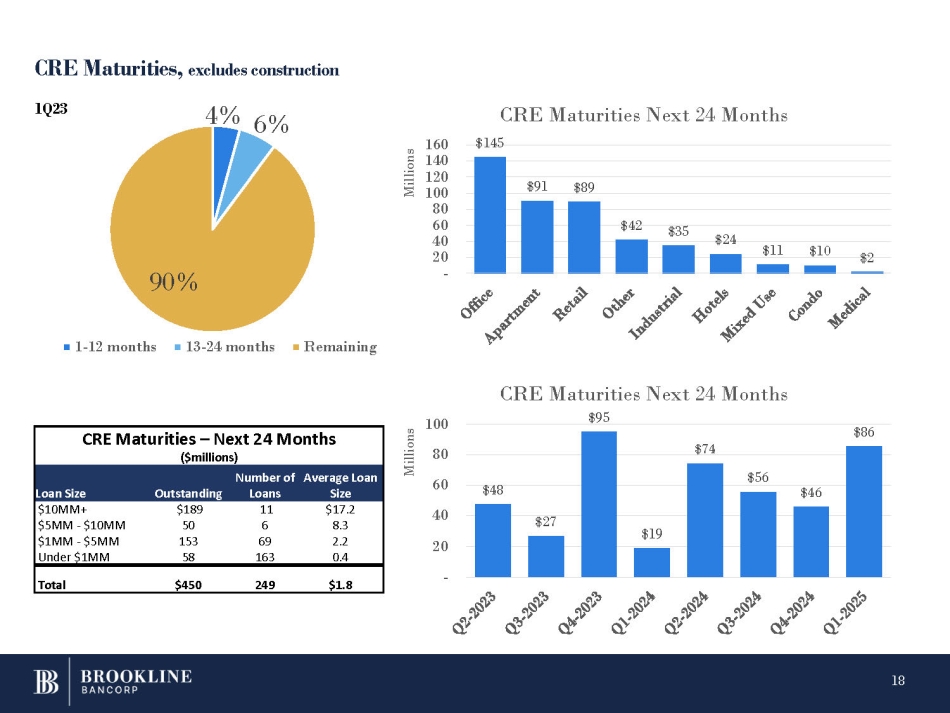
CRE Maturities, excludes construction 4% 6% 90% 1 - 12 months 13 - 24 months Remaining CRE Maturities Next 24 Months $145 $91 $89 $42 $35 $24 $11 $10 $2 - 160 140 120 100 80 60 40 20 Millions $48 $27 $19 $74 $56 $46 $86 CRE Maturities Next 24 Months $95 - 100 80 60 40 20 Millions 18 CRE Maturities – Next 24 Months ($millions) Average Loan Size Number of Loans Outstanding Loan Size $17.2 11 $189 $10MM+ 8.3 6 50 $5MM - $10MM 2.2 69 153 $1MM - $5MM 0.4 163 58 Under $1MM $1.8 249 $450 Total 1Q23
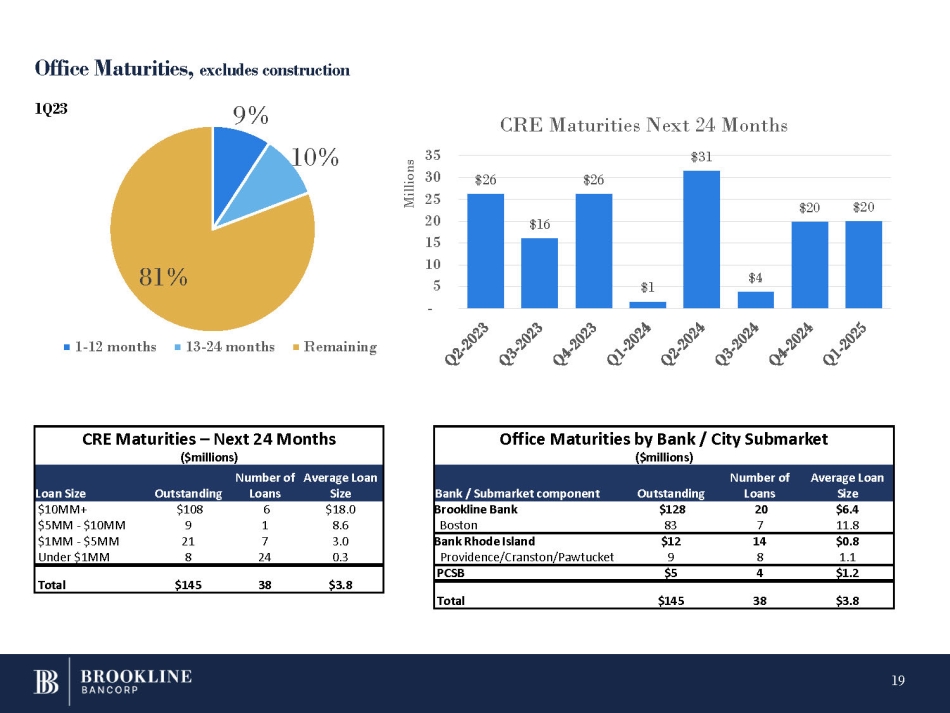
Office Maturities, excludes construction 9% 10% 81% 1 - 12 months 13 - 24 months Remaining $16 $26 $26 $1 CRE Maturities Next 24 Months $31 $4 $20 $20 - 35 30 25 20 15 10 5 Millions 19 CRE Maturities – Next 24 Months ($millions) Average Loan Size Number of Loans Outstanding Loan Size $18.0 6 $108 $10MM+ 8.6 1 9 $5MM - $10MM 3.0 7 21 $1MM - $5MM 0.3 24 8 Under $1MM $3.8 38 $145 Total Office Maturities by Bank / City Submarket ($millions) Average Loan Size Number of Loans Outstanding Bank / Submarket component $6.4 20 $128 Brookline Bank 11.8 7 83 Boston $0.8 14 $12 Bank Rhode Island 1.1 8 9 Providence/Cranston/Pawtucket $1.2 4 $5 PCSB $3.8 38 $145 Total 1Q23
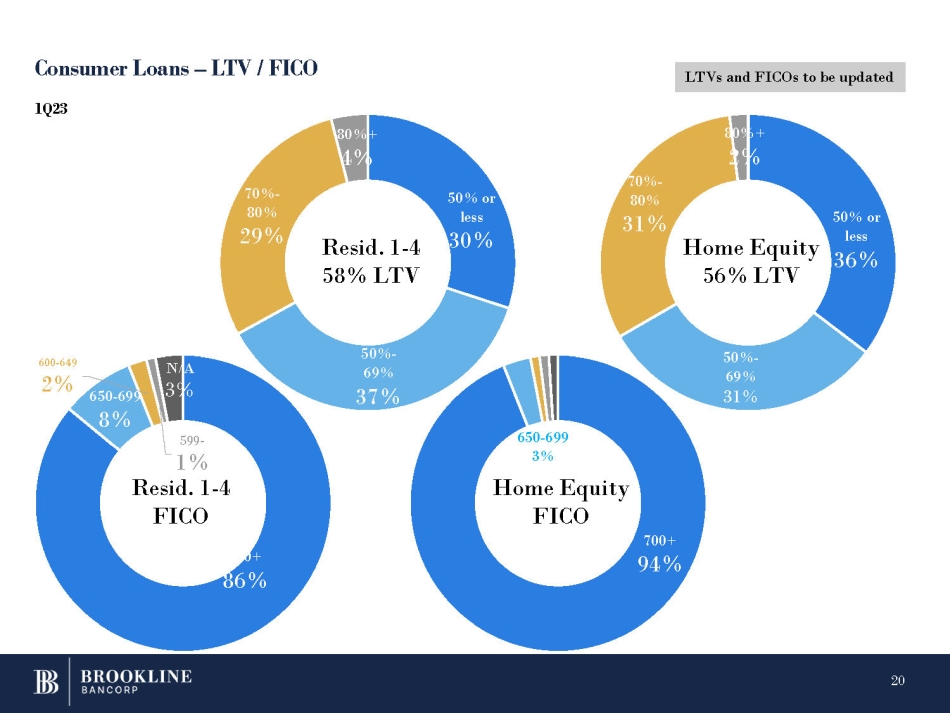
Consumer Loans – LTV / FICO 20 650 - 699 8% 600 - 649 2% 599 - N/A 3% 50% or less 30% 50% - 69% 37% 70% - 80% 29% 80%+ 4% 700+ 94% 50% or less 36% 50% - 69% 31% 70% - 80% 80%+ 2% Resid. 1 - 4 58% LTV 1% Resid. 1 - 4 FICO 700+ 86% 650 - 699 3% Home Equity FICO 31% Home Equity 56% LTV 1Q23 LTVs and FICOs to be updated

Well Diversified Deposit Base – 66% of Deposits are Insured* Consumer Deposits 53% (77% insured) Commercial Deposits 42% (49% insured) Municipal Deposits 5% * Insured includes deposits which are collateralized. Excludes brokered deposits which are 100% FDIC insured and have laddered maturities. 34% of Non Brokered Deposits Uninsured 30% of Total Deposits are Uninsured 21
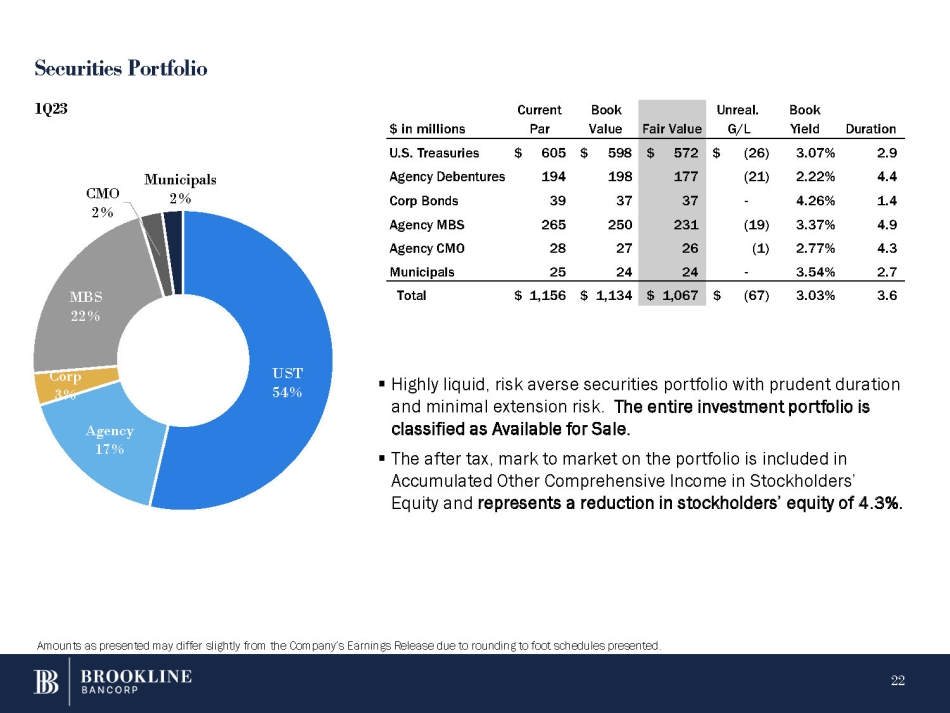
Securities Portfolio ▪ Highly liquid, risk averse securities portfolio with prudent duration and minimal extension risk. The entire investment portfolio is classified as Available for Sale. ▪ The after tax, mark to market on the portfolio is included in Accumulated Other Comprehensive Income in Stockholders’ Equity and represents a reduction in stockholders’ equity of 4.3%. UST 54% 22 Agency 17% Corp 3% MBS 22% CMO 2% Municipals 2% 1Q23 Duration Book Yield Unreal. G/L Fair Value Book Value Current Par $ in millions 2.9 3.07% $ (26) $ 572 $ 598 $ 605 U.S. Treasuries 4.4 2.22% (21) 177 198 194 Agency Debentures 1.4 4.26% - 37 37 39 Corp Bonds 4.9 3.37% (19) 231 250 265 Agency MBS 4.3 2.77% (1) 26 27 28 Agency CMO 2.7 3.54% - 24 24 25 Municipals 3.6 3.03% $ (67) $ 1,067 $ 1,134 $ 1,156 Total Amounts as presented may differ slightly from the Company’s Earnings Release due to rounding to foot schedules presented.
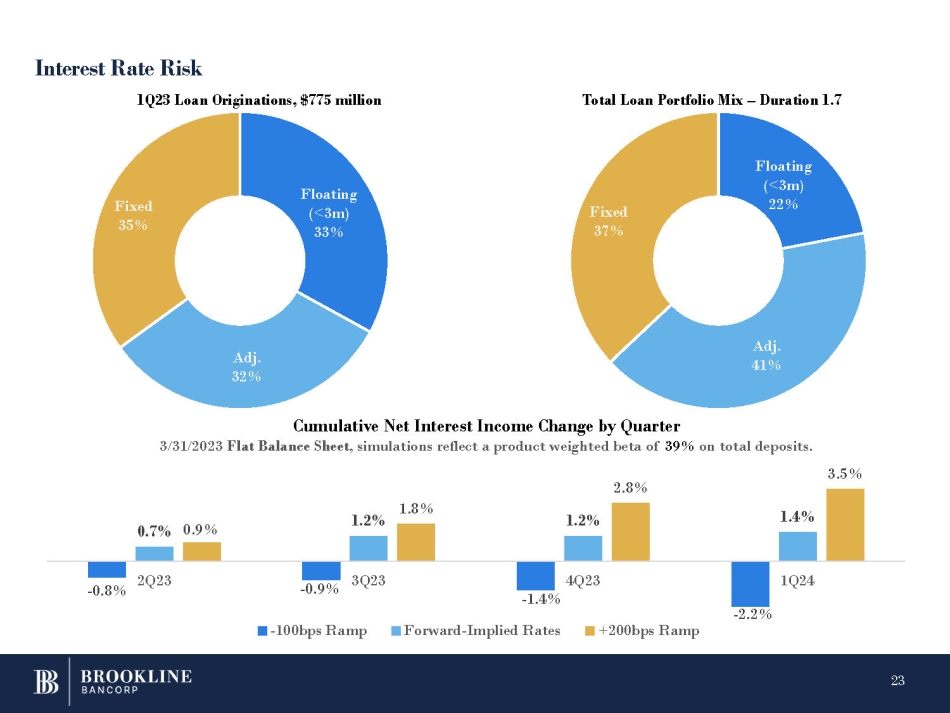
Interest Rate Risk Floating (<3m) 33% Adj. 32% Fixed 35% 1Q23 Loan Originations, $775 million Total Loan Portfolio Mix – Duration 1.7 - 0.9% - 2.2% 0.7% 1.2% 1.2% 1.4% 0.9% 1.8% - 0.8% 2Q23 3Q23 4Q23 - 1.4% 1Q24 Cumulative Net Interest Income Change by Quarter 3/31/2023 Flat Balance Sheet , simulations reflect a product weighted beta of 39% on total deposits. 3.5% 2.8% - 100bps Ramp Forward - Implied Rates +200bps Ramp Floating (<3m) 22% 23 Adj. 41% Fixed 37%
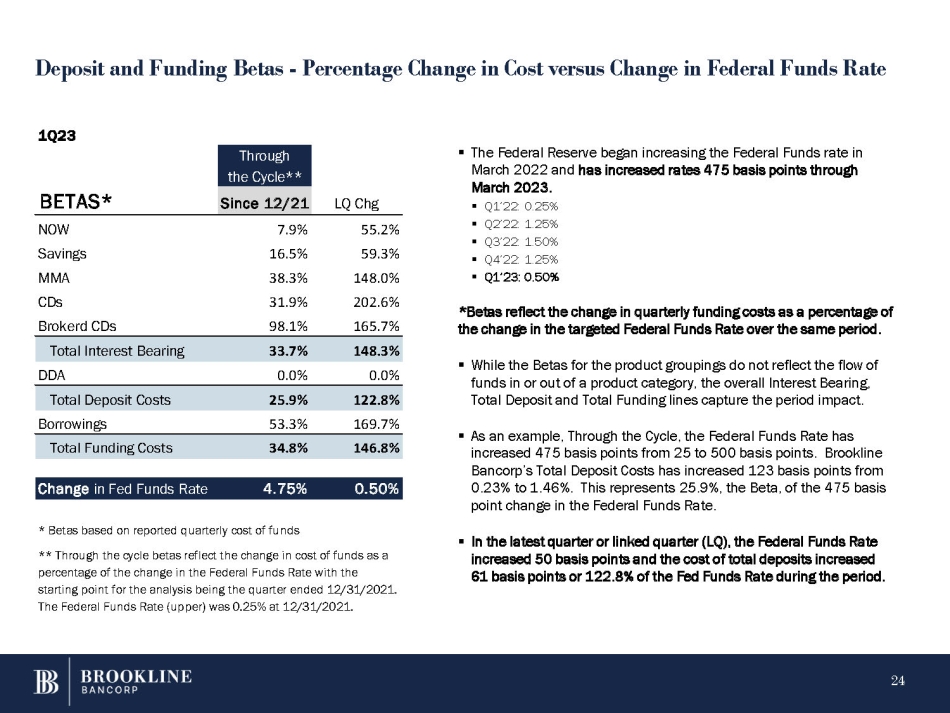
Deposit and Funding Betas - Percentage Change in Cost versus Change in Federal Funds Rate 24 ▪ The Federal Reserve began increasing the Federal Funds rate in March 2022 and has increased rates 475 basis points through March 2023. ▪ Q1’22: 0.25% ▪ Q2’22: 1.25% ▪ Q3’22: 1.50% ▪ Q4’22: 1.25% ▪ Q1’23: 0.50% *Betas reflect the change in quarterly funding costs as a percentage of the change in the targeted Federal Funds Rate over the same period. ▪ While the Betas for the product groupings do not reflect the flow of funds in or out of a product category, the overall Interest Bearing, Total Deposit and Total Funding lines capture the period impact. ▪ As an example, Through the Cycle, the Federal Funds Rate has increased 475 basis points from 25 to 500 basis points. Brookline Bancorp’s Total Deposit Costs has increased 123 basis points from 0.23% to 1.46%. This represents 25.9%, the Beta, of the 475 basis point change in the Federal Funds Rate. ▪ In the latest quarter or linked quarter (LQ), the Federal Funds Rate increased 50 basis points and the cost of total deposits increased 61 basis points or 122.8% of the Fed Funds Rate during the period. Through the Cycle** LQ Chg Since 12/21 BETAS* 55.2% 7.9% NOW 59.3% 16.5% Savings 148.0% 38.3% MMA 202.6% 31.9% CDs 165.7% 98.1% Brokerd CDs 148.3% 33.7% Total Interest Bearing 0.0% 0.0% DDA Total Deposit Costs 25.9% 122.8% 169.7% 53.3% Borrowings 146.8% 34.8% Total Funding Costs 0.50% 4.75% Change in Fed Funds Rate 1Q23 * Betas based on reported quarterly cost of funds ** Through the cycle betas reflect the change in cost of funds as a percentage of the change in the Federal Funds Rate with the starting point for the analysis being the quarter ended 12/31/2021. The Federal Funds Rate (upper) was 0.25% at 12/31/2021.
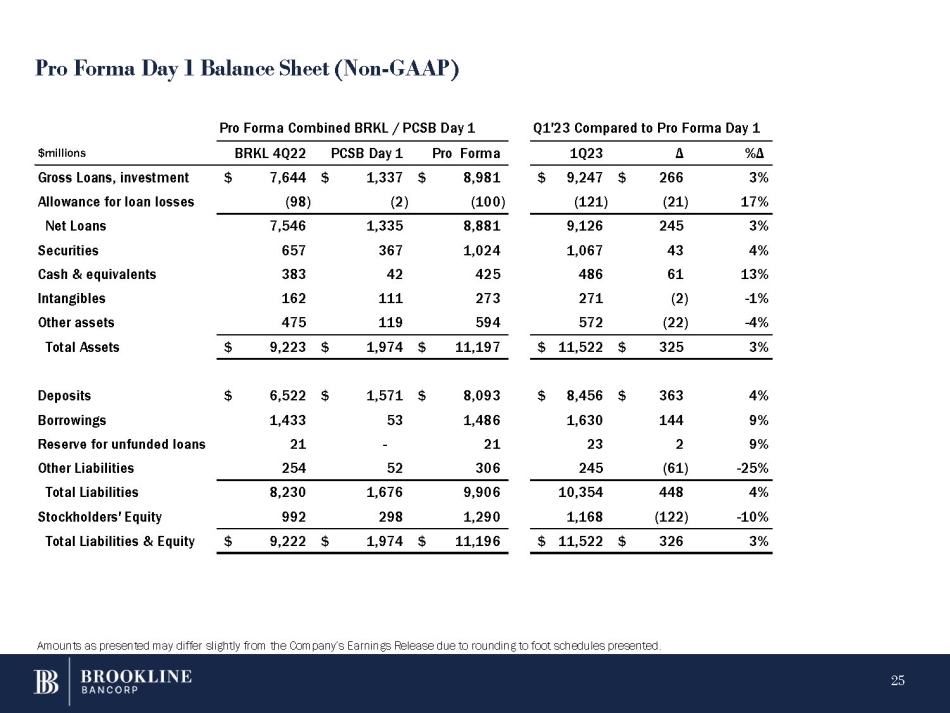
Pro Forma Day 1 Balance Sheet (Non - GAAP) %Δ Δ 1Q23 Forma Pro PCSB Day 1 BRKL 4Q22 $millions 3% $ 266 $ 9,247 8,981 $ $ 1,337 $ 7,644 Gross Loans, investment 17% (21) (121) (100) (2) (98) Allowance for loan losses 3% 245 9,126 8,881 1,335 7,546 Net Loans 4% 43 1,067 1,024 367 657 Securities 13% 61 486 425 42 383 Cash & equivalents - 1% (2) 271 273 111 162 Intangibles - 4% (22) 572 594 119 475 Other assets 3% 325 $ 11,522 $ 11,197 $ 1,974 $ 9,223 $ Total Assets 4% $ 363 $ 8,456 $ 8,093 $ 1,571 $ 6,522 Deposits 9% 144 1,630 1,486 53 1,433 Borrowings 9% 2 23 21 - 21 Reserve for unfunded loans - 25% (61) 245 306 52 254 Other Liabilities 4% 448 10,354 9,906 1,676 8,230 Total Liabilities - 10% (122) 1,168 1,290 298 992 Stockholders' Equity 3% $ 326 $ 11,522 $ 11,196 $ 1,974 $ 9,222 Total Liabilities & Equity Pro Forma Combined BRKL / PCSB Day 1 Q1'23 Compared to Pro Forma Day 1 Amounts as presented may differ slightly from the Company’s Earnings Release due to rounding to foot schedules presented. 25