EXHIBIT 99.2
January 25, 2024 1 4Q 2023 Financial Results
Forward Looking Statements 2 Certain statements contained in this press release that are not historical facts may constitute forward - looking statements within the meaning of Section 27A of the Securities Act of 1933, as amended, and Section 21E of the Securities Exchange Act of 1934, as amended, and are intended to be covered by the safe harbor provisions of the Private Securities Litigation Reform Act of 1995. We may also make forward - looking statements in other documents we file with the Securities and Exchange Commission ("SEC"), in our annual reports to shareholders, in press releases and other written materials, and in oral statements made by our officers, directors or employees. You can identify forward looking statements by the use of the words “believe,” “expect,” “anticipate,” “intend,” “estimate,” “assume,” “outlook,” “will,” “should,” and other expressions that predict or indicate future events and trends and which do not relate to historical matters, including statements regarding the Company’s business, credit quality, financial condition, liquidity and results of operations. Forward - looking statements may differ, possibly materially, from what is included in this press release due to factors and future developments that are uncertain and beyond the scope of the Company’s control. These include, but are not limited to, changes in interest rates; general economic conditions (including inflation and concerns about liquidity) on a national basis or in the local markets in which the Company operates; turbulence in the capital and debt markets; competitive pressures from other financial institutions; changes in consumer behavior due to changing political, business and economic conditions, or legislative or regulatory initiatives; changes in the value of securities and other assets in the Company’s investment portfolio; increases in loan and lease default and charge - off rates; the adequacy of allowances for loan and lease losses; decreases in deposit levels that necessitate increases in borrowing to fund loans and investments; operational risks including, but not limited to, cybersecurity incidents, fraud, natural disasters, and future pandemics; changes in regulation; the possibility that future credit losses may be higher than currently expected due to changes in economic assumptions and adverse economic developments; the risk that goodwill and intangibles recorded in the Company’s financial statements will become impaired; and changes in assumptions used in making such forward - looking statements. Forward - looking statements involve risks and uncertainties which are difficult to predict. The Company’s actual results could differ materially from those projected in the forward - looking statements as a result of, among others, the risks outlined in the Company’s Annual Report on Form 10 - K, as updated by its Quarterly Reports on Form 10 - Q and other filings submitted to the SEC. The Company does not undertake any obligation to update any forward - looking statement to reflect circumstances or events that occur after the date the forward - looking statements are made.
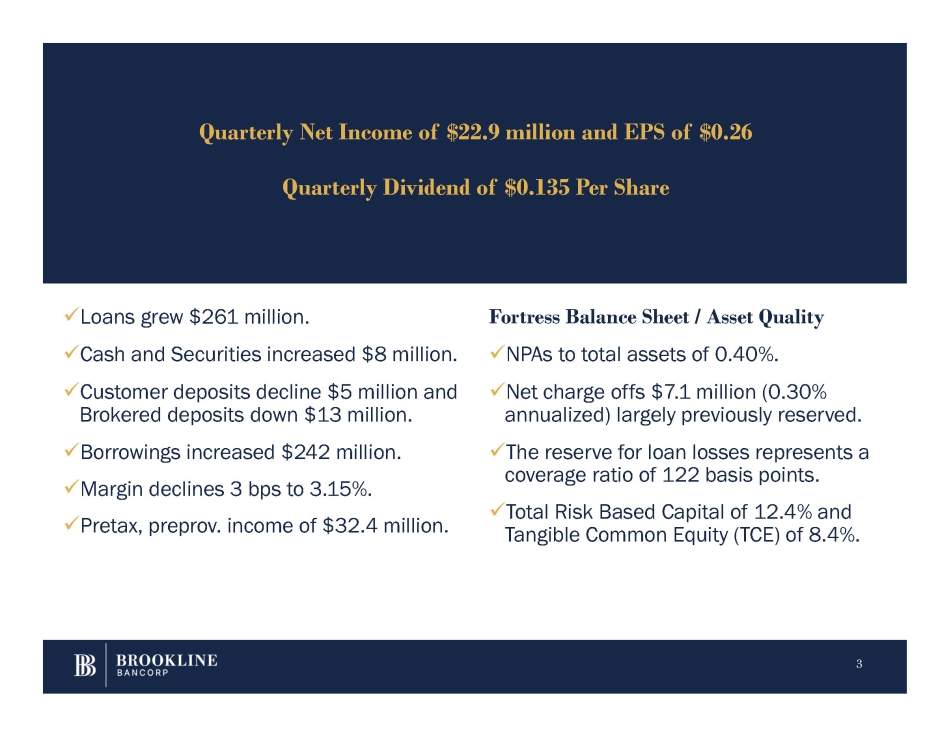
x Loans grew $261 million. x Cash and Securities increased $8 million. x Customer deposits decline $5 million and Brokered deposits down $13 million. x Borrowings increased $242 million. x Margin declines 3 bps to 3.15%. x Pretax, preprov. income of $32.4 million. 3 Fortress Balance Sheet / Asset Quality x NPAs to total assets of 0.40%. x Net charge offs $7.1 million (0.30% annualized) largely previously reserved. x The reserve for loan losses represents a coverage ratio of 122 basis points. x Total Risk Based Capital of 12.4% and Tangible Common Equity (TCE) of 8.4%. Quarterly Net Income of $22.9 million and EPS of $0.26 Quarterly Dividend of $0.135 Per Share
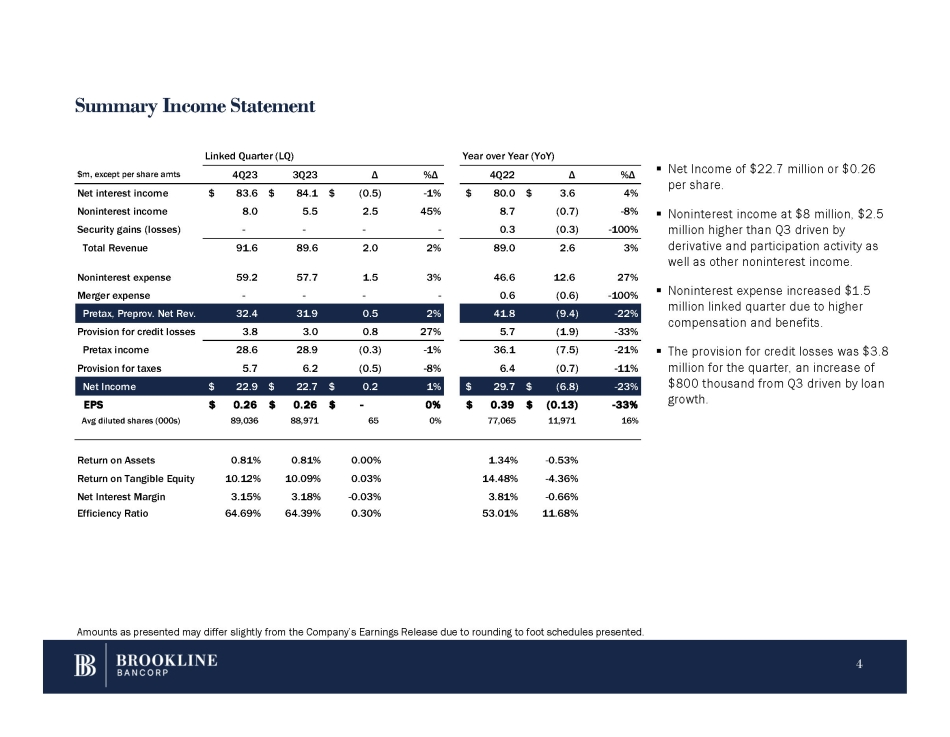
Summary Income Statement Amounts as presented may differ slightly from the Company’s Earnings Release due to rounding to foot schedules presented. 4 ▪ Net Income of $22.7 million or $0.26 per share. ▪ Noninterest income at $8 million, $2.5 million higher than Q3 driven by derivative and participation activity as well as other noninterest income. ▪ Noninterest expense increased $1.5 million linked quarter due to higher compensation and benefits. $800 thousand from Q3 driven by loan growth. ▪ The provision for credit losses was $3.8 - 21% (7.5) 36.1 - 1% (0.3) 28.9 28.6 Pretax income million for the quarter, an increase of - 11% (0.7) 6.4 - 8% (0.5) 6.2 5.7 Provision for taxes - 23% $ (6.8) $ 29.7 1% $ 0.2 $ 22.7 $ 22.9 Net Income - 33% $ (0.13) $ 0.39 0% $ - $ 0.26 $ 0.26 EPS 16% 11,971 77,065 0% 65 88,971 89,036 Avg diluted shares (000s) - 0.53% 1.34% 0.00% 0.81% 0.81% Return on Assets - 4.36% 14.48% 0.03% 10.09% 10.12% Return on Tangible Equity - 0.66% 3.81% - 0.03% 3.18% 3.15% Net Interest Margin 11.68% 53.01% 0.30% 64.39% 64.69% Efficiency Ratio Year over Year (YoY) Linked Quarter (LQ) %Δ 4Q22 Δ %Δ Δ 4Q23 3Q23 $m, except per share amts 4% $ 80.0 $ 3.6 - 1% $ (0.5) $ 83.6 $ 84.1 Net interest income - 8% 8.7 (0.7) 45% 2.5 8.0 5.5 Noninterest income - 100% (0.3) 0.3 - - - - Security gains (losses) 3% 2.6 89.0 2% 2.0 89.6 91.6 Total Revenue 27% 12.6 46.6 3% 1.5 57.7 59.2 Noninterest expense - 100% (0.6) 0.6 - - - - Merger expense - 22% (9.4) 41.8 2% 0.5 31.9 32.4 Pretax, Preprov. Net Rev. - 33% (1.9) 5.7 27% 0.8 3.0 3.8 Provision for credit losses
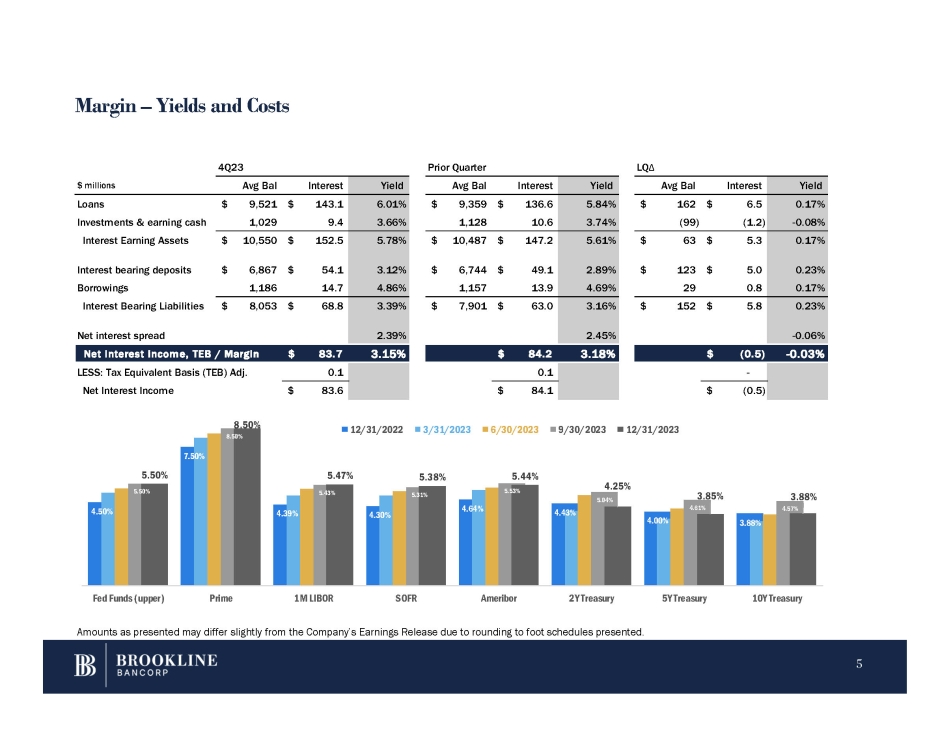
Margin – Yields and Costs LQ Δ Prior Quarter 4Q23 Yield Interest Avg Bal Yield Interest Avg Bal Yield Interest Avg Bal $ millions 0.17% $ 6.5 $ 162 5.84% $ 136.6 $ 9,359 6.01% $ 143.1 $ 9,521 Loans - 0.08% (1.2) (99) 3.74% 10.6 1,128 3.66% 9.4 1,029 Investments & earning cash 0.17% $ 5.3 $ 63 5.61% $ 147.2 $ 10,487 5.78% $ 152.5 $ 10,550 Interest Earning Assets 0.23% $ 5.0 $ 123 2.89% $ 49.1 $ 6,744 3.12% $ 54.1 $ 6,867 Interest bearing deposits 0.17% 0.8 29 4.69% 13.9 1,157 4.86% 14.7 1,186 Borrowings 0.23% $ 5.8 $ 152 3.16% $ 63.0 $ 7,901 3.39% $ 68.8 $ 8,053 Interest Bearing Liabilities - 0.06% 2.45% 2.39% Net interest spread - 0.03% $ (0.5) 3.18% $ 84.2 3.15% $ 83.7 Net interest income, TEB / Margin - 0.1 0.1 LESS: Tax Equivalent Basis (TEB) Adj. (0.5) $ 84.1 $ 83.6 $ Net Interest Income 4.50% 7.50% 4.39% 4.30% 4.64% 4.43% 4.00% 3.88% 5.50% 8.50% 5.43% 5.3 1% 5.53% 5.04% 4.61% 4.57% 5.50% 8.50% 5.47% 5.38% 5.44% 4.25% 3.85% 3.88% Fed Funds (upper) Prime 1M LIBOR SOFR Ameribor 2Y Treasury 5Y Treasury 10Y Treasury 12/31/2022 3/31/2023 6/30/2023 9/30/2023 12/31/2023 Amounts as presented may differ slightly from the Company’s Earnings Release due to rounding to foot schedules presented. 5
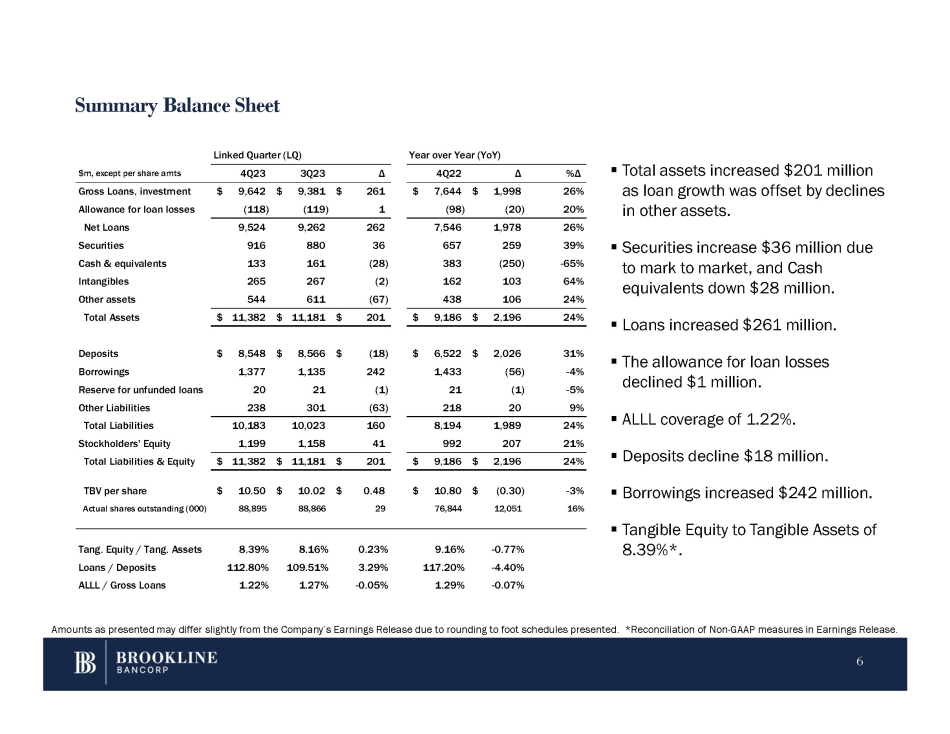
Summary Balance Sheet ▪ Total assets increased $201 million %Δ Δ 4Q22 Δ 3Q23 4Q23 $m, except per share amts as loan growth was offset by declines 26% $ 1,998 $ 7,644 $ 261 $ 9,381 $ 9,642 Gross Loans, investment in other assets. 20% (20) (98) 1 (119) (118) Allowance for loan losses 26% 1,978 7,546 262 9,262 9,524 Net Loans ▪ Securities increase $36 million due to mark to market, and Cash equivalents down $28 million. ▪ Loans increased $261 million. ▪ The allowance for loan losses declined $1 million. ▪ ALLL coverage of 1.22%. ▪ Deposits decline $18 million. ▪ Borrowings increased $242 million. ▪ Tangible Equity to Tangible Assets of 8.39%*. - 0.77% 9.16% 0.23% 8.16% 8.39% Tang. Equity / Tang. Assets - 4.40% 117.20% 3.29% 109.51% 112.80% Loans / Deposits - 0.07% 1.29% - 0.05% 1.27% 1.22% ALLL / Gross Loans 39% 259 657 36 880 916 Securities - 65% (250) 383 (28) 161 133 Cash & equivalents 64% 103 162 (2) 267 265 Intangibles 24% 106 438 (67) 611 544 Other assets 24% $ 2,196 $ 9,186 $ 201 $ 11,181 $ 11,382 Total Assets 31% $ 2,026 $ 6,522 $ (18) $ 8,566 $ 8,548 Deposits - 4% (56) 1,433 242 1,135 1,377 Borrowings - 5% (1) 21 (1) 21 20 Reserve for unfunded loans 9% 20 218 (63) 301 238 Other Liabilities 24% 1,989 8,194 160 10,023 10,183 Total Liabilities 21% 207 992 41 1,158 1,199 Stockholders' Equity 24% $ 2,196 $ 9,186 $ 201 $ 11,181 $ 11,382 Total Liabilities & Equity - 3% $ (0.30) $ 10.80 $ 0.48 $ 10.02 $ 10.50 TBV per share 16% 12,051 76,844 29 88,866 88,895 Actual shares outstanding (000) Linked Quarter (LQ) Year over Year (YoY) Amounts as presented may differ slightly from the Company’s Earnings Release due to rounding to foot schedules presented. *Reconciliation of Non - GAAP measures in Earnings Release. 6
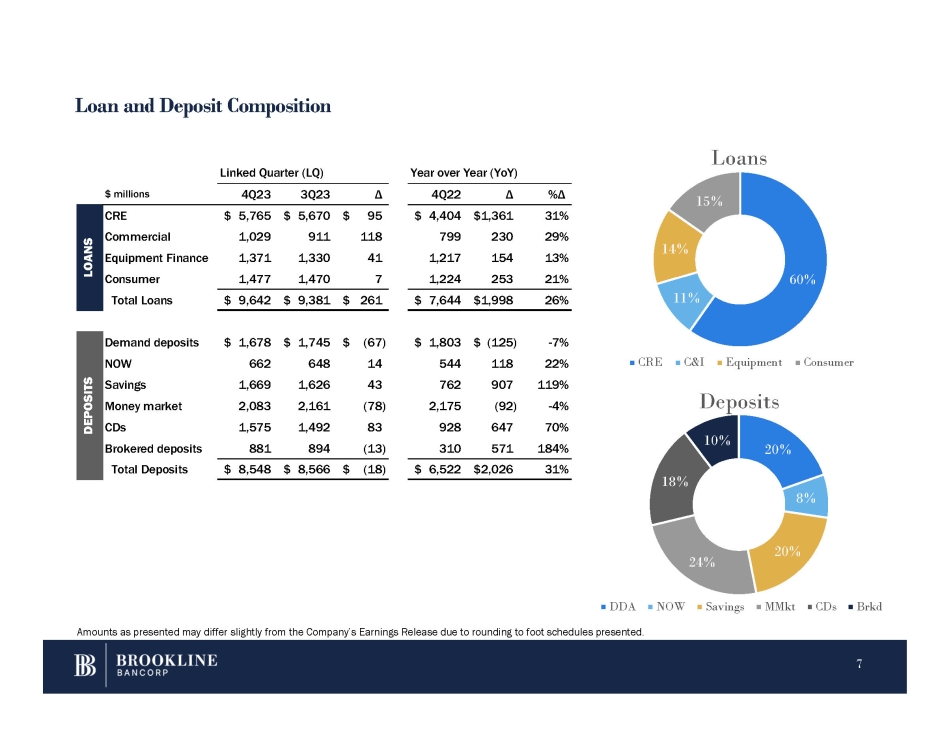
Loan and Deposit Composition 15% 14% 60% 11% Loans 20% 8% 20% 24% 18% 10% CRE C&I Equipment Consumer Deposits DDA NOW Savings MMkt CDs Brkd Amounts as presented may differ slightly from the Company’s Earnings Release due to rounding to foot schedules presented. %Δ Δ 4Q22 Δ 3Q23 4Q23 $ millions 31% $1,361 $ 4,404 $ 95 $ 5,670 $ 5,765 CRE 29% 230 799 118 911 1,029 Commercial S 13% 154 1,217 41 1,330 1,371 Equipment Finance OA N 21% 253 1,224 7 1,470 1,477 Consumer L Total Loans $ 9,642 $ 9,381 $ 261 $ 7,644 $1,998 26% - 7% $ (125) $ 1,803 $ (67) $ 1,745 Demand deposits $ 1,678 22% 118 544 14 648 NOW 662 119% 907 762 43 1,626 Savings 1,669 - 4% (92) 2,175 (78) 2,161 2,083 Money market 70% 647 928 83 1,492 1,575 CDs 184% 571 310 (13) 894 881 Brokered deposits 31% $2,026 $ 6,522 $ (18) $ 8,566 $ 8,548 Total Deposits Linked Quarter (LQ) 7 Year over Year (YoY) DEPOSITS
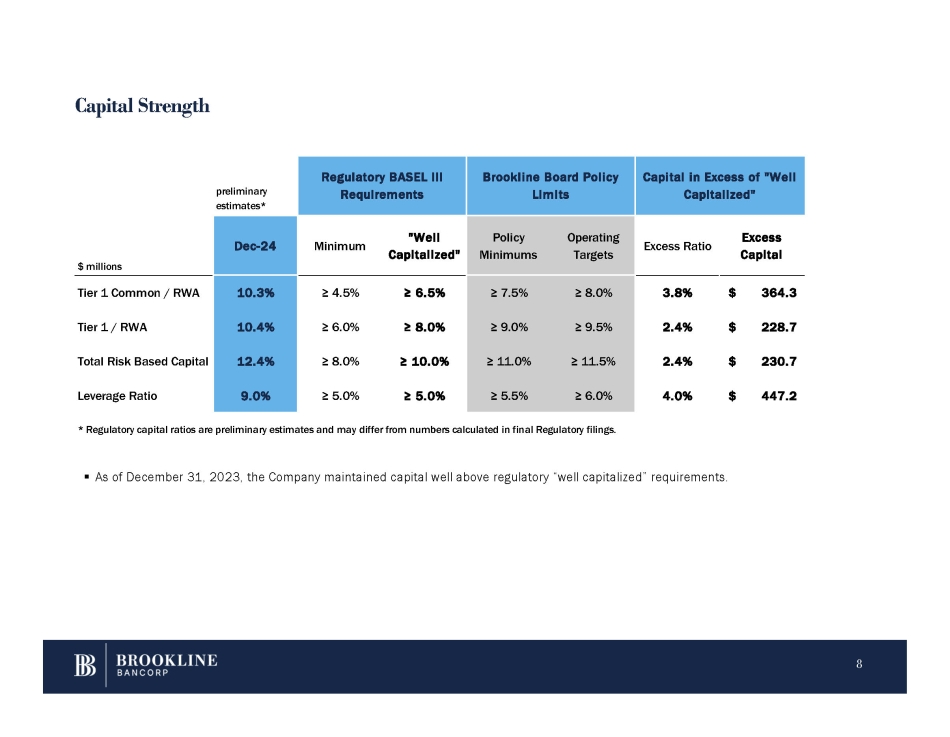
Capital Strength 8 ▪ As of December 31, 2023, the Company maintained capital well above regulatory “well capitalized” requirements. Capital in Excess of "Well Capitalized" Brookline Board Policy Limits Regulatory BASEL III Requirements preliminary estimates* Excess Capital Excess Ratio Operating Targets Policy Minimums "Well Capitalized" Minimum Dec - 24 $ millions $ 364.3 3.8% ≥ 8.0% ≥ 7.5% ≥ 6.5% ≥ 4.5% 10.3% Tier 1 Common / RWA $ 228.7 2.4% ≥ 9.5% ≥ 9.0% ≥ 8.0% ≥ 6.0% 10.4% Tier 1 / RWA $ 230.7 2.4% ≥ 11.5% ≥ 11.0% ≥ 10.0% ≥ 8.0% 12.4% Total Risk Based Capital $ 447.2 4.0% ≥ 6.0% ≥ 5.5% ≥ 5.0% ≥ 5.0% 9.0% Leverage Ratio * Regulatory capital ratios are preliminary estimates and may differ from numbers calculated in final Regulatory filings.
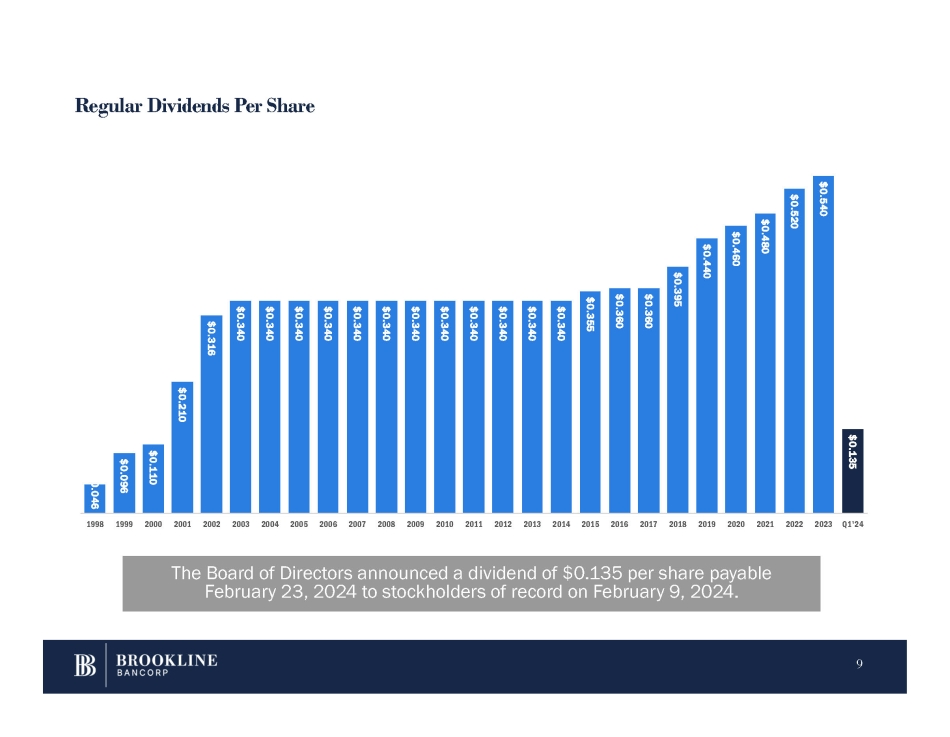
Regular Dividends Per Share The Board of Directors announced a dividend of $0.135 per share payable February 23, 2024 to stockholders of record on February 9, 2024. $0.046 9 $0.096 $0.110 $0.210 $0.316 $0.340 $0.340 $0.340 $0.340 $0.340 $0.340 $0.340 $0.340 $0.340 $0.340 $0.340 $0.340 $0.355 $0.360 $0.360 $0.395 $0.440 $0.460 $0.480 $0.520 $0.540 $0.135 1998 1999 2000 2001 2002 2003 2004 2005 2006 2007 2008 2009 2010 2011 2012 2013 2014 2015 2016 2017 2018 2019 2020 2021 2022 2023 Q1'24
QUESTIONS Paul A. Perrault, Chairman and Chief Executive Officer Carl M. Carlson, Co - President, Chief Financial and Strategy Officer Thank You. 10

APPENDIX RHODE ISLAND - PROVIDENCE BOSTON / EASTERN MASSACHUSETTS (15) WESTCHESTER / LOWER HUDSON VALLEY, NY (29) (22) Subsidiary of Eastern Funding 11
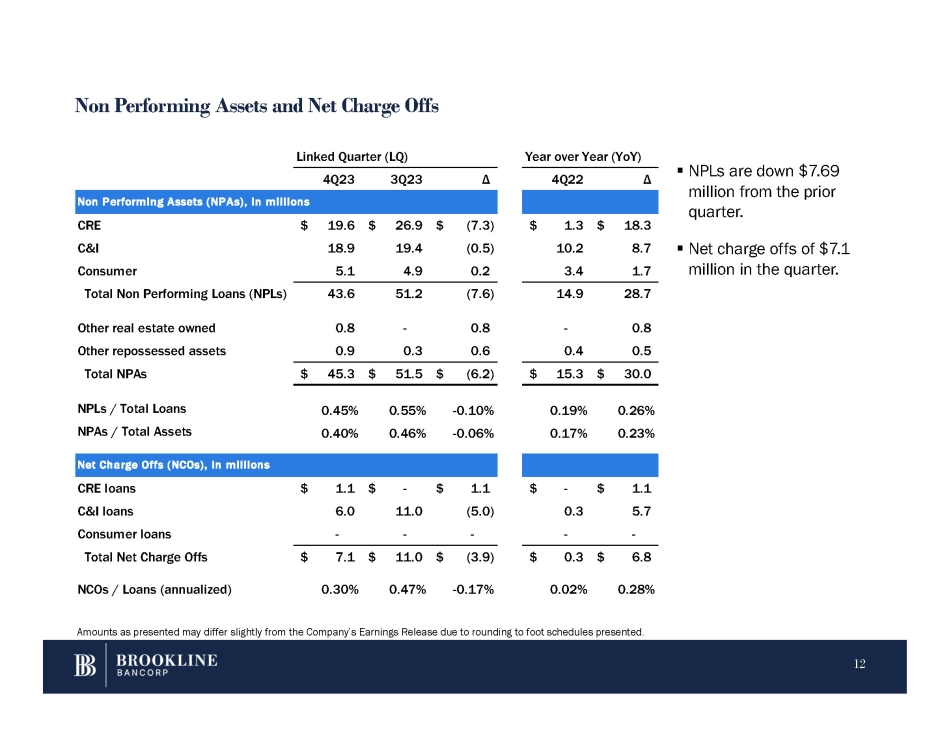
Non Performing Assets and Net Charge Offs Linked Quarter (LQ) 4Q23 3Q23 Δ Year over Year (YoY) 4Q22 Δ Non Performing Assets (NPAs), in millions Amounts as presented may differ slightly from the Company’s Earnings Release due to rounding to foot schedules presented. 12 ▪ NPLs are down $ 7 . 69 million from the prior quarter . $ 18.3 $ 1.3 $ (7.3) $ 26.9 $ 19.6 CRE ▪ Net charge offs of $7.1 8.7 10.2 (0.5) 19.4 18.9 C&I million in the quarter. 1.7 3.4 0.2 4.9 5.1 Consumer 28.7 14.9 (7.6) 51.2 43.6 Total Non Performing Loans (NPLs) 0.8 - 0.8 - 0.8 Other real estate owned 0.5 0.4 0.6 0.3 0.9 Other repossessed assets $ 30.0 $ 15.3 $ (6.2) $ 51.5 $ 45.3 Total NPAs 0.26% 0.19% - 0.10% 0.55% 0.45% NPLs / Total Loans 0.23% 0.17% - 0.06% 0.46% 0.40% NPAs / Total Assets Net Charge Offs (NCOs), in millions $ 1.1 $ - $ 1.1 $ - $ 1.1 CRE loans 5.7 0.3 (5.0) 11.0 6.0 C&I loans - - - - - Consumer loans $ 6.8 $ 0.3 $ (3.9) $ 11.0 $ 7.1 Total Net Charge Offs 0.28% 0.02% - 0.17% 0.47% 0.30% NCOs / Loans (annualized)
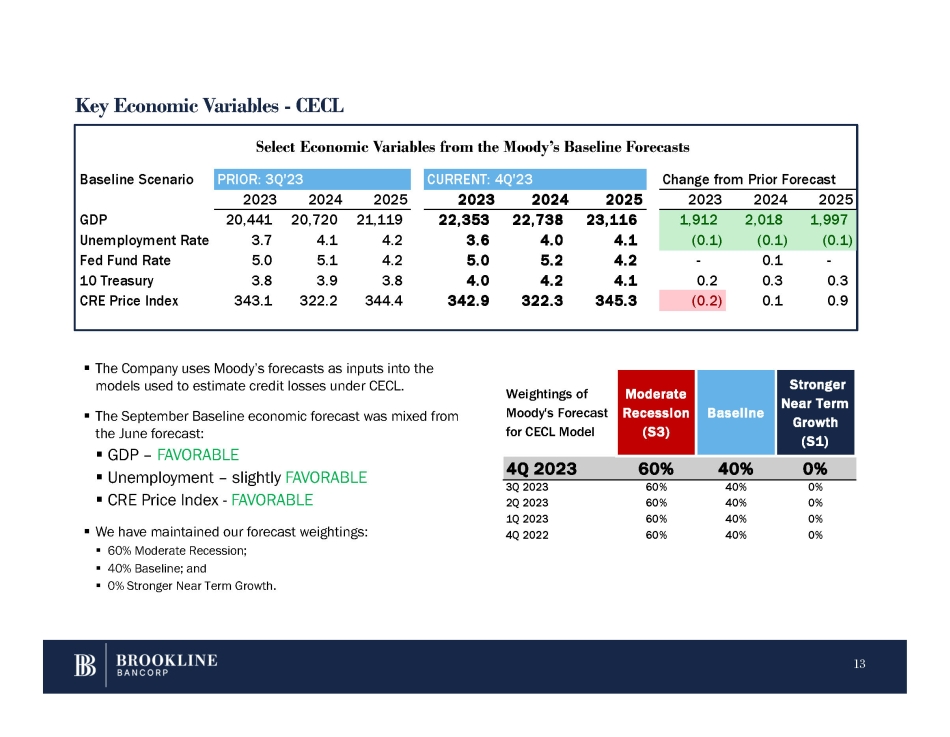
Key Economic Variables - CECL Select Economic Variables from the Moody’s Baseline Forecasts ▪ The Company uses Moody’s forecasts as inputs into the models used to estimate credit losses under CECL. ▪ The September Baseline economic forecast was mixed from the June forecast: ▪ GDP – FAVORABLE ▪ Unemployment – slightly FAVORABLE ▪ CRE Price Index - FAVORABLE ▪ We have maintained our forecast weightings: ▪ 60% Moderate Recession; ▪ 40% Baseline; and ▪ 0% Stronger Near Term Growth. recast om Prior Fo Change fr Q'23 CURRENT: 4 '23 PRIOR: 3Q Baseline Scenario 2025 2024 2023 2025 2024 2023 2025 2024 2023 1,997 2,018 1,912 23,116 22,738 22,353 21,119 20,720 20,441 GDP (0.1) (0.1) (0.1) 4.1 4.0 3.6 4.2 4.1 3.7 Unemployment Rate - 0.1 - 4.2 5.2 5.0 4.2 5.1 5.0 Fed Fund Rate 0.3 0.3 0.2 4.1 4.2 4.0 3.8 3.9 3.8 10 Treasury 0.9 0.1 (0.2) 345.3 322.3 342.9 344.4 322.2 343.1 CRE Price Index 13 Stronger Near Term Growth (S1) Baseline Moderate Recession (S3) Weightings of Moody's Forecast for CECL Model 4Q 2023 60% 40% 0% 0% 40% 60% 3Q 2023 0% 40% 60% 2Q 2023 0% 40% 60% 1Q 2023 0% 40% 60% 4Q 2022
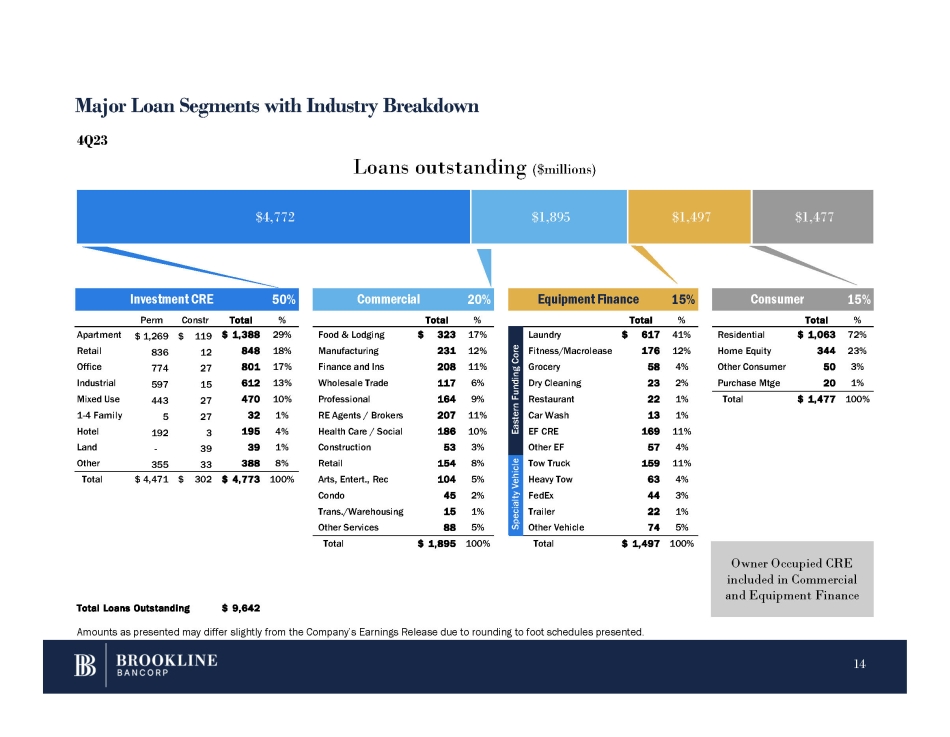
Investment CRE 50% Commercial 20% Equipment Finance 15% Consumer 15% Perm Constr Total % Total % Total % Total % Food & Lodging Manufacturing Finance and Ins Wholesale Trade Professional RE Agents / Brokers Health Care / Social Construction Retail Arts, Entert., Rec Condo Trans./Warehousing Other Services $ 323 17% 231 12% 208 11% 117 6% 164 9% 207 11% 186 10% 53 3% 154 8% 104 5% 45 2% 15 1% 88 5% Residential Home Equity Other Consumer Purchase Mtge $ 1,063 72% 344 23% 50 3% 20 1% Total $ 1,477 100% - Apartment Retail Office Industrial Mixed Use 1 - 4 Family Hotel Land Other 355 $ 1,269 $ 119 836 12 774 27 597 15 443 27 5 27 192 3 39 33 $ 1,388 29% 848 18% 801 17% 612 13% 470 10% 32 1% 195 4% 39 1% 388 8% Total $ 4,471 $ 302 $ 4,773 100% Total $ 1,895 100% Total $ 1,497 100% 41% $ 617 Laundry Eastern Funding Core 12% 176 Fitness/Macrolease 4% 58 Grocery 2% 23 Dry Cleaning 1% 22 Restaurant 1% 13 Car Wash 11% 169 EF CRE 4% 57 Other EF 11% 159 Tow Truck Specialty Vehicle 4% 63 Heavy Tow 3% 44 FedEx 1% 22 Trailer 5% 74 Other Vehicle Total Loans Outstanding $ 9,642 Amounts as presented may differ slightly from the Company’s Earnings Release due to rounding to foot schedules presented. Major Loan Segments with Industry Breakdown $4,772 $1,895 $1,497 $1,477 4Q23 Loans outstanding ($millions) Owner Occupied CRE included in Commercial and Equipment Finance 14
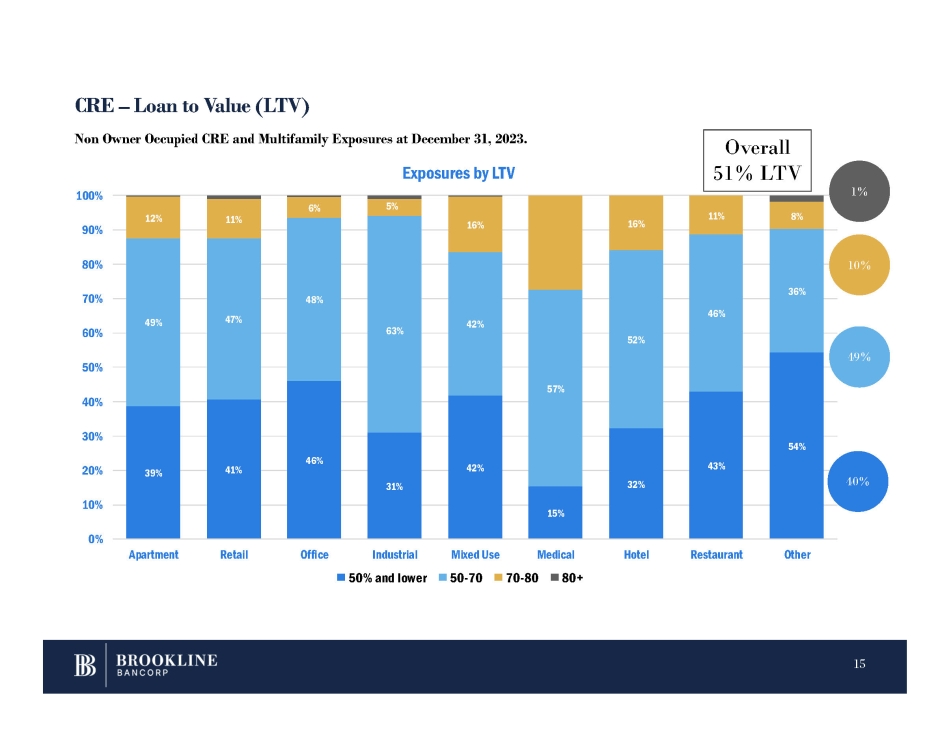
CRE – Loan to Value (LTV) 39% 41% 46% 31% 42% 15% 32% 43% 54% 49% 47% 48% 63% 42% 57% 52% 46% 36% 12% 11% 6% 5% 16% 16% 11% 8% 0% 10% 20% 30% 40% 50% 60% 70% 80% 90% 100% Apartment Retail Office Medical Hotel Restaurant Other Exposures by LTV Industrial 50% and lower Mixed Use 50 - 70 70 - 80 80+ Non Owner Occupied CRE and Multifamily Exposures at December 31, 2023. 40% 49% 1% 10% Overall 51% LTV 15
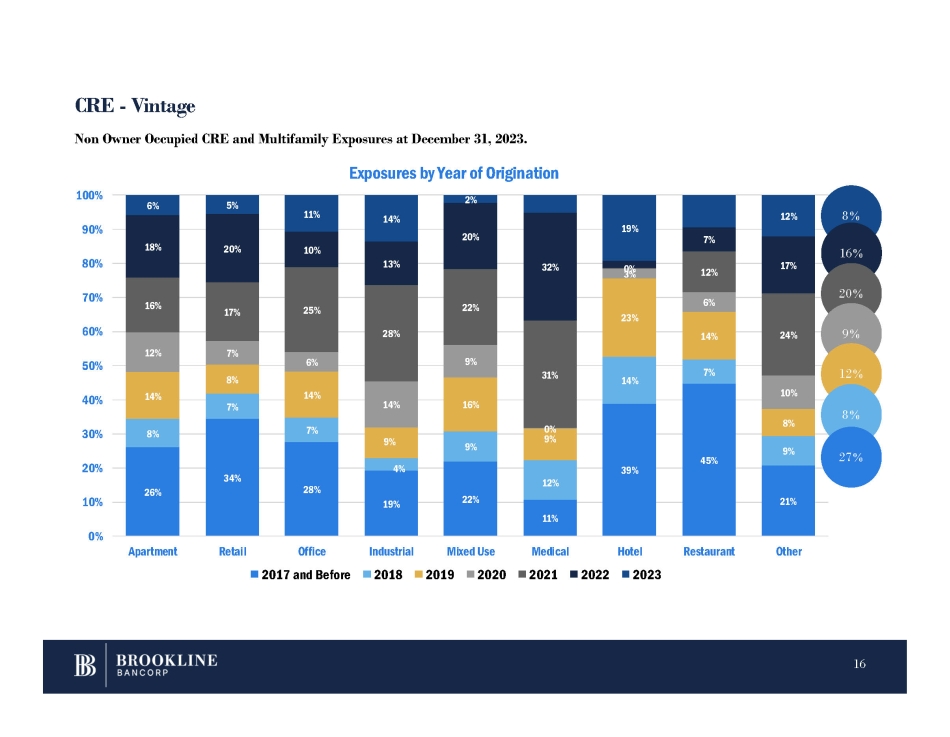
26% 34% 28% 19% 22% 11% 39% 45% 21% 8% 7% 7% 4% 9% 12% 14% 7% 9% 14% 8% 14% 9% 16% 9% 23% 14% 8% 12% 7% 6% 14% 9% 0% 6% 10% 16% 17% 25% 28% 22% 31% 3 0% 12% 24% 18% 20% 10% 13% 20% 32% 7% 17% 6% 5% 11% 14% 2% 19% 12% 0% 10% 20% 30% 40% 50% 60% 70% 80% 90% 100% Apartment Retail Office 2017 and Before Restaurant Other Non Owner Occupied CRE and Multifamily Exposures at December 31, 2023. Exposures by Year of Origination Industrial Mixed Use Medical Hotel 2018 2019 2020 2021 2022 2023 8 % CRE - Vintage 16 % 20 % 9 % 12 % 8 % 27 % 16
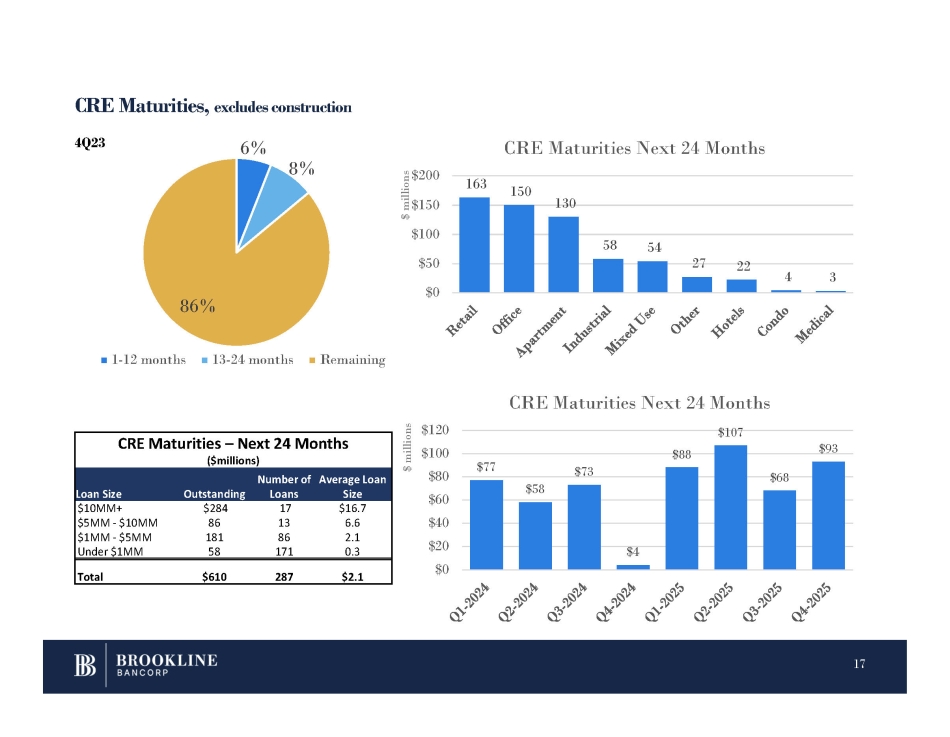
CRE Maturities, excludes construction 6% 8% 86% 1 - 12 months 13 - 24 months Remaining 163 150 130 58 54 27 22 4 3 $200 $150 $100 $50 $0 CRE Maturities Next 24 Months $77 $58 $73 $4 $88 CRE Maturities Next 24 Months $107 $68 $93 $120 $100 $80 $60 $40 $20 $0 CRE Maturities – Next 24 Months ($millions) 17 Number of Average Loan Loan Size Outstanding Loans Size $10MM+ $5MM - $10MM $1MM - $5MM Under $1MM $284 86 181 58 17 13 86 171 $16.7 6.6 2.1 0.3 Total $610 287 $2.1 4Q23 $ millions $ millions
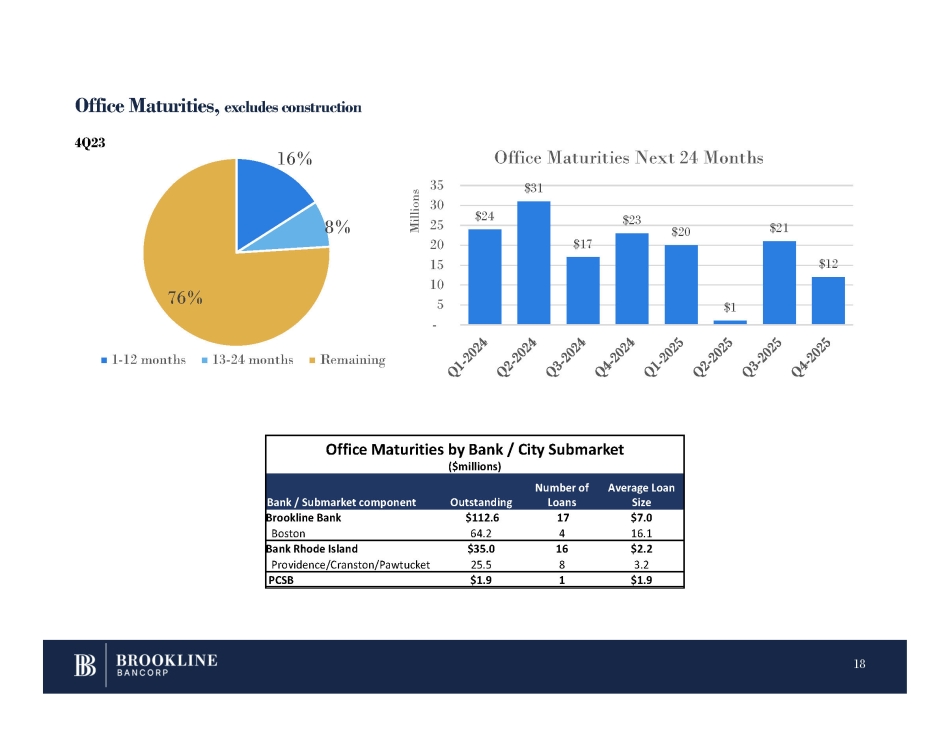
Office Maturities, excludes construction 16% 8% 76% 1 - 12 months 13 - 24 months Remaining $24 Office Maturities Next 24 Months $31 $17 $23 $20 $1 $21 $12 - 35 30 25 20 15 10 5 Millions 18 Office Maturities by Bank / City Submarket ($millions) Average Loan Size Number of Loans Outstanding Bank / Submarket component $7.0 17 $112.6 Brookline Bank 16.1 4 64.2 Boston $2.2 16 $35.0 Bank Rhode Island 3.2 8 25.5 Providence/Cranston/Pawtucket $1.9 1 $1.9 PCSB 4Q23

Consumer Loans – LTV / FICO 19 700+ 85% 650 - 699 8% 600 - 649 2% 599 - N/A 3% 50% or less 31% 50% - 69% 38% 70% - 80% 26% 80%+ 5% 700+ 94% 50% or less 35% 50% - 69% 31% 70% - 80% 32% 80%+ 2% Resid. 1 - 4 58% LTV 2% Resid. 1 - 4 FICO 650 - 699 3% Home Equity FICO Home Equity 56% LTV 4Q23
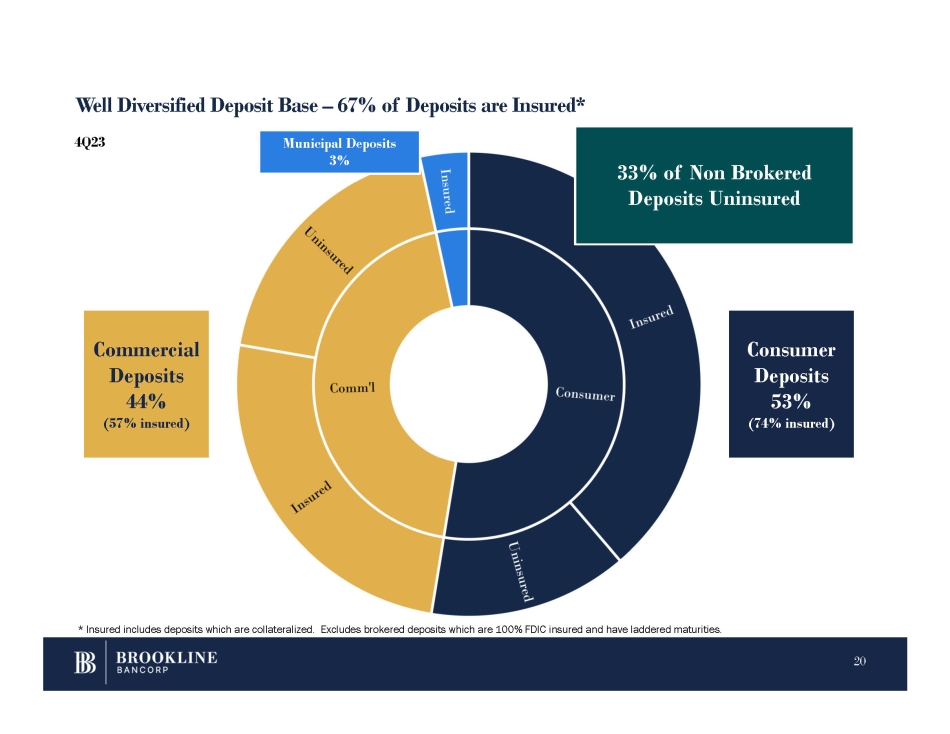
Well Diversified Deposit Base – 67% of Deposits are Insured* Consumer Deposits 53% (74% insured) Commercial Deposits 44% (57% insured) Municipal Deposits 3% * Insured includes deposits which are collateralized. Excludes brokered deposits which are 100% FDIC insured and have laddered maturities. 33% of Non Brokered Deposits Uninsured 20 4Q23
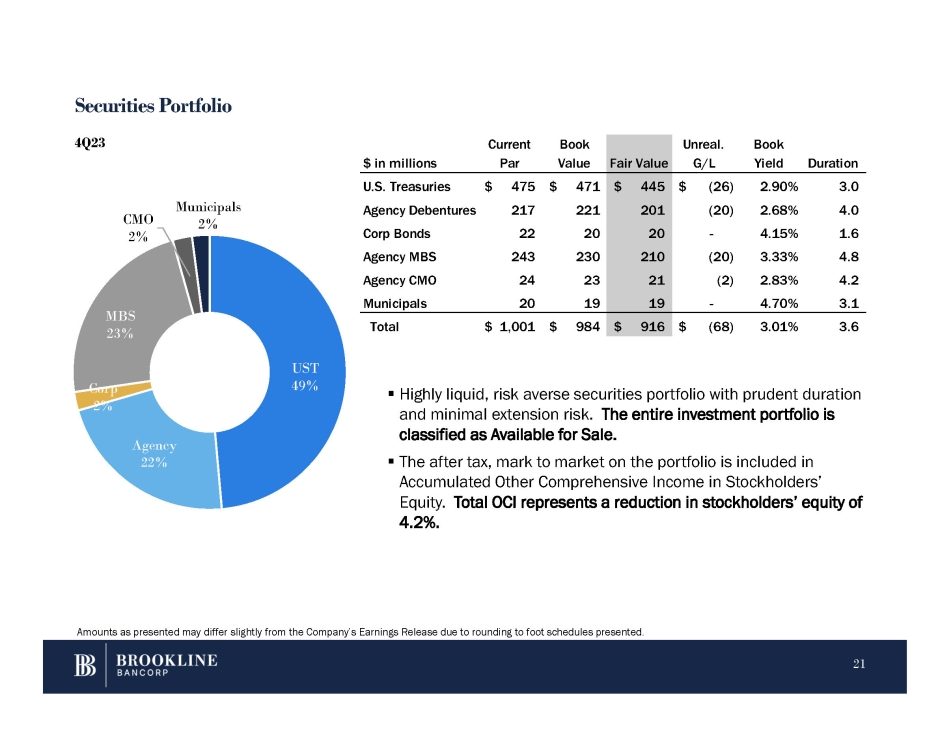
Securities Portfolio ▪ Highly liquid, risk averse securities portfolio with prudent duration and minimal extension risk. The entire investment portfolio is classified as Available for Sale. ▪ The after tax, mark to market on the portfolio is included in Accumulated Other Comprehensive Income in Stockholders’ Equity. Total OCI represents a reduction in stockholders’ equity of 4.2%. UST 49% 21 Agency 22% Corp 2% MBS 23% CMO 2% Municipals 2% 4Q23 Amounts as presented may differ slightly from the Company’s Earnings Release due to rounding to foot schedules presented. Duration Book Yield Unreal. G/L Fair Value Book Value Current Par $ in millions 3.0 2.90% $ (26) $ 445 $ 471 $ 475 U.S. Treasuries 4.0 2.68% (20) 201 221 217 Agency Debentures 1.6 4.15% - 20 20 22 Corp Bonds 4.8 3.33% (20) 210 230 243 Agency MBS 4.2 2.83% (2) 21 23 24 Agency CMO 3.1 4.70% - 19 19 20 Municipals 3.6 3.01% $ (68) $ 916 $ 984 $ 1,001 Total
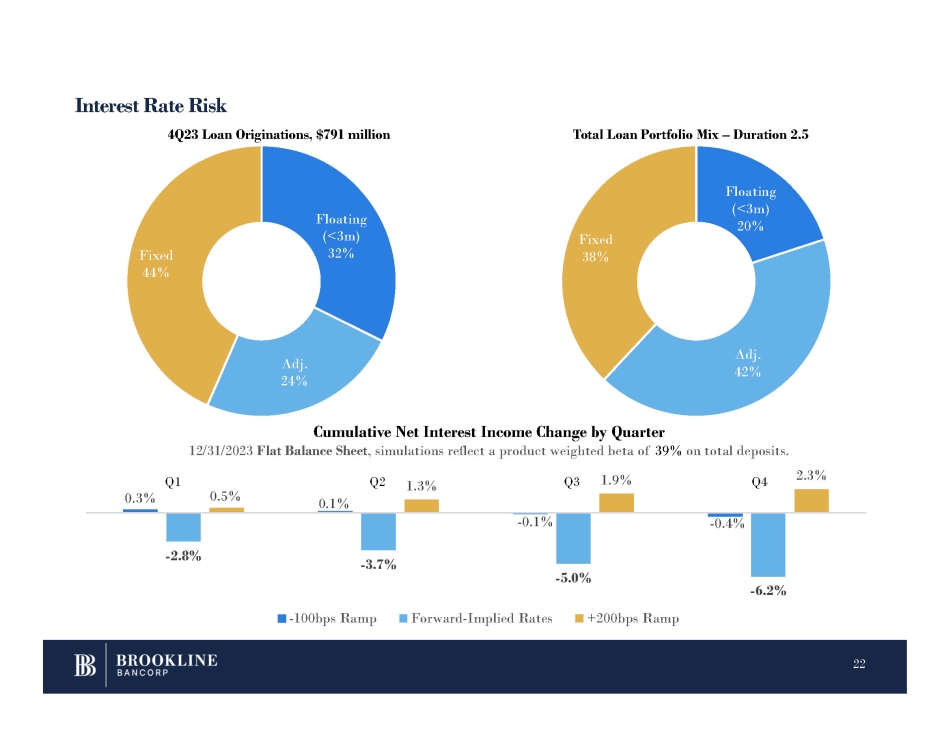
Interest Rate Risk Floating (<3m) 32% Adj. 24% Fixed 44% 4Q23 Loan Originations, $791 million Total Loan Portfolio Mix – Duration 2.5 0.3% 0.1% - 0.1% - 0.4% - 2.8% - 3.7% - 5.0% - 6.2% 0.5% 1.3% 1.9% 2.3% Cumulative Net Interest Income Change by Quarter 12/31/2023 Flat Balance Sheet , simulations reflect a product weighted beta of 39% on total deposits. - 100bps Ramp Forward - Implied Rates +200bps Ramp Q1 Q4 Q2 Q3 Floating (<3m) 20% 22 Adj. 42% Fixed 38%
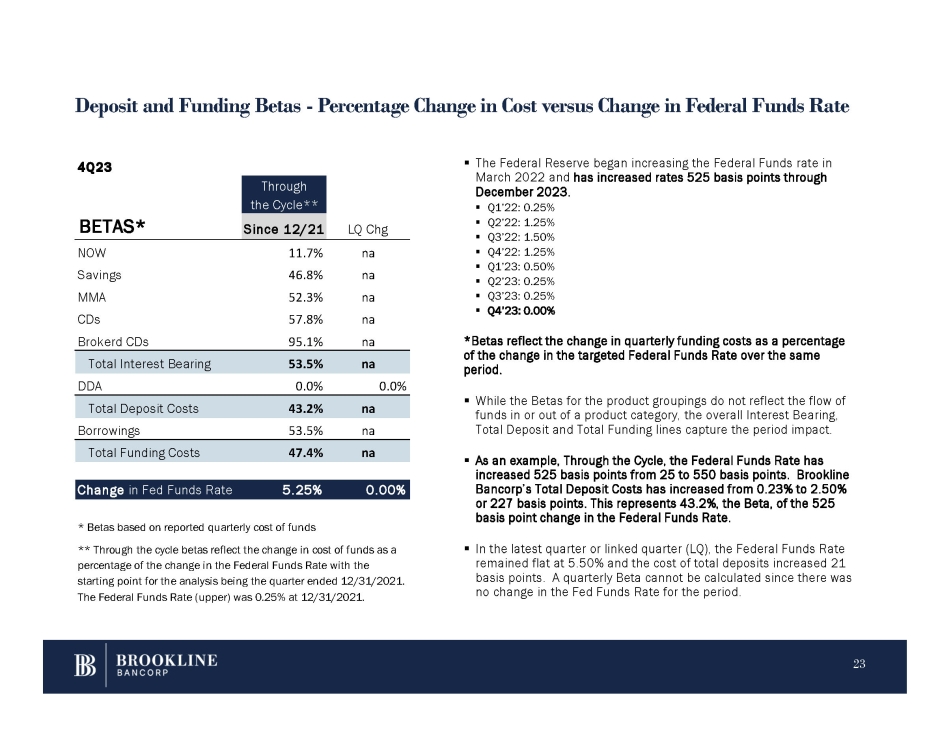
Deposit and Funding Betas - Percentage Change in Cost versus Change in Federal Funds Rate ▪ The Federal Reserve began increasing the Federal Funds rate in March 2022 and has increased rates 525 basis points through December 2023. ▪ Q1’22: 0.25% ▪ Q2’22: 1.25% ▪ Q3’22: 1.50% ▪ Q4’22: 1.25% ▪ Q1’23: 0.50% ▪ Q2’23: 0.25% ▪ Q3’23: 0.25% ▪ Q4’23: 0.00% *Betas reflect the change in quarterly funding costs as a percentage of the change in the targeted Federal Funds Rate over the same period. ▪ While the Betas for the product groupings do not reflect the flow of funds in or out of a product category, the overall Interest Bearing, Total Deposit and Total Funding lines capture the period impact. ▪ As an example, Through the Cycle, the Federal Funds Rate has increased 525 basis points from 25 to 550 basis points. Brookline Bancorp’s Total Deposit Costs has increased from 0.23% to 2.50% or 227 basis points. This represents 43.2%, the Beta, of the 525 basis point change in the Federal Funds Rate. ▪ In the latest quarter or linked quarter (LQ), the Federal Funds Rate remained flat at 5.50% and the cost of total deposits increased 21 basis points. A quarterly Beta cannot be calculated since there was no change in the Fed Funds Rate for the period. Through the Cycle** LQ Chg Since 12/21 BETAS* na 11.7% NOW na 46.8% Savings na 52.3% MMA na 57.8% CDs na 95.1% Brokerd CDs Total Interest Bearing 53.5% na 4Q23 0.0% DDA 0.0% Total Deposit Costs 43.2% na Borrowings 53.5% na Total Funding Costs 47.4% na Change in Fed Funds Rate 5.25% 0.00% * Betas based on reported quarterly cost of funds ** Through the cycle betas reflect the change in cost of funds as a percentage of the change in the Federal Funds Rate with the starting point for the analysis being the quarter ended 12/31/2021. The Federal Funds Rate (upper) was 0.25% at 12/31/2021. 23