Exhibit 99.2

October 24, 2024 1 3Q 2024 Financial Results
Forward Looking Statements 2 Certain statements contained in this press release that are not historical facts may constitute forward - looking statements within the meaning of Section 27A of the Securities Act of 1933, as amended, and Section 21E of the Securities Exchange Act of 1934, as amended, and are intended to be covered by the safe harbor provisions of the Private Securities Litigation Reform Act of 1995. We may also make forward - looking statements in other documents we file with the Securities and Exchange Commission ("SEC"), in our annual reports to shareholders, in press releases and other written materials, and in oral statements made by our officers, directors or employees. You can identify forward looking statements by the use of the words “believe,” “expect,” “anticipate,” “intend,” “estimate,” “assume,” “outlook,” “will,” “should,” and other expressions that predict or indicate future events and trends and which do not relate to historical matters, including statements regarding the Company’s business, credit quality, financial condition, liquidity and results of operations. Forward - looking statements may differ, possibly materially, from what is included in this press release due to factors and future developments that are uncertain and beyond the scope of the Company’s control. These include, but are not limited to, changes in interest rates; general economic conditions (including inflation and concerns about liquidity) on a national basis or in the local markets in which the Company operates; turbulence in the capital and debt markets; competitive pressures from other financial institutions; changes in consumer behavior due to changing political, business and economic conditions, or legislative or regulatory initiatives; changes in the value of securities and other assets in the Company’s investment portfolio; increases in loan and lease default and charge - off rates; the adequacy of allowances for loan and lease losses; decreases in deposit levels that necessitate increases in borrowing to fund loans and investments; operational risks including, but not limited to, cybersecurity incidents, fraud, natural disasters, and future pandemics; changes in regulation; the possibility that future credit losses may be higher than currently expected due to changes in economic assumptions and adverse economic developments; the risk that goodwill and intangibles recorded in the Company’s financial statements will become impaired; and changes in assumptions used in making such forward - looking statements. Forward - looking statements involve risks and uncertainties which are difficult to predict. The Company’s actual results could differ materially from those projected in the forward - looking statements as a result of, among others, the risks outlined in the Company’s Annual Report on Form 10 - K, as updated by its Quarterly Reports on Form 10 - Q and other filings submitted to the SEC. The Company does not undertake any obligation to update any forward - looking statement to reflect circumstances or events that occur after the date the forward - looking statements are made.
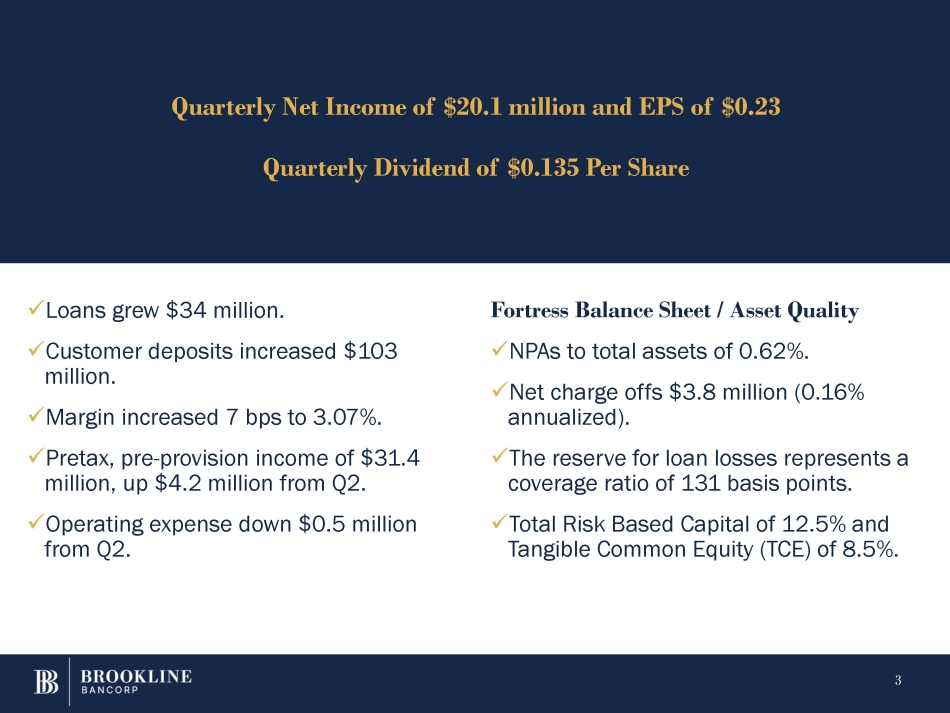
x Loans grew $34 million. x Customer deposits increased $103 million. x Margin increased 7 bps to 3.07%. x Pretax, pre - provision income of $31.4 million, up $4.2 million from Q2. x Operating expense down $0.5 million from Q2. 3 Fortress Balance Sheet / Asset Quality x NPAs to total assets of 0.62%. x Net charge offs $3.8 million (0.16% annualized). x The reserve for loan losses represents a coverage ratio of 131 basis points. x Total Risk Based Capital of 12.5% and Tangible Common Equity (TCE) of 8.5%. Quarterly Net Income of $20.1 million and EPS of $0.23 Quarterly Dividend of $0.135 Per Share
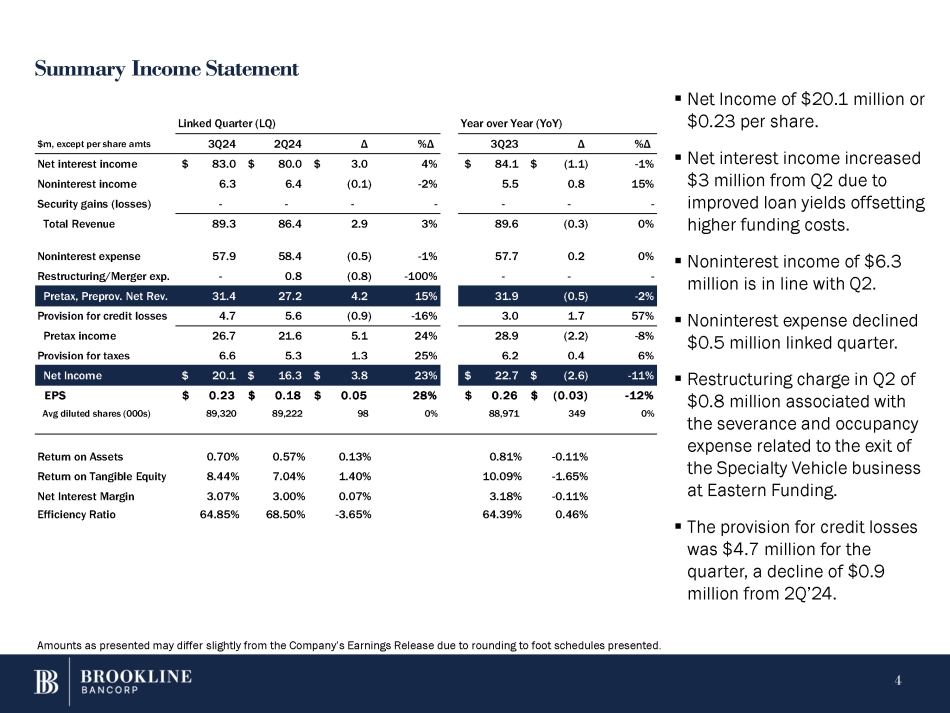
Summary Income Statement ▪ Net Income of $20.1 million or $0.23 per share. %Δ Δ 3Q23 %Δ Δ 2Q24 3Q24 $m, except per share amts ▪ Net interest income increased - 1% $ (1.1) $ 84.1 4% $ 3.0 $ 80.0 $ 83.0 Net interest income $3 million from Q2 due to 15% 0.8 5.5 - 2% (0.1) 6.4 6.3 Noninterest income improved loan yields offsetting - - - - - - Security gains (losses) - higher funding costs. 0% (0.3) 89.6 3% 2.9 86.4 Total Revenue 89.3 ▪ Noninterest income of $6.3 million is in line with Q2. ▪ Noninterest expense declined $0.5 million linked quarter. ▪ Restructuring charge in Q2 of $0.8 million associated with the severance and occupancy expense related to the exit of the Specialty Vehicle business at Eastern Funding. ▪ The provision for credit losses was $4.7 million for the quarter, a decline of $0.9 million from 2Q’24. 0% 0.2 57.7 - 1% (0.5) 58.4 57.9 Noninterest expense - - - - 100% (0.8) 0.8 - Restructuring/Merger exp. - 2% (0.5) 31.9 15% 4.2 27.2 31.4 Pretax, Preprov. Net Rev. 57% 1.7 3.0 - 16% (0.9) 5.6 4.7 Provision for credit losses - 8% (2.2) 28.9 24% 5.1 21.6 26.7 Pretax income 6% 0.4 6.2 25% 1.3 5.3 6.6 Provision for taxes - 11% $ (2.6) $ 22.7 23% $ 3.8 $ 16.3 $ 20.1 Net Income - 12% $ (0.03) $ 0.26 28% $ 0.05 $ 0.18 $ 0.23 EPS 0% 349 88,971 0% 98 89,222 89,320 Avg diluted shares (000s) - 0.11% 0.81% 0.13% 0.57% 0.70% Return on Assets - 1.65% 10.09% 1.40% 7.04% 8.44% Return on Tangible Equity - 0.11% 3.18% 0.07% 3.00% 3.07% Net Interest Margin 0.46% 64.39% - 3.65% 68.50% 64.85% Efficiency Ratio Linked Quarter (LQ) Year over Year (YoY) Amounts as presented may differ slightly from the Company’s Earnings Release due to rounding to foot schedules presented. 4

Margin – Yields and Costs LQ Δ Prior Quarter 3Q24 Yield Interest Avg Bal Yield Interest Avg Bal Yield Interest Avg Bal $ millions 0.15% $ 4.0 $ 23 6.02% $ 145.8 $ 9,687 6.17% $ 149.8 $ 9,710 Loans 0.02% 0.2 13 3.69% 9.8 1,062 3.71% 10.0 1,075 Investments & earning cash 0.14% $ 4.2 $ 36 5.79% $ 155.6 $ 10,749 5.93% $ 159.8 $ 10,785 Interest Earning Assets 0.00% $ 0.1 $ (49) 3.39% $ 59.7 $ 7,075 3.39% $ 59.8 $ 7,026 Interest bearing deposits 0.14% 1.1 38 5.00% 15.7 1,238 5.14% 16.8 1,276 Borrowings 0.02% $ 1.2 $ (11) 3.65% $ 75.4 $ 8,313 3.67% $ 76.6 $ 8,302 Interest Bearing Liabilities 0.12% 2.14% 2.26% Net interest spread 0.07% $ 3.0 3.00% $ 80.2 3.07% $ 83.2 Net interest income, TEB / Margin - 0.2 0.2 LESS: Tax Equivalent Basis (TEB) Adj. 3.0 $ 80.0 $ 83.0 $ Net Interest Income 5.50% 8.50% 5.3 1% 5.53% 5.04% 4.61% 4.57% 5.50% 8.50% 5.33% 5.44% 4.75% 4.38% 4.40% 5.00% 8.00% 5.16% 4.93% 3.64% 3.56% 3.78% Fed Funds (upper) Prime 30 Day Avg SOFR Ameribor 2Y Treasury 5Y Treasury 10Y Treasury 9/30/2023 12/31/2023 3/31/2024 6/30/2024 9/30/2024 Amounts as presented may differ slightly from the Company’s Earnings Release due to rounding to foot schedules presented. 5
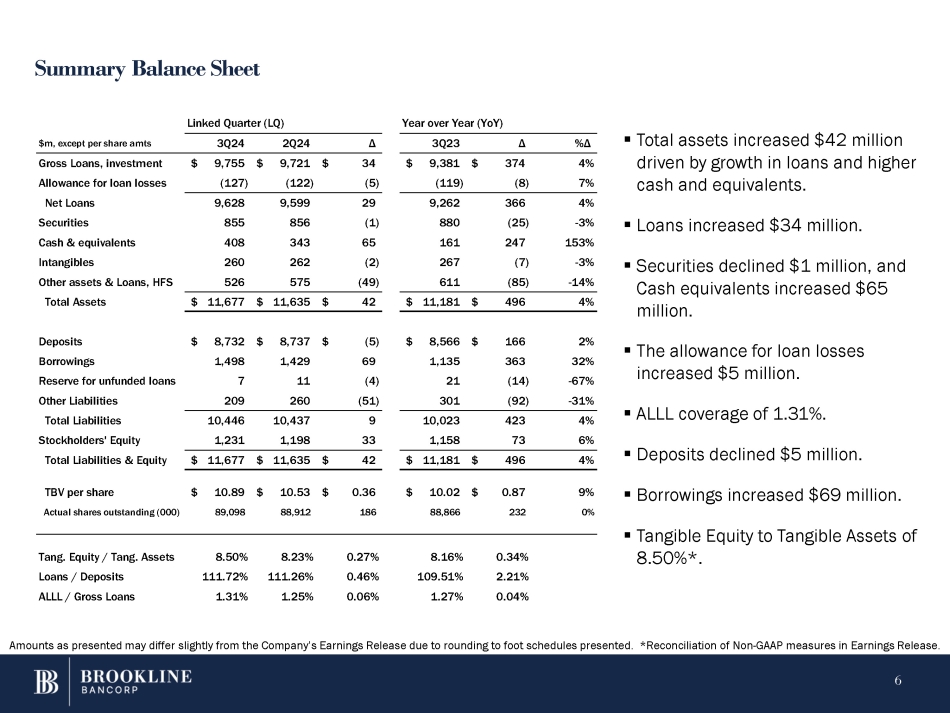
Summary Balance Sheet ▪ Total assets increased $42 million driven by growth in loans and higher cash and equivalents. ▪ Loans increased $34 million. ▪ Securities declined $1 million, and Cash equivalents increased $65 million. ▪ The allowance for loan losses increased $5 million. ▪ ALLL coverage of 1.31%. ▪ Deposits declined $5 million. ▪ Borrowings increased $69 million. ▪ Tangible Equity to Tangible Assets of 8.50%*. Year over Year (YoY) Linked Quarter (LQ) %Δ 3Q23 Δ Δ 3Q24 2Q24 $m, except per share amts 4% $ 9,381 $ 374 $ 34 $ 9,755 $ 9,721 Gross Loans, investment 7% (119) (8) (5) (127) (122) Allowance for loan losses 4% 366 9,262 29 9,599 9,628 Net Loans - 3% (25) 880 (1) 856 855 Securities 153% 247 161 65 343 408 Cash & equivalents - 3% (7) 267 (2) 262 260 Intangibles - 14% (85) 611 (49) 575 526 Other assets & Loans, HFS 4% 496 $ 11,181 $ 42 $ 11,635 $ 11,677 $ Total Assets 2% $ 166 $ 8,566 $ (5) $ 8,737 $ 8,732 Deposits 32% 363 1,135 69 1,429 1,498 Borrowings - 67% (14) 21 (4) 11 7 Reserve for unfunded loans - 31% (92) 301 (51) 260 209 Other Liabilities 4% 423 10,023 9 10,437 10,446 Total Liabilities 6% 73 1,158 33 1,198 1,231 Stockholders' Equity 4% $ 496 $ 11,181 $ 42 $ 11,635 $ 11,677 Total Liabilities & Equity 9% $ 0.87 $ 10.02 $ 0.36 $ 10.53 $ 10.89 TBV per share 0% 232 88,866 186 88,912 89,098 Actual shares outstanding (000) 0.34% 8.16% 0.27% 8.23% 8.50% Tang. Equity / Tang. Assets 2.21% 109.51% 0.46% 111.26% 111.72% Loans / Deposits 0.04% 1.27% 0.06% 1.25% 1.31% ALLL / Gross Loans Amounts as presented may differ slightly from the Company’s Earnings Release due to rounding to foot schedules presented. *Reconciliation of Non - GAAP measures in Earnings Release. 6
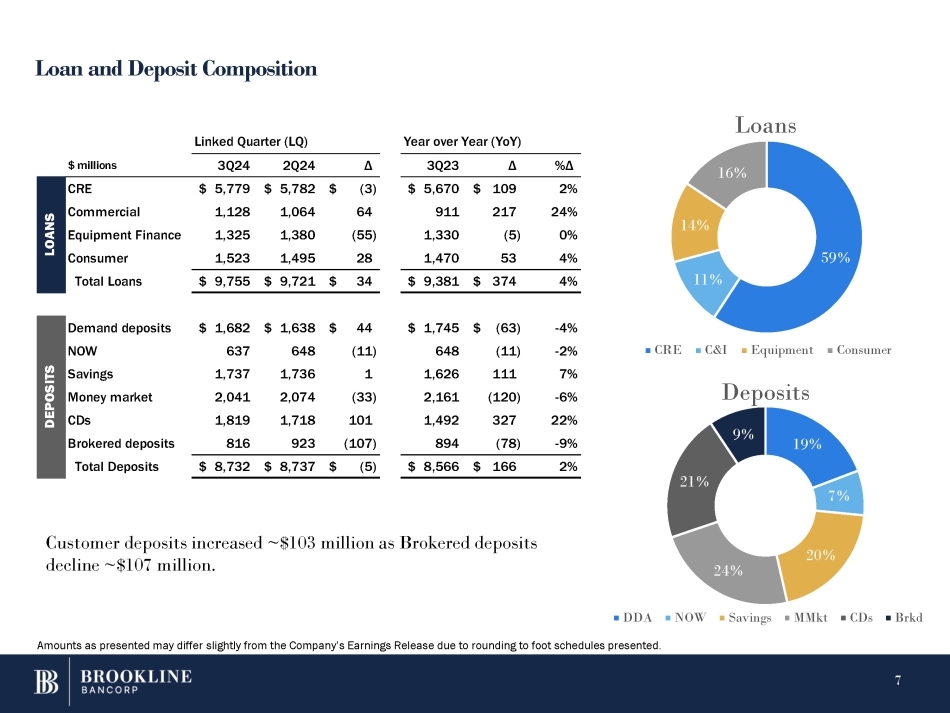
Loan and Deposit Composition 59% 11% 14% Loans 16% 19% 7% 20% 24% 21% 9% CRE C&I Equipment Consumer Deposits DDA NOW Savings MMkt CDs Brkd Amounts as presented may differ slightly from the Company’s Earnings Release due to rounding to foot schedules presented. %Δ Δ 3Q23 Δ 2Q24 3Q24 $ millions 2% $ 109 $ 5,670 $ (3) $ 5,782 $ 5,779 CRE 24% 217 911 64 1,064 1,128 Commercial S 0% (5) 1,330 (55) 1,380 1,325 Equipment Finance OA N 4% 53 1,470 28 1,495 1,523 Consumer L Total Loans $ 9,755 $ 9,721 $ 34 $ 9,381 $ 374 4% - 4% $ (63) $ 1,745 $ 44 $ 1,638 $ 1,682 Demand deposits - 2% (11) 648 (11) 648 637 NOW 7% 111 1,626 1 1,736 1,737 Savings - 6% (120) 2,161 (33) 2,074 2,041 Money market 22% 327 1,492 101 1,718 1,819 CDs - 9% (78) 894 (107) 923 816 Brokered deposits 2% $ 166 $ 8,566 $ (5) $ 8,737 $ 8,732 Total Deposits Linked Quarter (LQ) 7 Year over Year (YoY) DEPOSITS Customer deposits increased ~$103 million as Brokered deposits decline ~$107 million.
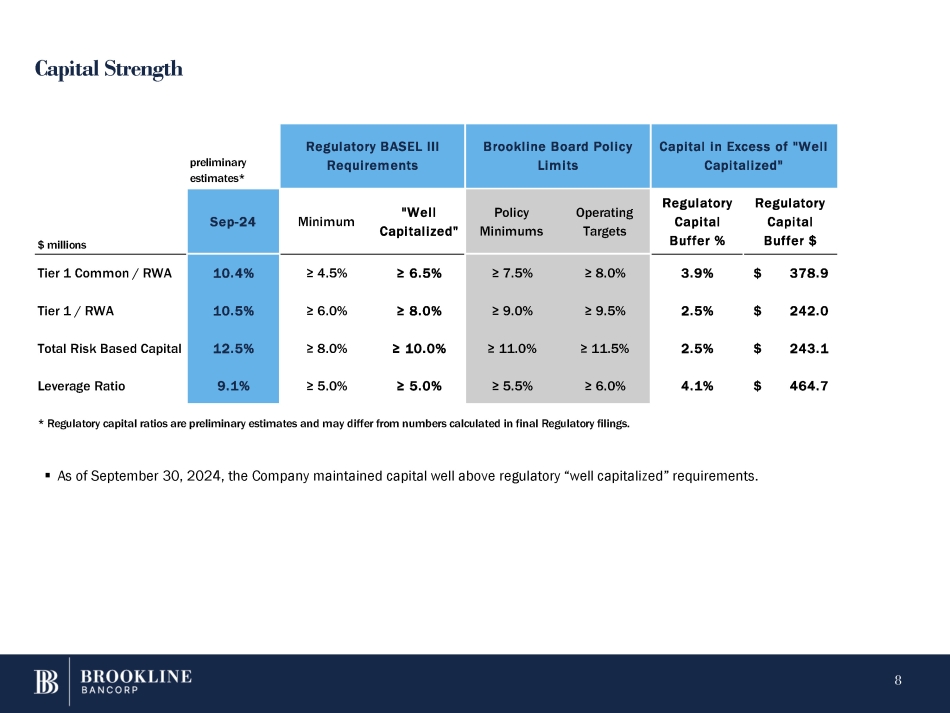
Capital Strength 8 ▪ As of September 30, 2024, the Company maintained capital well above regulatory “well capitalized” requirements. Capital in Excess of "Well Capitalized" Brookline Board Policy Limits Regulatory BASEL III Requirements preliminary estimates* Regulatory Capital Buffer $ Regulatory Capital Buffer % Operating Targets Policy Minimums "Well Capitalized" Minimum Sep - 24 $ millions $ 378.9 3.9% ≥ 8.0% ≥ 7.5% ≥ 6.5% ≥ 4.5% 10.4% Tier 1 Common / RWA $ 242.0 2.5% ≥ 9.5% ≥ 9.0% ≥ 8.0% ≥ 6.0% 10.5% Tier 1 / RWA $ 243.1 2.5% ≥ 11.5% ≥ 11.0% ≥ 10.0% ≥ 8.0% 12.5% Total Risk Based Capital $ 464.7 4.1% ≥ 6.0% ≥ 5.5% ≥ 5.0% ≥ 5.0% 9.1% Leverage Ratio * Regulatory capital ratios are preliminary estimates and may differ from numbers calculated in final Regulatory filings.
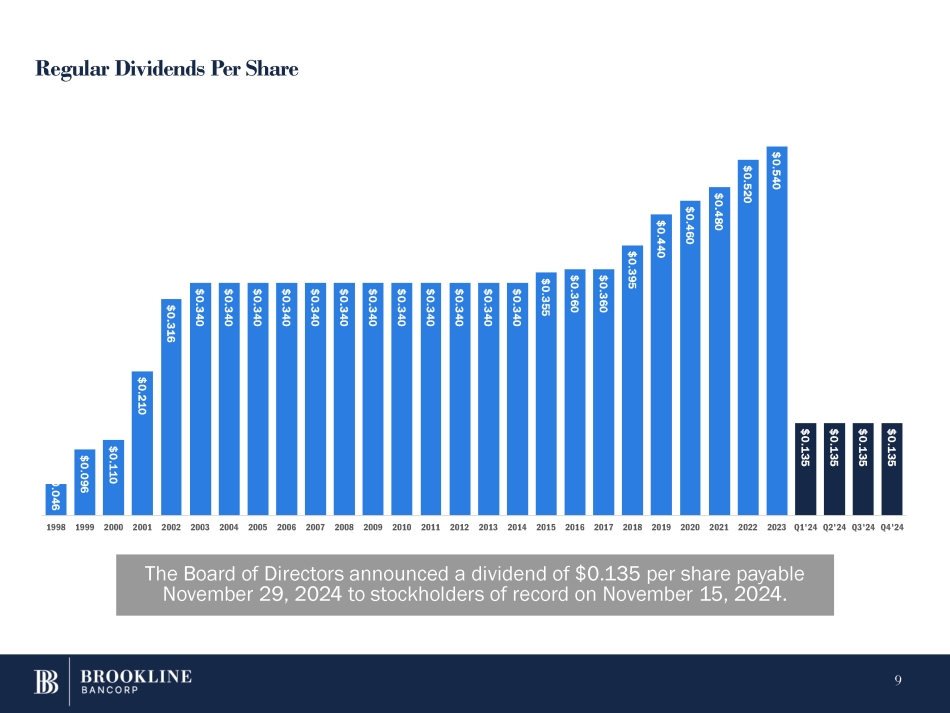
Regular Dividends Per Share The Board of Directors announced a dividend of $0.135 per share payable November 29, 2024 to stockholders of record on November 15, 2024. 0.046 9 $0.096 $0.110 $0.210 $0.316 $0.340 $0.340 $0.340 $0.340 $0.340 $0.340 $0.340 $0.340 $0.340 $0.340 $0.340 $0.340 $0.355 $0.360 $0.360 $0.395 $0.440 $0.460 $0.480 $0.520 $0.540 $0.135 $0.135 $0.135 $0.135 1998 1999 2000 2001 2002 2003 2004 2005 2006 2007 2008 2009 2010 2011 2012 2013 2014 2015 2016 2017 2018 2019 2020 2021 2022 2023 Q1'24 Q2'24 Q3'24 Q4'24
QUESTIONS Paul A. Perrault, Chairman and Chief Executive Officer Carl M. Carlson, Co - President, Chief Financial and Strategy Officer Thank You. 10
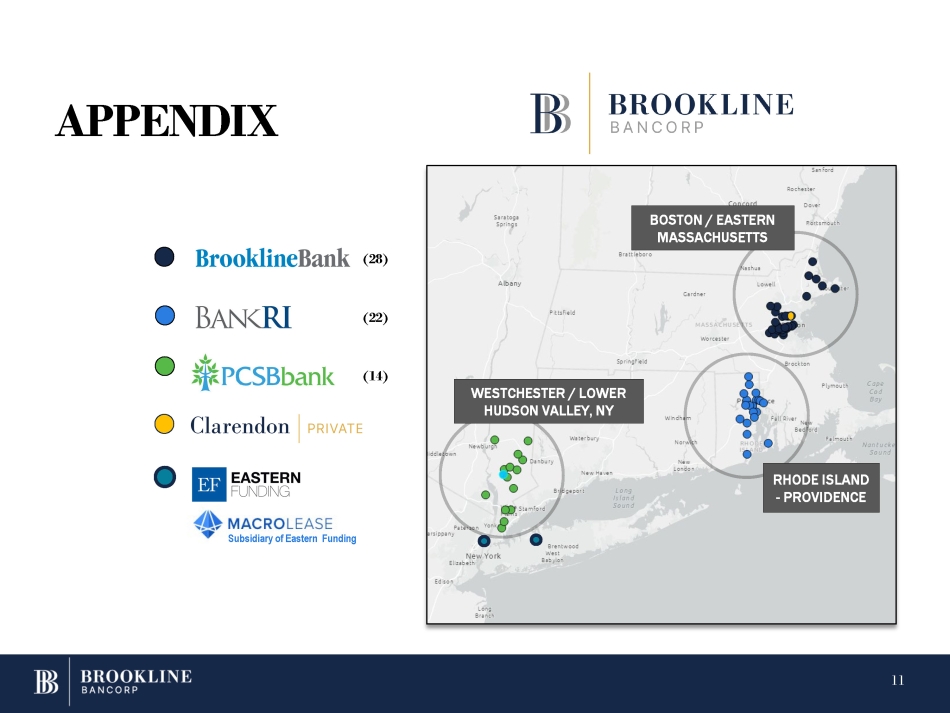
APPENDIX RHODE ISLAND - PROVIDENCE WESTCHESTER / LOWER HUDSON VALLEY, NY BOSTON / EASTERN MASSACHUSETTS (28) (22) (14) Subsidiary of Eastern Funding 11
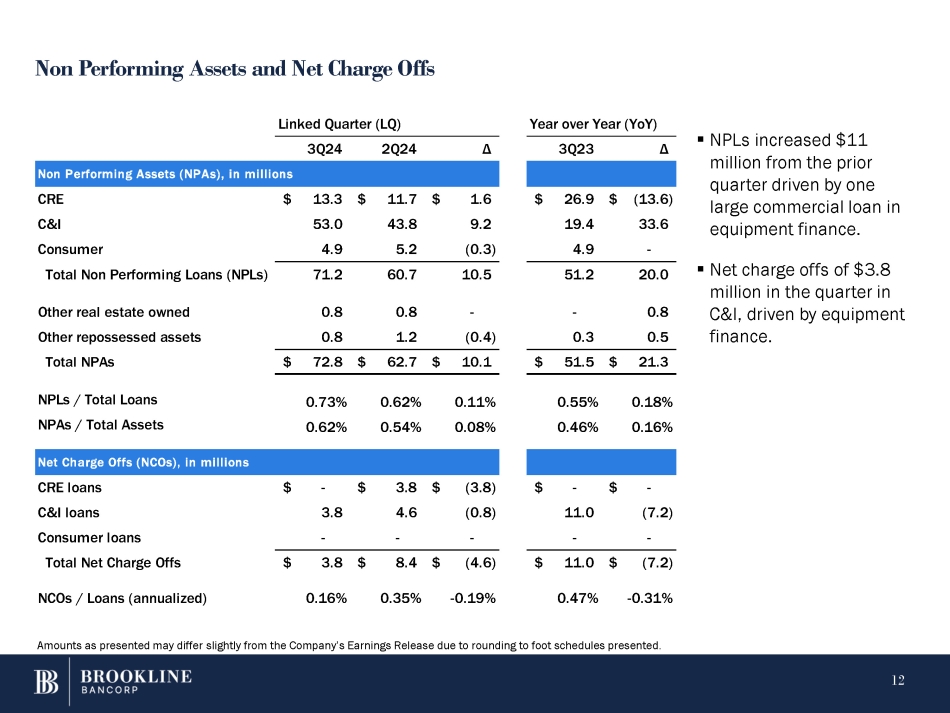
Non Performing Assets and Net Charge Offs Non Performing Assets (NPAs), in millions $ (13.6) $ 26.9 $ 1.6 $ 11.7 $ 13.3 CRE 33.6 19.4 9.2 43.8 53.0 C&I - 4.9 (0.3) 5.2 4.9 Consumer 20.0 51.2 10.5 60.7 Total Non Performing Loans (NPLs) 71.2 0.8 - - 0.8 Other real estate owned 0.8 finance. 0.5 0.3 (0.4) 1.2 Other repossessed assets 0.8 $ 21.3 $ 51.5 $ 10.1 $ 62.7 Total NPAs $ 72.8 0.18% 0.55% 0.11% 0.62% NPLs / Total Loans 0.73% 0.16% 0.46% 0.08% 0.54% NPAs / Total Assets 0.62% Net Charge Offs (NCOs), in millions $ - $ - $ (3.8) $ 3.8 $ - CRE loans (7.2) 11.0 (0.8) 4.6 3.8 C&I loans - - - - - Consumer loans $ (7.2) $ 11.0 $ (4.6) $ 8.4 $ 3.8 Total Net Charge Offs - 0.31% 0.47% - 0.19% 0.35% 0.16% NCOs / Loans (annualized) Linked Quarter (LQ) 3Q24 2Q24 Year over Year (YoY) Δ 3Q23 Δ Amounts as presented may differ slightly from the Company’s Earnings Release due to rounding to foot schedules presented. 12 ▪ NPLs increased $11 million from the prior quarter driven by one large commercial loan in equipment finance. ▪ Net charge offs of $3.8 million in the quarter in C&I, driven by equipment

Key Economic Variables - CECL Select Economic Variables from the Moody’s Baseline Forecasts ▪ The Company uses Moody’s forecasts as inputs into the models used to estimate credit losses under CECL. 13 ▪ The September 2024 Baseline economic forecast was favorable to the June 2024 forecast: ▪ GDP – FAVORABLE ▪ Unemployment – slightly UNFAVORABLE ▪ CRE Price Index – FAVORABLE ▪ We have modified our forecast weightings for 3Q’24: ▪ 50% Moderate Recession; neutral target of 30% ▪ 45% Baseline; neutral target of 40% ▪ 5% Stronger Near Term Growth; neutral target of 30% Stronger Near Term Growth (S1) Baseline Moderate Recession (S3) Weightings of Moody's Forecast for CECL Model 3Q 2024 50% 45% 5% 0% 40% 60% 2Q 2024 0% 40% 60% 1Q 2024 0% 40% 60% 4Q 2023 0% 40% 60% 3Q 2023 Change from Prior CURRENT: 3Q'24 Prior Quarter: Baseline Scenario 2025 2024 2025 2024 2025 2024 310 230 23,637 23,152 23,327 22,922 GDP - 0.2 4.1 4.2 4.1 4.0 Unemployment Rate (0.3) (0.2) 4.0 5.0 4.3 5.2 Fed Fund Rate - (0.2) 4.1 4.1 4.1 4.3 10 Treasury 7.0 1.5 325.3 306.5 318.3 305.0 CRE Price Index
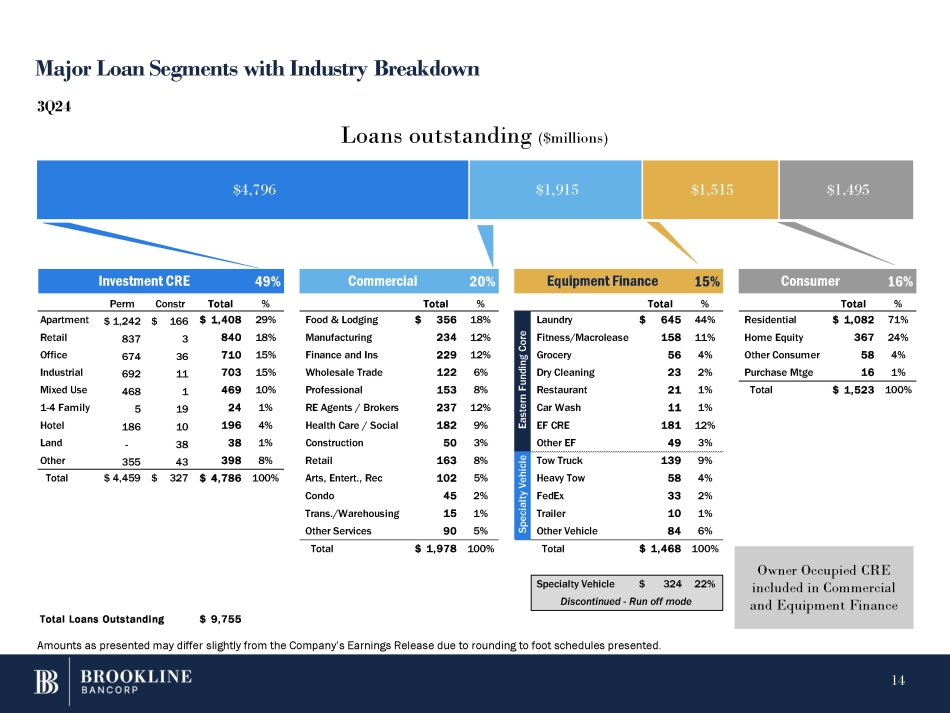
Investment CRE 49% Commercial 20% Equipment Finance 15% Consumer 16% Perm Constr Total % Total % Total % Total % Food & Lodging Manufacturing Finance and Ins Wholesale Trade Professional RE Agents / Brokers Health Care / Social Construction Retail Arts, Entert., Rec Condo Trans./Warehousing Other Services $ 356 18% 234 12% 229 12% 122 6% 153 8% 237 12% 182 9% 50 3% 163 8% 102 5% 45 2% 15 1% 90 5% Residential Home Equity Other Consumer Purchase Mtge $ 1,082 71% 367 24% 58 4% 16 1% Total $ 1,523 100% - Apartment Retail Office Industrial Mixed Use 1 - 4 Family Hotel Land Other 355 $ 1,242 $ 166 837 3 674 36 692 11 468 1 5 19 186 10 38 43 $ 1,408 29% 840 18% 710 15% 703 15% 469 10% 24 1% 196 4% 38 1% 398 8% Total $ 4,459 $ 327 $ 4,786 100% Total $ 1,978 100% Total $ 1,468 100% 44% $ 645 Laundry Eastern Funding Core 11% 158 Fitness/Macrolease 4% 56 Grocery 2% 23 Dry Cleaning 1% 21 Restaurant 1% 11 Car Wash 12% 181 EF CRE 3% 49 Other EF 9% 139 Tow Truck Specialty Vehicle 4% 58 Heavy Tow 2% 33 FedEx 1% 10 Trailer 6% 84 Other Vehicle Specialty Vehicle $ 324 22% Discontinued - Run off mode Total Loans Outstanding $ 9,755 Amounts as presented may differ slightly from the Company’s Earnings Release due to rounding to foot schedules presented. Major Loan Segments with Industry Breakdown $4,796 $1,915 $1,515 $1,495 3Q24 Loans outstanding ($millions) Owner Occupied CRE included in Commercial and Equipment Finance 14
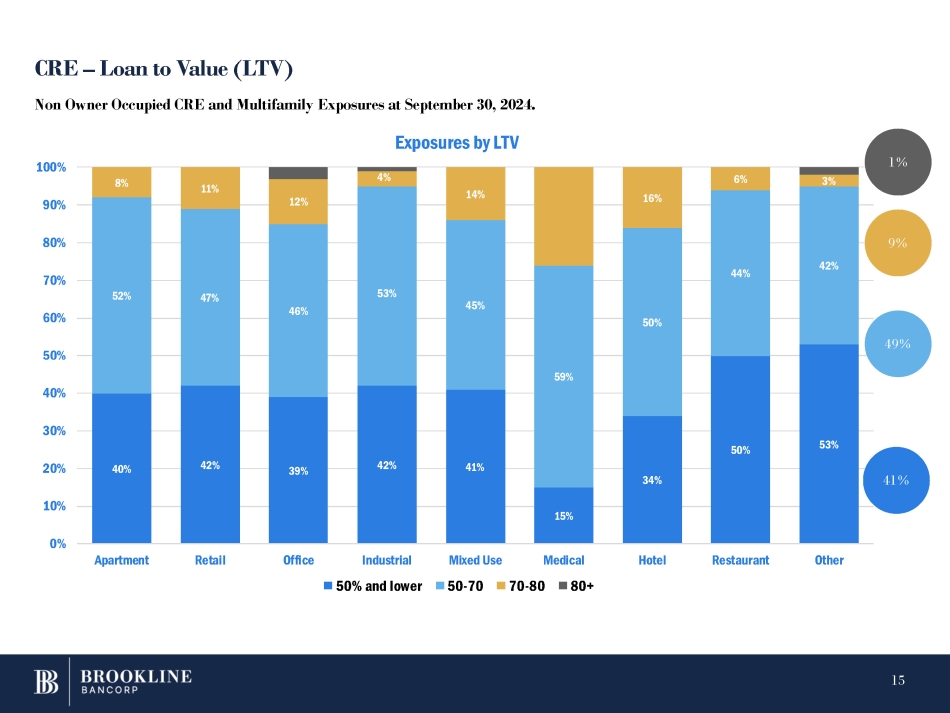
CRE – Loan to Value (LTV) 40% 42% 39% 42% 41% 15% 34% 50% 53% 52% 47% 46% 53% 45% 59% 50% 44% 42% 8% 11% 12% 4% 14% 16% 6% 3% 0% 10% 20% 30% 40% 50% 60% 70% 80% 90% 100% Apartment Retail Office Industrial 50% and lower Mixed Use 50 - 70 Medical Hotel Restaurant Other Non Owner Occupied CRE and Multifamily Exposures at September 30, 2024. Exposures by LTV 70 - 80 80+ 41% 49% 1% 9% 15
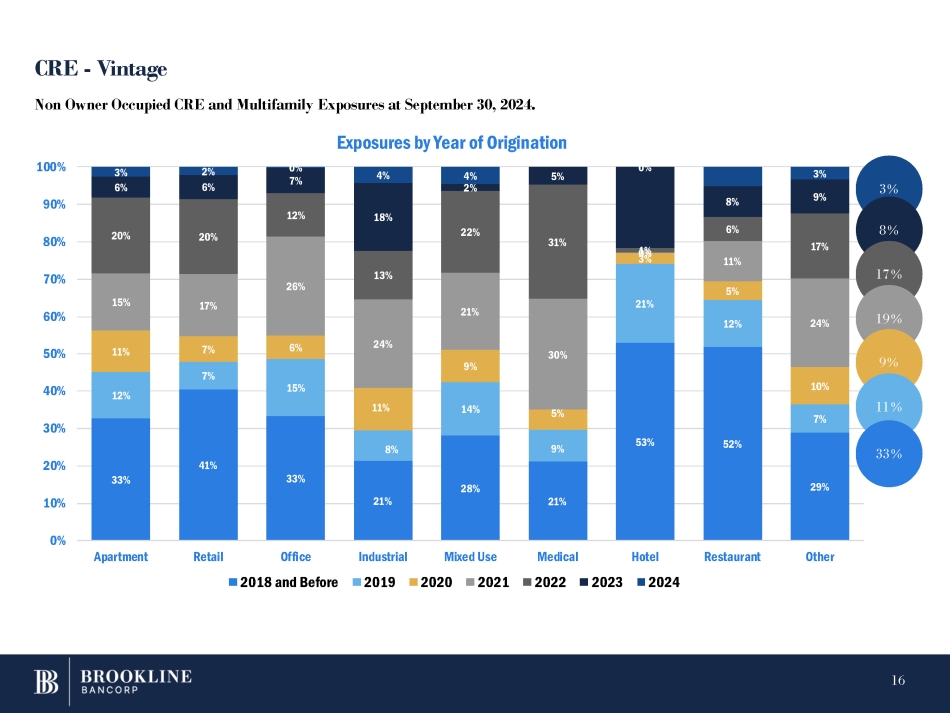
33% 41% 33% 21% 28% 21% 53% 52% 29% 12% 7% 15% 8% 14% 9% 21% 12% 7% 7% 6% 11% 9% 5% 3% 5% 10% 17% 26% 24% 21% 30% 11% 24% 20% 15% 11% 20% 12% 13% 22% 31% 1 0 % 6% 17% 6% 6% 7% 18% 8% 9% 3% 2% 0% 4% 4% 5% 2% 0% 3% 0% 10% 20% 30% 40% 50% 60% 70% 80% 90% 100% Apartment Retail Office 2018 and Before Restaurant Other Non Owner Occupied CRE and Multifamily Exposures at September 30, 2024. Exposures by Year of Origination Industrial Mixed Use Medical Hotel 2019 2020 2021 2022 2023 2024 3 % CRE - Vintage 8 % 17 % 19 % 9 % 11 % 33 % 16
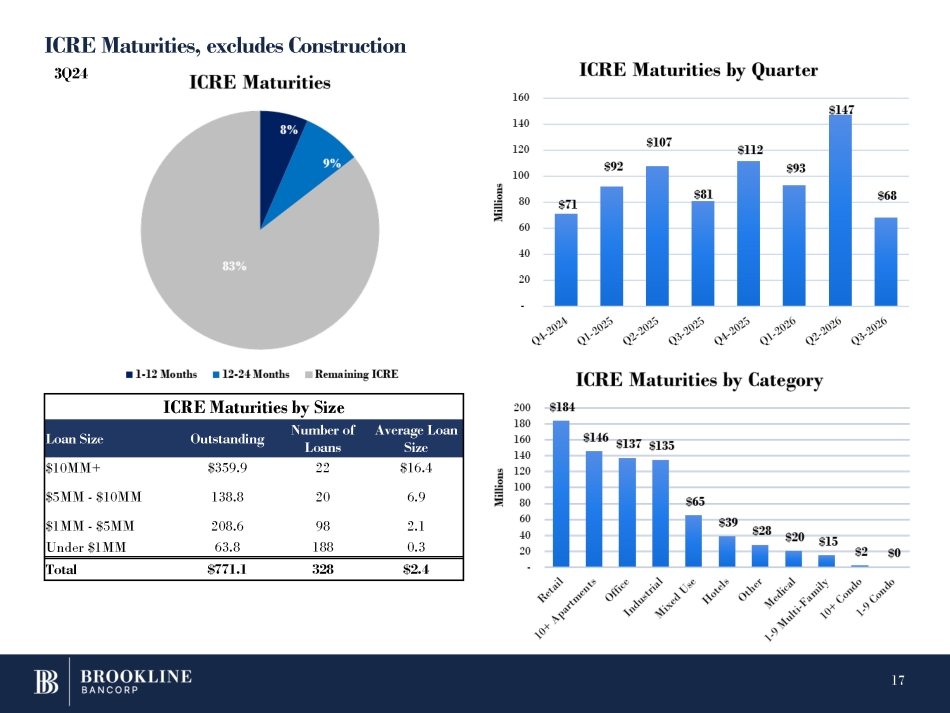
ICRE Maturities, excludes Construction 3Q24 ICRE Maturities by Size Average Loan Size Number of Loans Outstanding Loan Size $16.4 22 $359.9 $10MM+ 6.9 20 138.8 $5MM - $10MM 2.1 98 208.6 $1MM - $5MM 0.3 188 63.8 Under $1MM $2.4 328 $771.1 Total 17
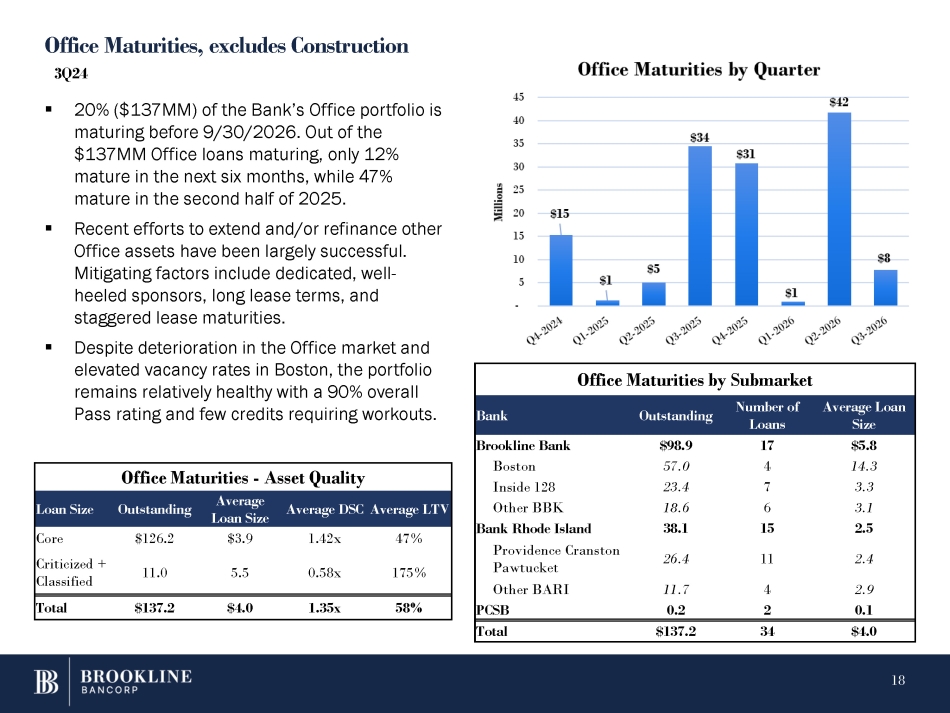
Office Maturities, excludes Construction 3Q24 ▪ 20% ($137MM) of the Bank’s Office portfolio is maturing before 9/30/2026. Out of the $137MM Office loans maturing, only 12% mature in the next six months, while 47% mature in the second half of 2025. ▪ Recent efforts to extend and/or refinance other Office assets have been largely successful. Mitigating factors include dedicated, well - heeled sponsors, long lease terms, and staggered lease maturities. ▪ Despite deterioration in the Office market and elevated vacancy rates in Boston, the portfolio remains relatively healthy with a 90% overall Pass rating and few credits requiring workouts. Office Maturities by Submarket Average Loan Size Number of Loans Outstanding Bank $5.8 17 $98.9 Brookline Bank 14.3 4 57.0 Boston 3.3 7 23.4 Inside 128 3.1 6 18.6 Other BBK 2.5 15 38.1 Bank Rhode Island 2.4 11 26.4 Providence Cranston Pawtucket 2.9 4 11.7 Other BARI 0.1 2 0.2 PCSB $4.0 34 $137.2 Total Office Maturities - Asset Quality Average LTV Average DSC Average Loan Size Outstanding Loan Size 47% 1.42x $3.9 $126.2 Core 175% 0.58x 5.5 11.0 Criticized + Classified 58% 1.35x $4.0 $137.2 Total 18
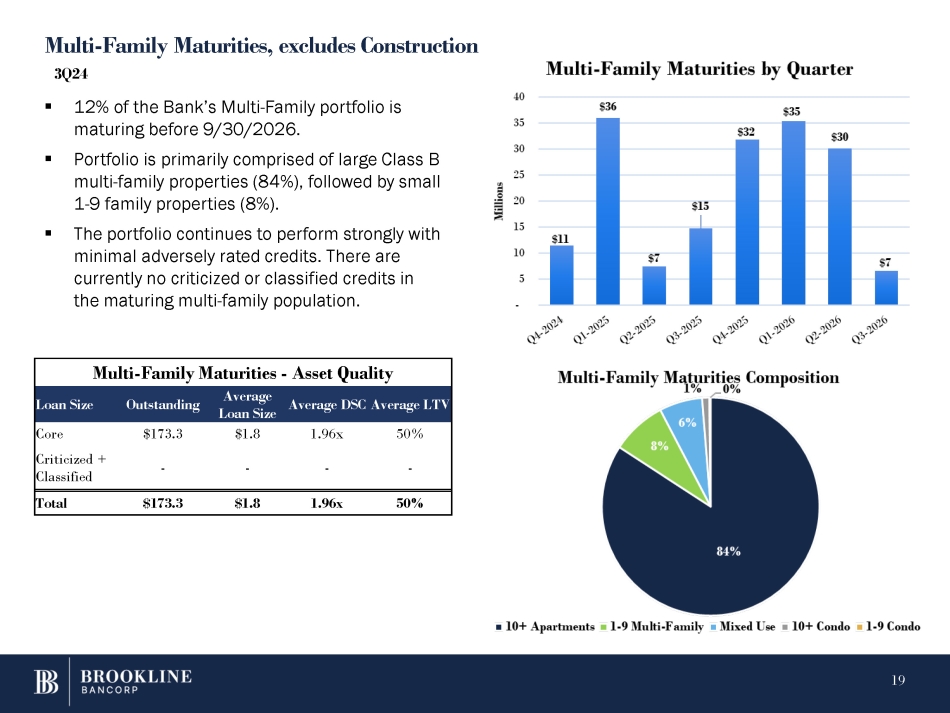
Multi - Family Maturities, excludes Construction 3Q24 ▪ 12 % of the Bank’s Multi - Family portfolio is maturing before 9 / 30 / 2026 . ▪ Portfolio is primarily comprised of large Class B multi - family properties ( 84 % ), followed by small 1 - 9 family properties ( 8 % ) . ▪ The portfolio continues to perform strongly with minimal adversely rated credits. There are currently no criticized or classified credits in the maturing multi - family population. Multi - Family Maturities - Asset Quality Average LTV Average DSC Average Loan Size Outstanding Loan Size 50% 1.96x $1.8 $173.3 Core - - - - Criticized + Classified 50% 1.96x $1.8 $173.3 Total 19
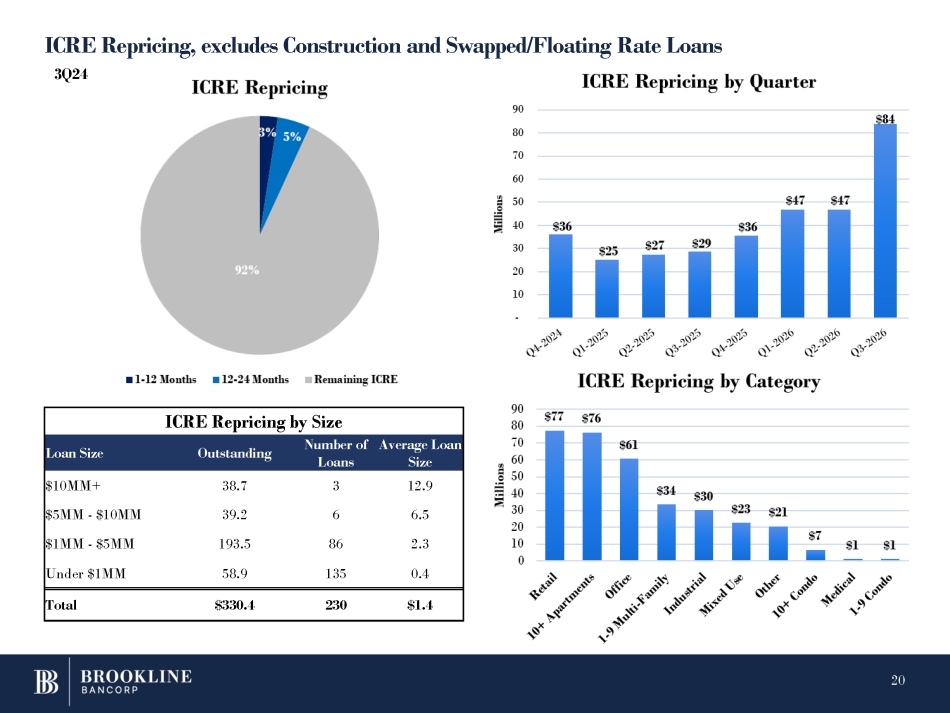
ICRE Repricing, excludes Construction and Swapped/Floating Rate Loans 3Q24 ICRE Repricing by Size Average Loan Size Number of Loans Outstanding Loan Size 12.9 3 38.7 $10MM+ 6.5 6 39.2 $5MM - $10MM 2.3 86 193.5 $1MM - $5MM 0.4 135 58.9 Under $1MM $1.4 230 $330.4 Total 20
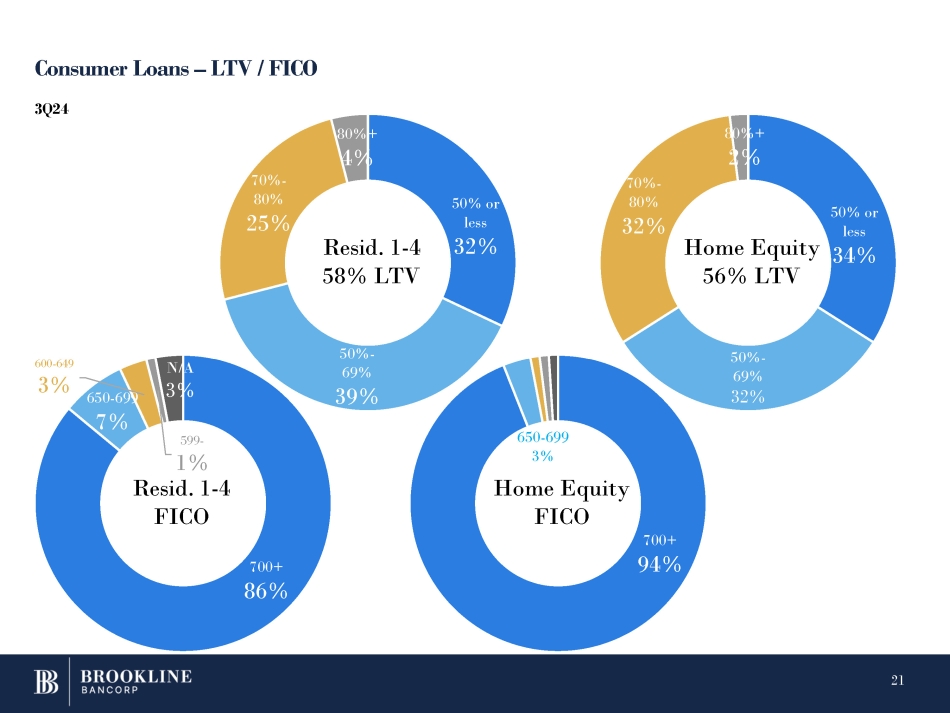
Consumer Loans – LTV / FICO 21 700+ 86% 650 - 699 7% 600 - 649 3% 599 - N/A 3% 50% or less 32% 50% - 69% 39% 70% - 80% 25% 80%+ 4% 700+ 94% 50% or less 50% - 69% 32% 70% - 80% 32% 80%+ 2% Resid. 1 - 4 58% LTV 1% Resid. 1 - 4 FICO 650 - 699 3% Home Equity FICO Home Equity 34% 56% LTV 3Q24

Well Diversified Deposit Base – 72% of Deposits are Insured* Consumer Deposits 52% (76% insured) Commercial Deposits 44% (61% insured) Municipal Deposits 4% * Insured includes deposits which are collateralized. Excludes brokered deposits which are 100% FDIC insured and have laddered maturities. 28% of Non Brokered Deposits Uninsured 22 3Q24
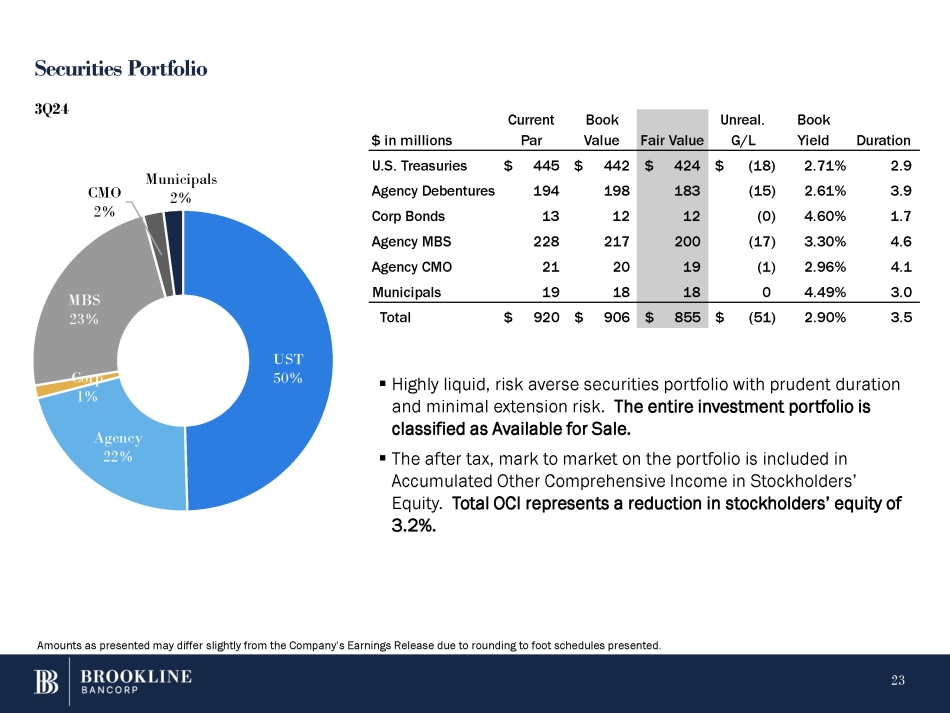
Securities Portfolio ▪ Highly liquid, risk averse securities portfolio with prudent duration and minimal extension risk. The entire investment portfolio is classified as Available for Sale. ▪ The after tax, mark to market on the portfolio is included in Accumulated Other Comprehensive Income in Stockholders’ Equity. Total OCI represents a reduction in stockholders’ equity of 3.2%. UST 50% 23 Agency 22% Corp 1% MBS 23% CMO 2% Municipals 2% 3Q24 Amounts as presented may differ slightly from the Company’s Earnings Release due to rounding to foot schedules presented. Duration Book Yield Unreal. G/L Fair Value Book Value Current Par $ in millions 2.9 2.71% $ (18) $ 424 $ 442 $ 445 U.S. Treasuries 3.9 2.61% (15) 183 198 194 Agency Debentures 1.7 4.60% (0) 12 12 13 Corp Bonds 4.6 3.30% (17) 200 217 228 Agency MBS 4.1 2.96% (1) 19 20 21 Agency CMO 3.0 4.49% 0 18 18 19 Municipals 3.5 2.90% $ (51) $ 855 $ 906 $ 920 Total
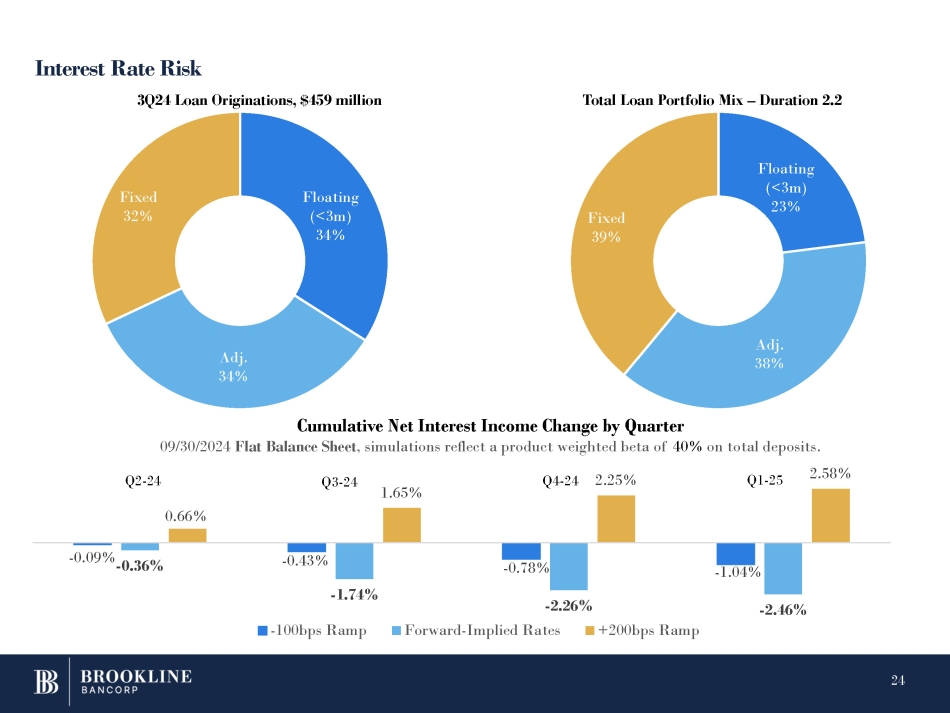
Interest Rate Risk Floating (<3m) 34% Adj. 34% Fixed 32% 3Q24 Loan Originations, $459 million Total Loan Portfolio Mix – Duration 2.2 - 0.43% - 0.78% - 1.04% - 0.09% - 0.36% - 1.74% - 2.46% 0.66% 2.25% - 2.26% Forward - Implied Rates 2.58% Cumulative Net Interest Income Change by Quarter 09/30/2024 Flat Balance Sheet , simulations reflect a product weighted beta of 40% on total deposits. - 100bps Ramp Q2 - 24 Q3 - 24 1.65% Q4 - 24 +200bps Ramp Q1 - 25 Floating (<3m) 23% 24 Adj. 38% Fixed 39%
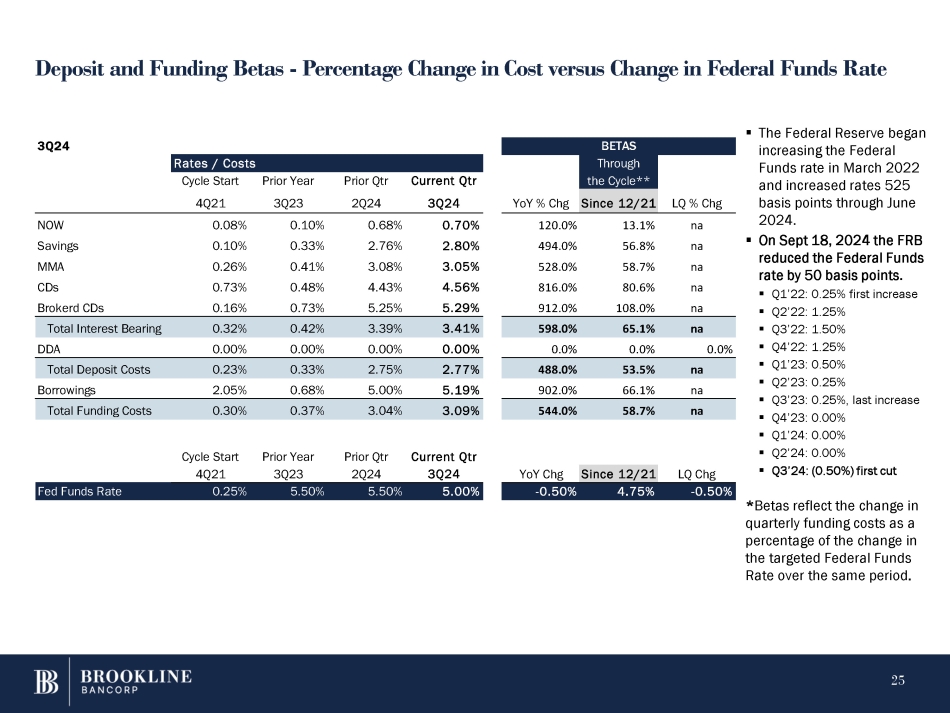
Deposit and Funding Betas - Percentage Change in Cost versus Change in Federal Funds Rate 25 ▪ The Federal Reserve began increasing the Federal Funds rate in March 2022 and increased rates 525 basis points through June 2024. ▪ On Sept 18 , 2024 the FRB reduced the Federal Funds rate by 50 basis points . ▪ Q1’22: 0.25% first increase ▪ Q2’22: 1.25% ▪ Q3’22: 1.50% ▪ Q4’22: 1.25% ▪ Q1’23: 0.50% ▪ Q2’23: 0.25% ▪ Q3’23: 0.25%, last increase ▪ Q4’23: 0.00% ▪ Q1’24: 0.00% ▪ Q2’24: 0.00% ▪ Q3’24: (0.50%) first cut *Betas reflect the change in quarterly funding costs as a percentage of the change in the targeted Federal Funds Rate over the same period. na 13.1% 120.0% 0.70% 0.68% 0.10% 0.08% NOW na 56.8% 494.0% 2.80% 2.76% 0.33% 0.10% Savings na 58.7% 528.0% 3.05% 3.08% 0.41% 0.26% MMA na 80.6% 816.0% 4.56% 4.43% 0.48% 0.73% CDs na 108.0% 912.0% 5.29% 5.25% 0.73% 0.16% Brokerd CDs na 65.1% 598.0% 3.41% 3.39% 0.42% 0.32% Total Interest Bearing 0.0% 0.0% 0.0% 0.00% 0.00% 0.00% 0.00% DDA na 53.5% 488.0% 2.77% 2.75% 0.33% 0.23% Total Deposit Costs na 66.1% 902.0% 5.19% 5.00% 0.68% 2.05% Borrowings na 58.7% 544.0% 3.09% 3.04% 0.37% 0.30% Total Funding Costs Current Qtr Prior Qtr Prior Year Cycle Start LQ Chg Since 12/21 YoY Chg 3Q24 2Q24 3Q23 4Q21 50% - 0.50% 4.75% - 0. 5.00% 5.50% 5.50% Fed Funds Rate 0.25% BETAS LQ % Chg Through the Cycle** YoY % Chg Since 12/21 3Q24 Rates / Costs Cycle Start 4Q21 Prior Year 3Q23 Prior Qtr 2Q24 Current Qtr 3Q24