Exhibit 99.2
January 30, 2025 1 4Q 2024 Financial Results
Forward Looking Statements 2 Certain statements contained in this press release that are not historical facts may constitute forward - looking statements within the meaning of Section 27A of the Securities Act of 1933, as amended, and Section 21E of the Securities Exchange Act of 1934, as amended, and are intended to be covered by the safe harbor provisions of the Private Securities Litigation Reform Act of 1995. We may also make forward - looking statements in other documents we file with the Securities and Exchange Commission ("SEC"), in our annual reports to shareholders, in press releases and other written materials, and in oral statements made by our officers, directors or employees. You can identify forward looking statements by the use of the words “believe,” “expect,” “anticipate,” “intend,” “estimate,” “assume,” “outlook,” “will,” “should,” and other expressions that predict or indicate future events and trends and which do not relate to historical matters, including statements regarding the Company’s business, credit quality, financial condition, liquidity and results of operations. Forward - looking statements may differ, possibly materially, from what is included in this press release due to factors and future developments that are uncertain and beyond the scope of the Company’s control. These include, but are not limited to, changes in interest rates; general economic conditions (including inflation and concerns about liquidity) on a national basis or in the local markets in which the Company operates; turbulence in the capital and debt markets; competitive pressures from other financial institutions; changes in consumer behavior due to changing political, business and economic conditions, or legislative or regulatory initiatives; changes in the value of securities and other assets in the Company’s investment portfolio; increases in loan and lease default and charge - off rates; the adequacy of allowances for loan and lease losses; failure to complete the proposed merger with Berkshire Hills Bancorp, Inc. (“Berkshire”) or unexpected delays related to the merger or either party’s inability to satisfy closing conditions required to complete the merger; failure to obtain necessary regulatory approvals (and the risk that such approvals may result in the imposition of conditions that could adversely affect the combined company or the expected benefits of the proposed merger); certain restrictions during the pendency of the proposed merger with Berkshire that may impact the Company’s ability to pursue certain business opportunities or strategic transactions; the diversion of management’s attention from ongoing business operations and opportunities; decreases in deposit levels that necessitate increases in borrowing to fund loans and investments; operational risks including, but not limited to, cybersecurity incidents, fraud, natural disasters, and future pandemics; changes in regulation; the possibility that future credit losses may be higher than currently expected due to changes in economic assumptions and adverse economic developments; the risk that goodwill and intangibles recorded in the Company’s financial statements will become impaired; and changes in assumptions used in making such forward - looking statements. Forward - looking statements involve risks and uncertainties which are difficult to predict. The Company’s actual results could differ materially from those projected in the forward - looking statements as a result of, among others, the risks outlined in the Company’s Annual Report on Form 10 - K, as updated by its Quarterly Reports on Form 10 - Q and other filings submitted to the SEC. The Company does not undertake any obligation to update any forward - looking statement to reflect circumstances or events that occur after the date the forward - looking statements are made.
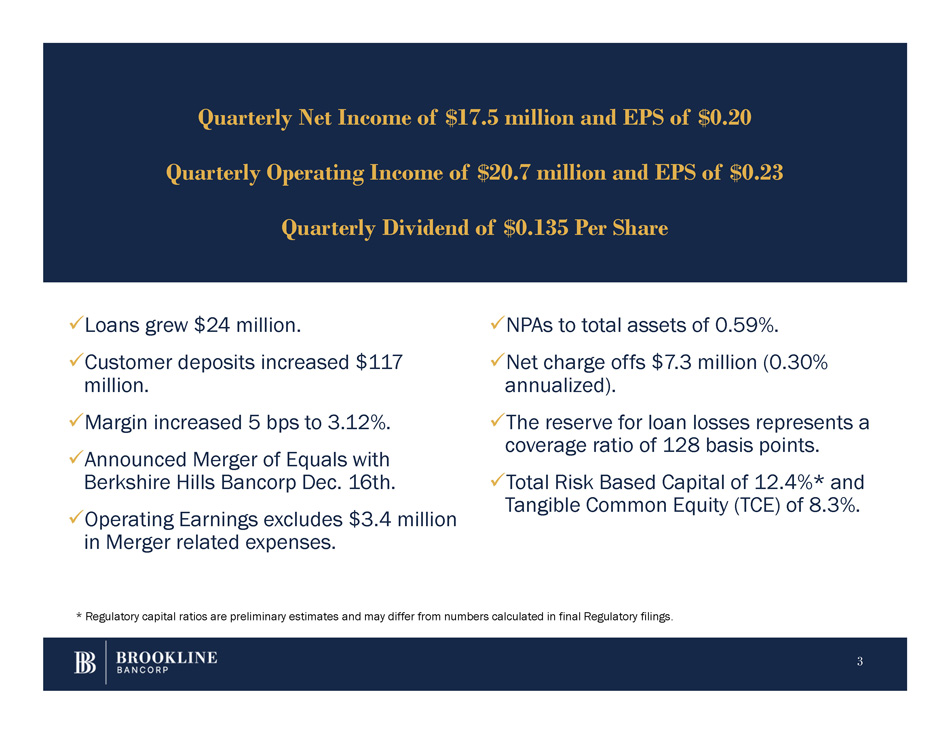
x Loans grew $24 million. x Customer deposits increased $117 million. x Margin increased 5 bps to 3.12%. x Announced Merger of Equals with Berkshire Hills Bancorp Dec. 16th. x Operating Earnings excludes $3.4 million in Merger related expenses. 3 x NPAs to total assets of 0.59%. x Net charge offs $7.3 million (0.30% annualized). x The reserve for loan losses represents a coverage ratio of 128 basis points. x Total Risk Based Capital of 12.4%* and Tangible Common Equity (TCE) of 8.3%. Quarterly Net Income of $17.5 million and EPS of $0.20 Quarterly Operating Income of $20.7 million and EPS of $0.23 Quarterly Dividend of $0.135 Per Share * Regulatory capital ratios are preliminary estimates and may differ from numbers calculated in final Regulatory filings.
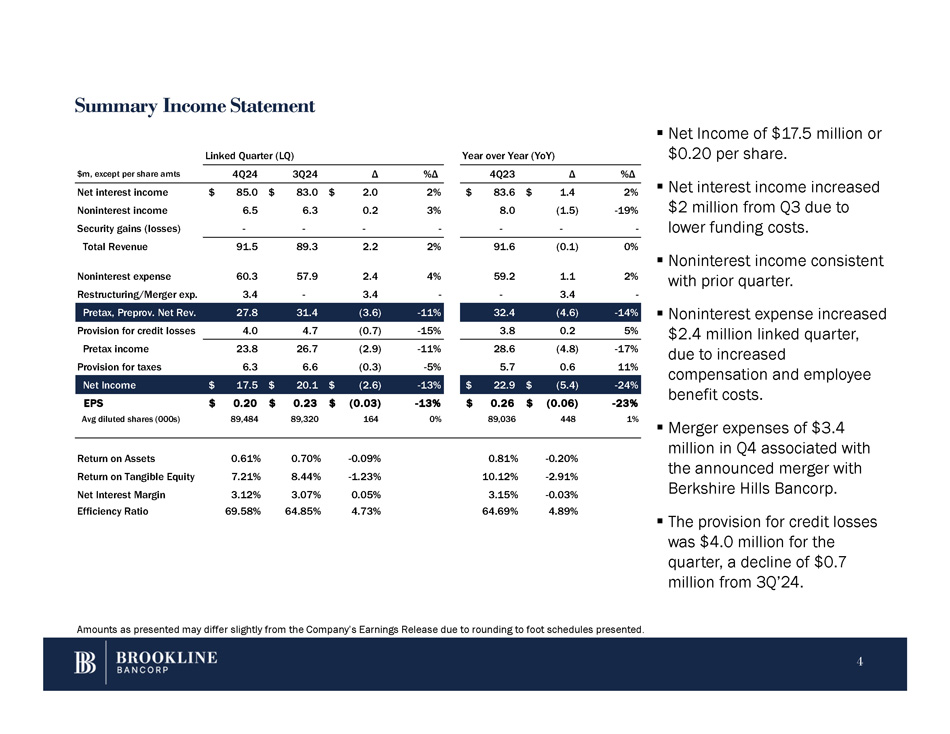
Summary Income Statement ▪ Net Income of $17.5 million or $0.20 per share. ▪ Net interest income increased $2 million from Q3 due to ▪ Noninterest income consistent with prior quarter. ▪ Noninterest expense increased $2.4 million linked quarter, due to increased compensation and employee benefit costs. ▪ Merger expenses of $3.4 million in Q4 associated with the announced merger with Berkshire Hills Bancorp. ▪ The provision for credit losses was $4.0 million for the quarter, a decline of $0.7 million from 3Q’24. lower funding costs. - - - - - - - Security gains (losses) 0% (0.1) 91.6 2% 2.2 89.3 91.5 Total Revenue 2% 1.1 59.2 4% 2.4 57.9 60.3 Noninterest expense - 3.4 - - 3.4 - 3.4 Restructuring/Merger exp. - 14% (4.6) 32.4 - 11% (3.6) 31.4 27.8 Pretax, Preprov. Net Rev. 5% 0.2 3.8 - 15% (0.7) 4.7 4.0 Provision for credit losses - 17% (4.8) 28.6 - 11% (2.9) 26.7 23.8 Pretax income 11% 0.6 5.7 - 5% (0.3) 6.6 6.3 Provision for taxes - 24% $ (5.4) $ 22.9 - 13% $ (2.6) $ 20.1 $ 17.5 Net Income - 23% $ (0.06) $ 0.26 - 13% $ (0.03) $ 0.23 $ 0.20 EPS 1% 448 89,036 0% 164 89,320 89,484 Avg diluted shares (000s) %Δ Δ 4Q23 %Δ Δ 3Q24 4Q24 $m, except per share amts 2% $ 1.4 $ 83.6 2% $ 2.0 $ 83.0 $ 85.0 Net interest income - 19% (1.5) 8.0 3% 0.2 6.3 6.5 Noninterest income - 0.20% 0.81% - 0.09% 0.70% 0.61% Return on Assets - 2.91% 10.12% - 1.23% 8.44% 7.21% Return on Tangible Equity - 0.03% 3.15% 0.05% 3.07% 3.12% Net Interest Margin 4.89% 64.69% 4.73% 64.85% 69.58% Efficiency Ratio Linked Quarter (LQ) Year over Year (YoY) Amounts as presented may differ slightly from the Company’s Earnings Release due to rounding to foot schedules presented. 4
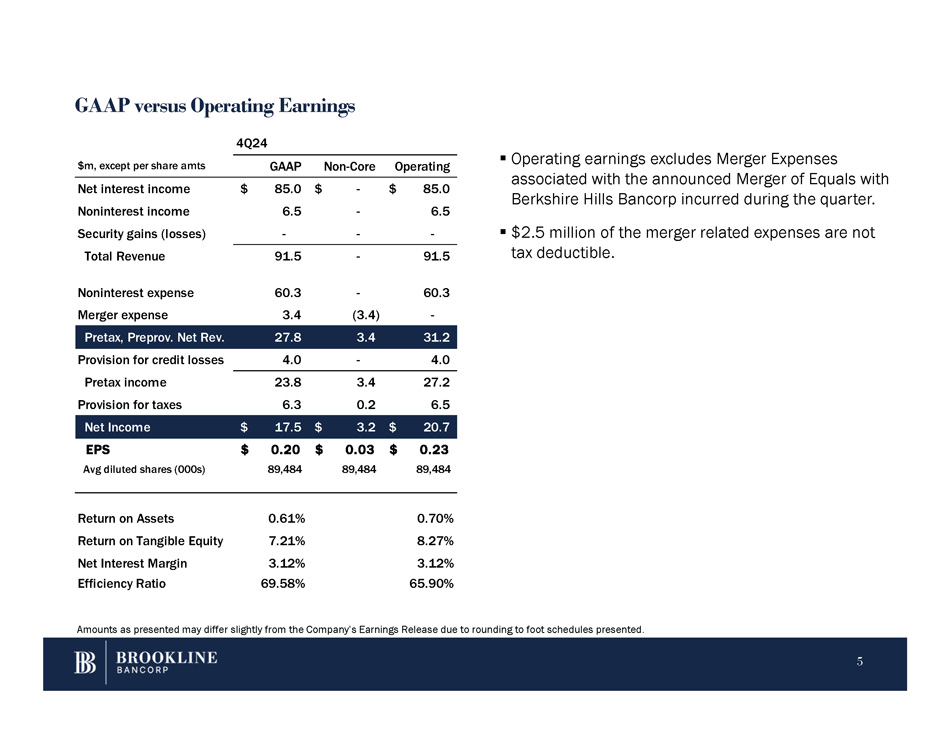
GAAP versus Operating Earnings ▪ Operating earnings excludes Merger Expenses associated with the announced Merger of Equals with Berkshire Hills Bancorp incurred during the quarter. ▪ $2.5 million of the merger related expenses are not tax deductible. Operating Non - Core GAAP $m, except per share amts $ 85.0 $ - $ 85.0 Net interest income 6.5 - 6.5 Noninterest income - - - Security gains (losses) 91.5 - 91.5 Total Revenue 60.3 - 60.3 Noninterest expense - (3.4) 3.4 Merger expense 31.2 3.4 27.8 Pretax, Preprov. Net Rev. 4.0 - 4.0 Provision for credit losses 27.2 3.4 23.8 Pretax income 6.5 0.2 6.3 Provision for taxes $ 20.7 $ 3.2 $ 17.5 Net Income $ 0.23 $ 0.03 $ 0.20 EPS 89,484 89,484 89,484 Avg diluted shares (000s) 0.70% 0.61% Return on Assets 8.27% 7.21% Return on Tangible Equity 3.12% 3.12% Net Interest Margin 65.90% 69.58% Efficiency Ratio 4Q24 Amounts as presented may differ slightly from the Company’s Earnings Release due to rounding to foot schedules presented. 5
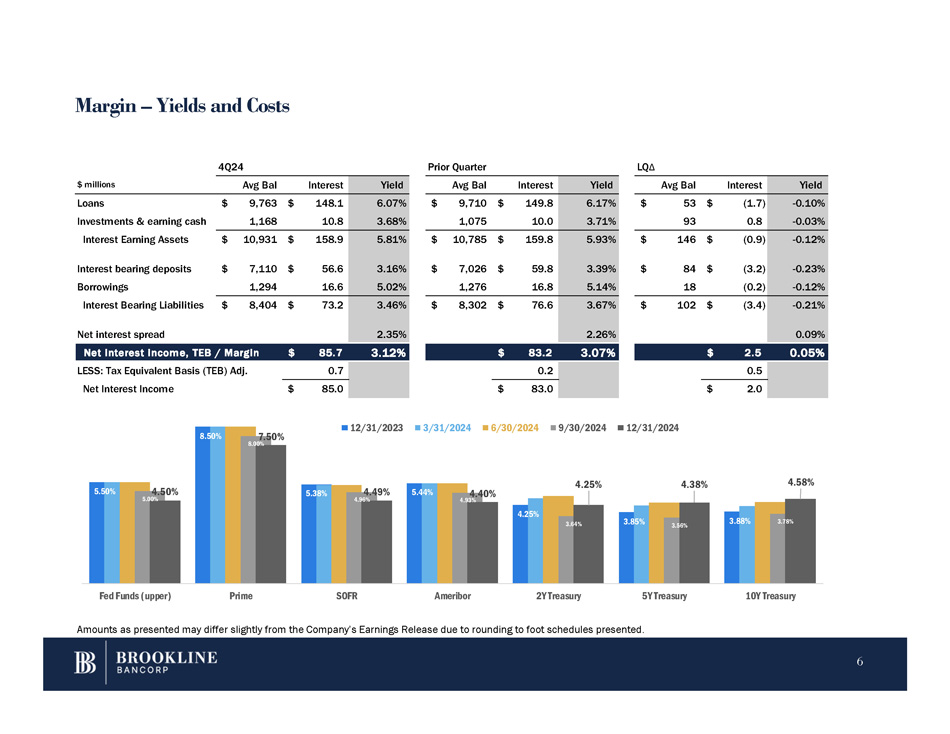
Margin – Yields and Costs LQ Δ Prior Quarter 4Q24 Yield Interest Avg Bal Yield Interest Avg Bal Yield Interest Avg Bal $ millions - 0.10% $ (1.7) $ 53 6.17% $ 149.8 $ 9,710 6.07% $ 148.1 $ 9,763 Loans - 0.03% 0.8 93 3.71% 10.0 1,075 3.68% 10.8 1,168 Investments & earning cash - 0.12% $ (0.9) $ 146 5.93% $ 159.8 $ 10,785 5.81% $ 158.9 $ 10,931 Interest Earning Assets - 0.23% $ (3.2) $ 84 3.39% $ 59.8 $ 7,026 3.16% $ 56.6 $ 7,110 Interest bearing deposits - 0.12% (0.2) 18 5.14% 16.8 1,276 5.02% 16.6 1,294 Borrowings - 0.21% $ (3.4) $ 102 3.67% $ 76.6 $ 8,302 3.46% $ 73.2 $ 8,404 Interest Bearing Liabilities 0.09% 2.26% 2.35% Net interest spread 0.05% $ 2.5 3.07% $ 83.2 3.12% $ 85.7 Net interest income, TEB / Margin 0.5 0.2 0.7 LESS: Tax Equivalent Basis (TEB) Adj. 2.0 $ 83.0 $ 85.0 $ Net Interest Income 5.50% 8.50% 5.38% 5.44% 4.25% 3.85% 3.88% 5.00% 8.00% 4.96% 4.93% 3.64% 3.56% 3.78% 4.50% 7.50% 4.49% 4.40% 4.25% 4.38% 4.58% Fed Funds (upper) Prime SOFR Ameribor 2Y Treasury 5Y Treasury 10Y Treasury 12/31/2023 3/31/2024 6/30/2024 9/30/2024 12/31/2024 Amounts as presented may differ slightly from the Company’s Earnings Release due to rounding to foot schedules presented. 6

Summary Balance Sheet ▪ Total assets increased $228 %Δ Δ 4Q23 Δ 3Q24 4Q24 $m, except per share amts driven by growth in cash and 1% $ 137 $ 9,642 $ 24 $ 9,755 $ 9,779 Gross Loans, investment equivalents and securities. 6% (7) (118) 2 (127) (125) Allowance for loan losses 1% 130 9,524 26 9,628 9,654 Net Loans million ▪ Loans increased $24 million. ▪ Securities increased $40 million, and Cash equivalents increased $136 million. ▪ The allowance for loan losses decreased $2 million. ▪ ALLL coverage of 1.28%. ▪ Deposits increased $170 million. ▪ Borrowings increased $22 million. ▪ Tangible Equity to Tangible Assets of 8.27%*. - 0.12% 8.39% - 0.23% 8.50% 8.27% Tang. Equity / Tang. Assets - 2.95% 112.80% - 1.87% 111.72% 109.85% Loans / Deposits 0.06% 1.22% - 0.03% 1.31% 1.28% ALLL / Gross Loans - 2% (21) 916 40 855 895 Securities 309% 411 133 136 408 544 Cash & equivalents - 3% (7) 265 (2) 260 258 Intangibles 2% 10 544 28 526 554 Other assets & Loans, HFS 5% 523 $ 11,382 $ 228 $ 11,677 $ 11,905 $ Total Assets 4% $ 354 $ 8,548 $ 170 $ 8,732 $ 8,902 Deposits 10% 143 1,377 22 1,498 1,520 Borrowings - 70% (14) 20 (1) 7 6 Reserve for unfunded loans 7% 17 238 46 209 255 Other Liabilities 5% 500 10,183 237 10,446 10,683 Total Liabilities 2% 23 1,199 (9) 1,231 1,222 Stockholders' Equity 5% $ 523 $ 11,382 $ 228 $ 11,677 $ 11,905 Total Liabilities & Equity 3% $ 0.31 $ 10.50 $ (0.08) $ 10.89 $ 10.81 TBV per share 0% 203 88,895 - 89,098 89,098 Actual shares outstanding (000) Linked Quarter (LQ) Year over Year (YoY) Amounts as presented may differ slightly from the Company’s Earnings Release due to rounding to foot schedules presented. *Reconciliation of Non - GAAP measures in Earnings Release. 7
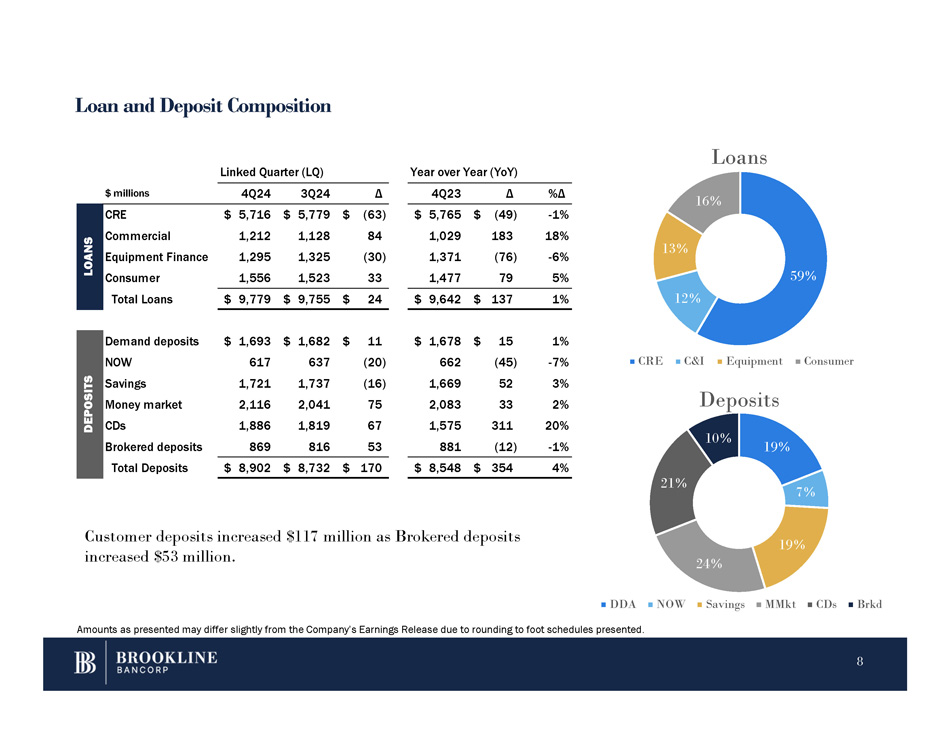
Loan and Deposit Composition 16% 13% 59% 12% Loans 19% 7% 19% 24% 21% 10% CRE C&I Equipment Consumer Deposits DDA NOW Savings MMkt CDs Brkd Amounts as presented may differ slightly from the Company’s Earnings Release due to rounding to foot schedules presented. %Δ Δ 4Q23 Δ 3Q24 4Q24 $ millions - 1% $ (49) $ 5,765 $ (63) $ 5,779 $ 5,716 CRE 18% 183 1,029 84 1,128 1,212 Commercial S - 6% (76) 1,371 (30) 1,325 1,295 Equipment Finance OA N 5% 79 1,477 33 1,523 1,556 Consumer L Total Loans $ 9,779 $ 9,755 $ 24 $ 9,642 $ 137 1% Demand deposits NOW Savings Money market CDs Brokered deposits Total Deposits $ 1,693 617 1,721 2,116 1,886 869 $ 1,682 $ 11 637 (20) 1,737 (16) 2,041 75 1,819 67 816 53 $ 1,678 $ 15 662 (45) 1,669 52 2,083 33 1,575 311 881 (12) 1% - 7% 3% 2% 20% - 1% $ 8,902 $ 8,732 $ 170 $ 8,548 $ 354 4% Linked Quarter (LQ) Year over Year (YoY) DEPOSITS Customer deposits increased $117 million as Brokered deposits increased $53 million. 8
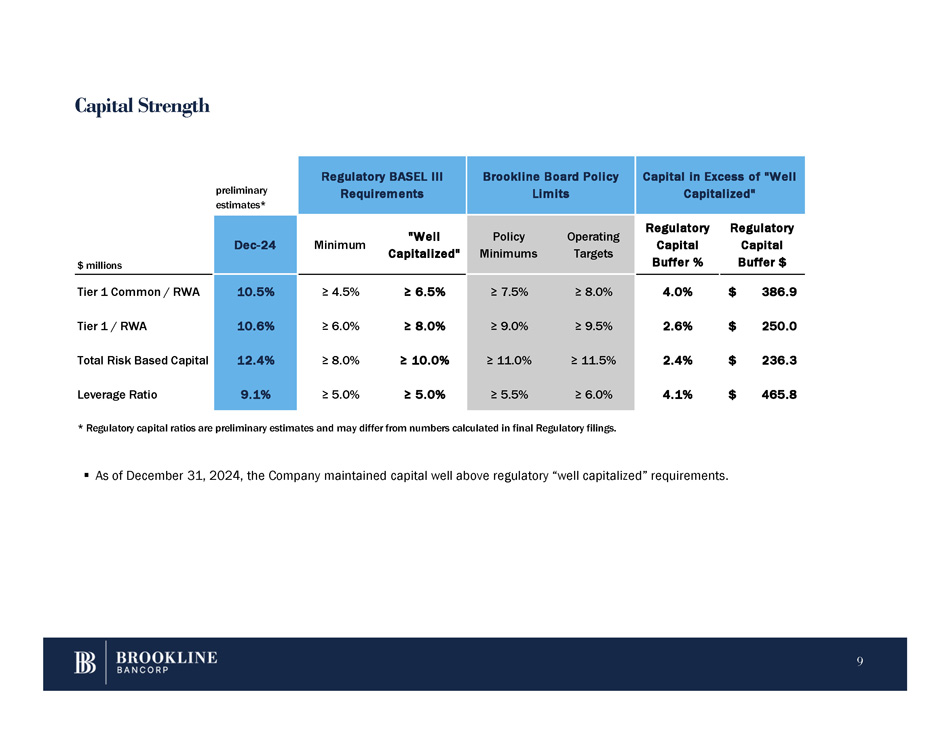
Capital Strength 9 ▪ As of December 31, 2024, the Company maintained capital well above regulatory “well capitalized” requirements. Capital in Excess of "Well Capitalized" Brookline Board Policy Limits Regulatory BASEL III Requirements preliminary estimates* Regulatory Capital Buffer $ Regulatory Capital Buffer % Operating Targets Policy Minimums "Well Capitalized" Minimum Dec - 24 $ millions $ 386.9 4.0% ≥ 8.0% ≥ 7.5% ≥ 6.5% ≥ 4.5% 10.5% Tier 1 Common / RWA $ 250.0 2.6% ≥ 9.5% ≥ 9.0% ≥ 8.0% ≥ 6.0% 10.6% Tier 1 / RWA $ 236.3 2.4% ≥ 11.5% ≥ 11.0% ≥ 10.0% ≥ 8.0% 12.4% Total Risk Based Capital $ 465.8 4.1% ≥ 6.0% ≥ 5.5% ≥ 5.0% ≥ 5.0% 9.1% Leverage Ratio * Regulatory capital ratios are preliminary estimates and may differ from numbers calculated in final Regulatory filings.
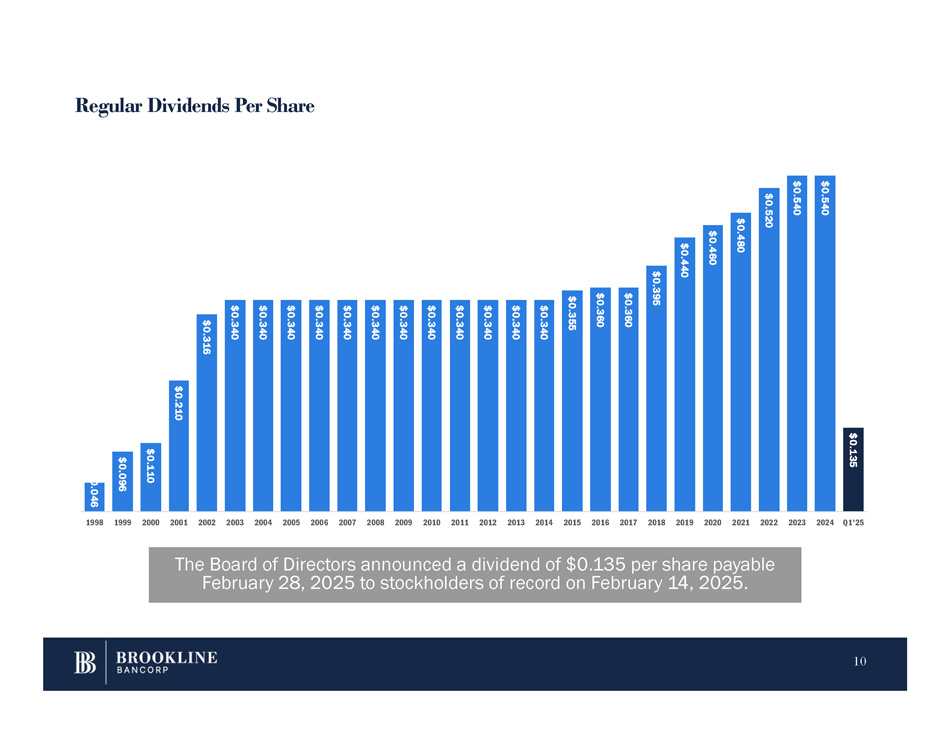
Regular Dividends Per Share The Board of Directors announced a dividend of $0.135 per share payable February 28, 2025 to stockholders of record on February 14, 2025. $0.046 10 $0.096 $0.110 $0.210 $0.316 $0.340 $0.340 $0.340 $0.340 $0.340 $0.340 $0.340 $0.340 $0.340 $0.340 $0.340 $0.340 $0.355 $0.360 $0.360 $0.395 $0.440 $0.460 $0.480 $0.520 $0.540 $0.540 $0.135 1998 1999 2000 2001 2002 2003 2004 2005 2006 2007 2008 2009 2010 2011 2012 2013 2014 2015 2016 2017 2018 2019 2020 2021 2022 2023 2024 Q1'25
QUESTIONS Paul A. Perrault, Chairman and Chief Executive Officer Carl M. Carlson, Co - President, Chief Financial and Strategy Officer Thank You. 11
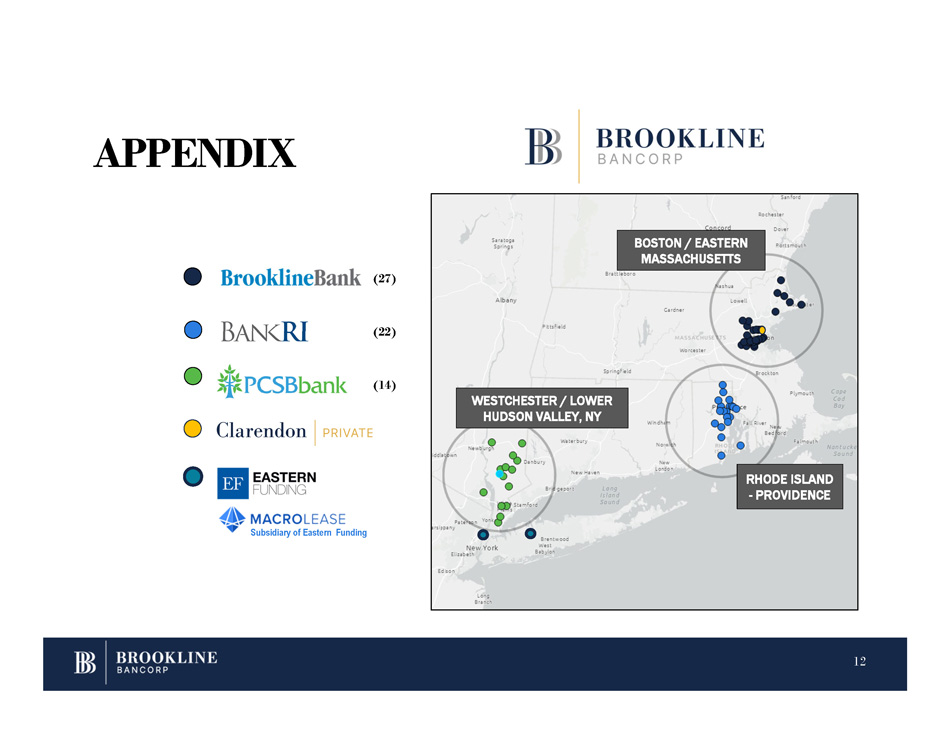
APPENDIX RHODE ISLAND - PROVIDENCE BOSTON / EASTERN MASSACHUSETTS (14) WESTCHESTER / LOWER HUDSON VALLEY, NY (27) (22) Subsidiary of Eastern Funding 12
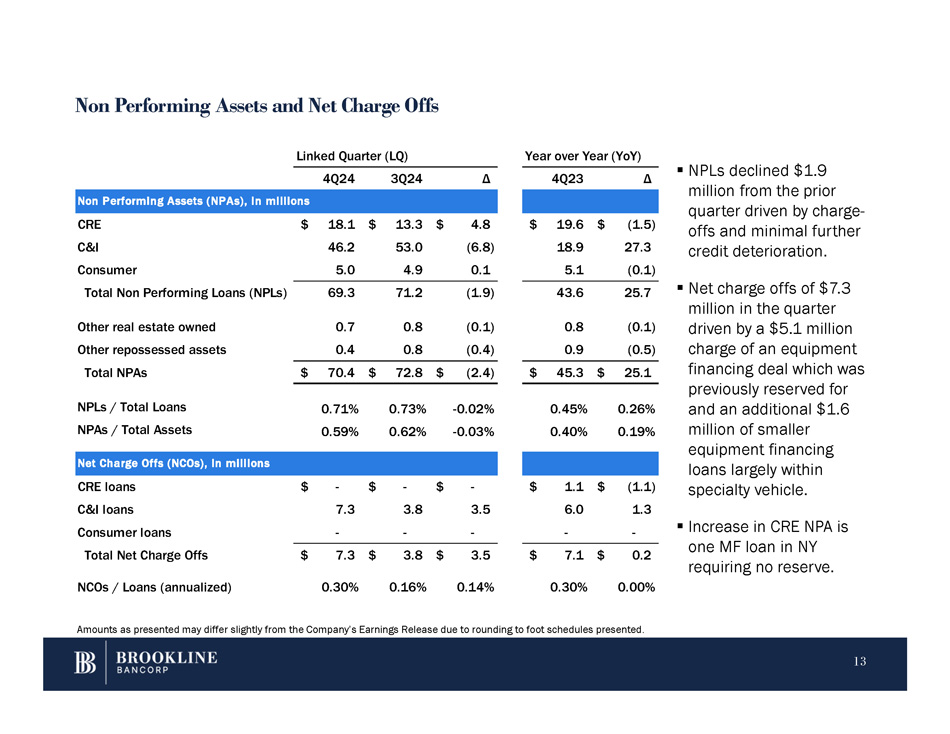
Non Performing Assets and Net Charge Offs Δ 4Q23 Δ 3Q24 4Q24 ons Non Performing Assets (NPAs), in milli $ (1.5) $ 19.6 $ 4.8 $ 13.3 $ 18.1 CRE 27.3 18.9 (6.8) 53.0 46.2 C&I (0.1) 5.1 0.1 4.9 5.0 Consumer 25.7 43.6 (1.9) 71.2 69.3 Total Non Performing Loans (NPLs) Net Charge Offs (NCOs), in millions $ (1.1) $ 1.1 $ - $ - $ - CRE loans 1.3 6.0 3.5 3.8 7.3 C&I loans - - - - - Consumer loans 0.2 $ 7.1 $ 3.5 $ 3.8 $ 7.3 $ Total Net Charge Offs Linked Quarter (LQ) Year over Year (YoY) Other real estate owned Other repossessed assets Total NPAs 0.7 0.4 0.8 0.8 (0.1) (0.4) 0.8 0.9 (0.1) (0.5) $ 70.4 $ 72.8 $ (2.4) $ 45.3 $ 25.1 NPLs / Total Loans NPAs / Total Assets 0.71% 0.59% 0.73% 0.62% - 0.02% - 0.03% 0.45% 0.40% 0.26% 0.19% NCOs / Loans (annualized) 0.30% 0.16% 0.14% 0.30% 0.00% Amounts as presented may differ slightly from the Company’s Earnings Release due to rounding to foot schedules presented. 13 ▪ NPLs declined $1.9 million from the prior quarter driven by charge - offs and minimal further credit deterioration. ▪ Net charge offs of $7.3 million in the quarter driven by a $5.1 million charge of an equipment financing deal which was previously reserved for and an additional $1.6 million of smaller equipment financing loans largely within specialty vehicle. ▪ Increase in CRE NPA is one MF loan in NY requiring no reserve.

Key Economic Variables - CECL Select Economic Variables from the Moody’s Baseline Forecasts ▪ The Company uses Moody’s forecasts as inputs into the models used to estimate credit losses under CECL. 14 ▪ The December 2024 Baseline economic forecast was slightly unfavorable to the September 2024 forecast: ▪ GDP – FAVORABLE ▪ Unemployment – Stable ▪ CRE Price Index – UNFAVORABLE ▪ We have modified our forecast weightings for 4Q’24: ▪ 35% Moderate Recession; neutral target of 30% ▪ 40% Baseline; neutral target of 40% ▪ 25% Stronger Near Term Growth; neutral target of 30% Stronger Near Term Growth (S1) Baseline Moderate Recession (S3) Weightings of Moody's Forecast for CECL Model 4Q 2024 35% 40% 25% 5% 45% 50% 3Q 2024 0% 40% 60% 2Q 2024 0% 40% 60% 1Q 2024 0% 40% 60% 4Q 2023 Change from Prior CURRENT: 4Q'24 Prior Quarter: Baseline Scenario 2026 2025 2026 2025 2026 2025 279 371 24,201 23,821 23,922 23,450 GDP 0.1 - 4.1 4.1 4.0 4.1 Unemployment Rate - (0.3) 3.4 4.1 3.4 4.4 Fed Fund Rate 0.2 0.1 4.3 4.3 4.1 4.2 10 Treasury (32.3) (21.1) 314.9 304.2 347.2 325.3 CRE Price Index
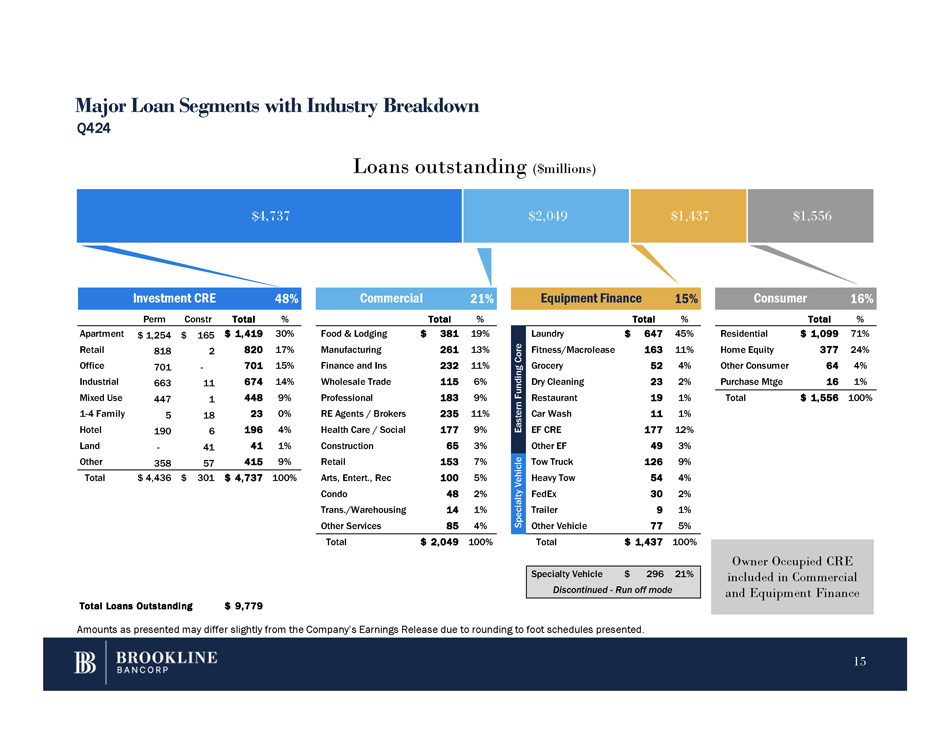
Investment CRE 48% Commercial 21% Equipment Finance 15% Consumer 16% Perm Constr Total % Total % Total % Total % Food & Lodging Manufacturing Finance and Ins Wholesale Trade Professional RE Agents / Brokers Health Care / Social Construction Retail Arts, Entert., Rec Condo Trans./Warehousing Other Services $ 381 19% 261 13% 232 11% 115 6% 183 9% 235 11% 177 9% 65 3% 153 7% 100 5% 48 2% 14 1% 85 4% Residential Home Equity Other Consumer Purchase Mtge $ 1,099 71% 377 24% 64 4% 16 1% - $ 1,254 $ 165 818 2 701 663 447 5 190 Apartment Retail Office Industrial Mixed Use 1 - 4 Family Hotel Land Other Total $ 1,556 100% - 358 11 1 18 6 41 57 $ 1,419 30% 820 17% 701 15% 674 14% 448 9% 23 0% 196 4% 41 1% 415 9% Total $ 4,436 $ 301 $ 4,737 100% Total $ 2,049 100% Total $ 1,437 100% 45% $ 647 Laundry Eastern Funding Core 11% 163 Fitness/Macrolease 4% 52 Grocery 2% 23 Dry Cleaning 1% 19 Restaurant 1% 11 Car Wash 12% 177 EF CRE 3% 49 Other EF 9% 126 Tow Truck Specialty Vehicle 4% 54 Heavy Tow 2% 30 FedEx 1% 9 Trailer 5% 77 Other Vehicle Specialty Vehicle $ 296 21% Discontinued - Run off mode Total Loans Outstanding $ 9,779 Amounts as presented may differ slightly from the Company’s Earnings Release due to rounding to foot schedules presented. Major Loan Segments with Industry Breakdown Q424 $4,737 $2,049 $1,437 $1,556 Loans outstanding ($millions) Owner Occupied CRE included in Commercial and Equipment Finance 15
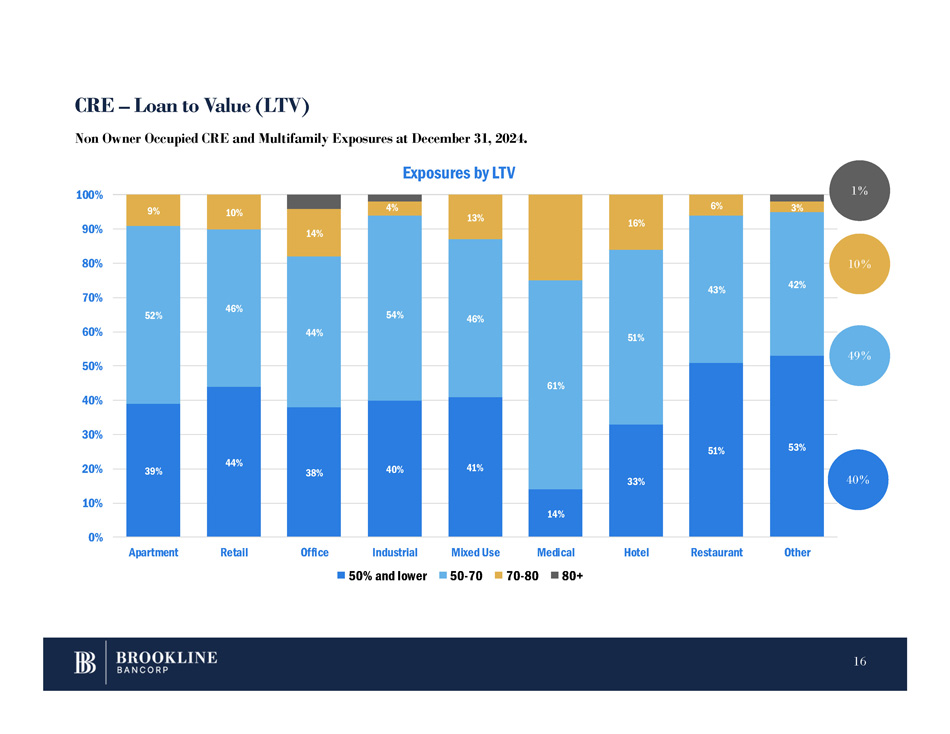
CRE – Loan to Value (LTV) 39% 44% 38% 40% 41% 14% 33% 51% 53% 52% 46% 44% 54% 46% 61% 51% 43% 42% 9% 10% 14% 4% 13% 16% 6% 3% 0% 10% 20% 30% 40% 50% 60% 70% 80% 90% 100% Apartment Retail Office Industrial 50% and lower Mixed Use 50 - 70 Medical Hotel Restaurant Other Non Owner Occupied CRE and Multifamily Exposures at December 31, 2024. Exposures by LTV 70 - 80 80+ 40% 49% 1% 10% 16
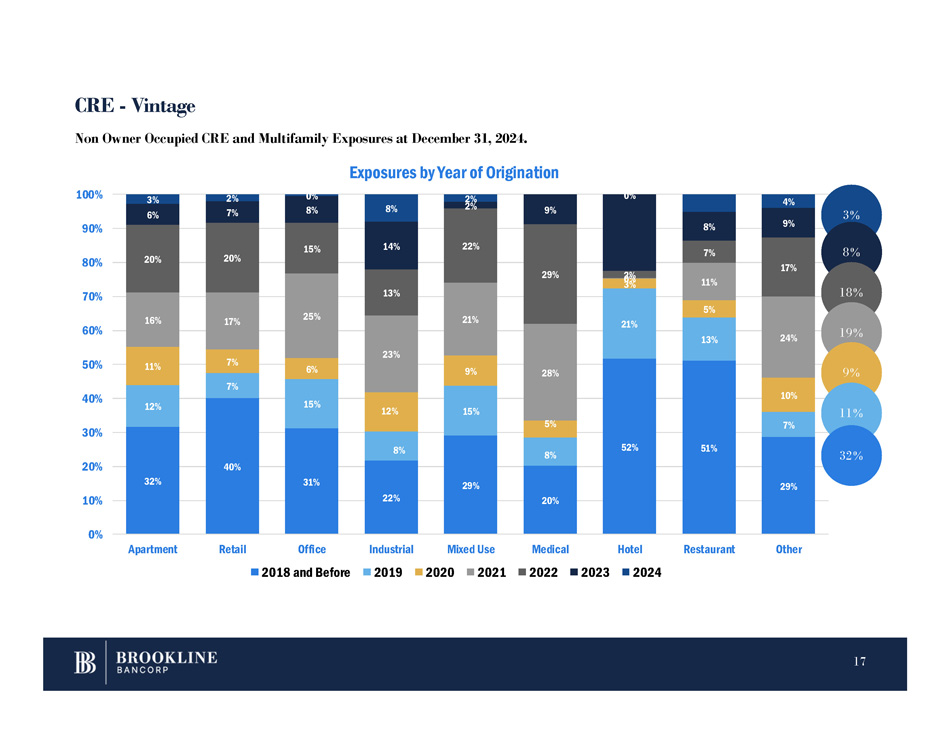
32% 40% 31% 22% 29% 20% 52% 51% 29% 12% 7% 15% 8% 15% 8% 21% 13% 7% 11% 7% 6% 12% 9% 5% 3% 5% 10% 16% 17% 25% 23% 21% 28% 11% 24% 20% 20% 15% 13% 22% 29% 0 2% 7% 17% 6% 7% 14% 2% 9% 8% 9% 0% 8% 3% 2% 8% 2% 0% 4% 0% 10% 20% 30% 40% 50% 60% 70% 80% 90% 100% Apartment Retail Office 2018 and Before Restaurant Other Non Owner Occupied CRE and Multifamily Exposures at December 31, 2024. Exposures by Year of Origination Industrial Mixed Use Medical Hotel 2019 2020 2021 2022 2023 2024 3 % CRE - Vintage 8 % 18 % 19 % 9 % 11 % 32 % 17
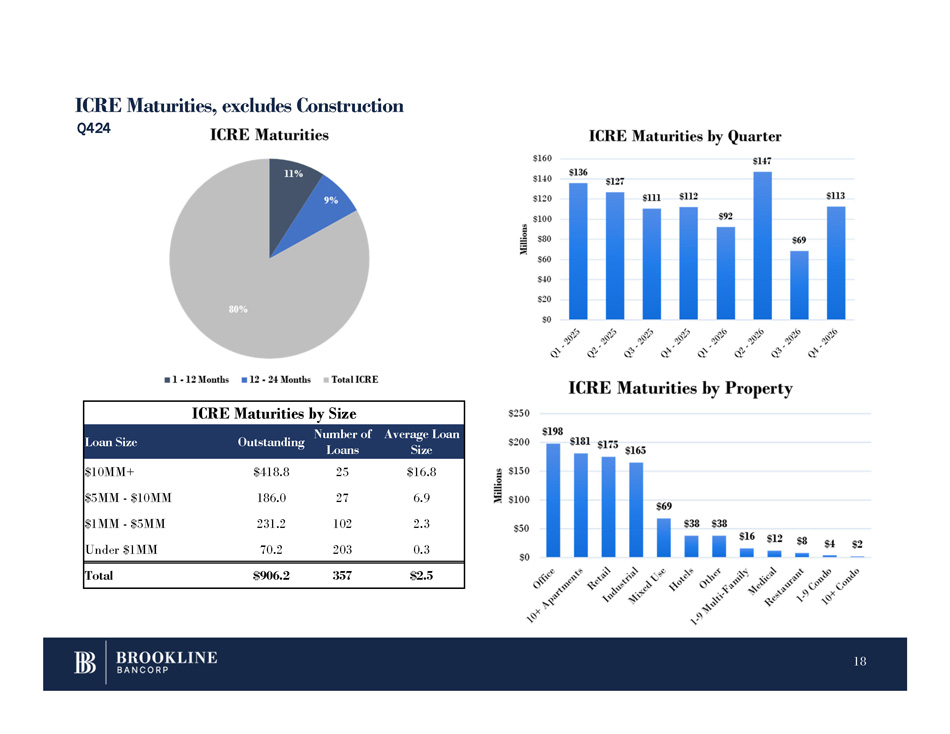
ICRE Maturities, excludes Construction Q424 ICRE Maturities by Size Average Loan Size Number of Loans Outstanding Loan Size $16.8 25 $418.8 $10MM+ 6.9 27 186.0 $5MM - $10MM 2.3 102 231.2 $1MM - $5MM 0.3 203 70.2 Under $1MM $2.5 357 $906.2 Total 18

Office Maturities, excludes Construction Office Maturities by Submarket Average Loan Size Number of Loans Outstanding Bank $7.5 20 150.3 Brookline Bank 5.7 10 56.9 Boston 4.8 10 47.5 Inside 128 5.1 9 45.9 Other BBK 2.2 22 47.7 Bank Rhode Island 2.2 15 33.4 Providence Cranston Pawtucket 2.0 7 14.3 Other BARI 0.1 2 0.2 PCSB 0.2 1 0.2 NY 0.0 1 0.0 Other PCSB $4.5 44 $198.2 Total Office Maturities - Asset Quality Average LTV Average DSC Average Loan Size Outstanding Loan Size 50% 1.56x $3.7 $187.2 Core 175% 0.42x 5.5 11.0 Criticized + Classified 57% 1.49x $3.7 $198.2 Total Q424 ▪ 28% ($198MM) of the Bank’s Office portfolio is maturing before 12/31/2026, 94% of which is Pass rated. Maturities are staggered in the next 24 months, with $105MM (53%) maturing in FY 2025. ▪ The Criticized + Classified population consists of only two loans : One $ 10 . 8 MM Boston CBD (core business district) exposure and one $ 200 K New Rochelle, NY exposure . ▪ After nearly a year of negotiations with the Sponsor and participant bank, the Boston CBD office building securing the $10.8MM Classified loan is in negotiations to be sold in an arm’s - length - transaction at approximately $170 PSF. Buyer is a well - known developer in the Boston area with a successful track record of office - to - residential conversions. ▪ Overall, the portfolio has continued to perform relatively well with no meaningful deterioration during the quarter . The portfolio maintains a 90 % overall Pass rating . 19

Multi - Family Maturities, excludes Construction Multi - Family Maturities - Asset Quality Average DSC Average LTV Average Loan Size Outstanding Loan Size 51% 2.05x $1.7 $192.0 Core 72% 0.92x 5.1 15.3 Criticized + Classified 53% 1.97x $1.8 $207.4 Total Q424 ▪ 15% ($207MM) of the multi - family portfolio matures before 12/31/2026. 94% of the population is Pass rated, ▪ The maturing Criticized + Classified population is comprised of three loans: ― One $1MM loan to a 30 - unit apartment building in the Bronx, NY. ― Two related construction projects totaling $14.3MM for development of low income and affordable housing complexes in Wareham, MA. Currently in their stabilization phases and awaiting permanent financing from MassHousing. ▪ The vast majority (84%) of maturities are large Class B multi - family properties, followed by small multi - family properties (8%). ▪ The portfolio has performed strongly and remains healthy, as evidenced by a 97% overall Pass rating. 20
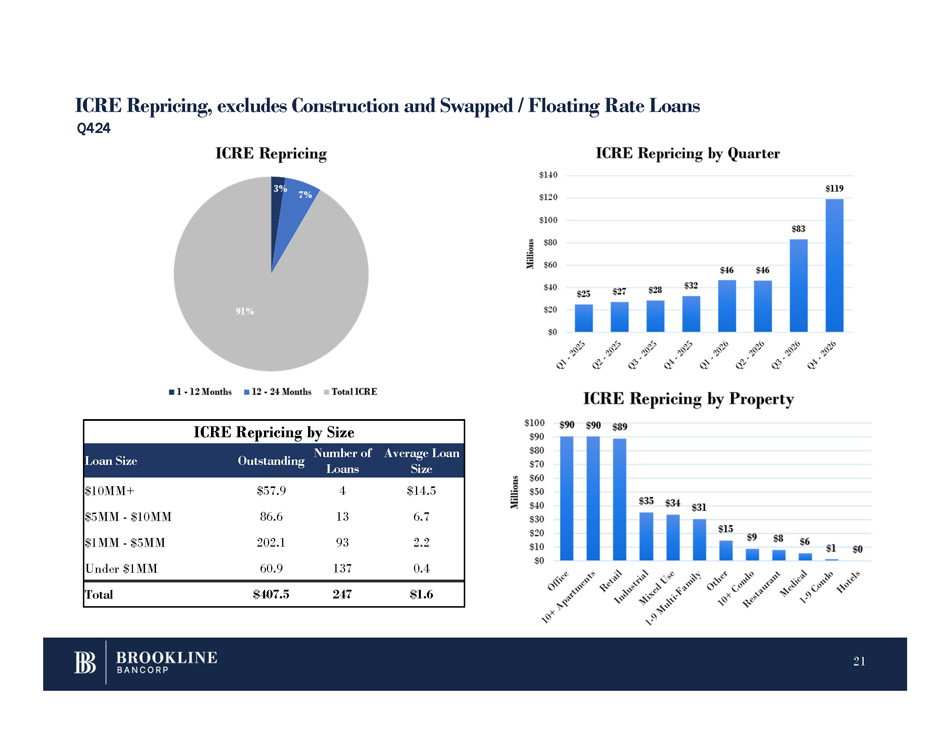
ICRE Repricing, excludes Construction and Swapped / Floating Rate Loans Q424 ICRE Repricing by Size Average Loan Size Number of Loans Outstanding Loan Size $14.5 4 $57.9 $10MM+ 6.7 13 86.6 $5MM - $10MM 2.2 93 202.1 $1MM - $5MM 0.4 137 60.9 Under $1MM $1.6 247 $407.5 Total 21
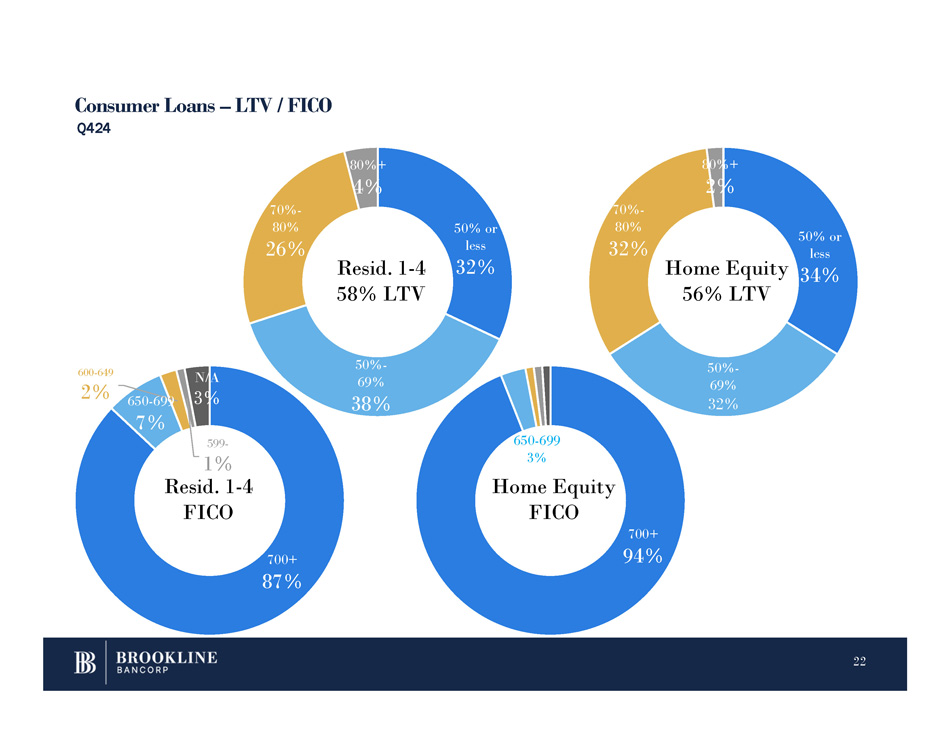
Consumer Loans – LTV / FICO Q424 22 700+ 87% 650 - 699 7% 600 - 649 2% 599 - N/A 3% 50% or less 32% 50% - 69% 38% 70% - 80% 26% 80%+ 4% 700+ 94% 50% or less 50% - 69% 32% 70% - 80% 32% 80%+ 2% Resid. 1 - 4 58% LTV 1% Resid. 1 - 4 FICO 650 - 699 3% Home Equity FICO Home Equity 34% 56% LTV
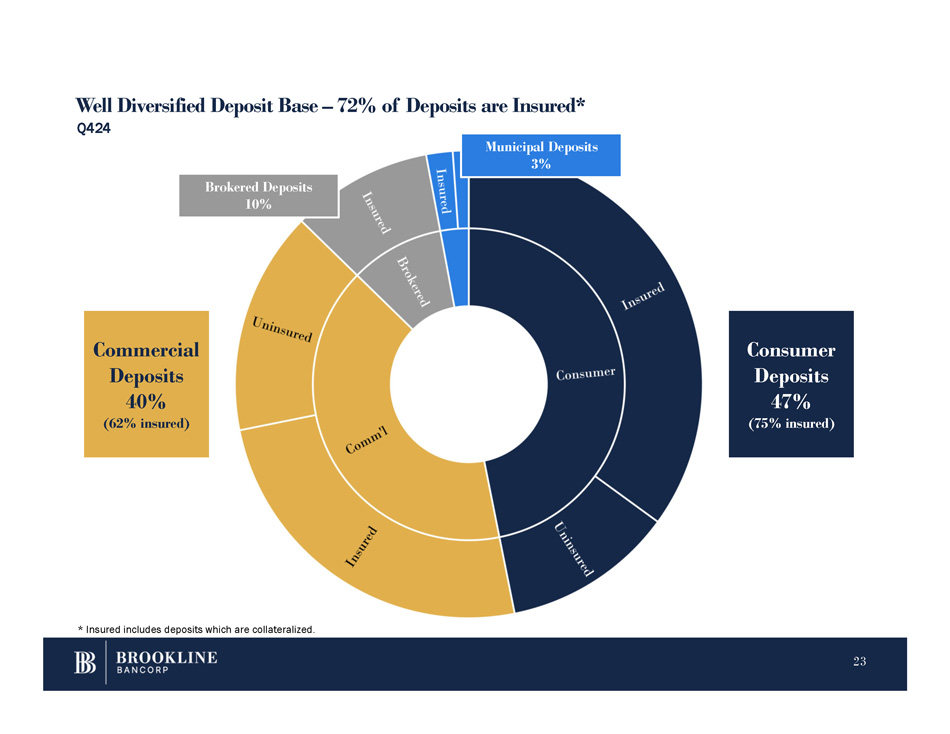
Well Diversified Deposit Base – 72% of Deposits are Insured* Consumer Deposits 47% (75% insured) Commercial Deposits 40% (62% insured) * Insured includes deposits which are collateralized. Q424 Municipal Deposits 3% Brokered Deposits 10% 23
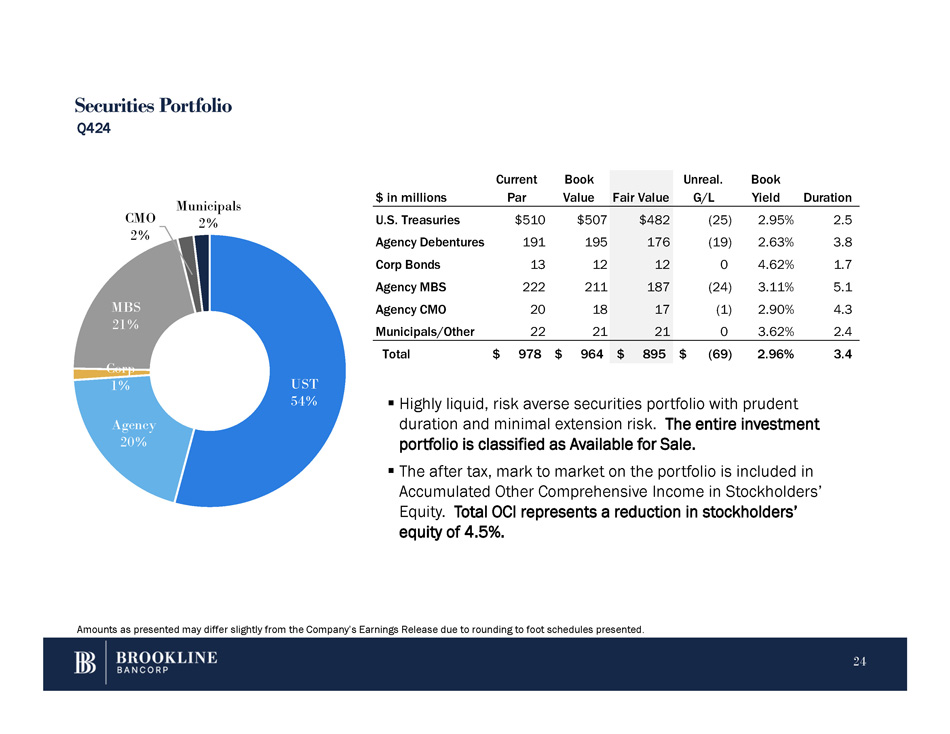
Securities Portfolio Q424 ▪ Highly liquid, risk averse securities portfolio with prudent duration and minimal extension risk. The entire investment portfolio is classified as Available for Sale. ▪ The after tax, mark to market on the portfolio is included in Accumulated Other Comprehensive Income in Stockholders’ Equity. Total OCI represents a reduction in stockholders’ equity of 4.5%. UST 54% 24 Agency 20% Corp 1% MBS 21% CMO 2% Municipals 2% Amounts as presented may differ slightly from the Company’s Earnings Release due to rounding to foot schedules presented. Duration Book Yield Unreal. G/L Fair Value Book Value Current Par $ in millions 2.5 2.95% (25) $482 $507 $510 U.S. Treasuries 3.8 2.63% (19) 176 195 191 Agency Debentures 1.7 4.62% 0 12 12 13 Corp Bonds 5.1 3.11% (24) 187 211 222 Agency MBS 4.3 2.90% (1) 17 18 20 Agency CMO 2.4 3.62% 0 21 21 22 Municipals/Other 3.4 2.96% $ (69) $ 895 $ 964 $ 978 Total
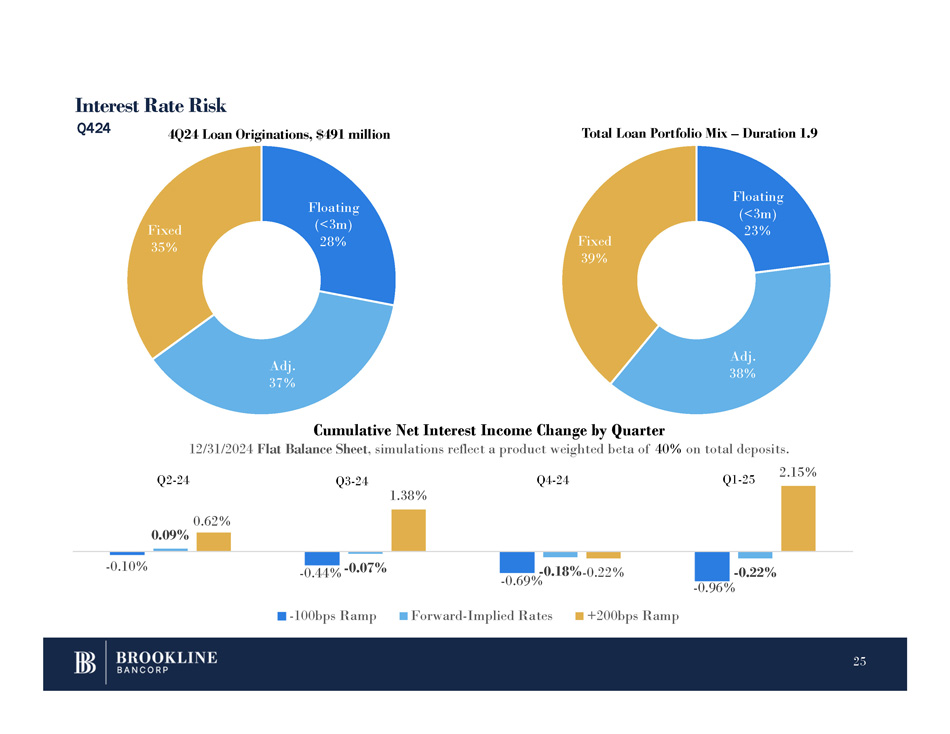
Interest Rate Risk Floating (<3m) 28% Adj. 37% Fixed 35% 4Q24 Loan Originations, $491 million Total Loan Portfolio Mix – Duration 1.9 - 0.10% - 0.69% - 0.44% - 0.07% - 0.22% - 0.96% 0.62% 0.09% - 0.18% - 0.22% 2.15% Cumulative Net Interest Income Change by Quarter 12/31/2024 Flat Balance Sheet , simulations reflect a product weighted beta of 40% on total deposits. - 100bps Ramp Forward - Implied Rates +200bps Ramp Q1 - 25 Q2 - 24 Q3 - 24 Q4 - 24 1.38% Floating (<3m) 23% 25 Adj. 38% Fixed 39% Q424
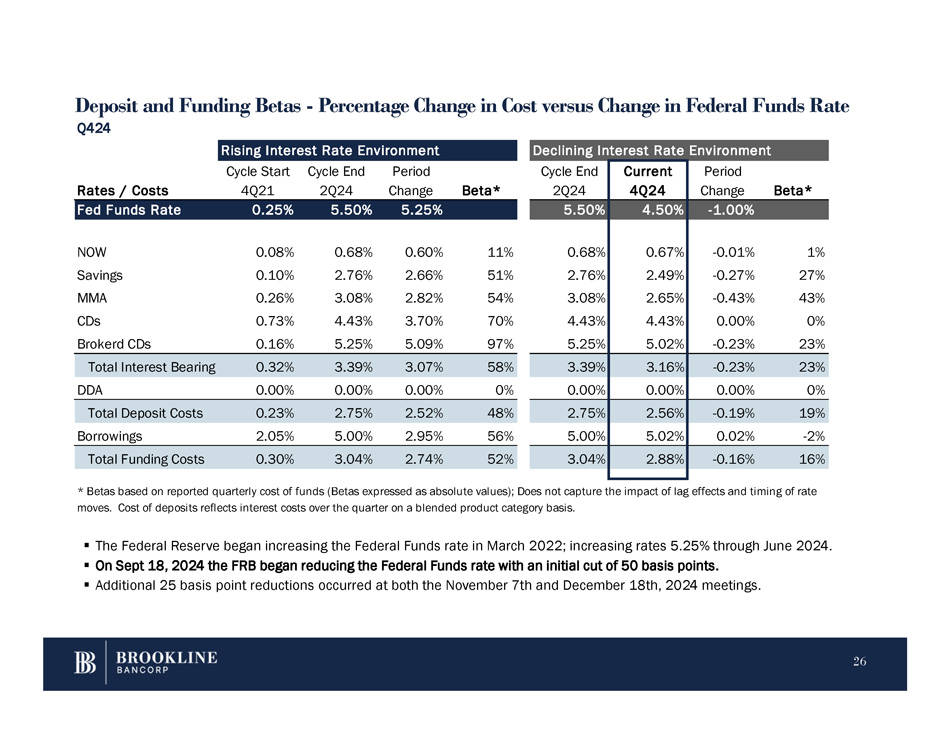
Deposit and Funding Betas - Percentage Change in Cost versus Change in Federal Funds Rate Q424 26 Rising Interest Rate Environment Beta* Period Change Cycle End 2Q24 Cycle Start 4Q21 Rates / Costs 5.25% 5.50% 0.25% Fed Funds Rate 11% 0.60% 0.68% 0.08% NOW 51% 2.66% 2.76% 0.10% Savings 54% 2.82% 3.08% 0.26% MMA 70% 3.70% 4.43% 0.73% CDs 97% 5.09% 5.25% 0.16% Brokerd CDs 58% 3.07% 3.39% 0.32% Total Interest Bearing 0% 0.00% 0.00% 0.00% DDA 48% 2.52% 2.75% 0.23% Total Deposit Costs 56% 2.95% 5.00% 2.05% Borrowings 52% 2.74% 3.04% 0.30% Total Funding Costs Declining Interest Rate Environment Beta* Period Change Current 4Q24 Cycle End 2Q24 - 1.00% 4.50% 5.50% 1% - 0.01% 0.67% 0.68% 27% - 0.27% 2.49% 2.76% 43% - 0.43% 2.65% 3.08% 0% 0.00% 4.43% 4.43% 23% - 0.23% 5.02% 5.25% 23% - 0.23% 3.16% 3.39% 0% 0.00% 0.00% 0.00% 19% - 0.19% 2.56% 2.75% - 2% 0.02% 5.02% 5.00% 16% - 0.16% 2.88% 3.04% * Betas based on reported quarterly cost of funds (Betas expressed as absolute values); Does not capture the impact of lag effects and timing of rate moves. Cost of deposits reflects interest costs over the quarter on a blended product category basis. ▪ The Federal Reserve began increasing the Federal Funds rate in March 2022; increasing rates 5.25% through June 2024. ▪ On Sept 18, 2024 the FRB began reducing the Federal Funds rate with an initial cut of 50 basis points. ▪ Additional 25 basis point reductions occurred at both the November 7th and December 18th, 2024 meetings.