UNITED STATES
SECURITIES AND EXCHANGE COMMISSION
Washington, D.C. 20549
FORM 10-K
ANNUAL REPORT PURSUANT TO SECTION 13 OR 15(d) OF THE
SECURITIES EXCHANGE ACT OF 1934
For the Fiscal Year ended June 30, 2007
Commission file number 0-1388
ZAREBA SYSTEMS, INC.
State of Incorporation: Minnesota
IRS Employer Identification No. 41-0832194
13705 26th Avenue N., Suite 102, Minneapolis, MN 55441 (763) 551-1125
Securities registered pursuant to Section 12(b) of the Act:
Common Stock, $0.01 par value per share, registered on the Nasdaq Capital Market
Series A Preferred Stock Purchase Rights Pursuant to Rights Agreement
Indicate by check mark if the registrant is a well-known seasoned issuer, as defined in Rule 405 of the Securities Act. Yeso Noþ
Indicate by check mark if the registrant is not required to file reports pursuant to Section 13 or Section 15(d) of the Act. Yeso Noþ
Indicate by check mark whether the issuer (1) filed all reports required to be filed by Section 13 or 15(d) of the Securities Exchange Act of 1934 during the past 12 months (or for such shorter period that the registrant was required to file such reports), and (2) has been subject to such filing requirements for the past 90 days. Yesþ Noo
Indicate by check mark if disclosure of delinquent filers pursuant to Item 405 of Regulation S-K (§229.405 of this chapter) is not contained herein, and will not be contained, to the best of registrant’s knowledge, in definitive proxy or information statements incorporated by reference in Part III of this Form 10-K or any amendment to this Form 10-K.þ
Indicate by check mark whether the Registrant is a large accelerated filer, an accelerated filer or a non-accelerated filer. See definition of “accelerated filer and large accelerated filer” in Rule 12b-2 of the Exchange Act.
Large Accelerated Filer o Accelerated Filer o Non-accelerated Filer þ
Indicate by check mark whether the registrant is a shell company (as defined in Rule 12b-2 of the Exchange Act). Yeso Noþ
The aggregate market value of the voting and non-voting common equity held by non-affiliates computed by reference to the price at which the common equity was last sold, as of the last day of the Company’s most recently completed second fiscal quarter was $7,129,000.
The number of shares outstanding of the Company’s Common Stock on September 5, 2007 was 2,452,291.
DOCUMENTS INCORPORATED BY REFERENCE
None.
PART I
Item 1. Business
A. Business Development
Zareba Systems, Inc. (“Zareba”, “Zareba Systems” or the “Company”) designs, manufactures and markets electronic perimeter fence and access control systems, operating in one world-wide business segment. Zareba has three subsidiaries, Zareba Systems Europe Limited, Zareba Security, Inc. and Zareba Systems of Canada LTD. The Company was incorporated in Minnesota in 1960.
On September 27, 2004, through its newly formed subsidiary, Zareba Systems Europe Limited (Zareba Systems Europe), Zareba acquired Rutland Electric Fencing Company Ltd. (Rutland), a manufacturer and distributor of electronic fencing equipment located in Oakham, United Kingdom (U.K.) pursuant to a stock purchase agreement. Under the stock purchase agreement, Zareba purchased all of the issued and outstanding share capital for a purchase price of approximately $10.4 million, or approximately $8.5 million net of cash acquired. The transaction was funded with bank debt and cash. This acquisition has strengthened our product offerings in both the security and electronic perimeter fence markets.
Under the brand names Rutland Electric Fencing, Electric Shepherd®, and Induced Pulse® (IP), products include insulators, fence energizers, high tensile fencing, polypropylene (poly) wire, rope and tape and security fencing. Zareba Systems Europe has 48 employees and annual sales of approximately $9.7 million. Zareba Systems Europe continues the former Rutland operations in its existing Oakham, England and Brechin, Scotland facilities. The acquisition of Rutland allowed Zareba to gain an entry into the UK, Europe, and the Middle East markets, as well as expand distribution of Rutland Electric Fencing products in the U.S.
On May 1, 2006, Zareba Security Inc. was established as a wholly-owned subsidiary of Zareba for the purpose of separating the security product line from the Company’s other product lines.
On August 6, 2001, Zareba purchased all outstanding shares of North Central Plastics, Incorporated (NCP) pursuant to a stock purchase agreement. The acquisition was partially funded with new bank debt.
Under the brand name Red Snap’r®, North Central Plastic’s products included insulators, fence energizers, high tensile fencing, polypropylene (poly) wire, rope and tape and accessories. The acquisition of NCP allowed Zareba to consolidate operations in NCP’s 64,000 square foot facility located in Ellendale, Minnesota, and to further expand its distribution in the U.S., Canada, Mexico, Central and South America, Europe and New Zealand.
At June 30, 2007, the Company substantially completed negotiation of the sale of the Company’s Waters Medical Systems, Inc., (WMS) subsidiary to a third party. The WMS subsidiary, a provider of medical products was initially formed on June 30, 2005, when all the assets of the WMS division of Zareba were transferred to the newly-formed subsidiary, and has operated in a separate business segment of the Company. With the impending sale, subsequently completed on August 1, 2007, all results of operations and assets and liabilities of WMS for all periods presented have been restated and classified as discontinued operations, and the Company now operates in one business segment. All references to the business are based on results of operations from continuing operations. The sale of WMS, completed subsequent to fiscal 2007 year end, was for $5 million cash, resulting in a pre-tax gain of approximately $4 million to be reported in the Company’s first quarter fiscal 2008 results. Cash proceeds from the sale were used to reduce borrowing under the Company’s existing credit facility.
B. Business of Issuer
Zareba Systems designs, manufactures and sells electronic perimeter fence and access control systems in both North America and the United Kingdom. These products are used for the control, containment and deterrent of everything from humans (in the case of terrorists or prison inmates in security applications) to horses, livestock, and lawn and garden applications (in the growing hobby farm market). An electronic perimeter fence system consists of an alternating current (also referred to as “AC”), direct current (also referred to as “DC”) or solar energizer insulators for the fence posts, poly wire, tape and rope, and a wide range of hardware and accessories. Automatic gate openers are incorporated as a means to open gates safely from a distance, such as from a vehicle.
3
In North America, Zareba Systems primarily sells to major retail merchandisers through direct sales personnel and independent representatives under written agreements in the “Do It Yourself” (DIY) hobby farm and hardware markets. Zareba Systems’ business is seasonal, with peak customer demand occurring in the spring and summer months. In the United Kingdom, Zareba Systems sells directly to dealers through direct sales personnel and delivers products with its factory owned tractor/trailer system. Backlog is not significant in this unit’s operations since most orders are filled within days after receipt of a purchase order.
Zareba Systems released several new electronic perimeter fence products during fiscal year 2005, including an electronic automatic gate opener for both residential and commercial use. These products open gates from a distance using a radio frequency transmitter signal and battery backed-up motors to swing open various styles of gates allowing access to secured property. In addition, Zareba Systems has developed and begun marketing the patent-pending Guard Tower™ perimeter fence security system and the patent-pending rapid pulse energizer system designed to deter, detect, delay, assess and respond to intrusions or escapes in a wide range of security applications. Potential applications include airports, oil refineries, remote utility sites, high value storage sites, correctional facilities as well as other commercial or government properties.
The market for electronic perimeter fence systems is competitive, with several global manufacturers vying for market share. By providing a fully integrated line of products, Zareba Systems considers itself the largest supplier of electronic perimeter fence systems in North America and the United Kingdom. In fiscal year 2007, one Zareba Systems customer had sales greater than 10 percent of the Company’s total sales. Sales to this customer totaled $7.2 million.
Zareba Systems made no significant electric fence system sales directly to governmental agencies, and therefore no governmental contracts are subject to renegotiation. Raw materials used in the production of electronic perimeter fence system products are generally available from a number of suppliers.
Zareba Systems has several patents, including on its (i) Apparatus and Method for Control of Electric Fence, issued August 4, 2003, (ii) Animal Containment System having a dynamically changing perimeter which was filed in February 2002, (iii) combined front panel and mount for an electric fence insulator filed in September 1992; (iv) direct capacitive discharge electric fence controller filed in March 1997; (v) electric fence charger filed in September 1992, (vi) types of electric fence insulators filed in October 1990, August 1989 and October 2001; (vii) fence post assembly, portable fencing system and method filed in September 2000; (viii) fence post cap insulator filed in December 1996; (ix) fence strand retainer clip for fence posts filed in September 1997; (x) front panel for an electric fence insulator filed in April 1989; and (xi) insulator for backside of a t-post filed in May 1998. Each of the patents has a 20 year duration from filing. Zareba has several other patent applications pending related to its electric fencing systems. There is no assurance the Zareba’s patents and rights to patents will afford the Company any competitive advantage.
Zareba Systems has the following trademarks registered in the United States: American Farmworks & Design, Blitzer, Bulldozer, Captivator, Electric Shepherd, Electro-line, Ezee Corral, Garden Protector, Guard Tower, Hol-dem, Horse Sense Electric Fence System, Hot Spark, International, One Stop Fencing and Design; Pet Controller;, Red Snap’r & Design, Rutland Professional Products, Snap Fast, Super Charger, Tarantula, The Horse Fence That Makes Sense, Zareba, Zareba Security, and Zareba Systems.
It has also registered the following trademarks in Australia, New Zealand, Canada and the European Union: Horse Sense Electric Fence System, The Horse Fence That Makes Sense, and Red Snap’r. Zareba also has a registered trademark for Zareba in the European Union.
During fiscal years 2007, 2006 and 2005, Zareba spent $1.3 million, $1.3 million and $1.1 million for research and development projects, respectively.
As of June 30, 2007, Zareba and its subsidiaries had a total of 142 employees, with 134 full-time employees, as compared to a total of 141 employees, with 137 full-time employees the prior year.
The majority of Zareba’s products are sold in the United States and United Kingdom, with export and foreign sales of $10.7 million in fiscal year 2007, compared to $9.3 million and $7.9 million in fiscal 2006 and 2005, respectively. On September 27, 2004, through its newly formed subsidiary, Zareba Systems Europe, Zareba acquired Rutland
4
Electric Fencing Company Ltd. (Rutland), a manufacturer and distributor of electronic fencing equipment located in Oakham, UK. Operating results of the acquired company, which were included in Zareba’s consolidated financial statements from the date of acquisition, comprised $6.7 million of foreign sales in fiscal year 2005. Most sales for foreign exports that have originated from the U.S. have been made through unrelated foreign and export dealers in major European, Asian, South American and other foreign markets.
Available Information
The Company maintains a website at http://www.ZarebaSystemsInc.com. The Company files annual reports on Form 10-K, quarterly reports on Form 10-Q and periodic reports on Form 8-K (and any amendments to these reports). These reports are available free of charge on the Company’s website as soon as reasonably practical after we file these reports with the SEC. To obtain copies of theses reports, go to the website and click on SEC Reports.
These reports may also be viewed and copied at the SEC’s Public Reference Room at 100 F Street, NE., Washington, DC 20549, phone number 1-800-SEC-0330, or electronically at http://www.sec.gov.
Item 1A. Risk Factors
The Company’s operations are subject to a number of risks, which include but are not limited to the following:
Our business is subject to seasonality that may cause our quarterly operating results to fluctuate materially and cause the market price of our common stock to decline.The vast majority of Zareba’s business is seasonal, with peak customer demand occurring in the late spring, summer and early autumn months. Therefore, the Company typically experiences peak revenues during the fourth fiscal quarter and lowest sales levels during the second fiscal quarter. Additionally, consumer demand for our products can be affected by weather patterns. Abnormally cold or wet spring or autumn seasons may cause consumers to delay or cancel purchases. However, because the length and severity of the season is difficult to anticipate, we cannot estimate the fluctuation of our sales from quarter to quarter in a fiscal year or the seasonal impact year to year. If our operating results are below financial analysts’ or investors’ expectations due to seasonality factors, the market price of our common stock may decline.
Reliance on a significant customer.In fiscal years 2007, 2006 and 2005 we had one significant customer that accounted for approximately 20%, 19% and 20% of net sales, respectively. We anticipate, but cannot assure, that this customer will continue to be significant in fiscal 2008. The loss of, or a significant decrease in sales to, this customer could have a material adverse effect on the Company’s financial condition and results of operation.
Requirements for availability of working capital.We depend on our revolving credit facilities for working capital. The lenders have security interests in substantially all of the Company’s assets. Our ability to borrow under the credit facilities depends on maintaining a borrowing base of eligible accounts receivable and, to a lesser extent, eligible inventory and complying with financial covenants concerning debt service coverage, interest coverage and maximum capital expenditures. If the Company is unable to generate a sufficient borrowing base and comply with the financial covenants and other requirements of the credit facilities, it will limit or prevent borrowing under the credit facilities and could have a serious adverse effect on the Company.
Substantial operations in foreign markets.Zareba has foreign subsidiaries in Canada and the United Kingdom and generates approximately 28% of its net sales from outside North America. The ability to sell products in foreign markets may be affected by changes in economic, political or market conditions in those foreign markets that are outside the Company’s control. Additionally, managing geographically dispersed operations presents difficult challenges associated with organizational alignment and infrastructure, communications and information technology, inventory control, customer relationship management, terrorist threats and related security matters and cultural diversities. If we are unsuccessful in managing such operations effectively, our business and results of operations will be adversely affected.
Reliance on critical suppliers.We use numerous vendors to supply raw materials, parts, components and subassemblies for the manufacture of our products. It is not always possible to maintain multiple qualified suppliers for all of our parts, components and subassemblies. As a result, certain key items may be available only from a single supplier or a limited number of suppliers. In addition, suppliers may cease manufacturing certain components that are difficult to replace without significant reengineering of our products. Furthermore, some key items are
5
sourced from foreign suppliers with long lead time requirements for economical shipping. As a result, unanticipated changes in inventory requirements may cause significant delays in receiving parts, or require the Company to incur significant shipping costs to expedite delivery of the items. Our results of operations may be materially and adversely impacted if we do not receive sufficient parts to meet our requirements in a timely and cost effective manner.
We have experienced significant volatility in our stock price.A variety of factors may cause the price of our stock to be volatile. In recent years, the stock market in general, and the market for shares of many small-capitalized companies, including ours, have experienced extreme price fluctuations, which have often been unrelated to the operating performance of affected companies. During the last three years the price of our common stock has ranged from $1.75 to $11.80. The price of our stock may be more volatile than other companies due to, among other factors, the unpredictable and seasonal nature of the markets we serve, our significant customer concentration and our relatively low daily stock trading volume. The market price of our common stock is likely to continue to fluctuate significantly in the future, including fluctuations related and unrelated to our performance.
Recently enacted and future changes in securities laws and regulations have increased our costs. Changing laws, regulations and standards relating to corporate governance and public disclosure, including the Sarbanes-Oxley Act of 2002, new SEC regulations and NASDAQ National Market rules, are creating challenges for all publicly-held companies. We are committed to maintaining high standards of corporate governance and public disclosure. As a result, our efforts to comply with evolving laws, regulations and standards have resulted in, and are likely to continue to result in, increased general and administrative expenses and a diversion of management time and attention from revenue-generating activities to compliance activities. In particular, our efforts to meet and maintain compliance with Section 404 of the Sarbanes-Oxley Act of 2002 and the related regulations regarding the required assessment of our internal controls over financial reporting and our external auditors’ audit of that assessment has required and is expected to increasingly require the commitment of significant financial and managerial resources. Further, our board members, chief executive officer and chief financial officer could face an increased risk of personal liability in connection with the performance of their duties. As a result, we may have difficulty attracting and retaining qualified board members and executive officers, which could harm our business.
Our future growth will depend in part upon our ability to develop and achieve sales of new products and successful entry into new markets.Our growth strategy depends upon the successful development and market introduction of the Company’s automatic gate opener products and security products and niche products into our core DIY business. In addition, in the case of security products, we will be entering new customer markets where we have no previous brand recognition or experience, and with longer sales cycles. We cannot assure you that we will be successful in completing development of any new products. Further, in developing new products, we will incur additional research and development and marketing expenses. Revenues, if any, which we generate from new products may not be sufficient to recoup the expenses we will incur in the development and introduction of new products. Customers may be slow to accept our new products, if at all, and therefore, we cannot assure you that we will generate significant sales from any new products we develop. If we cannot successfully develop new products and achieve sales of our new products, our financial performance and results of operations will be adversely affected.
Item 2. Properties
Zareba owns a 64,000 square foot facility in Ellendale, Minnesota that houses its manufacturing and support functions. In connection with the Company’s credit facility , the building and land are subject to a Negative Pledge Agreement in favor of JPMorgan Chase Bank, N.A. The Company currently leases 6,895 square feet of office space in a Plymouth, Minnesota, office complex for its corporate headquarters. The lease extends through January 31, 2008, and requires a monthly payment of $5,338.
Zareba Systems Europe leases certain facilities in the UK for its manufacturing and distribution operations. The UK leases vary in term, with the principal facility lease commencing on September 22, 2004 and continuing for a twenty-five year period. The lease provides for an early termination election every five years upon six months written notice, the first of which occurs September 22, 2009. The combined monthly lease rate for the UK facilities as of fiscal year end 2007 was approximately $28,000.
6
On August 1, 2007, Zareba’s lease of an 11,000 square foot facility in Rochester, Minnesota where the WMS manufacturing facility is located was assumed by the buyer of WMS. The monthly lease rate was $5,146 at June 30, 2007.
Zareba believes that its current facilities are adequate to meet its business needs and that insurance coverage on its properties is adequate.
Item 3. Legal Proceedings
Zareba did not have any legal proceedings during fiscal years 2007, 2006 and 2005 that were outside of routine litigation, incidental to the business.
Item 4. Submission of Matters to a Vote of Security Holders
No matters were submitted to a vote of Zareba’s shareholders during the fourth quarter of fiscal year 2007.
7
PART II
Item 5. Market for Common Equity and Related Stockholder Matters and Issuer Purchases of Equity Securities
Market Information
Zareba’s common stock is traded on the NASDAQ Capital Market under the symbol ZRBA.
| | | | | | | | | |
| Stock Price | | High | | Low | |
| |
FY2007 | | | | | | | | |
| First Quarter | | $ | 6.74 | | | $ | 1.75 | |
| Second Quarter | | $ | 6.74 | | | $ | 4.33 | |
| Third Quarter | | $ | 6.58 | | | $ | 4.01 | |
| Fourth Quarter | | $ | 7.16 | | | $ | 4.06 | |
FY2006 | | | | | | | | |
| First Quarter | | $ | 11.25 | | | $ | 7.85 | |
| Second Quarter | | $ | 8.94 | | | $ | 7.54 | |
| Third Quarter | | $ | 8.60 | | | $ | 6.40 | |
| Fourth Quarter | | $ | 7.40 | | | $ | 4.61 | |
Shareholders
As of September 5, 2007 Zareba had approximately 454 shareholders of record.
Dividend Summary
At a regularly scheduled meeting on October 26, 2006, the Board of Directors of Zareba voted to suspend payments of cash dividends for fiscal 2006 to retain cash for investment in the Company’s sales growth initiatives. Zareba paid a dividend in December 2005 at the rate of $.04 per share, or an aggregate amount of $96,000.
The Board of Directors will review its dividend policy and make an appropriate decision at its regularly scheduled meeting to be held in connection with Zareba’s 2007 Annual Meeting of Shareholders. There is no assurance Zareba will declare a dividend.
Equity Compensation Plan Information
The following table sets forth certain information regarding outstanding options to purchase Common Stock as of June 30, 2007:
| | | | | | | | | | | | | |
| | | | | | | | | | | Number of securities | |
| | | | | | | | | | | remaining available for | |
| | | Number of securities | | | | | | | future issuance under | |
| | | to be issued upon | | | Weighted average | | | equity compensation | |
| | | exercise of | | | exercise price of | | | plans (excluding | |
| | | outstanding options, | | | outstanding options, | | | securities reflected in | |
| | warrants and rights | | | warrants and rights | | | column (a)) | |
| (in thousands, except per share data) | | (a) | | | (b) | | | (c) | |
| Equity compensation plans approved by security holders: | | | | | | | | | | | | |
| The 1995 Plan | | | 141,225 | | | $ | 3.93 | | | | — | |
| The 2004 Plan | | | 220,875 | | | $ | 8.10 | | | | 329,125 | |
| The ASP Plan | | | — | | | | — | | | | 200,230 | |
| Equity compensation plans not approved by security holders: | | | | | | | | | | | | |
| None | | | — | | | | — | | | | — | |
| | | | | | | | | | |
| | | | 362,100 | | | $ | 6.48 | | | | 529,355 | |
| | | | | | | | | | |
8
Stock Performance
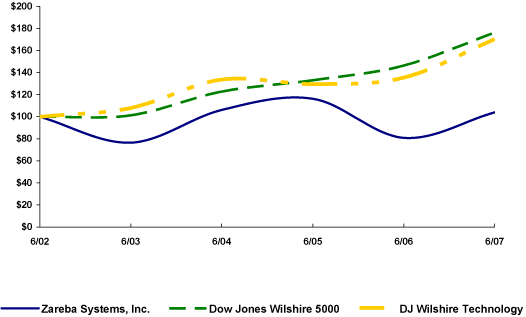
The graph below matches Zareba Systems, Inc.’s cumulative 5-year total shareholder return on common stock with the cumulative total returns of the Dow Jones Wilshire 5000 index and the DJ Wilshire Technology index. The graph assumes that the value of the investment in our common stock and in each of the indexes (including reinvestment of dividends) was $100 on 6/30/2002 and tracks it through 6/30/2007.
COMPARISON OF 5 YEAR CUMULATIVE TOTAL RETURN*
Among Zareba Systems, Inc., The Dow Jones Wilshire 5000 Index
And The DJ Wilshire Technology Index
| | |
* $100 invested on 6/30/02 in stock or index-including reinvestment of dividends.
Fiscal year ending June 30. |
| | | | | | | | | | | | | | | | | | | | | | | | | | | | | | | | | |
| |
| | | | | 6/02 | | | | 6/03 | | | | 6/04 | | | | 6/05 | | | | 6/06 | | | | 6/07 | | |
| | Zareba Systems, Inc. | | | | 100.00 | | | | | 76.48 | | | | | 106.16 | | | | | 116.31 | | | | | 80.86 | | | | | 104.05 | | |
| | Dow Jones Wilshire 5000 | | | | 100.00 | | | | | 101.27 | | | | | 122.71 | | | | | 133.01 | | | | | 146.35 | | | | | 176.22 | | |
| | DJ Wilshire Technology | | | | 100.00 | | | | | 107.84 | | | | | 133.73 | | | | | 129.57 | | | | | 135.39 | | | | | 170.32 | | |
| |
The stock price performance included in this graph is not necessarily indicative of future stock price performance.
9
Item 6. Selected Financial Data
| | | | | | | | | | | | | | | | | | | | | |
| | | Fiscal Year Ended June 30, | |
| (In thousands, except per share data) | | 2007(1) | | | 2006(2) | | | 2005(3) | | | 2004 | | | 2003 | |
Statement of Operations Data: | | | | | | | | | | | | | | | | | | | | |
| Net sales | | $ | 35,683 | | | $ | 32,296 | | | $ | 29,471 | | | $ | 20,930 | | | $ | 20,166 | |
| Income (loss) from continuing operations | | | 372 | | | | (640 | ) | | | 642 | | | | 1,506 | | | | 97 | |
| Net income (loss) | | | 610 | | | | (301 | ) | | | 850 | | | | 1,964 | | | | 610 | |
| Income (loss) per share from continuing operations: | | | | | | | | | | | | | | | | | | | | |
| Basic | | $ | 0.15 | | | $ | (0.26 | ) | | $ | 0.27 | | | $ | 0.65 | | | $ | 0.04 | |
| Diluted | | $ | 0.15 | | | $ | (0.26 | ) | | $ | 0.26 | | | $ | 0.62 | | | $ | 0.04 | |
| Net income (loss) per share: | | | | | | | | | | | | | | | | | | | | |
| Basic | | $ | 0.25 | | | $ | (0.12 | ) | | $ | 0.36 | | | $ | 0.85 | | | $ | 0.27 | |
| Diluted | | $ | 0.25 | | | $ | (0.12 | ) | | $ | 0.34 | | | $ | 0.81 | | | $ | 0.26 | |
| | | | | | | | | | | | | | | | | | | | | |
| Dividends per share: | | $ | — | | | $ | 0.04 | | | $ | 0.04 | | | $ | 0.04 | | | $ | 0.04 | |
| Weighted average number of shares outstanding during the period | | | 2,429 | | | | 2,410 | | | | 2,392 | | | | 2,312 | | | | 2,272 | |
| Weighted average number of shares and equivalents outstanding during the period, assuming dilution | | | 2,472 | | | | 2,410 | | | | 2,500 | | | | 2,430 | | | | 2,378 | |
| | | | | | | | | | | | | | | | | | | | | |
Consolidated Balance Sheets Data: | | | | | | | | | | | | | | | | | | | | |
| Working capital | | $ | 3,957 | | | $ | 8,270 | | | $ | 7,548 | | | $ | 4,463 | | | $ | 5,783 | |
| Total assets | | | 31,873 | | | | 31,837 | | | | 30,853 | | | | 19,379 | | | | 19,500 | |
| Long-term obligations | | | 2,269 | | | | 8,234 | | | | 7,905 | | | | 15 | | | | 2,661 | |
| Stockholders’ Equity | | | 14,721 | | | | 13,628 | | | | 13,767 | | | | 12,910 | | | | 10,832 | |
| | |
| (1) | | Fiscal 2007 Working Capital and Long-term obligations reflect the current liability classification of $5.0 million of debt under the Wells Fargo credit facility. |
| |
| (2) | | Fiscal 2006 results reflect pre-tax inventory valuation adjustments totaling $641,000 for excess and obsolete inventory and standard cost valuation adjustments. |
| |
| (3) | | Fiscal 2005 results include the partial year results of Rutland Electric Fencing Company Ltd., acquired in September, 2004, including $6.7 million of net sales. |
10
Item 7. Management’s Discussion and Analysis of Financial Condition and Results of Operation
The following discussion of the Company’s results of operations and financial condition should be read together with the other financial information and Consolidated Financial Statements included in this Annual Report on Form 10-K. The results of operations relate to continuing operations unless noted. This discussion contains forward-looking statements that involve risks and uncertainties. Our actual results could differ materially from those anticipated in the forward-looking statements as a result of a variety of factors, including those discussed in Item 1A.Risk Factors, and elsewhere in this report.
Executive Summary
Zareba Systems, Inc. (“Zareba”, “Zareba Systems” or the “Company”) experienced a 10.5% increase in net sales to $ 35.7 million, and a return to profitability in fiscal 2007, following the challenging previous year. Net sales increased across most areas of the business, with the larger contributions coming from sales of electric fencing systems in the UK and North America, as well as from perimeter security system sales. Improved weather conditions which extended the buying season of our customers, and payment of the farm subsidies in the UK, and a large perimeter security products order form several prisons drove much of the sales increase.
Income from continuing operations and net income improved in fiscal 2007, benefiting from the profit contribution of the increased sales and improved gross margins. In addition to the effects of an inventory valuation charge recorded in fiscal 2006, the current year margin improvement also reflected selective sales price adjustments and cost reduction initiatives.
At June 30, 2007, the Company substantially completed negotiation of the sale of the Company’s Waters Medical Systems, Inc., (WMS) subsidiary to a third party. The WMS subsidiary, a provider of medical products was initially formed on June 30, 2005, when all the assets of the WMS division of Zareba were transferred to the newly-formed subsidiary, and has operated in a separate business segment of the Company. With the impending sale, subsequently completed on August 1, 2007, all results of operations and assets and liabilities of WMS for all periods presented have been classified as discontinued operations. The sale of WMS, completed subsequent to fiscal 2007 year end, was for $5 million cash, resulting in a pre-tax gain of approximately $4 million to be reported in the Company’s first quarter fiscal 2008 results. Cash proceeds from the sale were used to reduce borrowing under the Company’s Wells Fargo credit facility.
On August 29, 2007, subsequent to our fiscal 2007 year end, the Company entered into a $6 million secured revolving credit facility with JPMorgan Chase Bank, N.A. Proceeds form the facility will be used for general working capital purposes as well as to repay the existing Wells Fargo Business Credit facility, totaling approximately $1.1 million.
Overview
Zareba Systems, Inc. designs, manufactures and markets electronic perimeter fence and access control systems, operating in one world-wide business segment. Zareba has three subsidiaries, Zareba Systems Europe Limited, Zareba Security, Inc. and Zareba Systems of Canada LTD.
On September 27, 2004, through its newly formed subsidiary, Zareba Systems Europe, the Company acquired Rutland, the largest manufacturer of electronic perimeter fence systems in the United Kingdom. To facilitate the acquisition, the Company and Zareba Systems Europe utilized credit facilities provided by Wells Fargo Bank and Bank of Scotland. The Company recorded the Rutland acquisition in accordance with FAS No. 141, Business Combinations. Financial results from the Zareba Systems Europe subsidiary have been included in the Company’s consolidated financial statements since the date of acquisition. This acquisition impacted net sales significantly.
In the first quarter of calendar year 2005, the Company introduced two new product lines within the Zareba Systems division, perimeter security systems and electric gate opener systems and accessories. The perimeter security system is designed to deter, detect, delay, assess and respond to intrusions or escapes in a wide range of applications including utilities, airports, correctional facilities and other commercial and government properties. The Company completed initial systems deliveries and established a distribution agreement with a key distributor in the UK in fiscal 2006. The Company completed additional systems deliveries in fiscal 2007 along with a large shipment of perimeter security products for several prisons. The Company continues to work to establish similar agreements
11
with other distributors to sell both non-lethal electric fencing and its patent-pending Guard Tower® product lines in various countries around the world.
Products comprising the automatic gate opener systems and accessories targeting the Do-It-Yourself (traditional) Zareba market are sold through existing retail channels in North America and the UK, often to the same customer that purchased products of the traditional Zareba product line. During the second half of fiscal 2007, the Company began shipping a new family of professional series automatic gate openers available to the professional installer distribution channels, which the Company believes will offer market growth opportunities.
Zareba Systems’ business is seasonal, with peak customer demand occurring in the late spring, summer and early autumn months. Backlog is not significant in either of the Company’s operating units since most orders are filled within days after receipt of a customer’s order. As a result of Zareba Systems seasonality, there is a resulting variability in sales, manufacturing fixed overhead absorption and a further resulting impact on gross margin, working capital and cash flow during the Company’s fiscal year.
Results of Continuing Operations
Net sales for fiscal year ended June 30, 2007, increased 10.5% to $35.7 million compared to $32.3 million and $29.5 million in fiscal year 2006 and 2005, respectively. Several factors contributed to the increased sales in fiscal year 2007, including the impact of selective sales price adjustments, improved market conditions in the UK, increased electric fencing sales in North America and the inclusion of a large security product sale in fiscal 2007. The increase in net sales in fiscal year 2006 versus 2005 is due primarily to the inclusion of the full year operations from its subsidiary, Zareba Systems Europe, which acquired Rutland on September 27, 2004. In addition, fiscal year 2006 sales increases in North America electric fencing systems were offset by the effects of a weakness of sales in Europe due to a late spring, compounded by deferred spending by UK customers as a result of a delay in payment of farm subsidies by the UK government.
During the second half of fiscal 2007, the Company began shipping its professional series of automatic gate openers and shipped a large order for electronic perimeter security fence products for several prisons. The perimeter security systems and automatic gate openers are an expanded focus for Zareba Systems, and are anticipated to be an emerging and growing market opportunity for the Company.
Fiscal year 2007 gross margins increased to 34.1% an increase of 2.3% from 31.8% in fiscal year 2006 and compared to 36.4% in fiscal year 2005. An inventory valuation adjustment in fiscal 2006 decreased gross margins for that year by 2%, resulting in a large portion of the year-to-year fluctuation. In addition, fiscal year 2007 margins benefited from selective sales price adjustments and the higher margins on security product sales. Gross margins for fiscal 2006 were adversely impacted by certain product cost increases and product mix changes, in addition to the inventory valuation adjustment.
Selling, general and administrative expenses were $9.3 million, or 26.0% of sales, for fiscal year 2007, compared to $8.9 million, or 27.6 % and $8.0 million, or 27.1% on sales in fiscal years 2006 and 2005, respectively. Targeted investments in selling and marketing resulted in the increased costs for fiscal 2007, while the inclusion of a full year’s results of the Rutland operations in fiscal 2006 versus just over nine months in the prior year comprised a significant portion of the increase from fiscal 2005. Costs related to expanded sales and marketing activities surrounding product launch of automatic gate openers and security products, as well as hiring and severance costs for management position changes made up the majority of the remaining increase over fiscal 2005.
Research and development expenses of $1.3 million for each of fiscal years 2007 and 2006, and $1.1 million for fiscal 2005 were directed toward new product development and testing for Zareba Systems automatic gate openers and perimeter security systems as well as continued product enhancements of existing electric fencing systems products. The Company’s long-term investments are designed to protect and enhance our future financial performance.
Interest expense, principally related to the Company’s term debt to finance the Rutland acquisition, was $844,000, $797,000 and $518,000 for fiscal years 2007, 2006 and 2005, respectively. The increase for fiscal 2007 versus 2006 resulted from an increase in interest rates, which more than offset decreased borrowing levels. The increase in fiscal 2006 versus 2005 resulted from the timing of the Rutland acquisition and the increases in interest rates during 2006.
12
Income from continuing operations of $372,000, or $0.15 per basic and diluted share, in fiscal 2007 compared to a loss of $640,000, or $0.26 per basic and diluted share, in fiscal 2006 and income of $642,000, or $0.27 and $0.26 per basic and diluted share, respectively in fiscal 2005. The improved operating results for fiscal 2007 versus the prior year resulted primarily from the gross profit contribution from increased fiscal 2007 sales and the impact of the fiscal 2006 inventory valuation adjustment. The change in operating results for fiscal 2006 versus 2005 resulted from increased investments in selling, marketing, engineering and administrative costs in fiscal 2006 to support new product development and market introductions, decreased gross margins.
Results of Discontinued Operations and Net Income
Gain from discontinued operations, net of tax was $238,000, or $0.10 per basic and diluted share for fiscal 2007, versus $339,000, or $0.14 per basic and diluted share for fiscal 2006, and $208,000, or $0.09 and $0.08 per basic and diluted share, respectively for fiscal 2005, reflecting the net results of the WMS for the respective periods.
Net income for fiscal 2007 was $610,000, or $0.25 per basic and diluted share, versus a net loss of $301,000, or $0.12 per basic and diluted share for fiscal 2006 and net income of $850,000, or $0.36 and $0.34 per basic and diluted share, respectively for fiscal 2005. The differences result primarily from the impact of the profit contribution from increased sales, the increased expenses related to investments in product development, sales growth and infrastructure development and the fiscal 2006 inventory valuation adjustment.
Liquidity and Capital Resources
The Company’s cash and working capital balances at June 30, 2007 were $1.6 million and $4.0 million, respectively, as compared to $1.4 million and $8.3 million at June 30, 2006. The decrease in working capital resulted primarily from the classification of $5.0 million of borrowing under the Wells Fargo revolving line, scheduled to mature on September 1, 2007, as a current liability at June 30, 2007.
Accounts receivable decreased to $7.7 million at June 30, 2007 versus $8.0 million in the prior year, reflecting the timing of timing of shipments and customer payments in the fourth quarter of the respective years. Inventories increased to $6.5 million at June 30, 2007, versus $6.0 million in the prior year, reflecting the increased investments in inventory to support the higher activity levels and new product introductions.
Capital expenditures were $0.2 million for fiscal 2007 versus $0.3 million in each of fiscal years 2006 and 2005, and were used primarily for manufacturing and computer equipment and purchases of new product tooling.
In September 2004, the Company paid in full the previous Wells Fargo Bank (WF) $3.0 million bank line of credit and term debt facility and executed a new Wells Fargo Business Credit facility for the Rutland acquisition. The WF credit facility initially included an aggregate credit limit of $7.8 million, consisting of revolving credit up to $6.0 million and term credit of $1.8 million. Under this credit facility, the Company borrowed approximately $5.1 million for the Rutland acquisition. Under the terms of the new WF credit facility agreement and subsequent amendments, interest is charged on outstanding balances at the rate of one half of one percent or (.50 percent) above base rate. The initial term of the agreement runs for three years, maturing on September 1, 2007, and it is renewable on an annual basis thereafter. As a result, the entire balance outstanding on the revolving credit facility of $5.0 million was classified as current at June 30, 2007. The effective interest rate was 8.75 percent on June 30, 2007 and June 30, 2006, and the average effective rate for fiscal year 2007 was 8.75 percent. The term notes require monthly principal payments of $19,168 plus interest. As of June 30, 2007 and 2006, the outstanding amount on the WF credit facility was $5.0 and $5.2 million, respectively with an additional $1.0 million and $0.8 million, respectively available for the future draws. Future WF availability is determined by the daily eligible collateral net of outstanding loan balance.
Also, in September 2004, Zareba Systems Europe secured a £2,214,000 term loan (approximately $4.0 million) from the Bank of Scotland (BoS) in the United Kingdom for the Rutland acquisition (See Notes 5 and 8 to consolidated financial statements). Under the terms of the BoS credit facility agreement, interest is charged on outstanding balances at the rate of two and one eighth percent (or 2.125 percent) above the base rate with a five-year term. On June 30, 2007 and 2006, the effective interest rate was 7.63 percent and 6.63 percent, respectively and the average effective rate for fiscal 2007 was 7.21 percent. The BoS term loan matures on September 27, 2009, with monthly principal and interest payments of £49,355 (approximately $96,000). The balance outstanding under this facility at June 30, 2007 and 2006 was £1.2 million, or approximately $2.4 million, and £1.7 million, or approximately $3.1 million, respectively. In September 2007, the BoS waived all previous covenant violations for fiscal 2007 and agreed to work with the Company to establish new covenant levels for the future. Based upon the discussions with
13
BoS regarding the proposed new covenant levels, the Company believes it will be able to meet the new financial covenants in fiscal 2008, once established.
Both the WF Business Credit and the BoS credit facilities are collateralized by substantially all of the assets of the Company and Zareba Systems Europe, in their respective localities. Line of credit borrowings are limited to eligible accounts receivable and inventory.
The table below shows a summary of the Company’s remaining contractual cash obligations excluding interest expense at June 30, 2007, including the above listed items to the Company’s credit facility and other term debt.
Contractual Obligations-United States
| | | | | | | | | | | | | | | | | | | | | | | | | | | | | |
| (In thousands) | | FY2008 | | | FY2009 | | | FY2010 | | | FY2011 | | | FY2012 | | | After FY2012 | | | Total | |
| |
| Long-term debt | | $ | 5,275 | | | $ | 231 | | | $ | 155 | | | $ | 131 | | | $ | 131 | | | $ | 292 | | | $ | 6,215 | |
| Operating leases | | | 101 | | | | 41 | | | | — | | | | — | | | | — | | | | — | | | | 142 | |
| |
TOTAL | | $ | 5,376 | | | $ | 272 | | | $ | 155 | | | $ | 131 | | | $ | 131 | | | $ | 292 | | | $ | 6,357 | |
| |
Contractual Obligations-United Kingdom
| | | | | | | | | | | | | | | | | | | | | | | | | | | | | |
| (In thousands) | | FY2008 | | | FY2009 | | | FY2010 | | | FY2011 | | | FY2012 | | | After FY2012 | | | Total | |
| |
| Long-term debt | | $ | 1,051 | | | $ | 1,129 | | | $ | 200 | | | $ | — | | | $ | — | | | $ | — | | | $ | 2,380 | |
| Operating leases | | | 345 | | | | 345 | | | | 316 | | | | 306 | | | | 305 | | | | 4,436 | | | | 6,053 | |
| |
TOTAL | | $ | 1,396 | | | $ | 1,474 | | | $ | 516 | | | $ | 306 | | | $ | 305 | | | $ | 4,436 | | | $ | 8,433 | |
| |
On August 1, 2007, subsequent to fiscal 2007 year end, the Company completed the sale of the WMS subsidiary, receiving $5 million cash, which was used to reduce the outstanding debt with WF Business Credit.
On August 29, 2007, subsequent to fiscal 2007 year end, the Company entered into a secured revolving credit facility with JPMorgan Chase Bank, N.A. (Chase), subsequently terminating the WF facility and paying in full all outstanding balances under the WF facility, totaling approximately $1.1 on August 30, 2007. The Chase facility provides for a $6 million secured revolving credit facility (the “Credit Facility”), with the option to increase borrowings in additional $500,000 increments with the consent of the Lender, up to a total of $7.5 million. Amounts under the facility may be borrowed, repaid and reborrowed from time to time until its maturity on August 29, 2010. Voluntary prepayments and commitment reductions under the Credit Facility are permitted at any time without payment of any prepayment fee upon proper notice and subject to minimum dollar amounts. Loans under the 2007 Credit Agreement will bear interest at either a base rate minus 1.0 percent to 0 percent, based upon financial performance, or a Eurocurrency rate equal to the London Inter-Bank Offered Rate (“LIBOR”) for the relevant term plus 1.5 percent to 2.5 percent, based upon financial performance. Notwithstanding the foregoing, borrowings until and including September 30, 2007 will bear interest at either a base rate minus 0.75 percent or LIBOR plus 1.75 percent. The facility contains a financial covenant requiring that the Company maintain a minimum debt service coverage ratio measured quarterly, and other covenants, and includes limitations on, among other things, liens, certain acquisitions, consolidations and sales of assets. The Company also entered into a Stock Pledge Agreement with the Lender, pursuant to which it pledged the stock of Zareba Systems of Canada, Ltd. to the Lender as additional security under the 2007 Credit Agreement. In addition, the Company entered into a Negative Pledge Agreement in favor of the Lender, pursuant to which it agreed not to convey or otherwise transfer or pledge or otherwise encumber any of its owned real property to any other party without the consent of the Lender, which consent is not to be unreasonably withheld.
The Company believes that its existing funds, additional cash generated from operations, and borrowings under the Company’s bank debt facility and cash proceeds from the subsequent sale of the WMS subsidiary will be adequate to meet the Company’s foreseeable operating activities and outlays for capital expenditures for at least the next twelve months.
Critical Accounting Policies
The Company’s critical accounting polices are discussed below.
Revenue Recognition
The Company recognizes revenue in accordance with the Securities Exchange Commission’s Staff Accounting Bulletin No. 104 (SAB104) Revenue, which requires that four basic criteria be met before revenue can be recognized: (i) persuasive evidence of a customer arrangement exists; (ii) the price is fixed or determinable; (iii) collectibility is reasonably assured; and (iv) product delivery has occurred or services have been rendered. Sales are
14
not conditional based on customer acceptance provisions or installation obligations. The Company primarily utilizes independent manufacturers’ representatives to facilitate sales orders (with no right of return or other Company obligation), as well as having direct sales for key accounts or product lines. The Company recognizes revenue as products are shipped based on FOB shipping point terms when title passes to the customer. The Company accounts for customer rebates on the accrual basis when they are probable and can be estimated. The Company estimates and accrues for sales returns based upon historical experience.
Allowance for Doubtful Accounts
The Company maintains an allowance for doubtful accounts for estimated losses resulting from the inability of its customers to make required payments. If the financial condition of the Company’s customers were to deteriorate, resulting in an impairment of their ability to make payments, additional allowances may be required.
The allowance for doubtful accounts is an estimate based on specifically identified accounts. The Company evaluates specific accounts where information that the customer may have an inability to meet its financial obligations is known. In these cases, management uses its judgment, based on the best available facts and circumstances, and records a specific reserve for that customer against amounts due to reduce the receivable to the amount that is expected to be collected. These specific reserves are re-evaluated and adjusted as additional information is received that impacts the amount reserved. If circumstances change, the Company’s estimates of the recoverability of amounts due could be reduced or increased by a material amount. Such a change in estimated recoverability would be accounted for in the period in which the facts that give rise to the change become known.
Valuation of Inventories
Our inventories are stated at the lower of cost or market and include materials, labor and overhead. Cost is determined by the first-in, first-out (“FIFO”) method. Provisions to reduce inventories to the lower of cost or market are made based on a review of excess and obsolete inventories through an examination of historical component consumption, current market demands and shifting product technology. Significant assumptions with respect to market trends are utilized to formulate our provision methods. Sudden or downward changes in markets we serve may cause us to record additional inventory revaluation charges in future periods.
Amortization of Intangible Assets
Customer relationships and non-compete agreements are amortized on a straight-line basis over seven and five years, respectively. Intangible assets are amortized on a basis that corresponds to the Company’s projections of future cash flows directly related to these intangible assets. The estimates that are included in its projection of future cash flows are based on the best available information at the time of the determination of useful life and amortization method. A change in circumstances could result in a determination that the related assets are impaired and impairment charges to reduce the carrying value of intangible assets may be necessary.
Impairment of Long-Lived Assets
The Company evaluates the carrying value of long-lived assets, including identifiable intangibles, for impairment when events or changes in circumstances indicate that the carrying amount of an asset may not be recoverable. If impairment indicators are present and the estimated future undiscounted cash flows are less than the carrying value of the assets, the carrying value is reduced to the estimated fair value as measured by the associated discounted cash flows.
Under SFAS No. 142, the Company currently evaluates goodwill and indefinite lived intangible assets (trade names) for impairment using a two-step test based upon a fair value approach. The first step is used to identify a potential impairment through an estimate of the fair value of certain reporting units (as defined by SFAS No. 142), while the second step calculates the amount of impairment, if any. Additionally, goodwill shall be tested for impairment between annual tests if an event occurs or circumstances change that would reduce the fair value of an entity below its carrying value. The Company evaluated goodwill for impairment using the method described in the preceding paragraph and determined the fair value of its reporting units by application of a discounted cash flow analysis. The Company makes estimates that are included in its discounted cash flow analyses based upon the best available information at the time of the fair value determination. If circumstances change, the estimates of fair value will also change and could necessitate additional impairment charges that reduce the carrying value of goodwill.
15
Contingencies
We are subject to the possibility of various loss contingencies, including legal claims, in the normal course of business. We accrue for loss contingencies when a loss is probable and can be estimated. See footnote 9 to the consolidated financial statements for additional information.
Recently Issued Accounting Standards
In June 2006, the Financial Accounting Standards Board (FASB) issued Interpretation No. 48 (FIN No. 48), “Accounting for Uncertainty in Income Taxes”, to address the noncomparability in reporting tax assets and liabilities resulting from a lack of specific guidance in SFAS No. 109, “Accounting for Income Taxes”, on the uncertainty in income taxes recognized in an enterprise’s financial statements. Specifically, FIN No. 48 prescribes (a) a consistent recognition threshold and (b) a measurement attribute for the financial statement recognition and measurement of a tax position taken or expected to be taken in a tax return, and provides related guidance on derecognition, classification, interest and penalties, accounting interim periods, disclosure and transition. FIN No. 48 will apply to fiscal years beginning after December 15, 2006, our fiscal year 2008. The Company has not yet determined the impact the adoption of FIN No. 48 will have on the consolidated financial statements.
Forward-Looking Statements and Risk Factors
Certain statements in this Report are forward-looking statements that involve a number of risks and uncertainties that may cause the Company’s future operations and results of operations to differ materially from those anticipated. Specifically, these include statements relating to (a) the sufficiency of capital, which depends on the Company successfully maintaining adequate levels of bank financing, the Company meeting its expenses and revenue projections and the success of the Company’s new products, which further depend on the management’s ability to realize target sales synergies, the impact new Zareba products have on seasonality, as well as general competitive, market and economic conditions; (b) growth in Zareba Systems’ sales generally and as a result of its new products, including sales within the corrections marketplace, and the expectation that the security systems and gate openers will become an emerging and growing market opportunity, which depend on the cost and success of the Company’s development efforts and new products, including the professional series of automatic gate openers, the success of the Zareba Systems Europe subsidiary, the actual development of the perimeter security system market, the extent to which weather and UK farm subsidies affect sales and timing, the Company’s ability to finalize distribution agreements with key distributors on acceptable terms, the success on new distribution channels, the actual costs of supplies, the effect of consolidation within the agricultural retail industry, as well as actual competition, market and economic conditions; (c) that the demand for customized electronic perimeter security systems will increase, which depends on the quality of the product offerings, the effectiveness of our sales force, the need and perceived need for increased security in the markets we serve, and competition from other suppliers; and, (d the anticipation that additional agreements will be established with other distributors following the recently obtained agreement with a key distributor in the UK, which depends on the effectiveness of our sales force, the quality of our products versus those otherwise available in Europe and elsewhere.
Item 7A. Quantitative and Qualitative Disclosures About Market Risk
Market Risk
Zareba has foreign subsidiaries in Canada and the United Kingdom, and we generate approximately 28% of our net sales from outside North America. Our ability to sell our products in foreign markets may be affected by changes in economic, political or market conditions in the foreign markets in which we do business.
The Company’s net investment in its foreign subsidiaries was $7.0 million, $6.1 million and $5.4 million at June 30, 2007, 2006 and 2005, respectively, translated into U.S. dollars at the closing exchange rates on those dates. The potential loss based on end-of-period balances and prevailing exchange rates resulting from a hypothetical 10% strengthening of the dollar against foreign currencies was not material for the fiscal years ended June 30, 2007, 2006 and 2005. Although the Company may decide to enter into foreign exchange contracts as a hedge against specific foreign currency receivables, the Company did not enter into any foreign exchange contracts in the fiscal years 2007, 2006 or 2005.
Interest Rate Risk
Substantially all of our senior debt and the associated interest expense are sensitive to changes in the level of interest rates. A hypothetical 100 basis point (one percentage point) increase in interest rates would result in incremental interest expense of approximately $80,000, $85,000 and $82,000 in fiscal years 2007, 2006 and 2005, respectively.
16
Item 8. Financial Statements and Supplementary Data
The Consolidated Financial Statements of the Company and its subsidiaries are included at the end of this report.
Item 9. Changes in and Disagreements With Accountants On Accounting and Financial Disclosure
Not applicable.
Item 9a. Controls and Procedures
The Company’s Chief Executive Officer and Chief Financial Officer have evaluated the Company’s disclosure controls and procedures as of the end of the period covered by this report. Based upon that review, they have concluded that these controls and procedures are effective in informing them of material information relating to the Company that is required to be disclosed in the periodic reports which the Company files under the Securities Exchange Act of 1934, as amended.
There have been no changes in the Company’s internal control over financial reporting during the period covered by this report that have materially affected, or are reasonably likely to materially affect internal control over financial reporting.
Item 9b. Other Information
On August 29, 2007, our Board of Directors approved non-equity plan compensation and discretionary bonuses to our named executive officers for fiscal 2007, as set forth in the Summary Compensation Table in Item 11 of Part III of this report.
17
PART III
Item 10. Directors, Executive Officers and Corporate Governance
Directors
The names and ages of all directors and the positions held by each with the Company are as follows:
| | | | | | | | | |
| Name | | Age | | Position |
| Eugene W. Courtney | | | 71 | | | Director |
| William R. Franta | | | 65 | | | Director |
| Jerry W. Grabowski | | | 55 | | | President and Chief Executive Officer |
| John A. Grimstad | | | 57 | | | Director |
| Dale A. Nordquist | | | 52 | | | Director |
Eugene W. Courtney, age 71, has been a director since 2003. Mr. Courtney has served as an independent management consultant since December 1998. From October 1999 to February 2001, he served as President and Chief Executive Officer of RSI Systems, Inc., a company that designs, manufactures and distributes videoconferencing systems. Mr. Courtney served as Chief Executive Officer of HEI, Inc., a company which designs and manufactures microelectronics, from 1990 until December 1998; he also served as HEI’s President from 1990 to July 1998 and as its Executive Vice President from 1988 to 1990.
William R. Franta, age 65, has been a director since 1997. Mr. Franta is currently an independent business, market and technology consultant to several venture finance companies. From October 2000 to May 2003, he was Director of Venture Finance for GATX Corporation. From June 1999 to October 2000, he was the Vice President of Product Strategies at REAL Solutions, Ltd. From August 1997 to February 2000, he was the Vice President of Marketing at Centron in Minneapolis, Minnesota. Between February 1997 and August 1997, he was a Business Development and Technology Consultant in Minneapolis, Minnesota. From January 1987 to February 1997, he served as Senior Vice President of Network Systems Corporation.
Jerry W. Grabowski, age 55, has been a director since 1993. Mr. Grabowski has been our President and Chief Executive Officer, and a member of our Board of Directors, since August 1993. He also served as our Chief Financial Officer, Secretary and Treasurer from December 1994 until October 1996. From 1988 until joining Zareba Systems, Mr. Grabowski was employed as General Manager of Onan Power/Electronics Division.
John A. Grimstad, age 57, has been a director since 1996. Mr. Grimstad has been engaged in the private practice of law since 1977 and has been a Vice President and shareholder of Fredrikson & Byron, P.A., our principal outside counsel, since 1984. Mr. Grimstad has served as our Secretary since 1995.
Dale A. Nordquist, age 52, has been a director since 2004. Mr. Nordquist has served as Senior Vice President of Sales and Marketing of Winland Electronics, Inc. since December 2002. From October 2001 to December 2002, he was the Vice President of Sales — EMS Western Region for Winland Electronics, Inc. From May 1999 to October 2001, Mr. Nordquist served as Vice President of Sales and Marketing for Quickdraw Conveyor Systems, Inc. From 1981 to May 1999, he served as Vice President of Sales and Marketing for HEI, Inc., a Minnesota-based designer and manufacturer of ultra-miniature electronic devices and high technology products incorporating these devices.
Code of Business Conduct and Ethics
The Board has approved a Code of Business Conduct and Ethics, which applies to all of our employees, directors and officers, including our principal executive officer, principal financial officer, principal accounting officer and controller. The Code of Business Conduct and Ethics addresses such topics as protection and proper use of our assets, compliance with applicable laws and regulations, accuracy and preservation of records, accounting and financial reporting, conflicts of interest and insider trading. The Code of Business Conduct and Ethics is available free of charge through our website at www.ZarebaSystemsInc.com and is available to any shareholder who sends a request for a paper copy to Zareba Systems, Inc., Attn. Director of Investor Relations, 13705 26th Avenue N., Suite 102, Minneapolis, MN 55441. Zareba Systems intends to include on its website any amendment to, or waiver from, a provision of its code of ethics that applies to our principal executive officer, principal financial officer, principal accounting officer and controller that relates to any element of the code of ethics definition enumerated in Item 406(d) of Regulation S-K. Zareba Systems has contracted with an independent professional organization to provide
18
anonymous hotline services that permit its employees to communicate any concerns about behavior or practices of Zareba Systems, its employees, officers or directors. The service was established to assist the Board of Directors in effective internal control.
Audit Committee
The Audit Committee consists of Messrs. Franta, Courtney and Nordquist, all of whom are outside directors. The Board of Directors and the Audit Committee believe that the Audit Committee’s current member composition satisfies the current rule of the National Association of Securities Dealers, Inc. (“NASD”) that governs audit committees, Rule 4350(d)(2), including the requirement that audit committee members all be “independent directors” as that term is defined by NASD Rule 4200(a)(15). The Audit Committee generally oversees the structure of our internal controls, reviews the selection of the independent auditors, reviews the annual audit plan, and oversees our financial reporting. The Audit Committee is responsible for the engagement of our independent accounting firm and reviews other matters relating to our relationship with our independent accounting firm. The Audit Committee Charter is publicly-available on our website at www.zarebasystemsinc.com.
The Board has determined that William R. Franta is the “audit committee financial expert” as defined by Item 407(d) of Regulation S-K. We acknowledge that the designation of Mr. Franta as the audit committee financial expert does not impose on Mr. Franta any duties, obligations or liability that are greater than the duties, obligations and liability imposed on Mr. Franta as a member of the Audit Committee and the Board of Directors in the absence of such designation or identification.
Executive Officers
Set forth below are the names and ages of current executive officers of Zareba Systems, Inc., as well as information regarding their positions with Zareba Systems and their business experience. There are no family relationships among any of the officers named, nor is there any arrangement or understanding pursuant to which any person was selected as an officer.
| | | | | | | | | |
| Name | | Age | | Position |
| Jerry W. Grabowski | | | 55 | | | President and Chief Executive Officer |
| Jeffrey S. Mathiesen | | | 46 | | | Vice President and Chief Financial Officer |
| Donald G. Dalland | | | 47 | | | Vice President, Engineering and Operations |
| William J. Frederick | | | 51 | | | Executive Vice President, Sales and Business Development |
Jerry W. Grabowski, age 55, has been our President and Chief Executive Officer and a member of our Board of Directors since August 1993. He also served as our Chief Financial Officer, Secretary and Treasurer from December 1994 until October 1996. From 1988 until joining Zareba Systems, Mr. Grabowski was employed as General Manager of Onan Power/Electronics Division.
Jeffrey S. Mathiesen, age 46, has served as our Vice President and Chief Financial Officer since December 2005. From July, 2004 to December 2005, Mr. Mathiesen was Vice President and Chief Financial Officer of Delphax Technologies, Inc. From April 2003 to July 2004, Mr. Mathiesen headed The Mathiesen Group, Inc., a provider of management and financial consulting services. From September 1996 to April 2003, Mr. Mathiesen was Vice President and Chief Financial Officer, then Vice President of Business Development for Micro Component Technology, Inc.
Donald G. Dalland, age 47, has served as our Vice President, Engineering and Operations since November 2005. From October 1994, when he joined us, to November 2005, Mr. Dalland served as our Vice President of Manufacturing.
William J. Frederick, age 51, has served as our Executive Vice President, Sales and Business Development since August 2005. From September 2002 to August 2005, Mr. Frederick was President of Frederick Consulting. From February 1985 to September 2002, Mr. Frederick was employed by ADC Telecommunications, serving in various capacities, most recently as Vice President and General Manager.
19
Section 16(a) Beneficial Ownership Reporting Compliance
Section 16(a) of the Securities Exchange Act of 1934 requires our officers and directors, and persons who own more than ten percent (10%) of the registered class of our equity securities, to file reports of ownership and changes in ownership with the Securities and Exchange Commission (the SEC). Officers, directors and greater than ten-percent shareholders are required by SEC regulation to furnish us with copies of all Section 16(a) forms they file.
To the Company’s knowledge, based on a review of the copies of such reports furnished to the Company during the fiscal year ended June 30, 2007, its officers, directors, and greater than ten-percent beneficial owners complied with all Section 16(a) filing requirements.
Item 11. Executive Compensation
Compensation Discussion and Analysis
In this section we describe the Company’s compensation programs and policies and the material elements of compensation for the executive officers named in the Summary Compensation Table, who we refer to as our named executive officers.
Compensation Philosophy and Objectives
Our Compensation Committee is committed to an executive compensation philosophy that attracts and retains executive officers, motivates executive officers to achieve our company’s business objectives, and aligns the interests of key leadership with the long-term interests of our company’s shareholders. The current objectives of our compensation program are to pay compensation at or near market level for the area, and to link pay to performance by encouraging executive officers to focus on sales, new product and market initiatives and net income.
Setting Executive Compensation
Executive compensation is intended to support our company’s performance goals. Accordingly, the committee believes that a high percentage of compensation should be tied to the performance of our company and the individual’s contribution to our company’s performance. This philosophy is illustrated by the committee’s practice of tying both annual incentive compensation as well as long-term equity incentives to our company’s key metrics.
The committee endeavors to set total compensation, including base salary, annual incentive compensation and equity incentives, at or near market level for area to attract top management to execute our company’s growth strategy. In making its compensation decisions, the committee has historically referenced published compensation data of similarly sized public companies in our area. The committee benchmarks total compensation at or near the average for this peer group.
Market Referencing
The Compensation Committee recognizes that competitive compensation is a critical factor in attracting and retaining key personnel. In addition to performance, we also base our compensation decisions on market considerations. Our compensation and benefit programs are benchmarked against programs available to employees in comparable roles at peer companies.
In its deliberative process, the Compensation Committee periodically reviews the independent compensation survey published by The American Electronics Association and other data sources to assist it in determining peer group compensation levels and practices for compensating executives. These materials are evaluated to compare the Company’s compensation levels to the market compensation levels, taking into consideration the other companies’ size, industry group, geographic location and the individual executive’s level of responsibility. For the fiscal year 2008 review, the Compensation Committee has retained a third party compensation consultant to assist with the review process.
The Compensation Committee benchmarks total compensation, as well as annual cash and long-term performance compensation to that of executive officers performing similar job functions at comparable companies, adjusted to reflect various factors including relative company size, complexity of operations, performance and geographic location. However, the Company’s policy is to endeavor to attract and retain the best talent among its senior management team. Therefore, the Compensation Committee may approve total compensation packages for senior management that vary from the benchmarks noted above based on several principal factors. Specifically, executives with relatively less overall experience, less demanding or complex operational responsibilities, less tenure with the
20
Company and/or lower performance ratings over several years will have total compensation set at or below the median for our executive group. Conversely, if an executive consistently receives favorable performance ratings over successive years, accumulates years of service and expertise with the Company, holds a position with more complex or demanding operational aspects and/or has significant other experience, his or her total compensation will typically be above the median. Overall, the Compensation Committee believes that the Company’s compensation programs, as structured, are within the market range, based on the information it reviews each year.
The committee generally commences its review of annual incentive compensation plans in the fourth quarter of each fiscal year, in conjunction with approval of the company’s annual operating plan for the following year. Incentive compensation payments are determined in the following year, upon completion of our audited financial statements for the prior fiscal year and the filing of such financial statements on Form 10-K. Base salary compensation for our executive officers is reviewed during the second fiscal quarter of each fiscal year, with changes in annual base compensation, if any, effective January 1 of each year. Equity incentives are reviewed from time to time as the Compensation Committee determines the need to ensure that equity incentives are properly aligned with the Company’s objectives. The Company has not historically had established annual equity incentive grants.
Compensation Policies
Employment Agreements: We have entered into an employment agreement dated July 1, 1995 with Mr. Jerry W Grabowski, our chief executive officer. The agreement provides for, an annual base salary, adjusted annually, incentive compensation and termination benefits. The termination benefits are described in detail in the narrative following “Potential Payments upon Termination or Change in Control.”
The agreement contains non-competition provisions that prohibit Mr. Grabowski from engaging or participating in a competitive business or soliciting Zareba’s customers or employees during his employment with us and for one year afterward. The agreement also contains provisions that restrict disclosure by Mr. Grabowski of the Company’s confidential information and assign ownership to the Company of inventions created by him in connection with his employment.
Based on the analysis of senior executive compensation practices for publicly held companies of similar size in our community and other relevant executive compensation factors and trends, the committee believes that employment agreements are customary at this level of leadership. We have not entered into employment agreements with any other employees.
Change-in-Control Agreements: The above-referenced employment agreement contains provisions related to a change-in-control of our company. The agreement is described in detail in the narrative following “Potential Payments upon Termination or Change in Control.” We do not maintain any other change-in-control policies or plans.
Severance Policy: The above-referenced employment agreement contains provisions related to severance payments upon termination of employment. The agreement is described in detail in the narrative following “Potential Payments upon Termination or Change in Control.” We do not maintain any other severance policies or plans.
Impact of Tax and Accounting Treatment on Compensation Decisions: We account for equity-based compensation paid to employees under Statement of Financial Accounting Standard No. 123(R) (“SFAS No. 123(R)”) promulgated by the Financial Accounting Standards Board, which requires us to estimate and record an expense over the service period of the award. Thus, we may record an expense in one year for awards granted in earlier years. We adopted SFAS No. 123(R) on July 1, 2006 and, therefore, fiscal year 2007 was the first year in which we recorded an expense related to employee stock options. Accounting rules also require us to record cash compensation as an expense at the time the obligation is accrued.
With respect to equity compensation awards, we generally can deduct the gain recognized by employees from nonqualified options. However, to the extent that an option is an incentive stock option, we cannot deduct the gain recognized by the optionee if there is no disqualifying disposition by the optionee.
Section 162(m) of the Internal Revenue Code of 1986 generally disallows a tax deduction to public companies for compensation in excess of $1 million paid to the companies’ chief executive officer and four other most highly-paid executive officers. Qualifying performance-based compensation will not be subject to the deduction limitation if
21
certain requirements are met. Because the potential amount of base salary and non-equity-based incentive compensation that the executive officers can earn is less than $1 million, Section 162(m) has not been material to our compensation decisions.
Components of Executive Officer Compensation
Base Salary: The Compensation Committee’s approach is to offer executives salaries competitive with those of other executives in the industry in which the Company operates. To that end, the Compensation Committee evaluates the competitiveness of base salaries based on information drawn from a variety of sources, including published and proprietary survey data and the Company’s own experience recruiting and retaining executives, although complete information is not easily obtainable. The Company’s base salary levels are intended to be consistent with competitive practice and level of responsibility, with salary increases reflecting competitive trends, the overall financial performance of the Company and the performance of the individual executive.
Annual Incentive Compensation: Executive officers receive annual incentive compensation to reward achievement of our key financial performance goals. These annual key financial performance goals are sales, sales performance and timeliness of new product and market initiatives, and net income. They are based on annual operating budgets established by management and submitted to the board for review. Annual incentive compensation is paid in cash. The targeted amounts for annual incentive compensation are set at or near market level for the industry based on our benchmarking data.
Annual incentive compensation for executive officers during fiscal year 2007 was determined in accordance with the incentive criteria established by the committee. The incentive compensation program provides for annual bonuses based on our company’s financial performance, within minimum threshold and maximum threshold ranges. The Company believes that the financial performance goals and threshold ranges were aggressive, but achievable for our named executive officers, but that disclosure of the specific targets would cause competitive harm.
Stock Option Awards: The committee grants stock options to provide additional incentives to maximize our company’s share value, and to make equity ownership an important component of executive compensation. Stock option award levels are determined based on market data, and vary based on an individual’s position within our company, time at our company, and contributions to our company’s performance. Stock options are granted at the closing market price of our common stock on the date of grant and vest over time. Vesting of recent stock option grants to executive officers occur on the fifth anniversary of the option grant, or sooner based upon achieving predetermined annual sales and net income amounts. During fiscal year 2007, we granted stock options to Mr. King in conjunction with his hiring. In addition to the provisions included in the option agreements of the other executive officers, Mr. King’s options agreement provides for the acceleration of vesting of the options in the event of a change in control of Zareba Systems subsidiary, Waters Medical Systems, Inc. Other stock options are granted from time to time based on the recommendation of the chief executive officer and reviewed and approved by the Compensation Committee.
Perquisites and Other Personal Benefits
We provide the named executive officers with certain perquisites and other personal benefits. These perquisites and other personal benefits include personal use of a company-leased automobile for the chief executive officer, and certain medical, dental, life insurance, and long term disability insurance benefits beyond those available to all other employees, and totaled less than $10,000 for each executive officer. The committee believes the perquisites and other personal benefits of our executive officers are in line with market.
Compensation Committee Report
The Compensation Committee has reviewed and discussed with management the Compensation Discussion and Analysis that appears herein. Based on such review and discussions, the committee recommended to our board of directors that the Compensation Discussion and Analysis be included in our 2007 Annual Report on Form 10-K. The name of each person who serves as a member of the committee is set forth below.
Mr. William R. Franta, Chairman
Mr. Eugene W. Courtney
Mr. Dale A. Nordquist
22
Compensation Committee Interlocks and Insider Participation
The members of the Compensation Committee are identified above under “Compensation Committee Report.” None of the members was an officer or employee of Zareba Systems during fiscal year 2007 or in any prior year and none of the members had any relationship requiring disclosure under Item 404(a) of Regulation S-K. There were no Compensation Committee interlocks as described in Item 407(e)(4) of Regulation S-K.
Summary Compensation Table
The following table sets forth information concerning the compensation of our named executive officers for fiscal year 2007:
| | | | | | | | | | | | | | | | | | | | | | | | | | | | | |
| | | | | | | | | | | | | | | | | | | Non-Equity | | | | |
| | | | | | | | | | | | | | | Option | | Incentive Plan | | All Other | | |
| Name and Principal | | | | | | | | | | Bonus | | Awards | | Compensation | | Compensation | | |
| Position | | Year | | Salary ($) | | ($)(1) | | ($)(2) | | ($)(3) | | ($)(4) | | Total ($) |
| Jerry W. Grabowski | | | 2007 | | | | 253,515 | | | | — | | | | 25,900 | | | | 107,000 | | | | | | | | 386,415 | |
President and Chief Executive Officer | | | | | | | | | | | | | | | | | | | | | | | | | | | | |
| |
| Jeffrey S. Mathiesen | | | 2007 | | | | 170,088 | | | | 5,000 | | | | — | | | | 48,000 | | | | | | | | 223,088 | |
Vice President and Chief Financial Officer | | | | | | | | | | | | | | | | | | | | | | | | | | | | |
| |
| Donald G. Dalland | | | 2007 | | | | 168,177 | | | | — | | | | — | | | | 40,000 | | | | | | | | 208,177 | |
Vice President, Engineering and Operations | | | | | | | | | | | | | | | | | | | | | | | | | | | | |
| |
| William John Frederick | | | 2007 | | | | 170,165 | | | | — | | | | — | | | | 30,000 | | | | | | | | 200,165 | |
Executive Vice President, Sales and Business Development | | | | | | | | | | | | | | | | | | | | | | | | | | | | |
| |
| Douglas E. King (5) | | | 2007 | | | | 137,527 | | | | 30,000 | | | | — | | | | — | | | | | | | | 167,527 | |
Vice President and General Manager, Waters Medical Systems, Inc. | | | | | | | | | | | | | | | | | | | | | | | | | | | | |
| | |
| (1) | | Represents bonus payments in recognition of work related to the sale of Waters Medical Systems, Inc. of $5,000 for Mr. Mathiesen and $20,000 for Mr. King, and a signing bonus of $10,000 related to Mr. King’s employment with the Company. |
| |
| (2) | | Represents the amounts recognized for financial statement reporting purposes for the fiscal year 2007 in accordance with FAS 123(R), and thus may include amounts from awards granted in and prior to the 2007 year. The assumptions used to determine the valuation of the awards are discussed in Note 3 to consolidated financial statements. |
| |
| (3) | | Represents non-equity incentive compensation earned in fiscal 2007 pursuant to performance criteria established by the Compensation Committee. |
| |
| (4) | | Perquisites totaled less than $10,000 for each named executive officer. |
| |
| (5) | | Mr. King became an executive officer of the Waters Medical Systems, Inc. subsidiary (WMS) on July 5, 2006 and resigned in conjunction with the sale of WMS on August 1, 2007. |
23
Grants of Plan-Based Awards
The following table sets forth information concerning equity incentive plan awards granted in fiscal year 2007 to our named executive officers:
| | | | | | | | | | | | | | | | | |
| | | | | | | All Other | | | | | | | Grant Date | |
| | | | | | | Option Awards: | | | Exercise | | | Fair Value | |
| | | | | | | Number of | | | or Base | | | of Stock | |
| | | | | | | Securities | | | Price of | | | and | |
| | | | | | | Underlying | | | Option | | | Option | |
| | | | | | | Options | | | Awards | | | Awards | |
| Name | | Grant Date | | | (#) | | | ($/Sh) | | | ($) | |
| Douglas E. King (1) | | | 10/26/06 | | | | 28,350 | | | | 6.71 | | | | 95,823 | |
| | |
| (1) | | Represent stock options awarded in conjunction with Mr. King joining the Company. Stock options vested 100% upon the sale of WMS on August 1, 2007, and expire on October 30, 2007, 90 days following Mr. King’s resignation on August 1, 2007. |
Outstanding Equity Awards at Fiscal Year-End
The following table sets forth information concerning outstanding equity awards held by our named executive officers at fiscal year end 2007:
| | | | | | | | | | | | | | | | | |
| | | Number of | | | | | | | | | | |
| | | Securities | | | Number of Securities | | | Option | | | | |
| | | Underlying | | | Underlying | | | Exercise | | | Option | |
| | | Unexercised Options | | | Unexercised Options | | | Price | | | Expiration | |
| Name | | (#) Exercisable | | | (#) Unexercisable | | | ($) | | | Date | |
| Jerry W. Grabowski | | | 4,875 | | | | — | | | | 3.63 | | | | 2/5/09 | |
| | | | 4.875 | | | | — | | | | 4.00 | | | | 2/5/10 | |
| | | | 15,000 | | | | — | | | | 2.67 | | | | 3/2/11 | |
| | | | — | | | | 30,000 | (1) | | | 5.90 | | | | 3/12/14 | |
| | | | — | | | | 50,000 | (2) | | | 8.38 | | | | 10/27/15 | |
| | | | | | | | | | | | | | | | | |
| Jeffrey S. Mathiesen | | | — | | | | 35,000 | (2) | | | 8.28 | | | | 12/10/15 | |
| | | | | | | | | | | | | | | | | |
| Donald G. Dalland | | | 4,875 | | | | — | | | | 3.83 | | | | 2/5/08 | |
| | | | 4,875 | | | | — | | | | 3.63 | | | | 2/5/09 | |
| | | | 4,875 | | | | — | | | | 4.00 | | | | 2/5/10 | |
| | | | — | | | | 30,000 | (2) | | | 8.38 | | | | 10/27/15 | |
| | | | | | | | | | | | | | | | | |
| William John Frederick | | | — | | | | 35,000 | (2) | | | 8.38 | | | | 10/27/15 | |
| | | | | | | | | | | | | | | | | |
| Douglas E. King (2) | | | — | | | | 28,350 | (2)(3) | | | 6.71 | | | | 10/26/16 | |
| | |
| (1) | | Options become exercisable on March 12, 2009. |
| |
| (2) | | Options fully vest and become exercisable on October 27, 2010 for Mssrs. Grabowski, Dalland and Frederick; on December 10, 2010 for Mr. Mathiesen; and on October 26, 2011 for Mr. King, subject to acceleration of vesting upon Zareba reaching certain performance targets as follows: |
| | • | | 1/3 of the options granted vest when annual revenues and pretax income reach $44 million and $1.3 million, respectively; |
| |
| | • | | 1/3 of the options granted vest when annual revenues and pretax income reach $50 million and $1.5 million, respectively; and, |
| |
| | • | | 1/3 of the options granted vest when annual revenues and pretax income reach $53 million and $1.6 million, respectively. |
| | | |
| (3) | | Mr. King’s options also contain an acceleration provision in which the options 100 percent vest upon the sale of WMS. Mr. King’s options vested August 1, 2007, and subject to Mr. King’s resignation on that same date, expire on October 30, 2007. |
24
Option Exercises and Stock Vested
The following table sets forth information concerning each exercise of stock options by our named executive officers at fiscal year end 2007:
| | | | | | | | | |
| | | Number of shares | | | Value | |
| | | acquired on | | | realized on | |
| | | exercise | | | exercise | |
| Name | | (#) | | | ($)(1) | |
| Jerry W. Grabowski | | | 4,875 | | | | 10,075 | |
| | |
| (1) | | Computed using closing price on the June 19, 2007 exercise date of $5.90 per share. |
Potential Payments upon Termination or Change in Control
We have an employment agreement with Jerry W. Grabowski, dated July 1, 1995, which provides for compensation in the event Mr. Grabowski’s employment with Zareba Systems is terminated under certain circumstances, as follows:
Upon termination of employment initiated by our Board of Directors, Mr. Grabowski will have the right to receive an amount equal to twelve months base salary and the cost of all existing health/medical and other benefit plans enjoyed by Mr. Grabowski on the effective date of termination (subject to the terms of the plans) or substantially the same benefits if the plan makes non-employees ineligible for benefits. Mr. Grabowski will also be entitled to receive on August 31, in the year immediately following the “Performance Period” (most recently ended fiscal year) in which a termination occurred, the incentive compensation he would have earned had his employment not been terminated. Such amount shall be prorated to reflect the number of months that he was employed by Zareba Systems prior to such termination.
In the event Mr. Grabowski’s employment with Zareba Systems is terminated within one year of a change in control, then, upon such termination, we will pay to Mr. Grabowski an additional amount equal to the base salary then in effect for one year, in addition to our obligation stated above.
In the event Mr. Grabowski’s employment with Zareba Systems is terminated as a result of Mr. Grabowski’s death, the Company will have no further obligation other than the applicable incentive compensation he would have received on August 31 in the year immediately following the fiscal year in which his employment terminated, prorated for the period in which he was employed.
In the Mr. Grabowski’s employment with Zareba Systems is terminated pursuant to Mr. Grabowski’s resignation, the Company will have no further obligation under the Agreement, including any accrued but unpaid incentive compensation, other than payment of accrued personal time off benefits.
25
The committee believes that the triggering events for Mr. Grabowski, set forth in his employment agreement, are in line with current compensation trends. The events that would trigger a named executive officer’s entitlement to payments or other benefits upon termination, and the value of the estimated payments and benefits are described in the following table, assuming a termination date and, where applicable, a change in control date of June 30, 2007, and a stock price of $7.00 per share, which was the closing price of one share of our common stock on June 29, 2007 (the last trading day of fiscal year 2007):
| | | | | | | | | | | | | | | | | |
| | | Continuation of Acceleration | | | | |
| | | Cash Medical/Welfare of Equity | | | | |
| Name | | Severance | | | Benefits | | | Awards | | | Total | |
| Jerry W. Grabowski | | | | | | | | | | | | | | | | |
| |
| Upon Termination by Board of Directors: (1) | | | 393,571 | | | | 4,453 | | | | — | | | | 398,024 | |
| |
| Upon termination pursuant to change in control: (2) | | | 654,090 | | | | 4,453 | | | | — | | | | 658,543 | |
| |
| Upon termination pursuant to resignation: (3) | | | 26,052 | | | | — | | | | — | | | | 26,052 | |
| |
| Upon termination pursuant to death: (4) | | | 133,052 | | | | — | | | | — | | | | 133,052 | |
| | |
| (1) | | Cash severance calculated as one times annual base pay of $260,519, plus fiscal 2007 incentive compensation earned of $107,000, plus accrued personal time off of $26,052. |
| |
| (2) | | Cash severance calculated as two times annual base pay of $260,519, plus fiscal 2007 incentive compensation earned of $107,000, plus accrued personal time off of $26,052. |
| |
| (3) | | Cash severance equal to accrued personal time off of $26,052. |
| |
| (4) | | Cash severance calculated as fiscal 2007 incentive compensation earned of $107,000, plus accrued personal time off of $26,052. |
Compensation of Directors
Each non-employee, non-officer director, excluding Mr. Grimstad, receives an annual retainer fee of $16,000 and meeting attendance fees of (i) $750 for each quarterly meeting of the Board attended, (ii) $50 for each breakfast or dinner meeting of the Board attended and (iii) $500 for each meeting of a Committee attended on which he serves. The chair of the Audit and Compensation Committees receives an additional annual retainer of $2,500 per committee. Each director receives reimbursement of travel expenses. Such directors also receive a monthly stipend of $50 to cover miscellaneous travel, telephone and meal expenses associated with Board responsibilities.
Compensation of our directors during fiscal year 2007 appears in the following table:
| | | | | | | | | | | | | |
| | | Fees earned | | | All other | | | | |
| | | or paid in | | | compensation | | | | |
| Name | | cash ($) | | | ($)(3) | | | Total ($) | |
| Eugene W. Courtney | | | 23,750 | | | | 600 | | | | 24,350 | |
| William R. Franta (1) | | | 28,750 | | | | 600 | | | | 29,350 | |
| John A. Grimstad (2) | | | — | | | | — | | | | — | |
| Dale A. Nordquist | | | 23,750 | | | | 600 | | | | 24,350 | |
| | |
| (1) | | Mr. Franta’s fees include an annual retainer of $2,500 each for serving as Chair of the Audit and Compensation Committees. |
| |
| (2) | | Mr. Grimstad serves as Company’s outside legal counsel and does not receive cash compensation for Board services. |
| |
| (3) | | Amount represents the $50 monthly stipend for miscellaneous travel and incidental expenses. |
26
Item 12. Security Ownership of Certain Beneficial Owners and Management and Related Stockholder Matters
Principal Shareholders
The following table provides information concerning the only persons known to us to be the beneficial owners of more than 5% of our outstanding Common Stock as of September 5, 2007.
Unless otherwise indicated in the footnotes to the table, each shareholder named in the table has sole voting and investment power with respect to the shares of Common Stock set forth opposite the shareholder’s name. We have based our calculation of the percentage of beneficial ownership on 2,452,291 shares of Common Stock outstanding on September 5, 2007.
| | | | | | | | | |
| | | | Number of Shares | | | |
| Name and Address of Beneficial Owner | | | Beneficially Owned (1) | | | Percent of Class |
Duane Schiefelbein
| | | 186,868 | (2) | | | 7.6 | % |
| 8555 South Robert Trail, Inver Grove Heights, MN 55007 | | | | | | | | |
Woodland Investment Company
| | | 258,000 | (3) | | | 10.5 | % |
| 3007 Skyway Circle North, Irving, TX 75038 | | | | | | | | |
Heartland Advisors, Inc.
| | | 228,000 | (4) | | | 9.3 | % |
| 789 North Water Street, Milwaukee, WI 53202 | | | | | | | | |
Nicole F. Kohl Gift Trust
| | | 135,000 | (5) | | | 5.5 | % |
| 3007 Skyway Circle North, Irving, TX 75038 | | | | | | | | |
Jerry W. Grabowski
| | | 125,125 | (6) | | | 5.1 | % |
| 13705 26th Avenue N., Suite 102, Minneapolis, MN 55441 | | | | | | | | |
| | |
| (1) | | Under the rules of the Securities and Exchange Commission, an individual is also deemed to beneficially own shares which are not outstanding but which the individual has the right to acquire as of September 5, 2007 or within 60 days of such date. Such shares not outstanding but so deemed beneficially owned are treated as outstanding when determining the percent of the class owned by the particular individual and when determining the percent owned by the group. |
| |
| (2) | | Represents shares held by Peace Shalom Foundation. Mr. Schiefelbein is the trustee of Peace Shalom Foundation and has voting and investment power of such shares. We have relied upon information contained in a Schedule 13G filed with the Securities and Exchange Commission by Mr. Schiefelbein on January 10, 2007. |
| |
| (3) | | According to the most current Schedule 13D filed by Woodland Investment Company and information provided to us, the power to vote and dispose (or to direct the vote or disposition) of such shares is shared with Atlee M. Kohl and Nicole F. Kohl, each of whom are thereby deemed to be beneficial owners of such shares. |
| |
| (4) | | Represents shares held for clients of Heartland Advisors, Inc. (“Heartland”), over which Heartland has shared dispositive power, and William J. Nasgovitz, President and principal shareholder of Heartland, may be deemed to have both shares voting and investment power over the shares. We have relied on information contained in a Schedule 13G filed with the Securities and Exchange Commission filed February 12, 2007 by Heartland and Mr. Nasgovitz. |
| |
| (5) | | According to the most current Schedule 13D filed by Kohl Gift Trust and information provided to us, the power to vote and dispose (or to direct the vote or disposition) of such shares is shared by the Northern Trust Company and Atlee M. Kohl, trustees of the Kohl Gift Trust. Mr. Kohl is deemed to be a beneficial owner of such shares. |
| |
| (6) | | Includes 24,750 shares which may be purchased by Mr. Grabowski upon exercise of options which are or will become exercisable within 60 days of September 5, 2007. |
27
Management Shareholdings
The following table sets forth the beneficial ownership of our Common Stock as of September 5, 2007 by (i) each director of the Company, (ii) the named executive officers, and (iii) all directors and executive officers as a group, as of September 5, 2007.
Unless otherwise indicated in the footnotes to the table, each shareholder named in the table has sole voting and investment power with respect to the shares of Common Stock set forth opposite the shareholder’s name. We have based our calculation of the percentage of beneficial ownership on 2,452,291 shares of Common Stock outstanding on September 5, 2007.
| | | | | | | | | |
| | | Number of Shares | | |
| Name of Officer or Director | | Beneficially Owned (1) | | Percent of Class |
| Jerry W. Grabowski | | | 125,125 | (2) | | | 5.1 | % |
| Eugene W. Courtney | | | 10,025 | (3) | | | * | |
| William R. Franta | | | 35,075 | (4) | | | 1.4 | % |
| John A. Grimstad | | | 45,875 | (5) | | | 1.9 | % |
| Dale A. Nordquist | | | 11,527 | (6) | | | * | |
| Donald J. Dalland | | | 21,449 | (7) | | | * | |
| William John Frederick | | | 4,500 | | | | * | |
| Officers and Directors as a Group (8 persons) | | | 271,705 | (8) | | | 10.6 | % |
| | |
| * | | Less than 1%. |
| |
| (1) | | Under the rules of the Securities and Exchange Commission, an individual is also deemed to beneficially own shares which are not outstanding but which the individual has the right to acquire as of September 5, 2007 or within 60 days of such date. Such shares not outstanding but so deemed beneficially owned are treated as outstanding when determining the percent of the class owned by the particular individual and when determining the percent owned by the group. |
| |
| (2) | | Includes 24,750 shares which may be purchased by Mr. Grabowski upon exercise of options which are or will become exercisable within 60 days of September 5, 2007. |
| |
| (3) | | Represents 10,025 shares which may be purchased by Mr. Courtney upon exercise of options which are or will become exercisable within 60 days of September 5, 2007. |
| |
| (4) | | Represents 35,075 shares which may be purchased by Mr. Franta upon exercise of options which are or will become exercisable within 60 days of September 5, 2007. |
| |
| (5) | | Includes 3,300 shares held by Mr. Grimstad’s wife and 20,000 shares which may be purchased by Mr. Grimstad upon exercise of options which are or will become exercisable within 60 days of September 5, 2007. |
| |
| (6) | | Represents 10,025 shares which may be purchased by Mr. Nordquist upon exercise of options which are or will become exercisable within 60 days of September 5, 2007. |
| |
| (7) | | Includes 14,625 shares which may be purchased by Mr. Dalland upon exercise of options which are or will become exercisable within 60 days of September 5, 2007. |
| |
| (8) | | Includes 114,500 shares which may be purchased by officers and directors upon exercise of options which are or will become exercisable within 60 days of September 5, 2007. |
Equity compensation plan information can be found in Item 5 of Part II of this report.
28
Item 13. Certain Relationships and Related Transactions, and Director Independence
Certain Relationships And Related Transactions
Under its charter, the Audit Committee has the responsibility to review and approve all related party transactions to which the Company may be a party prior to their implementation. To management’s knowledge, no director, officer or five percent shareholder or any family members of such persons had in fiscal year 2006 or 2007, or currently has, any material interest, direct or indirect, in any transaction in which Zareba Systems was involved that would require disclosure under Item 404 of Regulation S-K.
Director Independence
The Company’s Board of Directors has determined that a majority of its members are “independent” as defined by the listing standards of the Nasdaq Stock Market since none of them are believed to have any relationships that, in the opinion of the Board of Directors, would interfere with the exercise of independent judgment in carrying out the responsibilities of a director. Our current independent directors are Eugene W. Courtney, William R. Franta and Dale A. Nordquist. The Board of Directors has also determined that it satisfies the independence standards of the Nasdaq Stock Market with respect to the membership of the Board’s Audit Committee, Nominating Committee and Compensation Committee.
Item 14. Principal Accountant Fees and Services
Fees
The aggregate fees billed by Virchow, Krause & Company, LLP, our independent registered public accounting firm, for fiscal years 2007 and 2006 are as follows:
| | | | | | | | | |
| | | 2007 | | | 2006 | |
| Audit Fees | | $ | 167,065 | | | $ | 173,881 | |
| Audit-Related Fees | | | 0 | | | | 0 | |
| Tax Fees | | | 21,875 | | | | 31,490 | |
| All Other Fees | | | 0 | | | | 0 | |
| | | | | | | |
| | | $ | 188,940 | | | $ | 205,371 | |
Tax fees include fees for services provided in connection with year-end preparation, planning and services relating to preparation of federal and state tax returns.
The Audit Committee has considered whether provision of the above non-audit services is compatible with maintaining accountants’ independence and has determined that such services are compatible with maintaining accountants’ independence.
Pre-Approval Policy
The Audit Committee has not adopted a policy for pre-approval of all audit and non-audit services by its independent auditors, but it has routinely approved all audit and permitted non-audit services to be performed for Zareba Systems by its independent auditors.
29
PART IV
Item 15. Exhibits and Financial Statement Schedules
Financial Statements
The following Consolidated Financial Statements of Zareba Systems Inc. and subsidiaries are submitted in a separate financial statement of this report.
| | | | |
| | | Page Number |
| Report of Independent Registered Public Accounting Firm | | | 36 |
| Consolidated Balance Sheets – June 30, 2007 and 2006 | | | 37 |
| Consolidated Statements of Operations – Years ended June 30, 2007, 2006 and 2005 | | | 38 |
| Consolidated Statements of Stockholders’ Equity and Comprehensive Income – Years ended June 30, 2007, 2006 and 2005 | | | 39 |
| Consolidated Statements of Cash Flows – Years ended June 30, 2007, 2006 and 2005 | | | 40 |
| Notes to Consolidated Financial Statements | | | 41 |
Financial Statement Schedules
All financial statement schedules have been omitted because they are not applicable, are not required, or the information is included in the financial statements or notes thereto.
Exhibits
| | | | |
| Number | | Description and Reference |
| 3.1 | | | Restated Articles of Incorporation, as amended to date, incorporated by reference to Exhibit 3.1 to the Company’s quarterly report on Form 10-QSB for the fiscal quarter ended September 30, 2005. |
| | | | |
| 3.2 | | | Amended and Restated Bylaws, as amended to date, incorporated by reference to Exhibit 3.1 to the Company’s quarterly report on Form 8-K dated May 10, 2007. |
| | | | |
| 3.3 | | | Certificate of Designation of Series A Preferred Stock of Waters Instruments, Inc., incorporated by reference as part of Exhibit 4.1 of the Company’s Registration Statement on Form 8-A filed on March 16, 2005. |
| | | | |
| 4.1 | | | Rights Agreement dated as of March 15, 2005 between Waters Instruments, Inc. and Wells Fargo Bank, N.A. as Rights Agent, together with the following exhibits thereto: (A) Certificate of Designation of Series A Preferred Stock of Waters Instruments, Inc.; (B) Summary of Rights to Purchase Shares of Series A Preferred Stock; (C) Form of Right Certificate (pursuant to the Rights Agreement, Right Certificates will not be delivered until as soon as practicable after the Distribution Date), incorporated by reference to Exhibit 4.1 of the Company’s Registration Statement on Form 8-A filed on March 16, 2005. |
| | | | |
| 10.1* | | | 1995 Employment Agreement between the Company and Gerald W. Grabowski.** |
| | | | |
| 10.2 | | | 1995 Stock Option Plan, incorporated by reference to Exhibit 10.5 to the Company’s Annual Report on Form 10-KSB for the fiscal year ended June 30, 1996.** |
| | | | |
| 10.3 | | | 1997 Associates Stock Purchase Plan, incorporated by reference to Exhibit 10.7 to the Company’s Annual Report on Form 10-KSB for the fiscal year ended June 30, 1998.** |
| | | | |
| 10.4 | | | Amendment No. 1 to 1995 Stock Option Plan, incorporated by reference to Exhibit 10.8 to the Company’s Annual Report on Form 10-KSB for fiscal year ended June 30, 2000.** |
30
| | | | |
| Number | | Description and Reference |
| 10.5 | | | Restated Lease and Option to Purchase Agreement originally dated August 6, 2001 and amended and restated on October 15, 2002, by and between B&L Rentals, LLC (Landlord) and Waters Instruments, Inc. (Tenant), along with Termination of Lease Agreement dated November 3, 2003 by and between Landlord and Tenant, incorporated by reference to Exhibit 10.2 to the Company’s Annual Report on Form 10-KSB/A-1 for the fiscal year ended December 31, 2003. |
| | | | |
| 10.6 | | | Lease dated January 13, 2004 by and between 1620 Industrial Drive LLC and Waters Instruments, Inc., incorporated by reference to Exhibit 10.3 to the Company’s Annual Report on Form 10-KSB/A-1 for the fiscal year ended December 31, 2003. |
| | | | |
| 10.7 | | | Credit Facility Letter by and between Zareba Systems Europe Limited, a wholly-owned subsidiary of Waters Instruments, Inc., and Bank of Scotland dated September 27, 2004, incorporated by reference to Exhibit 10.2 to the Company’s quarterly report on Form 10-QSB for the fiscal quarter ended September 30, 2004. |
| | | | |
| 10.8 | | | Stock Purchase Agreement dated September 27, 2004 among Zareba Systems Europe Limited, a wholly-owned subsidiary of Waters Instruments, Inc., and certain individuals, incorporated by reference to Exhibit 2.1 of Form 8-K filed October 1, 2004. |
| | | | |
| 10.9 | | | 2004 Equity Incentive Plan, incorporated by reference to Exhibit 10.1 to the Company’s quarterly report on Form 10-QSB for the fiscal quarter ended December 31, 2004.** |
| | | | |
| 10.10 | | | Form of incentive stock option agreement and nonqualified stock option agreement currently used under the 2004 Equity Incentive Plan, incorporated by reference to Exhibit 10.1 to the Company’s quarterly report on Form 10-QSB for the fiscal quarter ended March 31, 2005.** |
| | | | |
| 10.11 | | | Form of restricted stock agreement currently used under the 2004 Equity Incentive Plan, incorporated by reference to Exhibit 10.2 to the Company’s quarterly report on Form 10-QSB for the fiscal quarter ended March 31, 2005.** |
| | | | |
| 10.12 | | | Form of stock appreciation rights agreement currently used under the 2004 Equity Incentive Plan, incorporated by reference to Exhibit 10.3 to the Company’s quarterly report on Form 10-QSB for the fiscal quarter ended March 31, 2005.** |
| | | | |
| 10.13 | | | Letter agreement dated August 29, 2005 with John Frederick, incorporated by reference to Exhibit 10.1 to the Company’s quarterly report on Form 10-QSB for the quarter ended September 30, 2005.** |
| | | | |
| 10.14 | | | Letter agreement dated October 17, 2005 with Jeff Mathiesen, incorporated by reference to Exhibit 10.1 to the Company’s quarterly report on Form 10-QSB for the quarter ended December 31, 2005.** |
| | | | |
| 10.15 | | | Stock Purchase Agreement for the Purchase and Sale of All Outstanding Shares of Capital Stock of Waters Medical Systems, Inc. dated as of July 24, 2007 between the Company and Holding GC, Inc., incorporated by reference to Exhibit 10.1 to Current Report on Form 8-K dated July 24, 2007 |
| | | | |
| 10.16 | | | Revolving Credit Agreement dated as of August 29, 2007 by and between the Company, Zareba Security, Inc. and JPMorgan Chase Bank, N.A., incorporated by reference to Exhibit 10.1 to Current Report on Form 8-K dated August 29, 2007 |
| | | | |
| 10.17 | | | Security Agreement dated as of August 29, 2007 by and between the Company and JPMorgan Chase Bank, N.A., incorporated by reference to Exhibit 10.2 to Current Report on Form 8-K dated August 29, 2007 |
| | | | |
| 10.18 | | | Security Agreement dated as of August 29, 2007 by and between Zareba Security, Inc. and JPMorgan Chase Bank, N.A., incorporated by reference to Exhibit 10.3 to Current Report on Form 8-K dated August 29, 2007 |
31
| | | | |
| Number | | Description and Reference |
| 10.19 | | | Revolving Notes dated as of August 29, 2007 by Zareba Systems, Inc and Zareba Securities, Inc. as Borrower and JPMorgan Chase Bank, N.A., as Lender, incorporated by reference to Exhibit 10.4 to Current Report on Form 8-K dated August 29, 2007 |
| | | | |
| 10.20 | | | Stock Pledge Agreement effective August 29, 2007 by and between the Company and JPMorgan Chase Bank, N.A., incorporated by reference to Exhibit 10.5 to Current Report on Form 8-K dated August 29, 2007 |
| | | | |
| 10.21 | | | Negative Pledge Agreement dated August 29, 2007 by Zareba Systems, Inc. in favor of JPMorgan Chase Bank, N.A., incorporated by reference to Exhibit 10.6 to Current Report on Form 8-K dated August 29, 2007 |
| | | | |
| 21.1* | | | List of Subsidiaries. |
| | | | |
| 23.1* | | | Consent of Independent Registered Public Accounting Firm -Virchow, Krause & Company, LLP. |
| | | | |
| 24.1* | | | Power of Attorney for Jerry W. Grabowski, Jeffrey S. Mathiesen, William R. Franta, John A. Grimstad, Eugene W. Courtney and Dale A. Nordquist (included on the signature page of this Form 10-K). |
| | | | |
| 31.1* | | | Certification of Chief Executive Officer pursuant to Section 302 of the Sarbanes-Oxley Act of 2002. |
| | | | |
| 31.2* | | | Certification of Chief Financial Officer pursuant to Section 302 of the Sarbanes-Oxley Act of 2002. |
| | | | |
| 32.1* | | | Certification of Chief Executive Officer pursuant to Section 906 of the Sarbanes-Oxley Act of 2002. |
| | | | |
| 32.2* | | | Certification of Chief Financial Officer pursuant to Section 906 of the Sarbanes-Oxley Act of 2002. |
| | | | |
| | |
| ** | | Management contract or compensatory plan. |
| |
| * | | Filed herewith. |
32
Signatures
Pursuant to the requirements of Section 13 or 15(d) of the Securities Exchange Act of 1934, the Company has duly caused this Report to be signed on its behalf by the undersigned, thereunto duly authorized, in Minneapolis, Minnesota, on September 27, 2007.
| | | | | |
| | Zareba Systems, Inc.
| |
| | By: | /s/ Jerry W. Grabowski | |
| | | Jerry W. Grabowski | |
| | | President and Chief Executive Officer | |
| |
Pursuant to the requirements of the Securities Exchange Act of 1934, this Report has been signed by the following persons on behalf of the Company in the capacities and on the dates indicated.
Power of Attorney
Each person whose signature appears below constitutes and appoints Jerry W. Grabowski, President, Chief Executive Officer, and Director, and Jeffrey S. Mathiesen, Chief Financial Officer as his true and lawful attorneys-in-fact and agents, each acting alone, with full power of substitution and resubstitution, for him and in his name, place and stead, in any and all capacities, to sign any or all amendments to this Annual Report on Form 10-K and to file the same, with all exhibits thereto, and other documents in connection therewith, with the Securities and Exchange Commission, granting unto said attorneys-in-fact and agents, acting alone, full power and authority to do and perform each and every act and thing requisite and necessary to be done in and about the premises, as fully to all intents and purposes as he might or could do in person, hereby ratifying and confirming said attorneys-in-fact and agents, acting alone, or his substitute or substitutes, may lawfully do or cause to be done by virtue hereof.
| | | | | |
| Signature | | Title | | Date |
| |
/s/ Jerry W. Grabowski
Jerry W. Grabowski | | President, Chief Executive Officer
(Principal Executive Officer) and Director | | September 27, 2007 |
| | | | | |
/s/ Jeffrey S. Mathiesen
Jeffrey S. Mathiesen | | Chief Financial Officer (Principal Financial Officer and Principal Accounting Officer) | | September 27, 2007 |
| | | | | |
/s/ William R. Franta
William R. Franta | | Director | | September 27, 2007 |
| | | | | |
/s/ John A. Grimstad
John A. Grimstad | | Director and Secretary | | September 27, 2007 |
| | | | | |
/s/ Eugene W. Courtney
Eugene W. Courtney | | Director | | September 27, 2007 |
| | | | | |
/s/ Dale A. Nordquist
Dale A. Nordquist | | Director | | September 27, 2007 |
33
Annual report on Form 10-K
Item 8, Item 15(a)(1) and (2)
List of Financial Statements and Financial Statement Schedules
Year Ended June 30, 2007
Zareba Systems, Inc.
Minneapolis, Minnesota
34
Form 10-K – Item 15(a)(1) and (2)
ZAREBA SYSTEMS, INC. AND SUBSIDIARIES
LIST OF FINANCIAL STATEMENTS AND FINANCIAL STATEMENT SCHEDULES
| |
| The following Consolidated Financial Statements of Zareba Systems, Inc. and subsidiaries are included in Item 8: |
| Report of Independent Registered Public Accounting Firm |
| Consolidated Balance Sheets – June 30, 2007 and 2006 |
| Consolidated Statements of Operations – Years ended June 30, 2007, 2006 and 2005 |
| Consolidated Statements of Stockholders’ Equity and Comprehensive Income – Years ended June 30, 2007, 2006 and 2005 |
| Consolidated Statements of Cash Flows – Years ended June 30, 2007, 2006 and 2005 |
| Notes to Consolidated Financial Statements |
35
REPORT OF INDEPENDENT REGISTERED PUBLIC ACCOUNTING FIRM
To the Stockholders, Audit Committee and Board of Directors
Zareba Systems, Inc.
Plymouth, Minnesota
We have audited the accompanying consolidated balance sheets of Zareba Systems, Inc. and subsidiaries as of June 30, 2007 and 2006, and the related consolidated statements of operations, stockholders’ equity and comprehensive income and cash flows for each of the three years in the period ended June 30, 2007. These consolidated financial statements are the responsibility of the company’s management. Our responsibility is to express an opinion on these consolidated financial statements based on our audits.
We conducted our audits in accordance with the standards of the Public Company Accounting Oversight Board (United States). Those standards require that we plan and perform the audit to obtain reasonable assurance about whether the consolidated financial statements are free of material misstatement. The Company is not required to have, nor were we engaged to perform, an audit of its internal control over financial reporting. Our audits included consideration of its internal control over financial reporting as a basis for designing audit procedures that are appropriate in the circumstances, but not for the purpose of expressing an opinion on the effectiveness of the Company’s internal control over financial reporting. Accordingly, we express no such opinion. An audit includes examining, on a test basis, evidence supporting the amounts and disclosures in the consolidated financial statements. An audit also includes assessing the accounting principles used and significant estimates made by management as well as evaluating the overall consolidated financial statement presentation. We believe that our audits provide a reasonable basis for our opinion.
As discussed in Note 1 to the consolidated financial statements, effective July 1, 2006, the Company adopted Financial Accounting Standards Board Statement No. 123(R), “Share-Based Payment.”
In our opinion, the consolidated financial statements referred to above present fairly, in all material respects, the financial position of Zareba Systems, Inc. and subsidiaries as of June 30, 2007 and 2006 and the results of their operations and their cash flows for each of the three years in the period ended June 30, 2007, in conformity with U.S. generally accepted accounting principles.
/s/ Virchow, Krause & Company, LLP
Minneapolis, Minnesota
September 20, 2007
36
ZAREBA SYSTEMS, INC. AND SUBSIDIARIES
Consolidated Balance Sheets
| | | | | | | | | |
| | | June 30, | | | June 30, | |
| (Dollars in thousands, except per share amounts) | | 2007 | | | 2006 | |
| |
Current assets | | | | | | | | |
| Cash and cash equivalents | | $ | 1,614 | | | $ | 1,414 | |
| Accounts receivable, net | | | 7,671 | | | | 8,009 | |
| Inventories | | | 6,503 | | | | 5,995 | |
| Other current assets | | | 1,227 | | | | 923 | |
| Current assets of discontinued operations | | | 729 | | | | 981 | |
| |
Total current assets | | | 17,744 | | | | 17,322 | |
| |
Property, plant and equipment, net | | | 3,150 | | | | 3,720 | |
| |
Other assets | | | | | | | | |
| Goodwill | | | 6,616 | | | | 6,151 | |
| Trademarks | | | 2,686 | | | | 2,638 | |
| Customer relationships, net | | | 1,447 | | | | 1,647 | |
| Non-compete agreement, net | | | — | | | | 21 | |
| Other, net | | | 211 | | | | 281 | |
| Other assets of discontinued operations | | | 19 | | | | 57 | |
| |
Total other assets | | | 10,979 | | | | 10,795 | |
| |
TOTAL ASSETS | | $ | 31,873 | | | $ | 31,837 | |
| |
| | | | | | | | | |
Current liabilities | | | | | | | | |
| Accounts payable | | $ | 4,712 | | | $ | 4,510 | |
| Accrued salaries, wages, and other compensation | | | 899 | | | | 603 | |
| Accrued product warranties | | | 519 | | | | 513 | |
| Other accrued liabilities | | | 1,001 | | | | 1,445 | |
| Income taxes payable | | | 207 | | | | 97 | |
| Short-term borrowing | | | — | | | | 300 | |
| Current maturities of long-term debt and non-compete agreement | | | 6,326 | | | | 1,413 | |
| Current liabilities of discontinued operations | | | 123 | | | | 171 | |
| |
Total current liabilities | | | 13,787 | | | | 9,052 | |
| |
| Deferred income taxes | | | 1,096 | | | | 923 | |
| Long-term debt, less current maturities | | | 2,269 | | | | 8,234 | |
| |
Total liabilities | | | 17,152 | | | | 18,209 | |
| |
| | | | | | | | | |
Stockholders’ equity | | | | | | | | |
| Undesignated shares as of June 30, 2007 and June 30, 2006, $0.01 par value, 39,950,000 shares authorized, none issued or outstanding; | | | — | | | | — | |
| Series A Preferred Stock as of June 30, 2007 and June 30, 2006, $0.01 par value per share, 50,000 shares authorized, none issued or outstanding | | | — | | | | — | |
| Common stock as of June 30, 2007 and June 30, 2006, par value $.01 per share; authorized: 20,000,000 shares; issued and outstanding 2,452,291 and 2,424,786 shares, respectively | | | 25 | | | | 24 | |
| Additional paid-in capital | | | 2,133 | | | | 1,987 | |
| Accumulated other comprehensive income: | | | | | | | | |
| Foreign currency translation adjustment | | | 488 | | | | 152 | |
| Retained earnings | | | 12,075 | | | | 11,465 | |
| |
Total stockholders’ equity | | | 14,721 | | | | 13,628 | |
| |
TOTAL LIABILITIES AND STOCKHOLDERS’ EQUITY | | $ | 31,873 | | | $ | 31,837 | |
| |
See notes to the consolidated financial statements.
37
ZAREBA SYSTEMS, INC. AND SUBSIDIARIES
Consolidated Statements of Operations
| | | | | | | | | | | | | |
| | | | Year ended June 30, |
| (Dollars in thousands, except per share data) | | 2007 | | 2006 | | 2005 |
| |
Net sales | | $ | 35,683 | | | $ | 32,296 | | | $ | 29,471 | |
| Cost of goods sold | | | 23,511 | | | | 22,027 | | | | 18,737 | |
| |
Gross profit | | | 12,172 | | | | 10,269 | | | | 10,734 | |
| Operating expenses | | | | | | | | | | | | |
| Selling, general and administrative | | | 9,263 | | | | 8,921 | | | | 7,996 | |
| Research and development | | | 1,280 | | | | 1,272 | | | | 1,091 | |
| |
| Total operating expenses | | | 10,543 | | | | 10,193 | | | | 9,087 | |
| |
Income from operations | | | 1,629 | | | | 76 | | | | 1,647 | |
| |
| Interest income | | | 29 | | | | 29 | | | | 22 | |
| Interest expense | | | (844 | ) | | | (797 | ) | | | (518 | ) |
| Other income (expense), net | | | (210 | ) | | | (304 | ) | | | (269 | ) |
| |
Income (loss) before income taxes | | | 604 | | | | (996 | ) | | | 882 | |
| Income tax provision (benefit) | | | 232 | | | | (356 | ) | | | 240 | |
| |
Income (loss) from continuing operations | | | 372 | | | | (640 | ) | | | 642 | |
| Gain from discontinued operations, net of tax | | | 238 | | | | 339 | | | | 208 | |
| |
Net income(loss) | | $ | 610 | | | $ | (301 | ) | | $ | 850 | |
| |
| | | | | | | | | | | | | |
| Income (loss) from continuing operations per common and common equivalent share: | | | | | | | | | | | | |
| basic | | $ | 0.15 | | | $ | (0.26 | ) | | $ | 0.27 | |
| diluted | | $ | 0.15 | | | $ | (0.26 | ) | | $ | 0.26 | |
| | | | | | | | | | | | | |
| Gain from discontinued operations per common and common equivalent share: | | | | | | | | | | | | |
| basic | | $ | 0.10 | | | $ | 0.14 | | | $ | 0.09 | |
| diluted | | $ | 0.10 | | | $ | 0.14 | | | $ | 0.08 | |
| | | | | | | | | | | | | |
| Net income (loss) per common and common equivalent share: | | | | | | | | | | | | |
| basic | | $ | 0.25 | | | $ | (0.12 | ) | | $ | 0.36 | |
| diluted | | $ | 0.25 | | | $ | (0.12 | ) | | $ | 0.34 | |
| | | | | | | | | | | | | |
| Cash dividends per share: | | $ | 0.00 | | | $ | 0.04 | | | $ | 0.04 | |
| | | | | | | | | | | | | |
| Weighted average number of shares outstanding | | | | | | | | | | | | |
| basic | | | 2,429,354 | | | | 2,410,285 | | | | 2,392,460 | |
| diluted | | | 2,472,023 | | | | 2,410,285 | | | | 2,500,434 | |
See notes to the consolidated financial statements.
38
ZAREBA SYSTEMS, INC. AND SUBSIDIARIES
Consolidated Statements of Stockholders’ Equity and Comprehensive Income
| | | | | | | | | | | | | | | | | | | | | | | | | |
| | | | | | | | | | | | | | | Accumulated | | | | | | | |
| | | | | | | | | | | | | | | Other | | | | | | | |
| | | | | | | | | | | | | | | Comprehensive | | | | | | | |
| | | | | | | | | | | | | | | Income (Loss) | | | | | | | |
| | | Common Stock | | | | | | | Foreign Currency | | | | | | | |
| | | Outstanding | | | Amount | | | Additional Paid | | | Translation | | | Retained | | | Stockholders’ | |
| (In thousands) | | Shares | | | Amount | | | In Capital | | | Adjustment | | | Earnings | | | Equity | |
| |
Balance June 30, 2004 | | | 2,350 | | | $ | 23 | | | $ | 1,779 | | | $ | — | | | $ | 11,108 | | | $ | 12,910 | |
| Comprehensive income: | | | | | | | | | | | | | | | | | | | | | | | | |
| Net income | | | — | | | | — | | | | — | | | | — | | | | 850 | | | | 850 | |
| Foreign currency translation adjustment | | | — | | | | — | | | | — | | | | (13 | ) | | | — | | | | (13 | ) |
| | | | | | | | | | | | | | | | | | | | | | | | |
| Total comprehensive income | | | | | | | | | | | | | | | | | | | | | | | 837 | |
| | | | | | | | | | | | | | | | | | | | | | | | |
| Dividends paid ($.04/share) | | | — | | | | — | | | | — | | | | — | | | | (96 | ) | | | (96 | ) |
| Issuance of common stock | | | | | | | | | | | | | | | | | | | | | | | | |
| Employee Stock Purchase Plan | | | 46 | | | | 1 | | | | 51 | | | | — | | | | — | | | | 52 | |
| Exercise of stock options | | | 9 | | | | 0 | | | | 64 | | | | — | | | | — | | | | 64 | |
| |
Balance June 30, 2005 | | | 2,405 | | | | 24 | | | | 1,894 | | | | (13) | | | | 11,862 | | | | 13,767 | |
| Comprehensive income: | | | | | | | | | | | | | | | | | | | | | | | | |
| Net loss | | | | | | | | | | | | | | | | | | | (301 | ) | | | (301 | ) |
| Foreign currency translation adjustment | | | — | | | | — | | | | — | | | | 165 | | | | — | | | | 165 | |
| | | | | | | | | | | | | | | | | | | | | | | | |
| Total comprehensive loss | | | | | | | | | | | | | | | | | | | | | | | (136 | ) |
| | | | | | | | | | | | | | | | | | | | | | | | |
| Dividends paid ($.04/share) | | | — | | | | — | | | | — | | | | — | | | | (96 | ) | | | (96 | ) |
| Issuance of Common Stock | | | | | | | | | | | | | | | | | | | | | | | | |
| Employee Stock Purchase Plan | | | 5 | | | | — | | | | 37 | | | | — | | | | — | | | | 37 | |
| Exercise of stock options | | | 15 | | | | — | | | | 56 | | | | — | | | | — | | | | 56 | |
| |
Balance June 30, 2006 | | | 2,425 | | | | 24 | | | | 1,987 | | | | 152 | | | | 11,465 | | | | 13,628 | |
| Comprehensive income: | | | | | | | | | | | | | | | | | | | | | | | | |
| Net income | | | | | | | | | | | | | | | | | | | 610 | | | | 610 | |
| Foreign currency translation adjustment, net of tax effect | | | — | | | | — | | | | — | | | | 336 | | | | — | | | | 336 | |
| | | | | | | | | | | | | | | | | | | | | | | | |
| Total comprehensive income | | | | | | | | | | | | | | | | | | | | | | | 946 | |
| | | | | | | | | | | | | | | | | | | | | | | | |
| Stock based compensation | | | — | | | | — | | | | 39 | | | | — | | | | — | | | | 39 | |
| Issuance of Common Stock | | | | | | | | | | | | | | | | | | | | | | | | |
| Employee Stock Purchase Plan | | | 7 | | | | — | | | | 31 | | | | — | | | | — | | | | 31 | |
| Exercise of stock options | | | 20 | | | | 1 | | | | 76 | | | | — | | | | — | | | | 77 | |
| |
Balance June 30, 2007 | | | 2,452 | | | $ | 25 | | | $ | 2,133 | | | $ | 488 | | | $ | 12,075 | | | $ | 14,721 | |
| |
See notes to the consolidated financial statements.
39
ZAREBA SYSTEMS, INC. AND SUBSIDIARIES
Consolidated Statements of Cash Flows
| | | | | | | | | | | | | |
| | | | Year ended June 30, |
| (In thousands) | | 2007 | | 2006 | | 2005 |
| |
| Reconciliation of net income (loss) to net cash provided by operations | | | | | | | | | | | | |
| Net income (loss) | | $ | 610 | | | $ | (301 | ) | | $ | 850 | |
| Adjustments to reconcile net income (loss) to cash flows from operating activities: | | | | | | | | | | | | |
| Depreciation and amortization | | | 1,289 | | | | 1,448 | | | | 1,392 | |
| Loss on disposal of plant and equipment | | | 5 | | | | 46 | | | | 5 | |
| Stock based compensation expense | | | 39 | | | | — | | | | — | |
| Allowance for doubtful accounts | | | (105 | ) | | | (72 | ) | | | 127 | |
| Deferred income taxes | | | (210 | ) | | | (144 | ) | | | (71 | ) |
| Inventory valuation adjustment | | | — | | | | 641 | | | | — | |
| Changes in assets and liabilities, net of effects of acquisition: | | | | | | | | | | | | |
| Accounts receivable | | | 588 | | | | (871 | ) | | | (639 | ) |
| Inventories | | | (47 | ) | | | (993 | ) | | | 811 | |
| Other assets | | | (164 | ) | | | (159 | ) | | | 303 | |
| Accounts payable and accrued expenses | | | (252 | ) | | | 2,154 | | | | (1,094 | ) |
| |
NET CASH PROVIDED BY OPERATIONS | | | 1,753 | | | | 1,749 | | | | 1,684 | |
| |
| Cash flows provided by (used in) investing activities: | | | | | | | | | | | | |
| Purchase of property and equipment | | | (176 | ) | | | (347 | ) | | | (272 | ) |
| Acquisition of business, net of cash acquired | | | (11 | ) | | | (46 | ) | | | (8,608 | ) |
| |
Net cash provided by (used in) investing activities | | | (187 | ) | | | (393 | ) | | | (8,880 | ) |
| |
| Cash flows provided by (used in) financing activities: | | | | | | | | | | | | |
| Proceeds from long-term borrowing | | | — | | | | — | | | | 11,190 | |
| Net advances on revolving credit facility | | | 152 | | | | 585 | | | | — | |
| Net advances (payments) on short-term borrowings | | | (300 | ) | | | (200 | ) | | | 20 | |
| Payments on non-compete liability | | | (250 | ) | | | (250 | ) | | | (250 | ) |
| Cash dividend payment | | | — | | | | (96 | ) | | | (96 | ) |
| Payment for debt issuance costs | | | — | | | | — | | | | (384 | ) |
| Proceeds from the sale of common stock | | | 108 | | | | 93 | | | | 116 | |
| Payments on long-term debt | | | (1,182 | ) | | | (1,133 | ) | | | (2,352 | ) |
| |
Net cash provided by (used in) financing activities | | | (1,472 | ) | | | (1,001 | ) | | | 8,244 | |
| Effect of exchange rate changes in cash | | | 106 | | | | 5 | | | | 6 | |
| Net increase in cash and cash equivalents | | | 200 | | | | 360 | | | | 1,054 | |
Cash and cash equivalents — beginning of period | | | 1,414 | | | | 1,054 | | | | — | |
| |
CASH AND CASH EQUIVALENTS — END OF PERIOD | | $ | 1,614 | | | $ | 1,414 | | | $ | 1,054 | |
| |
| |
Supplemental Schedule of Investing and Financing Activities | | | | | | | | | | | | |
| Accrued additional purchase price related to earn-out payment | | $ | — | | | $ | 56 | | | $ | 49 | |
| Adjustment to goodwill and income tax liability for Rutland acquisition (See Note 4) | | $ | 250 | | | $ | — | | | $ | — | |
| Business acquisition | | | | | | | | | | | | |
| Fair value of assets acquired, less cash acquired | | $ | — | | | $ | — | | | $ | 6,127 | |
| Purchase price assigned to goodwill trademarks and customer relationships | | | — | | | | — | | | | 5,661 | |
| Assumed accounts payable and accrued expenses | | | — | | | | — | | | | (3,241 | ) |
See notes to the consolidated financial statements.
40
ZAREBA SYSTEMS, INC. AND SUBSIDIARIES
Notes to Consolidated Financial Statements
June 30, 2007, 2006 and 2005
Note 1 — Nature of Business and Significant Accounting Policies
Nature of Business:Zareba Systems, Inc. (Zareba) designs, manufactures and markets electronic perimeter fence and access control systems, operating in one world-wide business segment. Zareba has three subsidiaries, Zareba Systems Europe Limited, Zareba Security, Inc. and Zareba Systems of Canada LTD. The sales of products from the business units occur principally within North America and the United Kingdom. Zareba’s electronic perimeter fence systems include energizers, high tensile fence systems, insulators, poly wire, tape and rope, automatic gate openers and perimeter security fence systems for human and animal control, containment, and deterrent.
Basis of Presentation:The accompanying consolidated financial statements include the accounts of Zareba Systems, Inc. and its wholly-owned subsidiaries, Zareba Systems Europe Limited, Zareba Security, Inc., Zareba Systems of Canada, Ltd. and the discontinued operations of Waters Medical Systems, Inc. and (collectively, “Zareba” or the “Company”). All inter-company accounts and transactions between consolidated entities have been eliminated.
Use of Estimates:The preparation of financial statements, in conformity with accounting principles generally accepted in the United States, requires management to make estimates and assumptions that affect the amounts reported in the financial statements and accompanying notes. Actual results could differ from those estimates.
Discontinued Operations:The sale of the Zareba’s Waters Medical Systems, Inc. (WMS) subsidiary to a third party was completed on August 1, 2007 pursuant to the terms of a Stock Purchase Agreement dated July 24, 2007. The transaction involved the sale of 100 percent of the stock of WMS. The Company had substantially completed negotiation of the sale in the quarter ended June 30, 2007.
The transaction met the requirements of Statement of Accounting Financial Standards (SFAS) No. 144, “Accounting for Impairment or Disposal of Long-Lived Assets” as being held for sale. Accordingly, the Company has restated the previously reported financial results of WMS to report the net results as a separate line in the consolidated statements of operations as “Gain from discontinued operations, net of tax” for all periods presented, and the assets and liabilities of WMS on consolidated balance sheets have separately classified as “Assets/Liabilities of discontinued operations”. In accordance with Emerging Issues Task Force (EITF) 87-24, “Allocation of Interest to Discontinued Operations”, the Company elected to not allocate consolidated interest expense to the discontinued operations where the debt is not directly attributed to or related to the discontinued operations. All of the financial information in the consolidated financial statements and notes to the consolidated financial statements has been revised to reflect only the results of continuing operations (see Note 11).
Cash and Cash Equivalents:All highly liquid investments with original maturities of three months or less are considered to be cash equivalents. Generally, the Company’s cash equivalents consist primarily of tax-exempt money market instruments and highly liquid debt securities of corporations and municipalities. These investments are denominated in U.S. dollars. The carrying amount of cash equivalents approximates fair value due to the short maturity of these instruments. The Company deposits its cash in high credit quality financial institutions. The balance, at times, may exceed federally insured limits.
Accounts Receivable:The Company generally requires no collateral from its customer with respect to trade accounts receivable. The Company reviews customers’ credit history before extending unsecured credit and establishes an allowance for uncollectible accounts based upon factors surrounding the credit risk of specific customers, historical experience and the expected ability to collect all accounts receivable. Credit risk on accounts receivable is minimized as a result of the large and diverse nature of the Company’s customer base. Invoices are due 30 days after presentation. Accounts receivable over 30 days are considered past due. The Company does not accrue interest on past due accounts receivable. Receivables are written off only after all collection attempts have failed and are based on individual credit evaluation and specific circumstances of the customer.
Inventories:Our inventories are stated at the lower of cost or market and include materials, labor and overhead. Cost is determined by the first-in, first-out (“FIFO”) method. Provisions to reduce inventories to the lower of cost or
41
market are made based on a review of excess and obsolete inventories through an examination of historical component consumption, current market demands and shifting product technology. Significant assumptions with respect to market trends are utilized to formulate our provision methods. Sudden or downward changes in markets we serve may cause us to record additional inventory revaluation charges in future periods.
Property, Plant and Equipment:Property, plant and equipment are recorded at cost less accumulated depreciation. Depreciation is computed on the straight-line method over estimated useful lives of 40 years for buildings, 5 to 15 years for improvements, and 3 to 10 years for machinery, equipment, and office furniture. Leasehold improvements are amortized using the straight line method over the shorter of the lease term or the estimated useful life of the assets. Maintenance and repairs are charged to expense as incurred. Major betterments and improvements, which extend the useful life of the item, are capitalized and depreciated. The cost and accumulated depreciation of property, plant and equipment retired or otherwise disposed of are removed from the related accounts, and any residual values are charged or credited to expenses.
Intangible Assets:In accordance with SFAS 142, “Goodwill and Other Intangible Assets”, the goodwill and trademarks acquired with the purchase of North Central Plastics (NCP) and Rutland (United Kingdom) are not being amortized, but are subject to periodic impairment testing. The trademarks are considered an indefinite lived intangible and therefore, not subject to amortization but rather periodic impairment tests. The NCP non-compete agreement has been amortized on a straight-line basis over five years. The Rutland customer relationships are being amortized on a straight-line basis over seven years.
Impairment of Long-lived Assets:The Company evaluates the carrying value of long-lived assets, including identifiable intangibles, for impairment when events or changes in circumstances indicate that the carrying amount of an asset may not be recoverable. If impairment indicators are present and the estimated future undiscounted cash flows are less than the carrying value of the assets, the carrying value is reduced to the estimated fair value as measured by the associated discounted cash flows.
Under SFAS No. 142, the Company evaluates goodwill for impairment annually using a two-step test based upon a fair value approach. The first step is used to identify a potential impairment, while the second step calculates the amount of impairment, if any. Additionally, goodwill shall be tested for impairment between annual tests if an event occurs or circumstances change that would more likely than not reduce the fair value of an entity below its carrying value. To date, the Company has not recognized any impairment losses.
Fair Value of Financial Instruments:The fair value of cash and cash equivalents, accounts receivable, accounts payable, and short-term borrowings approximate the carrying amount because of the short maturity of those instruments. The fair value of the Company’s long-term debt is estimated based on the quoted market prices for the same or similar issues or the current rates offered to the Company for debt with the same or similar remaining maturities and terms. At June 30, 2007, the fair value of the Company’s long-term debt approximated their carrying value.
Revenue Recognition:The Company recognizes revenue in accordance with the Securities Exchange Commission’s Staff Accounting Bulletin No. 104 (SAB 104) “Revenue Recognition,” which requires that four basic criteria be met before revenue can be recognized: (i) persuasive evidence of a customer arrangement exists; (ii) the price is fixed or determinable; (iii) collectibility is reasonably assured; and (iv) product delivery has occurred or services have been rendered. Sales are not conditional based on customer acceptance provisions or installation obligations. The Company primarily utilizes independent manufacturers’ representatives to facilitate sales orders (with no right of return or other Company obligation), as well as having direct sales for key accounts or product lines. The Company recognizes revenue as products are shipped based on FOB shipping point terms when title passes to the customer. The Company accounts for customer rebates on the accrual basis when they are probable and can be estimated. The Company estimates and accrues for sales returns based upon historical experience.
42
Product Warranty:The Company offers a warranty on various products and services. The Company estimates the costs that may be incurred under its warranties and records a liability in the amount of such costs at the time the product is sold. Factors that affect the Company’s warranty liability include the number of units sold, historical and anticipated rates of warranty claims and cost per claim. The Company periodically assesses the adequacy of its recorded warranty liabilities and adjusts the amounts as necessary. The amount of charges to the warranty reserve is equal to the costs to repair or otherwise satisfy the claim.
Foreign Currency Translations and Transactions:Foreign assets and liabilities are translated using the year-end exchange rates. Results of operations are translated using the average rates throughout the year. The translation gains or losses are accumulated as a separate component of stockholders’ equity.
Comprehensive Income (Loss):The components of comprehensive income (loss) include net income (loss) and the effects of foreign currency translation adjustments. The net tax effect of the foreign currency translation adjustment for fiscal 2007 was $275,000, and was not significant for the other years presented.
Shipping and Handling:In accordance with the EITF issue 00-10, “Accounting for Shipping and Handling Fees and Costs,” the Company includes shipping and handling revenues in net sales and shipping and handling costs in operating expenses. Shipping and handling costs included in operating expenses were $1.4 million, $1.3 million and $1.3 million for each of the years ended June 30, 2007, 2006 and 2005, respectively.
Stock-Based Compensation:Commencing July 1, 2006, we adopted SFAS No. 123(R),Share Based Payment (SFAS 123(R)), and SEC Staff Accounting Bulletin No. 107,Share Based Payment,(“SAB 107”) requiring all share-based payments, including grants of stock options, to be recognized in the income statement as an operating expense, based on their fair value over the requisite service period. We have applied the modified prospective method in adopting SFAS 123(R). Under the modified prospective approach, SFAS 123R applies to new awards and to awards that were outstanding on July 1, 2006 that are subsequently modified, repurchased, cancelled or vested. Under the modified prospective approach, compensation cost recognized in fiscal 2007 includes compensation cost for all share-based payments granted prior to, but not yet vested on, July 1, 2006, based on the grant-date fair value estimated in accordance with the provisions of SFAS 123R, and compensation cost for all shared-based payments granted subsequent to July 1, 2006, based on the grant-date fair value estimated in accordance with the provisions of SFAS 123R. See Note 3.
Employee Benefits:The Company has a calendar year-end 401(k) deferred savings plan for all United States employees (associates) who have completed six months of service. The Company may make matching and discretionary contributions. During each of the years ended June 30, 2007, 2006 and 2005, the Company expensed $52,000, $39,000 and $35,000 in matching contributions, respectively.
The Company offers medical insurance to its U.S. associates, which it self-insures up to $35,000 per individual and $1,000,000 in aggregate. During the years ended June 30, 2007, 2006 and 2005, the amounts charged to general and administrative expense under this plan were $367,000, $428,000 and $234,000, respectively.
Advertising Costs:The Company follows the policy of charging production costs of advertising to expense as incurred. Advertising expenses for fiscal years ended June 30, 2007, 2006 and 2005 were $862,000, $791,000 and $736,000, respectively.
Income Taxes:Deferred income taxes are provided on a liability method whereby deferred tax assets are recognized for deductible temporary differences and operating loss and tax credit carry forwards. Deferred tax liabilities are recognized for taxable temporary differences, which are the differences between the reported amounts of assets and liabilities and their tax basis. Deferred tax assets are reduced by a valuation allowance when, in the opinion of management, it is more likely than not that some portion or all of the deferred tax assets will not be realized. Deferred tax assets and liabilities are adjusted for the effects of changes in tax laws and rates on the date of enactment. The Company has not recognized a deferred tax liability relating to its operations in the United Kingdom. To date, the United Kingdom does not have any material undistributed earnings. If any undistributed earnings are remitted to the Company in the future, income taxes, if any, after the application of foreign tax credits will be provided at that time.
43
Earnings or Loss per Share:Basic income or loss per share is determined based on the weighted average common shares outstanding, while the diluted income per share also give effect to the common shares dilutive potential. A reconciliation of the denominator in the basic and diluted income or loss per share calculation is as follows:
| | | | | | | | | | | | | |
| | | Year ended June 30, |
| (In thousands, except per share data) | | 2007 | | | 2006 | | 2005 | |
| |
| Numerator: | | | | | | | | | | | | |
| Net income (loss) | | $ | 610 | | | $ | (301 | ) | | $ | 850 | |
| |
| Denominator: | | | | | | | | | | | | |
| Denominator for basic earnings (loss) per share, weighted average shares | | | 2,429 | | | | 2,410 | | | | 2,392 | |
| Dilutive potential shares – employee stock options | | | 43 | | | | — | | | | 108 | |
| |
| Denominator for diluted earnings (loss) per share, weighted average shares | | | 2,472 | | | | 2,410 | | | | 2,500 | |
| |
| Net income (loss) per share-basic | | $ | 0.25 | | | $ | (0.12 | ) | | $ | 0.36 | |
| Net income (loss) per share-diluted | | $ | 0.25 | | | $ | (0.12 | ) | | $ | 0.34 | |
| |
The dilutive effect of these additional shares for the years ended June 30, 2007 and 2005 was to increase the weighted average shares outstanding by 43,000 and 108,000 shares, respectively. Dilutive potential common shares were excluded from calculation of the denominator in fiscal year 2006 because the effect would be antidilutive.
New Accounting Pronouncements:In June 2006, the Financial Accounting Standards Board (FASB) issued Interpretation No. 48 (FIN No. 48), “Accounting for Uncertainty in Income Taxes”, to address the noncomparability in reporting tax assets and liabilities resulting from a lack of specific guidance in SFAS No. 109, “Accounting for Income Taxes”, on the uncertainty in income taxes recognized in an enterprise’s financial statements. Specifically, FIN No. 48 prescribes (a) a consistent recognition threshold and (b) a measurement attribute for the financial statement recognition and measurement of a tax position taken or expected to be taken in a tax return, and provides related guidance on derecognition, classification, interest and penalties, accounting interim periods, disclosure and transition. FIN No. 48 will apply to fiscal years beginning after December 15, 2006, our fiscal year 2008. The Company has not yet determined the impact the adoption of FIN No. 48 will have on the consolidated financial statements.
Note 2 — Balance Sheet Information
The allowance for doubtful accounts was as follows:
| | | | | | | | | | | | | |
| | | June 30, | | | |
| (In thousands) | | 2007 | | 2006 | | 2005 |
| |
| Beginning balance | | $ | 50 | | | $ | 189 | | | $ | 67 | |
| Provision for doubtful accounts | | | (15 | ) | | | (40 | ) | | | 167 | |
| Write-offs/recoveries, net | | | (18 | ) | | | (99 | ) | | | (45 | ) |
| |
Ending balance | | $ | 17 | | | $ | 50 | | | $ | 189 | |
| |
Components of inventory were:
| | | | | | | | | |
| | | June 30, |
| (In thousands) | | 2007 | | | 2006 | |
| |
| Raw materials | | $ | 2,024 | | | $ | 2,662 | |
| Work-in-process | | | — | | | | 2 | |
| Finished goods | | | 4,479 | | | | 3331 | |
| |
Totals | | $ | 6,503 | | | $ | 5,995 | |
| |
In the second quarter of fiscal 2006, the Company recorded inventory valuation adjustments for its Rutland operations totaling $641,000 before taxes related to the devaluation of inventories it determined to be excess and obsolete, and to correct labor and overhead valuation rates applied to those inventories. It appeared that these matters originated in periods prior to the second quarter of fiscal 2006; however, management was not able to reasonably determine the periods or amounts by which the previously reported results may have been affected. Consequently, the entire impact of these adjustments to the inventory valuation was recorded in the second quarter of fiscal 2006.
44
Property, plant and equipment were as follows:
| | | | | | | | | |
| | | June 30, |
| (In thousands) | | 2007 | | | 2006 | |
| |
| Land | | $ | 205 | | | $ | 205 | |
| Building and improvement | | | 1,878 | | | | 1,878 | |
| Machinery and equipment | | | 3,062 | | | | 3,090 | |
| Office furniture | | | 1,083 | | | | 1,586 | |
| Vehicles | | | 196 | | | | 196 | |
| Jigs, dies and fixtures | | | 2,153 | | | | 2,003 | |
| |
Total depreciable assets | | | 8,577 | | | | 8,958 | |
| Less accumulated depreciation | | | 5,427 | | | | 5,238 | |
| |
Net fixed assets | | $ | 3,150 | | | $ | 3,720 | |
| |
| | | | | | | | | | | | | |
| Depreciation & amortization expense for continuing operations (in thousands) | | 2007 | | | 2006 | | | 2005 | |
| |
| Depreciation expense | | $ | 797 | | | $ | 750 | | | $ | 801 | |
| Amortization expense | | | 456 | | | | 658 | | | | 558 | |
| |
Total depreciation & amortization expense | | $ | 1,253 | | | $ | 1,408 | | | $ | 1,359 | |
| |
Amortization expense relates to intangible assets, patents and debt issuance costs.
In fiscal 2007, the Company disposed of a number of fixed assets, primarily office and production equipment, no longer used in operations, with cost and accumulated depreciation values totaling $759,000 and $754,000, respectively.
The warranty reserve was as follows:
| | | | | | | | | | | | | |
| | | June 30, |
| (In thousands) | | 2007 | | 2006 | | 2005 |
| |
| Beginning balance | | $ | 513 | | | $ | 413 | | | $ | 354 | |
| Warranty expense | | | 634 | | | | 540 | | | | 340 | |
| Processed warranty claims | | | (628 | ) | | | (440 | ) | | | (281 | ) |
| |
Ending balance | | $ | 519 | | | $ | 513 | | | $ | 413 | |
| |
Note 3 —Stock-based Compensation and Stock Options
Stock-based Compensation
Commencing July 1, 2006, the Company adopted SFAS No. 123(R),Share Based Payment(SFAS 123(R)), and SEC Staff Accounting Bulletin No. 107,Share Based Payment,(“SAB 107”) requiring all share-based payments, including grants of stock options and compensatory employee stock purchase plans, to be recognized in the income statement as an operating expense, based on their fair value over the requisite service period. We recorded $39,000 of related compensation expense to general and administrative expense for the fiscal year ended June 30, 2007. The related tax benefit from recording this non-cash expense was $14,000 and the corresponding net compensation expense of $25,000, or $0.01 per basic and diluted share for fiscal 2007. As of June 30, 2007, a total of $797,000 of unrecognized compensation costs related to non-vested stock option awards was outstanding, including $639,000 of unrecognized compensation costs related to performance-based vesting stock options that in management’s current best estimate are not likely to vest and will be cancelled prior to vesting. The remaining balance of $158,000 of unrecognized compensation expense is expected to be recognized within the next four fiscal years, as follows: 2008 – $126,000; 2009 – $24,000; 2010 – $4,000; and, 2011 – $4,000.
Prior to adopting SFAS 123(R), we accounted for stock-based compensation under Accounting Principles Board Opinion No. 25,Accounting for Stock Issued to Employees. Accordingly, periods prior to adoption have not been restated. The following table illustrates the effect on net loss and loss per share if the fair value based method had been applied to the prior period:
45
| | | | | | | | | |
| (In thousands, except per share data) | | FY2006 | | FY2005 |
| |
Net income (loss), as reported | | $ | (301 | ) | | $ | 850 | |
| Stock-based compensation determined under fair value based method for all awards | | | (66 | ) | | | (42 | ) |
| |
| Pro forma net income (loss) | | | (367 | ) | | | 808 | |
| |
Basic earnings (loss) per share | | | | | | | | |
| As reported | | $ | (0.12 | ) | | $ | 0.36 | |
| Pro forma | | $ | (0.15 | ) | | $ | 0.34 | |
| |
Diluted earnings (loss) per share: | | | | | | | | |
| As reported | | $ | (0.12 | ) | | $ | 0.34 | |
| Pro forma | | $ | (0.15 | ) | | $ | 0.32 | |
| |
The Company uses the Black-Scholes option pricing model to determine the weighted average fair value of options. The volatility factor used in the Black-Scholes option pricing model is based on historical stock price fluctuations. The current forfeiture rate is based on a reasonable estimate by management. The assumptions the Company used to determine fair value were as follows:
| | | | | | | | | | | | | |
| | | FY2007 | | FY2006 | | FY2005 |
| |
| Expected dividend yield | | | 0.00 | % | | | 4.46 | % | | | 1.25 | % |
| Expected stock price volatility | | | 73.07 | % | | | 82.16 | % | | | 92.15 | % |
| Risk-free interest rate | | | 4.38 | % | | | 4.38 | % | | | 4.25 | % |
| Expected life of options | | 3 years | | 3 years | | 10 years |
Stock Options
The Board of Directors adopted the 1995 Stock Option Plan (the “1995 Plan”) in May 1995 and the shareholders of the Company approved the 1995 Plan at the Company’s annual meeting in October 1995. Following an increase in the authorized number of shares approved by the board in October 1999 and by shareholders in March 2000, the 1995 Plan provided for the grant of both incentive stock options and non-qualified stock options and reserves 562,500 shares of the Company’s Common Stock for issuance under the 1995 Plan and any previous plans of the Company, to be granted on a one-for-one basis.
The Board of Directors adopted the 2004 Equity Incentive Plan (the “2004 Plan”) in August 2004 and the shareholders of the Company approved the 2004 Plan at the Company’s annual meeting in November 2004. The 2004 Plan provides for the grant of incentive or nonqualified stock options, restricted stock, stock appreciation rights, performance shares and performance units to officers, employees, directors, consultants or advisors of the Company (including its subsidiaries and affiliates). There are 550,000 shares of the Company’s Common Stock reserved for issuance under the 2004 Plan, and no additional options will be granted under the 1995 Plan.
The Company’s stock options generally vest over five years of service and have a contractual life of 10 years. Recent stock option grants to executive management, however, have performance-based vesting upon achieving specific revenue and income objectives, otherwise vesting on the fifth anniversary of the grant date. Options to purchase 28,350, 187,500 and 5,025 shares were granted in fiscal years ended June 30, 2007, 2006, and 2005, respectively. A summary of the status of the stock option plans at June 30, 2007, 2006 and 2005, and changes during the years ended on those dates are as follows:
46
| | | | | | | | | | | | | | | | | | | | | | | | | |
| | | 2007 | | 2006 | | 2005 |
| | | | | | | Weighted | | | | | | Weighted | | | | | | Weighted |
| | | | | | | Average | | | | | | Average | | | | | | Average |
| | | | | | | Exercise | | | | | | Exercise | | | | | | Exercise |
| | | Shares | | Price | | Shares | | Price | | Shares | | Price |
| |
| Outstanding, beginning of year | | | 368,325 | | | $ | 6.21 | | | | 195,450 | | | $ | 4.03 | | | | 245,975 | | | $ | 3.48 | |
| Granted | | | 28,350 | | | $ | 6.71 | | | | 187,500 | | | $ | 8.30 | | | | 5,025 | | | $ | 8.47 | |
| Exercised | | | (19,950 | ) | | $ | 3.92 | | | | (14,625 | ) | | $ | 3.82 | | | | (45,500 | ) | | $ | 1.42 | |
| Expired | | | (14,625 | ) | | $ | 3.82 | | | | — | | | $ | — | | | | (10,050 | ) | | $ | 4.58 | |
| | | | | | | | | | | | | | | | | | | | | | | | | |
| Outstanding, end of year | | | 362,100 | | | $ | 6.48 | | | | 368,325 | | | $ | 6.21 | | | | 195,450 | | | $ | 4.03 | |
| | | | | | | | | | | | | | | | | | | | | | | | | |
| Exercisable at end of year | | | 139,750 | | | $ | 4.41 | | | | 170,825 | | | $ | 4.23 | | | | 165,450 | | | $ | 3.69 | |
| | | | | | | | | | | | | | | | | | | | | | | | | |
| Weighted-average fair value per share of options granted during the year | | | | | | $ | 3.38 | | | | | | | $ | 3.95 | | | | | | | $ | 8.47 | |
| |
| Aggregate intrinsic value of options outstanding at end of year | | | | | | $ | 434,366 | | | | | | | | | | | | | | | | | |
| | | | | | | | | | | | | | | | | | | | | | | | |
| Aggregate intrinsic value of options exercisable at end of year | | | | | | $ | 400,346 | | | | | | | | | | | | | | | | | |
| | | | | | | | | | | | | | | | | | | | | | | | |
| |
As of June 30, 2007, the options outstanding have a weighted average remaining contractual life of 5.8 years, and exercise prices and unexercised options as follows:
| | | | | | | | | | | | | | | | | | | | | |
| | | | | | | | | | | | | | | Options exercisable |
| | | Options outstanding | | | | | | Weighted |
| | | | | | | Weighted | | Weighted | | | | | | Average |
| Exercise | | Outstanding | | Average | | Average | | Number | | Exercisable |
| Price | | Shares | | Contractual Life | | Exercise Price | | Exercisable | | Price |
| |
| $4.58 | | | 10,050 | | | 0.3 years | | $ | 4.58 | | | | 10,050 | | | $ | 4.58 | |
| $3.83 | | | 13,875 | | | 0.6 years | | $ | 3.83 | | | | 13,875 | | | $ | 3.83 | |
| $2.67 | | | 5,025 | | | 1.3 years | | $ | 2.67 | | | | 5,025 | | | $ | 2.67 | |
| $3.63 | | | 16,125 | | | 1.6 years | | $ | 3.63 | | | | 16,125 | | | $ | 3.63 | |
| $4.00 | | | 16,125 | | | 2.6 years | | $ | 4.00 | | | | 16,125 | | | $ | 4.00 | |
| $2.67 | | | 45,000 | | | 3.7 years | | $ | 2.67 | | | | 45,000 | | | $ | 2.67 | |
| $4.52 | | | 5,025 | | | 6.3 years | | $ | 4.52 | | | | 5,025 | | | $ | 4.52 | |
| $5.90 | | | 30,000 | | | 6.7 years | | $ | 5.90 | | | | — | | | $ | — | |
| $8.47 | | | 5,025 | | | 7.3 years | | $ | 8.47 | | | | 5,025 | | | $ | 8.47 | |
| $8.38 | | | 145,000 | | | 8.3 years | | $ | 8.38 | | | | 22,000 | | | $ | 8.38 | |
| $8.28 | | | 35,000 | | | 8.5 years | | $ | 8.28 | | | | — | | | $ | — | |
| $6.83 | | | 7,500 | | | 8.8 years | | $ | 6.83 | | | | 1,500 | | | $ | 6.83 | |
| $6.71 | | | 28,350 | | | 9.3 years | | $ | 6.71 | | | | — | | | $ | — | |
| |
| $2.67 to $8.47 | | | 362,100 | | | 5.8 years | | $ | 6.48 | | | | 139,750 | | | $ | 4.41 | |
In December 1996, the Board of Directors adopted the Associates Stock Purchase Plan (the “ASP Plan”), which was approved by shareholders at the 1997 Annual Meeting. The ASP Plan is available to associates who have worked at least six months with the Company and are regularly scheduled to work at least 20 hours a week. The ASP Plan is carried out in 12-month phases commencing on January 1, 1997. Company stock bought under the ASP Plan is purchased at the lesser of 85 percent of the stock price at the beginning or end of the phase. The total shares issued under this plan for the fiscal years ended June 30, 2007, 2006 and 2005, were 7,555, 5,506 and 8,859, respectively.
Note 4 — Goodwill and Other Intangible Assets
Goodwill and Intangible Assets
The changes in the carrying amount of goodwill and indefinite lived intangible assets for the years ended June 30, 2007 and 2006 are as follows:
| | | | | | | | | | | | | | | | | |
| | | Fiscal year ended June 30, |
| | | 2007 | | 2006 |
| | | | | | | Ind. Life | | | | | | Ind. Life |
| (In thousands) | | Goodwill | | Intangibles | | Goodwill | | Intangibles |
| |
| Beginning balance | | $ | 6,151 | | | $ | 2,638 | | | $ | 6,023 | | | $ | 2,624 | |
| Change associated with NCP earn-out payment | | | (45 | ) | | | — | | | | 56 | | | | — | |
| Change in goodwill for Rutland tax liability adjustment | | | 250 | | | | — | | | | — | | | | — | |
| Currency translation adjustment | | | 260 | | | | 48 | | | | 72 | | | | 14 | |
| |
Ending balance | | $ | 6,616 | | | $ | 2,686 | | | $ | 6,151 | | | $ | 2,638 | |
| |
47
In Fiscal 2007, the final earn-out payment of $11,000, assigned to goodwill, was made based upon the fiscal 2006 operating results in connection with the North Central Plastics, Incorporated Stock Purchase Agreement which included an earn-out agreement that required the Company to pay the Sellers up to an additional $750,000 if operating results of the Company in fiscal years through 2006 exceed predetermined levels.
In Fiscal 2007, the Company determined that the income tax liability recorded by Rutland at the acquisition date was understated by approximately $250,000. In accordance with SFAS 141 and 109 and Emerging Issues Task Force (EITF) Statement 93-7, the Company increased goodwill and income taxes payable at June 30, 2007 by that same amount.
Effective July 1, 2002, the Company adopted SFAS No. 142, “Goodwill and Other Intangible Assets,” which established standards related to how acquired goodwill and indefinite-lived intangible assets are to be recorded upon their acquisition as well as how they are to be accounted for after they have been initially recognized in the financial statements.
Effective with the adoption of this standard, the Company no longer amortizes goodwill. Instead, SFAS No. 142 requires acquired goodwill to be evaluated for impairment using a two-step test, based upon a fair value approach. The first step is used to identify a potential impairment, while the second step calculates the amount of impairment, if any. Upon adoption of the standard, the Company completed a transitional impairment test for its acquired goodwill, determining the fair value of the Company’s Zareba reporting unit using a discounted cash flow model. As a result of the impairment analysis, the Company was not required to record an impairment charge as the fair value of the reporting unit exceeded its carrying value. The Company also completed a transitional impairment test of its indefinite lived intangible asset, the trademarks, by determining the fair value of the trademarks using the discounted cash flow model. As a result of this impairment analysis, the Company was not required to record an impairment charge, as the fair value of the trademarks exceeded its carrying value. On a prospective basis, the Company is required to test acquired goodwill and indefinite lived intangible assets on an annual basis based upon a fair value approach. Additionally, goodwill and indefinite lived intangible assets shall be tested for impairment between annual tests if an event occurs or circumstances change that would more likely than not reduce the fair value of an entity below its carrying value.
At June 30, 2007 and June 30, 2006, the Company completed its annual impairment tests for acquired goodwill and indefinite lived intangible assets using methodologies consistent with those applied for its transitional impairment tests performed as of July 1, 2002. Such testing resulted in no impairment charge.
Intangible assets subject to amortization were as follows:
| | | | | | | | | | | | | | | | | |
| | | Fiscal year ended June 30, |
| | | 2007 | | 2006 |
| | | | | | | Customer | | | | | | Customer |
| (In thousands) | | Non-compete | | Relationships | | Non-compete | | Relationships |
| |
| Gross carrying amount | | $ | 1,250 | | | $ | 2,383 | | | $ | 1,250 | | | $ | 2,196 | |
| Accumulated amortization | | | 1,250 | | | | 936 | | | | 1,229 | | | | 549 | |
| |
Net carrying amount | | $ | — | | | $ | 1,447 | | | $ | 21 | | | $ | 1,647 | |
| |
Intangible assets are amortized on a straight-line basis over the estimated periods benefited; a seven-year useful life has been assigned to the acquired customer relationships and five-year useful life for the non-compete.
Amortization expenses related to definite lived intangible assets for 2007, 2006 and 2005 were $408,000, $569,000 and $480,000, respectively. Estimated future annual amortization expense for identified intangible assets is as follows:
| | | | | | | | | |
| | | Fiscal | | | | |
| (In thousands) | | Year | | | Amount | |
| |
| | | | 2008 | | | $ | 340 | |
| | | | 2009 | | | | 340 | |
| | | | 2010 | | | | 341 | |
| | | | 2011 | | | | 341 | |
| | | | 2012 | | | | 85 | |
| |
| | | Total | | $ | 1,447 | |
| |
48
Note 5 – Financing
In September 2004, the Company paid in full the previous Wells Fargo Bank (WF) $3.0 million bank line of credit and term debt facility and executed a new Wells Fargo Business Credit facility for the Rutland acquisition. The WF credit facility initially included an aggregate credit limit of $7.8 million, consisting of revolving credit up to $6.0 million and term credit of $1.8 million. Under this credit facility, the Company borrowed approximately $5.1 million for the Rutland acquisition. Under the terms of the new WF credit facility agreement and subsequent amendments, interest is charged on outstanding balances at the rate of one half of one percent or (.50 percent) above base rate. The facility requires the Company to maintain certain financial and other covenants. The initial term of the agreement runs for three years, maturing on September 1, 2007, and it is renewable on an annual basis thereafter. As a result, the entire balance outstanding on the revolving credit facility of $5.0 million was classified as current at June 30, 2007. The effective interest rate was 8.75 percent on June 30, 2007 and June 30, 2006, and the average effective rate for fiscal year 2007 was 8.75 percent. The term notes require monthly principal payments of $19,168 plus interest. As of June 30, 2007 and 2006, the outstanding amount on the WF credit facility was $5.0 and $5.2 million, respectively with an additional $1.0 million and $0.8 million, respectively available for the future draws. Future WF availability is determined by the daily eligible collateral net of outstanding loan balance.
Also, in September 2004, Zareba Systems Europe secured a £2,214,000 term loan (approximately $4.0 million) from the Bank of Scotland (BoS) in the United Kingdom for the Rutland acquisition (See Notes 5 and 8 to consolidated financial statements). Under the terms of the BoS credit facility agreement, interest is charged on outstanding balances at the rate of two and one eighth percent (or 2.125 percent) above the base rate with a five-year term. On June 30, 2007 and 2006, the effective interest rate was 7.63 percent and 6.63 percent, respectively and the average effective rate for fiscal 2007 was 7.21 percent. The BoS term loan matures on September 27, 2009, with monthly principal and interest payments of £49,355 (approximately $96,000). The balance outstanding under this facility at June 30, 2007 and 2006 was £1.2 million, or approximately $2.4 million, and £1.7 million, or approximately $3.1 million, respectively. In September 2007, the BoS waived all previous covenant violations for fiscal 2007 and agreed to work with the Company to establish new covenant levels for the future. Based upon the discussions with BoS regarding the proposed new covenant levels, the Company believes it will be able to meet the new financial covenants in fiscal 2008, once established.
Both the WF Business Credit and the BoS credit facilities are collateralized by substantially all of the assets of the Company and Zareba Systems Europe, in their respective localities. Line of credit borrowings are limited to eligible accounts receivable and inventory.
In addition to bank and non-compete debt, the Company has “Other” low interest notes payable as an incentive from a local utility to make upgrades in its operations to reduce future electrical peak usage. The note payable was comprised of $1,000 and $5,000 of current maturities and $3,000 and $0 long-term as of June 30, 2007 and 2006, respectively.
Interest expense paid by the Company totaled $764,000, $664,000 and $507,000 in fiscal years 2007, 2006 and 2005, respectively.
The following table summarizes the debt outstanding:
United States Bank Debt as of June 30,
| | | | | | | | | |
| (In thousands) | | 2007 | | 2006 |
| |
| Note payable to bank | | $ | 6,211 | | | $ | 6,294 | |
| Short-term borrowings | | | — | | | | 300 | |
| Other | | | 4 | | | | 5 | |
| |
| | | | 6,215 | | | | 6,599 | |
| Less current maturities and short-term borrowings | | | (5,275 | ) | | | (535 | ) |
| |
Total | | $ | 940 | | | $ | 6,064 | |
| |
United Kingdom Bank Debt as of June 30,
| | | | | | | | | |
| (In thousands) | | 2007 | | 2006 |
| |
| Note payable to bank | | $ | 2,380 | | | $ | 3,098 | |
| Less current maturities and short-term borrowings | | | (1,051 | ) | | | (928 | ) |
| |
Total | | $ | 1,329 | | | $ | 2,170 | |
| |
49
Principal requirements on long-term debt for years ending after June 30, 2007 are as follows:
| | | | | | | | | |
| | | Fiscal | | | | |
| (In thousands) | | Year | | | Amount | |
| |
| | | | 2008 | | | $ | 6,326 | |
| | | | 2009 | | | | 1,360 | |
| | | | 2010 | | | | 355 | |
| | | | 2011 | | | | 131 | |
| | | | 2012 | | | | 131 | |
| | | Thereafter | | | 292 | |
| |
| | | Total | | | $ | 8,595 | |
| |
On August 1, 2007, subsequent to fiscal 2007 year end, the Company completed the sale of the WMS subsidiary, receiving $5 million cash, which was used to reduce the outstanding debt with WF Business Credit. (See Note 11)
On August 29, 2007, subsequent to fiscal 2007 year end, the Company entered into a secured revolving credit facility with JPMorgan Chase Bank, N.A. (Chase), subsequently terminating the WF facility and paying in full all outstanding balances under the WF facility, totaling approximately $1.1 on August 30, 2007. (See Note 12)
Note 6 — Income Taxes
Domestic and foreign income before provision for income taxes from continuing operations consists of the following:
| | | | | | | | | | | | | |
| (In thousands) | | 2007 | | | 2006 | | 2005 | |
| |
| Domestic | | $ | 579 | | | $ | 273 | | | $ | 155 | |
| Foreign | | | 25 | | | | (1,269 | ) | | | 727 | |
| |
Total | | $ | 604 | | | $ | (996 | ) | | $ | 882 | |
| |
The income tax provision charged to continuing operations for the years ended June 30, 2007, 2006 and 2005 includes the following components:
| | | | | | | | | | | | | |
| (In thousands) | | 2007 | | 2006 | | 2005 |
| |
| Current: | | | | | | | | | | | | |
| US federal | | $ | 267 | | | $ | 153 | | | $ | 95 | |
| State | | | 35 | | | | 47 | | | | 24 | |
| Foreign | | | 140 | | | | (412 | ) | | | 180 | |
| |
Total current | | | 442 | | | | (212 | ) | | | 299 | |
| |
| Deferred: | | | | | | | | | | | | |
| US federal and state | | | (120 | ) | | | (53 | ) | | | (59 | ) |
| Foreign | | | (90 | ) | | | (91 | ) | | | — | |
| |
Total deferred | | | (210 | ) | | | (144 | ) | | | (59 | ) |
| |
Total provision | | $ | 232 | | | $ | (356 | ) | | $ | 240 | |
| |
The reconciliation of income tax benefit or expense to the statutory rate was as follows:
| | | | | | | | | | | | | |
| (In thousands) | | 2007 | | 2006 | | 2005 |
| |
| Income tax expense at statutory rates: | | | | | | | | | | | | |
| U.S. Federal | | $ | 200 | | | $ | 83 | | | $ | 97 | |
| Foreign | | | 50 | | | | (381 | ) | | | 173 | |
| Increase (decrease) in income taxes resulting from: | | | | | | | | | | | | |
| State taxes, net of federal tax benefits | | | 23 | | | | 7 | | | | 49 | |
| Research and development tax credits | | | (67 | ) | | | (65 | ) | | | (87 | ) |
| Other | | | 26 | | | | — | | | | 8 | |
| |
Total | | $ | 232 | | | $ | (356 | ) | | $ | 240 | |
| |
50
Net deferred tax assets consist of the following components as of June 30, 2007 and 2006:
| | | | | | | | | |
| (In thousands) | | 2007 | 2006 |
| |
| Deferred tax assets | | | | | | | | |
| Employee benefits | | $ | 112 | | | $ | 91 | |
| Inventory and receivable allowances | | | 33 | | | | 55 | |
| Warranty and contingency reserves | | | 274 | | | | 184 | |
| Non compete payable | | | 272 | | | | 295 | |
| |
Total deferred tax assets | | | 691 | | | | 625 | |
| |
| Deferred tax liabilities | | | | | | | | |
| Property and equipment | | | 605 | | | | 842 | |
| Foreign currency translation adjustments included in other Comprehensive Income | | | 275 | | | | — | |
| Basis difference in costs recorded in the Rutland acquisition | | | 468 | | | | 375 | |
| |
Total deferred tax liabilities | | | 1,348 | | | | 1,217 | |
| |
Net deferred tax assets (liability) | | $ | (657 | ) | | $ | (592 | ) |
| |
The components giving rise to the net deferred tax assets (liability) described above have been included in the Company’s Balance Sheets as of June 30, 2007 and 2006 as follows:
| | | | | | | | | |
| (In thousands) | | 2007 | 2006 |
| |
| Current assets | | $ | 439 | | | $ | 331 | |
| Non-current liabilities | | | (1,096 | ) | | | (923 | ) |
| |
Net deferred tax assets (liability) | | $ | (657 | ) | | $ | (592 | ) |
| |
The cash tax payments for fiscal years ended June 30, 2007, 2006 and 2005 were $620,000, $386,000 and $1,021,000, respectively.
Note 7 — Stockholders’ Equity
Amendment to Articles of Incorporation
On November 3, 2004, the Company’s shareholders approved an amendment to the Company’s Articles of Incorporation. The approval increased the number of authorized common shares from 5,000,000 to 20,000,000, added 40,000,000 authorized undesignated shares, eliminated the 120,000 shares of previously authorized preferred shares, and changed the par value of the Company’s common and preferred shares from $0.10 per share and $25 per share, respectively, to $0.01 per share. The common stock value for fiscal year 2005 has been adjusted retrospectively.
On March 8, 2005, the Company’s Board of Directors approved the authorization of 50,000 shares of Series A Preferred Stock with a par value of $0.01 per share in connection with the rights dividend. Preferred Stock purchasable upon exercise of the Rights will not be redeemable. Each share of Preferred Stock will be entitled to a minimum preferential quarterly dividend payment of $1 per share but will be entitled to an aggregate dividend of 100 times the dividend declared per share of Common Stock. In the event of liquidation, the holders of the Preferred Stock will be entitled to a minimum preferential liquidation payment of $100 per share but will be entitled to an aggregate payment of 100 times the payment made per share of Common Stock. Each share of Preferred Stock will have 100 votes, voting together with the Common Stock. Finally, in the event of any merger, consolidation or other transaction in which Common Stock is exchanged, each share of Preferred Stock will be entitled to receive 100 times the amount received per share of Common Stock. These rights are protected by customary anti-dilution provisions.
Because of the nature of the Preferred Stock’s dividend, liquidation and voting rights, the value of the one one-hundredth of a share of Preferred Stock purchasable upon exercise of each Right should approximate the value of one share of Common Stock.
Rights Dividend
On March 8, 2005, the Board of Directors declared a dividend of one preferred stock purchase right (a “Right”) for each outstanding share of common stock, par value $.01 per share (the “Common Stock”), of the Company. The dividend is attached with the shares of Common Stock that the shareholders held on March 18, 2005 (the “Record
51
Date”) to the shareholders of record on that date. Each Right entitles the registered holder to purchase from the Company one one-hundredth of a share of Series A Preferred Stock, par value $.01 per share (the “Preferred Stock”), of the Company at a price of $70 per one one-hundredth of a Preferred Share, subject to adjustment. The distribution of the rights dividend is not until the earlier of (i) 10 days following a public announcement by the Company or a person or group of affiliated or associated persons (an “Acquiring Person”) that such an Acquiring Person has acquired beneficial ownership of 15% or more of the outstanding Common Stock or (ii) 10 business days (or such later date as may be determined by action of the Board of Directors prior to such time as any person or group of affiliated persons becomes an Acquiring Person) following the commencement of, or announcement of an intention to make, a tender offer or exchange offer the consummation of which would result in the beneficial ownership by a person or group of 15% or more of the outstanding Common Stock (the earlier of such dates being called the “Distribution Date”), the Rights will be evidenced, with respect to any of the Common Stock certificates outstanding as of the Record Date, by such Common Stock certificate with a copy of this Summary of Rights attached thereto. The Rights are not exercisable until the Distribution Date. The Rights will expire on March 17, 2015 (the “Final Expiration Date”), unless the Final Expiration Date is extended or unless the Rights are earlier redeemed by the Company.
Note 8 — Acquisition of Rutland Electric Fencing Company Ltd.
On September 27, 2004, through its newly formed subsidiary, Zareba Systems Europe Limited (Zareba Systems Europe), the Company acquired Rutland Electric Fencing Company Ltd. (Rutland), a manufacturer and distributor of electronic fencing equipment located in Oakham, UK. Under the stock purchase agreement, the Company purchased all of the issued and outstanding share capital for a purchase price of approximately $10.4 million. The transaction was funded primarily with bank debt and cash. The acquisition of Rutland allowed Zareba to gain an entry into the UK, Europe, and the Middle East markets, as well as expand distribution of Rutland Electric Fencing products in the U.S.
Included in the total purchase price are estimated direct acquisition costs of $0.6 million and cash acquired of $1.9 million. The Company accounted for this transaction as a purchase in accordance with SFAS No. 141, Business Combinations. The assets and liabilities acquired were recorded at their estimated fair market values on the date of acquisition. The goodwill is not deductible for tax purposes.
Operating results of the acquired company were included in the Company’s consolidated financial statements from the date of acquisition.
The following are unaudited fiscal year 2005 pro forma operating results as if the acquisition had taken place at July 1, 2004.
| | | | | |
| | | Fiscal year ended | |
| (In thousands, except share and per share data) | | June 30, 2005 | |
| |
| Net sale | | $ | 34,669 | |
| Net income | | $ | 1,105 | |
| Net income per share | | | | |
| -basic | | $ | 0.46 | |
| -diluted | | $ | 0.44 | |
| Weighted average number of shares outstanding | | | | |
| -basic | | | 2,392,460 | |
| -diluted | | | 2,500,434 | |
Note 9 — Commitments and Contingencies
The Company leases equipment and office, manufacturing and warehouse space under various non-cancelable operating leases that expire at various times through September 22, 2029. Rent expense related to the operating lease was approximately $498,000, $432,000 and $346,000 for the years ended June 30, 2007, 2006 and 2005, respectively. Future minimum lease payments are approximately as follows.
52
| | | | | |
| (In thousands) | | Annual Lease | |
| |
| 2008 | | $ | 446 | |
| 2009 | | | 386 | |
| 2010 | | | 316 | |
| 2011 | | | 306 | |
| 2012 | | | 305 | |
| Thereafter | | | 4,436 | |
| |
Total | | $ | 6,195 | |
| |
On August 1, 2007, subsequent to fiscal 2007 year end, the Company completed the sale of the WMS subsidiary, which included assignment of a facility lease with monthly lease payments of $5,146 through February 2009, reducing future lease commitments for fiscal years 2008 and 2009 by approximately $62,000 and $41,000, respectively. (See Note 11)
In October 2005, the Wisconsin department of natural resources (“WDNR”) notified the Company it is a “responsible party” with respect to a site on which certain TCE contaminated ground water was alleged to be present. Although it may become necessary for the Company to undertake actions in connection with the WDNR’s letter, we do not have sufficient information to determine what liability the Company will incur, if any. The Company expenses all associated legal and professional costs as incurred, which have totaled approximately $60,000 through June 30, 2007. There were no further developments on this matter in fiscal 2007. The Company will provide updates on this matter when and if any developments occur in future.
The Company has an employment agreement with the Company’s chief executive officer who also serves on the board. The Agreement provides for severance payments subject to certain conditions and events.
Note 10 — Concentrations
Based upon the Company’s organizational structure and manner in which performance is assessed and operating decisions are made, the Company operates in one worldwide business segment – the sale of electronic perimeter fence and access control systems — following the discontinued operation of the Company’s WMS business.
The Company markets its products throughout the world. The following summarizes net sales and long-lived assets for the geographic areas in which the Company has operations:
Geographic information:
| | | | | | | | | | | | | |
| (In thousands) | | FY2007 | | | FY2006 | | | FY2005 | |
| |
Net sales | | | | | | | | | | | | |
| United States | | $ | 24,958 | | | $ | 22,974 | | | $ | 21,589 | |
| United Kingdom | | | 9,687 | | | | 8,353 | | | | 6,704 | |
| Other regions | | | 1,038 | | | | 969 | | | | 1,178 | |
| |
Total net sales | | $ | 35,683 | | | $ | 32,296 | | | $ | 29,471 | |
| |
Long-lived assets | | | | | | | | | | | | |
| United States | | $ | 7,808 | | | $ | 8,355 | | | $ | 8,927 | |
| United Kingdom | | | 6,321 | | | | 6,160 | | | | 6,517 | |
| Other regions | | | — | | | | — | | | | — | |
| |
Total long-lived assets | | $ | 14,129 | | | $ | 14,515 | | | $ | 15,444 | |
| |
In fiscal years ended June 30, 2007, 2006 and 2005, sales to one Zareba Systems customer were $7.2, $6.2 and $5.9 million, respectively. Accounts receivable from this customer totaled $2.5 million and $2.8 million at June 30, 2007 and 2006, respectively.
Note 11 – Discontinued Operation and Sale of Waters Medical Systems, Inc.
At June 30, 2007, the Company substantially completed negotiation of the sale of the Company’s Waters Medical Systems, Inc., (WMS) subsidiary to a third party. The WMS subsidiary, a provider of medical products was initially formed on June 30, 2005, when all the assets of the WMS division of Zareba were transferred to the newly-formed subsidiary, and has operated in a separate business segment of the Company. Accordingly, all results of operations and assets and liabilities of WMS for all periods presented have been restated and classified as discontinued operations.
53
The sale of WMS was completed on August 1, 2007 pursuant to the terms of a Stock Purchase Agreement dated July 24, 2007. The transaction involved the sale of 100 percent of the stock of WMS for $5 million cash, including all assets and liabilities of WMS at close. The sale price is subject to a price adjustment if the net asset value at the close is below $575,000. Although subject to review by the Buyer, the Company does not expect an adjustment based upon the closing balance provided to the Buyer.
The estimated gain on the sale of WMS is calculated as follows:
| | | | | |
| Cash received | | $ | 5,000 | |
| Less: investment in WMS | | | (665 | ) |
| estimated transaction costs | | | (105 | ) |
| | | | |
| Gain on sale before tax | | | 4,230 | |
| Income tax (estimated rate of 41.5%) | | | (1,755 | ) |
| | | | |
| Gain on sale, net of tax | | $ | 2,475 | |
| | | | |
Assets and liabilities of WMS at June 30, 2007 and 2006 were as follows:
| | | | | | | | | |
| (In thousands) | | 2007 | | | 2006 | |
| |
| Accounts receivable, net | | $ | 259 | | | $ | 230 | |
| Inventories | | | 454 | | | | 727 | |
| Other current assets | | | 16 | | | | 24 | |
| |
Current assets of discontinued operations | | | 729 | | | | 981 | |
| |
| Property and equipment, net | | | 19 | | | | 57 | |
| |
Other assets of discontinued operations | | | 19 | | | | 57 | |
| |
| Accounts payable | | | 63 | | | | 102 | |
| Accrued compensation and other liabilities | | | 60 | | | | 69 | |
| |
Current liabilities of discontinued operations | | $ | 123 | | | $ | 171 | |
| |
Condensed consolidated statements of operations for WMS for fiscal years ended June 30, 2007, 2006 and 2005 are as follows:
| | | | | | | | | | | | | |
| | | Year ended June 30, | |
| (In thousands) | | 2007 | | | 2006 | | | 2005 | |
| |
| Net sales | | $ | 2,205 | | | $ | 2,122 | | | $ | 2,356 | |
| Gross profit | | | 1,241 | | | | 1,328 | | | | 1,243 | |
| Selling, general and administrative | | | 676 | | | | 665 | | | | 752 | |
| Research and development | | | 192 | | | | 134 | | | | 166 | |
| Income tax provision | | | 135 | | | | 190 | | | | 117 | |
| Gain from discontinued operations, net of tax | | $ | 238 | | | $ | 339 | | | $ | 208 | |
Depreciation expense for WMS was $37,000, $39,000 and $33,000 for fiscal years 2007, 2006 and 2005, respectively.
Note 12 – Subsequent Event – Financing Agreement
On August 29, 2007, subsequent to fiscal 2007 year end, the Company entered into a secured revolving credit facility with JPMorgan Chase Bank, N.A. (Chase), subsequently terminating the WF facility and paying in full all outstanding balances under the WF facility, totaling approximately $1.1 on August 30, 2007. The Chase facility provides for a $6 million secured revolving credit facility (the “Credit Facility”), with the option to increase borrowings in additional $500,000 increments with the consent of the Lender, up to a total of $7.5 million. Amounts under the facility may be borrowed, repaid and reborrowed from time to time until its maturity on August 29, 2010. Voluntary prepayments and commitment reductions under the Credit Facility are permitted at any time without payment of any prepayment fee upon proper notice and subject to minimum dollar amounts. Loans under the 2007 Credit Agreement will bear interest at either a base rate minus 1.0 percent to 0 percent, based upon financial performance, or a Eurocurrency rate equal to the London Inter-Bank Offered Rate (“LIBOR”) for the relevant term plus 1.5 percent to 2.5 percent, based upon financial performance. Notwithstanding the foregoing, borrowings until and including September 30, 2007 will bear interest at either a base rate minus 0.75 percent or LIBOR plus 1.75
54
percent. The facility contains a financial covenant requiring that the Company maintain a minimum debt service coverage ratio measured quarterly, and other covenants, and includes limitations on, among other things, liens, certain acquisitions, consolidations and sales of assets. The Company also entered into a Stock Pledge Agreement with the Lender, pursuant to which it pledged the stock of Zareba Systems of Canada, Ltd. to the Lender as additional security under the 2007 Credit Agreement. In addition, the Company entered into a Negative Pledge Agreement in favor of the Lender, pursuant to which it agreed not to convey or otherwise transfer or pledge or otherwise encumber any of its owned real property to any other party without the consent of the Lender, which consent is not to be unreasonably withheld.
Note 13 – Summarized Quarterly Financial Information (Unaudited)
| | | | | | | | | | | | | | | | | |
| | | Quarter ended | |
| (In thousands, except per share amounts) | | September 30 | | | December 31 | | | March 31 | | | June 30 | |
| |
Fiscal 2007 | | | | | | | | | | | | | | | | |
| Net sales | | $ | 8,168 | | | $ | 6,407 | | | $ | 8,679 | | | $ | 12,429 | |
| Gross profit | | | 2,661 | | | | 1,986 | | | | 2,787 | | | | 4,738 | |
| Income (loss) from continuing operations | | | (11 | ) | | | (363 | ) | | | 44 | | | | 702 | |
| Gain from discontinued operations | | | 33 | | | | 65 | | | | 66 | | | | 74 | |
| Net income (loss) | | $ | 22 | | | $ | (298 | ) | | $ | 110 | | | $ | 776 | |
| Income (loss) per share from continuing operations: | | | | | | | | | | | | | | | | |
| Basic | | $ | (0.00 | ) | | $ | (0.15 | ) | | $ | 0.02 | | | $ | 0.29 | |
| Diluted | | $ | (0.00 | ) | | $ | (0.15 | ) | | $ | 0.02 | | | $ | 0.28 | |
| Gain per share from discontinued operations: | | | | | | | | | | | | | | | | |
| Basic | | $ | 0.01 | | | $ | 0.03 | | | $ | 0.03 | | | $ | 0.03 | |
| Diluted | | $ | 0.01 | | | $ | 0.03 | | | $ | 0.03 | | | $ | 0.03 | |
| Net income (loss) per share: | | | | | | | | | | | | | | | | |
| Basic | | $ | 0.01 | | | $ | (0.12 | ) | | $ | 0.05 | | | $ | 0.32 | |
| Diluted | | $ | 0.01 | | | $ | (0.12 | ) | | $ | 0.04 | | | $ | 0.31 | |
| | | | | | | | | | | | | | | | | |
Fiscal 2006 | | | | | | | | | | | | | | | | |
| Net sales | | $ | 7,944 | | | $ | 5,464 | | | $ | 7,000 | | | $ | 11,888 | |
| Gross profit | | | 3,025 | | | | 872 | (1) | | | 2,121 | | | | 4,251 | |
| Income (loss) from continuing operations | | | 254 | | | | (1,155 | ) (1) | | | (483 | ) | | | 744 | |
| Gain from discontinuing operations | | | 136 | | | | 73 | | | | 101 | | | | 29 | |
| Net income (loss) | | $ | 390 | | | $ | (1,082 | ) (1) | | $ | (382 | ) (2) | | $ | 773 | |
| Income (loss) per share from continuing operations: | | | | | | | | | | | | | | | | |
| Basic | | $ | 0.11 | | | $ | (0.48 | ) | | $ | (0.20 | ) | | $ | 0.31 | |
| Diluted | | $ | 0.10 | | | $ | (0.48 | ) | | $ | (0.20 | ) | | $ | 0.30 | |
| Gain per share from discontinued operations: | | | | | | | | | | | | | | | | |
| Basic | | $ | 0.06 | | | $ | 0.03 | | | $ | 0.04 | | | $ | 0.01 | |
| Diluted | | $ | 0.05 | | | $ | 0.03 | | | $ | 0.04 | | | $ | 0.01 | |
| Net income (loss) per share: | | | | | | | | | | | | | | | | |
| Basic | | $ | 0.16 | | | $ | (0.45 | ) | | $ | (0.16 | ) | | $ | 0.32 | |
| Diluted | | $ | 0.16 | | | $ | (0.45 | ) | | $ | (0.16 | ) | | $ | 0.31 | |
| | |
| (1) | | The Company has historically reported a loss in the second quarter of the fiscal year, the weakest quarter in the Company’s seasonally affected business. The fiscal 2006 second quarter loss was greater than normal due to a $641,000 inventory valuation adjustment for excess and obsolete inventory and standard cost valuation corrections, reducing gross profit for the period (See Note 2). |
| |
| (2) | | Results for the quarter were unfavorably affected by adverse weather conditions, primarily in the UK, shortening the season for our products, and by the delay in payment of subsidies to farmers in England, restricting their ability to purchase the Company’s product. |
55