UNITED STATES
SECURITIES AND EXCHANGE COMMISSION WASHINGTON, D.C. 20549
FORM 6-K
REPORT OF FOREIGN PRIVATE ISSUER PURSUANT TO RULE 13a-16 OR 15d-16 UNDER
THE SECURITIES EXCHANGE ACT OF 1934
For the month of January, 2007
POLYAIR INTER PACK INC.
(Registrant's name)
330 Humberline Drive,
Toronto, Ont.
Canada M9W 1R5
(416) 679-6600
(Address of principal executive offices)
Indicate by check mark whether the registrant files or will file annual reports under cover Form 20-F or Form 40-F.
Form 20-F __X___ Form 40-F _____
Indicate by check mark whether the registrant by furnishing the information contained in this Form is also thereby furnishing the information to the Commission pursuant to Rule 12g3-2(b) under the Securities Exchange Act of 1934.
Yes _____ No __X___
If "Yes" is marked, indicate below the file number assigned to the registrant in connection with Rule 12g3-2(b): 82-__________.
EXHIBIT INDEX
| Exhibit Number | Description of Document |
1. | Company Press Release |
| 2. | Consolidated Financial Statements |
| 3. | Management's Discussion and Analysis |
SIGNATURES
Pursuant to the requirements of the Securities Exchange Act of 1934, the registrant has duly caused this report to be signed on its behalf by the undersigned, thereunto duly authorized.
POLYAIR INTER PACK INC.
Date: February 9, 2007
By: /s/ MICHAEL FREEL
Name: Michael Freel
Title: Director of Finance
Exhibit 1
POLYAIR INTER PACK INC. ANNOUNCES 2006 RESULTS
TORONTO, January 29, 2007 - Polyair Inter Pack Inc. (“PPK” or the “Company”) (TSX/AMEX: PPK) reported a net loss from continuing operations of $3.6 million or $0.53 per share on sales of $113.0 million for the fiscal year ended October 31, 2006, compared with a net loss from continuing operations of $2.4 million on sales of $108.1 million for the prior year. For the quarter ended October 31, 2006 the Company reported a net loss from continuing operations of $1.5 million or $0.22 per share on sales of $29.9 million, compared with a net loss from continuing operations of $1.4 million on sales of $29.0 million for the fourth quarter of 2005. In its year end financial results, the Company reported results from its Pool Division and its PXL and PSC subsidiaries as discontinued operations to reflect the actual and planned sale of these businesses.
All amounts are expressed in thousands of U.S. dollars, except for number of shares outstanding and per share amounts.
3 Months Ended | 12 Months Ended | |||||||||||||||
31-Oct | 31-Oct | 31-Oct | 31-Oct | |||||||||||||
2006 | 2005 | 2006 | 2005 | |||||||||||||
| Sales from continuing operations | ||||||||||||||||
| - Packaging Products | $ | 29,910 | $ | 28,955 | $ | 112,977 | $ | 108,076 | ||||||||
| Earnings from continuing operations | ||||||||||||||||
| before Interest, Taxes, Depreciation | 2,020 | 1,850 | 5,532 | 5,764 | ||||||||||||
| and Amortization (EBITDA)** | ||||||||||||||||
| Net Loss from continuing operations | (1,462 | ) | (1,385 | ) | (3,602 | ) | (2,389 | ) | ||||||||
| Net Loss from discontinued operations | (6,897 | ) | (6,978 | ) | (19,905 | ) | (13,280 | ) | ||||||||
| Net Loss | $ | (8,359 | ) | $ | (8,363 | ) | $ | (23,507 | ) | $ | (15,669 | ) | ||||
| Net loss per share from continuing operations | ||||||||||||||||
| - Basic | �� | $ | (0.22 | ) | $ | (0.20 | ) | $ | (0.53 | ) | $ | (0.36 | ) | |||
| - Diluted | $ | (0.22 | ) | $ | (0.20 | ) | $ | (0.53 | ) | $ | (0.36 | ) | ||||
| Net loss per share from discontinued operations | ||||||||||||||||
| - Basic | $ | (1.01 | ) | $ | (1.03 | ) | $ | (2.93 | ) | $ | (1.99 | ) | ||||
| - Diluted | $ | (1.01 | ) | $ | (1.03 | ) | $ | (2.93 | ) | $ | (1.99 | ) | ||||
| Net loss per share | ||||||||||||||||
| - Basic | $ | (1.23 | ) | $ | (1.23 | ) | $ | (3.46 | ) | $ | (2.35 | ) | ||||
| - Diluted | $ | (1.23 | ) | $ | (1.23 | ) | $ | (3.46 | ) | $ | (2.35 | ) | ||||
| Weighted average number of shares outstanding | ||||||||||||||||
(in millions) - Basic | 6.8 | 6.8 | 6.8 | 6.7 | ||||||||||||
| - Diluted | 6.8 | 6.8 | 6.8 | 6.7 | ||||||||||||
| Prior period amounts have been reclassifed from statements previously presented to conform to the presentation of the 2006 year end Consolidated Financial Statements. | ||||||||||||||||
| ** EBITDA is not a recognized measure under Canadian Generally Accepted Accounting Principles and readers are cautioned that EBITDA should not be considered as an alternative to net income or loss or cash from operating activities as an indicator of the Company's performance or cash flows. EBITDA, as calculated by the Company, is net income or loss before extraordinary items, net interest expenses and other, depreciation and amortization, and income taxes. Full interim financial statements along with Management's Discussion and Analysis can be obtained from SEDAR (www.sedar.com) and the Company's web site at www.polyair.com | ||||||||||||||||
The results of the Company’s Packaging Division have continued to improve from those reported earlier in the fiscal year due to increased sales volumes and gross margins. Gross margins improved to 15.4% from 13.2% in the fourth quarter of the 2005 fiscal year, primarily due to the combined impact of lower material costs and reduced overheads. Offsetting the Company’s operating gains in the fourth quarter of 2006 were higher interest rate costs. The Company reported a net loss from continuing operations of $1.5 million, partly due to a $0.9 million net tax provision in the quarter.
In its discontinued operations, comprising mainly the Pool Division, the Company recorded a loss of $6.9 million reflecting writedowns of assets associated with the discontinued business components, and professional and other costs associated with exiting the discontinued businesses. In the fourth quarter, the Company also completed the sale and lease-back of its Toronto head office building at 330 Humberline Drive. The $7.1 million gain earned on this transaction has been deferred and will be recognized over the 10 year life of the lease.
The Company’s operating bank debt has been reduced to $9.5 million from $21.1 million at the end of 2005, and total debt stood at $25.6 million compared to $41.3 million last year. The previously announced $5 million offer to finance which the Company received from an investment fund in October 2006, is currently being re-negotiated by the parties in light of the Company’s various asset sales and its modified capital requirements.
“The last fiscal year has been challenging for the Company and I am pleased to report progress in improving the profitability of the packaging business and the sale of non-core assets. The progress achieved is a testament to the commitment and effort of our employees, combined with the support we received from our lenders and customers” stated Victor D’Souza, interim CEO in announcing the Company’s results.
Polyair Inter Pack Inc. (www.Polyair.com) in its Packaging Division manufactures and distributes a wide range of protective packaging products in North America. The Company operates nine manufacturing facilities, seven of which are in the US where it generates the majority of its sales.
Certain information included in this news release contains statements that are forward-looking, such as statements relating to anticipated future revenues of the company, financing and the sale of non-packaging assets. Such forward-looking information involves important risks and uncertainties that could significantly affect anticipated results in the future and, accordingly, such results may differ materially from those expressed in any forward-looking statements made by or on behalf of Polyair Inter Pack Inc. In addition, Polyair Inter Pack Inc. expressly disclaims any obligation to publicly update or alter its previously issued forward-looking statements.
For more information contact:
Stysia Reay
Polyair Inter Pack Inc.
Phone: 416-679-6591
Email: sreay@polyair.com
Exhibit 2
Consolidated Financial Statements
POLYAIR INTER PACK INC.
Years ended October 31, 2006, 2005 and 2004
MANAGEMENT’S RESPONSIBILITY FOR FINANCIAL
REPORTING
The accompanying consolidated financial statements of Polyair Inter Pack Inc. (“Polyair”) and all the information in the Management Discussion and Analysis are the responsibility of management and have been approved by the Board of Directors.
The financial statements have been prepared by management in accordance with Canadian generally accepted accounting principles. The financial statements include certain amounts that are based on the best estimates and judgements of management, and in their opinion present fairly, in all material respects, Polyair’s financial position, results of operations and cash flows. Management has prepared the financial information presented elsewhere in the Management Discussion and Analysis and has ensured that it is consistent with the financial statements.
Management of Polyair, in furtherance of the integrity of the financial statements, has developed and maintains a system of internal controls. Management believes the internal controls provide reasonable assurance that transactions are properly authorized and recorded, financial records are reliable and form a proper basis for the preparation of financial statements and that Polyair’s assets are properly accounted for and safeguarded.
The Board of Directors is responsible for overseeing Management’s responsibility for financial reporting and is ultimately responsible for reviewing and approving the financial statements. The Board of Directors is assisted in meeting this responsibility through the Audit Committee.
The Audit Committee is appointed by the Board of Directors and its members are outside, unrelated directors. The Audit Committee meets periodically with management, as well as the external auditors, to discuss internal controls over the financial reporting process, auditing matters and financial reporting issues to satisfy itself that each party is properly discharging its responsibilities, and to review the Management Discussion and Analysis, the financial statements and the external auditor’s report. The Audit Committee reports its findings to the Board for consideration when approving the financial statements for issuance to the shareholders. The Audit Committee also considers, for review by the Board of Directors and approval by the shareholders, the engagement or re-appointment of the external auditors.
The financial statements have been audited by BDO Dunwoody LLP, the external auditors, in accordance with Canadian generally accepted auditing standards on behalf of the shareholders. BDO Dunwoody LLP has full and free access to the Audit Committee.
Victor D’Souza Michael Freel
Interim Chief Executive Officer Director of Finance
AUDITORS' REPORT TO THE SHAREHOLDERS
We have audited the consolidated balance sheet of Polyair Inter Pack Inc. as at October 31, 2006 and the consolidated statement of income and retained earnings and cash flows for the year ended October 31, 2006. These consolidated financial statements are the responsibility of the Company's management. Our responsibility is to express an opinion on these consolidated financial statements based on our audit.
We conducted our audit in accordance with Canadian generally accepted auditing standards. Those standards require that we plan and perform an audit to obtain reasonable assurance whether the consolidated financial statements are free of material misstatement. An audit includes examining, on a test basis, evidence supporting the amounts and disclosures in the consolidated financial statements. An audit also includes assessing the accounting principles used and significant estimates made by management, as well as evaluating the overall consolidated financial statement presentation.
In our opinion, these consolidated financial statements present fairly, in all material respects, the financial position of the Company as at October 31, 2006 and the results of its operations and its cash flows for the year ended October 31, 2006 in accordance with Canadian generally accepted accounting principles.
The consolidated financial statements as at October 31, 2005 and 2004 and for the years then ended were audited by other auditors who expressed an opinion without reservation on those consolidated financial statements in their report dated January 23, 2006.
/s/BDO Dunwoody LLP
Chartered Accountants
Toronto, Canada
January 24, 2007
POLYAIR INTER PACK INC.
Consolidated Balance Sheets
(In thousands of U.S. dollars)
As at October 31
2006 | 2005 | ||||||
Restated * | |||||||
ASSETS | |||||||
Current Assets: | |||||||
| Cash | $ | 248 | $ | 183 | |||
| Accounts receivable, net | 13,811 | 23,264 | |||||
| Inventory (note 4) | 9,966 | 28,421 | |||||
| Prepaid expenses and other | 1,281 | 2,603 | |||||
| Income taxes receivable | 1,916 | 1,953 | |||||
| Future income tax | 1,807 | 1,422 | |||||
| Assets held for sale (note 5) | 4,577 | - | |||||
| 33,606 | 57,846 | ||||||
Property, plant and equipment, net (note 6) | 29,880 | 38,749 | |||||
Future income tax | 5,126 | 1,969 | |||||
Intangible and other assets, net (note 7) | 3,583 | 2,800 | |||||
Assets held for sale (note 5) | 1,074 | - | |||||
| $ | 73,269 | $ | 101,364 | ||||
LIABILITIES AND SHAREHOLDERS' EQUITY | |||||||
Current liabilities: | |||||||
| Bank indebtedness (note 8) | $ | 9,503 | $ | 21,096 | |||
| Accounts payable and accrued liabilities | 34,309 | 31,685 | |||||
| Due to joint venture | 351 | - | |||||
| Income taxes payable | 46 | 113 | |||||
| Liabilities of business being sold (note 5) | 1,485 | - | |||||
| Current portion of long-term debt (note 9) | 15,411 | 20,161 | |||||
| 61,105 | 73,055 | ||||||
Other long-term liabilities | 129 | - | |||||
Deferred gain (note 10) | 7,071 | - | |||||
Convertible note (note 11) | 653 | 876 | |||||
Future income tax | 3,293 | 3,720 | |||||
Shareholders' equity: | |||||||
| Convertible note (note 11) | 3,613 | 3,613 | |||||
| Capital stock (note 12) | 13,183 | 13,183 | |||||
| Contributed surplus | 366 | 212 | |||||
| Retained earnings / (deficit) | (20,273 | ) | 3,234 | ||||
| Cumulative translation account | 4,129 | 3,471 | |||||
| 1,018 | 23,713 | ||||||
| Basis of presentation (note 2) | |||||||
| $ | 73,269 | $ | 101,364 | ||||
| * Restated to reflect accounting policy change - see note 3 (o) | |||||||
| The accompanying notes are an integral part of these consolidated financial statements. | |||||||
On behalf of the Board:
Fred A. Litwin Victor D’Souza
Chairman of the Board Interim Chief Executive Officer
POLYAIR INTER PACK INC.
Consolidated Statements of Income and Retained Earnings
(In thousands of U.S. dollars, except per share amounts)
Years ended October 31
2006 | 2005 | 2004 | ||||||||
Restated* | Restated * | |||||||||
Sales | $ | 112,977 | $ | 108,076 | $ | 96,458 | ||||
Cost of sales | 97,611 | 92,551 | 81,239 | |||||||
Gross profit | 15,366 | 15,525 | 15,219 | |||||||
Selling, general and administrative expenses | 16,334 | 16,866 | 15,431 | |||||||
Net interest expense and other | 2,523 | 2,368 | 1,304 | |||||||
(Loss) / Income before income taxes | (3,491 | ) | (3,709 | ) | (1,516 | ) | ||||
Income taxes (recovery): | ||||||||||
| Current | 1,130 | (246 | ) | (238 | ) | |||||
| Future | (1,019 | ) | (1,074 | ) | (43 | ) | ||||
| 111 | (1,320 | ) | (281 | ) | ||||||
(Loss) / income for the period from continuing operations | $ | (3,602 | ) | $ | (2,389 | ) | $ | (1,235 | ) | |
(Loss) / income from discontinued operations, net of tax (note 13) | (19,905 | ) | (13,280 | ) | 230 | |||||
Extraordinary Gain, Net of Taxes (note 22) | - | - | 948 | |||||||
Net (loss ) / income | (23,507 | ) | (15,669 | ) | (57 | ) | ||||
Retained earnings (deficit), beginning of period | 3,234 | 18,903 | 18,960 | |||||||
Retained earnings (deficit), end of period | $ | (20,273 | ) | $ | 3,234 | $ | 18,903 | |||
Net (loss) / income per share from continuing operations | ||||||||||
| Basic | $ | (0.53 | ) | $ | (0.36 | ) | $ | (0.20 | ) | |
| Diluted | $ | (0.53 | ) | $ | (0.36 | ) | $ | (0.20 | ) | |
Net (loss) / income per share from discontinued operations | ||||||||||
| Basic | $ | (2.93 | ) | $ | (1.99 | ) | $ | 0.19 | ||
| Diluted | $ | (2.93 | ) | $ | (1.99 | ) | $ | 0.19 | ||
Net (loss) / income per share | ||||||||||
| Basic | $ | (3.46 | ) | $ | (2.35 | ) | $ | (0.01 | ) | |
| Diluted | $ | (3.46 | ) | $ | (2.35 | ) | $ | (0.01 | ) | |
Weighted average number of shares outstanding | ||||||||||
| Basic | 6,797,250 | 6,673,370 | 6,130,264 | |||||||
| Diluted | 6,797,250 | 6,673,370 | 6,130,264 | |||||||
| * Restated to reflect accounting policy change - see note 3 (o) | ||||||||||
| The accompanying notes are an integral part of these consolidated financial statements. | ||||||||||
POLYAIR INTER PACK INC.
Consolidated Statements of Cash Flows
(In thousands of U.S. dollars)
Years ended October 31
2006 | 2005 | 2004 | ||||||||
Operating activities: | ||||||||||
| Net (loss) / income | $ | (23,507 | ) | $ | (15,669 | ) | $ | (57 | ) | |
| Items which do not involve cash: | ||||||||||
| Depreciation and amortization | 7,365 | 8,625 | 7,231 | |||||||
| Loss (gain) on sale of assets | 531 | 210 | (616 | ) | ||||||
| Extraordinary items | - | - | (948 | ) | ||||||
| Impairment of Property, plant and equipment | 954 | 2,866 | - | |||||||
| Stock based compensation | 153 | 129 | 83 | |||||||
| Future income taxes and other | (3,629 | ) | (2,512 | ) | 1,361 | |||||
| Change in non-cash operating working capital: | ||||||||||
| Accounts receivable | 7,741 | 2,092 | (256 | ) | ||||||
| Inventory | 18,387 | 14,052 | (9,504 | ) | ||||||
| Prepaid expenses and other | 1,255 | (94 | ) | (190 | ) | |||||
| Accounts payable and accrued liabilities | 2,302 | (4,144 | ) | 8,523 | ||||||
| Income taxes payable/receivable | 22 | (537 | ) | (3,023 | ) | |||||
| Interest on convertible debenture | (265 | ) | (184 | ) | (194 | ) | ||||
| 11,309 | 4,834 | 2,410 | ||||||||
Investing activities | ||||||||||
| Purchase and deposits on building and equipment | (1,912 | ) | (5,734 | ) | (10,064 | ) | ||||
| Net proceeds on the sale of capital assets | 7,174 | 51 | 616 | |||||||
| Due to (from) joint venture | 219 | (31 | ) | 168 | ||||||
| Other | (664 | ) | (481 | ) | (394 | ) | ||||
| 4,817 | (6,195 | ) | (9,674 | ) | ||||||
Financing activities: | ||||||||||
| Increase in long-term debt | - | 1,717 | 8,620 | |||||||
| Repayment of long-term debt | (4,787 | ) | (6,100 | ) | (4,521 | ) | ||||
| Net increase in bank indebtedness | (11,727 | ) | 2,084 | 4,269 | ||||||
| Stock options exercised | - | 1,670 | 1,585 | |||||||
| (16,514 | ) | (629 | ) | 9,953 | ||||||
Effect of currency translation on cash balances | 453 | (113 | ) | (1,291 | ) | |||||
Increase / (Decrease) in cash | 65 | (2,103 | ) | 1,398 | ||||||
Cash, beginning of year | 183 | 2,286 | 888 | |||||||
Cash, end of year | $ | 248 | $ | 183 | $ | 2,286 | ||||
Supplemental cash flow information: | ||||||||||
| Interest paid | 3,893 | 3,306 | 2,581 | |||||||
| Net income taxes (recovered) / paid | (421 | ) | (1,119 | ) | 1,334 | |||||
| The accompanying notes are an integral part of these consolidated financial statements. | ||||||||||
POLYAIR INTER PACK INC.
Notes to Consolidated Financial Statements
(In thousands of U.S. dollars, except per share amounts and except where noted)
October 31, 2006, 2005 and 2004
1. Nature of the business:
Polyair Inter Pack Inc. (the "Company" or “Polyair”) is a public company whose shares trade on the Toronto and American Stock Exchanges. The Company manufactures and distributes packaging product and swimming pool covers.
2. Basis of presentation:
The Company’s banking agreements contain several covenants, which require the Company to meet a certain maximum level of pre-tax losses and minimal level of tangible net worth tested on a quarterly basis. During the fiscal year the Company and its lenders agreed on several amendments to the covenants and other terms of its credit facilities. These amendments were required in order to accommodate losses incurred, to provide working capital and to allow divesture of the Pool Division. Following these amendments, the Company was in compliance with all debt covenants as at October 31, 2006.
The Company is currently negotiating with its lenders covenants for its 2007 fiscal year. The Company’s ongoing ability to meet covenants that are established will be dependent on an improvement in its profitability. At October 31, 2006 this improvement has not been clearly established and accordingly the Company believes it appropriate to continue to classify the term loans provided by these lenders as current. Under the terms of the Company’s lending agreements, violation of the primary financial covenants constitutes an event of default, which enables the lenders to demand repayment on the bank indebtedness, trigger cross defaults on the term loans thereby allowing the lenders to demand repayment of these loans, as well as take possession of the collateral security.
These Consolidated Financial Statements have been prepared on the basis of accounting principles applicable to a going concern, which assumes that the Company will be able to meet its financial covenant tests and generate positive cash flows from operations. In order for this to be realized the Company is dependent upon the continued support of the Company’s lenders and creditors and increased profitability of the Company’s packaging business, which is sensitive to the volume and price of packaging products sold, freight costs, and the cost of resin (a significant raw material component in the packaging business). If these assumptions are not met, the Company may not be able to realize its assets and discharge its liabilities in the normal course of operations. If the going concern assumption is not appropriate for these Consolidated Financial Statements, adjustments would be necessary in the carrying value of assets and liabilities and the reported revenues and expenses.
In 2006 the Company reported its Pool Division as a discontinued operation and sold operating assets associated with this division so that by year-end the only remaining assets were trade and other receivables. The Company operated its Pool Division from two wholly owned subsidiaries; the Canadian subsidiary sought protection under the Companies’ Creditors Arrangement Act (“CCAA”) in order to complete the sale of its assets and make a proposal to
POLYAIR INTER PACK INC.
Notes to Consolidated Financial Statements
(In thousands of U.S. dollars, except per share amounts and except where noted)
October 31, 2006, 2005 and 2004
2. Basis of presentation (continued):
its unsecured creditors to settle their claims. This proposal was agreed to by the Canadian subsidiary’s creditors subsequent to the Company’s year end.
The Company signed an agreement, effective October 31, 2006 for the sale of its 50.1% interest in PXL Cross Linked Foam Corporation (“PXL”), a Canadian based company that manufactures and distributes cross linked foam. The results from this business have been reported under results from discontinued operations in the 2006 financial statements.
In late 2006, the Board of Directors agreed to seek a buyer for its 76% interest in P.S.C. Mouldings Corporation (“PSC”), a business that manufactures and distributes expanded polystyrene products. Negotiations are underway with a purchaser and if successful the sale will conclude in the second quarter of 2007. The Company has reported this business as a discontinued operation in its 2006 fiscal year.
3. Significant accounting policies:
The consolidated financial statements of the Company have been prepared by management in accordance with accounting principles generally accepted in Canada.
(a) Basis of consolidation:
The consolidated financial statements include the accounts of the Company and those of its subsidiaries. Intercompany transactions and balances are eliminated on consolidation. The accounts also include the Company’s proportionate share of assets and liabilities of two joint ventures, PXL Cross Linked Foam Corporation (50.1% owned) and GCPC, Inc. (50.1% owned) (note 21).
| (b) | Reporting currency and foreign currency translation: |
The Company's reporting currency is the U.S. dollar and the Company’s functional currency is the Canadian dollar. The U.S. dollar is the functional currency of the Company’s United States operations. The Canadian dollar is the functional currency of the Company's Canadian operations.
Monetary items denominated in currencies other than the operation’s functional currency, such as cash and accounts receivable, are translated into the functional currency of the respective operations at exchange rates in effect at the balance sheet dates. Non-monetary items denominated in foreign currencies, such as property, plant and equipment are translated at rates of exchange in effect when the assets are acquired or obligations incurred. Revenue and expenses in currencies other than the operation’s functional currency are translated at rates in effect at the time of the transaction. Foreign exchange gains and losses arising from such translations are included in income.
POLYAIR INTER PACK INC.
Notes to Consolidated Financial Statements
(In thousands of U.S. dollars, except per share amounts and except where noted)
October 31, 2006, 2005 and 2004
3. Significant accounting policies (continued):
The Company’s Canadian operations are translated into U.S. dollars using the current rate method. Under this method, all assets and liabilities are translated at the year-end rate of exchange and all revenues and expense items are translated at the average rate of exchange for the year. Exchange rate differences arising on this translation are deferred into the Cumulative Translation Account reported as a component of shareholders’ equity.
(c) Revenue recognition:
Revenue from product sales is recognized when product is shipped to the customer, the customer takes ownership and assumes risk of loss, and collection of the relevant receivable is reasonably assured. Customer returns are recorded as an adjustment to sales. The Company estimates and accrues its customer returns based on historical trends and known return goods authorizations.
(d) Inventory:
Raw materials are stated at the lower of cost and replacement cost. Finished goods are stated at the lower of cost, determined by the first-in, first-out method, and net realizable value.
(e) Property, plant and equipment:
Property, plant and equipment are recorded at cost. Depreciation is recorded once assets are in use and is calculated using the straight-line method at annual rates designed to amortize the cost over their estimated useful lives as follows:
Building 2-1/2%
Machinery, equipment, furniture and fixtures 10% - 50%
Computer equipment 33%
Leasehold improvements Over term of lease plus
first renewal term
Property, plant and equipment, and other long-lived assets, are tested for impairment whenever events or changes in circumstances indicate that the carrying values of such assets exceed the projected future undiscounted cash flows. In these circumstances the Company reduces the carrying value of the assets to their fair value and recognizes an impairment charge.
POLYAIR INTER PACK INC.
Notes to Consolidated Financial Statements
(In thousands of U.S. dollars, except per share amounts and except where noted)
October 31, 2006, 2005 and 2004
3. Significant accounting policies (continued):
| (f) | Intangible and other assets: |
Patent, trademarks and license agreements are stated at cost, net of accumulated amortization. Amortization is provided over the useful lives of the intangible assets (5 to 20 years) using the straight-line method.
Goodwill is the residual amount that results when the purchase price of an acquired business exceeds the sum of the amounts allocated to the assets acquired, less liabilities assumed, based on their fair values. Goodwill is allocated, as of the date of the business combination, to the Company's reporting units that are expected to benefit from the synergies of the business combination.
Goodwill is not amortized and is tested for impairment annually, or more frequently, if events or changes in circumstances indicate that the asset might be impaired. The impairment test is carried out in two steps. In the first step, the carrying amount of the reporting unit is compared with its fair value. When the fair value of a reporting unit exceeds its carrying amount, goodwill of the reporting unit is considered not to be impaired and the second step of the impairment test is unnecessary.
The second step is carried out when the carrying amount of a reporting unit exceeds its fair value, in which case, the implied fair value of the reporting unit's goodwill is compared with its carrying amount to measure the amount of the impairment loss, if any. The implied fair value of goodwill is determined in the same manner as the value of goodwill is determined in a business combination described in the preceding paragraph, using the fair value of the reporting unit as if it was the purchase price. When the carrying amount of reporting unit goodwill exceeds the implied fair value of the goodwill, an impairment loss is recognized in an amount equal to the excess.
Deferred financing costs are amortized using the straight-line method over the term of the related financing. The amortization of deferred financing costs is included in Net interest expense and other.
| (g) | Financial instruments: |
In 2006, the Company did not enter into any foreign exchange contracts to hedge its exposure. In 2005, and prior, the Company entered into future foreign currency exchange contracts to manage foreign currency exposures. These contracts are not designated and documented as hedging relationships in accordance with Accounting Guideline 13, Hedging Relationships, and accordingly are measured at fair value with changes in fair value recorded in the statements of income and retained earnings.
POLYAIR INTER PACK INC.
Notes to Consolidated Financial Statements
(In thousands of U.S. dollars, except per share amounts and except where noted)
October 31, 2006, 2005 and 2004
3. Significant accounting policies (continued):
(h) Income taxes:
The Company follows the assets and liability method of accounting for income taxes. Under this method, future income tax assets and liabilities reflect the net tax effects of temporary differences between the carrying amounts of assets and liabilities for financial reporting purposes and the amounts employed for income tax purposes and the benefit of losses to be carried forward to future years for income tax purposes.
Future tax assets and liabilities are measured using enacted or substantively enacted tax rates expected to apply to taxable income in the years in which those temporary differences are expected to be recovered or settled. The effect on future tax assets and liabilities of a change in tax rates is recognized in income in the year that the rate changes. A valuation allowance is provided to the extent that it is more likely than not that future income tax assets will not be realized.
(i) Stock-based compensation plan:
The Company has a stock-based compensation plan, which is described in note 12.
The Company adopted recommendations of The Canadian Institute of Chartered Accountants with respect to the accounting for stock-based compensation and other stock-based payments, using the fair value-based method. Under the fair value method, compensation costs attributable to awards to Company employees are measured at fair value at the date of the grant, amortized over the vesting period on a straight-line basis, and charged to earnings with a related credit to Contributed Surplus. Consideration paid by employees on exercise of stock options is recorded as share capital. These recommendations were applied to all stock-based payments granted on or after November 1, 2002.
(j) Exit and disposal costs:
The Company recognizes costs associated with exit or disposal activities at fair value in the period in which the liability is incurred. Special termination benefits are recognized at fair value at the communication date.
(k) (Loss) income per share:
Basic (loss) income per share is computed using the weighted average number of common shares outstanding during the year. Diluted income per share is computed using the weighted average number of common and potential common shares outstanding during the year. Potential common shares consist of the incremental number of common shares issuable upon the exercise of stock options and the conversion of the convertible note.
POLYAIR INTER PACK INC.
Notes to Consolidated Financial Statements
(In thousands of U.S. dollars, except per share amounts and except where noted)
October 31, 2006, 2005 and 2004
3. Significant accounting policies (continued):
(l) Use of estimates:
The preparation of financial statements requires management to make estimates and assumptions that affect the reported amounts of assets and liabilities and disclosure of contingent assets and liabilities at the date of the financial statements and the reported amounts of revenue and expenses during the year.
The Company maintains a provision for obsolete inventory. In evaluating, the adequacy of the Company’s provision for inventory obsolescence a number of factors are considered including level of inventory in relationship to historical and forecasted sales, changes in demand for products, planned obsolescence and product replacement. The Company’s provision for inventory obsolescence may require adjustment as these factors change.
The Company maintains accounts receivable allowances for estimated losses resulting from the inability of its customers to make payments. It performs periodic credit evaluations of its customers and with the exception of the Pool Division’s exports sales, it typically does not carry collateral or credit insurance. The Company’s estimate of the allowance for doubtful accounts may prove insufficient if a greater than expected numbers of customers are delinquent in their payments.
(m) Environmental obligations:
The Company’s operations are subject to numerous environmental laws, regulations and guidelines adopted by various governmental authorities in the jurisdictions in which the Company operates. Liabilities are recorded when known or considered probable and can be reasonably estimated. The Company provides for environmental liabilities using best estimates. Actual environmental liabilities could differ significantly from these estimates.
| (n) | Asset retirement obligations |
The Company recognizes the fair value of a future asset retirement obligation as a liability in the period in which it incurs a legal obligation associated with the retirement of tangible long-lived assets that results from the acquisition, construction, development, and/or normal use of the assets. The Company concurrently recognizes a corresponding increase in the carrying amount of the related long-lived asset that is depreciated over the life of the asset. The fair value of the asset retirement obligation is estimated using the expected cash flow approach that reflects a range of possible outcomes discounted at a credit-
POLYAIR INTER PACK INC.
Notes to Consolidated Financial Statements
(In thousands of U.S. dollars, except per share amounts and except where noted)
October 31, 2006, 2005 and 2004
3. Significant accounting policies (continued):
adjusted risk-free interest rate. Subsequent to the initial measurement, the asset retirement obligation is adjusted at the end of each period to reflect the passage of time and changes in the estimated future cash flows underlying the obligation. Changes in the obligation due to the passage of time are recognized in income as an operating expense using the interest method. Changes in the obligation due to changes in estimated cash flows are recognized as an adjustment of the carrying amount of the related long-lived asset that is depreciated over the remaining life of the asset.
| (o) | Accounting policy changes |
The accounting policy with regard to the Convertible Note was changed in 2006; the effect of this change is covered in Note 11- Convertible Note.
4. Inventory:
2006 | 2005 | ||||||
| Raw materials | $ | 6,917 | $ | 17,220 | |||
| Finished goods | 3,049 | 11,201 | |||||
| $ | 9,966 | $ | 28,421 | ||||
5. Assets and Liabilities of Business Held for Sale:
In the first quarter of 2007, the Company completed the sale of its 50.1% interest in PXL. The Company reported $2.4 million of assets associated with this business under Assets held for sale and $1.5 million of liabilities under Liabilities of business being sold.
The Company has also decided to sell its 76% interest in PSC and at October 31, 2006 has reported $3.2 million as Assets held for sale. To reflect the valuation ascribed by the anticipated proceeds, machinery and intangibles related to this business were written down by a total of $1.1 million in the fourth quarter of 2006. This charge was booked to results from discontinued operations.
POLYAIR INTER PACK INC.
Notes to Consolidated Financial Statements
(In thousands of U.S. dollars, except per share amounts and except where noted)
October 31, 2006, 2005 and 2004
6. Property, plant and equipment:
| 2006 | Cost | Accumulated depreciation | Net book value | |||||||
| Land | $ | 132 | $ | - | $ | 132 | ||||
| Building | 8,217 | 1,827 | 6,390 | |||||||
| Machinery, equipment, furniture & fixtures | 59,433 | 37,792 | 21,641 | |||||||
| Computer equipment | 3,356 | 3,004 | 352 | |||||||
| Leasehold improvements | 3,890 | 2,719 | 1,171 | |||||||
| Construction in progress | 86 | - | 86 | |||||||
| Computer equipment under capital lease | 216 | 108 | 108 | |||||||
| $ | 75,330 | $ | 45,450 | $ | 29,880 | |||||
| 2005 | Cost | Accumulated depreciation | Net book value | |||||||
| Land | $ | 132 | $ | - | $ | 132 | ||||
| Building | 8,226 | 1,619 | 6,607 | |||||||
| Machinery, equipment, furniture & fixtures | 64,996 | 37,464 | 27,532 | |||||||
| Computer equipment | 3,619 | 3,060 | 559 | |||||||
| Leasehold improvements | 6,281 | 4,453 | 1,828 | |||||||
| Construction in progress | 1,920 | - | 1,920 | |||||||
| Computer equipment under capital lease | 206 | 35 | 171 | |||||||
| $ | 85,380 | $ | 46,631 | $ | 38,749 | |||||
In 2005, as a result of substantial losses incurred in the Pool products segment, the Company evaluated this segment’s Property, plant and equipment to determine if their carrying value exceeded their projected undiscounted future cash flows. The Company determined that it was appropriate to reduce the carrying value of these assets and recognized an impairment charge of $2,866. In 2006, all of the Property, plant and equipment of this division were sold and further losses of $443 where incurred.
In anticipation of the proceeds that will be received from the sale of the Company’s interest in its PSC subsidiary, the Company determined that is was appropriate to reduce the carrying value of the Property, plant and equipment of this business and recognized an impairment charge of $0.6 million.
All of the charges above have been included under results from Discontinued Operations.
Construction in progress represents primarily costs paid to vendors for machinery and equipment constructed or developed over time. Depreciation expense is not booked on these assets until they become available for commercial use.
7. Intangible and other assets:
2006 | Cost | Accumulated amortization | Net book value | |||||||
| Patent, trademarks and license agreements | $ | 443 | $ | 342 | $ | 101 | ||||
| Deferred financing costs | 634 | 369 | 265 | |||||||
| Goodwill | 392 | 59 | 333 | |||||||
| Other assets | 2,884 | - | 2,884 | |||||||
| $ | 4,353 | $ | 770 | $ | 3,583 | |||||
2005 | Cost | Accumulated amortization | Net book value | |||||||
| Patent, trademarks and license agreements | $ | 816 | $ | 432 | $ | 384 | ||||
| Deferred financing costs | 652 | 278 | 374 | |||||||
| Goodwill | 1,226 | 302 | 924 | |||||||
| Other assets | 1,118 | - | 1,118 | |||||||
| $ | 3,812 | $ | 1,012 | $ | 2,800 | |||||
Other assets include $809 (2005 - $727) representing the Company’s proportionate share of the amount it advanced to its joint venture PXL, $123 (2005 - $0) representing the Company’s proportionate share of the amount it advanced to its joint venture GPCP, Inc., $1,425 (2005 - $0) representing a mortgage receivable, an advance of $106 (2005 - $391) to another business partner for the purpose of funding the development of a new product line and for the construction of machinery and equipment and deferred development costs of $421(2005 - $0) for the development of a new product line.
The mortgage receivable was acquired as a result of the disposition of a property by the Pool Division’s Canadian subsidiary. As part of a Plan of Arrangement agreed to by the subsidiary’s creditors, all proceeds ultimately realized as a result of holding the mortgage will be used to settle creditor claims.
In anticipation of the proceeds that will be received from the sale of the Company’s interest in its PSC subsidiary, the Company determined that is was appropriate to reduce the carrying value of the goodwill of this business and recognized an impairment charge of $0.6 million. The charge was included under results from discontinued operations.
POLYAIR INTER PACK INC.
Notes to Consolidated Financial Statements
(In thousands of U.S. dollars, except per share amounts and except where noted)
October 31, 2006, 2005 and 2004
8. Bank indebtedness:
Bank indebtedness consists of a revolving, working capital credit facility that provides the Company with a maximum of $20.0 million for working capital with availability determined periodically based on eligible accounts receivable and inventory. Based on October 31, 2006 collateral balances, the available credit facility is $14.6 million of which the Company has used $3.1 million for the issuance of letters of credit and has drawn $9.5 million for operating cash.
The Company renewed its banking agreement on October 31, 2005 for a three-year term. This agreement contained financial covenants that required the company to meet a certain maximum level of pre-tax losses and to maintain a certain minimum tangible net worth. During 2006, the Company’s lenders revised the covenants to accommodate losses the company has incurred and to limit capital expenditures.
2006 | 2005 | ||||||
| US dollar working capital credit facility, interest | |||||||
| payable at U.S. prime plus 0.75% or LIBOR plus | |||||||
| 3.5% at the option of the Company. | $ | 6,824 | $ | 9,402 | |||
| Canadian dollar working capital credit facility, | |||||||
| interest payable at Canadian prime plus 1.25% or | |||||||
| LIBOR plus 3.5% at the option of the Company. | $ | 2,679 | $ | 11,694 | |||
| $ | 9,503 | $ | 21,096 | ||||
POLYAIR INTER PACK INC.
Notes to Consolidated Financial Statements
(In thousands of U.S. dollars, except per share amounts and except where noted)
October 31, 2006, 2005 and 2004
9. Long-term debt:
2006 | 2005 | ||||||
| Canadian dollar equipment loans repayable by monthly blended | |||||||
| principal and interest payments, bearing interest at rates ranging | |||||||
| from 6.95% to 7.65%, maturing at various dates ranging from | |||||||
| August 2007 to February 2010. | $ | 3,840 | $ | 4,887 | |||
| Canadian dollar bank loan repayable by monthly principal payments, | |||||||
| bearing interest at Canadian prime plus 1.75%, or LIBOR plus 3.75% at the | |||||||
| option of the company, maturing on November 2010. | 1,336 | 1,872 | |||||
| U.S. dollar equipment loans repayable by monthly blended principal payments, | |||||||
| bearing interest at LIBOR plus 3.15%. Maturing on September 2007 | 769 | 1,675 | |||||
| U.S. dollar bank loans repayble by monthly principal payments, bearing interest | |||||||
| at U.S. prime plus 1.25%, or LIBOR plus 3.75% at the option of the Company, | |||||||
| maturing at various dates ranging from June 2011 to May 2014. | 7,160 | 8,606 | |||||
| U.S. dollar municipal equipment loans repayable by monthly blended principal | |||||||
| and interest payments, bearing interest at fixed rate 3%, maturing at various | |||||||
| dates ranging from March 2007 to May 2007. | 163 | 506 | |||||
| U.S. dollar Industrial Revenue Bonds, repayable by quarterly sinking fund | |||||||
| installments, bearing interest at a floating rate, based on the rates prevalent | |||||||
| for the highest rated short-term, U.S. federal tax-exempt obligations, | |||||||
| maturing June 1, 2016. | 2,283 | 2,425 | |||||
| Canadian dollar Capital lease obligation, repayable by monthy principal and | |||||||
| interest payments, bearing interest at 8.34% per annum, maturing | |||||||
| August 2009. | 158 | 190 | |||||
| 15,709 | 20,161 | ||||||
| Less: Liabilities of business being sold | (298 | ) | - | ||||
| $ | 15,411 | $ | 20,161 | ||||
The bank operating and term loans are secured by a first charge on substantially all the assets of the Company and are governed by the same lending agreement. The Industrial Revenue Bonds are secured by a first charge on specific land and buildings and supported by a letter of credit. Equipment loans are secured by a first charge on specific equipment.
Certain of the Canadian dollar loans are secured in part by assets, which will be disposed of as part of the disposition of the PSC business. The Company will be required to pay back approximately $0.4 million of this loan upon closing of this transaction.
POLYAIR INTER PACK INC.
Notes to Consolidated Financial Statements
(In thousands of U.S. dollars, except per share amounts and except where noted)
October 31, 2006, 2005 and 2004
9. Long-term debt (continued):
| Under the terms of the debt agreements, the following are the original repayment terms: | ||||
| 2007 | $ | 3,891 | ||
| 2008 | 3,071 | |||
| 2009 | 2,601 | |||
| 2010 | 1,876 | |||
| 2011 | 1,193 | |||
| Thereafter | 2,779 | |||
| $ | 15,411 | |||
10. Deferred Gain
In 2006, the Pool Division sold a property that is used as the Company’s head office and Toronto manufacturing plant, for $8.4 million. Cash proceeds from this sale were used to repay bank debt and the Pool Division took back a five-year second mortgage from the purchaser for $1.4 million. Interest on this mortgage receivable accrues at a rate of 6.5% per annum and is payable at maturity.
The Company’s Canadian packaging subsidiary entered into a lease with the purchaser to lease the property for a term of 10 years. Accordingly, the net gain on the sale of $7.1 million has been deferred and will be amortized on a straight-line basis over the term of the lease. The amortized gain will be recorded in future periods under results from continuing operations.
11.Convertible note:
In May 2003, the Company, through its Pool Division, acquired certain swimming pool and pool equipment assets from Jacuzzi Inc. and Jacuzzi Leisure Products Inc. (Atlantic/Jacuzzi acquisition) at a purchase cost of $40.2 million. As part of the acquisition, the Company issued a $5.0 million unsecured convertible note, bearing interest of 6% per annum, maturing March 31, 2009. This note is convertible at the option of the holder, at any time after March 31, 2004 (or upon commencement of a take over bid) into 598,802 common shares at a price of $8.35 per share. The Company may prepay the note, at any time after March 31, 2006 in cash or by issuance of 598,802 Series A preference shares, which carry similar conversion features.
As the Company is required to make interest payments in cash while the note is outstanding, the discounted present value of future interest payments to maturity is classified as a liability on the balance sheet. As the Company has the unrestricted ability to satisfy payment of the principal amount of the note with equity, the discounted present value of the note at maturity has been classified as equity, including $462 of the proceeds allocated to the value of the note holders' conversion option.
POLYAIR INTER PACK INC.
Notes to Consolidated Financial Statements
(In thousands of U.S. dollars, except per share amounts and except where noted)
October 31, 2006, 2005 and 2004
11.Convertible note (continued):
Change in Accounting Policy
Effective December 1, 2005, the Canadian Institute of Chartered Accountants' Emerging Issues Committee withdrew Abstract 71 "Financial Instruments That May Be Settled At The Issuer's Option In Cash or Its Own Equity Instruments" (EIC 71). The Company had previously followed the guidance set out under this abstract such that an amount representing accretion of the equity carrying value to the face amount of the note over its term to maturity, on an after tax basis, had been accounted for as a reduction of equity and as a prior deduction in calculating earnings per common share. As a result of the withdrawal of EIC 71, a contractual obligation that can be settled in a Company's own shares, the number of which depends on the amount of the obligation represents a liability to the Company. A contractual obligation that can be settled in a fixed number of the Company's own shares represents an equity instrument to the Company. As the Company is able to satisfy the convertable debenture with a fixed number of shares, the equity carrying value of the debenture is not accreted and accordingly the equity carrying value remains at its historic value.
As a result of the retroactive implementation of this new standard and the restatement of prior period amounts, the Consolidated Statement of Income and Retained Earnings and Consolidated Balance Sheet have changed for the current and prior years as follows:
Increase (decrease) in | 2006 | 2005 | 2004 | |||||||
Consolidated Statement of Income and Retained Earnings | ||||||||||
Convertible Note Charge | (282 | ) | (158 | ) | (164 | ) | ||||
Consolidated Balance Sheet | ||||||||||
Convertible Note | (1,012 | ) | (730 | ) | (468 | ) | ||||
Retained Earnings / Deficit | 695 | 413 | 255 | |||||||
Cumulative Translation Acount | 317 | 317 | 213 |
POLYAIR INTER PACK INC.
Notes to Consolidated Financial Statements
(In thousands of U.S. dollars, except per share amounts and except where noted)
October 31, 2006, 2005 and 2004
12. Capital stock:
Authorized:
598,802 Series A preference shares,
non-voting, cumulative, bearing dividend at an annual rate of $0.501 per share,
redeemable and convertible, at the option of the holder, into an equivalent number of common shares
Unlimited common shares
Issued common shares:
2006 | 2005 | |||||||||||||||||
| Shares | Amount | Shares | Amount | |||||||||||||||
| Outstanding, beginning of year | 6,797,250 | $ | 13,183 | 6,448,350 | $ | 11,513 | ||||||||||||
| Options exercised during year | - | - | 348,900 | 1,670 | ||||||||||||||
| Outstanding, end of year | 6,797,250 | $ | 13,183 | 6,797,250 | $ | 13,183 | ||||||||||||
Stock options:
All options are set to expire 10 years from the date of grant. The Company has authorized options to purchase 1,141,000 common shares since the inception of the plan, and amended the plan in 2005 to authorize an additional 300,000 options for a total of 1,441,000 options. At October 31, 2006, 119,800 remain outstanding (2005 - 241,400) at prices ranging from Cdn. $6.00 to $13.44 per share. At year end, the weighted average remaining contractual life of the outstanding options was 6.17 years (2005 - 5.30 years; 2004 - 3.24 years) and 77,228 (2005 - 147,550; 2004 - 472,594) options were exercisable at prices ranging from Cdn. $6.00 to $13.44 per share.
| Options | Average exercised price ($Cdn.) | |||||||||||||||
| 2006 | 2005 | 2004 | 2006 | 2005 | 2004 | |||||||||||
| Outstanding, beginning of year | 241,400 | 542,700 | 868,750 | $ | 8.33 | $ | 6.54 | $ | 6.34 | |||||||
| Granted | - | 102,400 | - | - | 10.65 | - | ||||||||||
| Exercised | - | (348,900 | ) | (321,850 | ) | - | (6.00 | ) | (6.00 | |||||||
| Forfeited | (121,600 | ) | (54,800 | ) | (4,200 | ) | (7.19 | ) | (9.50 | ) | (8.66 | |||||
| Outstanding, end of year | 119,800 | 241,400 | 542,700 | $ | 9.49 | $ | 8.33 | $ | 6.54 | |||||||
POLYAIR INTER PACK INC.
Notes to Consolidated Financial Statements
(In thousands of U.S. dollars, except per share amounts and except where noted)
October 31, 2006, 2005 and 2004
12. Capital stock (continued):
The following table summarizes information about stock options outstanding at October 31, 2006:
| Options outstanding | Options exercisable | ||||||||
| Exercise prices ($Cdn.) | Number outstanding | Weighted average remaining contractual life (years | ) | Number exercisable | |||||
| $ 6.00 | 33,600 | 3.67 | 29,768 | ||||||
| $ 6.82 | 7,000 | 5.42 | 4,583 | ||||||
| $ 10.00 | 23,100 | 6.42 | 16,555 | ||||||
| $ 10.65 | 34,700 | 8.21 | 12,434 | ||||||
| $ 12.60 | 1,400 | 6.83 | 888 | ||||||
| $ 13.44 | 20,000 | 6.75 | 13,000 | ||||||
Assumptions | ||||||||||||||||||
Expected voltaility | Risk-free interest rate | Weighted average fair value | Expected life | Vesting period | ||||||||||||||
| Options granted: | ||||||||||||||||||
| 2006 | No options granted | |||||||||||||||||
| 2005 | 23% | 3.54% | 3.54 | 9 | 5 | |||||||||||||
| 2004 | No options granted | |||||||||||||||||
During the year, the Company, using the assumptions in the table above and the Black-Scholes option-pricing model, recognized stock-based compensation expense of $153 (2005 - $129, 2004 - $83). This amount was credited to contributed surplus.
POLYAIR INTER PACK INC.
Notes to Consolidated Financial Statements
(In thousands of U.S. dollars, except per share amounts and except where noted)
October 31, 2006, 2005 and 2004
13. Discontinued operations:
The operating results of the Pool Division, PXL and PSC have been classified as discontinued operations and comparative figures have been restated. Net revenues, results from operations, losses from disposals of assets and income tax impacts have been set out below.
2006 | 2005 | 2004 | |||||||
Revenues | |||||||||
| Pool Division | $ | 64,839 | $ | 78,908 | $ | 87,361 | |||
| Packaging Division (PXL & PSC) | 10,947 | 9,190 | 8,129 | ||||||
| 75,786 | 88,098 | 95,490 | |||||||
(Loss) / Income from operations: | |||||||||
| Pool Division | (19,992 | ) | (16,405 | ) | 467 | ||||
| Packaging Division (PXL & PSC) | (827 | ) | 190 | 5 | |||||
| (20,819 | ) | (16,215 | ) | 472 | |||||
(Loss) from disposal of assets - Pool Division | (3,729 | ) | - | - | |||||
Net (loss) / income before tax: | |||||||||
| Pool Division | (23,721 | ) | (16,405 | ) | 467 | ||||
| Packaging Division (PXL & PSC) | (827 | ) | 190 | 5 | |||||
| (24,548 | ) | (16,215 | ) | 472 | |||||
Income taxes (recovery): | |||||||||
| Pool Division | (4,674 | ) | (3,042 | ) | 292 | ||||
| Packaging Division (PXL & PSC) | 31 | 107 | (50 | ||||||
| (4,643 | ) | (2,935 | ) | 242 | |||||
Net (loss) / income from discontinued operations | |||||||||
| Pool Division | (19,047 | ) | (13,363 | ) | 175 | ||||
| Packaging Division (PXL & PSC) | (858 | ) | 83 | 55 | |||||
| (19,905 | ) | (13,280 | ) | 230 | |||||
The assets and liabilities of the Pool Division are aggregated on the balance sheet with the assets and liabilities of the continuing packaging business. The stated liabilities include the liabilities of the Canadian subsidiary that carried on the pool business in Canada. This legal entity is currently under protection from its creditors through a filing under the Companies’ Creditors Arrangement Act, and a Plan of Arrangement for settling $8.8 million of trade liabilities of this subsidiary has been agreed to by the subsidiary’s creditors. While these liabilities have been valued at their historical values, as the assets of this entity available to settle the liabilities are substantially less than the value of the liabilities, it is anticipated that these liabilities will be settled for an estimated 15% to 20% of their book value.
POLYAIR INTER PACK INC.
Notes to Consolidated Financial Statements
(In thousands of U.S. dollars, except per share amounts and except where noted)
October 31, 2006, 2005 and 2004
14. (Loss) income per share:
The following table sets forth the calculation of basic and diluted income per share:
2006 | 2005 | 2004 | ||||||||
| Restated* | Restated * | |||||||||
Net (loss) / income from continuing operation before extraordinary gain | $ | (3,602 | ) | $ | (2,389 | ) | $ | (1,235 | ) | |
Net (loss) / income from discontinued operations, net of tax (note 13) | (19,905 | ) | (13,280 | ) | 230 | |||||
Net (loss) / income available to common shareholders before extraordinary gain | (23,507 | ) | (15,669 | ) | (1,005 | ) | ||||
Extraordinary Gain, Net of Taxes | - | - | 948 | |||||||
Net (loss) / income available to common shareholders | (23,507 | ) | (15,669 | ) | (57 | ) | ||||
Denominator: | ||||||||||
| Weighted average number of shares outstanding | 6,797,250 | 6,673,370 | 6,130,264 | |||||||
| Effect of dilutive securities: | ||||||||||
| Employee stock options* | - | - | - | |||||||
| Convertible note* | - | - | - | |||||||
Weighted average shares - diluted* | 6,797,250 | 6,673,370 | 6,130,264 | |||||||
| * Excludes the effects of 119,800 (2005 - 241,400) stock options to purchase common shares and the | ||||||||||
| potential issuance of 598,802 (2005 - 598,802) common shares upon conversion of the convertible note | ||||||||||
| that are anti-dilutive. | ||||||||||
Net (loss) / income per share (based on income before extraordinary gain) from continuing operations: | ||||||||||
| Basic | $ | (0.53 | ) | $ | (0.36 | ) | $ | (0.20 | ) | |
| Diluted | $ | (0.53 | ) | $ | (0.36 | ) | $ | (0.20 | ) | |
Net (loss) / income per share (based on income before extraordinary gain) from discontinued operations: | ||||||||||
| Basic | $ | (2.93 | ) | $ | (1.99 | ) | $ | 0.04 | ||
| Diluted | $ | (2.93 | ) | $ | (1.99 | ) | $ | 0.04 | ||
Net (loss) / income per share (based on income after extraordinary gain) from continuing operations: | ||||||||||
| Basic | $ | (0.53 | ) | $ | (0.36 | ) | $ | (0.20 | ) | |
| Diluted | $ | (0.53 | ) | $ | (0.36 | ) | $ | (0.20 | ) | |
Net (loss) / income per share (based on income after extraordinary gain) from discontinued operations: | ||||||||||
| Basic | $ | (2.93 | ) | $ | (1.99 | ) | $ | 0.19 | ||
| Diluted | $ | (2.93 | ) | $ | (1.99 | ) | $ | 0.19 | ||
Weighted average number of shares outstanding | ||||||||||
| Basic | 6,797,250 | 6,673,370 | 6,130,264 | |||||||
| Diluted | 6,797,250 | 6,673,370 | 6,130,264 | |||||||
| * Restated to reflect accounting policy change - see note 3 (o) | ||||||||||
POLYAIR INTER PACK INC.
Notes to Consolidated Financial Statements
(In thousands of U.S. dollars, except per share amounts and except where noted)
October 31, 2006, 2005 and 2004
15. Income taxes:
2006 | 2005 | 2004 | ||||||||
| Current income taxes (recovery): | ||||||||||
| U.S. federal | $ | 988 | $ | 153 | $ | (34 | ) | |||
| U.S. state | 186 | 29 | (6 | ) | ||||||
| Canada | (44 | ) | (428 | ) | (198 | ) | ||||
| 1,130 | (246 | ) | (238 | ) | ||||||
| Future income taxes (recovery): | ||||||||||
| U.S. federal | (754 | ) | (501 | ) | 20 | |||||
| U.S. state | (142 | ) | (93 | ) | 8 | |||||
| Canada | (123 | ) | (480 | ) | (71 | ) | ||||
| (1,019 | ) | (1,074 | ) | (43 | ) | |||||
| $ | 111 | $ | (1,320 | ) | $ | (281 | ) | |||
The Company's income tax expense (recovery) differs from the amount that would have resulted by applying Canadian statutory tax rate of approximately 36.1% (2005 - 36.1%; 2004 -36.1%) to income as described below:
2006 | 2005 | 2004 | ||||||||
| Income tax (recovery) expense calculated | ||||||||||
| using statutory tax rates | $ | (10,122 | ) | $ | (7,192 | ) | $ | (377 | ) | |
| Non-deductible amounts | 269 | 89 | 35 | |||||||
| Manufacturing and processing | ||||||||||
| profits deduction (increase) | 417 | 214 | 15 | |||||||
| Foreign earnings subject to different | ||||||||||
| tax rates | (118 | ) | (345 | ) | 198 | |||||
| Valuation allowance taken | 4,216 | 3,441 | - | |||||||
| Large Corporations Tax | - | - | 85 | |||||||
| Other | 806 | (462 | ) | 5 | ||||||
| (4,532 | ) | (4,255 | ) | (39 | ) | |||||
| Less taxes (recovery) related to discontinuing operations | (4,643 | ) | (2,935 | ) | 242 | |||||
| Tax (recovery) on results from continuing operations | $ | 111 | $ | (1,320 | ) | $ | (281 | ) |
POLYAIR INTER PACK INC.
Notes to Consolidated Financial Statements
(In thousands of U.S. dollars, except per share amounts and except where noted)
October 31, 2006, 2005 and 2004
15. Income taxes (continued):
A summary of the principal components of future tax assets and liabilities calculated in accordance with Canadian accounting principles at October 31 is as follows:
2006 | 2005 | ||||||
| Current future tax assets: | |||||||
| Donations | $ | 31 | $ | 8 | |||
| Inventory | 13 | 184 | |||||
| Accounts Payable and Accrued Liabilities | 2,830 | 1,328 | |||||
| 2,874 | 1,520 | ||||||
| Valuation allowance | (1,067 | ) | (98 | ) | |||
| 1,807 | 1,422 | ||||||
| Non-current future tax assets: | |||||||
| Intangible and other assets | 56 | 248 | |||||
| Property, Plant and Equipment | 10 | 1,236 | |||||
| Non-capital losses carried forward | 8,966 | 3,169 | |||||
| Capital losses carried forward | 21 | 58 | |||||
| Corporate R&D and minimum tax credit | 100 | 337 | |||||
| Other long term assets | 2,339 | 86 | |||||
| Long-term debt | 662 | 479 | |||||
| 12,154 | 5,613 | ||||||
| Valuation allowance | (7,028 | ) | (3,644 | ) | |||
| 5,126 | 1,969 | ||||||
| 6,933 | 3,391 | ||||||
| Current future tax liabilities: | |||||||
| $ | - | $ | - | ||||
| Non-current future tax liabilities: | |||||||
| Plant, Property & Equipment | $ | (1,756 | ) | $ | (3,127 | ) | |
| Long-term debt | (743 | ) | (563 | ) | |||
| Intangible and other liabilities | (794 | ) | (30 | ) | |||
| (3,293 | ) | (3,720 | ) | ||||
| Net future tax assets (liabilities) | $ | 3,640 | $ | (329 | ) | ||
POLYAIR INTER PACK INC.
Notes to Consolidated Financial Statements
(In thousands of U.S. dollars, except per share amounts and except where noted)
October 31, 2006, 2005 and 2004
15. Income taxes (continued):
The Company has recorded future tax assets of $6,933 after a valuation allowance of $8,095 is taken into consideration. The valuation allowance is primarily for accumulated tax losses in the Pool Division’s Canadian subsidiary, and is due to the inability of this subsidiary to generate sufficient future taxable income to fully utilize these losses, due to the discontinuance of its business. In order to fully realize the remaining future income tax assets, the Company needs to generate future taxable income of approximately $19,208. Based on projections of future taxable income over the periods in which the future income tax assets are deductible, management believes it is more likely than not that the Company will realize the benefits of the future tax assets, net of the existing valuation allowance.
The Company and its subsidiaries have non-capital losses carried forward of $24,393. These non-capital losses have expiry dates ranging from 2011 to 2026. The company has recorded a valuation allowance of $4,026 against $11,641 of these losses to recognize those losses, which it does not expect to utilize. The losses above include federal non-capital loss carry forwards of $1,222 relating to one of the Company's U.S. subsidiaries. Of this amount $1,116 is restricted and becomes available to be utilized at the rate of $106 each year from 2007 to 2018. Some of the Company's U.S. subsidiaries also have state non-capital losses carried forward resulting in a future tax asset of $270, which has expiry dates ranging from 2015 to 2026.
16. Commitments:
The Company has production facilities under operating leases and computer equipment under capital leases. Rental expenses for all operating leases for the year totalled $3,275 (2005 - $3,175).
Future minimum rental payments to be made for all non-cancellable operating leases are as follows:
| 2007 | $ | 3,521 | ||
| 2008 | 3,145 | |||
| 2009 | 2,861 | |||
| 2010 | 2,746 | |||
| 2011 | 2,729 | |||
| Thereafter | 8,911 | |||
| $ | 23,913 |
Minimum lease payments include $1.1 million per year for a property formerly used by the discontinued pool business. The Company is seeking to sublet this property.
POLYAIR INTER PACK INC.
Notes to Consolidated Financial Statements
(In thousands of U.S. dollars, except per share amounts and except where noted)
October 31, 2006, 2005 and 2004
16. Commitments (continued):
Minimum lease payments for capital leases in aggregate and for the next five years are as follows:
Obligations under Capital Leases | ||
| 2007 | $ | 63 |
| 2008 | 63 | |
| 2009 | 51 | |
Total minimum lease payment | $ | 177 |
| Interest included in minimum payments at 8.34% | 19 | |
| Present value of net minimum lease payments | 158 | |
| Less: Current portion | 51 | |
| $ | 107 |
At October 31, 2006, the Company had commitments of $57 (2005 - $584) related to the completion of machinery and equipment under construction.
During 2005 the Company entered into a joint venture agreement with GPCP, Inc., which requires the Company to invest up to $550 for capital equipment and working capital over a two-year period. No costs were incurred in 2005 and $247 was invested in 2006.
17. Contingencies:
In the course of operations, the Company may be subject to litigation and claims. During 2006, the Company was subject to numerous claims initiated by creditors of the Pool Division, due to this Division’s inability to fulfill all of its creditor obligations. All significant creditor claims have been accounted for as accounts payable or accrued liabilities. Additionally any claims filed solely against the Canadian pool company have been stayed due to the subsidiary’s filing under the Companies’ Creditors Arrangement Act.
With respect to other actions against the Company and its subsidiaries, it is not possible to determine the amounts that may be ultimately assessed against the Company with respect to any existing or potential claims.
POLYAIR INTER PACK INC.
Notes to Consolidated Financial Statements
(In thousands of U.S. dollars, except per share amounts and except where noted)
October 31, 2006, 2005 and 2004
18. Related party transactions:
The Company is party to certain agreements and transactions with companies that are related either by common ownership or family relationship to a significant shareholder of the Company.
PSC paid management fees of Cdn $205 (U.S. $180) (2005 - U.S. $168) to a company of which a director and officer is related by family to a director and significant shareholder of Polyair Inter Pack Inc. This transaction was measured at the amount agreed to by the parties. These fees are paid under a July 1999 agreement that the Company entered into when it acquired an interest in PSC this agreement runs to July 1, 2009.
During the third quarter 2006, following the evaluation of offers by several purchasers, the Company sold the Pool Accessories business of its Pool Division to a company of which a former officer is a non-controlling shareholder.
During 2006, the Company sold a property that had been subject to a Put/Call agreement with a company (the “Optionee”) affiliated to a director and significant shareholder of the Company. The Put/Call agreement was entered into in March 2004 and it allowed the Optionee the contractual right to purchase the property, subject to the standard conditions of obtaining free and clear title. It also included a transfer restriction clause wherein the Company agreed not to sell or otherwise dispose of the property without notice to the Optionee and without the purchaser of the property agreeing to the terms of the Put/Call agreement. In September 2004, the purchaser exercised the call on the property. However title to the property was not conveyed at that time, as the Company’s lenders, who had a security charge against the property, did not provide their consent and free and clear title could not be obtained by the Optionee.
In the fourth quarter of 2006 the Company signed an agreement for the sale of this property with an unrelated third party. The agreement provided for the sale of the property for Cdn $9.4 million (US $8.4 million) with a secured vendor take back second mortgage of Cdn $1.6 million (US $1.4 million) and the balance to be paid in cash. The Optionee agreed to give up its transfer restriction rights to the property under the Put/Call agreement and to consent to the sale of the property in return for a payment of Cdn $1.5 million (US $1.3 million). The terms of the proposed payment were reviewed by an independent committee of the Company’s Board of Directors, approved by the Company’s Board of Directors and was consented to by the Company’s lenders.
POLYAIR INTER PACK INC.
Notes to Consolidated Financial Statements
(In thousands of U.S. dollars, except per share amounts and except where noted)
October 31, 2006, 2005 and 2004
19. Financial instruments:
The Company’s financial instruments consist of cash, accounts receivable, accounts payable and accrued liabilities, long-term debt, and working capital credit facility. The Company periodically uses derivative financial instruments, including future contracts to manage its foreign currency exposures. During 2006, the Company did not use future contracts
The fair values of the Company's financial instruments are as follows:
(a) Short-term financial assets and liabilities:
Short-term financial assets and liabilities are amounts that are expected to be settled within one year. The carrying amounts in the consolidated balance sheets approximate the fair value because of the short-term nature of these instruments.
As disclosed in note 2, the long-term portion of the term debt has been classified as a current liability.
(b) Long-term debt:
Long-term debt includes term loans and debenture loans that are not expected to be settled within one year. The carrying value of long-term debt approximates fair values as the interest rates charged on this debt approximate market rates for debt with similar terms and conditions.
20. Segmented information:
In its continuing operations the Company manufactures and markets packaging products. The Company operates principally in the United States and Canada.
By geographic region: | ||||||||||
2006 | 2005 | 2004 | ||||||||
| Sales: | ||||||||||
| United States | $ | 96,222 | $ | 91,994 | $ | 84,007 | ||||
| Canada | 16,755 | 16,082 | 12,451 | |||||||
| $ | 112,977 | $ | 108,076 | $ | 96,458 | |||||
| Property, plant and equipment and goodwill: | ||||||||||
| United States | $ | 17,447 | $ | 20,746 | $ | 23,345 | ||||
| Canada | 12,766 | 18,927 | 20,257 | |||||||
| $ | 30,213 | $ | 39,673 | $ | 43,602 |
POLYAIR INTER PACK INC.
Notes to Consolidated Financial Statements
(In thousands of U.S. dollars, except per share amounts and except where noted)
October 31, 2006, 2005 and 2004
20. Segmented information (continued):
By operating segment: | ||||||||||
2006 | 2005 | 2004 | ||||||||
| Sales | ||||||||||
| Packaging products | $ | 112,977 | $ | 108,076 | $ | 96,458 | ||||
| $ | 112,977 | $ | 108,076 | $ | 96,458 | |||||
| There were no sales to any one customer which constituted over 10% of total revenues. | ||||||||||
| Depreciation and amortization | ||||||||||
| Packaging products - continuing operations | $ | 6,500 | $ | 7,371 | $ | 6,138 | ||||
| Packaging products - discontinued operations | 865 | 264 | 321 | |||||||
| *Pool products - discontinued operations | - | 990 | 772 | |||||||
| Total | $ | 7,365 | $ | 8,625 | $ | 7,231 | ||||
| *Excludes write-off on disposal of property, plant and equipment of $0.4 million | ||||||||||
| (Loss) Income before net interest expense and other, and income taxes | ||||||||||
| Packaging products - continuing operations | $ | (968 | ) | $ | (1,341 | ) | $ | (212 | ) | |
| Packaging products - discontinued operations | (8 | ) | 439 | 384 | ||||||
| Pool products - discontinued operations | (21,635 | ) | (12,513 | ) | 885 | |||||
| $ | (22,611 | ) | $ | (13,415 | ) | $ | 1,057 | |||
| Non-recurring gains (net of tax) | ||||||||||
| Pool products - discontinued operations | - | - | 948 | |||||||
| $ | - | $ | - | $ | 948 | |||||
| Total assets: | ||||||||||
| Packaging products - continuing operations | $ | 61,384 | $ | 70,062 | $ | 67,090 | ||||
| Packaging products - discontinued operations | 5,651 | - | - | |||||||
| Pool products - discontinued operations | 6,234 | 31,302 | 54,395 | |||||||
| $ | 73,269 | $ | 101,364 | $ | 121,485 | |||||
| Capital expenditures: | ||||||||||
| Packaging products - continuing operations | $ | 1,391 | $ | 5,134 | $ | 6,396 | ||||
| Packaging products - discontinued operations | 207 | - | - | |||||||
| Pool products - discontinued operations | 314 | 799 | 3,668 | |||||||
| Total | $ | 1,912 | $ | 5,933 | $ | 10,064 | ||||
POLYAIR INTER PACK INC.
Notes to Consolidated Financial Statements
(In thousands of U.S. dollars, except per share amounts and except where noted)
October 31, 2006, 2005 and 2004
21. Interest in joint ventures:
Throughout 2005 and 2006, the Company owned 50.1% of a company established as a joint venture’s to produce cross-linked foam. The Company signed an agreement effective October 31, 2006 to sell its interest in this joint venture.
During 2005, the Company entered into an agreement to establish another joint venture for the production of a vapour corrosion inhibitor film. Under the terms of the agreement, the Company is required to jointly fund the start-up and capital equipment requirements of the venture, for a total of $1,100, of which the Company is responsible for $550.
These consolidated financial statements reflect the Company's proportionate interest in the joint ventures’ assets and liabilities. In general, liabilities of joint ventures are secured by pledges of related assets. As a participant in the venture, the Company may be liable for other participants' share of liabilities should they not be able to satisfy them, as well as its own share.
The following amounts included in the consolidated financial statements represent the Company's proportionate interest in the joint ventures at the end of the year:
2006 | 2005 | ||||||
| Current assets | $ | 1,168 | $ | 1,041 | |||
| Property, plant and equipment and other assets | 1,528 | 1,355 | |||||
| Current liabilities | (897 | ) | (918 | ) | |||
| Current portion of long-term debt | (165 | ) | (146 | ) | |||
| Long-term debt | (132 | ) | (283 | ) | |||
| Income taxes (net) | (84 | ) | (52 | ) | |||
| Net assets | $ | 1,418 | $ | 997 | |||
| Revenues | $ | 3,763 | $ | 2,756 | |||
| Gross profit | 1,134 | 786 | |||||
| Other expenses | 755 | 509 | |||||
| Net income before tax | 379 | 277 | |||||
| Net income after tax | $ | 249 | $ | 188 | |||
| Cash flows: | |||||||
| From operating activities | $ | 206 | $ | 171 | |||
| From investing activities | (403 | ) | (133 | ) | |||
| From financing activities | 399 | (102 | ) | ||||
| Effect of foreign currency translation | 5 | (14 | ) | ||||
| Net cash flows | $ | 207 | $ | (78 | ) | ||
| Due from joint venture | $ | 586 | $ | 765 | |||
POLYAIR INTER PACK INC.
Notes to Consolidated Financial Statements
(In thousands of U.S. dollars, except per share amounts and except where noted)
October 31, 2006, 2005 and 2004
22. Extraordinary Gain:
The extraordinary gain in 2004 reflects negative goodwill resulting from the finalization of acquisition contingencies related to the acquisition of the Atlantic/Jacuzzi assets in 2003.
23. Net interest expense and other:
2006 | 2005 | 2004 | ||||||||
| Interest on debt | $ | 2,523 | $ | 1,778 | $ | 1,520 | ||||
| Amortization of deferred finacing costs | 91 | 405 | 452 | |||||||
| Unrealized foreign exchange loss (gain) | 29 | (92 | ) | - | ||||||
| Other | (120 | ) | 277 | (668 | ) | |||||
Total interest expense and other | $ | 2,523 | $ | 2,368 | $ | 1,304 | ||||
24. Research and development:
In September 2003, the Company entered into an agreement to cooperate in the research and development, production and marketing of certain packaging systems. During 2005, the Company incurred $250 (2004 - $400) in related research costs. These costs were expensed in the determination of net income, as the viability of the project was not certain at the time. In 2006, the Company incurred additional development costs of $421. The Company has determined that these packaging systems now have economical viability and have been included in the Company’s 2007 sales and marketing plan. Therefore, the 2006 development costs have been treated as an intangible and included in intangibles and other assets (note 7) and will be amortized against the revenues achieved. As the products are successful marketed, the Company and its business partner would be jointly and severally liable to repay a research grant in the amount of $850 that was provided to them by a government agency, and which has been netted against the research and development costs expensed prior to 2006. The repayments of this grant would be calculated based on a percentage of revenues earned from the sale of the developed products and would be accrued at that time. The amount to be repaid is indexed to the Consumer Price Index in the U.S., and could increase up to 150% of the original amount.
POLYAIR INTER PACK INC.
Notes to Consolidated Financial Statements
(In thousands of U.S. dollars, except per share amounts and except where noted)
October 31, 2006, 2005 and 2004
25. Comparative figures:
The 2004 and 2005 Consolidated Financial Statements have been reclassified from statements previously presented to conform to the presentation of the 2006 Consolidated Financial Statements.
26. Subsequent events:
In November 2006, the Company sold its shares, representing a 50.1% interest, in PXL Cross Link Foam Corporation. The Company’s proportional interest in PXL was $461 at October 31, 2006, for which the Company was paid $878. In addition to the consideration received for the sale of its interest, PXL repaid intercompany loans totally $1.6 million.
| Net Assets Sold | ||
| Accounts receivable | 1,231 | |
| Inventory | 610 | |
| Capital assets | 2,874 | |
| Other assets | 140 | |
| Accounts payable and accrued liabilities | (1,395 | ) |
| Bank and other long term debt | (1,324 | ) |
| Loan from Polyair(net) | (965 | ) |
| Other liabilities | (252 | ) |
| 919 | ||
| 50.1% interest | 461 | |
| Consideration Received | 878 | |
In January 2007, the Company’s Plan of Arrangement, under the Companies’ Creditors Arrangement Act, for the Pool Division’s Canadian subsidiary was approved by the subsidiary’s creditors. Under this Plan, subsidiary liabilities of $8.8 million owing to unsecured third party creditors as at October 31, 2006 will be paid from the proceeds gained through the realization of subsidiary assets, net of any expenses incurred in order to maximize the realization of the assets. At October 31, 2006, these assets consisted of a $1.4 million mortgage receivable and a minor amount of trade receivables.
Exhibit 3.
Polyair Inter Pack Inc.
Fiscal year ended October 31, 2006
Management’s Discussion and Analysis
The following Management’s Discussion and Analysis (“MD&A”) provides an outline of Polyair Inter Pack’s business, its development strategy and how it measures performance. It contains a review of the 2006 financial results, identifies business risks that the Company faces and comments on the financial resources required for the development of the business. This report contains information that will enable a better understanding of the Company’s financial statements and should be read in conjunction with these documents. The Company’s unaudited, quarterly financial results for prior reporting periods can be accessed on SEDAR (www.sedar.com) and on EDGAR (www.sec.gov/edgar.shtml). The Company’s Annual Information Form for the year ended October 31, 2006, October 31, 2005 and October 31, 2004 can also be accessed on SEDAR (www.sedar.com).
In this document and in the Company’s financial statements, unless otherwise noted, all financial data is prepared in accordance with Canadian Generally Accepted Accounting Principles (GAAP). All amounts, unless specifically identified as otherwise, both in the financial statements and this MD&A are expressed in US dollars.
Management’s Discussion and Analysis contains forward-looking statements, including statements concerning possible or assumed future results of operations of the Company. Forward-looking statements typically involve words or phrases such as “believes”, “expects”, “anticipates”, “intends”, “foresees”, “estimates” or similar expressions. Forward-looking statements are based on current expectations of management and involve risks and uncertainties that could cause actual results to differ materially from future results expressed or implied by such forward-looking statements. The forward-looking statements contained herein are based on information available as of January24, 2007. Polyair Inter Pack Inc. expressly disclaims any obligation to publicly update or alter any forward-looking statements contained herein.
Corporate Overview and Business Strategy
Polyair Inter Pack Inc. (“Polyair” or the “Company”) is a well-established North American manufacturer and distributor of protective packaging products. Prior to 2006, the Company’s business also included the manufacture and distribution of swimming pool products to North American and European customers.
The Company’s packaging business was established in the early 1988 and has steadily grown both organically and through the acquisition of other packaging companies. The Company’s new product development has been in large part through joint ventures.
The Company’s pool business (“Pool Division”) predates its packaging business to 1972 when the Company started the manufacture of pool covers and other accessory products. In 2003, it acquired the assets of the above ground pool and pool equipment business from Jacuzzi Inc. and Jacuzzi Leisure Products Inc. In late 2003, the Company relocated the acquired pool equipment to a newly established production facility in Toronto. In early 2004, pool manufacturing was also consolidated into the new facility from its previous Toronto location (the “Humberline property”); the Humberline property was subsequently rented to the Company’s Packaging Division. The Company experienced start-up difficulties in early 2004 and poor weather during the peak sales months of the pool season resulted in lower sales. Both the Company and its customers were left with inventory that was carried into the 2005 season. Excess inventory in the supply chain, the stronger Canadian dollar and high prices of steel, a key raw material component, all contributed to lower sales and operating losses in fiscal 2005. In late 2005, the Company engaged an investment-banking firm to find a buyer for the Pool Division and after an extensive marketing program the Company narrowed the list to two prospective offers, both of which were subject to due diligence and financing. In April 2006, the Company, in consultation with its advisors, concluded that the sale of the Pool Division in its entirety was not feasible and it engaged a restructuring firm to operate the business through its peak season and solicit buyers for individual product units. The three business units (pool accessories, above ground pools and pool equipment) and the Humberline property were sold during 2006, and the proceeds were applied to reduce bank indebtedness and fund costs of winding down the Pool Division. All of the business unit sales involved the transfer of inventory, production equipment and intellectual property associated with the product units. In recognition of the Company’s early 2006 decision to sell its pool business, the Company has reported the results of this Division as a discontinued operation in its fiscal 2006 financial reporting.
The Company’s Canadian pool subsidiary, which had the majority of the debt owing to the Pool Division’s trade creditors, filed for protection under the Companies’ Creditors Arrangement Act in October 2006 and a proposal (“Plan of Arrangement”) to settle these claims was put forward. In January 2007, the Plan of Arrangement was approved and it calls for the settlement of third party creditors claims covered by the Plan of Arrangement, which totalled $8.8 million at October 31, 2006, from proceeds related to a mortgage receivable and the remaining accounts receivable which are collected.
As a result of the sale of the three Pool business units, the Company will not be making any sales to the swimming pool industry with the exception of solar covers and pool wall foam products. These products have historically been manufactured in the Company’s packaging plants and sold through the Pool Division. After the sale of the pool accessories unit, the Company continued to make and sell the solar covers and pool wall foam products directly to pool customers with the assistance of a sales representative agency.
In mid 2006, in its packaging business, the Company adapted a “Streamline Plan” with the principal objectives being to improve profitability and reduce bank debt. The components of this plan included a review of all of the Company’s packaging business units to determine which were core to its protective packaging business, and a focus on strategies and operational changes necessary to increase sales volumes and reduce plant operating and overhead costs.
With regard to its review of its packaging business units, the Company determined that its interests in cross-linked foam (operated through PXL Cross Linked Foam Corporation - “PXL”) and expanded polystyrene (operated through PSC Moulding Corporation- “PSC”) were not core to its business. In the fourth quarter of 2006, the Company began discussions with prospective purchasers of both businesses. In November 2006, the Company sold its 50.1% interest in PXL Cross Linked Foam Corporation, and applied the proceeds of this sale towards working capital. Discussions regarding the sale of PSC are still ongoing with a potential purchaser. In recognition of the Company’s decision to sell these business units both operations were reported as discontinued operations in the fourth quarter and year-end results of the Company.
To implement the other components of the Streamline Plan, the Company reorganized parts of its sales force in the second half of 2006 and increased efforts to reverse the sales volume erosion that the Company experienced in the early part of the year. To improve profitability, the Company reduced personnel and implemented a manufacturing process improvement program aimed at increasing its plant efficiencies and throughput capacities. In this regard, severance and other costs of $0.6 million were incurred.
After giving effect to the sale of the above mentioned business units, the Company will operate its protective packaging business from one Canadian plant and seven US plants. The seasonality of the Company’s sales and its working capital required are greatly diminished and most of the Company’s seasonal variation will come from the solar cover and wall foam business which has the period from February to July as its peak sales period.
With the rationalization of the Company’s business essentially complete and a significant reduction of bank debt effected the Company’s focus in coming years will be to increase its sales through organic growth and the expansion of its new developed Vision Foam-in-Place product line, and to increase the efficiency of its manufacturing operations.
Key Performance Indicators
Polyair measures its performance on a Company-wide basis through key financial indicators that includes the following: a minimum level of sales growth, a target for selling, general and administration expenses as a percentage of sales, earnings before taxes, earnings per share and certain working capital efficiency measures such as accounts receivables days outstanding and inventory turnover. These items are discussed in the appropriate sections under “2006 Operating Results”.
Market trends
Demand for protective packaging products in North America is expected to be driven by growing internet-based retail sales, and growing demand in specialized packaging requirements in the electronics and medical sectors. Increased activities in warehouse and distribution/fulfillment will also contribute to increasing demand for protective packaging. Many industries are seeking packaging solutions that reduce costs through reductions in labour requirements and costs associated with settling claims related to goods damaged during shipment, while improving productivity and efficiency. Products that offer these benefits include standard and converted bubble packaging and foam-in-place. However, inflatable bags will experience rapid growth due to its cost effectiveness, versatility and cleanliness, compared to loose fill and paper. Many of the products used in protective packaging applications are of commodity nature, and these product groups will continue to be very competitive, where above market growth rates will have to be in part driven by price competition.
Within these broader trends, the plastic protective packaging market in 2004-2006 was buffeted by rapid raw material and fuel cost escalations brought on by high oil and natural gas prices. Intense competition has meant that the Company has not always been able to increase its selling prices to offset these higher costs. Resin costs have declined over the last six months from their highs in January 2006, however selling prices continue to be volatile as competitors seek to use lower resin costs in order to gain market share.
The continued strength of the Canadian dollar has had a significant negative impact on Polyair over the last few years. The effect of the strengthened dollar was more pronounced on the Company’s Pool Division, since a greater portion of its manufacturing and other costs were in Canada, whereas a higher portion of its sales were in US dollars. With the sale of the Pool Division, PXL and possibly PSC, the effect of the stronger Canadian dollar has been substantially reduced.
2006 | 2005 | 2004 | ||||||||
| Selected annual information | Restated** | Restated** | ||||||||
| (In ‘000s of USD, except per share amounts) | ||||||||||
| Sales | $ | 112,977 | $ | 108,076 | $ | 96,458 | ||||
| Operating (Loss) / income from continuing operations* | (968 | ) | (1,341 | ) | (212 | ) | ||||
| Net (loss) / income from continuing operations* | (3,602 | ) | (2,389 | ) | (1,235 | ) | ||||
| Net (loss) / income from discontinued operations* | (19,905 | ) | (13,280 | ) | 230 | |||||
| Net (loss) / income before extraordinary gain | (23,507 | ) | (15,669 | ) | (1,005 | ) | ||||
| Extraordinary gain, net of tax | - | - | 948 | |||||||
| Net (loss) / income | (23,507 | ) | (15,669 | ) | (57 | ) | ||||
| Net (loss) / income per share from continuing operations | ||||||||||
| Basic | (0.53 | ) | (0.36 | ) | (0.20 | ) | ||||
| Diluted | (0.53 | ) | (0.36 | ) | (0.20 | ) | ||||
| Net (loss) / income per share from discontinued operations | ||||||||||
| Basic | (2.93 | ) | (1.99 | ) | 0.19 | |||||
| Diluted | (2.93 | ) | (1.99 | ) | 0.19 | |||||
| Net (loss) / income per share | ||||||||||
| Basic | (3.46 | ) | (2.35 | ) | (0.01 | ) | ||||
| Diluted | (3.46 | ) | (2.35 | ) | (0.01 | ) | ||||
| (LBITDA) / EBITDA* from continuing operations | 5,532 | 5,764 | 5,926 | |||||||
| Weighted average number of common shares outstanding | 6,797,250 | 6,673,370 | 6,130,264 | |||||||
| Total assets | $ | 73,269 | $ | 101,364 | $ | 121,485 | ||||
| Long term liabilities (including current portion) | 26,557 | 24,757 | 30,061 | |||||||
| Shareholders' equity | 1,018 | 23,713 | 37,457 |
* Operating (loss) or profit and (Loss) / Earnings before net Interest expenses and other, Taxes and Depreciation and Amortization (“LBITDA / EBITDA”), are not recognized measures under Canadian Generally Accepted Accounting Principles and readers are cautioned that Operating (loss) or profit and LBITDA / EBITDA should not be considered as alternatives to net income or loss or cash from operating activities as an indicators of the Company’s performance or cash flows. The Company’s method for calculating Operating (loss) / Profit and LBITDA / EBITDA may differ from other companies and may not be comparable to measures used by other companies. Operating profit/(loss) is net income or loss before extraordinary items, net interest expenses and other, non-controlling interest, and income taxes. LBITDA / EBITDA is net income or loss before extraordinary items, net interest expenses and other, depreciation and amortization, and income taxes.
** Restated due to a change in accounting policies. See section on recently issued accounting pronouncements and note 3(o) to the Company’s 2006 financial statements.
2006 Operating results
Sales from continuing operations
| (In ‘000s of USD ) | 2006 | % Increase | 2005 | % Increase | 2004 | |||||||||||
Packaging Division | $ | 112,977 | 4.5 | % | $ | 108,076 | 12.0 | % | $ | 96,458 |
Packaging product sales in 2006 increased by 4.5% compared to the prior period. The Company announced price increases in October and December 2005 and these increases, along with increases announced in fiscal 2005, reflected the increased cost of polyethylene resin as shown in the accompanying graph. Sales volumes in the early part of fiscal 2006 suffered as the Company lost sales in its effort to implement price increases. Sales volumes in the second half of the year returned to the same level as 2005 as the Company made increased efforts to recapture business. The strengthening of the Canadian dollar relative to the U.S. dollar contributed an additional $1.1 million to the increase in sales, as the Packaging Division realizes approximately 14.8% of its sales revenue in Canadian dollars.
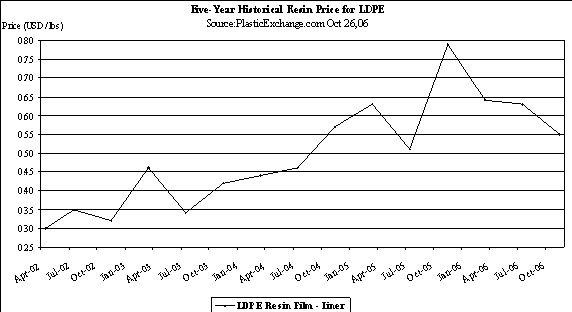
Bubble, foam and mailers are the Packaging Division’s core product lines. Sales of foam and mailers increased primarily due to higher average selling prices. However, volumes in the first quarter declined as the Company sought to maintain selling margins and experienced some erosion with its most price-sensitive customers. In the last two quarters however, the Company recaptured sales with these customers. Bubble revenues, in addition to having higher selling prices also experienced volume growth of 2% compared to the prior year. Sales of the Company’s construction products including Flexfoil, an insulation product, experienced revenue growth of 12% over 2005. Sales of Airspace film decreased by almost 25% as this product line’s sales lost ground in the face of new generations of field equipment launched by competing manufacturers. The Company has developed an improved Air Space machine and is continuing to develop new equipment to reverse its market erosion. VCI 2000, a vapour corrosion inhibitor film businesses, launched in late 2005, reported sales of $1.2 million in fiscal 2006.
Geographic distribution of revenues from continuing operations
| (In ‘000s of USD ) | 2006 | % of total Sales | 2005 | % of total Sales | 2004 | % of total Sales | |||||||||||||
United States | $ | 96,222 | 85 | % | $ | 91,994 | 85 | % | $ | 84,007 | 87 | % | |||||||
Canada | 16,755 | 15 | % | 16,082 | 15 | % | 12,451 | 13 | % | ||||||||||
Total | $ | 112,977 | 100 | % | $ | 108,076 | 100 | % | $ | 96,458 | 100 | % |
Packaging sales in the US in 2006 increased by $4.2 million or 4.6% compared to the prior year 2005. In Canada, sales increased by $0.7 million, as a result of a foreign exchange translation gain of $1.1 million offset by lower volumes.
Gross profit from continuing operations
| (In ‘000s of USD ) | 2006 | % Sales | 2005 | % Sales | 2004 | % Sales | |||||||||||||
Gross profit* | 15,366 | 13.6 | % | 15,525 | 14.4 | % | 15,219 | 15.8 | % | ||||||||||
Gross profit as a percentage of sales has dropped slightly in 2006, in large part due to high material costs in the first quarter of the year. The spike in resin prices in early 2006, brought on by the impact of hurricanes in the US gulf coast on petrochemical facilities there in the fall of 2005, reduced margins significantly until selling price increases took effect. Gross profit fell to a low of 7.7% in the first quarter of 2006 compared to 12.5% in the first quarter of 2005. Gross margins in the second half of 2006 were higher than those for the same period in 2005 and these gains helped offset the poor profitability of the first quarter. Resin prices have stabilized and unless there are new resin supply disruptions of the nature experienced in 2006, the Company expects that these improvements in margin will continue into fiscal 2007. Gross margins in 2006 were also reduced by higher freight costs of which approximately $1.0 million related to higher freight rates brought on by carrier fuel surcharges.
Selling, general and administrative expenses from continuing operations
| (In ‘000s of USD ) | 2006 | % Sales | 2005 | % Sales | 2004 | % Sales | |||||||||||||
Selling | $ | 9,342 | 8 | % | $ | 9,599 | 9 | % | $ | 10,355 | 11 | % | |||||||
General and administrative | 6,992 | 6 | % | 7,267 | 7 | % | 5,076 | 5 | % | ||||||||||
| $ | 16,334 | 14 | % | $ | 16,866 | 16 | % | $ | 15,431 | 16 | % |
Selling expenses in 2006, decreased in both absolute dollar amount and as a percentage of sales as a result of reductions in staff and targeted spending cuts in marketing expenses.
General and administration expenses have decreased in 2006 over 2005 due to reduction in personnel costs. This improvement was offset by severance costs of $0.3 million and the impact of the Canadian dollar, which increased the reported costs associated with the Canadian head office. Bank fees in 2006 increased due to covenant amendments and overdraft charges that were incurred during the year. Legal fees, particularly in the fourth quarter increased as the company incurred expenses associated with the winding-down and sales of the discontinued operations.
Product Development
In September 2003, the Company entered into an agreement to cooperate in the research and development, production and marketing of certain packaging systems. During 2005, the Company incurred $250,000 (2004 - $400,000) in related research costs. These costs were expensed in the determination of net income, as the viability of the project was not certain at the time. In 2006, the Company incurred additional development costs of $421,000. The Company has determined that these packaging systems now have economical viability and have been included in the Company’s 2007 sales and marketing plan. Therefore, the 2006 development costs have been treated as capital assets and will be amortized against the revenues achieved.
As the products are successful marketed, the Company and its business partner would be jointly and severally liable to repay a research grant in the amount of $850,000 that was provided to them by a government agency, and which has been netted against the research and development costs expensed prior to 2006. The repayments of this grant would be calculated based on a percentage of revenues earned from the sale of the developed products and would be accrued at that time. The amount to be repaid is indexed to the Consumer Price Index in the U.S., and could increase up to 150% of the original amount.
Net interest expenses and other, incomes taxes from continuing operations
| (In ‘000s of USD ) | 2006 | 2005 | 2004 | |||||||
Interest on debt | $ | 2,523 | $ | 1,778 | $ | 1,520 | ||||
Amortization of deferred finacing costs | 91 | 405 | 452 | |||||||
Unrealized foreign exchange loss (gain) | 29 | (92 | ) | - | ||||||
Other | (120 | ) | 277 | (668 | ) | |||||
Total interest expense and other | $ | 2,523 | $ | 2,368 | $ | 1,304 | ||||
Income taxes (recovery) | $ | 111 | $ | (1,320 | ) | $ | (281 | ) | ||
Interest costs in 2006, on a year over year basis increased by $0.7 million primarily as a result of higher interest rates, which on average were 280 basis points higher than in 2005. This increase was due to a combination of a higher prime rate in both Canada and the United States and an increase of 75 basis points in the risk premium charged by the Company’s lenders. The increase in interest rates was partially offset by a small reduction in average debt as the average debt carried by the Company under fixed and revolving terms decreased from $32.4 million in 2005 to $29.5 million in 2006.
Included in Net interest expense and other is the amortization of deferred financing costs. These financing costs are associated with the Company’s operating lending agreement, which was renewed in October 2005 for a three year term. These costs will be fully amortized at October 31st, 2008.
The Company is subject to income taxation in the US and Canada. As a result, the Company’s effective income tax rate fluctuates depending upon the geographic source of its earnings. The effective income tax recovery rate with respect to continuing operations in 2006 was negative 3.2% compared with a rate of 35.6% of net loss before income taxes in 2005. The negative rate in 2006 is primarily due to the fact that while a charge for taxes has been levied for profitable companies within the Polyair group of companies, with the Company’s recent history of both accounting and tax losses, there has been insufficient certainty about the ability to utilize tax losses in order to establish recoveries for all losses booked by those companies within the group incurring losses. During the year valuation allowances were increased by $4.3 million against certain tax losses carried forward and other future tax assets due to the uncertainty in being able to realize these loses prior to their expiry. Reconciliation between actual and statutory income tax rates for 2006 and 2005 can be found in note 15 to the Consolidated Financial Statements.
Net loss and loss per share from continuing operations
| (In ‘000s of USD ) | 2006 | 2005 Restated | 2004 Restated | |||||||
Net (loss) income available to common shareholders | $ | (3,602 | ) | $ | (2,389 | ) | $ | (1,235 | ) | |
Weighted average number of common shares outstanding | ||||||||||
Basic | 6,797,250 | 6,673,370 | 6,130,264 | |||||||
Diluted | 6,797,250 | 6,673,370 | 6,130,264 | |||||||
Net (loss) income per share | ||||||||||
Basic | $ | (0.53 | ) | $ | (0.36 | ) | $ | (0.20 | ) | |
Diluted | $ | (0.53 | ) | $ | (0.36 | ) | $ | (0.20 | ) | |
Net loss in 2006 was $3.6 million as compared to $2.4 million in 2005. The increases in loss compared to last year is mainly due to an increase in interest and financing related costs of $0.4 million and a $1.4 million unfavourable change in the net tax position. These increases were partially offset by a decrease in Selling General & Administration expenses by $0.5 million compared to 2005. Common shares outstanding increased in 2005 as a result of employees exercising stock options. In 2005, 348,900 options were exercised for net proceeds of $1.7 million.
Results from discontinued operations
Pool Division
Pool product sales decreased by $14.1 million to $64.8 million, or 18% over 2005. Product sales in the first quarter of 2006 were $4.0 million lower than the same period in 2005 due to lower purchases from the Division’s European customers who had a poor season in 2005. In the second quarter 2006, the Pool Division reported revenues that were comparable to those reported last year. In the third and forth quarters, the Pool Division reported revenues that were lower as the Company sold the pool accessories product unit in June and was in process of selling the remaining businesses.
The lower sales volume, coupled with discounts offered to move inventory and inventory write downs booked in the third quarter 2006 resulted in gross margins for the year of negative $1.6 million versus positive $3.7 million in 2005.
Selling expenses were $2.7 million lower in 2006 as a result of the sale of the Pool Accessories product line in the third quarter of 2006 and the termination of a significant portion of the sales force at that time. General and administrative expenses were higher by $9.2 million primarily due to $5.1 million of costs associated with the sale and wind down of the business, and increase of $0.6 million in the provision for doubtful accounts.
Additionally the results reflect a $1.9 million charge for the discounted cost of future lease payments in respect of the Pool Division’s head office, net of an estimate of income from sub-letting. The lease on this premise runs to November 2013.
In the fourth quarter, the Pool Division sold 330 Humberline Drive property for proceeds of $8.4 million, excluding selling expenses. Cash proceeds from the sale were used to repay bank indebtedness and the Company took back a mortgage from the purchaser for $1.4 million. Under the approved Plan of Arrangement this mortgage will be used to settle the claims of the unsecured creditors of the Canadian pool company. Upon the sale of the property the Company’s Packaging subsidiary entered into a ten-year lease on market terms. The amortized gain will be recorded in future periods under results from continuing operations on a straight line basis over the ten year term.
The Pool Division’s results include tax recoveries of $4.7 million associated with tax loss carry forwards which the Company will be able to utilize in the future through the filing of consolidated tax returns within the United States. Additionally the tax recovery gives recognition to the fact that due to the approval of the Creditors Plan of Arrangement, debts will be written down for tax purposes in the Division’s Canadian subsidiary providing for the partial utilization of tax loss carryforwards.
Other Discontinued Operations
Sales of the PSC division increased 28% over 2005 and sales of PXL, a joint venture that produces cross-linked polyethylene, reported sales that were 21% higher than 2005. The results for the PSC Division included a provision for bad debts of $0.6 million. Prior to the end of the year, the Company entered into negotiations for the sale of its PSC business. In anticipation of the consideration that would be received as the result of disposition, results from discontinued operations include a provision of $1.1 million in order to recognize the impairment in value of intangibles and property, plant and equipment associated with the PSC business.
Fourth Quarter Results for continuing operation:
In the fourth quarter of fiscal 2006 sales were $29.91 million compared to $28.96 million for the same period last year. Packaging sales in the fourth quarter of 2006 increased by 3.3% from the corresponding period of 2005 with price increases accounting for almost all of this increase. Product mix changed as the Company’s air space sales declined and were offset by higher sales of bubble, foam and flexfoil.
Gross margins in the fourth quarter of 2006 were 15.4% compared to 13.2% of sales in the fourth quarter of 2005. The increase in margin in the quarter is due to lower material costs and lower factory overhead costs.
Selling costs were lower than those reported in the fourth quarter of 2005 and General and administration costs came down due to lower personnel expenses.
Net Interest and other increased by $0.4 million from 2005 primarily due to higher prime rates and a 75 basis points addition in the risk premium charged by the Company’s lender.
Income tax expense in the fourth quarter of 2005 was $1.0 million, compared to an expected recovery of $0.2 million based on statutory tax rates. This was a result of an addition of $1.0 million increase to the valuation allowance to reflect the uncertainty of the Company having sufficient future taxable income to realize the value of various previous tax losses and other tax allowances.
Net loss in the quarter amounted to $1.5 million or ($0.22) per share on a fully diluted basis compared to $1.4 million in 2005 and ($0.20) per share on a fully diluted basis.
Summary of quarterly results for fiscal years 2006 and 2005
| (In 000's USD) | |||||||||||||||||||||||||
2006 | 2005 Restated * | ||||||||||||||||||||||||
| Q4 | Q3 | Q2 | Q1 | Q4 | Q3 | Q2 | Q1 | ||||||||||||||||||
Sales from continuing operations | 29,910 | 27,948 | 27,774 | 27,345 | 28,955 | 24,911 | 26,530 | 27,680 | |||||||||||||||||
Gain (loss) income before taxes and extraordinary gain from continuing operations | (546 | ) | 27 | (880 | ) | (2,092 | ) | (1,382 | ) | (1,385 | ) | (234 | ) | (708 | ) | ||||||||||
Net (loss) income from continuing operations | $ | (1,462 | ) | $ | (176 | ) | $ | (395 | ) | $ | (1,569 | ) | $ | (1,385 | ) | $ | (70 | ) | $ | (322 | ) | $ | (612 | ) | |
Net (loss) income from discontinuing operations | (6,897 | ) | (7,375 | ) | (1,904 | ) | (3,729 | ) | (6,978 | ) | (2,823 | ) | (1,279 | ) | (2,200 | ) | |||||||||
Net (loss) income | $ | (8,359 | ) | $ | (7,551 | ) | $ | (2,299 | ) | $ | (5,298 | ) | $ | (8,363 | ) | $ | (2,893 | ) | $ | (1,601 | ) | $ | (2,812 | ) | |
Net (loss) income per share from continuing operations | |||||||||||||||||||||||||
| Basic | $ | (0.22 | ) | $ | (0.03 | ) | $ | (0.06 | ) | $ | (0.22 | ) | $ | (0.20 | ) | $ | (0.01 | ) | $ | (0.05 | ) | $ | (0.10 | ) | |
| Diluted | $ | (0.22 | ) | $ | (0.03 | ) | $ | (0.06 | ) | $ | (0.22 | ) | $ | (0.20 | ) | $ | (0.01 | ) | $ | (0.05 | ) | $ | (0.10 | ) | |
Net (loss) income per share from discontinuing operations | |||||||||||||||||||||||||
| Basic | $ | (1.01 | ) | $ | (1.08 | ) | $ | (0.28 | ) | $ | (0.56 | ) | $ | (1.03 | ) | $ | (0.42 | ) | $ | (0.20 | ) | $ | (0.34 | ) | |
| Diluted | $ | (1.01 | ) | $ | (1.08 | ) | $ | (0.28 | ) | $ | (0.56 | ) | $ | (1.03 | ) | $ | (0.42 | ) | $ | (0.20 | ) | $ | (0.34 | ) | |
Net (loss) income per share | |||||||||||||||||||||||||
| Basic | $ | (1.23 | ) | $ | (1.11 | ) | $ | (0.34 | ) | $ | (0.78 | ) | $ | (1.23 | ) | $ | (0.43 | ) | $ | (0.25 | ) | $ | (0.44 | ) | |
| Diluted | $ | (1.23 | ) | $ | (1.11 | ) | $ | (0.34 | ) | $ | (0.78 | ) | $ | (1.23 | ) | $ | (0.43 | ) | $ | (0.25 | ) | $ | (0.44 | ) | |
| · | The reader is referred to the Company’s 2006 and 2005 annual and interim MD&A for a review of quarterly earnings. The 2006 and 2005 numbers have been reclassified from the numbers previously presented to segregate the loss from discontinued operations. |
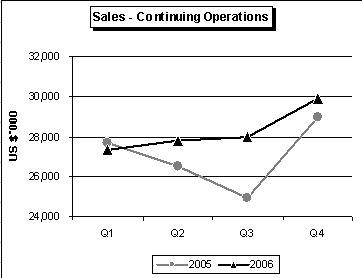
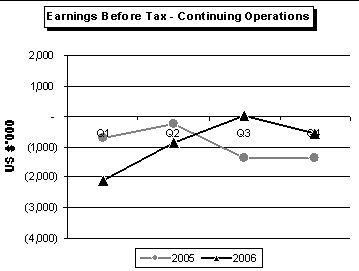
Sales of bubble and foam products in the fourth quarter of 2006 are up from the third quarter of the year and from the comparable quarter in 2005. This increase is mostly due to selling price increases with volumes remaining essentially flat. Higher bubble and foam sales helped offsett a decline in airspace sales which occurred throughout 2006. Mailer sales were flat on the year; an increase in third quarter sales was enough to offset declines in the other three quarters. The fourth quarter sales for Flexfoil, typically the strongest quarter for this products sales reflecting its seasonal demand, increased 16% over 2005 levels.
Quarterly gross profit was significantly lower in the first quarter of 2006 as a percentage of sales (7.7% versus 12.5% in 2005) due to the spike in resin prices and the lag time in implementing selling price increases. Gross margins improved over the balance of the year so that 2006 full year gross margin of 13.6% was only slightly below the 14.4% reported in 2005. Fourth quarter margins were 15.4% versus margins of 13.2% in the comparable 2005 period.
The Company made significant improvement in reaching operating profit by targeted actions to reduce expenses and staff. This was accomplished despite a negative impact of a
stronger Canadian dollar and certain one-time severance and other expenses of $0.9 million.
Related party transactions
The Company is party to certain agreements with companies that are related either by either common ownership or family relationship to a significant shareholder of the Company.
PSC paid management fees of Cdn $205,000 (U.S. $180,000) (2005 - U.S. $168,000) to a company of which a director and officer is the son of a director and significant shareholder of Polyair Inter Pack Inc. This transaction was measured at the amount agreed to by the parties. These fees are paid under a July 1999 agreement that the Company entered into when it acquired an interest in PSC this agreement runs to July 1, 2009.
During the third quarter 2006, following the evaluation of offers by several purchasers, the Company sold the Pool Accessories business of its Pool Division to a company of which a former officer is a non-controlling shareholder.
During 2006, the Company sold a property that had been subject to a Put/Call agreement with a company (the “Optionee”) affiliated to a director and significant shareholder of the Company. The Put/Call agreement was entered into in March 2004 and it allowed the Optionee the contractual right to purchase the property, subject to the standard conditions of obtaining free and clear title. It also included a transfer restriction clause wherein the Company agreed not to sell or otherwise dispose of the property without notice to the Optionee and without the purchaser of the property agreeing to the terms of the Put/Call agreement. In September 2004, the purchaser exercised the call on the property. However title to the property was not conveyed at that time, as the Company’s lenders, who had a security charge against the property, did not provide their consent and free and clear title could not be obtained by the Optionee.
In the fourth quarter of 2006 the Company signed an agreement for the sale of this property with an unrelated third party. The agreement provided for the sale of the property for Cdn $9.4 million (US $8.4 million) with a secured vendor take back second mortgage of Cdn $1.6 million (US $1.4 million) and the balance to be paid in cash. The Optionee agreed to give up its transfer restriction rights to the property under the Put/Call agreement and to consent to the sale of the property in return for a payment of Cdn $1.5 million (US $1.3 million). The terms of the proposed payment were reviewed by an independent committee of the Company’s Board of Directors, approved by the Company’s Board of Directors and was consented to by the Company’s lenders.
Liquidity and capital resources
Cash flows
(In '000s USD)
CASH FLOW | 2006 | 2005 | 2004 | |||||||
Cash flow from operations before changes in non cash operating working capital | ($18,398 | ) | ($6,535 | ) | $ | 6,860 | ||||
Changes in non-cash working capital | 29,707 | 11,369 | (4,450 | ) | ||||||
Cash flow from operations | 11,309 | 4,834 | 2,410 | |||||||
Net proceeds on the sale of capital assets | 7,174 | 51 | 616 | |||||||
Acquisitions of property, plant and equipment | (1,912 | ) | (5,734 | ) | (10,064 | ) | ||||
Available cash flow (deficit)* | $ | 16,571 | ($849 | ) | ($7,038 | ) | ||||
* Available cash flow (deficit) is not a recognized measure under Canadian Generally Accepted Accounting principles and the readers are cautioned that Available cash flow (deficit) should not be considered as an alternative to cash from operating activities as an indicator of the Company’s performance or cash flows. The Company’s method for calculating Available cash flows (deficits) may differ from other companies and may not be comparable to measures used by other companies. Available cash flow (deficit) is cash flow from operating activities less acquisitions of property, plant and equipment and intangible assets.
The Company’s cash flow from operations before changes in non-cash operating working capital was in a deficit position of $18.4 million primarily due to losses recorded by the Pool Division of $19.0 million. In addition to operational losses the total loss included, writedowns and losses on disposal of receivables, property plant and equipment and inventory of $4.3 million as well as professional fees incurred in the winding up of the business. Non cash working capital increased significantly due to the reduction of accounts receivables of $7.7 million resulting from the sale of the Pool Division. Inventories also came down due to the disposal of the Pool Division inventory of $15.5 million.
Changes in non cash working capital included a $2.7 million increase in trade payables and accruals of the Pool Division. Of the $13.7 million of trade payables and accruals owing by the Pool Division, $8.8 million involves creditor claims that will be settled under an approved Plan of Arrangement by the $1.4 million vendor take back mortgage and through the collection of the Canadian entity’s trade receivables, net of operating costs.
As previously discussed in October 2006 the Company, through its Pool Division, sold its 330 Humberline facility and recorded $5.6 million in cash receipts on this sale and $1.4 vendor take back second mortgage. The company had $1.9 million of capital expenditures of which $0.6 million was for the purchase of foam in place and airspace machines, and $0.4 million for packaging production equipment. At October 31, 2006 the Company had $0.09 million (2005 - $1.9 million), of construction in progress equipment that was being built for it or where installation had not been completed. The Company will need to spend $0.06 million in 2007 in order to bring these assets into productive use.
The Company had paid down operating debt of $11.7 million and repaid $4.8 million of term debt in 2006 compared with an increase of $2.0 million of operating debt and a term debt repayment of $6.1 million 2005 which included the retirement of Industrial Revenue bonds. The Company did not raise any long-term debt or equity in 2006. Comparably, in 2005, the Company raised $1.7 million from a fixed rate equipment loan that it took on in the first quarter of 2005 and issued $1.7 million of common stock as a result of the exercise of stock options.
Working capital
CAPITALIZATION and FUNDING | As at October 31, 2006 | As at October 31, 2005 | As at October 31, 2004 | |||||||
Amount drawn on operating credit facilities | $ | 9,503 | $ | 21,096 | $ | 18,673 | ||||
Remaining borrowing availability based on collateral values | 1,417 | 519 | 8,974 | |||||||
Net funded debt* | 25,865 | 42,133 | 43,880 | |||||||
Shareholders equity | 1,018 | 23,713 | 37,457 | |||||||
Net funded debt to shareholders equity | 25.4 | 1.8 | 1.2 | |||||||
Operating working capital (consolidated)** | (14,728 | ) | 3,530 | 19,612 | ||||||
Operating working capital (continuing operations)** | (6,948 | ) | 2,302 | 9,197 | ||||||
Operating working capital (discontinued operations)** | (7,780 | ) | 1,228 | 10,415 | ||||||
Accounts receivable days outstanding in continuing operations | 35 | 34 | 55 | |||||||
Inventory turnover in continuing operations | 8.8 | 6.2 | 3.9 | |||||||
Net increase (decrease) in long term debt | (4,452 | ) | (3,964 | ) | 4,586 | |||||
Issuance of common shares | $ | - | $ | 1,670 | $ | 1,631 |
Net increase( decrease) in long term debt does not tie to cash flow statement in financials
*Net funded debt is not a recognized measure under Canadian Generally Accepted Accounting Principles and readers are cautioned that Net funded debt should not be considered as an alternative to Long-term debt. The Company’s method for calculating Net funded debt may differ from other companies and may not be comparable to measures used by other companies. Net funded debt is comprised of bank indebtedness, current and long term portions of Long-term debt, and liability portions of the convertible note.
** Operating working capital is not a recognized measure under Canadian Generally Accepted Accounting Principles and readers are cautioned that Operating working capital should not be considered as an alternative to the term Working Capital. The Company’s method for calculating Operating working capital may differ from other companies and may not be comparable to measures used by other companies. Operating working capital is comprised of current assets net of current liabilities, excluding the current portion of long term debt, future income tax assets and future income tax liabilities)
Operating working capital, as defined above, was negative $14.7 million on October 31, 2006 compared with $3.5 million on October 31, 2005. The erosion of $18.2 million in operating working capital stemmed primarily from the Pool Division where operating working capital was reduced by $8.6 million. This was due to a $24.1 million reduction in current assets offset by a reduction of current liabilities of $15.5 million. The current asset reduction resulted from the writedown and reduction of accounts receivable associated with the winding down of the business and the sale of the inventory as part of the overall sale of the business. Proceeds from the reduction of current assets were used to pay down the secured bank financing.
Overall working capital was further eroded in the continuing packaging business as bank debt was used to fund capital expenditures and operating losses.
The Company renewed its banking agreement on October 31, 2005 for a three-year term. At that time the lenders temporarily suspended two debt service covenants and replaced them with a covenant that limits the Company’s pre-tax losses, tested on a quarterly basis. This covenant suspension and replacement took effect on October 31, 2005 and was to be in effect until October 31, 2006 after which the original covenants were to be reinstated, subject to current ongoing negotiations with the lenders. Under the covenants in effect to October 31, 2006, the Company was also required to maintain a certain level of tangible net worth and the lenders placed limitations on the Company’s capital expenditures. During the 2006 fiscal year the Company and its lenders agreed on several amendments to the covenants and other terms of its credit facilities. The Company lenders charged fees of $0.8 million for theses amendments. These amendments were required in order to accommodate losses incurred, to provide working capital and to allow divesture of the Pool Division. Following these amendments, the Company was in compliance with all debt covenants as at October 31, 2006.
Following the sale of the Pool Division assets, to reflect its reduced requirements the Company agreed with its lenders to reduce the operating line facility to $20 million which it believes is adequate for the Company’s needs for the balance of the term of the loan agreement. The lower loan facility amount will reduce the 0.5% standby fee that the Company was paying to less than $0.1 million per year. Borrowings under this facility fluctuate and the amount available to the Company is determined periodically based on eligible accounts receivable and inventory. The available borrowing limit based on collateral balances at October 31, 2006 was $14.6 million, of which the Company has used $3.1 million to support letters of credit and has drawn $9.5 million for operating cash. The Company posts letters of credit to support its payment obligations under the outstanding Industrial Revenue bond on its Youngstown, Ohio property and for other obligations such as rent.
In addition to its working capital requirements, Polyair will require funding to pay for capital expenditures and to service its debt obligations. In earlier years, a portion of this funding requirement has been provided by term bank debt and equipment loans that the Company assumed. At October 31, 2006, the Company had $15.4 million of term debt of which 25% is fixed rate debt. By comparison, in 2005 the Company assumed a $1.7 million fixed rate equipment loan and it repaid $6.1 million of bank and other term debt including $2 million of a 6.5% Industrial Revenue Bond. Until such time as the Company is confident it can raise term debt, it plans to finance its capital expenditures from its operating cash flow.
In order to provide sufficient funding for its operations the Company accepted an offer from an investment fund in September 2006 for it to provide a $5 million three year subordinated loan at an interest rate of 15% per annum. The term of the loan required the Company to issue 20% of the equity of its packaging subsidiaries as a transaction fee. The offer was subject to satisfactory documentation and if the Company did not complete the transaction by mid November it would pay a break fee of $79,000. Based on the sale of the Pool Division, PXL and the pending sale of PSC the Company has re-evaluated its capital requirements and has entered into negotiations with the investment fund to determine if can to borrow a reduced amount with a lower equity issue. These negotiations had not been concluded at the date hereof.
The Company is currently negotiating with its lenders its financing covenants for its 2007 fiscal year. The Company’s ongoing ability to meet its covenants will be dependent on an improvement in its profitability. At October 31, 2006, this improvement has not been clearly established and it is therefore possible that Company’s lenders may establish covenants that require an earnings level that the Company may subsequently not achieve. Under the terms of the Company’s lending agreements, violation of these financial covenants constitutes an event of default, which enables the lenders to demand repayment on the bank indebtedness, trigger cross defaults on the term loans thereby allowing the lenders to demand repayment of these loans, as well as take possession of the collateral security, as described in the Consolidated Financial Statements. There can be no assurance that the Company will realize the necessary improvement in profitability in order to meet the revised bank covenants or that the additional debt or equity financing will be available when required or that it can be secured on satisfactory terms.
The Company’s Consolidated Financial Statements have been prepared on the basis of accounting principles applicable to a going concern, which assumes that the Company will be able to meet its financial covenant tests and generate positive cash flows from operations. In order for this to be realized the Company is dependent upon the continued support of the Company’s lenders and creditors and increased profitability of the Company’s packaging business, which is sensitive to the volume and price of packaging products sold, freight costs, and the cost of resin (a significant raw material component in the packaging business). If these assumptions are not met, the Company may not be able to realize its assets and discharge its liabilities in the normal course of operations. If the going concern assumption is not appropriate for these Company’s Consolidated Financial Statements, adjustments would be necessary in the carrying value of assets and liabilities and the reported revenues and expenses.
Contractual Obligations
| (In 000's USD) | ||||||||||||||||
Payments due by Period: | ||||||||||||||||
Total | Less than 1 year | 1-3 years | 4-5 years | After 5 years | ||||||||||||
| Long term debt * | $ | 15,253 | $ | 3,839 | $ | 5,566 | $ | 3,069 | $ | 2,779 | ||||||
| Operating leases ** | 23,913 | 3,521 | 6,006 | 5,475 | 8,911 | |||||||||||
| Capital leases | 158 | 52 | 106 | - | - | |||||||||||
| Related party consulting fee | 481 | 180 | 301 | - | - | |||||||||||
| Interest | 3,614 | 1,075 | 1,590 | 755 | 194 | |||||||||||
Total contractual obligations | $ | 43,419 | $ | 8,667 | $ | 13,569 | $ | 9,299 | $ | 11,884 | ||||||
| * Based on scheduled repayments | ||||||||||||||||
| ** Includes $1.0 million per year to October 2013 in respect of a lease for a property used in a discontinued | ||||||||||||||||
| business. The Company is attempting to find a sub-tenant for this property. | ||||||||||||||||
Disclosure of outstanding Share Data
Polyair Inter Pack’s common shares are listed on the Toronto and American Stock Exchanges under the symbol PPK. As at October 31, 2006, there were 6,797,250 common shares issued and outstanding along with 119,800 stock options. Each vested stock option entitles the holder to purchase one common share. The Company also has a $5.0 million convertible note outstanding that can be converted at the option of the holder into 598,802 common shares. The Company may prepay this note or convert it into 598,802 Series A Preference shares at any time after March 31, 2006.
Disclosure and internal controls
Disclosure controls and procedures have the general objective of seeking to ensure that the Company’s Interim Chief Executive Officer and Director of Finance have access to all information that must be disclosed in the Company’s public reporting to provide accurate and complete information to all security holders. In 2005 the Company put in place controls and procedures to ensure that management is able to execute this responsibility. These controls and procedures were periodically reviewed in 2006.
The Company’s system of disclosure controls includes, but is not limited to, procedures in place to systematically identify matters warranting consideration of disclosure, and a verification process for individual financial and non financial metrics of information contained in annual and interim filings, including the Financial Statements, Management’s Discussion and Analysis, Annual Information Forms and other documents and external communications.
As required by CSA Multilateral Instrument 52-109, Certification of Disclosure in Issuers’ Annual and Interim Filings, an evaluation of the effectiveness and design and operation of the Company’s disclosure controls was made as of October 31, 2006. Based on that evaluation, the Interim Chief Executive Officer and Director of Finance have concluded that the design and operation of the system of disclosure controls and procedures was effective as of October 31, 2006.
The Company will continue to monitor the system of discloser controls and procedures and enhance them as necessary.
As a result of the discontinuation of the pool business, there was a high degree of turnover of finance personnel within the Company’s pool division, resulting in a change of internal control processes within the finance area. In order to ensure continuity of an adequate level of internal control within the Pool Division finance area, the Company’s corporate finance group significantly increased its oversight of Pool Division financial operations. Additionally the Company had engaged advisors in its Pool Division to manage the sale process and to oversee day-to-day operations. These advisors monitored cash disbursements, cash receipts and the movement of the Company’s assets thereby providing additional oversight. On this basis, the Company’s Interim Chief Executive Officer, and the Director of Finance have certified that they have designed internal and other compensating controls over financial reporting to provide reasonable assurance regarding the reliability of financial reporting.
Financial Instruments
In prior years, the Company employed financial instruments and currency hedging techniques in managing the cash flow impact of its exposure to exchange rate fluctuations, primarily through the use of future contracts. The Company’s general strategy was to hedge a portion of its net currency exposures, and only to the extent such exposures can be forecast with reasonable certainty. The Company does not undertake hedging activities for speculative purposes. In 2006, the Company did not enter into any futures contracts.
Critical accounting estimates
The preparation of financial statements in conformity with Canadian GAAP requires management to make estimates and assumptions that affect the reported amounts of assets, liabilities, revenues and expenses, and the disclosure of contingent assets and liabilities. Estimates and assumptions are evaluated on an ongoing basis and are based on historical and other factors believed to be reasonable under the circumstances. The results of these estimates may form the basis of the carrying value of certain assets and liabilities and may not be readily apparent from other sources. Actual results, under conditions and circumstances different from those assumed, may differ from estimates.
The Company believes the following accounting estimates used in the preparation of its consolidated financial statements include significant judgement and are critical to the understanding of results of operations:
Allowance for Doubtful Accounts
The Company maintains accounts receivable allowances for estimated losses resulting from the inability of its customers to make payments. It performs periodic credit evaluations of its customers and, it generally does not require collateral or credit insurance. In developing its allowance for doubtful accounts, the Company performs a specific reserve analysis of all large accounts with past due balances. The Company also maintains a general reserve for smaller accounts that are delinquent. The Company writes-off accounts when it has exhausted collection efforts, and recovery of amounts owed is unlikely. Such write-offs are charged against the allowance for doubtful accounts, if the account was previously provided for or to the Statement of Income if provision was not made or was insufficient. In 2006, write-offs for delinquent accounts for the Packaging Division were negligible.
Due to the discontinuation of the Pool business, the Company had difficulty in collecting its accounts receivable for that business due to customer concerns over warranty service and payment of various rebates. The Company and its advisors entered into negotiations with most of these customers and these negotiations are ongoing. The allowance for doubtful accounts set for the Pool Division as at the end of its fiscal year was based on cash received subsequent to the end of the year and on an assessment of future cash that will be collected based on current negotiations.
Valuation of obsolete inventory
In the Packaging Division the majority of products are manufactured against orders and inventory on hand is primarily raw materials or finished goods that are awaiting shipment or customer release. A provision for obsolete inventory is established in this division based on materials on hand that are in excess of current usage or where changes in the customer or product mix makes the inventory less saleable.
In the Pool Division a valuation for the fair market value of the remaining amounts of miscellaneous inventory has been established based on liquidation value.
In evaluating the adequacy of the Company’s provision for inventory obsolescence, a number of factors are considered including level of inventory in relationship to historical and forecasted sales, changes in customer preferences and new product offerings. The Company’s provision for inventory obsolescence may require adjustment as any of the above mentioned factors change.
Future Income taxes
The Company follows the assets and liability method of accounting for income taxes. Under this method, future income tax assets and liabilities reflect the net tax effects of temporary differences between the carrying amounts of assets and liabilities for financial reporting purposes and the amounts employed for income tax purposes and the benefit of losses to be carried forward to future years for income tax purposes. Future tax assets and liabilities are measured using enacted or substantively enacted tax rates expected to apply to taxable income in the years in which those temporary differences are expected to be recovered or settled. The effect on future tax assets and liabilities of a change in tax rates is recognized in income in the year that the rate changes.
Valuation allowances are established to the extent that it is more likely than not that the Company will realize the benefits of the established future income tax assets, net of the valuation allowances. The determination of the appropriate level of valuation allowances is based in part of an estimate of future taxable income. The appropriate amount of valuation allowances may require adjustment to the extent that these estimates change.
Environmental obligations
The Company’s operations are subject to numerous environmental laws, regulations and guidelines adopted by various governmental authorities in the jurisdictions in which the Company operates. Liabilities are recorded when known or considered probable and can be reasonably estimated. The Company provides for environmental liabilities using best estimates. Actual environmental liabilities could differ significantly from these estimates. As part of the acquisition of the Atlantic / Jacuzzi assets in 2003, the Company acquired a property with industrial contamination. In 2006 this property was sold to a third party as part of a sale-leaseback transaction. As part of the sales agreement, the third party assumed any costs for environmental liabilities related to this property.
Recently issued accounting pronouncements
Effective December 1, 2005, the Canadian Institute of Chartered Accountants' Emerging Issues Committee withdrew EIC 71 which the company had followed in accounting for the Convertible note. The Company’s 2006 financial statement reflects this change in accounting policy and it has restated the prior year comparative results to also reflect this change. These changes are detailed in Note 11 of the financial statements.
There were not other new accounting pronouncements issued in 2006 that impacted the preparation of the Consolidated financial statements
Risks and uncertainties
Polyair Inter Pack’s business is subject to a number of broad risks and uncertainties including general economic conditions, competition, product liability and Canadian and US government policies and regulations regarding environmental, health, transportation and safety. In addition to these broad business risks the Company has specific risks that it faces, the most significant of these risks are detailed below.
Sufficient capital resources and liquidity - Due to operating losses incurred, primarily in the Pool Division, the Company’s working capital position has deteriorated as it has used its bank facility to partially finance operating losses, capital expenditures and long term debt repayments. The Company is currently negotiating new covenants with its lenders to reflect the Company’s exit from the pool business and the fact that the previous covenants expired October 31, 2006. The Company’s ongoing ability to meet covenants that are established will be dependent on an improvement in its profitability. Although the Company is taking measures to improve both production and administrative productivity there is no assurance that the Company will be successful in reducing costs sufficiently to satisfy newly established covenants and to generate the operating cash flows necessary to fund working capital, buy raw materials and fund necessary capital improvements.
Commodity prices and availability - The Company uses various commodity raw materials in manufacturing its products. Generally, the Company acquires such components at market prices and does not use financial instruments to hedge commodity prices. As a result, the Company is exposed to market risk related to changes in commodity prices related to these components. In addition since the Company sources these materials primarily from North American sources it is vulnerable to supply disruptions. The Company mitigates this risk by maintaining strong relationships with its key suppliers, by maintaining buffer inventories and it has occasionally entered into short terms supply contracts to ensure continued supply. It has also sought to pass on increased costs of raw materials by increasing its selling prices.
New Products - Part of the Company’s future success will be based on the successful launch of new packaging systems in 2007. There can be no assurance that these products will gain the expected market acceptance or that the product launch will not be impeded by competitor actions.
Maturing Contracts - Facility leases at the Company’s New Jersey and Chicago plants are due for renewal during fiscal 2006. While the Company expects to be able to renew these leases in the normal course however failure to renew both leases could have an impact on sales and profitability.
Freight Costs - A significant portion of the Company’s gross margin is eroded by the cost of shipping products to the Company’s customers. This cost has steadily increased in recent years, both in absolute terms and as a percentage of the Company’s sales, as the price of fuel has risen and freight vendors have passed on their cost increase in the form of fuel surcharges. Although these increases also impact the Company’s competitors, the Company’s larger competitors with more production facilities closer to their customer base will not be as adversely impacted. There is therefore no certainty that the Company’s will be able to pass on the increased cost of distribution through price increases.
Foreign exchange risk - The Company’s earnings are impacted by a strengthening Canadian dollar as the Company has a higher percentage of it costs denominated in Canadian dollars than it has sales in Canadian dollars, due to its Canadian head office being in Canada and the fact that it is a net exporter into the US.
Credit risk - The Company attempts to mitigate its credit risk through the establishment of credit limits and monitoring the creditworthiness of its customers. It also seeks to maintain diversity in its customers and in fiscal 2006 no one customer accounted for more than 10% of consolidated sales.
Joint venture partner - In the Packaging Division, the Company depends on a joint venture partner for the production of specialized equipment and for new product development. The Company has advanced the partner a total of $260,000 for the supply of equipment, and other amounts to fund development costs that it has incurred in a joint research and development project. Failure of this supplier could result in delays in introducing new technology and put in jeopardy the development of a new product.
Environmental Regulation - The Company is subject to a wide range of environmental laws and regulations in Canada and the United States pertaining to the discharge of materials into the environment, the handling and disposition of wastes and otherwise relating to protection of the environment. The operations of the Company that are most impacted by environmental regulation are foam extrusion which is produced in two locations in the US. Emissions produced in the process are regulated and the Company has installed equipment to reduce emissions. It also monitors its emission production to ensure that it meets the federal, state and provincial guidelines.
In 2003, the Company purchased the pool and pool product assets from Jacuzzi Leisure Products Ltd. and Jacuzzi Inc., which contained industrial contamination. This property was sold to a third party in 2006 through a sale-leaseback transaction. Under the terms of the sale, the Company is no longer responsible for environmental liabilities associated with this original contamination. All other facilities are in compliance with regulatory standards. However, there can be no assurance that changes in environmental laws and regulations, or their application, will not require further expenditures by the Company.
Product Liability - The Company has been named from time to time as a defendant in claims arising from pool-related injuries. In each case, which has been resolved, the Company has either prevailed (on the merits or by dismissal) or secured settlement well within insurance coverage limits. The Company believes its products are safe and contain proper use warnings, but avoidance of litigation cannot be assured.
Subsequent event
In November 2006, the Company sold its shares, representing a 50.1% interest, in PXL Cross Linked Foam Corporation. The Company’s proportional interest in PXL was $461,000 at October 31, 2006, for which the Company was paid consideration of $878,000. In addition to the consideration received for the sale of its interest, PXL repaid intercompany loans totally $1.6 million.
On January 18th, 2007, the Company’s Canadian pool subsidiary’s that has been under protection under the Companies’ Creditors Arrangement Act, received approval for its Plan of Arrangement which provides for the settlement of $8.8 million of claims by the allocation of a $1.4 million vendor take back note and from net proceeds resulting from the collection of remaining accounts receivable in the Canadian pool subsidiary.