UNITED STATES
SECURITIES AND EXCHANGE COMMISSION
Washington, D.C. 20549
FORM N-CSR
CERTIFIED SHAREHOLDER REPORT OF REGISTERED
MANAGEMENT INVESTMENT COMPANIES
Investment Company Act file number 811-08509
Buffalo Small Cap Fund, Inc.
(Exact name of registrant as specified in charter)
5420 West 61st Place
Shawnee Mission, KS 66205
(Address of principal executive offices) (Zip code)
Kent W. Gasaway
5420 West 61st Place
Shawnee Mission, KS 66205
(Name and address of agent for service)
(913) 384-1513
Registrant's telephone number, including area code
Date of fiscal year end: March 31, 2005
Date of reporting period: September 30, 2004
Item 1. Report to Stockholders.
| MESSAGE |
| To Our Shareholders |
I am very proud to announce the Buffalo Funds reached several important milestones during the past six months. The Buffalo Balanced Fund celebrated its ten year anniversary in August. Three additional Buffalo Funds (High Yield, Large Cap and USA Global) will reach the ten year point in 2005. Also, the Buffalo Funds group hit $2.5 billion in total assets for the first time in September. Finally, we launched our eighth fund, Buffalo Micro Cap, in May. I have never been more proud of our research and management team, who continue to generate high quality and timely investment ideas that are consistent with our long-term trend based approach. These individuals are proof that hard work and attention to detail does make a difference in our industry. The Buffalo Funds’ investment team will visit with nearly 500 companies and write over 100 in-depth, new idea research reports in calendar year 2004. We continue our search for additional talented and experienced investment professionals. We could not be more pleased with the team orientation, work ethic and results of our recent hires. The Buffalo Funds have a proud history of making decisions that are in the best interests of shareholders. The Funds’ board and investment manager made certain decisions over the past six months that continue in this tradition. First, investment into our newest fund, Buffalo Micro Cap, was limited to direct purchases only (no broker/dealers). The Fund’s managers felt initial heavy inflows that might come through these institutions would not be in shareholders’ best interest. Next, the Buffalo High Yield Fund was closed to new purchases through broker/dealers. Given heavy cash inflows and a lack of corporate bonds to buy offering “high” yields to compensate for the level of risk, it was decided to close the Fund on a temporary basis. Finally, the decision was made to add short term redemption fees to all the Buffalo Funds (for new purchases after January 1, 2005) to discourage purchases by market timers. |
Sincerely, | |
Past performance does not guarantee future results. Mutual fund investing involves risk; loss of principle is possible. Please see the following Semi-Annual Report for the Funds’ holdings information.
| 2 | |
The last six months proved to be a soft period for the equity markets generally speaking, and our Funds were not able to entirely avoid the recent back-step. After stocks managed to post impressive gains for the prior twelve months ending in March of 2004 (the S&P 500 Index was up over 35% during that twelve month period), the equity markets lost some headway, especially over the last quarter with most major indices posting quarterly losses. This pull back is to be expected, as much of the early run up in stocks was in anticipation of positive earnings growth due to an improving economic climate. Much of that early economically driven earnings bounce is behind us, and now equity markets are trying to discern and understand the trajectories of future corporate earnings. We have thought for some time that the current market conditions are very similar to what we experienced in 1994/1995. During 1994, the Fed was raising interest rates to slow the economy down. This resulted in a difficult bond market as well as flat stock market. In 1995, once the market sensed that the Fed was done raising rates and had slowed the economy to a reasonable, non-inflationary pace, the stock market began to move upward. Today, we think we are in the same kind of mode, although we do not believe that the Fed is going to have to be as aggressive as it was in 1994. There are also some major differences between today’s market and the 1994/1995 period. Specifically, we have the ongoing threat of terrorism that we believe will place more of a risk premium on this market than we have experienced in the past. But by and large, we feel that the economy in general is sound and that the stock market is poised to move upward in the near term. We have been generally pleased with the earnings of the companies in the Funds. We believe as the markets come through this period of vacillation and indecision, stock prices should again reflect underlying corporate fundamentals, which are quite healthy. |
Buffalo Mid Cap Fund was down 7.72% over the last six months. The Fund’s benchmark, the S&P Midcap 400 Index, was off 1.15% over the same period. The underperformance over this relatively short period can be traced to our heavier allocation in technology stocks. In particular, technology stocks performed poorly in August. Additionally, the Fund is underweighted in the energy sector — a sector that performed strongly during the quarter. Several stocks were standout performers: Garmin (2.32% of Fund assets), a manufacturer of navigation equipment that uses the global positioning system. Garmin is well positioned to benefit from the growing popularity and usefulness of wireless applications and the increasing portability of technology products. Elan (2.91% of Fund assets) and Pharmaceutical Product Development (2.45% of Fund assets), both in the healthcare sector, also did well. |
| 3 | |
| MESSAGE |
| To Our Shareholders (Continued) |
Buffalo USA Global Fund was down 3.67% during the prior six months. The Fund’s benchmark, the S&P 500 Index, was off 0.18% over the same period. While recent performance has been weak, the Fund has been a particularly strong performer versus its benchmark over the past five years. Although we had reduced the exposure to technology stocks in this Fund relative to its historical composition, the Fund still is over weighted in this sector relative to the S&P 500 Index, which was the primary driver of relative performance over the preceding six months. We added some new holdings to the Fund, |
Buffalo Science & Technology Fund was down 5.16% over the last six months. The Fund’s benchmark, the Lipper Science & Technology Funds Index, was off 11.02% over the same period. There was a high level of activity in our management of the Fund during the period. For most of 2004, we positioned the Fund to have a larger exposure to healthcare stocks and a smaller allocation to technology stocks. This allocation decision, which was made in late 2003, was driven by our belief that healthcare stocks were more cheaply valued than technology stocks. This allocation has helped the Fund outperform its benchmark over the past one year. As technology stocks performed poorly through August, we began to find better bargains in the tech sector versus the healthcare sector. We bought technology stocks extensively during the quarter (and prudently trimmed some of our healthcare winners). |
| 4 | |
Buffalo Balanced Fund continues to be a strong performer, posting a positive return of 4.56% over the prior six months versus the Fund’s benchmark (Lipper Balanced Funds Index) which posted gains of only 0.05% over the same period. Energy sector holdings were the primary driver of performance including ConocoPhillips (2.99% of Fund assets), ChevronTexaco (2.15% of Fund assets) and Kerr-McGee (2.07% of Fund assets). We are keeping the bond/equity mix at approximately 50%/50%, with most stocks paying dividends in the 2-3% range. |
Thank you for your investments and confidence in the Buffalo Funds. Sincerely, | ||
 |  | ||
| John C. Kornitzer President | Kent W. Gasaway Sr. Vice President | ||
 |  | ||
| Robert Male Sr. Vice President | Grant B. Sarris Sr. Vice President | ||
 |  | ||
| William J. Kornitzer III Sr. Vice President | Jonathan C. Angrist Sr. Vice President | ||
| 5 | |
| INVESTMENT RESULTS |
| Total Returns as of September 30, 2004 | ||||||||||
| AVERAGE ANNUAL | ||||||||||
| SIX MONTHS | ONE YEAR | FIVE YEARS | TEN YEARS | SINCE INCEPTION | ||||||
| Buffalo Balanced Fund | ||||||||||
| (inception date 8/12/94) | 4.56% | 17.32% | 5.70% | 7.47% | 7.34% | |||||
| S&P 500 Index | -0.18% | 13.87% | -1.31% | 11.08% | 10.99% | |||||
| S&P 500 Index & Merrill Lynch U.S. Domestic | ||||||||||
| Master Index Weighted Average* | 0.16% | 9.78% | 2.21% | 9.72% | 9.60% | |||||
| Lipper Balanced Funds Index | 0.05% | 10.58% | 3.09% | 8.64% | 8.55% | |||||
| Buffalo High Yield Fund | ||||||||||
| (inception date 5/19/95) | 2.10% | 8.38% | 8.60% | N/A | 8.82% | |||||
| Merrill Lynch High Yield Master Index | 3.72% | 12.23% | 6.61% | N/A | 7.35% | |||||
| Lipper High Yield Bond Funds Index | 3.45% | 11.62% | 3.57% | N/A | 5.58% | |||||
| Buffalo Large Cap Fund | ||||||||||
| (inception date 5/19/95) | -4.98% | 4.87% | 1.63% | N/A | 10.03% | |||||
| S&P 500 Index | -0.18% | 13.87% | -1.31% | N/A | 10.30% | |||||
| Lipper Large-Cap Core Funds Index | -1.18% | 10.66% | -1.68% | N/A | 8.76% | |||||
| Lipper Capital Appreciation Funds Index | -2.12% | 11.97% | -1.50% | N/A | 7.77% | |||||
| Buffalo Micro Cap Fund | ||||||||||
| (inception date 5/21/04) | N/A | N/A | N/A | N/A | -3.60%** | |||||
| Russell 2000 Index | N/A | N/A | N/A | N/A | 5.42%** | |||||
| Buffalo Mid Cap Fund | ||||||||||
| (inception date 12/17/01) | -7.72% | 15.98% | N/A | N/A | 5.05% | |||||
| S&P Midcap 400 Index | -1.15% | 17.55% | N/A | N/A | 7.79% | |||||
| Russell Midcap Index | 0.60% | 20.55% | N/A | N/A | 9.08% | |||||
| Lipper Mid-Cap Core Funds Index | -1.10% | 16.76% | N/A | N/A | 6.54% | |||||
| Buffalo Science & Technology Fund | ||||||||||
| (inception date 4/16/01) | -5.16% | 18.57% | N/A | N/A | 1.34% | |||||
| S&P 500 Index | -0.18% | 13.87% | N/A | N/A | 0.00% | |||||
| Lipper Science & Technology Funds Index | -11.02% | 0.96% | N/A | N/A | -9.36% | |||||
| 6 | |
| AVERAGE ANNUAL | ||||||||||
| SIX MONTHS | ONE YEAR | FIVE YEARS | TEN YEARS | SINCE INCEPTION | ||||||
| Buffalo Small Cap Fund | ||||||||||
| (inception date 4/14/98) | -3.32% | 25.50% | 21.29% | N/A | 17.76% | |||||
| S&P Smallcap 600 Index | 2.18% | 24.58% | 11.49% | N/A | 6.63% | |||||
| Russell 2000 Index | -2.40% | 18.77% | 7.41% | N/A | 3.95% | |||||
| Lipper Small-Cap Core Funds Index | 0.11% | 21.99% | 10.50% | N/A | 5.72% | |||||
| Buffalo USA Global Fund | ||||||||||
| (inception date 5/19/95) | -3.67% | 13.49% | 3.71% | N/A | 11.02% | |||||
| S&P 500 Index | -0.18% | 13.87% | -1.31% | N/A | 10.30% | |||||
| Lipper Capital Appreciation Funds Index | -2.12% | 11.97% | -1.50% | N/A | 7.77% | |||||
| Lipper Global Funds Index | -1.71% | 16.49% | 0.79% | N/A | 7.04% | |||||
| * | The performance figure shown for comparison purposes is a weighted average made up of 60% of the S&P 500 Index and 40% of the Merrill Lynch U.S. Domestic Master Index. |
| ** | Cumulative since inception date of 5/21/04. |
Performance data quoted represents past performance; past performance does not guarantee future results. The investment return and principal value of an investment will fluctuate so that an investor’s shares, when redeemed, may be worth more or less than their original cost. Current performance of the Fund may be lower or higher than the performance quoted. Performance data current to the most recent month end may be obtained by visiting www.buffalofunds.com. | |
The Buffalo High Yield and Micro Cap Funds impose a 2.00% redemption fee on shares held for less than 180 days. | |
Short-term performance, in particular, is not a good indication of the Fund’s future performance, and an investment should not be made based solely on returns. | |
The Fund returns shown do not reflect the deduction of taxes that a shareholder would pay on Fund distributions or the redemption of Fund shares. The benchmark returns shown, excluding the Lipper Indices, reflect the reinvestment of dividends and capital gains but do not reflect the deduction of any investment management fees, other expenses or taxes. The performance of the Lipper Indices is presented net of the funds’ fees and expenses, however applicable sales charges are not taken into consideration. One cannot invest directly in an index. | |
The S&P 500 Index is a capitalization weighted index of 500 large capitalization stocks which is designed to measure broad domestic securities markets. The Merrill Lynch U.S. Domestic Master Index is a capitalization weighted aggregation of outstanding U.S. treasury, agency and supranational, mortgage pass-through and investment grade corporate bonds meeting specified criteria. The Lipper Balanced Funds Index is an unmanaged, net asset value weighted index of the 30 largest balanced mutual funds. The Merrill Lynch High Yield Master Index is an unmanaged index comprised of over 1,200 high yield bonds representative of high yield bond markets as a whole. The Lipper High Yield Bond Funds Index is a widely recognized index of the 30 largest mutual funds that invest primarily in high yield bonds. The Lipper Large-Cap Core Funds Index is an unmanaged, equally weighted performance index of the 30 largest qualifying mutual funds (based on net assets) in the Lipper Large-Cap classific ation. The Lipper Capital Appreciation Funds Index is an equally weighted performance index of the 30 largest qualifying funds in the investment objective. The Russell 2000 Index consists of the smallest 2,000 securities in the Russell 3000 Index, representing approximately 10% of the Russell 3000 total market capitalization. The S&P Midcap 400 Index consists of 400 domestic stocks chosen for market size, liquidity and industry group representation. It is a market-weighted index with each stock affecting the index in proportion to its market value. The Russell Midcap Index measures the performance of the 800 smallest companies in the Russell 1000 Index, which represent approximately 26% of the total market capitalization of the Russell 1000 Index. The index has a total market range of approximately $1.3 billion to $10.8 billion. The Lipper Mid-Cap Core Funds Index is an unmanaged, equally weighted performance index of the 30 largest qualifying mutual funds (based on net assets) in the Lipper Mid-Cap clas sification. The Lipper Science & Technology Funds Index is an unmanaged, equally weighted performance index of the 30 largest qualifying mutual funds (based on net assets) in the Lipper Science and Technology classification. The S&P Smallcap 600 Index consists of 600 domestic stocks chosen for market size, liquidity, bid-asked spread, ownership, share turnover and number of no-trade days and industry group representation. The Lipper Small-Cap Core Funds Index is an unmanaged, equally weighted performance index of the 30 largest qualifying mutual funds (based on net assets) in the Lipper Small-Cap classification. The Lipper Global Funds Index is an equally weighted performance index of the 30 largest qualifying funds in the investment objective (to invest at least 25% of its portfolio in securities traded outside of the United States). | |
References to specific securities should not be construed as recommendations by the Funds or their Advisor. Please refer to the schedule of investments in the report for Fund holdings information. | |
Please refer to the prospectus for special risks associated with investing in the Buffalo Funds, including, but not limited to, risks involved with investments in science and technology, foreign, lower- or non-rated securities and smaller companies. | |
Must be preceded or accompanied by a current prospectus. | |
| Quasar Distributors, LLC, distributor. 11/04 |
| 7 | |
| EXPENSE EXAMPLE |
ACTUAL EXPENSES The first line of the tables below provides information about actual account values and actual expenses. Although the Funds charge no sales load or transaction fees, you will be assessed fees for outgoing wire transfers, returned checks and stop payment orders at prevailing rates charged by U.S. Bancorp Fund Services, LLC, the Funds’ transfer agent. If you request that a redemption be made by wire transfer, currently a $15.00 fee is charged by the Funds’ transfer agent. You will be charged a redemption fee equal to 2.00% of the net amount of the redemption if you redeem your shares of the Buffalo High Yield and Micro Cap Funds within 180 days of purchase. To the extent the Funds invest in shares of other investment companies as part of its investment strategy, you will indirectly bear your proportionate share of any fees and expenses charged by the underlying funds in which the Funds invest in addition to the expenses of the Funds. Actual expenses of the underlying funds are expected to vary among the various underlying funds. These expenses are not included in the example below. The example below includes management fees, registration fees and other expenses. However, the example below does not include portfolio trading commissions and related expenses and other extraordinary expenses as determined under generally accepted accounting principles. You may use the information in this line, together with the amount you invested, to estimate the expenses that you paid over the period. Simply divide your account value by $1,000 (for example, an $8,600 account value divided by $1,000 = 8.6), then multiply the result by the number in the first line under the heading entitled “Expenses Paid During Period’’ to estimate the expenses you paid on your account during this period. |
The second line of the tables below provides information about hypothetical account values and hypothetical expenses based on the Funds’ actual expense ratios and an assumed rate of return of 5% per year before expenses, which are not the Funds’ actual returns. The hypothetical account values and expenses may not be used to estimate the actual ending account balance or expenses you paid for the period. You may use this information to compare the ongoing costs of investing in the Funds and other funds. To do so, compare this 5% hypothetical example with the 5% hypothetical examples that appear in the shareholder reports of the other funds. Please note that the expenses shown in the table are meant to highlight your ongoing costs only and do not reflect any transactional costs, such as sales charges (loads), redemption fees, or exchange fees. Therefore, the second line of the table is useful in comparing ongoing costs only, and will not help you determine the relative total costs of owning different funds. In addition, if these transactional costs were included, your costs would have been higher. |
| BUFFALO BALANCED FUND | ||||||
| BEGINNING | ENDING | EXPENSES PAID DURING | ||||
| ACCOUNT VALUE | ACCOUNT VALUE | PERIOD APRIL 1, 2004 - | ||||
| APRIL 1, 2004 | SEPTEMBER 30, 2004 | SEPTEMBER 30, 2004* | ||||
| Actual | $1,000.00 | $1,045.60 | $5.28 | |||
| Hypothetical (5% return before expenses) | $1,000.00 | $1,019.90 | $5.22 | |||
| * | Expenses are equal to the Fund’s annualized expense ratio of 1.03%, multiplied by the average account value over the period, multiplied by 183/365 to reflect the one-half year period. |
| BUFFALO HIGH YIELD FUND | ||||||
| BEGINNING | ENDING | EXPENSES PAID DURING | ||||
| ACCOUNT VALUE | ACCOUNT VALUE | PERIOD APRIL 1, 2004 - | ||||
| APRIL 1, 2004 | SEPTEMBER 30, 2004 | SEPTEMBER 30, 2004* | ||||
| Actual | $1,000.00 | $1,021.00 | $5.17 | |||
| Hypothetical (5% return before expenses) | $1,000.00 | $1,019.95 | $5.16 | |||
| * | Expenses are equal to the Fund’s annualized expense ratio of 1.02%, multiplied by the average account value over the period, multiplied by 183/365 to reflect the one-half year period. |
| 8 | |
| BUFFALO LARGE CAP FUND | ||||||
| BEGINNING | ENDING | EXPENSES PAID DURING | ||||
| ACCOUNT VALUE | ACCOUNT VALUE | PERIOD APRIL 1, 2004 - | ||||
| APRIL 1, 2004 | SEPTEMBER 30, 2004 | SEPTEMBER 30, 2004* | ||||
| Actual | $1,000.00 | $950.20 | $5.13 | |||
| Hypothetical (5% return before expenses) | $1,000.00 | $1,019.80 | $5.32 | |||
| * | Expenses are equal to the Fund’s annualized expense ratio of 1.05%, multiplied by the average account value over the period, multiplied by 183/365 to reflect the one-half year period. |
| BUFFALO MICRO CAP FUND | ||||||
| BEGINNING | ENDING | EXPENSES PAID DURING | ||||
| ACCOUNT VALUE | ACCOUNT VALUE | PERIOD MAY 21, 2004 - | ||||
| MAY 21, 2004* | SEPTEMBER 30, 2004 | SEPTEMBER 30, 2004** | ||||
| Actual | $1,000.00 | $964.00 | $5.75 | |||
| Hypothetical (5% return before expenses) | $1,000.00 | $1,012.22 | $5.89 | |||
| * | Commencement of operations. |
| ** | Expenses are equal to the Fund’s annualized expense ratio of 1.62%, multiplied by the average account value over the period, multiplied by 132/365 to reflect the period since commencement of operations. |
| BUFFALO MID CAP FUND | ||||||
| BEGINNING | ENDING | EXPENSES PAID DURING | ||||
| ACCOUNT VALUE | ACCOUNT VALUE | PERIOD APRIL 1, 2004 - | ||||
| APRIL 1, 2004 | SEPTEMBER 30, 2004 | SEPTEMBER 30, 2004* | ||||
| Actual | $1,000.00 | $922.80 | $4.96 | |||
| Hypothetical (5% return before expenses) | $1,000.00 | $1,019.90 | $5.22 | |||
| * | Expenses are equal to the Fund’s annualized expense ratio of 1.03%, multiplied by the average account value over the period, multiplied by 183/365 to reflect the one-half year period. |
| BUFFALO SCIENCE & TECHNOLOGY FUND | ||||||
| BEGINNING | ENDING | EXPENSES PAID DURING | ||||
| ACCOUNT VALUE | ACCOUNT VALUE | PERIOD APRIL 1, 2004 - | ||||
| APRIL 1, 2004 | SEPTEMBER 30, 2004 | SEPTEMBER 30, 2004* | ||||
| Actual | $1,000.00 | $948.40 | $5.13 | |||
| Hypothetical (5% return before expenses) | $1,000.00 | $1,019.80 | $5.32 | |||
| * | Expenses are equal to the Fund’s annualized expense ratio of 1.05%, multiplied by the average account value over the period, multiplied by 183/365 to reflect the one-half year period. |
| BUFFALO SMALL CAP FUND | ||||||
| BEGINNING | ENDING | EXPENSES PAID DURING | ||||
| ACCOUNT VALUE | ACCOUNT VALUE | PERIOD APRIL 1, 2004 - | ||||
| APRIL 1, 2004 | SEPTEMBER 30, 2004 | SEPTEMBER 30, 2004* | ||||
| Actual | $1,000.00 | $966.80 | $4.98 | |||
| Hypothetical (5% return before expenses) | $1,000.00 | $1,020.00 | $5.11 | |||
| * | Expenses are equal to the Fund’s annualized expense ratio of 1.01%, multiplied by the average account value over the period, multiplied by 183/365 to reflect the one-half year period. |
| BUFFALO USA GLOBAL FUND | ||||||
| BEGINNING | ENDING | EXPENSES PAID DURING | ||||
| ACCOUNT VALUE | ACCOUNT VALUE | PERIOD APRIL 1, 2004 - | ||||
| APRIL 1, 2004 | SEPTEMBER 30, 2004 | SEPTEMBER 30, 2004* | ||||
| Actual | $1,000.00 | $963.30 | $5.12 | |||
| Hypothetical (5% return before expenses) | $1,000.00 | $1,019.85 | $5.27 | |||
| * | Expenses are equal to the Fund’s annualized expense ratio of 1.04%, multiplied by the average account value over the period, multiplied by 183/365 to reflect the one-half year period. |
| 9 | |
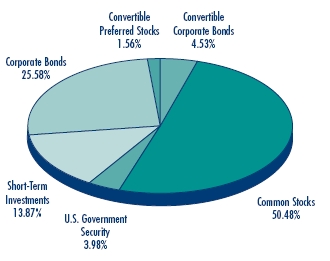
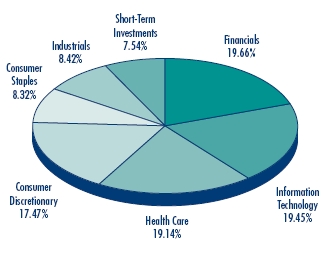
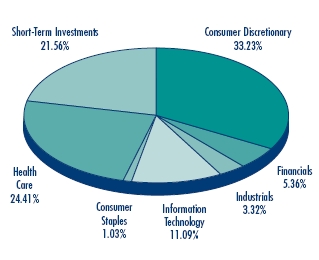
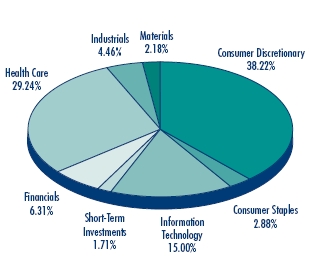
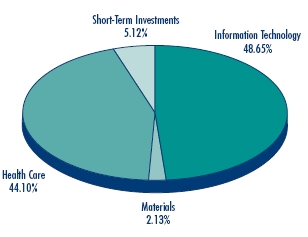
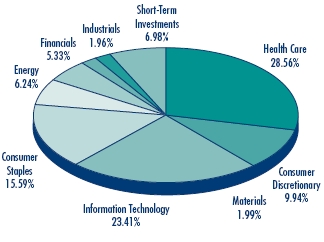
| ALLOCATION OF |
| PORTFOLIO HOLDINGS |
Percentages represent market value as a percentage of total investments on September 30, 2004.
| BUFFALO BALANCED FUND | BUFFALO LARGE CAP FUND | |
 |  | |
| BUFFALO HIGH YIELD FUND | BUFFALO MICRO CAP FUND | |
 |  | |
| 10 | |
| BUFFALO MID CAP FUND | BUFFALO SMALL CAP FUND | |
 |  | |
| BUFFALO SCIENCE & TECHNOLOGY FUND | BUFFALO USA GLOBAL FUND | |
 |  | |
| 11 | |
| BUFFALO |
| BALANCED FUND |
SCHEDULE OF INVESTMENTS
September 30, 2004 (unaudited)
| SHARES | MARKET VALUE | |||
| COMMON STOCKS — 50.97% | ||||
| CONSUMER DISCRETIONARY — 1.96% | ||||
| 30,000 | Argosy Gaming Co.* | $ | 1,176,000 | |
| 15,000 | Costco Wholesale Corp. | 623,400 | ||
| 15,000 | General Motors Corp. | 637,200 | ||
| 2,436,600 | ||||
| CONSUMER STAPLES — 7.94% | ||||
| 25,000 | Campbell Soup Co. | 657,250 | ||
| 10,000 | The Coca-Cola Co. | 400,500 | ||
| 30,000 | Colgate-Palmolive Co. | 1,355,400 | ||
| 60,000 | ConAgra Foods, Inc. | 1,542,600 | ||
| 35,000 | General Mills, Inc. | 1,571,500 | ||
| 30,000 | H.J. Heinz Co. | 1,080,600 | ||
| 30,000 | Kellogg Co. | 1,279,800 | ||
| 20,000 | PepsiCo, Inc. | 973,000 | ||
| 20,000 | Sara Lee Corp. | 457,200 | ||
| 9,000 | Wm. Wrigley Jr. Co. | 569,790 | ||
| 9,887,640 | ||||
| ENERGY — 15.04% | ||||
| 5,000 | Amerada Hess Corp. | 445,000 | ||
| 20,000 | Anadarko Petroleum Corp. | 1,327,200 | ||
| 15,000 | Apache Corp. | 751,650 | ||
| 35,000 | BP PLC, ADR | 2,013,550 | ||
| 50,000 | ChevronTexaco Corp. | 2,682,000 | ||
| 45,000 | ConocoPhillips | 3,728,250 | ||
| 11,742 | Eagle Geophysical, Inc.f * | 117 | ||
| 35,000 | Exxon Mobil Corp. | 1,691,550 | ||
| 20,000 | Frontier Oil Corp. | 472,200 | ||
| 45,000 | Kerr-McGee Corp. | 2,576,250 | ||
| 35,000 | Marathon Oil Corp. | 1,444,800 | ||
| 50,000 | Suncor Energy, Inc. | 1,600,500 | ||
| 18,733,067 | ||||
| FINANCIALS — 10.46% | ||||
| 25,000 | The Allstate Corp. | 1,199,750 | ||
| 40,000 | Bank of America Corp. | 1,733,200 | ||
| 10,000 | The Chubb Corp. | 702,800 | ||
| 25,000 | Cincinnati Financial Corp. | 1,030,500 | ||
| 25,000 | Citigroup Inc. | 1,103,000 | ||
| 18,000 | JPMorgan Chase & Co. | 715,140 | ||
| 25,000 | KeyCorp | 790,000 | ||
| 10,000 | Lincoln National Corp. | 470,000 | ||
| 30,000 | Marsh & McLennan Companies, Inc. | 1,372,800 | ||
| 10,000 | Marshall & Ilsley Corp. | 403,000 | ||
| 10,000 | Northern Trust Corp. | 408,000 | ||
| 10,000 | PNC Financial Services Group | 541,000 | ||
| 20,000 | Regions Financial Corp. | 661,200 | ||
| 30,000 | Washington Mutual, Inc. | 1,172,400 | ||
| 20,000 | Wilmington Trust Corp. | 724,200 | ||
| 13,026,990 | ||||
| 12 | |
| SHARES | MARKET VALUE | |||
| HEALTH CARE — 6.36% | ||||
| 25,000 | Abbott Laboratories | $ | 1,059,000 | |
| 25,000 | Baxter International Inc. | 804,000 | ||
| 35,000 | Bristol-Myers Squibb Co. | 828,450 | ||
| 10,000 | Forest Laboratories, Inc.* | 449,800 | ||
| 25,000 | GlaxoSmithKline PLC, ADR | 1,093,250 | ||
| 15,000 | Johnson & Johnson | 844,950 | ||
| 30,000 | Merck & Co. Inc. | 990,000 | ||
| 30,000 | Pfizer Inc. | 918,000 | ||
| 20,000 | Schering-Plough Corp. | 381,200 | ||
| 15,000 | Wyeth | 561,000 | ||
| 7,929,650 | ||||
| INDUSTRIALS — 6.53% | ||||
| 5,000 | FedEx Corp. | 428,450 | ||
| 60,000 | General Electric Co. | 2,014,800 | ||
| 30,000 | Lockheed Martin Corp. | 1,673,400 | ||
| 35,000 | Northrop Grumman Corp. | 1,866,550 | ||
| 35,000 | Pitney Bowes Inc. | 1,543,500 | ||
| 45,000 | Southwest Airlines Co. | 612,900 | ||
| 8,139,600 | ||||
| INFORMATION TECHNOLOGY — 2.18% | ||||
| 45,000 | Intel Corp. | 902,700 | ||
| 50,000 | Microsoft Corp. | 1,382,500 | ||
| 15,000 | SanDisk Corp.* | 436,800 | ||
| 2,722,000 | ||||
| UTILITIES — 0.50% | ||||
| 10,000 | Kinder Morgan, Inc. | 628,200 | ||
| TOTAL COMMON STOCKS | 63,503,747 | |||
| (COST $ 58,556,207) | ||||
| CONVERTIBLE PREFERRED STOCKS — 1.58% | ||||
| CONSUMER DISCRETIONARY — 0.38% | ||||
| 10,335 | Fleetwood Capital Trust* | 468,951 | ||
| ENERGY — 0.81% | ||||
| 53,500 | ICO Inc.* | 1,012,755 | ||
| MATERIALS — 0.39% | ||||
| 10,000 | TXI Capital Trust I | 486,900 | ||
| TOTAL CONVERTIBLE PREFERRED STOCKS | 1,968,606 | |||
| (COST $1,583,389) | ||||
| 13 | |
| BUFFALO |
| BALANCED FUND |
SCHEDULE OF INVESTMENTS (continued)
September 30, 2004 (unaudited)
| FACE AMOUNT | MARKET VALUE | ||||
| CORPORATE BONDS — 25.83% | |||||
| CONSUMER DISCRETIONARY — 10.49% | |||||
| $ | 1,000,000 | Charter Communications Holdings Capital Corp., 11.125% due 1-15-11 | $ | 815,000 | |
| 4,000,000 | Charter Communications Holdings Capital Corp., 8.75% due 11-15-13 | 3,945,000 | |||
| 55,000 | Circus Circus, 7.625% due 7-15-13 | 58,575 | |||
| 100,000 | Fisher Communications, Inc., 8.625% due 9-15-14 (Acquired 9-15-04; Cost$100,000)r | 104,500 | |||
| 4,000,000 | Ford Motor Co., 7.45% due 7-16-31 | 3,933,324 | |||
| 1,500,000 | General Motors Acceptance Corp., 8.00% due 11-1-31 | 1,556,862 | |||
| 1,500,000 | Interface, Inc., 9.50% due 2-1-14 | 1,560,000 | |||
| 25,000 | John Q Hamons Hotel, 8.875% due 5-15-12 | 28,000 | |||
| 1,000,000 | Mikohn Gaming Corp., 11.875% due 8-15-08 | 1,065,000 | |||
| 13,066,261 | |||||
| CONSUMER STAPLES — 1.62% | |||||
| 1,140,000 | Nash Finch Co., 8.50% due 5-1-08 | 1,178,475 | |||
| 500,000 | Pilgrim’s Pride Corp., 9.625% due 9-15-11 | 562,500 | |||
| 250,000 | Pilgrim’s Pride Corp., 9.25% due 11-15-13 | 276,250 | |||
| 2,017,225 | |||||
| ENERGY — 7.72% | |||||
| 100,000 | Frontier Oil Corp., 11.75% due 11-15-09 | 107,125 | |||
| 4,000,000 | Giant Industries, 8.00% due 5-15-14 | 4,100,000 | |||
| 10,000 | Swift Energy Co., 9.375% due 5-1-12 | 11,250 | |||
| 1,250,000 | Tesoro Petroleum Corp., 9.625% due 4-1-12 | 1,453,125 | |||
| 4,000,000 | United Refining Co., 10.50% due 8-15-12 (Acquired Multiple Dates; Cost $3,940,447)r | 3,950,000 | |||
| 9,621,500 | |||||
| HEALTH CARE — 5.31% | |||||
| 2,500,000 | Aaipharma, Inc., 11.00% due 4-1-10 | 1,625,000 | |||
| 250,000 | Alpharma, Inc., 8.625% due 5-1-11 (Acquired 9-9-03; Cost $247,238)r | 257,500 | |||
| 4,500,000 | Athena Neuro Financial LLC, 7.25% due 2-21-08 | 4,578,750 | |||
| 150,000 | Inverness Medical Innovations, Inc., 8.75% due 2-15-12 (Acquired 2-5-04; Cost $150,000)r | 151,500 | |||
| 6,612,750 | |||||
| INDUSTRIALS — 0.00% | |||||
| 25,644 | Philip Services, Inc., 6.00% due 4-15-10df p* | 3 | |||
| MATERIALS — 0.69% | |||||
| 750,000 | Texas Industries, Inc., 10.25% due 6-15-11 | 866,250 | |||
| TOTAL CORPORATE BONDS | 32,183,989 | ||||
| (COST $31,729,098) | |||||
| CONVERTIBLE CORPORATE BONDS — 4.58% | |||||
| CONSUMER DISCRETIONARY — 3.38% | |||||
| 1,000,000 | Lions Gate Entertainment Corp., 4.875% due 12-15-10 (Acquired 11-28-03; Cost $1,000,000)r | 1,727,500 | |||
| 2,500,000 | Lions Gate Entertainment Corp., 2.9375% due 10-15-24 (Acquired 9-29-04; Cost $2,487,500)r | 2,487,500 | |||
| 4,215,000 | |||||
| HEALTH CARE — 0.16% | |||||
| 150,000 | Axcan Pharma Inc., 4.25% due 4-15-08 (Acquired 2-28-03; Cost $150,000)r | 200,437 | |||
| INDUSTRIALS — 0.86% | |||||
| 1,000,000 | EDO Corp., 5.25% due 4-15-07 | 1,067,500 | |||
| 775,805 | Philip Services, Inc., 3.00% due 4-15-20df * | 78 | |||
| 1,067,578 | |||||
| 14 | |
| SHARES OR | ||||||
| FACE AMOUNT | MARKET VALUE | |||||
| INFORMATION TECHNOLOGY — 0.18% | ||||||
| $ | 250,000 | Conexant Systems, Inc., 4.00% due 2-1-07 | $ | 222,500 | ||
| TOTAL CONVERTIBLE CORPORATE BONDS | 5,705,515 | |||||
| (COST $5,776,556) | ||||||
| U.S. GOVERNMENT SECURITY — 4.01% | ||||||
| U.S. TREASURY NOTE — 4.01% | ||||||
| 5,000,000 | 1.75% due 12-31-04 | 5,001,175 | ||||
| (COST $5,000,000) | ||||||
| SHORT-TERM INVESTMENTS — 14.00% | ||||||
| INVESTMENT COMPANY — 0.18% | ||||||
| 225,596 | SEI Daily Income Treasury II Fund, Class B | 225,596 | ||||
| U.S. TREASURY BILLS — 13.82% | ||||||
| $ | 9,403,000 | 1.14% due 10-7-04 | 9,400,593 | |||
| 2,095,000 | 1.00% due 10-14-04 | 2,093,858 | ||||
| 314,000 | 0.97% due 10-21-04 | 313,764 | ||||
| 5,421,000 | 1.00% due 11-04-04 | 5,414,440 | ||||
| 17,222,655 | ||||||
| TOTAL SHORT-TERM INVESTMENTS | 17,448,251 | |||||
| (COST $17,448,251) | ||||||
| TOTAL INVESTMENTS — 100.97% | 125,811,283 | |||||
| (COST $120,093,501) | ||||||
| Liabilities, less Other Assets — (0.97)% | (1,212,622 | ) | ||||
| TOTAL NET ASSETS — 100.00% | $ | 124,598,661 | ||||
| d | Security is in default at September 30, 2004. |
| f | Fair valued security. The total value of these securities amounted to $198 (0.00% of net assets) at September 30, 2004. |
| p | Payment-in-kind security. |
| r | Security exempt from registration under Rule 144A of the Securities Act of 1933. These securities may be resold in transactions exempt from registration normally to qualified institutional buyers. The total value of these securities amounted to $8,878,937 (7.13% of net assets) at September 30, 2004. |
| * | Non-income producing security |
| ADR — American Depository Receipt | |
| PLC — Public Limited Company | |
See accompanying Notes to Financial Statements.
| 15 | |
| BUFFALO |
| HIGH YIELD FUND |
SCHEDULE OF INVESTMENTS
September 30, 2004 (unaudited)
| FACE AMOUNT | MARKET VALUE | ||||
| CORPORATE BONDS — 39.09% | |||||
| CONSUMER DISCRETIONARY — 17.24% | |||||
| $ | 1,780,000 | Ameristar Casinos, Inc., 10.75% due 2-15-09 | $ | 2,029,200 | |
| 100,000 | Argosy Gaming Co., 9.00% due 9-1-11 | 112,750 | |||
| 875,000 | Argosy Gaming Co., 7.00% due 1-15-14 | 906,719 | |||
| 1,700,000 | Aztar Corp., 7.875% due 6-15-14 (Acquired Multiple Dates; Cost $1,704,325)r | 1,810,500 | |||
| 2,250,000 | Central Garden & Pet Co., 9.125% due 2-1-13 | 2,480,625 | |||
| 1,185,000 | Charter Communications Holdings Capital Corp., 8.625% due 4-1-09 | 927,262 | |||
| 255,000 | Charter Communications Holdings Capital Corp., 11.125% due 1-15-11 | 207,825 | |||
| 845,000 | Charter Communications Holdings Capital Corp., 8.00% due 4-30-12 | ||||
| (Acquired 4-20-04; Cost $845,000) r | 847,112 | ||||
| 3,100,000 | Circus Circus, 7.625% due 7-15-13 | 3,301,500 | |||
| 175,000 | Fisher Communications, Inc., 8.625% due 9-15-14 (Acquired 9-15-04; Cost $175,000)r | 182,875 | |||
| 3,880,000 | Ford Motor Co., 7.45% due 7-16-31 | 3,815,324 | |||
| 4,195,000 | General Motors Acceptance Corp., 8.00% due 11-1-31 | 4,354,024 | |||
| 2,185,000 | Host Marriott LP, 9.25% due 10-1-07 | 2,458,125 | |||
| 2,250,000 | Interface, Inc., 10.375% due 2-1-10 | 2,565,000 | |||
| 3,570,000 | Interface, Inc., 9.50% due 2-1-14 | 3,712,800 | |||
| 4,025,000 | Isle of Capri Casinos, 7.00% due 3-1-14 | 4,065,250 | |||
| 395,000 | John Q Hamons Hotel, 8.875% due 5-15-12 | 442,400 | |||
| 460,000 | Mandalay Resort Group, 10.25% due 8-1-07 | 524,400 | |||
| 180,000 | MGM MIRAGE, 8.375% due 2-1-11 | 199,575 | |||
| 4,587,000 | Mikohn Gaming Corp., 11.875% due 8-15-08 | 4,885,155 | |||
| 300,000 | Park Place Entertainment Corp., 8.875% due 9-15-08 | 342,750 | |||
| 595,000 | Park Place Entertainment Corp., 8.125% due 5-15-11 | 690,200 | |||
| 2,785,000 | Penn National Gaming, Inc., 8.875% due 3-15-10 | 3,066,981 | |||
| 3,120,000 | Phillips Van-Heusen Corp., 7.75% due 11-15-23 | 3,135,600 | |||
| 850,000 | Rent-Way, Inc., 11.875% 6-15-10 | 930,750 | |||
| 3,930,000 | Royal Caribbean Cruises Ltd., 7.50% due 10-15-27 | 4,106,850 | |||
| 59,000 | Wal-Mart Stores, 8.75% due 12-29-06 | 59,620 | |||
| 3,160,000 | WCI Communities, Inc., 10.625% due 2-15-11 | 3,578,700 | |||
| 55,739,872 | |||||
| CONSUMER STAPLES — 2.95% | |||||
| 2,000,000 | Elizabeth Arden, Inc., 7.75% due 1-15-14 | 2,110,000 | |||
| 215,000 | Hines Nurseries, Inc., 10.25% due 10-1-11 | 228,975 | |||
| 1,400,000 | Ingles Markets, Inc., 8.875% due 12-1-11 | 1,515,500 | |||
| 1,840,000 | Nash Finch Co., 8.50% due 5-1-08 | 1,902,100 | |||
| 2,085,000 | Pilgrim’s Pride Corp., 9.625% due 9-15-11 | 2,345,625 | |||
| 1,110,000 | Pilgrim’s Pride Corp., 9.25% due 11-15-13 | 1,226,550 | |||
| 185,000 | Rayovac Corp., 8.50% due 10-1-13 | 201,650 | |||
| 9,530,400 | |||||
| ENERGY — 7.01% | |||||
| 2,920,000 | Frontier Oil Corp., 11.75% due 11-15-09 | 3,128,050 | |||
| 4,615,000 | Giant Industries, 8.00% due 5-15-14 | 4,730,375 | |||
| 2,200,000 | Premcor Refining Group Inc., 9.25% due 2-1-10 | 2,508,000 | |||
| 450,000 | Premcor Refining Group Inc., 9.50% due 2-1-13 | 532,125 | |||
| 2,530,000 | Premcor Refining Group Inc., 7.50% due 6-15-15 | 2,732,400 | |||
| 300,000 | Swift Energy Co., 9.375% due 5-1-12 | 337,500 | |||
| 3,900,000 | Tesoro Petroleum Corp., 9.625% due 4-1-12 | 4,533,750 | |||
| 4,200,000 | United Refining Co., 10.50% due 8-15-12 (Acquired 8-3-04; Cost $4,144,550)r | 4,147,500 | |||
| 22,649,700 | |||||
| 16 | |
| FACE AMOUNT | MARKET VALUE | ||||
| HEALTH CARE — 5.64% | |||||
| $ | 6,370,000 | Aaipharma, Inc., 11.00% due 4-1-10 | $ | 4,140,500 | |
| 4,040,000 | Alpharma, Inc., 8.625% due 5-1-11 (Acquired Multiple Dates; Cost $4,080,345)r | 4,161,200 | |||
| 4,785,000 | Athena Neuro Financial LLC, 7.25% due 2-21-08 | 4,868,738 | |||
| 3,265,000 | Bausch & Lomb, Inc., 7.125% due 8-1-28 | 3,468,658 | |||
| 430,000 | Fisher Scientific International Inc., 8.00% due 9-1-13 | 483,750 | |||
| 665,000 | Inverness Medical Innovations, Inc., 8.75% due 2-15-12 (Acquired 2-5-04; Cost $665,000) | 671,650 | |||
| 400,000 | Stewart Enterprises, 10.75% due 7-1-08 | 444,000 | |||
| 18,238,496 | |||||
| INDUSTRIALS — 4.57% | |||||
| 1,300,000 | Allied Waste North America, 9.25% due 9-1-12 | 1,452,750 | |||
| 1,680,000 | Allied Waste North America, 7.875% due 4-15-13 | 1,780,800 | |||
| 2,065,000 | Cenveo Inc., 9.625% due 3-15-12 | 2,281,825 | |||
| 4,255,000 | Iron Mountain, Inc., 7.75% due 1-1-15 | 4,531,575 | |||
| 1,265,000 | Mobile Mini, Inc., 9.50% due 7-1-13 | 1,410,475 | |||
| 25,106 | Philip Services, Inc., 6.00% due 4-15-10dfp* | 3 | |||
| 3,185,000 | Titan Corp., 8.00% due 5-15-11 | 3,328,325 | |||
| 14,785,753 | |||||
| MATERIALS — 1.68% | |||||
| 2,330,000 | Texas Industries, Inc., 10.25% due 6-15-11 | 2,691,150 | |||
| 2,615,000 | U.S. Concrete, Inc., 8.375% due 4-1-14 | 2,745,750 | |||
| 5,436,900 | |||||
| TOTAL CORPORATE BONDS | 126,381,121 | ||||
| (COST $119,065,793) | |||||
| CONVERTIBLE CORPORATE BONDS — 20.56% | |||||
| CONSUMER DISCRETIONARY — 5.26% | |||||
| 2,175,000 | Best Buy, 2.25% due 1-15-22 | 2,324,531 | |||
| 1,000,000 | Lions Gate Entertainment Corp., 4.875% due 12-15-10 (Acquired 11-28-03; Cost $1,000,000)r | 1,727,500 | |||
| 6,500,000 | Lions Gate Entertainment Corp., 2.9375% due 10-15-24 (Acquired 9-29-04; Cost $6,467,500)r | 6,467,500 | |||
| 1,685,000 | Sirius Satellite, 2.50% due 2-15-09 (Acquired 9-22-04; Cost $1,647,278) | 1,748,187 | |||
| 3,140,000 | WMS Industries Inc., 2.75% due 7-15-10 (Acquired Multiple Dates; Cost$3,207,535)r | 4,725,700 | |||
| 16,993,418 | |||||
| CONSUMER STAPLES — 1.85% | |||||
| 5,775,000 | Performance Food Group Co., 5.50% due 10-16-08 | 5,991,563 | |||
| ENERGY — 0.64% | |||||
| 1,770,000 | Kerr-McGee Corp., 5.25% due 2-15-10 | 1,900,537 | |||
| 161,000 | Moran Energy, Inc., 8.75% due 1-15-08 | 158,585 | |||
| 2,059,122 | |||||
| HEALTH CARE — 5.70% | |||||
| 1,745,000 | Axcan Pharma Inc., 4.25% due 4-15-08 (Acquired Multiple Dates; Cost $1,781,007) | 2,331,756 | |||
| 3,415,000 | Cell Therapeutic, 5.75% due 6-15-08 | 3,299,744 | |||
| 2,570,000 | Charles River Laboratories International, Inc., 3.50% due 2-1-22 | 3,096,850 | |||
| 1,290,000 | Community Health Systems Inc., 4.25% due 10-15-08 | 1,336,762 | |||
| 1,655,000 | Enzon, Inc., 4.50% due 7-1-08 | 1,553,631 | |||
| 4,760,000 | First Horizon Pharmaceutical Corp., 1.75% due 3-8-24 (Acquired Multiple Dates; Cost $4,718,453)r | 5,307,400 | |||
| 1,273,000 | Medicis Pharmaceutical Corp., 1.50% due 6-4-33 | 1,494,184 | |||
| 18,420,327 | |||||
| INDUSTRIALS — 1.46% | |||||
| 5,050,000 | JetBlue Airways, 3.50% due 7-15-33 | 4,728,062 | |||
| 759,568 | Philip Services, Inc., 3.00% due 4-15-20df * | 76 | |||
| 4,728,138 | |||||
| 17 | |
| BUFFALO |
| HIGH YIELD FUND |
SCHEDULE OF INVESTMENTS (continued)
September 30, 2004 (unaudited)
| SHARES OR | |||||
| FACE AMOUNT | MARKET VALUE | ||||
| INFORMATION TECHNOLOGY — 5.65% | |||||
| $ | 445,000 | Adaptec, Inc., 3.00% due 3-5-07 (Acquired 10-16-02; Cost $357,539)r | $ | 447,225 | |
| 3,985,000 | The BISYS Group, 4.00% due 3-15-06 | 3,925,225 | |||
| 1,100,000 | Conexant Systems, Inc., 4.00% due 2-1-07 | 979,000 | |||
| 4,830,000 | Fairchild Semiconductor Corp., 5.00% due 11-1-08 | 4,811,888 | |||
| 460,000 | Komag, Inc., 2.00% due 2-1-24 | 415,150 | |||
| 3,985,000 | NCO Group, Inc., 4.75% due 4-15-06 | 4,224,100 | |||
| 1,780,000 | Wind River Systems, Inc., 3.75% due 12-15-06 | 1,762,200 | |||
| 1,725,000 | Wind River Systems, Inc., 3.75% due 12-15-06 (Acquired Multiple Dates; Cost $1,652,796)r | 1,707,750 | |||
| 18,272,538 | |||||
| TOTAL CONVERTIBLE CORPORATE BONDS | 66,465,106 | ||||
| (COST $61,514,731) | |||||
| COMMON STOCKS — 9.52% | |||||
| CONSUMER DISCRETIONARY — 0.00% | |||||
| 758 | Exide Technologies* | 12,014 | |||
| 1,895 | Exide Technologies warrant | 5,649 | |||
| 17,663 | |||||
| CONSUMER STAPLES — 0.88% | |||||
| 110,360 | ConAgra Foods, Inc. | 2,837,356 | |||
| ENERGY — 1.50% | |||||
| 30,100 | ChevronTexaco Corp. | 1,614,564 | |||
| 19,500 | ConocoPhillips | 1,615,575 | |||
| 17,025 | Eagle Geophysical, Inc.f * | 170 | |||
| 28,100 | Kerr-McGee Corp. | 1,608,725 | |||
| 4,839,034 | |||||
| FINANCIALS — 2.80% | |||||
| 60,400 | Bank of America Corp. | 2,617,132 | |||
| 35,000 | Citigroup Inc. | 1,544,200 | |||
| 52,400 | KeyCorp | 1,655,840 | |||
| 41,300 | Washington Mutual, Inc. | 1,614,004 | |||
| 80,815 | W.P. Stewart & Co., Ltd. | 1,615,492 | |||
| 9,046,668 | |||||
| HEALTH CARE — 1.79% | |||||
| 60,700 | Bayer AG, ADR | 1,665,001 | |||
| 40,105 | Bristol-Myers Squibb Co. | 949,285 | |||
| 96,600 | Merck & Co. Inc. | 3,187,800 | |||
| 5,802,086 | |||||
| INDUSTRIALS — 1.00% | |||||
| 251,300 | The ServiceMaster Co. | 3,231,718 | |||
| TELECOMMUNICATION SERVICES — 1.55% | |||||
| 101,210 | SBC Communications Inc. | 2,626,400 | |||
| 60,200 | Verizon Communications Inc. | 2,370,676 | |||
| 4,997,076 | |||||
| TOTAL COMMON STOCKS | 30,771,601 | ||||
| (COST $29,065,719) | |||||
| 18 | |
| SHARES OR | ||||||
| FACE AMOUNT | MARKET VALUE | |||||
| CONVERTIBLE PREFERRED STOCKS — 1.40% | ||||||
| ENERGY — 0.45% | ||||||
| 76,200 | ICO Inc.* | $ | 1,442,466 | |||
| MATERIALS — 0.95% | ||||||
| 63,400 | TXI Capital Trust I | 3,086,946 | ||||
| TOTAL CONVERTIBLE PREFERRED STOCKS | 4,529,412 | |||||
| (COST $3,338,549) | ||||||
| NON-CONVERTIBLE PREFERRED STOCK — 0.01% | ||||||
| CONSUMER DISCRETIONARY — 0.01% | ||||||
| 7,250 | Adelphia Communications Corp.* | 45,313 | ||||
| (COST $719,125) | ||||||
| SHORT-TERM INVESTMENTS — 31.00% | ||||||
| INVESTMENT COMPANY — 0.18% | ||||||
| 588,028 | SEI Daily Income Treasury II Fund, Class B | 588,028 | ||||
| U.S. TREASURY BILLS — 30.82% | ||||||
| $ | 63,023,000 | 1.14% due 10-7-04 | 63,006,897 | |||
| 3,634,000 | 0.97% due 10-21-04 | 3,631,270 | ||||
| 33,060,000 | 1.00% due 11-4-04 | 33,019,992 | ||||
| 99,658,159 | ||||||
| TOTAL SHORT-TERM INVESTMENTS | 100,246,187 | |||||
| (COST $100,246,187) | ||||||
| TOTAL INVESTMENTS — 101.58% | 328,438,740 | |||||
| (COST $313,950,104) | ||||||
| Liabilities, less Other Assets — (1.58)% | (5,094,481 | ) | ||||
| TOTAL NET ASSETS — 100.00% | $ | 323,344,259 | ||||
| d | Security is in default at September 30, 2004. |
| f | Fair valued security. The total value of these securities amounted to $249 (0.00% of net assets) at September 30, 2004. |
| p | Payment-in-kind security. |
| r | Security exempt from registration under Rule 144A of the Securities Act of 1933. These securities may be resold in transactions exempt from registration normally to qualified institutional buyers. The total value of these securities amounted to $36,283,855 (11.22% of net assets) at September 30, 2004. |
| * | Non-income producing security |
| ADR — American Depository Receipt | |
See accompanying Notes to Financial Statements.
| 19 | |
| BUFFALO |
| LARGE CAP FUND |
SCHEDULE OF INVESTMENTS
September 30, 2004 (unaudited)
| SHARES | MARKET VALUE | |||
| COMMON STOCKS — 93.46% | ||||
| CONSUMER DISCRETIONARY — 17.66% | ||||
| 45,000 | Carnival Corp. | $ | 2,128,050 | |
| 21,800 | Electronic Arts Inc.* | 1,002,582 | ||
| 24,500 | Harley-Davidson, Inc. | 1,456,280 | ||
| 25,300 | Interactive Corp.* | 557,106 | ||
| 27,500 | International Game Technology | 988,625 | ||
| 32,000 | Marriott International, Inc., Class A | 1,662,720 | ||
| 66,600 | McDonald’s Corp. | 1,866,798 | ||
| 9,662,161 | ||||
| CONSUMER STAPLES — 8.41% | ||||
| 27,700 | Colgate-Palmolive Co. | 1,251,486 | ||
| 24,100 | PepsiCo, Inc. | 1,172,465 | ||
| 28,700 | Sysco Corp. | 858,704 | ||
| 36,800 | Walgreen Co. | 1,318,544 | ||
| 4,601,199 | ||||
| FINANCIALS — 19.88% | ||||
| 51,200 | American Express Co. | 2,634,752 | ||
| 35,000 | The Bank of New York Co., Inc. | 1,020,950 | ||
| 13,000 | The Goldman Sachs Group, Inc. | 1,212,120 | ||
| 26,100 | Mellon Financial Corp. | 722,709 | ||
| 30,200 | Morgan Stanley | 1,488,860 | ||
| 42,400 | Northern Trust Corp. | 1,729,920 | ||
| 22,900 | PNC Financial Services Group | 1,238,890 | ||
| 23,000 | Principal Financial Group, Inc. | 827,310 | ||
| 10,875,511 | ||||
| HEALTH CARE — 19.34% | ||||
| 35,500 | Abbott Laboratories | 1,503,780 | ||
| 39,800 | Baxter International Inc. | 1,279,968 | ||
| 44,200 | Bayer AG, ADR | 1,212,406 | ||
| 14,000 | Boston Scientific Corp.* | 556,220 | ||
| 30,700 | Johnson & Johnson | 1,729,331 | ||
| 36,900 | Merck & Co. Inc. | 1,217,700 | ||
| 39,800 | Pfizer Inc. | 1,217,880 | ||
| 68,400 | Schering-Plough Corp. | 1,303,704 | ||
| 21,700 | Teva Pharmaceutical Industries Ltd., ADR | 563,115 | ||
| 10,584,104 | ||||
| INDUSTRIALS — 8.51% | ||||
| 41,000 | Automatic Data Processing, Inc. | 1,694,120 | ||
| 19,000 | FedEx Corp. | 1,628,110 | ||
| 98,087 | Southwest Airlines Co. | 1,335,945 | ||
| 4,658,175 | ||||
| 20 | |
| SHARES OR | ||||||
| FACE AMOUNT | MARKET VALUE | |||||
| INFORMATION TECHNOLOGY — 19.66% | ||||||
| 29,600 | Analog Devices, Inc. | $ | 1,147,888 | |||
| 47,400 | Applied Materials, Inc.* | 781,626 | ||||
| 68,620 | AU Optronics Corp., ADR | 859,122 | ||||
| 50,100 | Cisco Systems, Inc.* | 906,810 | ||||
| 8,400 | Dell Inc.* | 299,040 | ||||
| 30,222 | First Data Corp. | 1,314,657 | ||||
| 47,300 | Intel Corp. | 948,838 | ||||
| 61,100 | Microsoft Corp. | 1,689,415 | ||||
| 86,555 | Nokia Oyj, ADR | 1,187,535 | ||||
| 41,300 | Texas Instruments Inc. | 878,864 | ||||
| 27,600 | Xilinx, Inc. | 745,200 | ||||
| 10,758,995 | ||||||
| TOTAL COMMON STOCKS | 51,140,145 | |||||
| (COST $49,240,920) | ||||||
| SHORT-TERM INVESTMENTS — 7.62% | ||||||
| INVESTMENT COMPANY — 3.97% | ||||||
| 2,170,293 | SEI Daily Income Treasury II Fund, Class B | 2,170,293 | ||||
| U.S. TREASURY BILL — 3.65% | ||||||
| $ | 2,000,000 | 1.14% due 10-7-04 | 1,999,488 | |||
| TOTAL SHORT-TERM INVESTMENTS | 4,169,781 | |||||
| (COST $4,169,781) | ||||||
| TOTAL INVESTMENTS — 101.08% | 55,309,926 | |||||
| (COST $53,410,701) | ||||||
| Liabilities, less Other Assets — (1.08%) | (593,403 | ) | ||||
| TOTAL NET ASSETS — 100.00% | $ | 54,716,523 | ||||
| * | Non-income producing security |
| ADR — American Depository Receipt | |
See accompanying Notes to Financial Statements.
| 21 | |
| BUFFALO |
| MICRO CAP FUND |
SCHEDULE OF INVESTMENTS
September 30, 2004 (unaudited)
| SHARES | MARKET VALUE | |||
| COMMON STOCKS — 78.63% | ||||
| CONSUMER DISCRETIONARY — 33.31% | ||||
| 30,700 | 1-800-FLOWERS.COM, Inc.* | $ | 254,810 | |
| 13,600 | Brookstone, Inc.* | 256,904 | ||
| 19,750 | Cache, Inc.* | 296,250 | ||
| 21,100 | Coachmen Industries, Inc. | 332,958 | ||
| 26,850 | Coldwater Creek Inc.* | 560,360 | ||
| 29,200 | Concorde Career Colleges, Inc.* | 448,804 | ||
| 28,100 | Digital Theater Systems Inc.* | 512,825 | ||
| 21,800 | Isle of Capri Casinos, Inc.* | 422,266 | ||
| 30,000 | J. Jill Group Inc.* | 595,500 | ||
| 13,100 | LIFE TIME FITNESS, Inc.* | 336,146 | ||
| 12,500 | Lodgian, Inc.* | 123,750 | ||
| 17,000 | MarineMax, Inc.* | 382,840 | ||
| 20,100 | Marine Products Corp. | 361,800 | ||
| 33,000 | McCormick & Schmick’s Seafood Restaurants, Inc.* | 395,670 | ||
| 18,300 | National R.V. Holdings, Inc.* | 227,469 | ||
| 23,700 | Nutraceutical International Corp.* | 333,933 | ||
| 26,400 | Orient-Express Hotel Ltd., Class A | 431,376 | ||
| 10,700 | Oxford Industries, Inc. | 398,575 | ||
| 12,200 | Sharper Image Corp.* | 261,690 | ||
| 14,800 | Steiner Leisure Ltd.* | 327,080 | ||
| 7,261,006 | ||||
| CONSUMER STAPLES — 1.03% | ||||
| 9,300 | Hansen Natural Corp.* | 224,316 | ||
| FINANCIALS — 5.38% | ||||
| 14,700 | Asset Acceptance Capital Corp.* | 249,459 | ||
| 16,000 | Boston Private Financial Holdings, Inc. | 399,360 | ||
| 8,800 | Portfolio Recovery Associates, Inc.* | 258,632 | ||
| 9,800 | PrivateBancorp, Inc. | 264,208 | ||
| 1,171,659 | ||||
| HEALTH CARE — 24.47% | ||||
| 9,300 | Able Laboratories, Inc.* | 178,188 | ||
| 19,100 | Cambrex Corp. | 419,245 | ||
| 37,000 | Cell Therapeutics, Inc.* | 253,820 | ||
| 19,500 | Closure Medical Corp.* | 277,680 | ||
| 18,500 | DUSA Pharmaceuticals, Inc.* | 212,380 | ||
| 22,800 | Enzon Pharmaceuticals, Inc.* | 363,660 | ||
| 13,500 | ICON PLC, ADR* | 444,285 | ||
| 36,900 | Ista Pharmaceuticals, Inc.* | 449,811 | ||
| 17,700 | LifeCell Corp.* | 177,000 | ||
| 55,800 | Lifecore Biomedical, Inc.* | 390,600 | ||
| 15,900 | Lifeline Systems, Inc.* | 388,278 | ||
| 3,500 | Meridian Bioscience, Inc. | 46,550 | ||
| 16,000 | Molecular Devices Corp.* | 377,120 | ||
| 14,800 | Neurochem, Inc.* | 253,968 | ||
| 29,000 | Orchid Biosciences, Inc.* | 232,870 | ||
| 42,300 | Quinton Cardiology Systems, Inc.* | 353,205 | ||
| 50,400 | Sonic Innovations, Inc.* | 229,824 | ||
| 45,200 | Urologix, Inc.* | 285,664 | ||
| 5,334,148 | ||||
| 22 | |
| SHARES OR FACE AMOUNT | MARKET VALUE | |||||
| INDUSTRIALS — 3.32% | ||||||
| 30,000 | Educate, Inc.* | $ | 353,700 | |||
| 15,400 | FirstService Corp.* | 370,986 | ||||
| 724,686 | ||||||
| INFORMATION TECHNOLOGY — 11.12% | ||||||
| 19,900 | Applied Films Corp.* | 358,399 | ||||
| 9,500 | Applied Signal Technology, Inc. | 303,905 | ||||
| 87,300 | Corillian Corp.* | 402,453 | ||||
| 34,400 | eCollege.com Inc.* | 331,960 | ||||
| 33,100 | Plexus Corp.* | 365,424 | ||||
| 46,900 | Stellent, Inc.* | 361,599 | ||||
| 66,000 | Wells-Gardner Electronics Corp. | 300,300 | ||||
| 2,424,040 | ||||||
| TOTAL COMMON STOCKS | 17,139,855 | |||||
| (COST $18,021,917) | ||||||
| SHORT-TERM INVESTMENTS — 21.60% | ||||||
| INVESTMENT COMPANY — 1.32% | ||||||
| 288,169 | SEI Daily Income Treasury II Fund, Class B | 288,169 | ||||
| U.S. TREASURY BILLS — 20.28% | ||||||
| $ | 400,000 | 1.14% due 10-7-04 | 399,898 | |||
| 1,189,000 | 0.97% due 10-21-04 | 1,188,107 | ||||
| 2,837,000 | 1.00% due 11-4-04 | 2,833,567 | ||||
| 4,421,572 | ||||||
| TOTAL SHORT-TERM INVESTMENTS | 4,709,741 | |||||
| (COST $4,709,741) | ||||||
| TOTAL INVESTMENTS — 100.23% | 21,849,596 | |||||
| (COST $22,731,658) | ||||||
| Liabilities, less Other Assets — (0.23)% | (51,210 | ) | ||||
| TOTAL NET ASSETS — 100.00% | $ | 21,798,386 | ||||
| * | Non-income producing security |
| ADR — American Depository Receipt | |
| PLC — Public Limited Company |
See accompanying Notes to Financial Statements.
| 23 | |
| BUFFALO |
| MID CAP FUND |
SCHEDULE OF INVESTMENTS
September 30, 2004 (unaudited)
| SHARES | MARKET VALUE | ||||
| COMMON STOCKS — 94.54% | |||||
| CONSUMER DISCRETIONARY — 29.70% | |||||
| 93,700 | Abercrombie & Fitch Co., Class A | $ | 2,951,550 | ||
| 31,800 | Autoliv, Inc. | 1,284,720 | |||
| 95,100 | Barnes & Noble, Inc.* | 3,518,700 | |||
| 58,700 | Career Education Corp.* | 1,668,841 | |||
| 47,100 | Chico’s FAS, Inc.* | 1,610,820 | |||
| 47,450 | CVS Corp. | 1,999,068 | |||
| 111,525 | Fairmont Hotels & Resorts Inc. | 3,046,863 | |||
| 59,600 | Furniture Brands International, Inc. | 1,494,768 | |||
| 23,450 | Harley-Davidson, Inc. | 1,393,868 | |||
| 73,100 | Harrah’s Entertainment, Inc. | 3,872,838 | |||
| 56,500 | International Game Technology | 2,031,175 | |||
| 34,875 | MGM MIRAGE* | 1,731,544 | |||
| 9,400 | Mohawk Industries, Inc.* | 746,266 | |||
| 73,500 | Royal Caribbean Cruises Ltd. | 3,204,600 | |||
| 89,700 | The Talbots, Inc. | 2,223,663 | |||
| 63,200 | Tiffany & Co. | 1,942,768 | |||
| 58,200 | Weight Watchers International, Inc.* | 2,259,324 | |||
| 42,100 | Williams-Sonoma, Inc.* | 1,580,855 | |||
| 58,400 | Winnebago Industries, Inc. | 2,022,976 | |||
| 40,585,207 | |||||
| FINANCIALS — 8.02% | |||||
| 102,475 | A.G. Edwards, Inc. | 3,547,685 | |||
| 173,400 | Janus Capital Group Inc. | 2,359,974 | |||
| 47,550 | Legg Mason, Inc. | 2,532,988 | |||
| 47,600 | Mellon Financial Corp. | 1,318,044 | |||
| 33,350 | Principal Financial Group, Inc. | 1,199,600 | |||
| 10,958,291 | |||||
| HEALTH CARE — 21.31% | |||||
| 53,600 | Barr Pharmaceuticals Inc.* | 2,220,648 | |||
| 29,900 | Biomet, Inc. | 1,401,712 | |||
| 170,000 | Elan Corp. PLC, ADR* | 3,978,000 | |||
| 35,000 | Invitrogen Corp.* | 1,924,650 | |||
| 113,600 | MedImmune, Inc.* | 2,692,320 | |||
| 60,100 | Millipore Corp.* | 2,875,785 | |||
| 92,900 | Pharmaceutical Product Development, Inc.* | 3,344,400 | |||
| 111,600 | Shire Pharmaceuticals Group PLC, ADR | 3,197,340 | |||
| 30,350 | Sigma-Aldrich Corp. | 1,760,300 | |||
| 68,800 | Waters Corp.* | 3,034,080 | |||
| 91,700 | Watson Pharmaceuticals, Inc.* | 2,701,482 | |||
| 29,130,717 | |||||
| INDUSTRIALS — 5.48% | |||||
| 76,700 | ChoicePoint Inc.* | 3,271,255 | |||
| 88,500 | DeVry, Inc.* | 1,832,835 | |||
| 48,325 | H&R Block, Inc. | 2,388,221 | |||
| 7,492,311 | |||||
| 24 | |
| SHARES OR | ||||||
| FACE AMOUNT | MARKET VALUE | |||||
| INFORMATION TECHNOLOGY — 30.03% | ||||||
| 122,100 | Altera Corp.* | $ | 2,389,497 | |||
| 180,990 | AU Optronics Corp., ADR | 2,265,995 | ||||
| 246,900 | BEA Systems, Inc.* | 1,706,079 | ||||
| 187,100 | The BISYS Group, Inc.* | 2,733,531 | ||||
| 127,750 | Cadence Design Systems, Inc.* | 1,665,860 | ||||
| 143,800 | Citrix Systems, Inc.* | 2,519,376 | ||||
| 39,575 | Diebold, Inc. | 1,848,152 | ||||
| 179,300 | Fairchild Semiconductor International, Inc.* | 2,540,681 | ||||
| 39,400 | Fiserv, Inc.* | 1,373,484 | ||||
| 73,400 | Garmin Ltd. | 3,174,550 | ||||
| 90,050 | Jabil Circuit, Inc.* | 2,071,150 | ||||
| 42,100 | KLA-Tencor Corp.* | 1,746,308 | ||||
| 140,200 | National Semiconductor Corp. | 2,171,698 | ||||
| 112,200 | Novellus Systems, Inc.* | 2,983,398 | ||||
| 135,600 | SanDisk Corp.* | 3,948,672 | ||||
| 84,600 | Scientific-Atlanta, Inc. | 2,192,832 | ||||
| 85,400 | Semtech Corp.* | 1,637,118 | ||||
| 63,400 | Take-Two Interactive Software, Inc.* | 2,082,690 | ||||
| 41,051,071 | ||||||
| TOTAL COMMON STOCKS | 129,217,597 | |||||
| (COST $121,103,273) | ||||||
| SHORT-TERM INVESTMENTS — 5.47% | ||||||
| INVESTMENT COMPANY — 2.87% | ||||||
| 3,919,264 | SEI Daily Income Treasury II Fund, Class B | 3,919,264 | ||||
| U.S. TREASURY BILL — 2.60% | ||||||
| $ | 3,550,000 | 1.14% due 10-7-04 | 3,549,092 | |||
| TOTAL SHORT-TERM INVESTMENTS | 7,468,356 | |||||
| (COST $7,468,356) | ||||||
| TOTAL INVESTMENTS — 100.01% | 136,685,953 | |||||
| (COST $128,571,629) | ||||||
| Liabilities, less Other Assets — (0.01)% | (7,668 | ) | ||||
| TOTAL NET ASSETS — 100.00% | $ | 136,678,285 | ||||
| * | Non-income producing security |
| ADR — American Depository Receipt | |
| PLC — Public Limited Company |
See accompanying Notes to Financial Statements.
| 25 | |
| BUFFALO SCIENCE & |
| TECHNOLOGY FUND |
SCHEDULE OF INVESTMENTS
September 30, 2004 (unaudited)
| SHARES | MARKET VALUE | ||||
| COMMON STOCKS — 94.46% | |||||
| HEALTH CARE — 43.91% | |||||
| 19,400 | Abbott Laboratories | $ | 821,784 | ||
| 25,300 | American Medical Systems Holdings, Inc.* | 917,631 | |||
| 20,600 | AtheroGenics, Inc.* | 678,770 | |||
| 29,100 | Axcan Pharma Inc.* | 453,669 | |||
| 13,700 | Barr Pharmaceuticals Inc.* | 567,591 | |||
| 18,800 | Baxter International Inc. | 604,608 | |||
| 39,600 | Bayer AG, ADR | 1,086,228 | |||
| 4,300 | Biomet, Inc. | 201,584 | |||
| 21,200 | Bristol-Myers Squibb Co. | 501,804 | |||
| 25,000 | Cambrex Corp. | 548,750 | |||
| 80,700 | Cell Therapeutics, Inc.* | 553,602 | |||
| 17,500 | Charles River Laboratories International, Inc.* | 801,500 | |||
| 23,600 | Covance Inc.* | 943,292 | |||
| 48,900 | DUSA Pharmaceuticals, Inc.* | 561,372 | |||
| 47,500 | Elan Corp. PLC, ADR* | 1,111,500 | |||
| 40,100 | Enzon Pharmaceuticals, Inc.* | 639,595 | |||
| 9,400 | Fisher Scientific International Inc.* | 548,302 | |||
| 15,100 | Given Imaging Ltd.* | 580,595 | |||
| 10,150 | INAMED Corp.* | 483,851 | |||
| 6,000 | Invitrogen Corp.* | 329,940 | |||
| 11,600 | Johnson & Johnson | 653,428 | |||
| 9,400 | Medicis Pharmaceutical Corp., Class A | 366,976 | |||
| 35,700 | MedImmune, Inc.* | 846,090 | |||
| 9,450 | Merck & Co. Inc. | 311,850 | |||
| 14,300 | Millipore Corp.* | 684,255 | |||
| 13,000 | OSI Pharmaceuticals, Inc.* | 798,980 | |||
| 24,700 | Pfizer Inc. | 755,820 | |||
| 24,800 | Pharmaceutical Product Development, Inc.* | 892,800 | |||
| 486 | Sanofi-Aventis, ADR | 17,792 | |||
| 36,700 | Schering-Plough Corp. | 699,502 | |||
| 32,900 | Shire Pharmaceuticals Group PLC, ADR | 942,585 | |||
| 10,700 | Sigma-Aldrich Corp. | 620,600 | |||
| 29,100 | Sybron Dental Specialties, Inc.* | 863,979 | |||
| 11,900 | Teva Pharmaceutical Industries Ltd., ADR | 308,805 | |||
| 12,700 | Warner Chilcott PLC, ADR | 705,739 | |||
| 23,200 | Waters Corp.* | 1,023,120 | |||
| 22,000 | Watson Pharmaceuticals, Inc.* | 648,120 | |||
| 12,900 | Wyeth | 482,460 | |||
| 2,500 | Zimmer Holdings, Inc.* | 197,600 | |||
| 24,756,469 | |||||
| INFORMATION TECHNOLOGY — 48.43% | |||||
| 94,500 | Adaptec, Inc.* | 718,200 | |||
| 22,000 | Agilent Technologies, Inc.* | 474,540 | |||
| 33,850 | Altera Corp.* | 662,445 | |||
| 23,100 | Analog Devices, Inc. | 895,818 | |||
| 35,800 | Applied Materials, Inc.* | 590,342 | |||
| 73,845 | AU Optronics Corp., ADR | 924,539 | |||
| 146,400 | BEA Systems, Inc.* | 1,011,624 | |||
| 42,450 | Cadence Design Systems, Inc.* | 553,548 | |||
| 40,700 | Cisco Systems, Inc.* | 736,670 | |||
| 55,100 | Citrix Systems, Inc.* | 965,352 | |||
| 15,050 | Dell Inc.* | 535,780 | |||
| 13,100 | Diebold, Inc. | 611,770 | |||
| 62,500 | EMC Corp.* | 721,250 | |||
| 63,400 | Fairchild Semiconductor International, Inc.* | 898,378 | |||
| 56,600 | FileNET Corp.* | 988,236 | |||
| 26 | |
| SHARES OR | ||||||
| FACE AMOUNT | MARKET VALUE | |||||
| INFORMATION TECHNOLOGY — 48.43%(Continued) | ||||||
| 55,150 | Intel Corp. | $ | 1,106,309 | |||
| 28,300 | Jabil Circuit, Inc.* | 650,900 | ||||
| 17,200 | KLA-Tencor Corp.* | 713,456 | ||||
| 24,050 | Lam Research Corp.* | 526,214 | ||||
| 14,650 | Maxim Integrated Products, Inc. | 619,548 | ||||
| 24,000 | Mentor Corp. | 808,320 | ||||
| 30,300 | Microchip Technology Inc. | 813,252 | ||||
| 52,150 | Micron Technology, Inc.* | 627,365 | ||||
| 34,500 | Microsoft Corp. | 953,925 | ||||
| 49,500 | MKS Instruments, Inc.* | 758,340 | ||||
| 18,000 | Molex Inc. | 536,760 | ||||
| 20,350 | National Instruments Corp. | 615,994 | ||||
| 42,900 | National Semiconductor Corp. | 664,521 | ||||
| 67,600 | Nokia Oyj, ADR | 927,472 | ||||
| 32,200 | Novellus Systems, Inc.* | 856,198 | ||||
| 74,300 | Plexus Corp.* | 820,272 | ||||
| 44,800 | SanDisk Corp.* | 1,304,576 | ||||
| 19,400 | Scientific-Atlanta, Inc. | 502,848 | ||||
| 43,600 | Semtech Corp.* | 835,812 | ||||
| 33,700 | Texas Instruments Inc. | 717,136 | ||||
| 54,000 | Wind River Systems, Inc.* | 658,800 | ||||
| 27,306,510 | ||||||
| MATERIALS — 2.12% | ||||||
| 33,000 | Cabot Microelectronics Corp.* | 1,196,250 | ||||
| TOTAL COMMON STOCKS | 53,259,229 | |||||
| (COST $49,417,437) | ||||||
| SHORT-TERM INVESTMENTS — 5.09% | ||||||
| INVESTMENT COMPANY — 1.28% | ||||||
| 723,447 | SEI Daily Income Treasury II Fund, Class B | 723,447 | ||||
| U.S. TREASURY BILLS — 3.81% | ||||||
| $ | 914,000 | 1.14% due 10-7-04 | 913,766 | |||
| 1,236,000 | 0.97% due 10-21-04 | 1,235,072 | ||||
| 2,148,838 | ||||||
| TOTAL SHORT-TERM INVESTMENTS | 2,872,285 | |||||
| (COST $2,872,285) | ||||||
| TOTAL INVESTMENTS — 99.55% | 56,131,514 | |||||
| (COST $52,289,722) | ||||||
| Other Assets, less Liabilities — 0.45% | 251,447 | |||||
| TOTAL NET ASSETS — 100.00% | $ | 56,382,961 | ||||
| * | Non-income producing security |
| ADR — American Depository Receipt | |
| PLC — Public Limited Company |
See accompanying Notes to Financial Statements.
| 27 | |
| BUFFALO |
| SMALL CAP FUND |
SCHEDULE OF INVESTMENTS
September 30, 2004 (unaudited)
| SHARES | MARKET VALUE | |||
| COMMON STOCKS — 96.17% | ||||
| CONSUMER DISCRETIONARY — 37.40% | ||||
| 587,200 | Abercrombie & Fitch Co., Class A | $ | 18,496,800 | |
| 924,968 | American Eagle Outfitters, Inc. | 34,085,071 | ||
| 1,400,493 | Ameristar Casinos, Inc.a | 42,364,913 | ||
| 1,194,850 | Argosy Gaming Co.* | 46,838,120 | ||
| 1,368,800 | Borders Group, Inc. | 33,946,240 | ||
| 665,200 | Brunswick Corp. | 30,439,552 | ||
| 560,750 | Central Garden & Pet Co.* | 17,170,165 | ||
| 1,035,000 | Christopher & Banks Corp. | 16,570,350 | ||
| 604,363 | Coachmen Industries, Inc. | 9,536,848 | ||
| 424,350 | Ethan Allen Interiors Inc. | 14,746,163 | ||
| 624,900 | FirstService Corp.* | 15,053,841 | ||
| 694,882 | Gentex Corp. | 24,411,205 | ||
| 1,461,750 | Isle of Capri Casinos, Inc.* | 28,314,098 | ||
| 1,253,040 | J. Jill Group Inc.a* | 24,872,844 | ||
| 1,268,800 | Monaco Coach Corp. | 27,469,520 | ||
| 996,750 | Orient-Express Hotel Ltd., Class A | 16,286,895 | ||
| 587,325 | Oxford Industries, Inc. | 21,877,856 | ||
| 982,830 | Penn National Gaming, Inc.* | 39,706,332 | ||
| 1,130,187 | Rent-A-Center, Inc.* | 29,226,636 | ||
| 957,800 | Royal Caribbean Cruises Ltd. | 41,760,080 | ||
| 198,646 | VCA Antech, Inc.* | 4,098,067 | ||
| 819,900 | WCI Communities, Inc.* | 19,103,670 | ||
| 1,538,250 | WMS Industries Inc.a* | 39,517,642 | ||
| 879,100 | Zale Corp.* | 24,702,710 | ||
| 620,595,618 | ||||
| CONSUMER STAPLES — 2.82% | ||||
| 1,114,500 | Performance Food Group Co.* | 26,413,650 | ||
| 764,928 | United Natural Foods, Inc.* | 20,347,085 | ||
| 46,760,735 | ||||
| FINANCIALS — 6.17% | ||||
| 431,050 | A.G. Edwards, Inc. | 14,922,951 | ||
| 544,000 | Boston Private Financial Holdings, Inc. | 13,578,240 | ||
| 317,850 | Gabelli Asset Management Inc., Class A | 13,619,872 | ||
| 971,050 | The Phoenix Companies, Inc. | 10,118,341 | ||
| 709,875 | Raymond James Financial, Inc. | 17,122,185 | ||
| 429,250 | Wilmington Trust Corp. | 15,543,143 | ||
| 878,250 | W.P. Stewart & Co., Ltd. | 17,556,218 | ||
| 102,460,950 | ||||
| HEALTH CARE — 28.61% | ||||
| 948,680 | American Medical Systems Holdings, Inc.* | 34,408,624 | ||
| 1,061,400 | Axcan Pharma Inc.* | 16,547,226 | ||
| 1,208,050 | Cambrex Corp. | 26,516,697 | ||
| 799,475 | Charles River Laboratories International, Inc.* | 36,615,955 | ||
| 1,055,550 | Covance Inc.* | 42,190,334 | ||
| 2,050,000 | Elan Corp. PLC, ADR* | 47,970,000 | ||
| 1,131,550 | First Horizon Pharmaceutical Corp.* | 22,642,315 | ||
| 430,875 | Fisher Scientific International Inc.* | 25,132,939 | ||
| 702,626 | INAMED Corp.* | 33,494,181 | ||
| 432,000 | Medicis Pharmaceutical Corp., Class A | 16,865,280 | ||
| 1,434,900 | Mentor Corp. | 48,327,432 | ||
| 1,448,153 | Pharmaceutical Product Development, Inc.* | 52,133,508 | ||
| 399,275 | Sybron Dental Specialties, Inc.* | 11,854,475 | ||
| 1,080,069 | Warner Chilcott PLC, ADR | 60,019,434 | ||
| 474,718,400 | ||||
| 28 | |
| SHARES OR | ||||||
| FACE AMOUNT | MARKET VALUE | |||||
| INDUSTRIALS — 4.36% | ||||||
| 374,550 | Bright Horizons Family Solutions, Inc.* | $ | 20,334,319 | |||
| 1,167,700 | DeVry, Inc.* | 24,183,067 | ||||
| 958,250 | Educate, Inc.* | 11,297,768 | ||||
| 459,700 | ITT Educational Services, Inc.* | 16,572,185 | ||||
| 72,387,339 | ||||||
| INFORMATION TECHNOLOGY — 14.67% | ||||||
| 1,928,250 | Adaptec, Inc.* | 14,654,700 | ||||
| 1,993,150 | Fairchild Semiconductor International, Inc.* | 28,242,935 | ||||
| 1,732,500 | FileNET Corp.* | 30,249,450 | ||||
| 943,600 | Lam Research Corp.* | 20,645,968 | ||||
| 2,273,400 | Micrel, Inc.* | 23,666,094 | ||||
| 1,318,993 | MKS Instruments, Inc.* | 20,206,973 | ||||
| 529,200 | National Instruments Corp. | 16,018,884 | ||||
| 1,779,522 | Plexus Corp.* | 19,645,923 | ||||
| 852,200 | SanDisk Corp.* | 24,816,064 | ||||
| 1,211,000 | Semtech Corp.* | 23,214,870 | ||||
| 1,816,417 | Wind River Systems, Inc.* | 22,160,287 | ||||
| 243,522,148 | ||||||
| MATERIALS — 2.14% | ||||||
| 978,500 | Cabot Mircoelectronics Corp.* | 35,470,625 | ||||
| TOTAL COMMON STOCKS | 1,595,915,815 | |||||
| (COST $1,257,927,929) | ||||||
| SHORT-TERM INVESTMENTS — 1.68% | ||||||
| INVESTMENT COMPANY — 0.06% | ||||||
| 1,029,540 | SEI Daily Income Treasury II Fund, Class B | 1,029,540 | ||||
| U.S. TREASURY BILLS — 1.62% | ||||||
| $ | 3,197,000 | 1.14% due 10-7-04 | 3,196,182 | |||
| 3,815,000 | 1.00% due 10-14-04 | 3,812,917 | ||||
| 19,807,000 | 1.00% due 11-4-04 | 19,783,030 | ||||
| 26,792,129 | ||||||
| TOTAL SHORT-TERM INVESTMENTS | 27,821,669 | |||||
| (COST $27,821,669) | ||||||
| TOTAL INVESTMENTS — 97.85% | 1,623,737,484 | |||||
| (COST $1,285,749,598) | ||||||
| Other Assets, less Liabilities — 2.15% | 35,679,798 | |||||
| TOTAL NET ASSETS — 100.00% | $ | 1,659,417,282 | ||||
| a | Affiliated company; the Fund owns 5% or more of the outstanding voting securities of the issuer. See Note 6. |
| * | Non-income producing security |
| ADR — American Depository Receipt | |
| PLC — Public Limited Company |
See accompanying Notes to Financial Statements.
| 29 | |
| BUFFALO |
| USA GLOBAL FUND |
SCHEDULE OF INVESTMENTS
September 30, 2004 (unaudited)
| SHARES | MARKET VALUE | ||||
| COMMON STOCKS — 92.93% | |||||
| CONSUMER DISCRETIONARY — 9.93% | |||||
| 41,700 | Gentex Corp. | $ | 1,464,921 | ||
| 29,800 | Johnson Controls, Inc. | 1,692,938 | |||
| 33,300 | Lear Corp. | 1,813,185 | |||
| 83,800 | McDonald’s Corp. | 2,348,914 | |||
| 15,900 | Tempur-Pedic International Inc.* | 238,341 | |||
| 31,100 | Tiffany & Co. | 956,014 | |||
| 8,514,313 | |||||
| CONSUMER STAPLES — 15.58% | |||||
| 46,700 | The Coca-Cola Co. | 1,870,335 | |||
| 32,300 | Colgate-Palmolive Co. | 1,459,314 | |||
| 41,700 | The Gillette Co. | 1,740,558 | |||
| 46,100 | H.J. Heinz Co. | 1,660,522 | |||
| 36,100 | Kimberly-Clark Corp. | 2,331,699 | |||
| 77,400 | Sara Lee Corp. | 1,769,364 | |||
| 39,900 | Wm. Wrigley Jr. Co. | 2,526,069 | |||
| 13,357,861 | |||||
| ENERGY — 6.23% | |||||
| 17,000 | ChevronTexaco Corp. | 911,880 | |||
| 18,100 | Exxon Mobil Corp. | 874,773 | |||
| 50,650 | Halliburton Co. | 1,706,399 | |||
| 15,900 | Kerr-McGee Corp. | 910,275 | |||
| 21,900 | Unocal Corp. | 941,700 | |||
| 5,345,027 | |||||
| FINANCIALS — 5.32% | |||||
| 42,900 | AFLAC Inc. | 1,682,109 | |||
| 42,400 | American International Group, Inc. | 2,882,776 | |||
| 4,564,885 | |||||
| HEALTH CARE — 28.54% | |||||
| 30,400 | Abbott Laboratories | 1,287,744 | |||
| 63,000 | Applera Corp. — Applied Biosystems Group | 1,188,810 | |||
| 54,700 | Baxter International Inc. | 1,759,152 | |||
| 88,900 | Bristol-Myers Squibb Co. | 2,104,263 | |||
| 40,200 | Johnson & Johnson | 2,264,466 | |||
| 52,400 | Mentor Corp. | 1,764,832 | |||
| 34,000 | Millipore Corp.* | 1,626,900 | |||
| 85,400 | Pfizer Inc. | 2,613,240 | |||
| 99,100 | Schering-Plough Corp. | 1,888,846 | |||
| 33,900 | Sigma-Aldrich Corp. | 1,966,200 | |||
| 20,100 | Sybron Dental Specialties, Inc.* | 596,769 | |||
| 50,800 | Waters Corp.* | 2,240,280 | |||
| 52,900 | Wyeth | 1,978,460 | |||
| 15,030 | Zimmer Holdings, Inc.* | 1,187,971 | |||
| 24,467,933 | |||||
| INDUSTRIALS — 1.96% | |||||
| 7,700 | Getty Images, Inc.* | 425,810 | |||
| 29,400 | Teleflex Inc. | 1,249,500 | |||
| 1,675,310 | |||||
| 30 | |
| SHARES OR | ||||||
| FACE AMOUNT | MARKET VALUE | |||||
| INFORMATION TECHNOLOGY — 23.38% | ||||||
| 53,600 | Agilent Technologies, Inc.* | $ | 1,156,152 | |||
| 47,300 | Analog Devices, Inc. | 1,834,294 | ||||
| 87,802 | Applied Materials, Inc.* | 1,447,855 | ||||
| 77,500 | Cisco Systems, Inc.* | 1,402,750 | ||||
| 99,700 | Fairchild Semiconductor International, Inc.* | 1,412,749 | ||||
| 73,200 | GTECH Holdings Corp. | 1,853,424 | ||||
| 93,400 | Intel Corp. | 1,873,604 | ||||
| 25,200 | KLA-Tencor Corp.* | 1,045,296 | ||||
| 110,100 | Micron Technology, Inc.* | 1,324,503 | ||||
| 94,200 | Microsoft Corp. | 2,604,630 | ||||
| 28,800 | Molex Inc. | 858,816 | ||||
| 64,600 | Motorola, Inc. | 1,165,384 | ||||
| 24,300 | National Instruments Corp. | 735,561 | ||||
| 86,200 | National Semiconductor Corp. | 1,335,238 | ||||
| 20,050,256 | ||||||
| MATERIALS — 1.99% | ||||||
| 47,105 | Cabot Microelectronics Corp.* | 1,707,556 | ||||
| TOTAL COMMON STOCKS | 79,683,141 | |||||
| (COST $70,320,025) | ||||||
| SHORT-TERM INVESTMENTS — 6.97% | ||||||
| INVESTMENT COMPANY — 0.22% | ||||||
| 192,437 | SEI Daily Income Treasury II Fund, Class B | 192,437 | ||||
| U.S. TREASURY BILLS — 6.75% | ||||||
| $ | 2,330,000 | 1.14% due 10-7-04 | 2,329,404 | |||
| 1,340,000 | 1.00% due 10-14-04 | 1,339,255 | ||||
| 2,119,000 | 0.97% due 10-21-04 | 2,117,408 | ||||
| 5,786,067 | ||||||
| TOTAL SHORT-TERM INVESTMENTS | 5,978,504 | |||||
| (COST $5,978,504) | ||||||
| TOTAL INVESTMENTS — 99.90% | 85,661,645 | |||||
| (COST $76,298,529) | ||||||
| Other Assets, less Liabilities — 0.10% | 82,599 | |||||
| TOTAL NET ASSETS — 100.00% | $ | 85,744,244 | ||||
* Non-income producing security
See accompanying Notes to Financial Statements.
| 31 | |
| STATEMENTS OF ASSETS |
| AND LIABILITIES |
| BUFFALO | BUFFALO | BUFFALO | BUFFALO | |||||||||
| BALANCED | HIGH YIELD | LARGE CAP | MICRO CAP | |||||||||
| FUND | FUND | FUND | FUND | |||||||||
| ASSETS: | ||||||||||||
| Investments in securities, at cost: | ||||||||||||
| Investments in securities of unaffiliated issuers | $ | 120,093,501 | $ | 313,950,104 | $ | 53,410,701 | $ | 22,731,658 | ||||
| Investments in securities of affiliated issuers | — | — | — | — | ||||||||
| Total investments, at cost | $ | 120,093,501 | $ | 313,950,104 | $ | 53,410,701 | $ | 22,731,658 | ||||
| Investments in securities, at value: | ||||||||||||
| Investments in securities of unaffiliated issuers | $ | 125,811,283 | $ | 328,438,740 | $ | 55,309,926 | $ | 21,849,596 | ||||
| Investments in securities of affiliated issuers | — | — | — | — | ||||||||
| Total investments, at value | 125,811,283 | 328,438,740 | 55,309,926 | 21,849,596 | ||||||||
| Cash | 8,957 | — | — | — | ||||||||
| Receivables: | ||||||||||||
| Investments sold | — | 533,778 | — | — | ||||||||
| Fund shares sold | 341,298 | 259,641 | 36,257 | 17,425 | ||||||||
| Dividends | 89,823 | 47,064 | 36,203 | — | ||||||||
| Interest | 933,540 | 3,810,532 | 927 | 276 | ||||||||
| Other assets | 20,933 | 20,543 | 13,339 | 17,936 | ||||||||
| Total assets | 127,205,834 | 333,110,298 | 55,396,652 | 21,885,233 | ||||||||
| LIABILITIES: | ||||||||||||
| Payables: | ||||||||||||
| Investments purchased | 2,487,500 | 9,409,700 | 633,926 | 53,996 | ||||||||
| Fund shares purchased | 13,891 | 89,605 | — | 4,705 | ||||||||
| Management fees | 101,412 | 264,709 | 45,660 | 26,764 | ||||||||
| Accrued expenses | 4,370 | 2,025 | 543 | 1,382 | ||||||||
| Total liabilities | 2,607,173 | 9,766,039 | 680,129 | 86,847 | ||||||||
| NET ASSETS | $ | 124,598,661 | $ | 323,344,259 | $ | 54,716,523 | $ | 21,798,386 | ||||
| NET ASSETS CONSIST OF: | ||||||||||||
| Capital (capital stock and paid-in capital) | $ | 123,630,612 | $ | 312,135,422 | $ | 56,048,260 | $ | 22,606,970 | ||||
| Undistributed net investment income (loss) | 47,799 | (421,018 | ) | (7,401 | ) | (73,108 | ) | |||||
| Undistributed net realized gain (loss) from investment transactions | (4,797,532 | ) | (2,858,781 | ) | (3,223,561 | ) | 146,586 | |||||
| Net unrealized appreciation (depreciation) of investments | 5,717,782 | 14,488,636 | 1,899,225 | (882,062 | ) | |||||||
| NET ASSETS APPLICABLE | ||||||||||||
| TO OUTSTANDING SHARES | $ | 124,598,661 | $ | 323,344,259 | $ | 54,716,523 | $ | 21,798,386 | ||||
| Capital shares, $1.00 par value: | ||||||||||||
| Authorized | 25,000,000 | 100,000,000 | 10,000,000 | Unlimited | ||||||||
| Outstanding | 12,903,930 | 28,758,613 | 3,282,561 | 2,261,526 | ||||||||
| NET ASSET VALUE PER SHARE | $ | 9.66 | $ | 11.24 | $ | 16.67 | $ | 9.64 | ||||
See accompanying Notes to Financial Statements.
| 32 | |
| BUFFALO | |||||||||||||
| BUFFALO | SCIENCE & | BUFFALO | BUFFALO | ||||||||||
| MID CAP | TECHNOLOGY | SMALL CAP | USA GLOBAL | ||||||||||
| FUND | FUND | FUND | FUND | ||||||||||
| $ | 128,571,629 | $ | 52,289,722 | $ | 1,203,608,510 | $ | 76,298,529 | ||||||
| — | — | 82,141,088 | — | ||||||||||
| $ | 128,571,629 | $ | 52,289,722 | $ | 1,285,749,598 | $ | 76,298,529 | ||||||
| $ | 136,685,953 | $ | 56,131,514 | $ | 1,516,962,085 | $ | 85,661,645 | ||||||
| — | — | 106,775,399 | — | ||||||||||
| 136,685,953 | 56,131,514 | 1,623,737,484 | 85,661,645 | ||||||||||
| — | — | — | — | ||||||||||
| — | 144,595 | 71,168,916 | — | ||||||||||
| 108,228 | 146,806 | 1,868,695 | 66,151 | ||||||||||
| 41,015 | 17,292 | 482,020 | 106,483 | ||||||||||
| 1,737 | 614 | 615 | 321 | ||||||||||
| 13,977 | 10,555 | 36,505 | 14,808 | ||||||||||
| 136,850,910 | 56,451,376 | 1,697,294,235 | 85,849,408 | ||||||||||
| — | — | 6,655,964 | — | ||||||||||
| 60,470 | 21,712 | 29,847,453 | 34,017 | ||||||||||
| 110,297 | 45,628 | 1,355,377 | 70,382 | ||||||||||
| 1,858 | 1,075 | 18,159 | 765 | ||||||||||
| 172,625 | 68,415 | 37,876,953 | 105,164 | ||||||||||
| $ | 136,678,285 | $ | 56,382,961 | $ | 1,659,417,282 | $ | 85,744,244 | ||||||
| $ | 127,941,428 | $ | 53,707,272 | $ | 1,287,855,809 | $ | 78,525,936 | ||||||
| (295,610 | ) | (103,822 | ) | (2,151,339 | ) | 74,428 | |||||||
| 918,143 | (1,062,281 | ) | 35,724,926 | (2,219,236 | ) | ||||||||
| 8,114,324 | 3,841,792 | 337,987,886 | 9,363,116 | ||||||||||
| $ | 136,678,285 | $ | 56,382,961 | $ | 1,659,417,282 | $ | 85,744,244 | ||||||
| Unlimited | Unlimited | 100,000,000 | 10,000,000 | ||||||||||
| 11,915,774 | 5,384,925 | 66,817,906 | 4,647,351 | ||||||||||
| $ | 11.47 | $ | 10.47 | $ | 24.83 | $ | 18.45 | ||||||
| 33 | |
| STATEMENTS |
| OF OPERATIONS |
| BUFFALO | BUFFALO | BUFFALO | BUFFALO | |||||||||
| BALANCED | HIGH YIELD | LARGE CAP | MICRO CAP | |||||||||
| FUND | FUND | FUND | FUND(1) | |||||||||
| INVESTMENT INCOME: | ||||||||||||
| Interest | $ | 1,549,834 | $ | 6,807,792 | $ | 22,880 | $ | 20,063 | ||||
| Dividends: | ||||||||||||
| Dividends from securities of unaffiliated issuers | 683,566 | 703,476 | 314,901 | 6,635 | ||||||||
| Dividends from securities of affiliated issuers | — | — | — | — | ||||||||
| Foreign tax withheld | (527 | ) | (5,396 | ) | (4,034 | ) | — | |||||
| Total investment income | 2,232,873 | 7,505,872 | 333,747 | 26,698 | ||||||||
| EXPENSES: | ||||||||||||
| Management fees | 514,776 | 1,605,836 | 282,648 | 89,280 | ||||||||
| Registration fees | 15,493 | 30,796 | 13,398 | 10,272 | ||||||||
| Other | 1,602 | 5,472 | 1,398 | 254 | ||||||||
| Total expenses | 531,871 | 1,642,104 | 297,444 | 99,806 | ||||||||
| Net investment income (loss) | 1,701,002 | 5,863,768 | 36,303 | (73,108 | ) | |||||||
| NET REALIZED AND UNREALIZED | ||||||||||||
| GAIN (LOSS) ON INVESTMENTS: | ||||||||||||
| Net realized gain (loss) from investment transactions | 725,720 | 1,133,328 | 909,859 | 146,586 | ||||||||
| Net unrealized appreciation (depreciation) during | ||||||||||||
| the period on investments | 2,622,267 | (233,517 | ) | (3,821,627 | ) | (882,062 | ) | |||||
| Net realized and unrealized gain (loss) on investments | 3,347,987 | 899,811 | (2,911,768 | ) | (735,476 | ) | ||||||
| Net increase (decrease) in net assets resulting from operations | $ | 5,048,989 | $ | 6,763,579 | $ | (2,875,465 | ) | $ | (808,584 | ) | ||
(1)Commenced operations on May 21, 2004.
See accompanying Notes to Financial Statements.
| 34 | |
| BUFFALO | ||||||||||||
| BUFFALO | SCIENCE & | BUFFALO | BUFFALO | |||||||||
| MID CAP | TECHNOLOGY | SMALL CAP | USA GLOBAL | |||||||||
| FUND | FUND | FUND | FUND | |||||||||
| $ | 50,884 | $ | 23,030 | $ | 433,371 | $ | 25,609 | |||||
| 362,604 | 122,041 | 6,544,823 | 519,163 | |||||||||
| — | — | 525,185 | — | |||||||||
| (10,238 | ) | (5,026 | ) | (12,961 | ) | — | ||||||
| 403,250 | 140,045 | 7,490,418 | 544,772 | |||||||||
| 681,410 | 232,280 | 8,376,197 | 422,243 | |||||||||
| 15,569 | 10,610 | 46,429 | 14,910 | |||||||||
| 1,881 | 977 | 24,574 | 1,754 | |||||||||
| 698,860 | 243,867 | 8,447,200 | 438,907 | |||||||||
| (295,610 | ) | (103,822 | ) | (956,782 | ) | 105,865 | ||||||
| (395,244 | ) | 250,569 | 20,462,595 | 1,871,597 | ||||||||
| (11,417,270 | ) | (2,473,507 | ) | (83,413,899 | ) | (5,104,035 | ) | |||||
| (11,812,514 | ) | (2,222,938 | ) | (62,951,304 | ) | (3,232,438 | ) | |||||
| $ | (12,108,124 | ) | $ | (2,326,760 | ) | $ | (63,908,086 | ) | $ | (3,126,573 | ) | |
| 35 | |
| STATEMENTS OF CHANGES |
| IN NET ASSETS |
| BUFFALO BALANCED FUND | ||||||
| SIX MONTHS ENDED SEPTEMBER 30, 2004 (UNAUDITED) | YEAR ENDED MARCH 31, 2004 | |||||
| OPERATIONS: | ||||||
| Net investment income (loss) | $ | 1,701,002 | $ | 1,454,730 | ||
| Net realized gain (loss) from investment transactions | 725,720 | 1,713,641 | ||||
| Net unrealized appreciation (depreciation) during the period on investments | 2,622,267 | 6,825,134 | ||||
| Net increase (decrease) in net assets resulting from operations | 5,048,989 | 9,993,505 | ||||
| DISTRIBUTIONS TO SHAREHOLDERS: | ||||||
| Net investment income | (1,731,201 | ) | (1,472,676 | ) | ||
| Net realized gain from investment transactions | — | — | ||||
| Total distributions to shareholders | (1,731,201 | ) | (1,472,676 | ) | ||
| CAPITAL SHARE TRANSACTIONS: | ||||||
| Shares sold | 60,933,269 | 56,140,863 | ||||
| Reinvested distributions | 1,054,623 | 1,037,470 | ||||
| 61,987,892 | 57,178,333 | |||||
| Shares repurchased(2) | (17,982,274 | ) | (6,473,482 | ) | ||
| Net increase (decrease) from capital share transactions | 44,005,618 | 50,704,851 | ||||
| Total increase (decrease) in net assets | 47,323,406 | 59,225,680 | ||||
| NET ASSETS: | ||||||
| Beginning of period | 77,275,255 | 18,049,575 | ||||
| End of period | $ | 124,598,661 | $ | 77,275,255 | ||
| Undistributed net investment income (loss) at end of period | $ | 47,799 | $ | 77,998 | ||
| Fund share transactions: | ||||||
| Shares sold | 6,438,952 | 6,383,755 | ||||
| Reinvested distributions | 110,221 | 117,571 | ||||
| 6,549,173 | 6,501,326 | |||||
| Shares repurchased | (1,887,617 | ) | (740,830 | ) | ||
| Net increase (decrease) in fund shares | 4,661,556 | 5,760,496 | ||||
(1) Commenced operations on May 21, 2004.
(2) Net of redemption fees of $75,693 and $302,566, respectively, for the
Buffalo High Yield Fund and $53,583 for the Buffalo Micro Cap Fund.
See accompanying Notes to Financial Statements.
| 36 | |
| BUFFALO HIGH YIELD FUND | BUFFALO LARGE CAP FUND | BUFFALO MICRO CAP FUND | ||||||||||||
| SIX MONTHS ENDED SEPTEMBER 30, 2004 (UNAUDITED) | YEAR ENDED MARCH 31, 2004 | SIX MONTHS ENDED SEPTEMBER 30, 2004 (UNAUDITED) | YEAR ENDED MARCH 31, 2004 | PERIOD ENDED SEPTEMBER 30, 2004(1) (UNAUDITED) | ||||||||||
| $ | 5,863,768 | $ | 8,867,174 | $ | 36,303 | $ | 46,494 | $ | (73,108 | ) | ||||
| 1,133,328 | 5,850,378 | 909,859 | (221,826 | ) | 146,586 | |||||||||
| (233,517 | ) | 18,593,874 | (3,821,627 | ) | 14,815,819 | (882,062 | ) | |||||||
| 6,763,579 | 33,311,426 | (2,875,465 | ) | 14,640,487 | (808,584 | ) | ||||||||
| (6,646,565 | ) | (8,970,699 | ) | (88,189 | ) | (87,501 | ) | — | ||||||
| — | — | — | — | — | ||||||||||
| (6,646,565 | ) | (8,970,699 | ) | (88,189 | ) | (87,501 | ) | — | ||||||
| 34,774,628 | 221,234,911 | 4,128,784 | 17,459,598 | 25,446,328 | ||||||||||
| 5,011,777 | 7,319,856 | 87,183 | 86,552 | — | ||||||||||
| 39,786,405 | 228,554,767 | 4,215,967 | 17,546,150 | 25,446,328 | ||||||||||
| (40,682,564 | ) | (71,779,618 | ) | (4,192,795 | ) | (10,105,847 | ) | (2,839,358 | ) | |||||
| (896,159 | ) | 156,775,149 | 23,172 | 7,440,303 | 22,606,970 | |||||||||
| (779,145 | ) | 181,115,876 | (2,940,482 | ) | 21,993,289 | 21,798,386 | ||||||||
| 324,123,404 | 143,007,528 | 57,657,005 | 35,663,716 | — | ||||||||||
| $ | 323,344,259 | $ | 324,123,404 | $ | 54,716,523 | $ | 57,657,005 | $ | 21,798,386 | |||||
| $ | (421,018 | ) | $ | 361,779 | $ | (7,401 | ) | $ | 44,485 | $ | (73,108 | ) | ||
| 3,100,726 | 20,274,824 | 241,113 | 1,060,190 | 2,561,369 | ||||||||||
| 450,022 | 670,987 | 4,976 | 5,551 | — | ||||||||||
| 3,550,748 | 20,945,811 | 246,089 | 1,065,741 | 2,561,369 | ||||||||||
| (3,638,708 | ) | (6,598,568 | ) | (244,619 | ) | (622,622 | ) | (299,843 | ) | |||||
| (87,960 | ) | 14,347,243 | 1,470 | 443,119 | 2,261,526 | |||||||||
| 37 | |
| STATEMENTS OF CHANGES |
| IN NET ASSETS (Continued) |
| BUFFALO MID CAP FUND | ||||||
| SIX MONTHS ENDED SEPTEMBER 30, 2004 (UNAUDITED) | YEAR ENDED MARCH 31, 2004 | |||||
| OPERATIONS: | ||||||
| Net investment income (loss) | $ | (295,610 | ) | $ | (330,003 | ) |
| Net realized gain (loss) from investment transactions | (395,244 | ) | 2,458,904 | |||
| Net unrealized appreciation (depreciation) during the period on investments | (11,417,270 | ) | 29,310,695 | |||
| Net increase (decrease) in net assets resulting from operations | (12,108,124 | ) | 31,439,596 | |||
| DISTRIBUTIONS TO SHAREHOLDERS: | ||||||
| Net investment income | — | — | ||||
| Net realized gain from investment transactions | — | — | ||||
| Total distributions to shareholders | — | — | ||||
| CAPITAL SHARE TRANSACTIONS: | ||||||
| Shares sold | 84,259,008 | 63,034,132 | ||||
| Reinvested distributions | — | — | ||||
| 84,259,008 | 63,034,132 | |||||
| Shares repurchased | (47,542,576 | ) | (21,596,555 | ) | ||
| Net increase (decrease) from capital share transactions | 36,716,432 | 41,437,577 | ||||
| Total increase (decrease) in net assets | 24,608,308 | 72,877,173 | ||||
| NET ASSETS: | ||||||
| Beginning of period | 112,069,977 | 39,192,804 | ||||
| End of period | $ | 136,678,285 | $ | 112,069,977 | ||
| Undistributed net investment income (loss) at end of period | $ | (295,610 | ) | $ | — | |
| Fund share transactions: | ||||||
| Shares sold | 6,976,374 | 5,842,323 | ||||
| Reinvested distributions | — | — | ||||
| 6,976,374 | 5,842,323 | |||||
| Shares repurchased | (4,074,943 | ) | (2,028,876 | ) | ||
| Net increase (decrease) in fund shares | 2,901,431 | 3,813,447 | ||||
See accompanying Notes to Financial Statements.
| 38 | |
| BUFFALO SCIENCE & TECHNOLOGY FUND | BUFFALO SMALL CAP FUND | BUFFALO USA GLOBAL FUND | |||||||||||||||
| SIX MONTHS ENDED SEPTEMBER 30, 2004 (UNAUDITED) | YEAR ENDED MARCH 31, 2004 | SIX MONTHS ENDED SEPTEMBER 30, 2004 (UNAUDITED) | YEAR ENDED MARCH 31, 2004 | SIX MONTHS ENDED SEPTEMBER 30, 2004 UNAUDITED) | YEAR ENDED MARCH 31, 2004 | ||||||||||||
| $ | (103,822 | ) | $ | (142,380 | ) | $ | (956,782 | ) | $ | (6,755,394 | ) | $ | 105,865 | $ | 107,338 | ||
| 250,569 | 537,882 | 20,462,595 | 76,560,135 | 1,871,597 | 1,018,839 | ||||||||||||
| (2,473,507 | ) | 13,107,045 | (83,413,899 | ) | 651,289,740 | (5,104,035 | ) | 26,552,336 | |||||||||
| (2,326,760 | ) | 13,502,547 | (63,908,086 | ) | 721,094,481 | (3,126,573 | ) | 27,678,513 | |||||||||
| — | — | (1,194,557 | ) | — | (125,516 | ) | (12,570 | ) | |||||||||
| — | — | — | (12,901,507 | ) | — | — | |||||||||||
| — | — | (1,194,557 | ) | (12,901,507 | ) | (125,516 | ) | (12,570 | ) | ||||||||
| 32,216,870 | 14,872,544 | 288,687,377 | 751,553,406 | 15,543,830 | 26,796,069 | ||||||||||||
| — | — | 1,140,034 | 12,555,173 | 123,191 | 12,473 | ||||||||||||
| 32,216,870 | 14,872,544 | 289,827,411 | 764,108,579 | 15,667,021 | 26,808,542 | ||||||||||||
| (8,431,490 | ) | (7,988,156 | ) | (270,176,236 | ) | (453,066,699 | ) | (5,863,015 | ) | (36,016,963 | ) | ||||||
| 23,785,380 | 6,884,388 | 19,651,175 | 311,041,880 | 9,804,006 | (9,208,421 | ) | |||||||||||
| 21,458,620 | 20,386,935 | (45,451,468 | ) | 1,019,234,854 | 6,551,917 | 18,457,522 | |||||||||||
| 34,924,341 | 14,537,406 | 1,704,868,750 | 685,633,896 | 79,192,327 | 60,734,805 | ||||||||||||
| $ | 56,382,961 | $ | 34,924,341 | $ | 1,659,417,282 | $ | 1,704,868,750 | $ | 85,744,244 | $ | 79,192,327 | ||||||
| $ | (103,822 | ) | $ | — | $ | (2,151,339 | ) | $ | — | $ | 74,428 | $ | 94,079 | ||||
| 3,029,325 | 1,587,137 | 11,611,339 | 38,390,923 | 822,380 | 1,598,662 | ||||||||||||
| — | — | 45,895 | 575,661 | 6,416 | 780 | ||||||||||||
| 3,029,325 | 1,587,137 | 11,657,234 | 38,966,584 | 828,796 | 1,599,442 | ||||||||||||
| (808,445 | ) | (839,999 | ) | (11,187,213 | ) | (22,349,575 | ) | (311,281 | ) | (2,125,556 | ) | ||||||
| 2,220,880 | 747,138 | 470,021 | 16,617,009 | 517,515 | (526,114 | ) | |||||||||||
| 39 | |
| FINANCIAL HIGHLIGHTS |
| BUFFALO BALANCED FUND | ||||||||||||||||||
| Condensed data for a share of capital stock outstanding throughout the period. | SIX MONTHS ENDED SEPTEMBER 30, 2004 (UNAUDITED) | YEARS ENDED MARCH 31, | ||||||||||||||||
| 2004 | 2003 | 2002(1) | 2001 | 2000 | ||||||||||||||
| Net asset value, beginning of period | $ | 9.38 | $ | 7.27 | $ | 9.27 | $ | 8.97 | $ | 9.86 | $ | 8.87 | ||||||
| Income from investment operations: | ||||||||||||||||||
| Net investment income | 0.14 | 0.29 | 0.20 | 0.33 | 0.35 | 0.57 | ||||||||||||
| Net gains (losses) on securities | ||||||||||||||||||
| (both realized and unrealized) | 0.29 | 2.12 | (1.99 | ) | 0.23 | (0.79 | ) | 0.87 | ||||||||||
| Total from investment operations | 0.43 | 2.41 | (1.79 | ) | 0.56 | (0.44 | ) | 1.44 | ||||||||||
| Less distributions: | ||||||||||||||||||
| Dividends from net investment income | (0.15 | ) | (0.30 | ) | (0.21 | ) | (0.26 | ) | (0.45 | ) | (0.45 | ) | ||||||
| Distributions from capital gains | — | — | — | — | — | — | ||||||||||||
| Total distributions | (0.15 | ) | (0.30 | ) | (0.21 | ) | (0.26 | ) | (0.45 | ) | (0.45 | ) | ||||||
| Net asset value, end of period | $ | 9.66 | $ | 9.38 | $ | 7.27 | $ | 9.27 | $ | 8.97 | $ | 9.86 | ||||||
| Total return* | 4.56% | 33.50% | (19.32% | ) | 6.48% | (4.58% | ) | 16.78% | ||||||||||
| Ratios/Supplemental Data | ||||||||||||||||||
| Net assets, end of period (in millions) | $ | 125 | $ | 77 | $ | 18 | $ | 23 | $ | 28 | $ | 29 | ||||||
| Ratio of expenses to average net assets** | 1.03% | 1.05% | 1.10% | 1.08% | 1.06% | 1.05% | ||||||||||||
| Ratio of net investment income | ||||||||||||||||||
| to average net assets** | 3.30% | 3.47% | 2.60% | 2.71% | 3.72% | 5.82% | ||||||||||||
| Portfolio turnover rate | 19% | 32% | 45% | 12% | 68% | 33% | ||||||||||||
| * | Total return not annualized for periods less than one full year. |
| ** | Annualized for periods less than one full year. |
| (1) | As required, effective April 1, 2001, the Fund has adopted the provisions of the AICPA Audit and Accounting Guide for Investment Companies and began amortizing premiums on debt securities. The effect of this change for the period ended March 31, 2002 was to decrease net investment income per share by less than 1/2 of a cent, increase net realized and unrealized gains and losses per share by less than 1/2 of a cent, and the ratio of net investment income to average net assets per share was unchanged. Per share, ratios and supplemental data for periods prior to April 1, 2001 have not been restated to reflect this change in presentation. |
See accompanying Notes to Financial Statements.
| 40 | |
| FINANCIAL HIGHLIGHTS |
| BUFFALO HIGH YIELD FUND | ||||||||||||||||||
| Condensed data for a share of capital stock outstanding throughout the period. | SIX MONTHS ENDED SEPTEMBER 30, 2004 (UNAUDITED) | YEARS ENDED MARCH 31, | ||||||||||||||||
| 2004 | 2003 | 2002(1) | 2001 | 2000 | ||||||||||||||
| Net asset value, beginning of period | $ | 11.24 | $ | 9.86 | $ | 9.87 | $ | 10.24 | $ | 10.21 | $ | 10.74 | ||||||
| Income from investment operations: | ||||||||||||||||||
| Net investment income | 0.20 | 0.43 | 0.55 | 0.73 | 1.05 | 1.05 | ||||||||||||
| Net gains (losses) on securities | ||||||||||||||||||
| (both realized and unrealized) | 0.03 | 1.37 | 0.01 | (0.34 | ) | 0.02 | (0.54 | ) | ||||||||||
| Total from investment operations | 0.23 | 1.80 | 0.56 | 0.39 | 1.07 | 0.51 | ||||||||||||
| Less distributions: | ||||||||||||||||||
| Dividends from net investment income | (0.23 | ) | (0.43 | ) | (0.57 | ) | (0.76 | ) | (1.04 | ) | (1.04 | ) | ||||||
| Distributions from capital gains | — | — | — | — | — | — | ||||||||||||
| Total distributions | (0.23 | ) | (0.43 | ) | (0.57 | ) | (0.76 | ) | (1.04 | ) | (1.04 | ) | ||||||
| Paid-in capital from redemption fees | — | (2) | 0.01 | — | (2) | — | — | — | ||||||||||
| Net asset value, end of period | $ | 11.24 | $ | 11.24 | $ | 9.86 | $ | 9.87 | $ | 10.24 | $ | 10.21 | ||||||
| Total return* | 2.10% | 18.56% | 5.95% | 3.95% | 11.16% | 4.83% | ||||||||||||
| Ratios/Supplemental Data | ||||||||||||||||||
| Net assets, end of period (in millions) | $ | 323 | $ | 324 | $ | 143 | $ | 70 | $ | 42 | $ | 44 | ||||||
| Ratio of expenses to average net assets** | 1.02% | 1.03% | 1.03% | 1.04% | 1.04% | 1.04% | ||||||||||||
| Ratio of net investment income | ||||||||||||||||||
| to average net assets** | 3.65% | 3.89% | 6.24% | 7.63% | 10.30% | 9.05% | ||||||||||||
| Portfolio turnover rate | 20% | 51% | 33% | 36% | 54% | 16% | ||||||||||||
| * | Total return not annualized for periods less than one full year. |
| ** | Annualized for periods less than one full year. |
| (1) | As required, effective April 1, 2001, the Fund has adopted the provisions of the AICPA Audit and Accounting Guide for Investment Companies and began amortizing premiums on debt securities. The effect of this change for the period ended March 31, 2002 was to decrease net investment income per share by less than 1/2 of a cent, increase net realized and unrealized gains and losses per share by less than 1/2 of a cent, and decrease the ratio of net investment income to average net assets from 7.73% to 7.63%. Per share, ratios and supplemental data for periods prior to April 1, 2001 have not been restated to reflect this change in presentation. |
| (2) | Less than $0.01 per share |
See accompanying Notes to Financial Statements.
| 41 | |
| FINANCIAL HIGHLIGHTS |
| BUFFALO LARGE CAP FUND | ||||||||||||||||||
| Condensed data for a share of capital stock outstanding throughout the period. | SIX MONTHS ENDED SEPTEMBER 30, 2004 (UNAUDITED) | YEARS ENDED MARCH 31, | ||||||||||||||||
| 2004 | 2003 | 2002 | 2001 | 2000 | ||||||||||||||
| Net asset value, beginning of period | $ | 17.57 | $ | 12.57 | $ | 18.14 | $ | 17.99 | $ | 21.91 | $ | 16.95 | ||||||
| Income from investment operations: | ||||||||||||||||||
| Net investment income (loss) | 0.01 | 0.01 | 0.03 | (0.03 | ) | 0.04 | 0.01 | |||||||||||
| Net gains (losses) on securities | ||||||||||||||||||
| (both realized and unrealized) | (0.88 | ) | 5.02 | (5.60 | ) | 0.39 | (1.98 | ) | 5.21 | |||||||||
| Total from investment operations | (0.87 | ) | 5.03 | (5.57 | ) | 0.36 | (1.94 | ) | 5.22 | |||||||||
| Less distributions: | ||||||||||||||||||
| Dividends from net investment income | (0.03 | ) | (0.03 | ) | — | (0.01 | ) | (0.03 | ) | (0.01 | ) | |||||||
| Distributions from capital gains | — | — | — | (0.20 | ) | (1.95 | ) | (0.25 | ) | |||||||||
| Total distributions | (0.03 | ) | (0.03 | ) | — | (0.21 | ) | (1.98 | ) | (0.26 | ) | |||||||
| Net asset value, end of period | $ | 16.67 | $ | 17.57 | $ | 12.57 | $ | 18.14 | $ | 17.99 | $ | 21.91 | ||||||
| Total return* | (4.98 | %) | 40.05% | (30.71 | %) | 2.06% | (9.86 | %) | 31.07% | |||||||||
| Ratios/Supplemental Data | ||||||||||||||||||
| Net assets, end of period (in millions) | $ | 55 | $ | 58 | $ | 36 | $ | 54 | $ | 43 | $ | 34 | ||||||
| Ratio of expenses to average net assets** | 1.05% | 1.04% | 1.06% | 1.06% | 1.04% | 1.05% | ||||||||||||
| Ratio of net investment income (loss) | ||||||||||||||||||
| to average net assets** | 0.13% | 0.10% | 0.21% | (0.17% | ) | 0.17% | 0.04% | |||||||||||
| Portfolio turnover rate | 6% | 41% | 16% | 7% | 27% | 27% | ||||||||||||
| * | Total return not annualized for periods less than one full year. |
| ** | Annualized for periods less than one full year. |
See accompanying Notes to Financial Statements.
| 42 | |
| FINANCIAL HIGHLIGHTS |
| BUFFALO MICRO CAP FUND | |||
| Condensed data for a share of capital stock outstanding throughout the period. | PERIOD FROM MAY 21, 2004 (INCEPTION) TO SEPTEMBER 30, 2004 (UNAUDITED) | ||
| Net asset value, beginning of period | $ | 10.00 | |
| Income from investment operations: | |||
| Net investment loss | (0.03 | ) | |
| Net losses on securities (both realized and unrealized) | (0.37 | ) | |
| Total from investment operations | (0.40 | ) | |
| Less distributions: | |||
| Dividends from net investment income | — | ||
| Distributions from capital gains | — | ||
| Total distributions | — | ||
| Paid-in capital from redemption fees | 0.04 | ||
| Net asset value, end of period | $ | 9.64 | |
| Total return* | (3.60% | ) | |
| Ratios/Supplemental Data | |||
| Net assets, end of period (in millions) | $ | 22 | |
| Ratio of expenses to average net assets** | 1.62% | ||
| Ratio of net investment loss to average net assets** | (1.19% | ) | |
| Portfolio turnover rate | 7% | ||
* Total return not annualized for periods less than one full year.
** Annualized for periods less than one full year.
See accompanying Notes to Financial Statements.
| 43 | |
| FINANCIAL HIGHLIGHTS |
| BUFFALO MID CAP FUND | ||||||||||||
| SIX MONTHS ENDED SEPTEMBER 30, 2004 (UNAUDITED) | PERIOD FROM DECEMBER 17, 2001 (INCEPTION) TO MARCH 31, 2002 | |||||||||||
| Condensed data for a share of capital stock outstanding throughout the period. | YEARS ENDED MARCH 31, | |||||||||||
| 2004 | 2003 | |||||||||||
| Net asset value, beginning of period | $ | 12.43 | $ | 7.54 | $ | 10.12 | $ | 10.00 | ||||
| Income from investment operations: | ||||||||||||
| Net investment loss | (0.02 | ) | (0.04 | ) | (0.04 | ) | (0.01 | ) | ||||
| Net gains (losses) on securities | ||||||||||||
| (both realized and unrealized) | (0.94 | ) | 4.93 | (2.54 | ) | 0.13 | ||||||
| Total from investment operations | (0.96 | ) | 4.89 | (2.58 | ) | 0.12 | ||||||
| Less distributions: | ||||||||||||
| Dividends from net investment income | — | — | — | — | ||||||||
| Distributions from capital gains | — | — | — | — | ||||||||
| Total distributions | — | — | — | — | ||||||||
| Net asset value, end of period | $ | 11.47 | $ | 12.43 | $ | 7.54 | $ | 10.12 | ||||
| Total return* | (7.72% | ) | 64.85% | (25.49% | ) | 1.20% | ||||||
| Ratios/Supplemental Data | ||||||||||||
| Net assets, end of period (in millions) | $ | 137 | $ | 112 | $ | 39 | $ | 32 | ||||
| Ratio of expenses to average net assets** | 1.03% | 1.03% | 1.10% | 1.16% | ||||||||
| Ratio of net investment loss to average net assets** | (0.43% | ) | (0.48% | ) | (0.59% | ) | (0.71% | ) | ||||
| Portfolio turnover rate | 9% | 24% | 8% | 3% | ||||||||
* Total return not annualized for periods less than one full year.
** Annualized for periods less than one full year.
See accompanying Notes to Financial Statements.
| 44 | |
| FINANCIAL HIGHLIGHTS |
| BUFFALO SCIENCE & TECHNOLOGY FUND | ||||||||||||
| SIX MONTHS ENDED SEPTEMBER 30, 2004 (UNAUDITED) | PERIOD FROM DECEMBER 17, 2001 (INCEPTION) TO MARCH 31, 2002 | |||||||||||
| Condensed data for a share of capital stock outstanding throughout the period. | YEARS ENDED MARCH 31, | |||||||||||
| 2004 | 2003 | |||||||||||
| Net asset value, beginning of period | $ | 11.04 | $ | 6.01 | $ | 10.18 | $ | 10.00 | ||||
| Income from investment operations: | ||||||||||||
| Net investment loss | (0.02 | ) | (0.04 | ) | (0.05 | ) | (0.05 | ) | ||||
| Net gains (losses) on securities | ||||||||||||
| (both realized and unrealized) | (0.55 | ) | 5.07 | (4.12 | ) | 0.23 | ||||||
| Total from investment operations | (0.57 | ) | 5.03 | (4.17 | ) | 0.18 | ||||||
| Less distributions: | ||||||||||||
| Dividends from net investment income | — | — | — | — | ||||||||
| Distributions from capital gains | — | — | — | — | ||||||||
| Total distributions | — | — | — | — | ||||||||
| Net asset value, end of period | $ | 10.47 | $ | 11.04 | $ | 6.01 | $ | 10.18 | ||||
| Total return* | (5.16% | ) | 83.69% | (40.96% | ) | 1.80% | ||||||
| Ratios/Supplemental Data | ||||||||||||
| Net assets, end of period (in millions) | $ | 56 | $ | 35 | $ | 15 | $ | 19 | ||||
| Ratio of expenses to average net assets** | 1.05% | 1.03% | 1.23% | 1.17% | ||||||||
| Ratio of net investment loss to average net assets** | (0.45% | ) | (0.55% | ) | (0.73% | ) | (0.77% | ) | ||||
| Portfolio turnover rate | 7% | 38% | 26% | 4% | ||||||||
* Total return not annualized for periods less than one full year.
** Annualized for periods less than one full year.
See accompanying Notes to Financial Statements.
| 45 | |
| FINANCIAL HIGHLIGHTS |
| BUFFALO SMALL CAP FUND | ||||||||||||||||||
| Condensed data for a share of capital stock outstanding throughout the period. | SIX MONTHS ENDED SEPTEMBER 30, 2004 (UNAUDITED) | YEARS ENDED MARCH 31, | ||||||||||||||||
| 2004 | 2003 | 2002 | 2001 | 2000 | ||||||||||||||
| Net asset value, beginning of period | $ | 25.70 | $ | 13.79 | $ | 21.08 | $ | 14.97 | $ | 15.38 | $ | 9.49 | ||||||
| Income from investment operations: | ||||||||||||||||||
| Net investment loss | (0.01 | ) | (0.10 | ) | (0.10 | ) | (0.03 | ) | (0.01 | ) | (0.03 | ) | ||||||
| Net gains (losses) on securities | ||||||||||||||||||
| (both realized and unrealized) | (0.84 | ) | 12.21 | (7.16 | ) | 6.17 | 1.27 | 6.13 | ||||||||||
| Total from investment operations | (0.85 | ) | 12.11 | (7.26 | ) | 6.14 | 1.26 | 6.10 | ||||||||||
| Less distributions: | ||||||||||||||||||
| Dividends from net investment income | (0.02 | ) | — | — | — | — | — | |||||||||||
| Distributions from capital gains | — | (0.20 | ) | (0.03 | ) | (0.03 | ) | (1.67 | ) | (0.21 | ) | |||||||
| Total distributions | (0.02 | ) | (0.20 | ) | (0.03 | ) | (0.03 | ) | (1.67 | ) | (0.21 | ) | ||||||
| Net asset value, end of period | $ | 24.83 | $ | 25.70 | $ | 13.79 | $ | 21.08 | $ | 14.97 | $ | 15.38 | ||||||
| Total return* | (3.32% | ) | 88.07% | (34.49% | ) | 41.04% | 8.95% | 64.87% | ||||||||||
| Ratios/Supplemental Data | ||||||||||||||||||
| Net assets, end of period (in millions) | $ | 1,659 | $ | 1,705 | $ | 686 | $ | 1,285 | $ | 53 | $ | 35 | ||||||
| Ratio of expenses to average net assets** | 1.01% | 1.01% | 1.02% | 1.01% | 1.04% | 1.12% | ||||||||||||
| Ratio of net investment loss to average net assets** | (0.11% | ) | (0.53% | ) | (0.55% | ) | (0.44% | ) | (0.12% | ) | (0.27% | ) | ||||||
| Portfolio turnover rate | 12% | 22% | 24% | 6% | 31% | 42% | ||||||||||||
* Total return not annualized for periods less than one full year.
** Annualized for periods less than one full year.
See accompanying Notes to Financial Statements.
| 46 | |
| FINANCIAL HIGHLIGHTS |
| BUFFALO USA GLOBAL FUND | ||||||||||||||||||
| Condensed data for a share of capital stock outstanding throughout the period. | SIX MONTHS ENDED SEPTEMBER 30, 2004 (UNAUDITED) | YEARS ENDED MARCH 31, | ||||||||||||||||
| 2004 | 2003 | 2002 | 2001 | 2000 | ||||||||||||||
| Net asset value, beginning of period | $ | 19.18 | $ | 13.04 | $ | 18.84 | $ | 17.48 | $ | 25.01 | $ | 16.27 | ||||||
| Income from investment operations: | ||||||||||||||||||
| Net investment income (loss) | 0.02 | 0.02 | (0.01 | ) | (0.06 | ) | (0.01 | ) | (0.03 | ) | ||||||||
| Net gains (losses) on securities | ||||||||||||||||||
| (both realized and unrealized) | (0.72 | ) | 6.12 | (5.79 | ) | 1.42 | (4.67 | ) | 9.71 | |||||||||
| Total from investment operations | (0.70 | ) | 6.14 | (5.80 | ) | 1.36 | (4.68 | ) | 9.68 | |||||||||
| Less distributions: | ||||||||||||||||||
| Dividends from net investment income | (0.03 | ) | — | — | — | — | (0.02 | ) | ||||||||||
| Distributions from capital gains | — | — | — | — | (2.85 | ) | (0.92 | ) | ||||||||||
| Total distributions | (0.03 | ) | — | — | — | (2.85 | ) | (0.94 | ) | |||||||||
| Net asset value, end of period | $ | 18.45 | $ | 19.18 | $ | 13.04 | $ | 18.84 | $ | 17.48 | $ | 25.01 | ||||||
| Total return* | (3.67% | ) | 47.11% | (30.79% | ) | 7.78% | (19.80% | ) | 60.72% | |||||||||
| Ratios/Supplemental Data | ||||||||||||||||||
| Net assets, end of period (in millions) | $ | 86 | $ | 79 | $ | 61 | $ | 73 | $ | 49 | $ | 52 | ||||||
| Ratio of expenses to average net assets** | 1.04% | 1.03% | 1.04% | 1.05% | 1.03% | 1.04% | ||||||||||||
| Ratio of net investment income (loss) | ||||||||||||||||||
| to average net assets** | 0.25% | 0.14% | (0.10% | ) | (0.39% | ) | (0.05% | ) | (0.16% | ) | ||||||||
| Portfolio turnover rate | 12% | 21% | 7% | 6% | 17% | 35% | ||||||||||||
* Total return not annualized for periods less than one full year.
** Annualized for periods less than one full year.
See accompanying Notes to Financial Statements.
| 47 | |
| NOTES TO FINANCIAL |
| STATEMENTS |
September 30, 2004 (unaudited)
1. SIGNIFICANT ACCOUNTING POLICIES:
The Buffalo Balanced Fund, Inc., Buffalo High Yield Fund, Inc., Buffalo Large Cap Fund, Inc., Buffalo Funds (comprised of the Buffalo Micro Cap Fund, Buffalo Mid Cap Fund and Buffalo Science & Technology Fund), Buffalo Small Cap Fund, Inc. and Buffalo USA Global Fund, Inc. (the “Funds”) are registered under the Investment Company Act of 1940, as amended, as diversified open-end management investment companies. The shares of the Buffalo Funds are issued in multiple series, with each series, in effect, representing a separate Fund. The following is a summary of significant accounting policies consistently followed by the Funds in the preparation of their financial statements.
A. INVESTMENT VALUATION — Corporate stocks and bonds traded on a national securities exchange or national market, except those traded using the National Association of Securities Dealers’ Automated Quotation System (“NASDAQ”), are valued at the latest sales price thereof, or if no sale was reported on that date, the mean between the most recent quoted bid and asked price is used. All equity securities that are traded using NASDAQ are valued using the NASDAQ Official Closing Price (“NOCP”).
Securities not currently traded or those securities with a price deemed to be unsatisfactory are valued at fair value as determined in good faith under procedures approved by the Boards of Directors/Trustees. If events occur that will affect the value of a Fund’s portfolio securities before the NAV has been calculated, the security will generally be priced using a fair value procedure. The Board has adopted specific procedures for valuing portfolio securities and delegated the responsibility of fair value determinations to a Valuation Committee. Some of the factors that may be considered by the Valuation Committee in determining fair value are fundamental analytical data relating to the investment; the nature and duration of any restriction on the disposition; trading in similar securities of the same issuer or comparable companies; information from broker-dealers; and an evaluation of the forces that influence the market in which the securities are purchased or sold. As of September 30, 2004, the Buffalo Balanced Fund and Buffalo High Yield Fund held fair valued securities with market values of $198 and $249, respectively or 0.00% and 0.00% of total net assets, respectively.
Securities with maturities of 60 days or less when acquired or subsequently within 60 days of maturity are valued at amortized cost, which approximates market value.
B. FEDERAL INCOME TAXES — Each Fund intends to comply with the requirements of Subchapter M of the Internal Revenue Code necessary to qualify as regulated investment companies and to make the requisite distributions of income and capital gains to its shareholders sufficient to relieve it from all or substantially all federal income taxes. Therefore, no federal income tax provision has been provided.
C. INVESTMENT TRANSACTIONS AND INVESTMENT INCOME — Investment transactions are accounted for on the date the securities are purchased or sold (trade date). Dividend income is recorded on the ex-dividend date. Interest income is recognized on the accrual basis. Realized gains and losses from investment transactions and unrealized appreciation and depreciation of investments are reported on the identified cost basis. All discounts/premiums are accreted/amortized for financial reporting purposes and are included in interest income.
D. DISTRIBUTIONS TO SHAREHOLDERS — Distributions to shareholders are recorded on the ex-dividend date. Distributions are determined in accordance with income tax regulations, which may differ from accounting principles generally accepted in the United States. These differences are primarily due to differing treatments for premium amortization on debt securities and deferral of post October and wash sale losses.
E. USE OF ESTIMATES — The preparation of financial statements in conformity with accounting principles generally accepted in the United States requires management to make estimates and assumptions that affect the amounts reported in the financial statements and accompanying notes. Actual results could differ from such estimates.
| 48 | |
2. FEDERAL TAX MATTERS:
The tax character of distributions paid during the periods ended September 30, 2004 and March 31, 2004 were as follows:
| SIX MONTHS ENDED SEPTEMBER 30, 2004 | YEAR ENDED MARCH 31, 2004 | |||||||||||||||||
| ORDINARY | LONG-TERM | RETURN | ORDINARY | LONG-TERM | RETURN | |||||||||||||
| INCOME | CAPITAL GAINS | OF CAPITAL | INCOME | CAPITAL GAINS | OF CAPITAL | |||||||||||||
| Buffalo Balanced Fund | $ | 1,731,201 | $ | — | $ | — | $ | 1,472,676 | $ | — | $ | — | ||||||
| Buffalo High Yield Fund | 6,646,565 | — | — | 8,970,699 | — | — | ||||||||||||
| Buffalo Large Cap Fund | 88,189 | — | — | 87,501 | — | — | ||||||||||||
| Buffalo Micro Cap Fund(1) | — | — | — | N/A | N/A | N/A | ||||||||||||
| Buffalo Mid Cap Fund | — | — | — | — | 22,700 | — | ||||||||||||
| Buffalo Science & Technology Fund | — | — | — | — | — | — | ||||||||||||
| Buffalo Small Cap Fund | 1,194,557 | — | — | — | 15,401,507 | — | ||||||||||||
| Buffalo USA Global Fund | 125,516 | — | — | 12,570 | — | — | ||||||||||||
(1)Commenced operations on May 21, 2004.
Total distributions paid differ from the Statements of Changes in Net Assets due primarily to the use of equalization debits for tax purposes.
As of March 31, 2004, the components of accumulated earnings (losses) on a tax basis were as follows:
| BUFFALO BALANCED FUND | BUFFALO HIGH YIELD FUND | BUFFALO LARGE CAP FUND | BUFFALO MID CAP FUND | BUFFALO SCIENCE & TECHNOLOGY FUND | BUFFALO MALL CAP FUND | BUFFALO USA GLOBAL FUND | |||||||||||||||
| Cost of investments(a) | $ | 73,762,928 | $ | 308,036,026 | $ | 51,927,626 | $ | 101,548,686 | $ | 28,344,127 | $ | 1,273,174,129 | $ | 65,220,503 | |||||||
| Gross unrealized appreciation | 6,443,075 | 18,980,974 | 9,168,045 | 21,856,846 | 8,366,355 | 472,591,085 | 18,680,468 | ||||||||||||||
| Gross unrealized depreciation | (3,472,831 | ) | (4,822,492 | ) | (3,479,607 | ) | (2,325,252 | ) | (2,088,173 | ) | (53,130,223 | ) | (4,798,711 | ) | |||||||
| Net unrealized appreciation | 2,970,244 | 14,158,482 | 5,688,438 | 19,531,594 | 6,278,182 | 419,460,862 | 13,881,757 | ||||||||||||||
| Undistributed ordinary income | 160,379 | 920,244 | 44,485 | — | — | — | 94,079 | ||||||||||||||
| Undistributed long-term | |||||||||||||||||||||
| capital gain | — | — | — | 1,313,387 | — | 17,203,254 | — | ||||||||||||||
| Total distributable earnings | 160,379 | 920,244 | 44,485 | 1,313,387 | — | 17,203,254 | 94,079 | ||||||||||||||
| Other accumulated | |||||||||||||||||||||
| gains (losses) | (5,480,362 | ) | (3,986,903 | ) | (4,101,006 | ) | — | (1,275,733 | ) | — | (3,505,439 | ) | |||||||||
| Total accumulated | |||||||||||||||||||||
| earnings (losses) | $ | (2,349,739 | ) | $ | 11,091,823 | $ | 1,631,917 | $ | 20,844,981 | $ | 5,002,449 | $ | 436,664,116 | $ | 10,470,397 | ||||||
(a)Represents cost for federal income tax purposes and differs from the cost for financial reporting purposes.
As of March 31, 2004, the accumulated net realized loss on sales of investments and losses deferred for federal income tax purposes which are available to offset future taxable gains are as follows:
| CAPITAL LOSS | ||||
| CARRYOVER | EXPIRES | |||
| Buffalo Balanced Fund | $ | 2,546,950 | 2007 | |
| 2,192,010 | 2009 | |||
| 226,010 | 2011 | |||
| 515,392 | 2012 | |||
| Buffalo High Yield Fund | 3,986,903 | 2011 | ||
| Buffalo Large Cap Fund | 757,457 | 2010 | ||
| 2,333,606 | 2011 | |||
| 1,009,943 | 2012 | |||
| Buffalo Science & Technology Fund | 1,064,579 | 2011 | ||
| Buffalo USA Global Fund | 3,505,439 | 2011 | ||
| 49 | |
| NOTES TO FINANCIAL |
| STATEMENTS (Continued) |
The Buffalo Science & Technology Fund incurred a loss for tax purposes from November 1, 2003 to March 31, 2004 in the amount of $211,154. As permitted by tax regulations, the Fund intends to elect to defer and treat this loss as arising in the fiscal year ended March 31, 2005.
For the fiscal year ended March 31, 2004 certain dividends paid by the Funds may be subject to a maximum tax rate of 15%, as provided for by the Jobs and Growth Tax Relief Reconciliation Act of 2003. The percentage of dividends declared from net investment income designated as qualified dividend income were as follows (unaudited):
| Buffalo Balanced Fund | 37 | % |
| Buffalo High Yield Fund | 6 | % |
| Buffalo Large Cap Fund | 100 | % |
| Buffalo USA Global Fund | 100 | % |
For corporate shareholders, the percent of ordinary income distributions qualifying for the corporate dividends received deduction for the fiscal year ended March 31, 2004 were as follows (unaudited):
| Buffalo Balanced Fund | 34 | % |
| Buffalo High Yield Fund | 5 | % |
| Buffalo Large Cap Fund | 100 | % |
| Buffalo USA Global Fund | 100 | % |
3. TRANSACTIONS WITH AFFILIATES:
Management fees are paid to Kornitzer Capital Management, Inc. at the rate of 1.00% per annum of the average daily net asset values of the Funds, except for the Buffalo Micro Cap Fund which has a management fee rate of 1.45%. The management fees are for services which include administration, and all other operating expenses of the Funds except the cost of acquiring and disposing of portfolio securities, the taxes, if any, imposed directly on the Funds and its shares, insurance, certain director expenses and the cost of qualifying the Funds’ shares for sale in any jurisdiction. Certain officers and a director/trustee of the Funds are also officers and/or directors of Kornitzer Capital Management, Inc.
A director/trustee of the Funds is affiliated with U.S. Bancorp Fund Services, LLC and U.S. Bank, N.A., which provide accounting, administration, transfer agency and custodian services to the Funds.
4. REDEMPTION FEE:
Shares of the Buffalo High Yield Fund and Buffalo Micro Cap Fund sold or exchanged within 180 days of their purchase are subject to a redemption fee of 2.00% of the value of the shares sold or exchanged. The redemption fee does not apply to shares purchased through reinvested distributions (dividends and capital gains). The redemption fee is retained by the Funds and will help pay transaction and tax costs that long-term investors may bear when the Funds realize capital gains as a result of selling securities to meet investor redemptions.
5. INVESTMENT TRANSACTIONS:
The aggregate purchases and sales of securities, excluding short-term investments and U.S. government securities, for the Funds for the six months ended September 30, 2004, were as follows:
| BUFFALO BALANCED FUND | BUFFALO HIGH YIELD FUND | BUFFALO LARGE CAP FUND | BUFFALO MICRO CAP FUND(1) | BUFFALO MID CAP FUND | BUFFALO SCIENCE & TECHNOLOGY FUND | BUFFALO SMALL CAP FUND | BUFFALO USA GLOBAL FUND | |||||||||||||||||
| Purchases | $ | 48,410,708 | $ | 82,759,994 | $ | 6,911,345 | $ | 18,643,641 | $ | 51,231,109 | $ | 25,505,335 | $ | 259,945,868 | $ | 16,748,904 | ||||||||
| Proceeds from Sales | $ | 17,002,931 | $ | 39,463,954 | $ | 3,352,655 | $ | 768,903 | $ | 11,872,485 | $ | 2,883,867 | $ | 190,779,294 | $ | 9,470,955 | ||||||||
(1)Commenced operations on May 21, 2004.
Purchases and proceeds from sales of long-term U.S. government securities for the Buffalo High Yield Fund were $0 and $1,500,000, respectively.
There were no purchases or sales of long-term U.S. government securities for any other Funds during the six months ended September 30, 2004.
| 50 | |
6. OTHER AFFILIATES:*
Investments representing 5% or more of the outstanding voting securities of a portfolio company result in that company being considered an affiliated company, as defined in the 1940 Act. The aggregate market value of all securities of affiliated companies held in the Buffalo Small Cap Fund as of September 30, 2004 amounted to $106,755,399 representing 6.43% of net assets. There were no affiliated companies held in any of the other Funds. Transactions in the Buffalo Small Cap Fund during the six months ended September 30, 2004 in which the issuer was an “affiliated person” are as follows:
| AMERISTAR | J. JILL | ORBITZ INC. | ULTIMATE | WMS | ||||||||||||||
| CASINOS, INC. | GROUP INC. | CLASS A | ELECTRONICS, INC. | INDUSTRIES INC. | TOTAL | |||||||||||||
| March 31, 2004 | ||||||||||||||||||
| Balance | ||||||||||||||||||
| Shares | 1,400,493 | 1,253,040 | — | 870,050 | 1,538,250 | 5,061,833 | ||||||||||||
| Cost | $ | 29,331,370 | $ | 19,167,093 | $ | — | $ | 20,746,361 | $ | 33,642,625 | $ | 102,887,449 | ||||||
| Gross Additions | ||||||||||||||||||
| Shares | — | — | 400,615 | — | — | 400,615 | ||||||||||||
| Cost | $ | — | $ | — | $ | 9,546,206 | $ | — | $ | — | $ | 9,546,206 | ||||||
| Gross Deductions | ||||||||||||||||||
| Shares | — | — | — | — | — | — | ||||||||||||
| Cost | $ | — | $ | — | $ | — | $ | — | $ | — | $ | — | ||||||
| September 30, 2004 | ||||||||||||||||||
| Balance | ||||||||||||||||||
| Shares | 1,400,493 | 1,253,040 | — | — | 1,538,250 | 4,191,783 | ||||||||||||
| Cost | $ | 29,331,370 | $ | 19,167,093 | $ | — | $ | — | $ | 33,642,625 | $ | 82,141,088 | ||||||
| Realized gain | $ | — | $ | — | $ | — | $ | — | $ | — | $ | — | ||||||
| Investment income | $ | 525,185 | $ | — | $ | — | $ | — | $ | — | $ | 525,185 | ||||||
* As a result of the Buffalo Small Cap Fund's beneficial ownership of the common stock of these companies, regulators require that the Fund state that it may be deemed an affiliate of the
respective issuer. The Fund disclaims that the “affiliated persons”are affiliates of the Distributor, Advisor, Funds or any other client of the Advisor.
The Funds’ Proxy Voting Policies and Procedures are available without charge by calling 1-800-49-BUFFALO or by accessing the SEC’s website at www.sec.gov.
The actual voting records relating to portfolio securities during the twelve month period ended June 30, 2004 (as filed with the SEC on Form N-PX) are available without charge by calling 1-800-49-BUFFALO or by accessing the SEC’s website at www.sec.gov.
Beginning with the Funds’ first and third quarters ending after July 9, 2004, the Funds will file complete schedules of portfolio holdings with the SEC on Form N-Q. Form N-Q will be available without charge, upon request, by calling 1-800-49-BUFFALO or by accessing the SEC’s website at www.sec.gov.
This report has been prepared for the information of the shareholders of the Funds, and is not to be construed as an offering of the shares of the Funds. Shares of the Funds are offered only by the Prospectus, a copy of which may be obtained from Buffalo Funds c/o U.S. Bancorp Fund Services, LLC, 1-800-49-BUFFALO or at www.buffalofunds.com.
| 51 | |
| BUFFALO FUNDS | |
| Balanced Fund | |
| High Yield Fund | |
| Large Cap Fund | |
| Micro Cap Fund | |
| Mid Cap Fund | |
| Science & Technology Fund | |
| Small Cap Fund | |
| USA Global Fund | |
| 1-800-49-BUFFALO | |
| (1-800-492-8332) | |
| www.buffalofunds.com | |
Item 2. Code of Ethics.
Not applicable for semi-annual reports.
Item 3. Audit Committee Financial Expert.
Not applicable for semi-annual reports.
Item 4. Principal Accountant Fees and Services.
Not applicable for semi-annual reports.
Item 5. Audit Committee of Listed Registrants.
Not applicable to open-end investment companies.
Item 6. Schedule of Investments.
Schedule of Investments is included as part of the report to shareholders filed under Item 1 of this Form.
Item 7. Disclosure of Proxy Voting Policies and Procedures for Closed-End Management Investment Companies.
Not applicable to open-end investment companies.
Item 8. Purchases of Equity Securities by Closed-End Management Investment Company and Affiliated Purchases.
Not applicable to open-end investment companies.
Item 9. Submission of Matters to a Vote of Security Holders.
Not Applicable.
Item 10. Controls and Procedures.
| (a) | The Registrant’s President/Chief Executive Officer and Treasurer/Chief Financial Officer have concluded that the Registrant's disclosure controls and procedures (as defined in |
1
| Rule 30a-3(c) under the Investment Company Act of 1940 (the “1940 Act”)) are effective as of a date within 90 days of the filing date of the report that includes the disclosure required by this paragraph, based on the evaluation of these controls and procedures required by Rule 30a-3(b) under the 1940 Act and Rules 15d-15(b) under the Securities Exchange Act of 1934, as amended. | |
| (b) | There were no significant changes in the Registrant's internal controls over financial reporting that occurred during the Registrant's last fiscal half-year that has materially affected, or is reasonably likely to materially affect, the Registrant's internal control over financial reporting. |
Item 11. Exhibits.
| (a) | (1) Any code of ethics or amendment thereto, that is subject of the disclosure required by Item 2, to the extent that the registrant intends to satisfy Item 2 requirements through filing an exhibit. Not Applicable. |
| (2) A separate certification for each principal executive and principal financial officer of the Registrant as required by Rule 30a-2(a) under the 1940 Act and pursuant to Section 302 of the Sarbanes-Oxley Act of 2002. Filed herewith. | |
| (3) Any written solicitation to purchase securities under Rule 23c-1 under the 1940 Act sent or given during the period covered by the report by or on behalf of the registrant to 10 or more persons. Not applicable to open-end investment companies. | |
| (b) | Certification pursuant to Section 906 of the Sarbanes-Oxley Act of 2002. Furnished herewith. |
2
SIGNATURES
Pursuant to the requirements of the Securities Exchange Act of 1934 and the Investment Company Act of 1940, the registrant has duly caused this report to be signed on its behalf by the undersigned, thereunto duly authorized.
(Registrant) Buffalo Small Cap Fund, Inc.
By (Signature and Title) /s/ Kent W. Gasaway, President and Treasurer
Kent W. Gasaway, President and Treasurer
Date 12/6/04
Pursuant to the requirements of the Securities Exchange Act of 1934 and the Investment Company Act of 1940, this report has been signed below by the following persons on behalf of the registrant and in the capacities and on the dates indicated.
By (Signature and Title) /s/ Kent W. Gasaway, President and Treasurer
Kent W. Gasaway, President and Treasurer
Date 12/6/04
3