Exhibit 99.1

Relationships F - I - R - S - T Sandler O’Neill + Partners East Coast Financial Services Conference November 14, 2019
Forward Looking Statements Forward Looking Statements This presentation contains forward looking statements within the meaning of the Securities and Exchange Act of 1934 , as amended, including statements of goals, intentions, and expectations as to future trends, plans, events or results of Company operations and policies and regarding general economic conditions . In some cases, forward - looking statements can be identified by use of words such as “may,” “will,” “anticipates,” “believes,” “expects,” “plans,” “estimates,” “potential,” “continue,” “should,” and similar words or phrases . These statements are based upon current and anticipated economic conditions, nationally and in the Company’s market, interest rates and interest rate policy, competitive factors and other conditions which by their nature, are not susceptible to accurate forecast and are subject to significant uncertainty . For details on factors that could affect these expectations, see the risk factors and other cautionary language included in the Company’s Annual Report on Form 10 - K and other periodic and current reports filed with the SEC . Because of these uncertainties and the assumptions on which this discussion and the forward - looking statements are based, actual future operations and results in the future may differ materially from those indicated herein . Readers are cautioned against placing undue reliance on any such forward - looking statements . The Company’s past results are not necessarily indicative of future performance . The Company does not undertake to publicly revise or update forward - looking statements in this presentation to reflect events or circumstances that arise after the date of this presentation, except as may be required under applicable law . This presentation was delivered digitally . The Company makes no representation that subsequent to delivery of the presentation it was not altered . For the most current, accurate information, please refer to www . eaglebankcorp . com and go to the Investor Relations tab . For further information on the Company please contact : Michael T . Flynn 240 - 497 - 2040 mflynn@eaglebankcorp . com 2

Company Overview ▪ Eagle Bancorp, Inc. is a highly profitable community bank focused on the Washington, DC metropolitan area ▪ Commercially - oriented business model with deep relationships of loans, core deposits and related products ▪ S treamlined network of 20 branches and 2 LPOs located in Northern Virginia, Suburban Maryland and the District of Columbia ▪ #1 in deposit market share among community banks headquartered in the Washington, DC metropolitan area ▪ Largest market capitalization of any community bank based in the Washington, DC metropolitan area ▪ Largest and most profitable bank headquartered and operating in the state of Maryland 3 Data as - of September 30, 2019.

Summary Statistics 4 NOTE: Data as - of September 30, 2019 unless otherwise noted. (1) Please refer to the Non - GAAP reconciliation and footnotes in the appendices on pages 34 - 39. Total Assets: $9.0 billion Total Loans: $7.6 billion Total Deposits: $7.4 billion Tangible Common Equity: $1.1 billion (1) Tangible Book Value per Common Share: $32.02 (1) Shares Outstanding (at close October 31, 2019): 33,583,928 Market Capitalization (at close October 31, 2019): $1.52 billion Institutional Ownership: 81% Member of Russell 2000 Yes Member of S&P SmallCap 600 Yes

Investment Rationale ▪ Highly Profitable, with Balanced Financial Performance ▪ Favorable Net Interest Margin = 3.72% ▪ Operating Leverage with streamlined branch system: Efficiency Ratio = 38.34% ▪ Clean Asset Quality: NPAs/Assets = 0.66%; NCOs/Average Loans = 0.08% ▪ C onsistent organic growth of loans and deposits ▪ DDA’s as a percentage of Average Deposits = 29.51% ▪ Strong capital ratios ▪ Cash Dividend: Yield = 1.96%; Dividend payout ratio = 20.56% ▪ Proven ability to evaluate and execute acquisitions ▪ Strategically positioned in the 5 th largest regional economy in the U.S. ▪ Dedicated, diverse and experienced Board focused on vision and governance 5 NOTE: Financial data at or for the quarter ended September 30, 2019,

Performance Statistics 6 NOTE: (1) Bank Holding Company Performance Report Peer Group represents companies with consolidated assets between $3 billion an d $10 billion. (2) Please refer to the Non - GAAP reconciliation and footnotes in the appendices on pages 34 - 39. * Data as - of 9/30/19. The peer group valuation numbers represent the KRX Index. ** Data for 2017Y & 2019Q1 is shown on an adjusted basis . Peer Group (1) Key Ratios (at or for the period ended) 2014Y 2015Y 2016Y 2017Y 2018Y 2019Q1 2019Q2 2019Q3 2019Q2 PROFITABILITY Net Interest Margin 4.44% 4.33% 4.16% 4.15% 4.10% 4.02% 3.91% 3.72% 3.55% Efficiency Ratio 50.67% 42.49% 40.29% 37.84% 37.31% 36.82%** 38.04% 38.34% 62.01% Return on Average Assets 1.31% 1.49% 1.52% 1.62%** 1.91% 1.85%** 1.74% 1.62% 1.15% Return on Average Tangible Common Equity 14.27% 14.69% 14.19% 12.54%** 16.63% 15.26%** 14.08% 13.25% N/A ASSET QUALITY Allowance Loan Losses/Gross Loans 1.07% 1.05% 1.04% 1.01% 1.00% 0.98% 0.98% 0.98% 0.95% NPAs + 90 Days Past Due/Total Assets 0.68% 0.31% 0.30% 0.20% 0.21% 0.50% 0.45% 0.66% 0.53% Net Charge-Offs to Average Loans (annualized) 0.17% 0.17% 0.09% 0.06% 0.05% 0.19% 0.08% 0.08% 0.09% Reserve/NPLs (Coverage Ratio) 205.30% 397.95% 330.49% 489.20% 429.72%329.15%** 192.70% 127.87% 237.88% CAPITAL Tier 1 Leverage Ratio 10.69% 10.90% 10.72% 11.45% 12.08% 12.55%** 12.66% 12.19% 10.30% Tangible Common Equity/Tangible Assets (2) 8.54% 10.56% 10.84% 11.44% 12.11% 12.65%** 12.60% 12.13% N/A Total Risk Based Capital Ratio 12.97% 12.75% 14.89% 15.02% 16.08% 16.27%** 16.36% 16.08% 14.50% VALUATION Price/Earnings 18.2x 20.2x 21.3x 19.8x 11.0x 11.5x 12.4x 10.4x* 12.5x* Price/Tangible Book Value 244% 268% 282% 235% 167% 166% 173% 140%* 179%* EGBN

Experienced Senior Management Team 7 Years Years in with Name Title/Function Banking EGBN Susan G. Riel CEO & President, Eagle Bancorp & EagleBank 43 21 Charles D. Levingston EVP & Chief Financial Officer - Eagle Bancorp & EagleBank 19 8 Antonio F. Marquez EVP & Chief Real Estate Lending Officer 34 8 Lindsey S. Rheaume EVP & Chief C&I Lending Officer 34 5 Janice L. Williams EVP & Chief Credit Officer 25 16

Board Focused on Vision and Oversight 8 Years with Name Title/Function EGBN Norman R. Pozez Chair - Board of Directors, Governance & Nominating Committee 11 Kathy A. Raffa Board Member, Chair - Audit Committee 4 Leslie Ludwig Board Member, Chair - Compensation Committee 3 Matthew D. Brockwell Board Member 1 Theresa G. LaPlaca Board Member 1 Susan G. Riel Board Member - President & CEO 21 James A. Soltesz Board Member 12 Benjamin M. Soto Board Member 13 Leland M. Weinstein Board Member 21
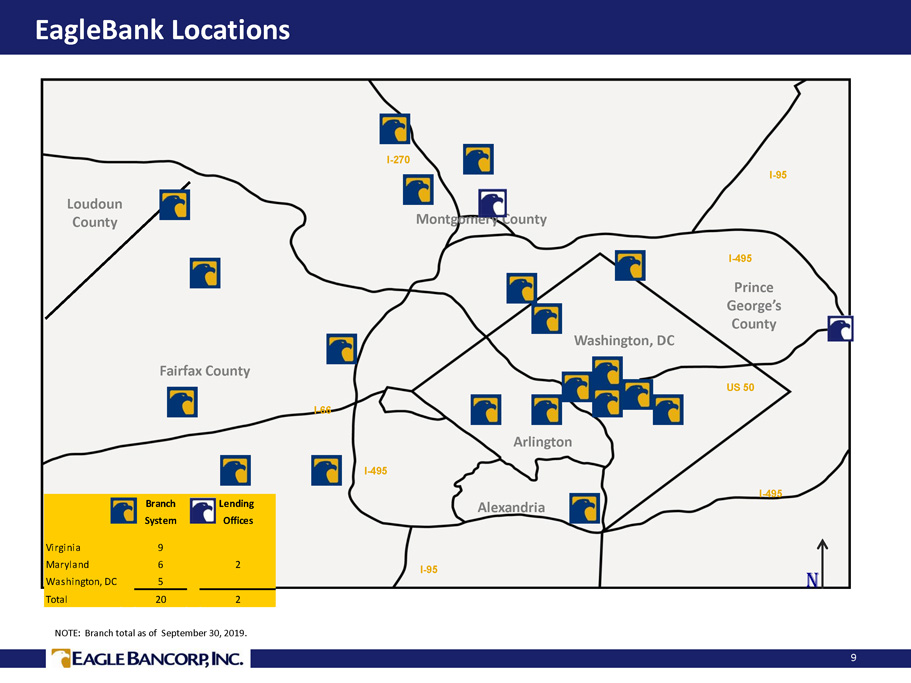
EagleBank Locations 9 Loudoun County Fairfax County I - 66 I - 495 I - 95 Alexandria Arlington I - 495 N US 50 Washington, DC Prince George’s County I - 495 I - 95 Montgomery County I - 270 NOTE: Branch total as of September 30, 2019. Branch Lending System Offices Virginia 9 Maryland 6 2 Washington, DC 5 Total 20 2

(Dollar values in thousands) Washington, DC Metropolitan Area Local June 30, June 30, 2019 Community 2018 2019 Annual Market Rank Banks Company Name Branches Balance Balance Growth Share 1 Bank of America Corp. 149 36,020,840 38,188,832 6.0% 17.5% 2 Capital One Financial Corp. 104 32,472,108 36,385,715 12.1% 16.6% 3 Wells Fargo & Co. 156 29,004,206 27,965,536 -3.6% 12.8% 4 SunTrust Banks Inc. 137 18,971,412 18,829,928 -0.7% 8.6% 5 BB&T Corp. 153 14,122,059 14,314,193 1.4% 6.5% 6 PNC Financial Services Group Inc. 178 13,829,853 14,121,929 2.1% 6.5% 7 Citigroup Inc. 33 8,831,000 8,748,000 -0.9% 4.0% 8 United Bankshares Inc. 64 8,491,143 8,603,932 1.3% 3.9% 9 1 Eagle Bancorp Inc. 20 6,344,313 7,011,807 10.5% 3.2% 10 2 Sandy Spring Bancorp Inc. 47 4,864,852 5,304,062 9.0% 2.4% 11 HSBC Holdings Plc 12 3,459,642 4,586,832 32.6% 2.1% 12 Toronto-Dominion Bank 50 3,950,139 4,407,148 11.6% 2.0% 13 M&T Bank Corp 74 4,362,246 4,164,848 -4.5% 1.9% 14 3 Atlantic Union Bank 33 1,836,408 3,949,701 115.1% 1.8% 15 4 Burke & Herbert Bank & Trust Co. 25 2,329,599 2,398,132 2.9% 1.1% 16 5 Revere Bank 8 1,523,792 1,677,877 10.1% 0.8% 17 6 Old Line Bank 19 1,321,437 1,536,111 16.2% 0.7% 18 7 John Marshall Bank 8 976,132 1,266,237 29.7% 0.6% 19 8 First Virginia Community Bank 10 1,011,230 1,253,752 24.0% 0.6% 20 9 Community Bank of the Chesapeake 9 976,279 1,127,550 15.5% 0.5% 21 Amalgamated Bank 1 978,551 1,027,077 5.0% 0.5% 22 10 Capital Bank 4 921,829 1,023,173 11.0% 0.5% 23 11 Main Street Bank 6 803,223 1,013,455 26.2% 0.5% 24 12 Congressional Bank 6 844,176 922,457 9.3% 0.4% 25 13 SONABANK 16 541,282 657,042 21.4% 0.3% All Other Market Participants 225 9,825,749 8,312,355 -15.4% 3.8% Market Total 1,547 208,613,500 218,797,681 4.9% 100.0% Deposit Market Share 10 76.4% NOTE: Washington, D.C. Metro Area as defined in FDIC Summary of Deposits Report. Data excludes: E*Trade whose deposits are substantially from outside of the defined market area. SOURCE: FDIC, as of June 30, 2018 and June 30, 2019.

Total Assets $0 $500 $1,000 $1,500 $2,000 $2,500 $3,000 $3,500 $4,000 $4,500 $5,000 $5,500 $6,000 $6,500 $7,000 $7,500 $8,000 $8,500 $9,000 $9,500 14Q3 14Q4 15Q1 15Q2 15Q3 15Q4 16Q1 16Q2 16Q3 16Q4 17Q1 17Q2 17Q3 17Q4 18Q1 18Q2 18Q3 18Q4 19Q1 19Q2 19Q3 Consistent Balance Sheet Growth 11 $9,003 NOTE: Virginia Heritage Bank acquisition closed on October 31, 2014. * Q4 2017 is shown on an operating basis. * Millions of Dollars

$5,000 $10,000 $15,000 $20,000 $25,000 $30,000 $35,000 $40,000 $45,000 14Q3 14Q4 15Q1 15Q2 15Q3 15Q4 16Q1 16Q2 16Q3 16Q4 17Q1 17Q2 17Q3 17Q4 18Q1 18Q2 18Q3 18Q4 19Q1 19Q2 19Q3 Net Income Available to Common SBLF Dividend Consistent Net Income Growth 12 $36,495 NOTE: Virginia Heritage Bank acquisition closed on October 31, 2014. * Q4 2017 & Q1 2019 is shown on an adjusted basis. * * Thousand of Dollars

$0.00 $0.50 $1.00 $1.50 $2.00 $2.50 $3.00 $3.50 $4.00 $4.50 $5.00 EPS (Reported) EPS (Operating) Earnings Per Share 13 $1.95 $2.08 $2.50 $2.86 $3.35 NOTE: Virginia Heritage Bank acquisition closed on October 31, 2014. EPS (Operating) for 2014 is net of merger related expenses. EPS for 2017 & Q1 2019 are shown on an adjusted basis.; Please refer to the Non - GAAP reconciliation and footnotes in the appendices on pages 34 - 39. $2.92 $4.42 $0.98 $1.11 $ 1.08 $ 1.07

$14.56 $18.83 $21.61 $24.67 $29.17 $32.02 $0.00 $5.00 $10.00 $15.00 $20.00 $25.00 $30.00 $35.00 2014Y 2015Y 2016Y 2017Y 2018Y 2019YTD Tangible Book Value per Share 14 NOTE: P lease refer to the Non - GAAP reconciliation and footnotes in the appendices on pages 34 - 39. Virginia Heritage Bank acquisition closed on October 31, 2014.
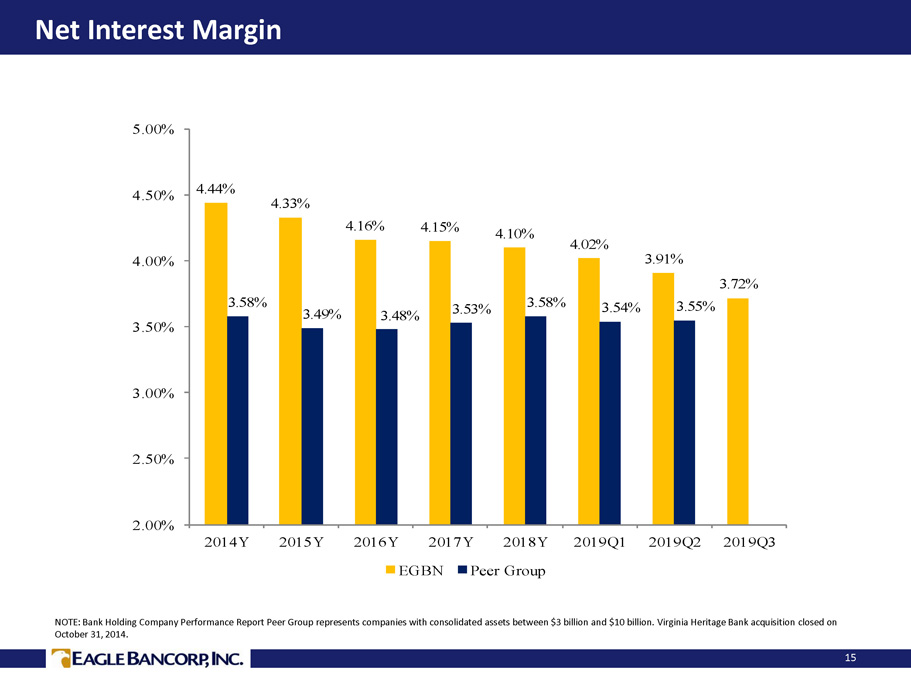
Net Interest Margin 15 NOTE: Bank Holding Company Performance Report Peer Group represents companies with consolidated assets between $3 billion and $1 0 billion. Virginia Heritage Bank acquisition closed on October 31, 2014. 4.44% 4.33% 4.16% 4.15% 4.10% 4.02% 3.91% 3.72% 3.58% 3.49% 3.48% 3.53% 3.58% 3.54% 3.55% 2.00% 2.50% 3.00% 3.50% 4.00% 4.50% 5.00% 2014Y 2015Y 2016Y 2017Y 2018Y 2019Q1 2019Q2 2019Q3 EGBN Peer Group
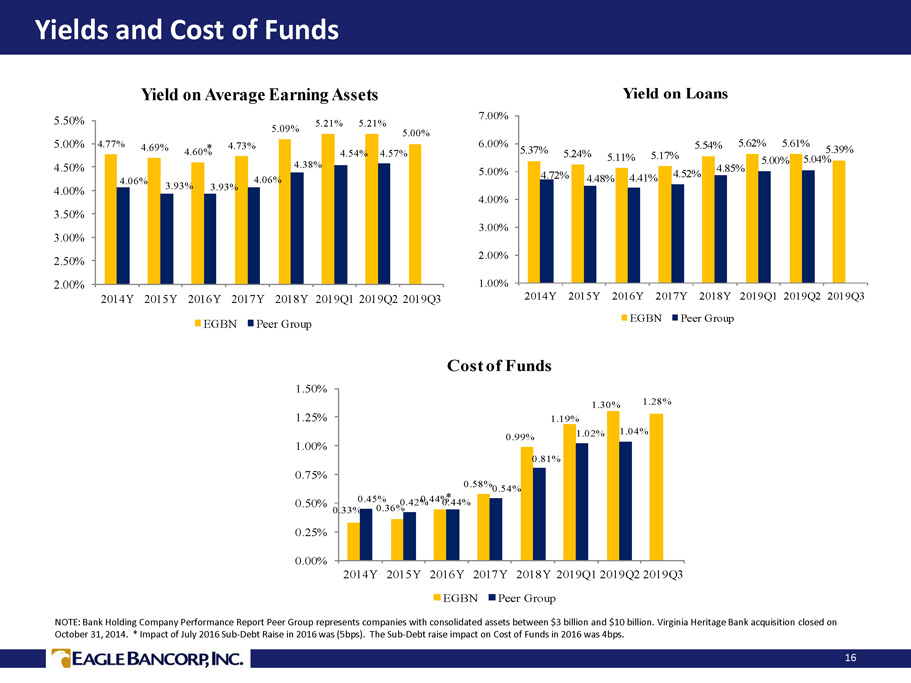
4.77% 4.69% 4.60% 4.73% 5.09% 5.21% 5.21% 5.00% 4.06% 3.93% 3.93% 4.06% 4.38% 4.54% 4.57% 2.00% 2.50% 3.00% 3.50% 4.00% 4.50% 5.00% 5.50% 2014Y 2015Y 2016Y 2017Y 2018Y 2019Q1 2019Q2 2019Q3 Yield on Average Earning Assets EGBN Peer Group Yields and Cost of Funds 16 NOTE: Bank Holding Company Performance Report Peer Group represents companies with consolidated assets between $3 billion and $1 0 billion. Virginia Heritage Bank acquisition closed on October 31, 2014. * Impact of July 2016 Sub - Debt Raise in 2016 was (5bps). The Sub - Debt raise impact on Cost of Funds in 2016 was 4bps. * * 5.37% 5.24% 5.11% 5.17% 5.54% 5.62% 5.61% 5.39% 4.72% 4.48% 4.41% 4.52% 4.85% 5.00% 5.04% 1.00% 2.00% 3.00% 4.00% 5.00% 6.00% 7.00% 2014Y 2015Y 2016Y 2017Y 2018Y 2019Q1 2019Q2 2019Q3 Yield on Loans EGBN Peer Group 0.33% 0.36% 0.44% 0.58% 0.99% 1.19% 1.30% 1.28% 0.45% 0.42% 0.44% 0.54% 0.81% 1.02% 1.04% 0.00% 0.25% 0.50% 0.75% 1.00% 1.25% 1.50% 2014Y 2015Y 2016Y 2017Y 2018Y 2019Q1 2019Q2 2019Q3 Cost of Funds EGBN Peer Group
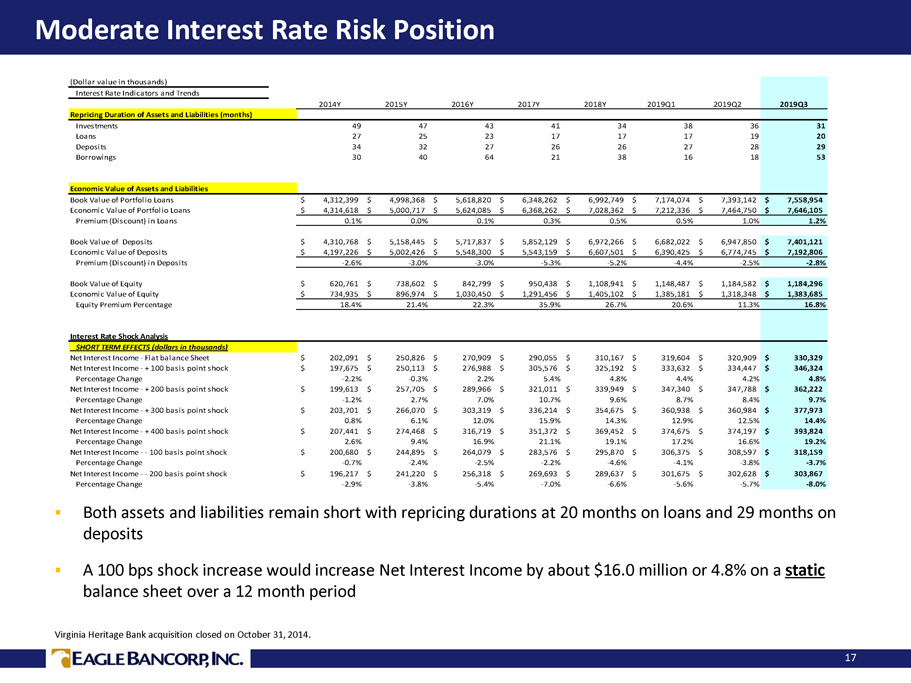
Moderate Interest Rate Risk Position 17 ▪ Both assets and liabilities remain short with repricing durations at 20 months on loans and 29 months on deposits ▪ A 100 bps shock increase would increase Net Interest Income by about $ 16.0 million or 4.8% on a static balance sheet over a 12 month period Virginia Heritage Bank acquisition closed on October 31, 2014. (Dollar value in thousands) Interest Rate Indicators and Trends 2014Y 2015Y 2016Y 2017Y 2018Y 2019Q1 2019Q2 2019Q3 Repricing Duration of Assets and Liabilities (months) Investments 49 47 43 41 34 38 36 31 Loans 27 25 23 17 17 17 19 20 Deposits 34 32 27 26 26 27 28 29 Borrowings 30 40 64 21 38 16 18 53 Economic Value of Assets and Liabilities Book Value of Portfolio Loans 4,312,399$ 4,998,368$ 5,618,820$ 6,348,262$ 6,992,749$ 7,174,074$ 7,393,142$ 7,558,954$ Economic Value of Portfolio Loans 4,314,618$ 5,000,717$ 5,624,085$ 6,368,262$ 7,028,362$ 7,212,336$ 7,464,750$ 7,646,105$ Premium (Discount) in Loans 0.1% 0.0% 0.1% 0.3% 0.5% 0.5% 1.0% 1.2% Book Value of Deposits 4,310,768$ 5,158,445$ 5,717,837$ 5,852,129$ 6,972,266$ 6,682,022$ 6,947,850$ 7,401,121$ Economic Value of Deposits 4,197,226$ 5,002,426$ 5,548,300$ 5,543,159$ 6,607,501$ 6,390,425$ 6,774,745$ 7,192,806$ Premium (Discount) in Deposits -2.6% -3.0% -3.0% -5.3% -5.2% -4.4% -2.5% -2.8% Book Value of Equity 620,761$ 738,602$ 842,799$ 950,438$ 1,108,941$ 1,148,487$ 1,184,582$ 1,184,296$ Economic Value of Equity 734,935$ 896,974$ 1,030,450$ 1,291,456$ 1,405,102$ 1,385,181$ 1,318,348$ 1,383,685$ Equity Premium Percentage 18.4% 21.4% 22.3% 35.9% 26.7% 20.6% 11.3% 16.8% Interest Rate Shock Analysis SHORT TERM EFFECTS (dollars in thousands) Net Interest Income - Flat balance Sheet 202,091$ 250,826$ 270,909$ 290,055$ 310,167$ 319,604$ 320,909$ 330,329$ Net Interest Income - + 100 basis point shock 197,675$ 250,113$ 276,988$ 305,576$ 325,192$ 333,632$ 334,447$ 346,324$ Percentage Change -2.2% -0.3% 2.2% 5.4% 4.8% 4.4% 4.2% 4.8% Net Interest Income - + 200 basis point shock 199,613$ 257,705$ 289,966$ 321,011$ 339,949$ 347,340$ 347,788$ 362,222$ Percentage Change -1.2% 2.7% 7.0% 10.7% 9.6% 8.7% 8.4% 9.7% Net Interest Income - + 300 basis point shock 203,701$ 266,070$ 303,319$ 336,214$ 354,675$ 360,938$ 360,984$ 377,973$ Percentage Change 0.8% 6.1% 12.0% 15.9% 14.3% 12.9% 12.5% 14.4% Net Interest Income - + 400 basis point shock 207,441$ 274,468$ 316,719$ 351,372$ 369,452$ 374,675$ 374,197$ 393,824$ Percentage Change 2.6% 9.4% 16.9% 21.1% 19.1% 17.2% 16.6% 19.2% Net Interest Income - - 100 basis point shock 200,680$ 244,895$ 264,079$ 283,576$ 295,870$ 306,375$ 308,597$ 318,159$ Percentage Change -0.7% -2.4% -2.5% -2.2% -4.6% -4.1% -3.8% -3.7% Net Interest Income - - 200 basis point shock 196,217$ 241,220$ 256,318$ 269,693$ 289,637$ 301,675$ 302,628$ 303,867$ Percentage Change -2.9% -3.8% -5.4% -7.0% -6.6% -5.6% -5.7% -8.0%

$0 $10,000 $20,000 $30,000 $40,000 $50,000 $60,000 $70,000 $80,000 $90,000 Revenue ($000s) Non-Int Expense ($000s) Consistent Increases in Operating Leverage 18 NOTE: P lease refer to the Non - GAAP reconciliation and footnotes in the appendices on pages 34 - 39. Virginia Heritage Bank acquisition closed on October 31, 2014. Data for Q2, Q3, Q4 2014 are shown on an operating basis, net of merger related expenses. Q4 2017 & Q1 2019 is shown on an adjusted basis.

51% 42% 40% 40% 37% 37% 38% 38% 68% 65% 64% 62% 61% 63% 62% 30% 35% 40% 45% 50% 55% 60% 65% 70% 75% 2014Y 2015Y 2016Y 2017Y 2018Y 2019Q1 2019Q2 2019Q3 EGBN Peer Group Superior Efficiency Ratio 19 Note: Bank Holding Company Performance Report Peer Group represents companies with consolidated assets between $3 billion an d $ 10 billion. Virginia Heritage Bank acquisition closed on October 31, 2014 . * Q1 2019 is shown on an adjusted basis. P lease refer to the Non - GAAP reconciliation and footnotes in the appendices on pages 34 - 39. *

Deposit Composition and Growth 20 Commercial focus drives growth of Noninterest Bearing Demand accounts Wholesale Deposits used to enhance cost of funds, not a strategy to replace growth in core deposits (1) Core deposits include CDAR’s and ICS reciprocal deposits. (Dollar Values in Thousands) Deposit Type % of % of % of Balance Total Balance Total Balance Total Noninterest Bearing 2,057,886$ 32.3% 2,104,220$ 30.2% 2,051,106$ 27.7% Interest Bearing Transaction 459,455 7.2% 593,107 8.5% 918,011 12.4% Core Savings & Money Market (1) 2,143,677 33.7% 2,304,996 33.1% 2,297,508 31.0% Core CD's (1) 737,573 11.6% 829,435 11.9% 823,994 11.1% Wholesale Money Market 429,582 6.7% 644,563 9.2% 737,022 10.0% Wholesale CD's 544,132 8.5% 497,964 7.1% 574,872 7.8% Total Deposits 6,372,305$ 100% 6,974,285$ 100% 7,402,513$ 100% As of December 31, 2018 As of September 30, 2019As of September 30, 2018

Detail of Loan Portfolio 21 32.1% 50.3% 15.1% Concentration in quality markets: Washington, DC, Montgomery County, Fairfax County Held for Sale residential mortgages not included NOTE: Data as of September 30, 2019 (Dollar Value in Thousands) County C&I Owner Occupied CRE Income Producing CRE CRE Bridge Financing Owner Occupied Const. CRE Construction Land Residential Mortgage Consumer TOTAL % of Total Maryland Montgomery 379,513$ 163,315$ 351,621$ 279,094$ 13,304$ 79,539$ 9,151$ 12,882$ 38,467$ 1,326,886$ 17.6% Prince George's 130,054 141,242 286,712 61,671 14,834 42,142 17,835 327 1,846 696,663 9.2% Baltimore 34,345 34,720 57,588 84,148 2,463 1,032 - - 260 214,556 2.8% Anne Arundel 15,533 22,094 40,454 78,365 - 14,067 271 3,072 1,031 174,887 2.3% Frederick 5,165 630 58,767 4,090 - - 6,468 732 382 76,234 1.0% Howard 14,942 11,394 31,965 14,103 - 650 4,877 971 1,247 80,149 1.1% Eastern Shore 8,076 10,504 64,840 - - - 131 1,272 678 85,501 1.1% Charles 4,227 20,407 9,709 - - - - 446 189 34,978 0.5% Other MD 4,541 8,771 11,843 - - 1,094 3,029 - 545 29,823 0.4% Washington DC 352,556 214,983 656,266 552,626 23,660 645,155 21,452 48,460 19,574 2,534,732 33.5% - Virginia Fairfax 246,952 69,392 259,379 168,929 - 63,795 3,773 16,377 9,771 838,368 11.1% Loudoun 32,412 48,002 124,311 56,223 12,336 11,956 4,086 1,350 3,155 293,831 3.9% Arlington 54,624 1,844 55,981 60,957 1,520 10,135 881 2,263 1,912 190,117 2.5% Alexandria 42,153 14,219 43,443 17,994 - 56,120 - 1,666 440 176,035 2.3% Prince William 9,262 31,576 83,910 17,756 206 9,011 4,399 - 1,415 157,535 2.1% Fauquier 2,905 3,000 5,005 3,271 - - - 773 269 15,223 0.2% Other VA 10,771 46,918 110,132 1,823 266 63 1,171 419 510 172,073 2.3% Other USA 118,831 113,335 120,832 38,475 13,327 38,394 3,112 13,553 1,711 461,570 6.1% Total $1,466,862 $956,346 $2,372,758 $1,439,525 $81,916 $973,153 $80,636 $104,563 $83,402 $7,559,161 100.0% % of Total 19.4% 12.7% 31.3% 19.0% 1.1% 12.9% 1.1% 1.4% 1.1% 100.0%

Credit Quality Trends 22 NOTE: Virginia Heritage Bank acquisition closed on October 31, 2014. (Dollar Values in Thousands) 2014Y 2015Y 2016Y 2017Y 2018Y 2019Q1 2019Q2 2019Q3 Nonperforming Assets: Accruing Loans 90 or More Days Past Due -$ -$ -$ -$ -$ -$ -$ 16,528$ Nonaccrual 22,443 13,239 17,875 13,238 16,277 40,261 37,408 41,122 Total Nonperforming Loans (NPLs) 22,443$ 13,239$ 17,875$ 13,238$ 16,277$ 40,261$ 37,408$ 57,650$ Other Real Estate Owned (OREO) 13,224 5,852 2,694 1,394 1,394 1,394 1,394 1,487 Total Nonperforming Assets 35,667$ 19,091$ 20,569$ 14,632$ 17,671$ 41,655$ 38,802$ 59,137$ Performing Restructured Loans (TDRs) 13,502 11,836 7,924 12,339 13,601 26,175 8,608 8,567 NPAs/Assets 0.68% 0.31% 0.30% 0.20% 0.21% 0.50% 0.45% 0.66% NPAs+TDRs/Assets 0.94% 0.51% 0.41% 0.36% 0.37% 0.81% 0.55% 0.75% Reserves 46,075$ 52,687$ 59,073$ 64,758$ 69,944$ 69,943$ 72,086$ 73,720$ Reserves/Loans 1.07% 1.05% 1.04% 1.01% 1.00% 0.98% 0.98% 0.98% Charge-Offs NCOs/Average Loans 0.17% 0.17% 0.09% 0.06% 0.05% 0.19% 0.08% 0.08%
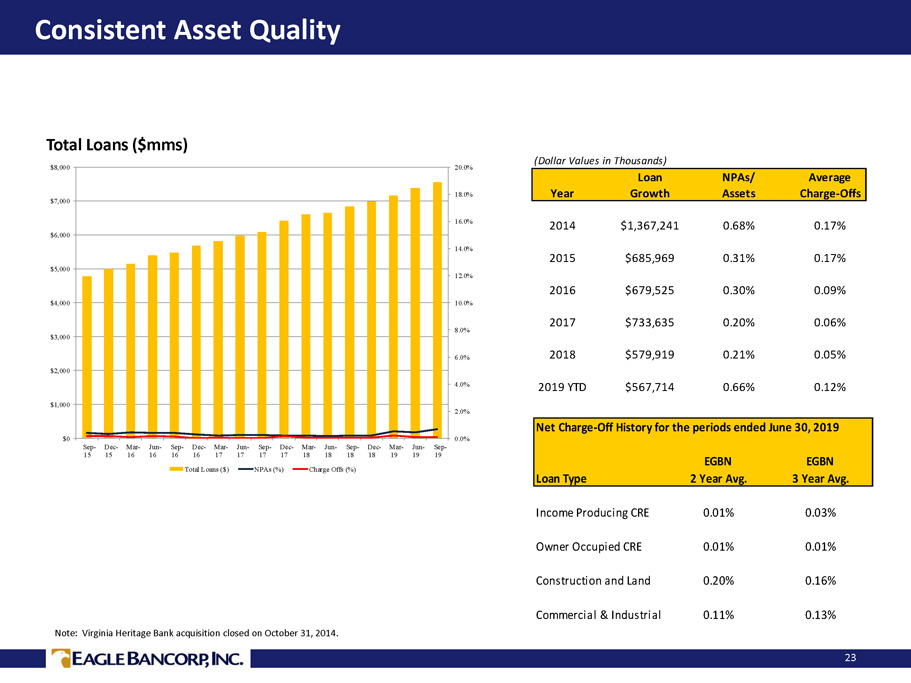
Consistent Asset Quality 23 Total Loans ($mms) Note: Virginia Heritage Bank acquisition closed on October 31, 2014. Net Charge-Off History for the periods ended June 30, 2019 EGBN EGBN Loan Type 2 Year Avg. 3 Year Avg. Income Producing CRE 0.01% 0.03% Owner Occupied CRE 0.01% 0.01% Construction and Land 0.20% 0.16% Commercial & Industrial 0.11% 0.13% 0.0% 2.0% 4.0% 6.0% 8.0% 10.0% 12.0% 14.0% 16.0% 18.0% 20.0% $0 $1,000 $2,000 $3,000 $4,000 $5,000 $6,000 $7,000 $8,000 Sep- 15 Dec- 15 Mar- 16 Jun- 16 Sep- 16 Dec- 16 Mar- 17 Jun- 17 Sep- 17 Dec- 17 Mar- 18 Jun- 18 Sep- 18 Dec- 18 Mar- 19 Jun- 19 Sep- 19 Total Loans ($) NPAs (%) Charge Offs (%) (Dollar Values in Thousands) Loan NPAs/ Average Year Growth Assets Charge-Offs 2014 $1,367,241 0.68% 0.17% 2015 $685,969 0.31% 0.17% 2016 $679,525 0.30% 0.09% 2017 $733,635 0.20% 0.06% 2018 $579,919 0.21% 0.05% 2019 YTD $567,714 0.66% 0.12%
Strength in C&I Lending 24 At 19% of the Loan Portfolio, EagleBank has a much larger focus o n C&I Lending than other local peer banks C&I Loan Portfolio is predominantly variable rate loans 11% Annual growth rate of Owner Occupied Loans, which are key to small and mid - market relationships DDA Operating Accounts of C&I relationships are a critical component of deposit composition strategy Treasury Management services provide opportunity for relationship retention and expansion
CRE Risk Management 25 Executive & Board Level Oversight of Approval Process Disciplined Underwriting Proactive Portfolio Management Quarterly Stress Testing of CRE Portfolio Quarterly Independent Credit Review Dedicated Special Assets Team

CRE Concentration 26 (1) All peer group and other data is from the FR Y - 9C and Bank Holding Company Performance Report. Peer group data is based on the Compa ny’s asset size at the time of reporting. (2) Represents CRE (excluding owner occupied) concentration as a percentage of EGBN consolidated risk - based capital. * Virginia Heritage Bank acquisition closed on October 31, 2014 . (Dollar Values in Thousands) 2010Y 2011Y 2012Y 2013Y 2014Y* 2015Y 2016Y 2017Y 2018Y 2019Q1 2019Q2 2019Q3 Total CRE Portfolio (excl Own Occ) 909,058$ 1,147,897$ 1,431,984$ 1,660,266$ 2,453,662$ 2,978,550$ 3,246,636$ 3,900,263$ 4,213,281$ 4,385,841$ 4,602,792$ 4,809,433$ CRE/Total Loans (1) 51.77% 47.63% 57.44% 56.37% 56.78% 59.59% 57.18% 60.83% 60.26% 61.14% 62.26% 63.62% CRE Nonperforming Loans NPLs/Total CRE 1.43% 1.67% 1.40% 0.88% 0.23% 0.22% 0.34% 0.16% 0.14% 0.45% 0.20% 0.26% Peer NPLs/Total CRE (1) 4.42% 3.52% 2.40% 1.50% 0.86% 0.53% 0.40% 0.33% 0.41% 0.41% 0.38% Total Net Charge Offs NCOs/Total CRE 0.18% 0.09% 0.18% 0.07% 0.07% 0.06% 0.04% 0.07% 0.01% 0.26% 0.18% 0.11% Peer NCOs/Total CRE (1) 1.53% 1.10% 0.67% 0.22% 0.06% 0.01% 0.01% 0.01% 0.01% 0.01% 0.01% CRE Concentration (2) 401.12% 392.96% 375.05% 377.00% 388.64% 394.40% 319.33% 345.17% 325.08% 328.92% 336.65% 355.12%

ADC Concentration 27 (1) All peer group and other data is from the FR Y - 9C and Bank Holding Company Performance Report. Peer group data is based on t he Company’s asset size at the time of reporting . (2) Represents ADC concentration as a percentage of EGBN consolidated risk - based capital. (3) Adjusted ADC Concentration exclud es loans which are income producing and have a U & O permit. * Virginia Heritage Bank acquisition closed on October 31, 2014 . (Dollar Values in Thousands) 2010Y 2011Y 2012Y 2013Y 2014Y* 2015Y 2016Y 2017Y 2018Y 2019Q1 2019Q2 2019Q3 Total ADC Portfolio 327,718$ 448,470$ 539,069$ 628,880$ 798,241$ 909,654$ 976,599$ 1,413,922$ 1,616,098$ 1,626,531$ 1,618,114$ 1,657,638$ ADC/Total Loans (1) 18.66% 18.61% 21.62% 21.35% 18.47% 18.20% 17.20% 22.05% 23.12% 22.68% 21.89% 21.89% ADC Nonperforming Loans NPLs/Total ADC 4.50% 3.89% 3.45% 1.33% 0.51% 0.08% 0.13% 0.05% 0.25% 0.19% 0.57% 0.55% Peer NPLs/Total ADC (1) 11.24% 8.85% 6.51% 2.91% 1.28% 0.63% 0.35% 0.21% 0.18% 0.20% 0.14% Total Net Charge Offs NCOs/Total ADC 0.52% 0.28% 0.44% 0.21% 0.26% -0.02% 0.16% 0.15% 0.01% 0.00% 0.00% 0.00% Peer NCOs/Total ADC (1) 4.30% 3.09% 2.37% 0.46% -0.11% -0.04% -0.06% -0.04% -0.02% -0.01% -0.01% ADC Concentration (2) 144.60% 153.52% 141.19% 142.80% 126.44% 120.45% 96.05% 125.13% 124.69% 121.98% 118.35% 122.40%
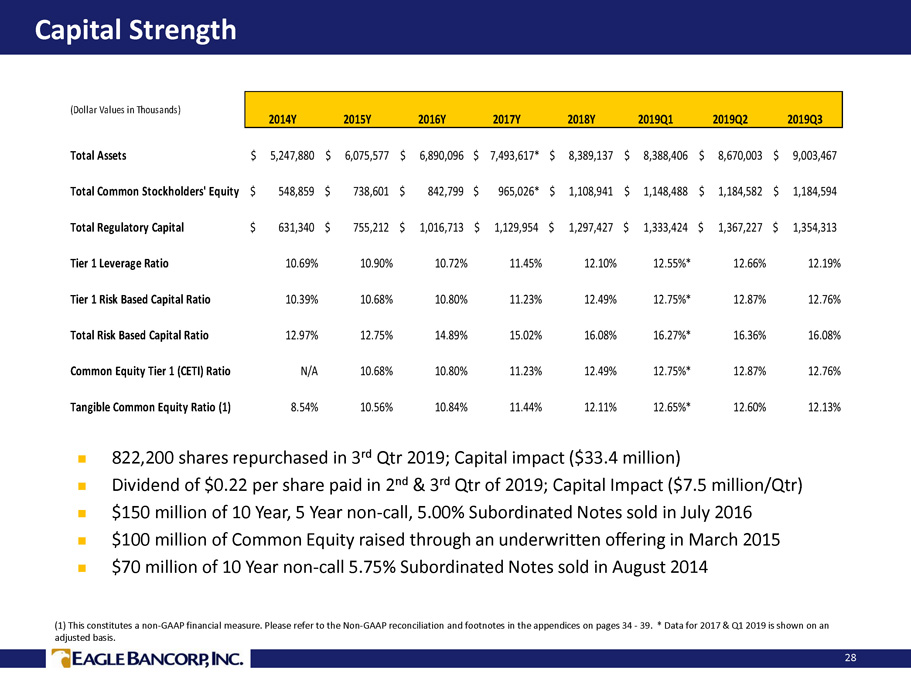
Capital Strength 28 822,200 shares repurchased in 3 rd Qtr 2019; Capital impact ($33.4 million) Dividend of $0.22 per share paid in 2 nd & 3 rd Qtr of 2019; Capital Impact ($7.5 million/ Qtr ) $150 million of 10 Year, 5 Year non - call, 5.00% Subordinated Notes sold in July 2016 $100 million of Common Equity raised through an underwritten offering in March 2015 $70 million of 10 Year non - call 5.75% Subordinated Notes sold in August 2014 (1) This constitutes a non - GAAP financial measure. P lease refer to the Non - GAAP reconciliation and footnotes in the appendices on pages 34 - 39. * Data for 2017 & Q1 2019 is shown on an adjusted basis. (Dollar Values in Thousands) 2014Y 2015Y 2016Y 2017Y 2018Y 2019Q1 2019Q2 2019Q3 Total Assets 5,247,880$ 6,075,577$ 6,890,096$ $ 7,493,617* 8,389,137$ 8,388,406$ 8,670,003$ 9,003,467$ Total Common Stockholders' Equity 548,859$ 738,601$ 842,799$ $ 965,026* 1,108,941$ 1,148,488$ 1,184,582$ 1,184,594$ Total Regulatory Capital 631,340$ 755,212$ 1,016,713$ 1,129,954$ 1,297,427$ 1,333,424$ 1,367,227$ 1,354,313$ Tier 1 Leverage Ratio 10.69% 10.90% 10.72% 11.45% 12.10% 12.55%* 12.66% 12.19% Tier 1 Risk Based Capital Ratio 10.39% 10.68% 10.80% 11.23% 12.49% 12.75%* 12.87% 12.76% Total Risk Based Capital Ratio 12.97% 12.75% 14.89% 15.02% 16.08% 16.27%* 16.36% 16.08% Common Equity Tier 1 (CETI) Ratio N/A 10.68% 10.80% 11.23% 12.49% 12.75%* 12.87% 12.76% Tangible Common Equity Ratio (1) 8.54% 10.56% 10.84% 11.44% 12.11% 12.65%* 12.60% 12.13%

Key Success Factors 29 ▪ Building and maintaining core relationships o Cross sales o Focus on key customers ▪ Maintenance of strong credit culture o Conservative underwriting criteria and loan policies o Disciplined committee approval and review process o Portfolio is balanced among C&I, CRE and Construction o Periodic loan and portfolio stress testing o Proactive identification and resolution of problem credits ▪ Built and preserved a strong capital position and balance sheet o Nine capital raising events since August 2008 o Consistent quarterly profitability bolsters the capital position

Key Success factors (continued) 30 Disciplined ALCO process Maintained focus on areas of strength o Concentration on core geographic markets and products P roper infrastructure to support the increased volume of business and regulation Comprehensive Management and Board level reporting Human Resources o Recruiting of strong, seasoned bankers with local market knowledge and experience o Well designed, incentive based compensation plans o Stability of staff, low turnover rate

EagleBank Growth Strategy 31 Profitability • Pricing discipline to sustain Net Interest Margin • Prudent expense management with streamlined branch system to maintain Efficiency Ratio Sustain Credit Quality • Maintain balanced portfolio mix: C&I, CRE and Construction • Enhanced monitoring of individual credits • Expanded stress testing Emphasis on Organic Growth • Only 3.2% deposit market share in DC Metro Area • Significant opportunities to expand C&I business lines including loans and treasury management products • Attract new relationships and develop cross sell opportunities • Enhance infrastructure to support growth beyond $10 billion in assets Opportunities For Noninterest Income • Residential mortgage origination , FHA commercial mortgage origination, SBA guaranteed loans, treasury management services, insurance
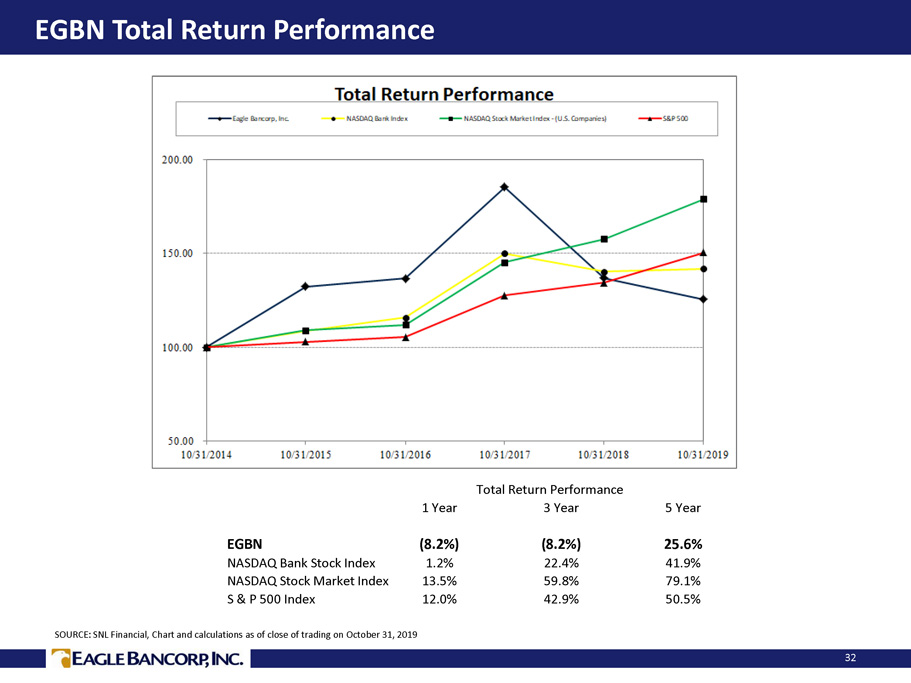
EGBN Total Return Performance 32 Total Return Performance 1 Year 3 Year 5 Year EGBN (8.2%) (8.2%) 25.6% NASDAQ Bank Stock Index 1.2% 22.4% 41.9% NASDAQ Stock Market Index 13.5% 59.8% 79.1% S & P 500 Index 12.0% 42.9% 50.5% SOURCE: SNL Financial, Chart and calculations as of close of trading on October 31, 2019

Appendices 33
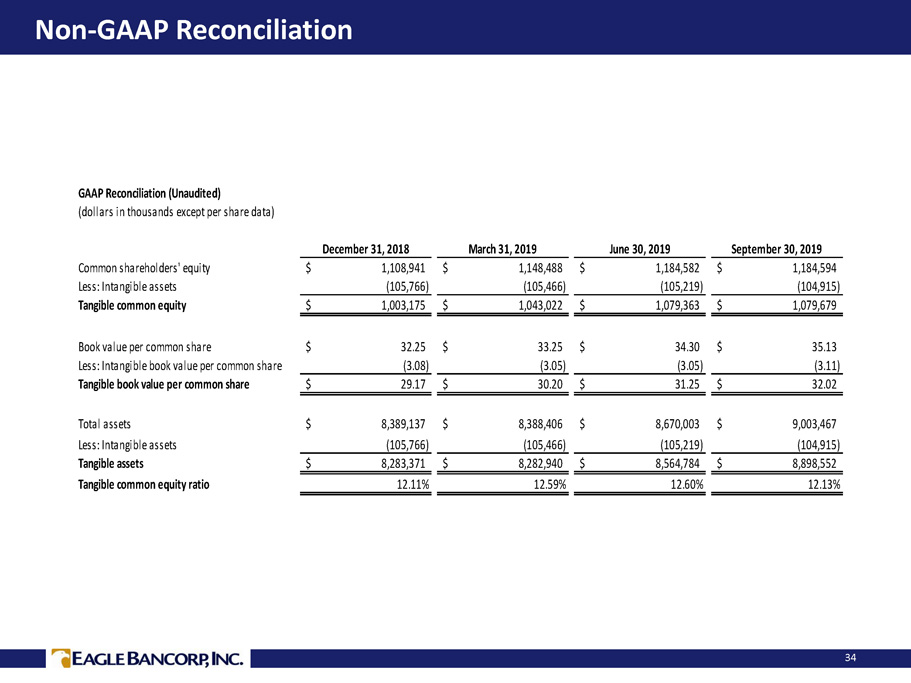
Non - GAAP Reconciliation 34 GAAP Reconciliation (Unaudited) (dollars in thousands except per share data) December 31, 2018 March 31, 2019 June 30, 2019 September 30, 2019 Common shareholders' equity 1,108,941$ 1,148,488$ 1,184,582$ 1,184,594$ Less: Intangible assets (105,766) (105,466) (105,219) (104,915) Tangible common equity 1,003,175$ 1,043,022$ 1,079,363$ 1,079,679$ Book value per common share 32.25$ 33.25$ 34.30$ 35.13$ Less: Intangible book value per common share (3.08) (3.05) (3.05) (3.11) Tangible book value per common share 29.17$ 30.20$ 31.25$ 32.02$ Total assets 8,389,137$ 8,388,406$ 8,670,003$ 9,003,467$ Less: Intangible assets (105,766) (105,466) (105,219) (104,915) Tangible assets 8,283,371$ 8,282,940$ 8,564,784$ 8,898,552$ Tangible common equity ratio 12.11% 12.59% 12.60% 12.13%

Non - GAAP Reconciliation 35 * Data for 2017 is shown on an operating basis. GAAP Reconciliation (Unaudited) (dollars in thousands except per share data) December 31, 2014 December 31, 2015 December 31, 2016 December 31, 2017* December 31, 2018 Common shareholders' equity 548,859$ 738,601$ 842,799$ 965,026$ 1,108,941$ Less: Intangible assets (109,908) (108,542) (107,419) (107,212) (105,766) Tangible common equity 438,951$ 630,059$ 735,380$ 857,814$ 1,003,175$ Book value per common share 18.21$ 22.07$ 24.77$ 28.23$ 32.25$ Less: Intangible book value per common share (3.65) (3.24) (3.16) (3.14) (3.08) Tangible book value per common share 14.56$ 18.83$ 21.61$ 25.09$ 29.17$ Total assets 5,247,880$ 6,076,649$ 6,890,097$ 7,493,617$ 8,389,137$ Less: Intangible assets (109,908) (108,542) (107,419) (107,212) (105,766) Tangible assets 5,137,972$ 5,968,107$ 6,782,678$ 7,386,405$ 8,283,371$ Tangible common equity ratio 8.54% 10.56% 10.84% 11.61% 12.11%
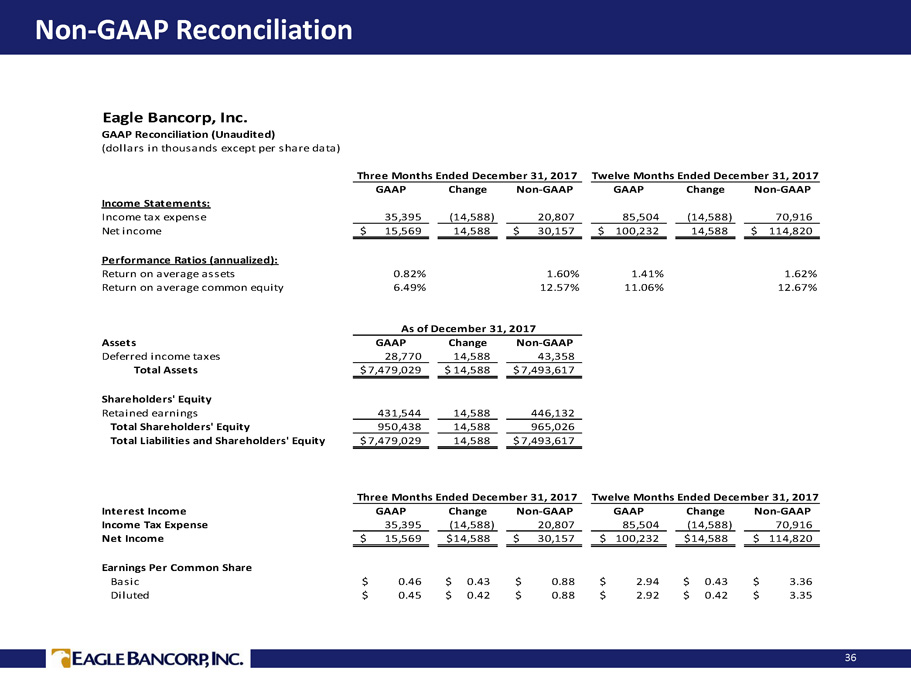
Non - GAAP Reconciliation 36 Eagle Bancorp, Inc. GAAP Reconciliation (Unaudited) (dollars in thousands except per share data) GAAP Change Non-GAAP GAAP Change Non-GAAP Income Statements: Income tax expense 35,395 (14,588) 20,807 85,504 (14,588) 70,916 Net income 15,569$ 14,588 30,157$ 100,232$ 14,588 114,820$ Performance Ratios (annualized): Return on average assets 0.82% 1.60% 1.41% 1.62% Return on average common equity 6.49% 12.57% 11.06% 12.67% Assets GAAP Change Non-GAAP Deferred income taxes 28,770 14,588 43,358 Total Assets 7,479,029$ 14,588$ 7,493,617$ Shareholders' Equity Retained earnings 431,544 14,588 446,132 Total Shareholders' Equity 950,438 14,588 965,026 Total Liabilities and Shareholders' Equity 7,479,029$ 14,588 7,493,617$ Interest Income GAAP Change Non-GAAP GAAP Change Non-GAAP Income Tax Expense 35,395 (14,588) 20,807 85,504 (14,588) 70,916 Net Income 15,569$ 14,588$ 30,157$ 100,232$ 14,588$ 114,820$ Earnings Per Common Share Basic 0.46$ 0.43$ 0.88$ 2.94$ 0.43$ 3.36$ Diluted 0.45$ 0.42$ 0.88$ 2.92$ 0.42$ 3.35$ As of December 31, 2017 Three Months Ended December 31, 2017 Twelve Months Ended December 31, 2017 Three Months Ended December 31, 2017 Twelve Months Ended December 31, 2017

Non - GAAP Reconciliation 37 Eagle Bancorp, Inc. GAAP Reconciliation (Unaudited) (dollars in thousands except per share data) GAAP Change Non-GAAP Noninterest Expense Salaries and employee benefits 23,644 (6,153) 17,491 Total noninterest expense 38,304 (6,153) 32,151 Income Before Income Tax Expense 45,645 6,153 51,798 Income Tax Expense 11,895 1,404 13,299 Net Income 33,749$ 4,749$ 38,499$ Earnings Per Common Share Basic 0.98$ 0.14$ 1.12$ Diluted 0.98$ 0.13$ 1.11$ Book value per common share at period end 33.25$ 33.39$ Tangible book value per common share at period end 30.20$ 30.33$ Return on average assets 1.62% 1.85% Return on average common equity 12.12% 13.84% Return on average tangible common equity 13.38% 15.26% Efficiency ratio 43.87% 36.82% Effective tax rate 26.06% 25.67% Other Ratios: Common equity to total assets 13.69% 13.75% Tier 1 capital (to average assets) 12.49% 12.55% Tier 1 risk based capital ratio 11.69% 11.69% Total capital (to risk weighted assets) 16.22% 16.27% Common equity tier 1 capital (to risk weighted assets) 12.69% 12.75% Tangible common equity ratio 12.59% 12.65% Non Interest Expense as a % of average assets 1.81% 1.52% Allowance for credit losses to total nonperforming loans 173.72% 329.15% Three Months Ended March 31, 2019

Non - GAAP Reconciliation 38 GAAP Reconciliation (Unaudited) (dollars in thousands except per share data) Three Months Ended Nine Months Ended Twelve Months Ended Three Months Ended Nine Months Ended September 30, 2019 September 30, 2019 December 31, 2018 September 30, 2018 September 30, 2018 Common shareholders' equity 1,184,594$ 1,108,941$ 1,061,651$ Less: Intangible assets (104,915) (105,766) (106,481) Tangible common equity 1,079,679$ 1,003,175$ 955,170$ Book value per common share 35.13$ 32.25$ 30.94$ Less: Intangible book value per common share (3.11) (3.08) (3.10) Tangible book value per common share 32.02$ 29.17$ 27.84$ Total assets 9,003,467$ 8,389,137$ 8,057,855$ Less: Intangible assets (104,915) (105,766) (106,481) Tangible assets 8,898,552$ 8,283,371$ 7,951,374$ Tangible common equity ratio 12.13% 12.11% 12.01% Average common shareholders' equity 1,197,513$ 1,164,541$ 1,022,642$ 1,040,826$ 1,003,439$ Less: Average intangible assets (105,034) (105,297) (106,806) (106,629) (106,949) Average tangible common equity 1,092,479$ 1,059,245$ 915,836$ 934,197$ 896,490$ Net Income Available to Common Shareholders 36,495$ 107,487$ 152,276$ 38,949$ 111,959$ Average tangible common equity 1,092,479$ 1,059,245$ 915,836$ 934,197$ 896,490$ 13.25% 13.57% 16.63% 16.54% 16.70% Annualized Return on Average Tangible Common Equity (1) Eagle Bancorp, Inc. GAAP Reconciliation (Unaudited) (dollars in thousands except per share data) GAAP Change Non-GAAP Noninterest Expense Nonperforming assets 59,137$ (16,528)$ 42,609$ Nonperforming loans 57,650$ (16,528)$ 41,122$ Other Ratios (annualized): Nonperforming assets to total assets (4) 0.66% 0.47% Nonperforming loans to total loans (4) 0.76% 0.54% Allowance for credit losses to total nonperforming loans (4) 127.87% 179.27% Nine Months Ended September 30, 2019 (4) Nonperforming loans at September 30, 2019, includes a $16.5 million loan that was brought current shortly after quarter e nd.
Non - GAAP Reconciliation 39 (1) Tangible common equity to tangible assets (the "tangible common equity ratio") and tangible book value per common share are non-GAAP financial measures derived from GAAP-based amounts. The Company calculates the tangible common equity ratio by excluding the balance of intangible assets from common shareholders' equity and dividing by tangible assets. The Company calculates tangible book value per common share by dividing tangible common equity by common shares outstanding, as compared to book va lue per common share, which the Company calculates by dividing common shareholders' equity by common shares outstanding. The Company considers this information important to shareholders' as tangible equity is a measure that is consistent with the calculation of capital for bank regulatory purposes, which excludes intangible assets from the calculation of risk based ratios and as such is useful for investors, regulators, management and others to evaluate capital adequacy and to compare against other financial institutions.

Market Information – Washington, DC MSA 40 Population 6.2 Million □ 6 th largest market in the U.S. Employment 3.3 Million □ 38,400 new jobs created in 12 months ended August, 2019 □ Employment growth driven by private sector, over 222,000 net new private sector jobs created over last five years □ Unemployment rate of 3.2% vs. US average of 3.7% (August 2019) Gross Regional Product (GRP) $529 Billion □ 5th largest regional economy in the U.S. □ 16.7% growth in GRP over the last 10 years □ Federal Government Spending is 31.0% of GRP □ Highest median household income of any major U.S. market
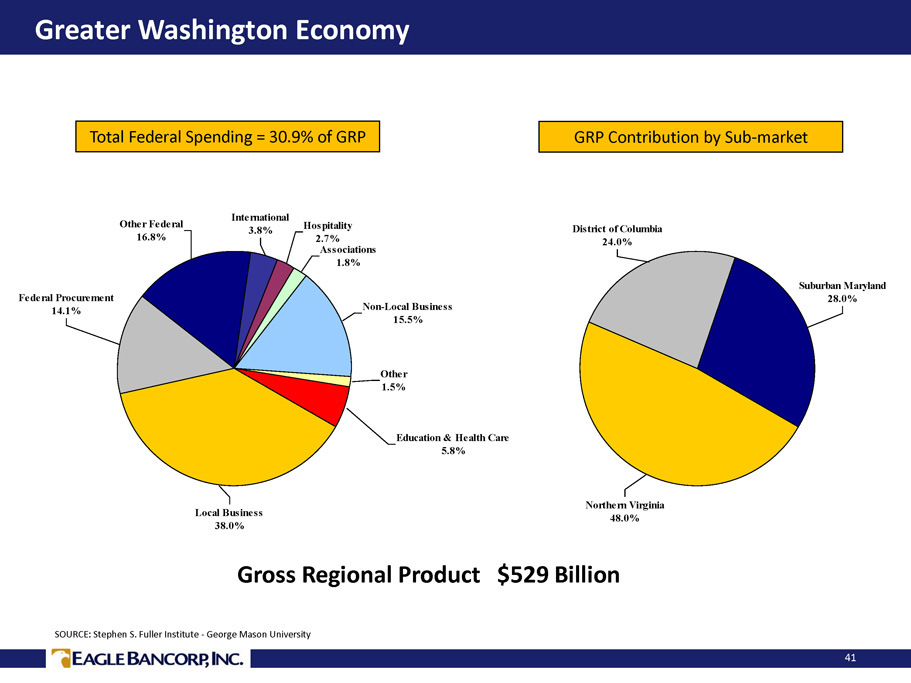
Greater Washington Economy 41 Total Federal Spending = 30.9% of GRP GRP Contribution by Sub - market Education & Health Care 5.8% Other 1.5% Non-Local Business 15.5% Associations 1.8% Hospitality 2.7% International 3.8% Other Federal 16.8% Federal Procurement 14.1% Local Business 38.0% Suburban Maryland 28.0% District of Columbia 24.0% Northern Virginia 48.0% Gross Regional Product $529 Billion SOURCE: Stephen S. Fuller Institute - George Mason University

Loan Portfolio and Growth 42 (Dollar Values in Thousands) Annual Growth Rate Loan Type Balance % of Total Balance % of Total Balance % of Total % Commercial and Industrial 1,493,577$ 22.0% 1,553,111$ 22.2% 1,466,862$ 19.4% (1.8%) Commercial Real Estate: Owner Occupied 863,162 12.6% 887,814 12.7% 956,346 12.7% 10.8% Income Producing 1,949,757 28.5% 2,030,826 29.1% 2,372,758 31.4% 21.7% CRE Bridge Financing 1,240,153 18.1% 1,226,073 17.5% 1,439,525 19.0% 16.1% Subtotal 4,053,072$ 59.2% 4,144,713$ 59.3% 4,768,629$ 63.1% 17.7% Construction & Land: Owner Occupied 56,572 0.8% 57,797 0.8% 81,916 1.1% 44.8% CRE Construction 982,327 14.4% 980,938 14.1% 973,153 12.9% (0.9%) Land 65,264 1.0% 58,877 0.8% 80,636 1.1% 23.6% Subtotal 1,104,163$ 16.1% 1,097,612$ 15.7% 1,135,705$ 15.0% 2.9% Residential Mortgage 104,864$ 1.5% 106,419$ 1.5% 104,563$ 1.4% (0.3%) Consumer & Other 88,996$ 1.3% 89,592$ 1.3% 83,402$ 1.1% (6.3%) Total Loans 6,844,672$ 100.0% 6,991,447$ 100.0% 7,559,161$ 100.0% 10.4% As of September 30, 2018 As of December 31, 2018 As of September 30, 2019
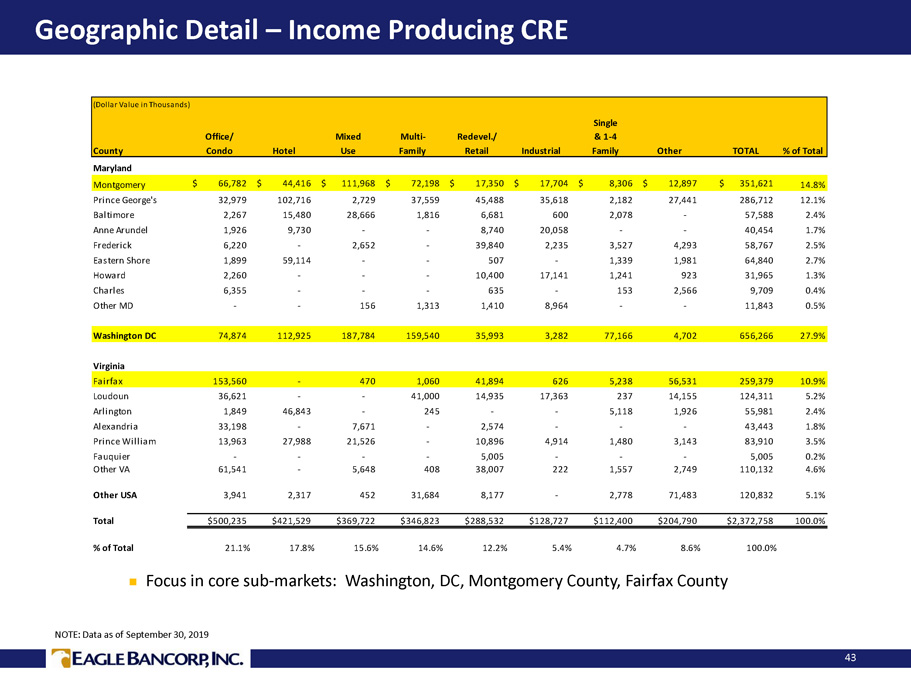
Geographic Detail – Income Producing CRE 43 Focus in core sub - markets: Washington, DC, Montgomery County, Fairfax County NOTE: Data as of September 30, 2019 (Dollar Value in Thousands) Single Office/ Mixed Multi- Redevel./ & 1-4 County Condo Hotel Use Family Retail Industrial Single & 1-4 Family Other TOTAL % of Total Maryland Montgomery 66,782$ 44,416$ 111,968$ 72,198$ 17,350$ 17,704$ 8,306$ 12,897$ 351,621$ 14.8% Prince George's 32,979 102,716 2,729 37,559 45,488 35,618 2,182 27,441 286,712 12.1% Baltimore 2,267 15,480 28,666 1,816 6,681 600 2,078 - 57,588 2.4% Anne Arundel 1,926 9,730 - - 8,740 20,058 - - 40,454 1.7% Frederick 6,220 - 2,652 - 39,840 2,235 3,527 4,293 58,767 2.5% Eastern Shore 1,899 59,114 - - 507 - 1,339 1,981 64,840 2.7% Howard 2,260 - - - 10,400 17,141 1,241 923 31,965 1.3% Charles 6,355 - - - 635 - 153 2,566 9,709 0.4% Other MD - - 156 1,313 1,410 8,964 - - 11,843 0.5% Washington DC 74,874 112,925 187,784 159,540 35,993 3,282 77,166 4,702 656,266 27.9% Virginia Fairfax 153,560 - 470 1,060 41,894 626 5,238 56,531 259,379 10.9% Loudoun 36,621 - - 41,000 14,935 17,363 237 14,155 124,311 5.2% Arlington 1,849 46,843 - 245 - - 5,118 1,926 55,981 2.4% Alexandria 33,198 - 7,671 - 2,574 - - - 43,443 1.8% Prince William 13,963 27,988 21,526 - 10,896 4,914 1,480 3,143 83,910 3.5% Fauquier - - - - 5,005 - - - 5,005 0.2% Other VA 61,541 - 5,648 408 38,007 222 1,557 2,749 110,132 4.6% Other USA 3,941 2,317 452 31,684 8,177 - 2,778 71,483 120,832 5.1% Total $500,235 $421,529 $369,722 $346,823 $288,532 $128,727 $112,400 $204,790 $2,372,758 100.0% % of Total 21.1% 17.8% 15.6% 14.6% 12.2% 5.4% 4.7% 8.6% 100.0%

Geographic Detail – Construction 44 Focus in core sub - markets: Washington, DC, Montgomery County, Fairfax County Recognized expertise in Single Family and Condo construction lending Portfolio is diversified among collateral types NOTE: Data as of September 30, 2019 (Dollar Value in Thousands) Single Mixed Multi- Residential & 1-4 County Use Family Condo Single & 1-4 Family Office Hotel Retail Other TOTAL % of Total Maryland Montgomery -$ 5,284$ -$ 43,782$ 20,973$ -$ -$ 9,500$ 79,539$ 8.2% Prince George's - 10,822 - 3,369 - 18,795 - 9,156 42,142 4.3% Baltimore - - - 1,032 - - - - 1,032 0.1% Anne Arundel 14,067 - - - - - - - 14,067 1.4% Frederick - - - - - - - - - 0.0% Eastern Shore - - - - - - - - - 0.0% Howard - - - 650 - - - - 650 0.1% Charles - - - - - - - - - 0.0% Other MD 1,094 - - - - - - - 1,094 0.1% Washington DC 153,304 180,124 145,666 53,902 101,500 - 832 9,827 645,155 66.4% Virginia Fairfax 3,055 761 3,324 36,612 7,438 - - 12,605 63,795 6.6% Loudoun 964 - 7,208 510 2,988 - 286 - 11,956 1.2% Arlington - - - 10,135 - - - - 10,135 1.0% Alexandria 54,094 - - 2,026 - - - - 56,120 5.8% Prince William - - - 1,610 - - - 7,401 9,011 0.9% Fauquier - - - - - - - 0.0% Other VA - - - 63 - - - - 63 0.0% Other USA - - - 75 - 30,357 - 7,962 38,394 3.9% Total $226,578 $196,991 $156,198 $153,766 $132,899 $49,152 $1,118 $56,451 $973,153 100.0% % of Total 23.3% 20.1% 16.1% 15.8% 13.7% 5.1% 0.1% 5.8% 100.0% Renovation 61,306$ 57,627$ 33,059$ 46,039$ 106,798$ -$ -$ 20,233$ 325,062$ 33.4% Ground-Up 165,272$ 139,364$ 123,139$ 107,727$ 26,101$ 49,152$ 1,118$ 36,218$ 648,091$ 66.6%
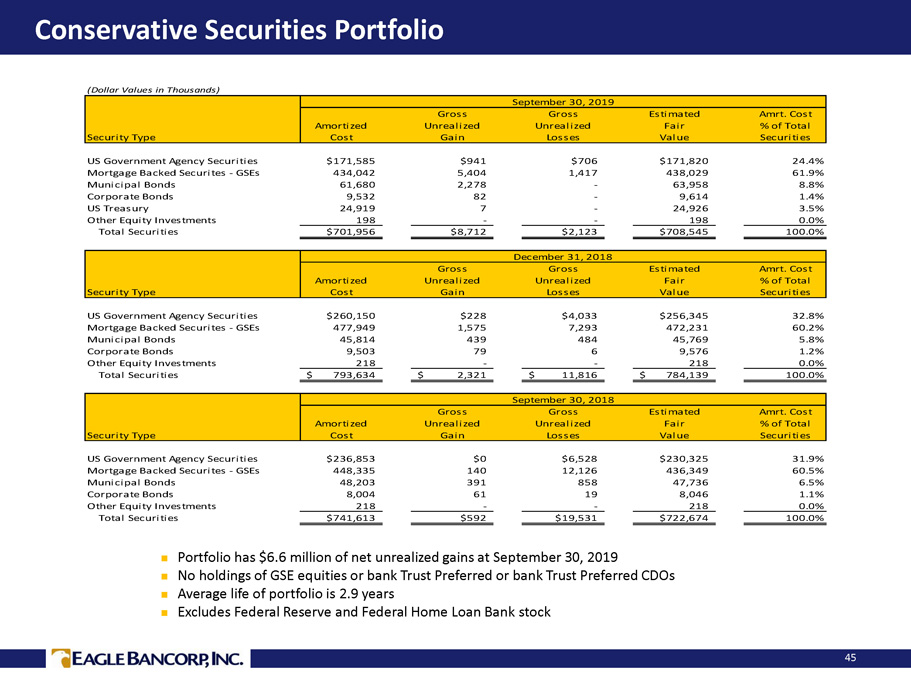
Conservative Securities Portfolio 45 Portfolio has $6.6 million of net unrealized gains at September 30, 2019 No holdings of GSE equities or bank Trust Preferred or bank Trust Preferred CDOs Average life of portfolio is 2.9 years Excludes Federal Reserve and Federal Home Loan Bank stock (Dollar Values in Thousands) September 30, 2019 Gross Gross Estimated Amrt. Cost Amortized Unrealized Unrealized Fair % of Total Security Type Cost Gain Losses Value Securities US Government Agency Securities $171,585 $941 $706 $171,820 24.4% Mortgage Backed Securites - GSEs 434,042 5,404 1,417 438,029 61.9% Municipal Bonds 61,680 2,278 - 63,958 8.8% Corporate Bonds 9,532 82 - 9,614 1.4% US Treasury 24,919 7 - 24,926 3.5% Other Equity Investments 198 - - 198 0.0% Total Securities $701,956 $8,712 $2,123 $708,545 100.0% December 31, 2018 Gross Gross Estimated Amrt. Cost Amortized Unrealized Unrealized Fair % of Total Security Type Cost Gain Losses Value Securities US Government Agency Securities $260,150 $228 $4,033 $256,345 32.8% Mortgage Backed Securites - GSEs 477,949 1,575 7,293 472,231 60.2% Municipal Bonds 45,814 439 484 45,769 5.8% Corporate Bonds 9,503 79 6 9,576 1.2% Other Equity Investments 218 - - 218 0.0% Total Securities 793,634$ 2,321$ 11,816$ 784,139$ 100.0% September 30, 2018 Gross Gross Estimated Amrt. Cost Amortized Unrealized Unrealized Fair % of Total Security Type Cost Gain Losses Value Securities US Government Agency Securities $236,853 $0 $6,528 $230,325 31.9% Mortgage Backed Securites - GSEs 448,335 140 12,126 436,349 60.5% Municipal Bonds 48,203 391 858 47,736 6.5% Corporate Bonds 8,004 61 19 8,046 1.1% Other Equity Investments 218 - - 218 0.0% Total Securities $741,613 $592 $19,531 $722,674 100.0%
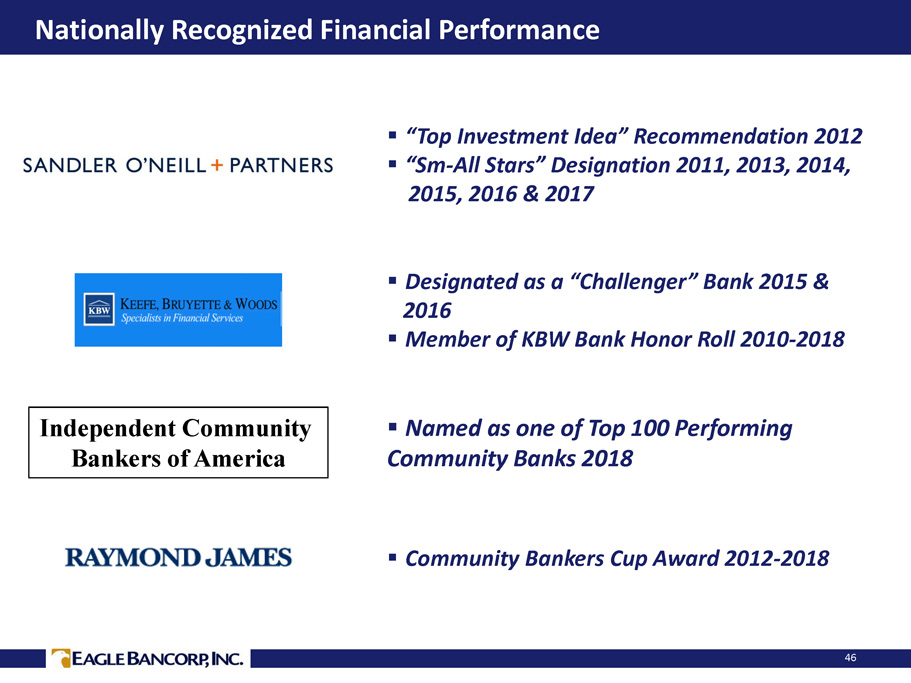
Nationally Recognized Financial Performance 46 ▪ “Top Investment Idea” Recommendation 2012 ▪ “Sm - All Stars” Designation 2011, 2013, 2014, 2015, 2016 & 2017 ▪ Designated as a “Challenger” Bank 2015 & 2016 ▪ Member of KBW Bank Honor Roll 2010 - 2018 ▪ Named as one of Top 100 Performing Community Banks 2018 Independent Community Bankers of America ▪ Community Bankers Cup Award 2012 - 2018
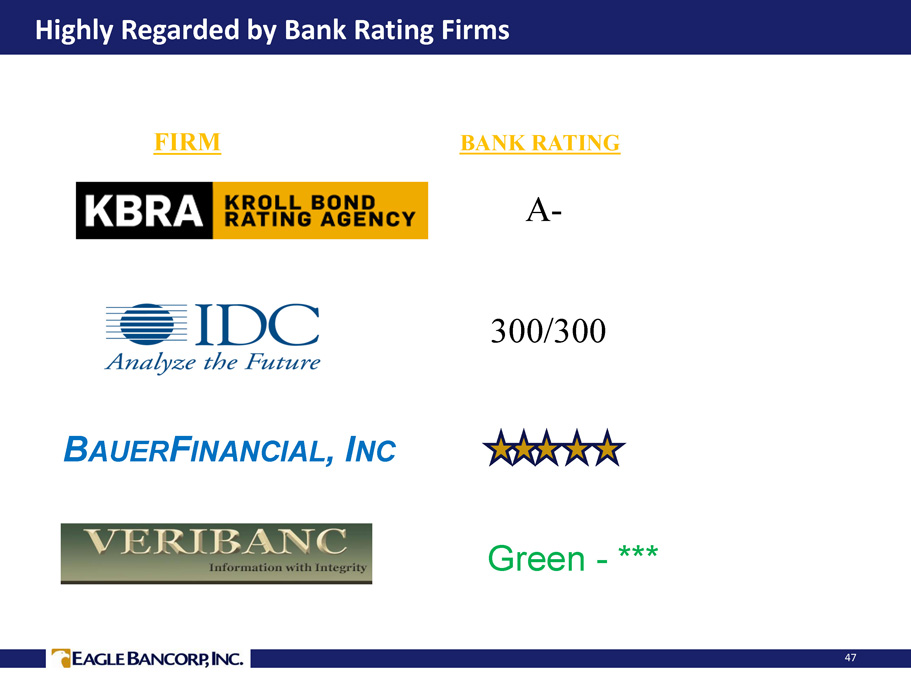
Highly Regarded by Bank Rating Firms 47 FIRM BANK RATING B AUER F INANCIAL , I NC A - 300/300 Green - ***

Experienced Management Team 48 Susan G. Riel, Chief Executive Officer & President Eagle Bancorp & EagleBank Ms. Riel, President - Chief Executive Officer of the Bank and Bancorp, and formerly Chief Operating Officer . Ms . Riel has been with the bank for 20 years. She previously served as Executive Vice President - Chief Operating Officer of Columbia First Bank, FSB from 1989 until t hat institution’s acquisition by First Union Bancorp in 1995. She is one of the founding officers of EagleBank. Ms. Riel has over 42 years of experience in the commercial banking industry . Ms. Riel was recently included in the Bisnow 2017 Power Series: Women of Influence in Commercial Real Estate. Charles D. Levingston, EVP, Chief Financial Officer, Eagle Bancorp, Inc. and EagleBank Mr. Levingston, Executive Vice President and Chief Financial Officer of the Bank and Company as of April 2017, most recently served as Executive Vice President of Finance at the Bank. Mr . Levingston, a CPA, served in various financial and senior management roles at the bank prior to his current role. Mr. Levingston joined the bank in January 2012, and previously worked at the Federal Reserve Banks of Atlanta and Philadelphia as a commissioned Bank Examiner, and at PriceWaterhouseCoopers as a Manager in the Advisory practice. He has over 18 years of exp eri ence in the banking industry. Antonio F. Marquez, EVP, Chief Commercial Real Estate Lending Officer Mr. Marquez, Executive Vice President, joined EagleBank in 2011 as the Chief Real Estate Lender. Prior to joining EagleBank, Mr. Marquez established the real estate lending franchise for HSBC for the Washington, DC market Earlier he was the head of Commercial Re al Estate lending at Chevy Chase Bank from 1999 to 2005 and prior to that held various lending positions at Chase Manhattan Bank in New York and T he Riggs National Bank in Washington, D.C. Mr. Marquez has over 33 years of experience in the banking industry in the Washington, DC metropolit an area. Lindsey S. Rheaume, EVP, Chief C&I Lending Officer Mr. Rheaume joined EagleBank as Chief C&I Lending Officer in December 2014 and has over 33 years of commercial lending, credi t r isk and managerial experience in the financial industry. Most recently, he served as relationship executive for JP Morgan Chase, res pon sible for business development in the DC, suburban Maryland and Northern Virginia market with clients ranging in revenue from $20MM to $500MM. Pre viously, he served as executive vice president and commercial lending manager at Virginia Commerce Bank — which was acquired by United Bank in 2014 — where he managed the bank’s entire commercial and industrial lending activities. Earlier in his career, he held senior comme rci al lending and credit positions with SunTrust Bank, GE Capital and Bank of America. Janice L. Williams, EVP, Chief Credit Officer Ms. Williams, Executive Vice President and Chief Credit Officer of the Bank, has served the Bank as Credit Officer, Senior Cr edi t Officer and Chief Credit Officer for the past 15 years. Prior to employment with the Bank, Ms. Williams was with Capital Bank, Sequoia Bank, and American Security Bank. Additionally, Ms. Williams, a graduate of Georgetown University Law Center and a Member of the Maryland Bar, was previous ly employed in the private practice of law in Maryland.

Historical Balance Sheet 49 * Data for 2017 is shown on an operating basis. (Dollar Values in Thousands) 2014Y 2015Y 2016Y 2017Y* 2018Y 5 Year Compound Growth Rate 2019YTD Assets Cash and Equivalents $256,025 $298,363 $368,163 $190,473 $321,864 1.0% $395,522 Securities Available for Sale 404,903 504,772 559,708 625,592 807,645 15.7% 737,270 Total Cash and Securities 660,928 803,135 927,871 816,065 1,129,509 10.2% 1,132,792 Gross Loans HFI 4,312,399 4,998,368 5,677,893 6,411,528 6,991,447 18.9% 7,559,161 Loan Loss Reserves 46,075 52,687 59,074 64,758 69,944 11.3% 73,720 Loans Held for Sale 44,317 47,492 51,629 25,096 19,254 (14.5%) 52,199 Total Net Loans 4,310,641 4,993,173 5,670,448 6,371,866 6,940,757 18.7% 7,537,640 Real Estate Owned 13,224 5,852 2,694 1,394 1,394 (31.5%) 1,487 Total Intangibles 109,626 108,155 106,947 106,824 105,470 100.2% 104,693 Total Servicing Rights 282 387 472 388 296 4.8% 222 Other Assets 153,179 164,875 181,664 197,080 211,711 12.8% 226,633 Total Assets $5,247,880 $6,075,577 $6,890,096 $7,493,617 $8,389,137 17.3% $9,003,467 Liabilities Deposits $4,310,768 $5,158,444 $5,716,114 $5,853,984 $6,974,285 16.7% $7,402,513 FHLB Borrowings 140,000 0 0 325,000 0 (100.0%) 100,000 Repurchase Agreements 61,120 72,356 68,876 76,561 30,413 (17.7%) 30,297 Subordinated Debt 79,300 68,928 216,514 216,905 217,296 87.8% 217,589 Other Liabilities 35,933 37,248 45,793 56,141 58,202 12.4% 68,474 Total Liabilities 4,627,121 5,336,976 6,047,297 6,528,591 7,280,196 16.6% 7,818,873 Equity Preferred Equity 71,900 0 0 0 0 (100.0%) 0 Common Equity 546,212 738,410 845,180 966,775 1,113,216 26.7% 1,179,957 Net Unrealized Gain (Loss) 2,647 191 (2,381) (1,749) (4,275) 5.2% 4,637 Total Stockholders Equity 620,759 738,601 842,799 965,026 1,108,941 23.0% 1,184,594 Total Liabilities and Equity $5,247,880 $6,075,577 $6,890,096 $7,493,617 $8,389,137 17.3% $9,003,467 Balance Sheet Analysis (%) Total Gross Loans/ Total Assets 82.17 82.27 82.41 85.56 83.34 83.96 Loans/ Deposits 100.04 96.90 99.33 109.52 100.25 102.12 Reserves/ Loans 1.07 1.05 1.04 1.01 1.00 0.98 Annualized Growth Rates (%) Asset Growth Rate 39.15 15.77 13.41 8.76 11.95 9.74 Gross Loans HFI 46.42 15.91 13.59 12.92 9.04 10.80 Deposit Growth Rate 33.65 19.66 10.81 2.41 19.14 8.17
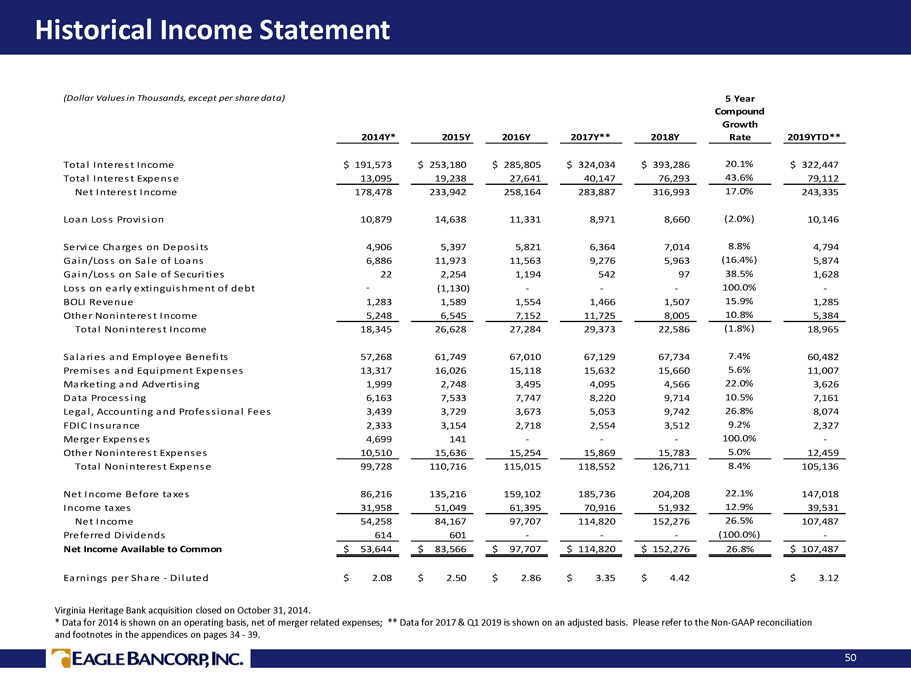
Historical Income Statement 50 Virginia Heritage Bank acquisition closed on October 31, 2014. * Data for 2014 is shown on an operating basis, net of merger related expenses; ** Data for 2017 & Q1 2019 is shown on an adjusted basis. P lease refer to the Non - GAAP reconciliation and footnotes in the appendices on pages 34 - 39. (Dollar Values in Thousands, except per share data) 2014Y* 2015Y 2016Y 2017Y** 2018Y 5 Year Compound Growth Rate 2019YTD** Total Interest Income 191,573$ 253,180$ 285,805$ 324,034$ 393,286$ 20.1% 322,447$ Total Interest Expense 13,095 19,238 27,641 40,147 76,293 43.6% 79,112 Net Interest Income 178,478 233,942 258,164 283,887 316,993 17.0% 243,335 Loan Loss Provision 10,879 14,638 11,331 8,971 8,660 (2.0%) 10,146 Service Charges on Deposits 4,906 5,397 5,821 6,364 7,014 8.8% 4,794 Gain/Loss on Sale of Loans 6,886 11,973 11,563 9,276 5,963 (16.4%) 5,874 Gain/Loss on Sale of Securities 22 2,254 1,194 542 97 38.5% 1,628 Loss on early extinguishment of debt - (1,130) - - - 100.0% - BOLI Revenue 1,283 1,589 1,554 1,466 1,507 15.9% 1,285 Other Noninterest Income 5,248 6,545 7,152 11,725 8,005 10.8% 5,384 Total Noninterest Income 18,345 26,628 27,284 29,373 22,586 (1.8%) 18,965 Salaries and Employee Benefits 57,268 61,749 67,010 67,129 67,734 7.4% 60,482 Premises and Equipment Expenses 13,317 16,026 15,118 15,632 15,660 5.6% 11,007 Marketing and Advertising 1,999 2,748 3,495 4,095 4,566 22.0% 3,626 Data Processing 6,163 7,533 7,747 8,220 9,714 10.5% 7,161 Legal, Accounting and Professional Fees 3,439 3,729 3,673 5,053 9,742 26.8% 8,074 FDIC Insurance 2,333 3,154 2,718 2,554 3,512 9.2% 2,327 Merger Expenses 4,699 141 - - - 100.0% - Other Noninterest Expenses 10,510 15,636 15,254 15,869 15,783 5.0% 12,459 Total Noninterest Expense 99,728 110,716 115,015 118,552 126,711 8.4% 105,136 Net Income Before taxes 86,216 135,216 159,102 185,736 204,208 22.1% 147,018 Income taxes 31,958 51,049 61,395 70,916 51,932 12.9% 39,531 Net Income 54,258 84,167 97,707 114,820 152,276 26.5% 107,487 Preferred Dividends 614 601 - - - (100.0%) - Net Income Available to Common 53,644$ 83,566$ 97,707$ 114,820$ 152,276$ 26.8% 107,487$ Earnings per Share - Diluted 2.08$ 2.50$ 2.86$ 3.35$ 4.42$ 3.12$