Exhibit 99.2
| | | |
| |  |
| | | |
| | 1360 Post Oak Blvd., Suite 2100 • Houston, TX 77056 |
| | 713-629-7600 • www.quantaservices.com |
| | |
Quanta Services, Inc. | | |
(NYSE: PWR) | | |
| | |
People Need Power — The Power of One | | |
Leading Provider of Specialty Contracting Services | | |
Overview & Key Points
| • | | The August 2003 power blackout in the northeast brought to the public’s attention what the power industry has known for years: the nation’s power grid is old, overloaded, and needs significant upgrades and maintenance to serve the country’s current and future power needs. |
| |
| • | | Demand for electricity is expected to increase by more than
20%1 over the next decade and utilities have made less than adequate investment in the nation’s power grid during the past few years. Quanta estimates that it will cost $100 billion to $200 billion over the next 10 to 15 years to expand, upgrade and maintain the nation’s power grid to meet current and future electricity demand. |
| |
| • | | Quanta’s customers are focused on optimizing operations, reducing costs and improving efficiencies in increasingly competitive markets. To that end, the industries Quanta serves continue to outsource the installation and maintenance of their networks to companies like Quanta to provide cost effective turnkey network infrastructure solutions across a wide geographic area. |
| |
| • | | As the largest specialty electric infrastructure contractor in the US, Quanta is well |
| | | | | |
| (In Thousands, Except Per Share & % Data) | | | | |
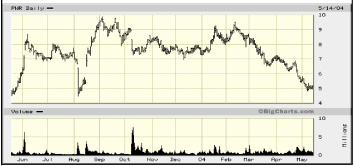
Price(May 14, 2004) | | $ | 5.12 | |
| 52 Week High/Low | | $ | 9.87 / $4.48 | |
| Avg. Daily Trading Volume (3 Mo.) | | | 863.5 | |
Shares Outstanding(As of May 3, 2004) | | | 117,131 | |
| Equity Market Cap. | | $ | 599,710 | |
| Cash & Equivalents | | $ | 195,680 | |
| Long-Term Debt | | $ | 50,574 | |
| Convertible Sub. Notes | | $ | 442,500 | |
| Enterprise Value | | $ | 897,104 | |
| Long-Term Debt / Equity | | | 7.7 | % |
| LT Debt & Convt. Notes / Equity | | | 75.4 | % |
| LT Debt & Convt. Notes / Total Cap. | | | 43.0 | % |
| Net LT Debt & Convt. Notes / Total Cap. | | | 25.9 | % |
Balance sheet data as of March 31, 2004 | | | | |
| | | positioned to capitalize on the urgent need for the nation’s power grid to be expanded, upgraded and maintained, and also on increasing infrastructure outsourcing trends. |
| |
| • | | Facing the most challenging operating environment in thirty years, Quanta has successfully focused on reducing costs, operating its business more efficiently, and maintaining a healthy balance sheet. |
Founded in August 1997, with its IPO in February 1998, Quanta is a leading national provider of specialty contracting solutions to the electric power, natural gas, telecom, broadband cable TV, and ancillary services industries. Quanta provides design, installation, repair, maintenance and emergency response services that enable its customers to reduce costs, increase operating efficiencies and network performance, and provide the best possible service to their customers.
| | | | | |
|
Quanta Services, Inc. | | ©2004 Quanta Services, Inc. All rights reserved. | | Page 1 |
NYSE: PWR | | | | |
Forward-looking statements contained herein are subject to certain risks and uncertainties as further described on page 37 of this Company Profile.
Readers should carefully review the cautionary statement described in this and other documents filed from time to time with the SEC, including on Form 10-K.
| | | | |
| Company Profile | |  | | May 2004 |
Quanta Services, Inc. — Summary Financial Data
Summary Income Statement
(In Thousands, Except Per Share Data)
| | | | | | | | | | | | | |
| | | | | | | | | | | (Unaudited) |
| | | | | | | | | | | Three |
| | | | | | | | | | | Months Ended |
| | | 2002
| | 2003
| | Mar. 31, 2004
|
| Revenues | | $ | 1,750,713 | | | $ | 1,642,853 | | | $ | 354,997 | |
| Cost of Services | | | 1,513,940 | | | | 1,442,958 | | | | 328,273 | |
| | | |
| | | |
| | | |
| |
| Gross Profit | | | 236,773 | | | | 199,895 | | | | 26,724 | |
| SG&A | | | 190,015 | | | | 156,982 | | | | 43,287 | |
| Bad Debt | | | 35,710 | | | | 19,890 | | | | 83 | |
| Goodwill Impairment | | | 166,580 | | | | 6,452 | | | | — | |
| | | |
| | | |
| | | |
| |
| Income (Loss) from Operations | | | (155,532 | ) | | | 16,571 | | | | (16,646 | ) |
| Interest Expense | | | (35,866 | ) | | | (31,822 | ) | | | (6,366 | ) |
| Loss on Early Extinguishment on Debt | | | — | | | | (35,055 | ) | | | — | |
| Other, Net | | | (2,446 | ) | | | (2,763 | ) | | | 301 | |
| | | |
| | | |
| | | |
| |
| Pre-Tax Income (Loss) before Accounting Change | | | (193,844 | ) | | | (53,069 | ) | | | (22,711 | ) |
| Provision (Benefit) for Income Taxes | | | (19,710 | ) | | | (18,080 | ) | | | (11,017 | ) |
| | | |
| | | |
| | | |
| |
| Income (Loss) before Accounting Change | | | (174,134 | ) | | | (34,989 | ) | | | (11,694 | ) |
| Cumulative Effect of Accounting Change | | | 445,422 | | | | — | | | | — | |
| | | |
| | | |
| | | |
| |
| Net Income (Loss) before Dividends to Preferred | | | (619,556 | ) | | | (34,989 | ) | | | (11,694 | ) |
| Dividends (Forfeitures) on Preferred Stock | | | 8,497 | | | | (2,109 | ) | | | — | |
| | | |
| | | |
| | | |
| |
| Net Income (Loss) to Common Stock | | $ | (628,053 | ) | | $ | (32,880 | ) | | $ | (11,694 | ) |
| | | |
| | | |
| | | |
| |
| Diluted EPS before Accounting Change | | $ | (2.90 | ) | | $ | (0.30 | ) | | $ | (0.10 | ) |
| Accounting Change | | | (7.08 | ) | | | — | | | | — | |
| | | |
| | | |
| | | |
| |
| Diluted EPS | | $ | (9.98 | ) | | $ | (0.30 | ) | | $ | (0.10 | ) |
| | | |
| | | |
| | | |
| |
| Diluted Shares | | | 62,957 | | | | 110,906 | | | | 113,918 | |
Margin Analysis
(As a Percentage of Revenues)
| | | | | | | | | | | | | |
| | | | | | | | | | | (Unaudited) |
| | | | | | | | | | | Three |
| | | | | | | | | | | Months Ended |
| | | 2002
| | 2003
| | Mar. 31, 2004
|
Gross Margin(including depreciation expense) | | | 13.5 | % | | | 12.2 | % | | | 7.5 | % |
| SG&A | | | 10.9 | % | | | 9.6 | % | | | 12.2 | % |
| Income (Loss) from Operations | | | (8.9 | )% | | | 1.0 | % | | | (4.7 | )% |
| Income (Loss) before Accounting Change | | | (9.9 | )% | | | (2.1 | )% | | | (3.3 | )% |
| Net Income (Loss) before Dividends to Preferred | | | (35.3 | )% | | | (2.1 | )% | | | (3.3 | )% |
| Net Income (Loss) to Common Stock | | | (35.8 | )% | | | (2.0 | )% | | | (3.3 | )% |
Selected Historical Balance Sheet Date & Ratios
(In Thousands, Except Ratios)
| | | | | | | | | | | | | |
| | | | | | | | | | | (Unaudited) |
| | | 2002
| | 2003
| | Mar. 31, 2004
|
| Cash & Cash Equivalents | | $ | 27,901 | | | $ | 179,626 | | | $ | 195,680 | |
Total Current Assets | | | 529,497 | | | | 676,093 | | | | 654,327 | |
| Property & Equipment, Net | | | 369,568 | | | | 341,542 | | | | 337,786 | |
| Goodwill & Other Intangibles, Net | | | 395,597 | | | | 388,882 | | | | 388,817 | |
Total Assets | | | 1,364,812 | | | | 1,466,435 | | | | 1,440,359 | |
| Total Current Liabilities | | | 212,141 | | | | 199,390 | | | | 205,443 | |
| Long-Term Debt, Net | | | 213,167 | | | | 58,051 | | | | 46,962 | |
| Convertible Subordinated Notes | | | 172,500 | | | | 442,500 | | | | 442,500 | |
Total Liabilities | | | 680,219 | | | | 803,303 | | | | 786,312 | |
| Redeemable Common Stock | | | 72,922 | | | | — | | | | — | |
| Stockholders’ Equity | | | 611,671 | | | | 663,132 | | | | 654,047 | |
Total Liabilities & Stockholders’ Equity | | $ | 1,364,812 | | | $ | 1,466,435 | | | $ | 1,440,359 | |
| Current Ratio | | | 2.5 | | | | 3.4 | | | | 3.2 | |
| Long-Term Debt / Stockholders’ Equity | | | 35.9 | % | | | 9.5 | % | | | 7.9 | % |
| Total Debt / Capitalization | | | 39.1 | % | | | 43.3 | % | | | 43.0 | % |
Selected Historical Statement of Cash Flows Data
(In Thousands)
| | | | | | | | | | | | | |
| | | | | | | | | | | (Unaudited) |
| | | | | | | | | | | Three |
| | | | | | | | | | | Months Ended |
| | | 2002
| | 2003
| | Mar. 31, 2004
|
| Net Cash Provided by Operating Activities | | $ | 121,522 | | | $ | 117,183 | | | $ | 34,651 | |
| Capital Expenditures | | | 49,454 | | | | 35,943 | | | | 11,591 | |
| | | |
| | | |
| | | |
| |
Free Cash Flow | | $ | 72,068 | | | $ | 81,240 | | | $ | 23,060 | |
Historical Stock Data
| | | | | | | | | | | | | |
| | | 2002
| | 2003
| | YTD*
|
| High | | $ | 18.90 | | | $ | 9.87 | | | $ | 9.52 | |
| Low | | $ | 1.75 | | | $ | 2.80 | | | $ | 4.83 | |
| Avg. Daily Volume | | | 532,819 | | | | 675,749 | | | | 900,994 | |
* As of May 14, 2004
| | | | | |
|
Quanta Services, Inc. | | ©2004 Quanta Services, Inc. All rights reserved. | | Page 2 |
NYSE: PWR | | | | |
Forward-looking statements contained herein are subject to certain risks and uncertainties as further described on page 37 of this Company Profile.
Readers should carefully review the cautionary statement described in this and other documents filed from time to time with the SEC, including on Form 10-K.
| | | | |
| Company Profile | | | | May 2004 |
This document is being published by Quanta Services in continuation of the Company’s goal to provide more disclosure and transparency to the investment community regarding Quanta’s operations, strategies, industry dynamics and conditions, etc. Quanta Services intends to take greater responsibility for and a proactive role in communicating with the investment community and in providing greater operating and financial transparency.
Executive Summary & Selected Highlights
Founded in August 1997, with its IPO in February 1998, Quanta Services is a leading national provider of specialty contracting solutions to the electric power, natural gas, telecom, broadband cable TV and other industries.Quanta was created to respond to the increasing need for the outsourcing of infrastructure services.That is, Quanta’s current and future customers are expecting — as they grow their businesses through mergers and increased outsourcing — specialty contractors to increase the scope of their service capabilities and geographic reach. Through its operating units located throughout the US, Quanta provides design, installation, repair, maintenance and emergency response services that enable its customers to reduce costs, increase operating efficiencies, improve network performance, and provide the best possible services to their customers.
The August 2003 power blackout, the largest in North America’s history, brought to the forefront what the power industry has known for years: the nation’s power grid is old, overloaded, and needs significant upgrading and maintenance to serve the country’s current and future power needs.Quanta estimates that it will cost between $100 billion and $200 billion to upgrade and maintain the country’s transmission and distribution (T&D) system adequately over the next ten to fifteen years.According to Platts, a leading energy news, research and consulting company, before the August 2003 blackout there were $27.5 billion worth of T&D projects to begin in 2004 and be completed by 2008. The discrepancy between the $27.5 billion earmarked before the blackout versus the $100 billion the Electric Power Research Industry estimates it would cost to fix the system illustrates the magnitude of the underinvestment by the electric utility industry in its T&D infrastructure over the years.
Quanta and the industries it serves have faced the most difficult operating conditions in thirty years due to challenging economic and capital markets conditions and the collapse of the telecom industry. Though the Company believes that normal operating conditions may not return for some time, Quanta’s utility customers have improved their balance sheets over the last 18 months and conditions in the telecom industry appear to have stabilized.As operating conditions return to normal and growth opportunities return, there are several major trends that could generate long-term organic revenue growth opportunities of approximately 15% annually:
| • | | New awareness of transmission and distribution network upgrade needs |
| |
| • | | Customers focusing on their core business, which increases the value of Quanta’s end-to-end services |
| |
| • | | Increased outsourcing of infrastructure services |
Faced with extremely difficult operating conditions for the last three years, Quanta has focused on its operations and on maintaining a healthy financial position. As of March 31, 2004, Quanta had $195.7 million of cash on its balance sheet and $32.3 million in available borrowing capacity under its $185 million credit facility. For 1Q04, Quanta generated $34.7 million of cash provided by operating activities, which, less capital expenditures of $11.6 million yielded free cash flow of $23.1 million. In addition, to align its operations with the changing needs of its customers — who are themselves refocusing on their core operations — in 2003 Quanta reorganized its operations to focus on two primary client bases: Electric Power/Natural Gas and Telecom/Broadband Cable TV.Quanta believes it is well positioned, both financially and operationally, to operate in the current environment and to capitalize on future growth opportunities.
| | | | | |
|
Quanta Services, Inc. | | ©2004 Quanta Services, Inc. All rights reserved. | | Page 3 |
NYSE: PWR | | | | |
Forward-looking statements contained herein are subject to certain risks and uncertainties as further described on page 37 of this Company Profile.
Readers should carefully review the cautionary statement described in this and other documents filed from time to time with the SEC, including on Form 10-K.
| | | | |
| Company Profile | | | | May 2004 |
Table of Contents
| | | | | |
SECTION
| | PAGE
|
| Overview & Key Points | | | 1 | |
| Summary Financial Data | | | 2 | |
| Executive Summary & Selected Highlights | | | 3 | |
| Quanta Services Company Overview | | | 5 | |
| Major Market Trends & Outsourcing Thesis | | | 6 | |
•New Awareness of Transmission & Distribution Network Upgrade Needs | | | 6 | |
•Customers Focusing on Core Business; Value of End-to-End Solutions | | | 8 | |
•Increased Network infrastructure Outsourcing | | | 8 | |
| Massive Need for Transmission & Distribution Upgrade & Maintenance | | | 10 | |
| Quanta Services Operations Overview | | | 14 | |
•Electric Utility Infrastructure Services | | | 16 | |
•Energized Services | | | 17 | |
•Energized Services Case Study | | | 18 | |
•Natural Gas & Pipeline Services | | | 19 | |
•Telecom Network Services | | | 19 | |
•Broadband Cable TV Services | | | 20 | |
•Specialty Services | | | 20 | |
| Understanding Margins | | | 21 | |
| Quanta’s Growth Strategy — Steady Organic Growth Supplemented by Selected Acquisitions | | | 22 | |
| Recent Financial Results & Commentary | | | 23 | |
| Outlook | | | 25 | |
| Historical Financial & Operating Data Table | | | 26 | |
| Peer Operation & Valuation Comparison | | | 27 | |
| Executive Management Bios | | | 28 | |
| Board & Corporate Governance Matters | | | 30 | |
| Consolidated Statements of Operations | | | 34 | |
| Consolidated Balance Sheets | | | 35 | |
| Consolidated Statements of Cash Flows | | | 36 | |
| Forward-Looking Statements & Risk Factors | | | 37 | |
| | | | | |
|
Quanta Services, Inc. | | ©2004 Quanta Services, Inc. All rights reserved. | | Page 4 |
NYSE: PWR | | | | |
Forward-looking statements contained herein are subject to certain risks and uncertainties as further described on page 37 of this Company Profile.
Readers should carefully review the cautionary statement described in this and other documents filed from time to time with the SEC, including on Form 10-K.
| | | | |
| Company Profile | | | | May 2004 |
Quanta Services Company Overview
Founded in August 1997, with its IPO in February 1998, Quanta Services is a leading national provider of specialty contracting solutions to the electric power, natural gas, telecom, broadband cable TV, and specialty services industries. Through its operating units located throughout the US, Quanta provides design, installation, repair, maintenance and emergency response services that enable Quanta’s customers to reduce costs, increase operating efficiencies, improve network performance, and provide the best possible service to their customers. The Company also provides a variety of ancillary services such as inside electrical wiring; intelligent traffic networks; cable and control systems for light rail lines, airports and highways; and specialty rock trenching, directional boring and road milling for industrial and commercial customers.
Quanta was created to respond to the increasing need for outsourced infrastructure services.That is, Quanta’s customers are expecting specialty contractors to increase the scope of their service capabilities and geographic reach as they grow their businesses through mergers and increased outsourcing. Such requirements are a tall order for the average private specialty contractor, so in February 1998, Quanta went public to obtain additional capital to pursue a strategy of “smart growth” consolidation coupled with organic growth, driven by the growth in infrastructure services outsourcing trends and increased customer demands.
After its IPO, Quanta selectively acquired approximately 85 specialty contractors over several years to increase the scope of its services, expand its geographic reach and diversity, and enhance its future growth opportunities. Though initially focused on the electric utility industry, Quanta expanded into the telecom and broadband cable TV infrastructure services industries as its core utility customers began expanding into those unregulated sectors and turned to Quanta to perform simultaneous electrical, telecom and broadband cable TV related projects.
With the challenges in the telecom and broadband cable TV sectors, Quanta’s utility customers largely have ceased pursuing telecom and broadband cable TV initiatives and have refocused on the electric and gas utility side of their businesses. To meet the ever changing needs of its core customers, Quanta has reorganized its operations to focus on two primary client bases: Electric Power/Natural Gas and Telecom/Broadband Cable TV.
| | | | | |
|
Quanta Services, Inc. | | ©2004 Quanta Services, Inc. All rights reserved. | | Page 5 |
NYSE: PWR | | | | |
Forward-looking statements contained herein are subject to certain risks and uncertainties as further described on page 37 of this Company Profile.
Readers should carefully review the cautionary statement described in this and other documents filed from time to time with the SEC, including on Form 10-K.
| | | | |
| Company Profile | | | | May 2004 |
Major Market Trends & Outsourcing Thesis
| • | | New Awareness of Transmission and Distribution (T&D) Network Upgrade Needs |
| |
| • | | Customers Focusing on Core Business; Value of End-to-End Solutions |
| |
| • | | Increased Outsourcing of Infrastructure Services |
New Awareness of Transmission and Distribution Network Upgrade Needs
The August 14, 2003 power blackout was the largest in North America’s history. The statistics regarding the impact of the blackout are staggering:
| • | | Eight states and two Canadian providences, home to approximately 50 million people, were affected. |
| |
| • | | Twenty-two US and Canadian nuclear plants were shut down. |
| |
| • | | Ten major airports were shut down, canceling 700 flights nationwide. |
| |
| • | | The Cleveland National Guard distributed 7,600 gallons of drinking water after the city’s four main pumping stations failed. |
| |
| • | | Approximately 350,000 people were on New York City subways when the power went out; 19 trains were in underwater tunnels. |
| |
| • | | Various estimates put the cost of the outage between $6 billion and $8 billion. |
Source: Time Magazine & Platts Power Magazine

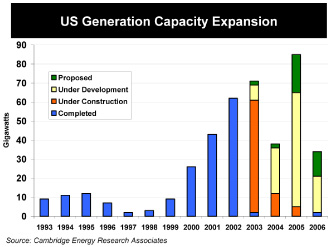
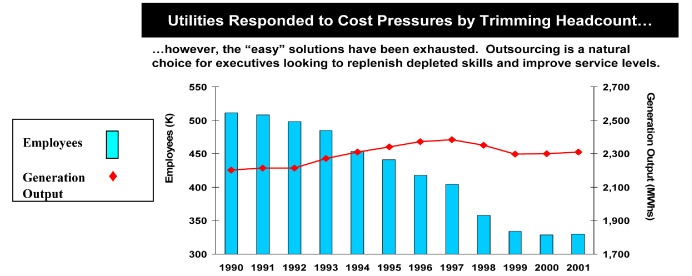
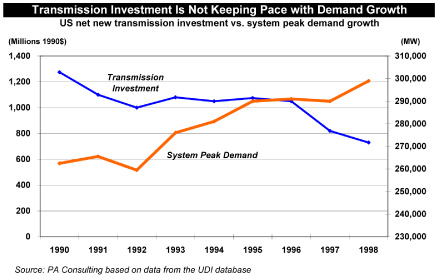
Due to the number of people impacted by the catastrophic failure of the country’s power grid, the event has increased the nation’s awareness of what has been known in the power industry for many years: the nation’s electrical grid is old, overloaded, and needs significant maintenance and expansion to handle the country’s current and growing power needs. Despite previous power blackouts since the 1960s that left tens of millions of people in the dark, expansion and maintenance of the grid has fallen short. As the country’s population has grown and technology has become a larger part of everyday life,generating capacity has increased nearly eight fold over the past ten years2 while demand for electricity has grown over 20%3. However, transmission capacity over the last ten years has fallen by approximately 16% and is expected to decline by approximately 7% from 2003 to 20084.
So far, the August 2003 blackout caught the attention of the media, the general population, the politicians, and the electric utility industry, and discussions are ongoing to find solutions to remedy the problem. For example, the Electric Power Research Institute isbeginning a public education campaign to raise some $100 billion from investors, governments and consumers to upgrade the nation’s power grid.
| | | 2Cambridge Energy Research Associates |
| |
| | | 3Energy Information Administration’s “Early Release of the Annual Energy Outlook 2004”. |
| |
| | | 4“Expanding U.S. Transmission Capacity”, Eric Hirst, Ph.D., August 2000. |
| | | | | |
|
Quanta Services, Inc. | | ©2004 Quanta Services, Inc. All rights reserved. | | Page 6 |
NYSE: PWR | | | | |
Forward-looking statements contained herein are subject to certain risks and uncertainties as further described on page 37 of this Company Profile.
Readers should carefully review the cautionary statement described in this and other documents filed from time to time with the SEC, including on Form 10-K.
| | | | |
| Company Profile | | | | May 2004 |
| | | The August 2003 blackout was the worst in the nation’s history, but it was not the first major blackout impacting North America, and unfortunately, may not be the last. The accompanying table lists examples of other major bulk electric system power outages that have hit North America. Note this list excludes many past power outage events that also impacted many people, such as the rolling blackouts experienced in California during 2000 and 2001. |
Examples of Major Bulk Electric System Power Outages
| | | | | | | |
| | | States/Provinces | | Customers | | |
Date
| | Affected
| | Affected
| | Duration
|
| 11/9/1965 | | NY, CT, MA, RI, northern PA, northeast NJ, and Ontario, Canada | | 30 million people; over 20,000 MW of demand | | Up to 13 hours |
| | | | | | | |
| 7/13/1977 | | New York City | | 9 million people; 6,000 MW of demand | | Up to 26 hours |
| | | | | | | |
| 12/22/1982 | | West coats of US | | +5 million people: over 12,350 MW of demand | | NA |
| | | | | | | |
| 7/2/1996 | | AZ, CA, CO, ID, MT, NB, NV, NM OR, SD, TX, UT, WA,& WY in the US; Alberta & British Columbia in Canada; Baja California Norte in Mexico | | 2 million (10% of customers in the Western Interconnection); 11,850 MW of demand | | From a few mins. to several hours |
| | | | | | | |
| 8/10/1996 | | AZ, CA, CO, ID, MT, NB, NV, NM, OR, SD, TX, UT, WA, & WY in the US; Alberta & British Columbia in Canada; Baja California Norte in Mexico | | 7.5 million people; 28,000 MW of demand shed by underfrequency load-shedding relays | | Up to 9 hours |
| | | | | | | |
| 6/25/1998 | | MN, MT, ND, SD, & WI in the US; Ontario, Manitoba & Saskatchewan in Canada | | 152,000 customers; 950 MW of demand | | 19 hours |
Source: North American Electric Liability Counsel & US-Canada Power System Outage Task Force
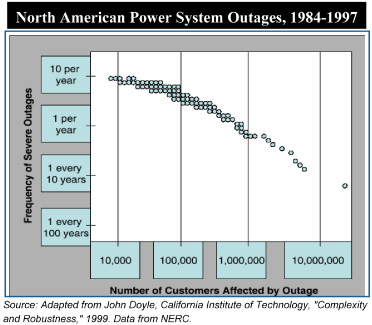
Further, each year there are smaller power outages that occur throughout North America that do not get significant media attention, but are more frequent than one would expect. The dots in the chart below represent individual outages in North America between 1984 and 1997.
| | | | | |
|
Quanta Services, Inc. | | ©2004 Quanta Services, Inc. All rights reserved. | | Page 7 |
NYSE: PWR | | | | |
Forward-looking statements contained herein are subject to certain risks and uncertainties as further described on page 37 of this Company Profile.
Readers should carefully review the cautionary statement described in this and other documents filed from time to time with the SEC, including on Form 10-K.
| | | | |
| Company Profile | | | | May 2004 |
Customers Focusing on Core Business; Value of End-to-End Solutions
All of the industries Quanta serves are facing very competitive environments. With challenging economic and capital market conditions over the last few years, many companies in the electric and gas utility, telecom, and broadband cable TV industries have refocused on core operations, operating efficiencies and prudent capital investment in their networks. The absolute dollar amount of network capital expenditures by Quanta’s customers has declined over the past few years. However, conditions generally have stabilized and Quanta’s customers will need to begin investing in the development and maintenance of their networks once again.
One way for Quanta’s customers to focus on core operations, operating efficiencies and prudent capital investment is to outsource non-revenue-generating functions, such as network infrastructure development and maintenance.Small owner-operated contractors are not as well positioned as Quanta to serve the broad range of needs that many utilities, telecom, and broadband cable TV companies request. Further, service providers are reducing the number of vendors they deal with to reduce paperwork, bidding and vendor management costs, and time.Increasingly, the industries Quanta serves are looking for companies like Quanta that are able to provide a wide array of network infrastructure services on a national basis — on time and on budget.
Increased Infrastructure Outsourcing
Challenging economic and capital market conditions, stiff competition amongst their peers, focus on efficiencies, and the need to enhance and maintain the lifeblood of their business — their networks — are causing companies in the electric and gas utility, telecom, and broadband cable TV industries to increase the amount of network infrastructure work they outsource to specialty contractors like Quanta Services.
Quanta estimates that annual infrastructure spending in the primary industries Quanta serves is approximately $30-$40 billion. Quanta further estimates that the electric power industry typically outsources approximately 30%-40% of its infrastructure work to specialty contractors, telecom typically outsources approximately 50%-60% of its infrastructure work, and broadband cable TV typically outsources approximately 70%-80% of its infrastructure work to specialty contractors. As economic, capital market, and operating conditions improve for Quanta’s customers and they return to more normalized levels of investment in their networks, Quanta’s annual addressable market opportunity and the amount of work that is outsourced should grow.
| | | | | |
|
Quanta Services, Inc. | | ©2004 Quanta Services, Inc. All rights reserved. | | Page 8 |
NYSE: PWR | | | | |
Forward-looking statements contained herein are subject to certain risks and uncertainties as further described on page 37 of this Company Profile.
Readers should carefully review the cautionary statement described in this and other documents filed from time to time with the SEC, including on Form 10-K.
| | | | |
| Company Profile | | | | May 2004 |
In addition to service providers outsourcing elements of their network installation and maintenance activities, Quanta believes there is significant opportunity in its customers completely outsourcing the operation and maintenance of their network infrastructure (utilities, telecom and broadband cable TV companies alike). In fact,Quanta is the only specialty contractor to successfully develop and implement a complete infrastructure outsourcing program with an electric utility.
Puget Sound Energy was one of the first utilities to announce that it would progressively outsource 100% of its infrastructure operations and maintenance functions. Puget Sound considered twelve different companies for this vital task and chose Quanta for both electric and gas infrastructure outsourcing initiatives. Today, Quanta is managing all electric and gas construction for new residences and businesses in Puget Sound’s Washington service area, as well as managing all related inventory and materials. Productive work hours have increased by at least one hour per day, a 30% cost savings over historical numbers is projected, and service levels continue to improve. Puget Sound and Quanta forged new ground with this outsourcing model. As it has proven successful, more and more companies are seriously examining a complete outsourcing model.
| | | | | |
|
Quanta Services, Inc. | | ©2004 Quanta Services, Inc. All rights reserved. | | Page 9 |
NYSE: PWR | | | | |
Forward-looking statements contained herein are subject to certain risks and uncertainties as further described on page 37 of this Company Profile.
Readers should carefully review the cautionary statement described in this and other documents filed from time to time with the SEC, including on Form 10-K.
| | | | |
| Company Profile | | | | May 2004 |
Massive Need for Transmission & Distribution Upgrades & Maintenance
The August 2003 power blackout, the largest in North America’s history, brought to the forefront what the power industry has known for years: the nation’s power grid is old, overloaded, and needs significant upgrades and maintenance to serve the country’s current and future power needs. With a now concerned public and 50 million angry northeastern constituents, politicians began taking the grid’s most spectacular failure seriously and have begun discussions toward clarifying the regulatory uncertainty so that electric utilities will have the economic incentive to and be able to attract capital investment for upgrading and maintaining the nation’s power grid.
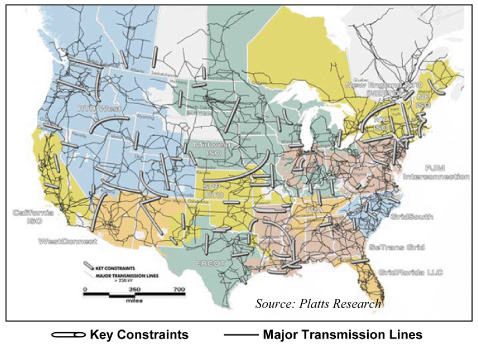
The challenge the industry faces is not one of a shortage of electricity and generating capacity, but capacity strains and bottlenecks for transmitting and distributing the electricity to the end user. The map above depicts the nation’s major transmission lines and identifies key capacity constraints. As indicated, there are a troubling number of key transmission capacity constraints. While demand for electricity has grown over 20% over the past decade, transmission capacity has fallen by approximately 16% and is expected to decline further by approximately 7% from 2003 to 20084.
| | | | | |
|
Quanta Services, Inc. | | ©2004 Quanta Services, Inc. All rights reserved. | | Page 10 |
NYSE: PWR | | | | |
Forward-looking statements contained herein are subject to certain risks and uncertainties as further described on page 37 of this Company Profile.
Readers should carefully review the cautionary statement described in this and other documents filed from time to time with the SEC, including on Form 10-K.
| | | | |
| Company Profile | | | | May 2004 |
Following the August 2003 blackout, the power industry began a campaign to raise $100 billion from investors, governments, and consumers to upgrade the various power grids across the nation.Quanta estimates that it will cost between $100 billion and $200 billion to significantly upgrade and maintain the country’s transmission and distribution (T&D) system over the next ten to fifteen years.According to Platts, before the August 2003 blackout there was $27.5 billion worth of T&D projects to begin in 2004 and be completed by 2008. The discrepancy between the amount of earmarked projects before the blackout versus the $100 billion investment the power industry is now trying to attract illustrates the magnitude of the electric power industry’s underinvestment in its T&D infrastructure over the years.
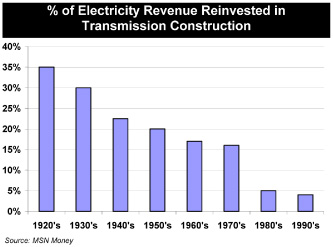
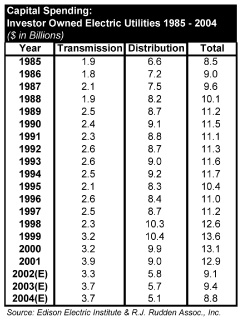
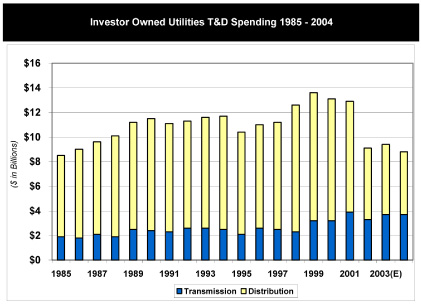
Prior to the August 2003 blackout, R.J. Rudden Associates estimated that bringing spending in line with forecast demand would require a 25% annual increase in transmission spending and a 50% annual increase in distribution spending. *Note the tables below reflect Investor Owned Utilities only*
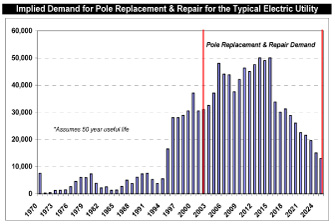
The majority of the nation’s T&D infrastructure was built shortly after World War II, is over 50 years old in many cases, and is beyond its useful life. The table below illustrates the number of poles installed annually by a particular electric power utility. While the identity of the specific utility will remain concealed, the chart illustrates an investment pattern that is typical for the average US electric utility. The vast majority of the grid system was installed from 1945 to the late 1970’s. With these assets already past or rapidly approaching the end of their useful life, as depicted in the chart below, there is significant demand for pole repair and replacement going forward based on past T&D investment.
| | | | | |
|
Quanta Services, Inc. | | ©2004 Quanta Services, Inc. All rights reserved. | | Page 11 |
NYSE: PWR | | | | |
Forward-looking statements contained herein are subject to certain risks and uncertainties as further described on page 37 of this Company Profile.
Readers should carefully review the cautionary statement described in this and other documents filed from time to time with the SEC, including on Form 10-K.
| | | | |
| Company Profile | | | | May 2004 |
Electric utilities have underinvested in their T&D infrastructure for three primary reasons: (1) uncertainty regarding the final terms of the Federal Energy Regulatory Commission’s (FERC) standard market design proposal, (2) the inability to recover investment costs in T&D investment under state imposed rate freezes, and (3) balance sheet issues resulting from energy trading losses, telecom business investments, etc. Note that many of the state rate freezes began to expire in 2003 and pressure will mount on utilities to invest in their T&D infrastructure.
It is troubling that investment in T&D infrastructure has declined over the years while demand for electricity has meaningfully increased. Coupled with the fact that much of the nation’s T&D infrastructure is 50 years old, it is apparent that the power industry is increasingly relying on aging assets. This is a recipe for significant future problems as power demand increases on an aged and overloaded grid.
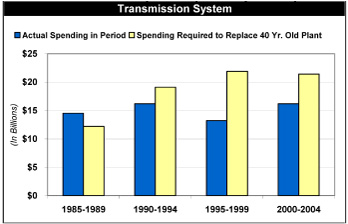
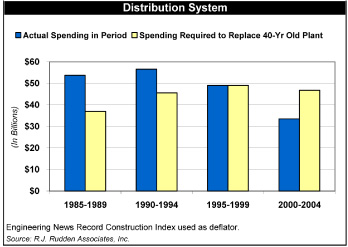
The accompanying table adjusts the dollar figures from the “Capital Spending” table on the previous page to year 2000 dollars and assumes that T&D assets have a 40 year useful life. The data suggests (1) capital spending has not been enough to replace old transmission assets and (2) distribution has not earmarked enough spending to replace aging distribution assets in the future.
As the charts and data show, utility investment in the expansion and maintenance of T&D assets has lagged what is needed. Further, there is significant pending demand for the replacement and repair of poles that were installed 50 years ago.
Deflated T&D Expenditures in Year 2000 Dollars
($ in Billions)
| | | | | | | | | | | | | | | | | |
| | | 1985-1989 | | 1990-1994 | | 1995-1999 | | 2000-2004 |
Transmission | | | | | | | | | | | | | | | | |
| Spending in Period | | | 14.5 | | | | 16.2 | | | | 13.2 | | | | 16.2 | |
| Replacement Spending Required | | | 12.2 | | | | 19.1 | | | | 21.9 | | | | 21.4 | |
Net New Spending (Deficiency) | | | 2.3 | | | | (2.9 | ) | | | (8.7 | ) | | | (5.2 | ) |
Distribution | | | | | | | | | | | | | | | | |
| Spending in Period | | | 53.8 | | | | 56.6 | | | | 49.1 | | | | 33.5 | |
| Replacement Spending Required | | | 37.0 | | | | 45.6 | | | | 49.1 | | | | 46.8 | |
Net New Spending (Deficiency) | | | 16.8 | | | | 11.0 | | | | 0.0 | | | | (13.3 | ) |
| | | | | |
|
Quanta Services, Inc. | | ©2004 Quanta Services, Inc. All rights reserved. | | Page 12 |
NYSE: PWR | | | | |
Forward-looking statements contained herein are subject to certain risks and uncertainties as further described on page 37 of this Company Profile.
Readers should carefully review the cautionary statement described in this and other documents filed from time to time with the SEC, including on Form 10-K.
| | | | |
| Company Profile | | | | May 2004 |
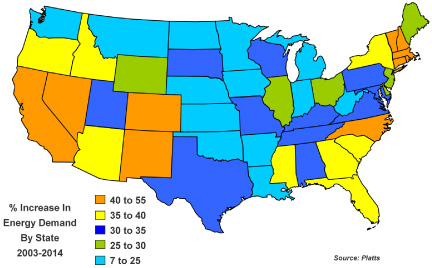
Expanding and improving current T&D assets to meet current and future power demand is a daunting task. Further complicating the issue, the demand for electricity is expected to continue to grow at a healthy rate for the next few decades as (1) the country’s population expands and (2) we become increasingly dependent on technology, which requires power.
The map below illustrates the estimated demand for electricity by state in the US from 2003 to 2014. It is estimated that overall electricity demand in the US will grow in excess of 20% over this period. Areas such as California and the northeastern US are expected to have 40%-55% increases in electricity demand over the period; note both are areas that have had major blackouts and brownouts in the past few years.
The electric utility industry finds itself in the position of playing catch-up from underinvestment, needing to replace and repair a significant amount of its legacy distribution network, and properly plan for future electricity demand. While the August 2003 blackout has caught the attention of utilities and politicians, it is too early to determine if it will result in real efforts to fix the grid. To the extent that this wake up call is heeded, it may take twelve months or more before hurdles are crossed and serious T&D investment begins. However, as the largest specialty electrical infrastructure contractor in the country, Quanta is well positioned to meet the needs of its customers and to harvest the fruits of future increases in T&D network investment by the electric utility industry.
| | | | | |
|
Quanta Services, Inc. | | ©2004 Quanta Services, Inc. All rights reserved. | | Page 13 |
NYSE: PWR | | | | |
Forward-looking statements contained herein are subject to certain risks and uncertainties as further described on page 37 of this Company Profile.
Readers should carefully review the cautionary statement described in this and other documents filed from time to time with the SEC, including on Form 10-K.
| | | | |
| Company Profile | | | | May 2004 |
Quanta Services Operations Overview
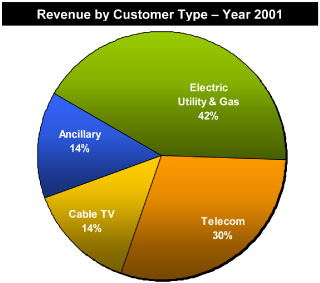
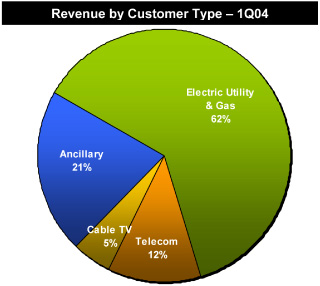
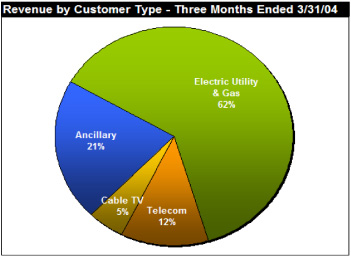
For the quarter ending March 31, 2004, revenues generated by customers in the electric power and natural gas industries accounted for approximately 62% of revenue, telecom for approximately 12%, broadband cable TV for approximately 5% and ancillary services for approximately 21%. For the year 2003, revenues generated by customers in the electric power and natural gas industries accounted for approximately 60% of revenue, telecom for approximately 15%, broadband cable TV for approximately 7%, and ancillary services for approximately 18%.
Quanta estimates that the combined historical average market opportunity for infrastructure spending is approximately $35 billion annually. Of that, Quanta estimates that the largest public and private specialty contractors serving these combined industries only account for 15% or less of the market. Quanta estimates that it commands the largest portion of this estimated 15% share, but that it is less than 5% of the total addressable market. The balance of the market is served by smaller, typically private companies. With its greater scope of services, greater financial and organizational resources, and superior work force, Quanta believes it has significant opportunities to increase its market share over time. Quanta estimates that approximately 30%-40% of electric and gas infrastructure work is typically outsourced, 50%-60% of telecom infrastructure work is outsourced, and 70%-80% of broadband cable TV infrastructure work is outsourced currently.
As the accompanying charts depict, the percentage of revenues Quanta derived from the telecom and broadband cable TV industries in 1Q04 declined versus the year 2001. This is primarily due to the historic collapse of the telecom market and challenging operating environment in the broadband cable TV market. As a result, nearly all of Quanta’s telecom and broadband cable TV customers have been experiencing operating and financial challenges for several years, and a number of Quanta’s telecom and broadband cable TV customers have filed for bankruptcy. As a result, capital expenditures and overall network investment by the telecom and broadband cable TV sectors have declined significantly versus levels in the late 1990s and early 2000, and also relative to normal historical levels.
| | | | | |
|
Quanta Services, Inc. | | ©2004 Quanta Services, Inc. All rights reserved. | | Page 14 |
NYSE: PWR | | | | |
Forward-looking statements contained herein are subject to certain risks and uncertainties as further described on page 37 of this Company Profile.
Readers should carefully review the cautionary statement described in this and other documents filed from time to time with the SEC, including on Form 10-K.
| | | | |
| Company Profile | | | | May 2004 |
Quanta believes the historic downturn of the telecom industry has reached bottom and that the industry may be stabilizing. Further, there are several telecom initiatives currently in discussion and underway by several government organizations, wire line carriers and wireless carriers that could provide Quanta with pockets of opportunity for its telecom group in the future. However, Quanta currently does not believe these opportunities are indicative of an overall return to historical network investment levels by the telecom industry as a whole.
With the stabilization of several of Quanta’s markets, the Company has begun to see gross margins generally stabilize as well. While operating conditions are still abnormal and many challenges remain, Quanta is also beginning to see some opportunity for margins to improve slightly, but they are not expected to return to historical levels in the near term. To the extent that Quanta’s primary markets remain stable or begin to improve, margins could gradually continue to improve.
Quanta is unique from its competitors because it has always had a diversified network infrastructure service offering for its customers and a diversified customer base. Thus, Quanta is not overly reliant on a given industry or client for business. For 1Q04 Quanta’s largest customer accounted for 7% of revenues. For 1Q04 Quanta’s top ten and top twenty customers accounted for approximately 31% and 43% of revenues, respectively. This diverse customer base reduces Quanta’s reliance on any one customer in a given period and is one reason why the Company was able to remain financially healthy through the tumultuous telecom downturn over the past few years.
Quanta has low customer concentration...
Most Recent Quarter
| | | | | | | | | | | | | | | | | |
| | | Largest | | Top 5 | | Top 10 | | Top 20 |
| | | Customer
| | Customers
| | Customers
| | Customers
|
| Dycom Industries* | | | 30 | % | | | 67 | % | | | +76 | % | | NA |
| MasTec ** | | | 13 | % | | NA | | NA | | | 64 | % |
Quanta Services | | | 7 | % | | | 21 | % | | | 31 | % | | | 43 | % |
| * | | For quarter ending 1/04 |
| |
| ** | | For 4Q03. MasTec has not reported 1Q04 results as of this publishing. |
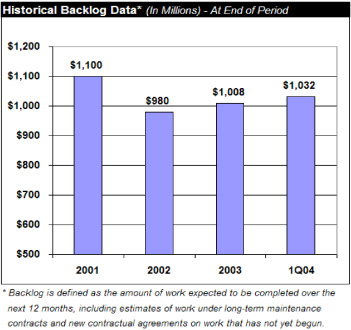
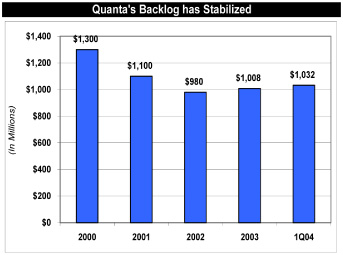
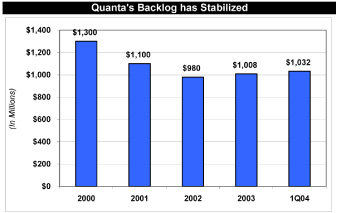
Quanta’s backlog at the end of 1Q04 was approximately $1.032 billion, which is the amount of work expected to be completed over the next 12 months, including estimates of work under long-term maintenance contracts and new contractual agreements on work that has not yet begun. Quanta’s 1Q04 backlog of $1.032 billion was up versus its 4Q03 backlog of $1.008 billion, and up versus 1Q03 backlog of $980 million. Approximately one third of Quanta’s revenues are typically derived from strategic alliances the Company has with various customers, engineering firms, manufacturers, distributors, and others.
...and a high quality, diversified customer base
Quanta’s Top 20 Customers for the Quarter Ending 3/31/04
| | | | | |
| 1 | | Puget Sound Energy | | 11 Georgia Power |
| 2 | | Southern California Edison | | 12 Comcast |
| 3 | | San Diego Gas & Electric | | 13 Alabama Power |
| 4 | | CenterPoint Energy | | 14 SC Electric & Gas |
| 5 | | Pacific Gas & Electric | | 15 Mortenson |
| 6 | | Intermountain Rural Electric | | 16 Illinois Power |
| 7 | | Ericsson | | 17 ADP Marshall, Inc. |
| 8 | | Adelphia Communications | | 18 Verizon |
| 9 | | Entergy Services | | 19 WE Energies |
| 10 | | Alltel | | 20 Utilicorp United |
| | | | | |
|
Quanta Services, Inc. | | ©2004 Quanta Services, Inc. All rights reserved. | | Page 15 |
NYSE: PWR | | | | |
Forward-looking statements contained herein are subject to certain risks and uncertainties as further described on page 37 of this Company Profile.
Readers should carefully review the cautionary statement described in this and other documents filed from time to time with the SEC, including on Form 10-K.
| | | | |
| Company Profile | | | | May 2004 |
It is important to understand that Quanta’s business is typically influenced by seasonal factors.These factors include influences due to weather, capital expenditure spending patterns, bidding seasons, and holidays. Typically, thefirst quarterof the year is the slowest for Quanta, since weather is typically cold, snowy, or wet, and the bidding season for projects to commence throughout the year is just beginning. Thesecond quarteris typically better than the first, as some projects begin, but cold and wet weather can often impact second quarter productivity. Thethird quarteris typically the best of the year, as projects are in full swing and weather is typically accommodating to work on projects. Thefourth quarterof the year is typically not as good as the third, but a bit better than the second. Projects begin to complete in the fourth quarter, things tend to slow due to the holiday season ramping up, and weather can sometimes impact work. However, the fourth quarter can remain robust if some of Quanta’s customers have not yet finished spending their budget, and they race to spend their remaining funds. The Company would note that it has not experienced these normal seasonal patterns for the last few years due to the meltdown in the telecom industry, slowing on the broadband cable TV side of the business, and starts and stops from the utility sector as they have dealt with challenging economic and capital market conditions.
Electric Utility Infrastructure Services
| Quanta performs a complete range of specialty contracting installation, maintenance and repair services for the electric utility industry. Types of electric utility customers include investor-owned utilities (IOUs), independent power producers (IPPs), rural electric associations (REAs) and federal, state and municipal agencies. |
| |
| As the largest specialty electric power contractor in the US, Quanta has some of the most experienced contractors and employees in the industry. In fact, many of the companies that are now part of Quanta contributed to the original build-out of the national transmission and distribution system over 70 years ago. |

Quanta has the ability to handle any electrical infrastructure need for its customers. From project-based engineering and construction of a multi-state, several hundred mile, high voltage transmission line and substation system to complex underground distribution networks, Quanta can handle every size and scope of power project. In fact, there are more than 200,000 miles of overhead electrical lines and thousands of miles of underground electrical cable that have been built and/or are maintained by Quanta Services.
Some of Quanta’s power infrastructure services capabilities include:
| | • | | Design-build or engineer-procure-construct (EPC) services |
| |
| | • | | Construction and maintenance of transmission lines from 69kV to 765 kV |
| |
| | • | | Installation and maintenance of all kinds of distribution facilities |
| |
| | • | | Substation engineering and construction |
| |
| | • | | Energized installation, maintenance and upgrades utilizing proprietary robotic arm, barehand and hotstick methods |
| |
| | • | | Emergency power restoration |
| |
| | • | | Power and control cable pulling, splicing, terminating and testing |
| |
| | • | | Joint electric, gas and telecom installations, and much more |
| | | | | |
|
Quanta Services, Inc. | | ©2004 Quanta Services, Inc. All rights reserved. | | Page 16 |
NYSE: PWR | | | | |
Forward-looking statements contained herein are subject to certain risks and uncertainties as further described on page 37 of this Company Profile.
Readers should carefully review the cautionary statement described in this and other documents filed from time to time with the SEC, including on Form 10-K.
| | | | |
| Company Profile | | | | May 2004 |
Energized Services
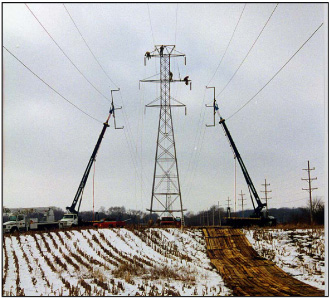
One of Quanta’s significant competitive advantages on the power side is its unmatched expertise and capabilities in the field of energized services. Quanta’s Energized Services and techniques enable Quanta to perform a wide variety of installation, maintenance, rebuild and repair services to almost all parts of an electric network while the network remains energized, without service interruption. Unique to Quanta’s specialty electrical service offering is its exclusive, patent-pending LineMasterTM Robotic Arm. Quanta owns the US rights and the exclusive right to use the LineMaster Robotic Arm for more than the next 10 years. The LineMaster Robotic Arm is used in the construction, maintenance, repair, and improvement of energized T&D lines and substation facilities, and can reduce project completion times by more than 50% versus traditional methods. The telescoping robotic arm temporarily supports live power lines to allow repair or replacement of transmission poles, cross-arms, insulators, etc., while maintaining an energized connection.Importantly, this capability prevents Quanta’s customers from having to shut down a portion of the power grid to allow work to be done, eliminating downtime costs and angry consumers.
Hotstick & Barehand— Hotstick and barehand techniques also enable crews to work on lines without interrupting the customer’s power supply. Quanta uses hotsticks to move conductors, install fuses, and open and close switches. For more intricate repairs, Quanta’s crews use barehand techniques in which live-line workers wear specially designed protective gear that enables them to work at the same electrical potential as the line. Quanta’s employees performing energized services are hand-selected, experienced journeymen, each of whom have completed more than 120 hours of specialized barehand training and annual, recurrent training to be “energized certified”.


Barehand crews can safely handle and efficiently repair live lines up to 765kV. On one project, Quanta used barehand techniques to repair a nuclear plant’s 345kV substation switches in one day without shutting down the reactor.This saved the utility an estimated $10 million— the cost associated with shutting down the reactor, making repairs, returning it to operation and making spot market power purchases during the down time.
Coupling the LineMaster Robotic Arm technology with Quanta’s barehand and hotstick methods provides a complete energized solution that increases efficiency, reliability, levelization, and safety.
| | | | | |
|
Quanta Services, Inc. | | ©2004 Quanta Services, Inc. All rights reserved. | | Page 17 |
NYSE: PWR | | | | |
Forward-looking statements contained herein are subject to certain risks and uncertainties as further described on page 37 of this Company Profile.
Readers should carefully review the cautionary statement described in this and other documents filed from time to time with the SEC, including on Form 10-K.
| | | | |
| Company Profile | | | | May 2004 |
Energized Services Case Study
Kansas City Power & Light (KCP&L) was experiencing transmission congestion on its 345kV LaCygne-Stilwell Line, representing a major bottleneck for members and customers of the Southwest Power Pool (SPP) who rely on the line for service. Since the line was vital to the service needs of KCP&L and the SPP, taking the line out of service for any extended period of time for upgrades would have proved extremely disruptive in the form of lost revenue, power outages, and angry customers.
Since the line was built in 1972, KCP&L had done a number of system augmentations including substation enhancements at either end of the line as well as installing monitoring equipment that provided incremental capacity as power demand grew over the years. However, as KCP&L looked for additional capacity enhancements for the line, it became clear that KCP&L would have to rebuild or upgrade the line to truly solve its capacity problem.
The advent of a high-temperature conductor, or ACSS (aluminum conductor steel supported), meant that the ACSS could carry twice the load of the conductors KCP&L was using on the line, and that if the 345-kV line could be reconductored with the ACSS, KCP&L could use the existing H-frames supporting the line. If this were able to be done while the line remained energized, the line’s capacity problem would be solved and customers would not experience any service disruption.
Because of Quanta’s unmatched expertise in energized services, proprietary tools and work methods, KCP&L approached Quanta to work toward a rebuild solution on the 345-kV LaCygne-Stillwell Line. Quanta worked with KCP&L and developed a plan predicated on reconductoring the line while energized at 345-kV. At that time, Quanta had worked on many energized projects for KCP&L, but none of this magnitude.
To do the job, Quanta used the Equal Potential Stringing Method, which isolated the working area and the conductor being pulled, used proprietary processes, tools and equipment to solve complicated issues and completed the project — all while the line remained in service. The project ran smoothly and was completed a month ahead of schedule, a major accomplishment given the snow and mud experienced at the start of the project in February and spring rains and storms in May.
In summary, Quanta and KCP&L broke new ground with this project in solving transmission congestion problems and upgrading conductors in an energized state. The project was completed ahead of schedule in under five months and cost less than $8 million. Had the line been replaced using traditional installation methods, the project would have taken longer, required the line to be shut down for periods at a time, been significantly more costly, and been disruptive to customers.
| | | | | |
|
Quanta Services, Inc. | | ©2004 Quanta Services, Inc. All rights reserved. | | Page 18 |
NYSE: PWR | | | | |
Forward-looking statements contained herein are subject to certain risks and uncertainties as further described on page 37 of this Company Profile.
Readers should carefully review the cautionary statement described in this and other documents filed from time to time with the SEC, including on Form 10-K.
| | | | |
| Company Profile | | | | May 2004 |
Natural Gas & Pipeline Services
Like the electric power industry, the continued growth of the natural gas industry is expected to generate significant activity, including the development of new pipelines and expansion or upgrades of current systems. Natural gas consumption in the US is expected to rise significantly over the next two decades. It is estimated that the US needs 263,000 miles of distribution pipelines and another 38,000 miles of large diameter transmission pipelines. With the implementation of new legislative mandates requiring more structured and regular maintenance and monitoring of systems, there has been a sharp increase in demand for gas and pipeline services.
Quanta is involved in the assessment, development, maintenance, and expansion of natural gas pipelines. Quanta delivers a comprehensive set of solutions for the natural gas and pipeline industries, including surveying, designing, installing, maintaining, and repairing and testing for all systems and methods of transmitting natural gas. This includes transmission and distribution pipelines, gathering systems, compressor stations, and meter stations.
Quanta also provides services for:
| | • | | Corrosion protection and rehabilitation |
| |
| | • | | Permit and right-of-way acquisition |
| |
| | • | | Directional drilling |
| |
| | • | | Computer aided drafting |
| |
| | • | | Material specifications and acquisition |
Telecom Network Services
Quanta is equipped to provide a complete scope of services to the telecom industry for both wire line and wireless services. Quanta’s telecom customers include incumbent local exchange carriers (ILECs), long-distance carriers, rural telecom providers, competitive local exchange carriers (CLECs), wireless carriers, and others. Quanta not only configures telecom networks, but also provides the services to design, install, operate, test and maintain them. Quanta has the capabilities to install and maintain fiber optic networks across the country, through mountains, valleys and prairies, to businesses, buildings and homes, telephones and modems. From route selection to positioning of the product, Quanta’s telecom network services group provides a turnkey solution.
| ØOutside Plant Services—Both overhead and underground: |
| • | | Plant design, engineering and construction drawings |
| |
| • | | Right-of-way acquisition and permitting |
| |
| • | | Overhead and underground installation, maintenance and repair of fiber optic and copper cable |
| |
| • | | Cable splicing and testing |
| ØInside Plant Services— Starting with plant design, construction drawings and permitting, Quanta’s inside plant services encompass all elements of network integration. From riser installation to horizontal cabling, pathway construction and ongoing maintenance, including installation, cable splicing and materials procurement. Quanta’s inside plant services can serve single or multiple site needs. |
| | | | | |
|
Quanta Services, Inc. | | ©2004 Quanta Services, Inc. All rights reserved. | | Page 19 |
NYSE: PWR | | | | |
Forward-looking statements contained herein are subject to certain risks and uncertainties as further described on page 37 of this Company Profile.
Readers should carefully review the cautionary statement described in this and other documents filed from time to time with the SEC, including on Form 10-K.
| | | | |
| Company Profile | | | | May 2004 |
| ØCentral Office —Quanta’s central office services cover complete engineering, furnish and install (EF&I) needs nationwide. Quanta installs equipment designed by the industry’s leading manufacturers. In fact, Quanta is certified to install the vast majority of the equipment telecom customers require. |
| |
| ØWireless —From monopole erection to orientation and sweep testing, Quanta provides wireless clients with design, build, and maintenance services as well as data transmission, project management and all the permitting processes associated with construction. Quanta crews construct cellular, digital, PCS, microwave and other wireless telecom towers and mobile switching offices. |
Broadband Cable TV Services
Quanta designs, installs, maintains and repairs entire residential and commercial broadband cable TV networks using both analog and digital technology. Quanta’s experience in the latest broadband, telephony, and data technologies, coupled with its inside and outside plant capabilities, enable Quanta to seamlessly handle all phases of a network’s lifespan — from design and installation to upgrade and maintenance projects. Likewise, Quanta’s ability to design and install all types of broadband cable industry systems — coaxial, fiber optic and hybrid systems — provides customers with a reliable resource for all potential needs. Quanta’s scope of services supports advanced technologies including frame relay, SONET, Dense Wave Division Multiplexing (DWDM), and MPEG. From DSL, ADSL and HDSL to video-on-demand, voice over IP or a full headend facility, Quanta can do it all.
Quanta’s broadband cable network services include:
| | • | | System and plant engineering |
| |
| | • | | Equipment installation, activation and testing |
| |
| | • | | Inside wiring, splicing and testing |
| |
| | • | | Permit and utility coordination |
| |
| | • | | Site preparation including rock trenching, directional drilling and mass excavation |
| |
| | • | | Rack installation, overhead and floor cable and fiber trays, and much more |
Specialty Services
In addition to the comprehensive services previously described, Quanta provides a number of specialty services, many of which have applications and customers that span the electric and gas utility, telecom, and broadband cable TV industries. Quanta’s specialty services capabilities include:
| | • | | Pipeline transfer and bulk storage facilities |
| |
| | • | | Intelligent traffic networks including signals, controllers, message signs, and closed circuit monitoring |
| |
| | • | | Light rail tower installation, specialty wiring and ground wires |
| |
| | • | | Piping, tankage and control for airport fueling systems |
| |
| | • | | Wind generation facilities |
| |
| | • | | Rock trenching, directional drilling and road milling |
| |
| | • | | Vegetation control and tree trimming, and more |
| | | | | |
|
Quanta Services, Inc. | | ©2004 Quanta Services, Inc. All rights reserved. | | Page 20 |
NYSE: PWR | | | | |
Forward-looking statements contained herein are subject to certain risks and uncertainties as further described on page 37 of this Company Profile.
Readers should carefully review the cautionary statement described in this and other documents filed from time to time with the SEC, including on Form 10-K.
| | | | |
| Company Profile | | | | May 2004 |
Understanding Margins
It is important to understand how various factors — some controllable, some not - - impact Quanta’s gross margins on a quarterly or annual basis.
| | • | | Seasonal & Geographical:Seasonal patterns can have a significant impact on gross margins. Generally, business is slower in the winter months versus the warmer parts of the year. This can be offset somewhat by increased demand for electrical service and repair work from severe weather. In addition, the mix of business conducted in different parts of the country will affect margins; some parts of the country command higher gross margins than others. |
| |
| | • | | Weather:Adverse or favorable weather conditions can impact gross margins in a given period. For example, in the first quarter of 2003, parts of the country experienced record snow or rain fall that negatively impacted Quanta’s revenue and gross margin. In many cases projects were delayed or had to be temporarily placed on hold and in some parts of the country the snow fall was so severe that Quanta’s employees could not even get to work to open the office. Conversely, in periods where weather remains dry and temperatures are accommodating, more work can be done, sometimes with less cost, which would have a favorable impact in gross margin. In some cases, strong storms or hurricanes can provide Quanta with high margin emergency service restoration work, which has a positive impact on margins. |
| |
| | • | | Revenue Mix:The mix of revenue derived from the electric versus telecom versus broadband cable TV versus other industries will impact gross margins. Historically, broadband cable TV work has commanded the highest gross margins, followed by telecom, and electric. However, with overcapacity and other challenges impacting the telecom and broadband cable TV industries and the significant need for T&D work by electric utilities, in future periods electric utility gross margins could be higher than telecom and broadband cable TV gross margins due to significant demand for T&D work. |
| |
| | • | | Service and Maintenance versus Installation:In general, installation work has a higher gross margin than maintenance work. This is because installation work is often quoted as a lump sum bid, which entails higher risk versus maintenance type work. Quanta typically derives approximately 40%-50% of its revenue from maintenance type work, which is performed under pre-established or negotiated prices or cost plus pricing arrangements. Thus, a higher portion of installation work in a given quarter may lead to a higher gross margin. |
| |
| | • | | Subcontract Work:Work that has to be subcontracted out generally has lower gross margins. An increase in subcontract work in a given period may contribute to a decrease in gross margin. Quanta typically derives approximately 15% of its revenue from work that is subcontracted out to other contractors. |
| |
| | • | | Materials versus Labor:In general, projects that have a higher labor component have a higher gross margin. Some projects require Quanta to supply all, or a portion of, the materials required to complete a project. This is typically at cost plus a mark-up. A given period with work that has a higher materials component may decrease overall gross margin. |
| |
| | • | | Depreciation:Quanta includes depreciation in its cost-of-services line. This is common practice in its industry, but can make comparability to other companies difficult. This must be taken into consideration when comparing Quanta to other companies. |
Again, it is important to understand how various factors impact gross margin. Just because gross margin narrows in a quarter may not mean that Quanta is not managing its costs of services well.
| | | | | |
|
Quanta Services, Inc. | | ©2004 Quanta Services, Inc. All rights reserved. | | Page 21 |
NYSE: PWR | | | | |
Forward-looking statements contained herein are subject to certain risks and uncertainties as further described on page 37 of this Company Profile.
Readers should carefully review the cautionary statement described in this and other documents filed from time to time with the SEC, including on Form 10-K.
| | | | |
| Company Profile | | | | May 2004 |
Quanta’s Growth Strategy — Steady Organic Growth Supplemented by Selected Acquisitions
As discussed, the past three years have been the most challenging and abnormal operating environment for Quanta and its peers in thirty years. No one could have predicted the severity and depth of the telecom industry’s collapse and challenging environment for cable TV, leading to the significant reduction in network development and maintenance investment. The electric power industry, to a lesser extent, was impacted as well.
Throughout this period, Quanta transitioned from a company focused on growth to a company focused on managing its business in a tumultuous environment. Quanta has been successful in reducing its cost structure, streamlining and focusing on operations, and improving its balance sheet. Though the operating environment has not returned to normal or demonstrated a return to a growth trend, Quanta has positioned the Company to operate successfully in the current environment and is well positioned to capitalize on growth opportunities as conditions improve.
In normal market conditions, Quanta enjoyed solid organic revenue growth in excess of 20%. Quanta believes that a sustainable long-term organic revenue growth rate for its business is approximately 10% to 15% in normal operating conditions. This growth will be driven by the need to invest in the expansion and maintenance of the nation’s power grid and continued development and maintenance of telecom and broadband cable TV networks as technology continues to develop new applications and services. It will also be driven by increased network infrastructure installation and maintenance outsourcing trends.
Since the founding of Quanta, the Company has augmented its organic growth with strategic acquisitions of top tier companies, enabling it to expand its service offering and geographic reach to better serve its customers. Quanta has not completed an acquisition since early 2002, but as business conditions return to normal, Quanta may elect to selectively and opportunistically pursue the acquisition of companies to continue to enhance its service offering and expand its geographic reach.
We would note that Quanta has not purchased start-up companies or turnarounds, instead focusing on companies with an average operating history of 20 to 30 years and with a record of operational excellence and profitability. Quanta has a disciplined acquisition approach that focuses on various financial, geographic, and management criteria including:
| | • | | Solid historical and projected financial performance |
| |
| | • | | Internal rate of return, return on assets, and return on revenue benchmarks |
| |
| | • | | Management experience and reputation |
| |
| | • | | The composition and size of the candidate’s customer base |
| |
| | • | | The candidate’s impact on increasing or maintaining market share |
| |
| | • | | Operational synergies, and |
| |
| | • | | Any liabilities, contingent or otherwise. |
| | | | | |
|
Quanta Services, Inc. | | ©2004 Quanta Services, Inc. All rights reserved. | | Page 22 |
NYSE: PWR | | | | |
Forward-looking statements contained herein are subject to certain risks and uncertainties as further described on page 37 of this Company Profile.
Readers should carefully review the cautionary statement described in this and other documents filed from time to time with the SEC, including on Form 10-K.
| | | | |
| Company Profile | | | | May 2004 |
Recent Financial Results & Commentary
As discussed earlier, the first quarter of a given year is typically the slowest and most unpredictable quarter of the year. Quanta’s 1Q04 was more difficult and unpredictable than normal due to project delays, inclement weather and a lack of high margin storm restoration work that typically helps Quanta offset adverse first quarter operating conditions. However, Quanta reported 1Q04 revenue of $355.0 million, which was solidly within its revenue guidance range of $340 million to $360 million and its backlog increased to $1,032 million as of the end of 1Q04 versus $1,008 million at the end of 2003.
1Q04 financial results included the following highlights:
| | • | | Revenues were $355.0 million versus guidance of $340-$360 million |
| |
| | • | | Loss per share was $0.10 versus updated guidance on April 26, 2004, of a loss of $0.10 per share to a loss of $0.11 per share. |
| |
| | • | | Cash flow from operations for 1Q04 was $34.7 million. Cash flow from operations of $34.7 million less capital expenditures of $11.6 million yielded free cash flow of $23.1 million in 1Q04. |
Gross margin (including depreciation expense) in 1Q04 was 7.5% versus 10.3% in 1Q03. The decrease in gross margin in 1Q04 versus the same period last year was due to lower margins in Quanta’s utility and cable TV work, resulting from lower volume of high margin storm restoration work, increased fuel costs, increased safety and insurance costs, plus pricing pressures on utility and cable work. The company also experienced cost overruns and weather delays on a few projects. Quanta expects gross margin to improve sequentially each quarter through the balance of 2004 due to better weather conditions, rising revenue to better cover fixed costs, the opportunity to pass on rising costs to customers in future periods and the opportunity to increase margins on work going forward.
Revenue Breakdown by Type of Customer
| | | | | | | | | |
| | | First Quarter
|
| | | 2004
| | 2003
|
| Electric & Gas Utilities | | | 62 | % | | | 63 | % |
| Telecom | | | 12 | % | | | 14 | % |
| Cable TV | | | 5 | % | | | 7 | % |
| Other | | | 21 | % | | | 16 | % |
SG&A expenses rose in 1Q04 to $43.4 million versus $39.0 million in 1Q03. The increase in SG&A expenses was due primarily to start-up expenses necessary for Quanta to establish its Quanta Government Solutions business, created to pursue the significant opportunities in the government project arena. To date in 2004, Quanta has made important investments in people, processes and systems for this initiative, which Quanta believes offers significant near- and long-term opportunities. Quanta’s strategic decision to pursue government contracts is long-term in nature and the Company does not intend to abandon this initiative once spending in its other core industry segments resume. Quanta believes no other company is as strongly positioned to leverage these opportunities as Quanta.
SG&A was also impacted by higher costs associated with systems and procedures formalization, implementation and testing to comply with certain provisions of Sarbanes-Oxley and higher non-cash compensation expenses related to amortization of its restricted stock awards as a result of its options exchange program initiated in 1Q03. Quanta believes SG&A expenses should decline over the balance of 2004 as costs associated with the development of Quanta Government Solutions and costs related to Sarbanes-Oxley decline.
Loss from operations in 1Q04 was $16.6 million versus 1Q03 loss from operations of $1.2 million. Quanta’s net loss attributable to common stock for 1Q04 was $11.7 million, or ($0.10) per share versus a net loss of $2.7 million, or ($0.03) per share in 1Q03.
| | | | | |
|
Quanta Services, Inc. | | ©2004 Quanta Services, Inc. All rights reserved. | | Page 23 |
NYSE: PWR | | | | |
Forward-looking statements contained herein are subject to certain risks and uncertainties as further described on page 37 of this Company Profile.
Readers should carefully review the cautionary statement described in this and other documents filed from time to time with the SEC, including on Form 10-K.
| | | | |
| Company Profile | | | | May 2004 |
Cash flow from operations in 1Q04 was approximately $34.7 million. Cash flow from operations of $34.7 million less capital expenditures in the quarter of approximately $11.6 million generated free cash flow of approximately $23.1 million in 1Q04. For the year 2004, Quanta estimates it will generate approximately $100 million in free cash flow, inclusive of an estimated $30 million tax refund the Company anticipates receiving in the third or fourth quarter of 2004.
Quanta’s backlog at the end of 1Q04 was $1,032 million, up from backlog at the end of 2003 of $1,008 million and higher versus 1Q03 backlog of $980 million. For the quarter, Quanta’s largest customer accounted for 7% of revenues. Quanta’s top 10 customers for the quarter accounted for 31% of revenues and top 20 customers accounted for 43% of revenues. At the end of 1Q04, Quanta’s employee count was 10,605 versus 11,217 at the end of 2003.
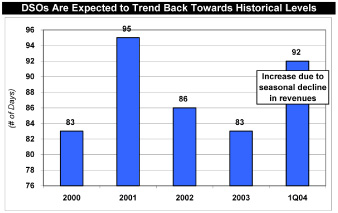
Quanta’s days sales outstanding (DSOs), which includes current accounts receivable plus costs and estimated earnings in excess of billings on uncompleted contracts less billings in excess of costs and estimated earnings on uncompleted contracts, was 92 days at the end of 1Q04 versus 88 days at the end of 1Q03 and compared to 83 days at the end of 4Q03. Quanta’s 1Q04 DSO of 92 days increased from DSOs at the end of 2003 primarily due to the seasonal decline in revenues from $431 million in 4Q03 to $355 million in 1Q04. Quanta expects its DSOs to decline from 92 days at the end of 1Q04 towards historical levels through the course of the year.
In November 2003 Quanta announced that it was awarded a project with American Electric Power (AEP). Quanta continues to move forward on this project to meet AEP’s goals, budget and timeline. With 47 employees deployed, the project is in full swing with right of way acquisition, clearing, receiving materials, and the initial phase of construction in progress.
| | • | | American Electric Power Project —Quanta will construct a 90-mile 765,000-volt (kV) transmission line that will stretch from an AEP station in Oceana, West Virginia to the Jacksons Ferry Station east of Wytheville, Virginia, and will help reinforce the transmission system serving western Virginia and southern West Virginia. The last transmission line completed in this region occurred more than thirty years ago and since then energy demand in this area has increased more than 135%. |
Quanta has seen its telecom (both wire line and wireless) and specialty business environments experience increased stability, as its customers’ capital spending levels appear to have stabilized, albeit at reduced levels. Most of Quanta’s telecom customers appear to be maintaining their current, though reduced levels of capital expenditures, but do not show indication of a significant upward trend in spending due to regulatory uncertainties.
| | | | | |
|
Quanta Services, Inc. | | ©2004 Quanta Services, Inc. All rights reserved. | | Page 24 |
NYSE: PWR | | | | |
Forward-looking statements contained herein are subject to certain risks and uncertainties as further described on page 37 of this Company Profile.
Readers should carefully review the cautionary statement described in this and other documents filed from time to time with the SEC, including on Form 10-K.
| | | | |
| Company Profile | | | | May 2004 |
There are specific pockets of growth in the telecom sector that will ultimately benefit Quanta’s business in the long-term. The single largest opportunity for Quanta’s telecom operations is the potential move by telecom carriers to install fiber-to-the premise (FTTP) in a meaningful way. Recently, Verizon awarded a large FTTP project to one of Quanta’s competitors. However, there are additional opportunities for Quanta to pursue FTTP work with Verizon in markets such as Florida, Texas and California, as the most recent award is not believed to encompass the majority of Verizon’s total contemplated FTTP initial project. It is believed that the remainder of Verizon’s initial FTTP project will be awarded more on a market by market basis, and Quanta will compete for these projects in each market at its subsidiary level. This is a positive development for the industry as a whole as Verizon’s first-mover decision may spur other large telecom companies to expedite FTTP initiatives in their markets and/or encourage cable operators to continue to upgrade their networks to compete with FTTP networks and services. Further, the work should enable the industry as a whole to improve margins as new projects are put out for bid.
On the cable side, Quanta continued to perform cable work for Comcast and Adelphia, including maintenance, upgrades and new builds. Quanta believes Comcast’s spending levels will decline through the balance of the year as it completes its system upgrades. As a result of Comcast being expected to complete the majority of its system upgrades toward the middle of 2004, it is expected that overall cable network spending will decline in 2004 versus 2003.
Finally, Quanta recently announced that Kenneth W. Trawick was named president, Telecommunications and Cable Television Division. Prior to this appointment, Mr. Trawick served as president of Trawick Construction Company, a Quanta operating unit. Previously, he was vice president of Quanta with responsibility for nationwide business development, unit collaboration and asset utilization among Quanta’s telecommunications and cable operating units. Prior to becoming vice president of Quanta, he held various management positions at Trawick Construction including executive vice president and director.
Outlook
For 2Q04, Quanta expects revenues to range from $380 million to $410 million and diluted EPS to be between $0.02 and $0.05. Quanta expects operating margins for 2Q04 to be between 3% and 4%; average diluted shares outstanding for 2Q04 of approximately 115 million; and the Company estimates its effective tax rate for 2Q04 to be between 48% and 49%.
Due to recent spikes in aluminum, copper, steel, and other commodity prices, among other things, that could affect Quanta’s customer’s capital spending decisions in the short-term, Quanta will update full year guidance after the second quarter bidding season has been completed and visibility has improved.
Operating conditions remained challenging in 1Q04, but Quanta is optimistic about the future of its business and will maintain its focus on improving margins and strategically positioning the Company for immediate and future opportunities. While the August 2003 blackout magnifies the need for significant T&D investment, it is uncertain when, or if, the electric utility industry will significantly invest in the power grid in response to its failure. While uncertainties remain, Quanta believes that if capital spending by its customers remains stable, 2004 should present a better operating environment than 2003.
| | | | | |
|
Quanta Services, Inc. | | ©2004 Quanta Services, Inc. All rights reserved. | | Page 25 |
NYSE: PWR | | | | |
Forward-looking statements contained herein are subject to certain risks and uncertainties as further described on page 37 of this Company Profile.
Readers should carefully review the cautionary statement described in this and other documents filed from time to time with the SEC, including on Form 10-K.
| | | | |
| Company Profile | | | | May 2004 |
Quanta Services, Inc.
Historical Financial and Operating Data
(In Thousands, Except Per Share Data)
| | | | | | | | | | | | | | | | | | | | | | | | | | | | | |
| | | 2002
| | 1Q03
| | 2Q03
| | 3Q03
| | 4Q03
| | 2003
| | 1Q04
|
| Revenue | | $ | 1,750,713 | | | $ | 367,129 | | | $ | 408,302 | | | $ | 436,133 | | | $ | 431,289 | | | $ | 1,642,853 | | | $ | 354,997 | |
| Cost of Services | | | 1,513,940 | | | | 329,372 | | | | 354,784 | | | | 381,125 | | | | 377,677 | | | | 1,442,958 | | | | 328,273 | |
| | | |
| | | |
| | | |
| | | |
| | | |
| | | |
| | | |
| |
| Gross Profit | | | 236,773 | | | | 37,757 | | | | 53,518 | | | | 55,008 | | | | 53,612 | | | | 199,895 | | | | 26,724 | |
| SG&A | | | 225,725 | | | | 38,970 | | | | 58,107 | | | | 38,886 | | | | 40,909 | | | | 176,872 | | | | 43,370 | |
| Goodwill Impairment | | | 166,580 | | | | — | | | | — | | | | — | | | | 6,452 | | | | 6,452 | | | | — | |
| | | |
| | | |
| | | |
| | | |
| | | |
| | | |
| | | |
| |
| Income (Loss) from Operations | | | (155,532 | ) | | | (1,213 | ) | | | (4,589 | ) | | | 16,122 | | | | 6,251 | | | | 16,571 | | | | (16,646 | ) |
| Interest Expense | | | (35,866 | ) | | | (7,964 | ) | | | (8,138 | ) | | | (8,080 | ) | | | (7,640 | ) | | | (31,822 | ) | | | (6,366 | ) |
| Loss on Early Extinguishment of Debt | | | — | | | | — | | | | — | | | | — | | | | (35,055 | ) | | | (35,055 | ) | | | — | |
| Other, Net | | | (2,446 | ) | | | 216 | | | | (326 | ) | | | 182 | | | | (2,835 | ) | | | (2,763 | ) | | | 301 | |
| | | |
| | | |
| | | |
| | | |
| | | |
| | | |
| | | |
| |
| Income (Loss) Before Income Tax Provision (Benefit) | | | (193,844 | ) | | | (8,961 | ) | | | (13,053 | ) | | | 8,224 | | | | (39,279 | ) | | | (53,069 | ) | | | (22,711 | ) |
| Provision (Benefit) for Income Taxes | | | (19,710 | ) | | | (4,118 | ) | | | (3,218 | ) | | | 2,825 | | | | (13,569 | ) | | | (18,080 | ) | | | (11,017 | ) |
| | | |
| | | |
| | | |
| | | |
| | | |
| | | |
| | | |
| |
| Income (Loss) Before Cumulative Effect of Change in Accounting Principle, Net | | | (174,134 | ) | | | (4,843 | ) | | | (9,835 | ) | | | 5,399 | | | | (25,710 | ) | | | (34,989 | ) | | | (11,694 | ) |
| Cumulative Effect of Change in Accounting Principle, Net | | | 445,422 | | | | — | | | | — | | | | — | | | | — | | | | — | | | | — | |
| | | |
| | | |
| | | |
| | | |
| | | |
| | | |
| | | |
| |
| Net Income (Loss) | | | (619,556 | ) | | | (4,843 | ) | | | (9,835 | ) | | | 5,399 | | | | (25,710 | ) | | | (34,989 | ) | | | (11,694 | ) |
| Preferred Stock Dividends, Net | | | (11 | ) | | | (2,109 | ) | | | — | | | | — | | | | — | | | | (2,109 | ) | | | — | |
| Non-Cash Beneficial Conversion Charge | | | 8,508 | | | | — | | | | — | | | | — | | | | — | | | | — | | | | — | |
| | | |
| | | |
| | | |
| | | |
| | | |
| | | |
| | | |
| |
| Net Income (Loss) to Common Stock | | $ | (628,053 | ) | | $ | (2,734 | ) | | $ | (9,835 | ) | | $ | 5,399 | | | $ | (25,710 | ) | | $ | (32,880 | ) | | $ | (11,694 | ) |
| Earnings (Loss) Per Share: | | | | | | | | | | | | | | | | | | | | | | | | | | | | |
| Basic EPS Before Cum. Effect of Change in Accounting Principle | | $ | (2.90 | ) | | $ | (0.03 | ) | | $ | (0.08 | ) | | $ | 0.05 | | | $ | (0.23 | ) | | $ | (0.30 | ) | | $ | (0.10 | ) |
| Cum. Effect of Change in Accounting Principle, Net | | | (7.08 | ) | | | — | | | | — | | | | — | | | | — | | | | — | | | | — | |
| | | |
| | | |
| | | |
| | | |
| | | |
| | | |
| | | |
| |
| Basic EPS | | $ | (9.98 | ) | | $ | (0.03 | ) | | $ | (0.08 | ) | | $ | 0.05 | | | $ | (0.23 | ) | | $ | (0.30 | ) | | $ | (0.10 | ) |
| Diluted EPS Before Cum. Effect of Change in Accounting Principle | | $ | (2.90 | ) | | $ | (0.03 | ) | | $ | (0.08 | ) | | $ | 0.05 | | | $ | (0.23 | ) | | $ | (0.30 | ) | | $ | (0.10 | ) |
| Cum. Effect of Change in Accounting Principle, Net | | | (7.08 | ) | | | — | | | | — | | | | — | | | | — | | | | — | | | | — | |
| | | |
| | | |
| | | |
| | | |
| | | |
| | | |
| | | |
| |
| Diluted EPS | | $ | (9.98 | ) | | $ | (0.03 | ) | | $ | (0.08 | ) | | $ | 0.05 | | | $ | (0.23 | ) | | $ | (0.30 | ) | | $ | (0.10 | ) |
| Basic Weighted Average Shares | | | 62,957 | | | | 104,073 | | | | 115,799 | | | | 116,567 | | | | 113,450 | | | | 110,906 | | | | 113,918 | |
| Diluted Weighted Average Shares | | | 62,957 | | | | 104,073 | | | | 115,799 | | | | 116,645 | | | | 113,450 | | | | 110,906 | | | | 113,918 | |
| | | | | | | | | | | | | | | | | | | | | | | | | | | | | |
Margin Analysis | | | 2002 | | | | 1Q03 | | | | 2Q03 | | | | 3Q03 | | | | 4Q03 | | | | 2003 | | | | 1Q04 | |
| | | |
| | | |
| | | |
| | | |
| | | |
| | | |
| | | |
| |
| Revenue | | | 100.0 | % | | | 100.0 | % | | | 100.0 | % | | | 100.0 | % | | | 100.0 | % | | | 100.0 | % | | | 100.0 | % |
| Cost of Services | | | 86.5 | % | | | 89.7 | % | | | 86.9 | % | | | 87.4 | % | | | 87.6 | % | | | 87.8 | % | | | 92.5 | % |
| | | |
| | | |
| | | |
| | | |
| | | |
| | | |
| | | |
| |
| Gross Profit | | | 13.5 | % | | | 10.3 | % | | | 13.1 | % | | | 12.6 | % | | | 12.4 | % | | | 12.2 | % | | | 7.5 | % |
| SG&A | | | 12.9 | % | | | 10.6 | % | | | 14.2 | % | | | 8.9 | % | | | 9.5 | % | | | 10.8 | % | | | 12.2 | % |
| Income (Loss) from Operations | | | -8.9 | % | | | -0.3 | % | | | -1.1 | % | | | 3.7 | % | | | 1.4 | % | | | 1.0 | % | | | -4.7 | % |
| Income (Loss) Before Income Tax Provision (Benefit) | | | -11.0 | % | | | -2.4 | % | | | -3.2 | % | | | 1.9 | % | | | -9.1 | % | | | -3.2 | % | | | -6.4 | % |
| Income (Loss) Before Cumulative Effect of Change in Accounting Principle, Net | | | -9.9 | % | | | -1.3 | % | | | -2.4 | % | | | 1.2 | % | | | -6.0 | % | | | -2.1 | % | | | -3.3 | % |
| Net Income (Loss) | | | -35.3 | % | | | -1.3 | % | | | -2.4 | % | | | 1.2 | % | | | -6.0 | % | | | -2.1 | % | | | -3.3 | % |
| Net Income (Loss) to Common Stockholders | | | -35.8 | % | | | -0.7 | % | | | -2.4 | % | | | 1.2 | % | | | -6.0 | % | | | -2.0 | % | | | -3.3 | % |
| | | | | | | | | | | | | | | | | | | | | | | | | | | | | |
Selected Cash Flow Data | | | 2002 | | | | 1Q03 | | | | 2Q03 | | | | 3Q03 | | | | 4Q03 | | | | 2003 | | | | 1Q04 | |
| | | |
| | | |
| | | |
| | | |
| | | |
| | | |
| | | |
| |
| Net Cash Provided By Operating Activities | | | 121,522 | | | | 37,292 | | | | 35,870 | | | | 3,587 | | | | 40,433 | | | | 117,183 | | | | 34,651 | |
| Capital Expenditures | | | 49,454 | | | | 4,853 | | | | 7,624 | | | | 11,459 | | | | 12,007 | | | | 35,943 | | | | 11,591 | |
| | | |
| | | |
| | | |
| | | |
| | | |
| | | |
| | | |
| |
| Free Cash Flow | | | 72,068 | | | | 32,439 | | | | 28,246 | | | | (7,872 | ) | | | 28,426 | | | | 81,240 | | | | 23,060 | |
| | | | | | | | | | | | | | | | | | | | | | | | | | | | | |
Selected Operating Data | | | 2002 | | | | 1Q03 | | | | 2Q03 | | | | 3Q03 | | | | 4Q03 | | | | 2003 | | | | 1Q04 | |
| | | |
| | | |
| | | |
| | | |
| | | |
| | | |
| | | |
| |
| Backlog | | $ | 980 | | | $ | 980 | | | $ | 975 | | | $ | 983 | | | $ | 1,008 | | | $ | 1,008 | | | $ | 1,032 | |
| Top 10 Customers as a Percentage of Revenue in Period | | | 31 | % | | | 31 | % | | | 29 | % | | | 29 | % | | | 33 | % | | | 29 | % | | | 31 | % |
| Top 20 Customers as a Percentage of Revenue in Period | | | 44 | % | | | 45 | % | | | 42 | % | | | 41 | % | | | 44 | % | | | 41 | % | | | 43 | % |
| Days Sales Outstanding | | | 86 | | | | 88 | | | | 87 | | | | 89 | | | | 83 | | | | 83 | | | | 92 | |
Revenue By Industry | | | | | | | | | | | | | | | | | | | | | | | | | | | | |
| Electric Power & Natural Gas Network Services | | | 56 | % | | | 63 | % | | | 64 | % | | | 59 | % | | | 56 | % | | | 60 | % | | | 62 | % |
| Telecom Network Services | | | 16 | % | | | 14 | % | | | 15 | % | | | 16 | % | | | 13 | % | | | 15 | % | | | 12 | % |
| Cable TV & Broadband Network Services | | | 12 | % | | | 7 | % | | | 6 | % | | | 8 | % | | | 9 | % | | | 7 | % | | | 5 | % |
| Ancillary Services | | | 16 | % | | | 16 | % | | | 15 | % | | | 17 | % | | | 22 | % | | | 18 | % | | | 21 | % |
| | | | | |
|
Quanta Services, Inc. | | ©2004 Quanta Services, Inc. All rights reserved. | | Page 26 |
NYSE: PWR | | | | |
Forward-looking statements contained herein are subject to certain risks and uncertainties as further described on page 37 of this Company Profile.
Readers should carefully review the cautionary statement described in this and other documents filed from time to time with the SEC, including on Form 10-K.
| | | | |
| Company Profile | | | | May 2004 |
Peer Operation & Valuation Comparison
The specialty contracting industry is highly fragmented and very competitive. Quanta estimates that its annual addressable market is approximately $30 billion to $40 billion. Quanta believes that the top five specialty contractors (based on revenues) account for approximately 15% of this annual market opportunity. Quanta estimates that it commands the largest portion of this estimated 15% share, but that it is less than 5% of the total addressable market. The remaining 85% market share is held by smaller, private specialty contracting companies.
With its diversified service offering and customer base, and national presence, Quanta is unique. Below is a table of Quanta’s peer group indicating the various markets each specialty contractor serves. Also included is a peer valuation analysis of a broader peer group that includes several companies in the construction and engineering sector. While Quanta may not compete directly with some of these companies, they are included because they perform construction and engineering services and are often impacted by similar macro and/or other trends as Quanta. Of this peer group, Dycom Industries and MasTec are Quanta’s closest public peers, however, both focus more on the telecom and broadband cable TV industries.
Specialty Contracting Services Market
| | | | | | | | | | | | | | | | | | | | | | | | | |
| | | Utility Infrastructure
| | Commercial & Industrial
|
| | | Electric & | | | | | | | | | | Inside | | | | | | Building |
| | | Gas
| | Telecom
| | Cable TV
| | Electrical
| | Mechanical
| | Services
|
Quanta Services | | | X - 60% | | | | X | | | | X | | | | X | | | | | | | | | |
MasTec | | | X -20%-25% | | | | X | | | | X | | | | | | | | | | | | | |
Dycom Industries | | | | | | | X | | | | X | | | | | | | | | | | | | |
IES | | | | | | | | | | | | | | | X | | | | | | | | X | |
EMCOR | | | | | | | | | | | | | | | X | | | | X | | | | X | |
Comfort Systems | | | | | | | | | | | | | | | | | | | X | | | | X | |
Peer Valuation Comparison
Specialty Contractors/Construction & Engineering
| | | | | | | | | | | | | | | | | | | | | | | | | | | | | |
| | | | | | | | | | | (5/14/04) | | EPS* | | PE Multiple |
| | | Symbol
| | FYE
| | Price
| | 2004E
| | 2005E
| | 2004
| | 2005
|
| Dycom Industries | | DY | | July | | $ | 22.41 | | | $ | 1.02 | | | $ | 1.41 | | | | 22.0X | | | | 15.9X | |
| MasTec | | MTZ | | Dec | | $ | 4.26 | | | $ | 0.62 | | | $ | 0.80 | | | | 6.9X | | | | 5.3X | |
| Chicago Bridge & Iron | | CBI | | Dec | | $ | 28.34 | | | $ | 1.63 | | | $ | 1.88 | | | | 17.4X | | | | 15.1X | |
| EMCOR | | EME | | Dec | | $ | 39.44 | | | $ | 1.99 | | | $ | 3.21 | | | | 19.8X | | | | 12.3X | |
| Flour | | FLR | | Dec | | $ | 37.66 | | | $ | 2.22 | | | $ | 2.52 | | | | 17.0X | | | | 14.9X | |
| IES | | IES | | Sep | | $ | 9.41 | | | $ | 0.63 | | | $ | 0.99 | | | | 14.9X | | | | 9.5X | |
| Jacobs Engineering | | JEC | | Sep | | $ | 41.95 | | | $ | 2.48 | | | $ | 2.81 | | | | 16.9X | | | | 14.9X | |
| Shaw Group | | SGR | | Aug | | $ | 10.98 | | | $ | 0.51 | | | $ | 0.96 | | | | 21.5X | | | | 11.4X | |
| Wireless Facilities | | WFII | | Dec | | $ | 9.59 | | | $ | 0.42 | | | $ | 0.47 | | | | 22.8X | | | | 20.4X | |
| | | | | | | | | | | | | | | | | | | | | | | |
| | | |
| |
Peer Group Average | | | | | | | | | | | | | | | | | | | | | | | 17.7X | | | | 13.3X | |
Closest Peers | | | | | | | | | | | | | | | | | | | | | | | | | | | | |
| Dycom Industries | | DY | | July | | $ | 22.41 | | | $ | 1.02 | | | $ | 1.41 | | | | 22.0X | | | | 15.9X | |
| MasTec | | MTZ | | Dec | | $ | 4.26 | | | $ | 0.62 | | | $ | 0.80 | | | | 6.9X | | | | 5.3X | |
| | | | | | | | | | | | | | | | | | | | | | | |
| | | |
| |
Average | | | | | | | | | | | | | | | | | | | | | | | 14.4X | | | | 10.6X | |
Quanta Services | | PWR | | Dec | | $ | 5.12 | | | $ | 0.11 | | | $ | 0.33 | | | | 46.5X | | | | 15.5X | |
* EPS estimates from First Call using fiscal year end unless noted
| | | | | |
|
Quanta Services, Inc. | | ©2004 Quanta Services, Inc. All rights reserved. | | Page 27 |
NYSE: PWR | | | | |
Forward-looking statements contained herein are subject to certain risks and uncertainties as further described on page 37 of this Company Profile.
Readers should carefully review the cautionary statement described in this and other documents filed from time to time with the SEC, including on Form 10-K.
| | | | |
| Company Profile | | | | May 2004 |
Executive Management Bios
John R. Colsonhas been a member of the Board of Directors since 1998 and has served as Chairman of the Board of Directors since 2002. Mr. Colson has served as Quanta’s Chief Executive Officer since December 1997. He joined PAR Electrical Contractors, Inc. (PAR), an electrical specialty contractor and now a subsidiary of Quanta, in 1971 and served as its President from 1991 to December 1997. He is currently a director of the Missouri Valley Chapter of the National Electrical Contractors Association (NECA), a regent of the Electrical Contracting Foundation, and, since May 1999, a director of U. S. Concrete, Inc.
James H. Haddoxhas served as Quanta’s Chief Financial Officer since November 1997, and served as Secretary from December 1997 until March 1999 and as Treasurer from December 1997 until September 1999.
John R. Wilsonhas been a member of the Board of Directors since 1998. He has served as Quanta’s President of the Electric Power and Gas Division since January 2003, and served as a Senior Vice President of Quanta from June 2001 until January 2003, as a Regional Vice President of Quanta from April 1999 until June 2001, and as President of PAR, an electrical specialty contractor and now a subsidiary of Quanta, from 1997 until January 2003. Mr. Wilson joined PAR in 1977 and served as an Executive Vice President from 1991 until 1997.
Kenneth W. Trawickhas served as President, Telecommunications and Cable Television Division since May 2004 after serving as President of Trawick Construction Company, a Quanta operating unit. Previously, he was Vice President of Quanta with responsibility for nationwide business development, unit collaboration and asset utilization among Quanta’s telecommunications and cable operating units. Prior to becoming Vice President of Quanta, he held various management positions at Trawick Construction including Executive Vice President and Director.
James F. O’Neil IIIhas served as Quanta’s Senior Vice President of Operations Integration and Audit since December 2002 and served as the Company’s Vice President of Operations Integration from August 1999 until December 2002. From 1980 until 1999, Mr. O’Neil held various positions with Halliburton Company, a provider of products and services to the petroleum and energy industries, most recently as Director, Global Deepwater Development.
Benadetto G. Boscohas served as Quanta’s Senior Vice President of Outsourcing since April 2003 and served as the Company’s Vice President of Outsourcing from July 2002 until April 2003. From 1997 until joining Quanta, he served as Vice President of Network/National Sales for Exelon Infrastructure Services, Inc., a provider of transmission and distribution infrastructure services to the electrical, gas, telecommunications and cable utilities. Mr. Bosco holds an M.B.A. degree.
Derrick A. Jensenhas served as Quanta’s Vice President and Controller since December 1997 and as the Company’s Chief Accounting Officer since March 1999. Mr. Jensen is a Certified Public Accountant.
Dana A. Gordonhas served as Quanta’s Vice President, General Counsel and Secretary since January 2001 and as the Company’s Chief Compliance Officer since August 2002, and served as Associate General Counsel from August 1999 until December 2000. From 1996 until joining Quanta, Ms. Gordon was an associate in the corporate department of the law firm of Weil, Gotshal & Manges LLP. Ms. Gordon holds a J.D. degree.
| | | | | |
|
Quanta Services, Inc. | | ©2004 Quanta Services, Inc. All rights reserved. | | Page 28 |
NYSE: PWR | | | | |
Forward-looking statements contained herein are subject to certain risks and uncertainties as further described on page 37 of this Company Profile.
Readers should carefully review the cautionary statement described in this and other documents filed from time to time with the SEC, including on Form 10-K.
| | | | |
| Company Profile | | | | May 2004 |
Darren B. Millerhas served as Quanta’s Vice President of Information Technology and Administration since October 2003. From 1996 until May 2003, Mr. Miller held various positions with Encompass Services Corporation, a provider of facilities systems and services to the construction, healthcare, commercial realty and technology industries, most recently as Senior Vice President and Chief Financial Officer.
Nicholas M. Grindstaffhas served as Quanta’s Treasurer since October 1999 and served as the Company’s Assistant Treasurer from March 1999 until September 1999. Mr. Grindstaff holds a Master of Science in Accounting degree.
In addition to these executives, Quanta is led by more than 30 operating executives with an average of over 25 years of experience.
| | | | | |
|
Quanta Services, Inc. | | ©2004 Quanta Services, Inc. All rights reserved. | | Page 29 |
NYSE: PWR | | | | |
Forward-looking statements contained herein are subject to certain risks and uncertainties as further described on page 37 of this Company Profile.
Readers should carefully review the cautionary statement described in this and other documents filed from time to time with the SEC, including on Form 10-K.
| | | | |
| Company Profile | | | | May 2004 |
Board & Corporate Governance Matters
Quanta’s Board of Directors, as a representative of the stockholders, strives to ensure the achievement of business success and the enhancement of long-term stockholder value with the highest standards of integrity and ethics. The following discussion highlights certain characteristics of Quanta’s Board of Directors and other Corporate Governance matters.Additional information on this subject can be found in the Corporate Governance section of Quanta’s web site at www.QuantaServices.com.
Code of Ethics and Business Conduct & Conflicts of Interest:
The Board expects Quanta directors, as well as officers and employees, to act ethically at all times and to adhere to the policies contained within Quanta’s Code of Ethics and Business Conduct. The Board will not permit any waiver of any ethics policy for any director or executive officer. If an actual or potential conflict of interest arises for a director, the director shall promptly inform the Chairman of the Board or the chairman of the Governance and Nominating Committee. If a significant conflict exists and cannot be resolved, the director should resign. All directors will recuse themselves from any discussion or decision affecting their personal, business or professional interests. The Board shall resolve any conflict of interest question involving the CEO or any other executive officer, and the CEO shall resolve any conflict of interest issue involving any other Quanta officer.
During the year ended December 31, 2003, the Board of Directors held six meetings. All directors attended at least 75% of the meetings of the Board and the committees of the Board, if any, on which they serve during the periods for which they have served as a director, except for Ben A. Guill, who attended 67% of such meetings. Quanta encourages, but does not require, the members of the Board to attend the annual meeting of stockholders. Last year, eight of our directors attended the annual meeting of stockholders.
Quanta’s Board of Directors consists of ten members, whose bios are as follows:
John R. Colsonhas been a member of the Board of Directors since 1998 and has served as Chairman of the Board of Directors since 2002. Mr. Colson has served as Quanta’s Chief Executive Officer since December 1997. He joined PAR Electrical Contractors, Inc. (PAR), an electrical specialty contractor and now a subsidiary of Quanta, in 1971 and served as its President from 1991 to December 1997. He is currently a director of the Missouri Valley Chapter of the National Electrical Contractors Association (NECA), a regent of the Electrical Contracting Foundation, and, since May 1999, a director of U. S. Concrete, Inc.
James R. Ballhas been a member of the Board of Directors since 1998 and is a private investor with J. R. Ball Investments, a private investment firm. Mr. Ball serves as a director of ABS Group of Companies, Inc. Mr. Ball holds a Master of Science in Management degree.
Vincent D. Fosterhas been a member of the Board of Directors since 1998. He has served as Senior Managing Director of Main Street Mezzanine Fund, L.P. (and its predecessor firms), a venture capital firm, since 1997. Mr. Foster is also a director of U. S. Concrete, Inc. and Carriage Services, Inc. Mr. Foster holds a J.D. degree and is a Certified Public Accountant.
Bernard Friedhas been a member of the Board of Directors since March 2004. He has served as an advisor to the board of Citadon, Inc., a software services provider, since November 2003. Mr. Fried served as Chief Executive Officer and President of Citadon, Inc., from 2001 until November 2003, Principal Vice President and Program Manager of Bechtel Business Services, a shared services operating unit of Bechtel Group, Inc., an international engineering and construction firm, from 2000 until 2001, and
| | | | | |
|
Quanta Services, Inc. | | ©2004 Quanta Services, Inc. All rights reserved. | | Page 30 |
NYSE: PWR | | | | |
Forward-looking statements contained herein are subject to certain risks and uncertainties as further described on page 37 of this Company Profile.
Readers should carefully review the cautionary statement described in this and other documents filed from time to time with the SEC, including on Form 10-K.
| | | | |
| Company Profile | | | | May 2004 |
Chief Financial Officer and Managing Director of Bechtel Enterprises, Inc., a financing and development subsidiary of Bechtel Group, Inc., from 1997 until 2000. Mr. Fried holds an M.B.A. degree.
H. Jarrell Gibbshas been a member of the Board of Directors since March 2004. He served as President of TXU Corporation, an energy services company, from 2001 until 2002, Vice Chairman of TXU Corporation, from 1997 until 2001, President of TXU Electric Company, a power generation and electricity distribution subsidiary of TXU Corporation, from 1995 until 1997, and Chief Financial Officer of TXU Corporation and President of TXU Business Services Company, an accounting, human resources, information technology, environmental and regulatory services subsidiary of TXU Corporation, from 1991 until 1995. Mr. Gibbs serves as a director of Penn Virginia Corporation. Mr. Gibbs holds an M.B.A. degree.
Louis C. Golmhas been a member of the Board of Directors since July 2002 and from May 2001 until May 2002. He has been an independent consultant and senior advisor to the telecommunications and information management industries since 1999. Mr. Golm serves as a director of SBS Technologies. Mr. Golm holds a Master of Science in Management degree and an M.B.A. degree.
Ben A. Guillhas been a member of the Board of Directors since December 2002. He has served as President and a Managing Director of First Reserve Corporation, a private equity firm specializing in the energy industry, since 1998. Mr. Guill serves as a director on the boards of Dresser, Inc., National-Oilwell, Inc., Superior Energy Services, Inc. and T-3 Energy Services, Inc. Mr. Guill holds an M.B.A. degree.
Thomas J. Sikorskihas been a member of the Board of Directors since March 2003. He has served as a Managing Director of First Reserve Corporation, a private equity firm specializing in the energy industry, since April 2002. From 1994 until 2002, Mr. Sikorski was a Partner with Windward Capital, a New York-based private equity firm. Mr. Sikorski serves as a director of Dresser, Inc. Mr. Sikorski holds an M.B.A. degree.
Gary A. Tuccihas been a member of the Board of Directors since 1998 and has served as a Regional Vice President of Quanta since August 1998. Mr. Tucci joined Potelco, Inc., a gas, telecommunications and power infrastructure services provider and now a subsidiary of Quanta, in 1975 and has served as Chief Executive Officer since November 2002 and served as President from 1988 until November 2002. He is a member of the Joint NECA/International Brotherhood of Electrical Workers Apprenticeship and Training Committee as well as the National Labor Relations Board.
John R. Wilsonhas been a member of the Board of Directors since 1998. He has served as Quanta’s President of the Electric Power and Gas Division since January 2003, and served as a Senior Vice President of Quanta from June 2001 until January 2003, as a Regional Vice President of Quanta from April 1999 until June 2001, and as President of PAR, an electrical specialty contractor and now a subsidiary of Quanta, from 1997 until January 2003. Mr. Wilson joined PAR in 1977 and served as an Executive Vice President from 1991 until 1997.
| | | | | |
|
Quanta Services, Inc. | | ©2004 Quanta Services, Inc. All rights reserved. | | Page 31 |
NYSE: PWR | | | | |
Forward-looking statements contained herein are subject to certain risks and uncertainties as further described on page 37 of this Company Profile.
Readers should carefully review the cautionary statement described in this and other documents filed from time to time with the SEC, including on Form 10-K.
| | | | |
| Company Profile | | | | May 2004 |
Director Compensation
The Governance and Nominating Committee has the responsibility of recommending to the Board non-employee directors’ compensation and benefits. The committee is guided by certain director compensation principles set forth in Quanta’s Corporate Governance Guidelines. Directors who also are employees of Quanta or any of its subsidiaries do not receive additional compensation for serving as directors. Each non-employee director receives a fee for attendance at each meeting of the Board of Directors or any committee according to the following schedule:
| • | | $2,000 for attendance at a board meeting in person; $1,000 for attendance at a board meeting by telephone; $1,000 for attendance at a committee meeting in person; $500 for attendance at a committee meeting by telephone; and $500 additional compensation for attendance at a committee meeting by the committee chairman. |
Upon initial appointment to the Board of Directors other than at an annual meeting of stockholders, each non-employee director receives a pro rata portion of (i) an annual cash retainer payment of $30,000 and (ii) an annual grant of shares of restricted stock with a value equal to $60,000 for the period from appointment through the end of the director service year during which the appointment is made. Upon initial election to the Board of Directors at an annual meeting of stockholders, each non-employee director receives an annual cash retainer payment of $30,000 and an award of shares of restricted stock with a value equal to $120,000. At each subsequent annual meeting of stockholders at which a non-employee director is re-elected or remains a director, the non-employee director receives an annual cash retainer payment of $30,000 and an award of shares of restricted stock with a value equal to $60,000. Directors are reimbursed for reasonable out-of-pocket expenses incurred in attending meetings of the Board of Directors or the committees thereof, and for other expenses reasonably incurred in their capacity as directors of Quanta.
Board Committees
Quanta’s Board has established the following standing committees to assist the Board in discharging its responsibilities: (i) Audit Committee; (ii) Compensation Committee; and (iii) Governance and Corporate Nominating Committee. Each of these committees is governed by a written charter approved by the full Board, upon the recommendation of the Governance and Nominating Committee. These committee charters are posted to the Quanta Services website. The Board also has established the following standing committees to monitor the strategic direction of Quanta’s acquisition program and approve acquisitions within certain parameters: (i) Acquisitions Committee and (ii) Small Acquisitions Committee. The Board shall convene other standing or special committees as it deems appropriate.
Audit Committee
Chaired by James Ball, the Audit Committee is the principal agent of the Board in overseeing (i) the integrity of the Company’s financial statements, (ii) the Company’s compliance with legal and regulatory requirements, (iii) the independent auditor’s qualifications and independence, and (iv) the performance of the Company’s internal audit function and independent auditors.
Compensation Committee
Chaired by James Ball, the Compensation Committee has overall responsibility to design, approve and evaluate the executive compensation plans, policies and programs of the Company, discharge the Board’s responsibilities relating to compensation of the Company’s executives and produce an annual report on executive compensation that is included in the Company’s proxy statement, in accordance with applicable rules and regulations.
| | | | | |
|
Quanta Services, Inc. | | ©2004 Quanta Services, Inc. All rights reserved. | | Page 32 |
NYSE: PWR | | | | |
Forward-looking statements contained herein are subject to certain risks and uncertainties as further described on page 37 of this Company Profile.
Readers should carefully review the cautionary statement described in this and other documents filed from time to time with the SEC, including on Form 10-K.
| | | | |
| Company Profile | | | | May 2004 |
Governance & Nominating Committee
Chaired by Louis Golm, the Governance and Nominating Committee has overall responsibility to identify qualified individuals to become members of the Board and the committees thereof, to recommend that the Board select the director nominees for the next annual meeting of stockholders and to fill any vacancy, to make recommendations for nominations to the Board regarding executive officers and to develop and recommend to the Board corporate governance principles applicable to the Board and the Company.
| | | | | | | | | | | | | |
| | | | | | | | | | | Governance & |
| | | Audit | | Compensation | | Nominating |
| | | Committee
| | Committee
| | Committee
|
| James R. Ball | | Chair | | Chair | | X |
| John R. Colson, Chairman of the Board | | | | | | | | | | | | |
| Vincent D. Foster | | | | | | | | | | | | |
| Bernard Fried | | X | | | | | | X |
| H. Jarrell Gibbs | | X | | X | | | | |
| Louis C. Golm | | X | | X | | Chair |
| Ben A. Guill | | | | | | | | | | | | |
| Thomas J. Sikorski | | | | | | | | | | | | |
| Gary A. Tucci | | | | | | | | | | | | |
| John R. Wilson | | | | | | | | | | | | |
| * | | Board composition as of the regular meeting of directors held on 3/18/04. Information is current as of the date of such meeting. |
| | | | | |
|
Quanta Services, Inc. | | ©2004 Quanta Services, Inc. All rights reserved. | | Page 33 |
NYSE: PWR | | | | |
Forward-looking statements contained herein are subject to certain risks and uncertainties as further described on page 37 of this Company Profile.
Readers should carefully review the cautionary statement described in this and other documents filed from time to time with the SEC, including on Form 10-K.
| | | | |
| Company Profile | | | | May 2004 |
QUANTA SERVICES, INC. AND SUBSIDIARIES
CONSOLIDATED STATEMENTS OF OPERATIONS
(In thousands, except per share information)
(Unaudited)
| | | | | | | | | |
| | | Three Months Ended |
| | | March 31, |
| | | 2003
| | 2004
|
| Revenues | | $ | 367,129 | | | $ | 354,997 | |
| Cost of services (including depreciation) | | | 329,372 | | | | 328,273 | |
| | | |
| | | |
| |
| Gross profit | | | 37,757 | | | | 26,724 | |
| Selling, general and administrative expenses | | | 38,970 | | | | 43,370 | |
| | | |
| | | |
| |
| Income (loss) from operations | | | (1,213 | ) | | | (16,646 | ) |
| Interest expense | | | (7,964 | ) | | | (6,366 | ) |
| Other, net | | | 216 | | | | 301 | |
| | | |
| | | |
| |
| Income (loss) before income tax provision (benefit) | | | (8,961 | ) | | | (22,711 | ) |
| Provision (benefit) for income taxes | | | (4,118 | ) | | | (11,017 | ) |
| | | |
| | | |
| |
| Net income (loss) | | | (4,843 | ) | | | (11,694 | ) |
| Dividends on preferred stock, net of forfeitures | | | (2,109 | ) | | | — | |
| | | |
| | | |
| |
| Net income (loss) attributable to common stock | | $ | (2,734 | ) | | $ | (11,694 | ) |
| | | |
| | | |
| |
| Earnings (loss) per share: | | | | | | | | |
| Basic and diluted earnings (loss) per share | | $ | (0.03 | ) | | $ | (0.10 | ) |
| | | |
| | | |
| |
| Basic and diluted weighted average shares outstanding | | | 104,073 | | | | 113,918 | |
| | | |
| | | |
| |
| | | | | |
|
Quanta Services, Inc. | | ©2004 Quanta Services, Inc. All rights reserved. | | Page 34 |
NYSE: PWR | | | | |
Forward-looking statements contained herein are subject to certain risks and uncertainties as further described on page 37 of this Company Profile.
Readers should carefully review the cautionary statement described in this and other documents filed from time to time with the SEC, including on Form 10-K.
| | | | |
| Company Profile | | | | May 2004 |
QUANTA SERVICES, INC. AND SUBSIDIARIES
CONSOLIDATED BALANCE SHEETS
(In thousands, except share information)
(Unaudited)
| | | | | | | | | |
| | | December 31, | | March 31, |
| | | 2003
| | 2004
|
ASSETS | | | | | | | | |
Current Assets: | | | | | | | | |
| Cash and cash equivalents | | $ | 179,626 | | | $ | 195,680 | |
| Accounts receivable, net of allowances | | | 358,698 | | | | 319,063 | |
| Costs and estimated earnings in excess of billings on uncompleted contracts | | | 51,619 | | | | 55,686 | |
| Inventories | | | 23,809 | | | | 26,042 | |
| Prepaid expenses and other current assets | | | 62,341 | | | | 57,856 | |
| | | |
| | | |
| |
| Total current assets | | | 676,093 | | | | 654,327 | |
| Property and equipment, net | | | 341,542 | | | | 337,786 | |
| Accounts and notes receivable, net of allowances | | | 34,327 | | | | 34,358 | |
| Other assets, net | | | 25,591 | | | | 25,071 | |
| Goodwill and other intangibles, net | | | 388,882 | | | | 388,817 | |
| | | |
| | | |
| |
| Total assets | | $ | 1,466,435 | | | $ | 1,440,359 | |
| | | |
| | | |
| |
LIABILITIES AND STOCKHOLDERS’ EQUITY | | | | | | | | |
Current Liabilities: | | | | | | | | |
| Current maturities of long-term debt | | $ | 5,034 | | | $ | 3,612 | |
| Accounts payable and accrued expenses | | | 175,445 | | | | 184,222 | |
| Billings in excess of costs and estimated earnings on uncompleted contracts | | | 18,911 | | | | 17,609 | |
| | | |
| | | |
| |
| Total current liabilities | | | 199,390 | | | | 205,443 | |
| Long-term debt, net of current maturities | | | 58,051 | | | | 46,962 | |
| Convertible subordinated notes | | | 442,500 | | | | 442,500 | |
| Deferred income taxes and other non-current liabilities | | | 103,362 | | | | 91,407 | |
| | | |
| | | |
| |
| Total liabilities | | | 803,303 | | | | 786,312 | |
| | | |
| | | |
| |
| Commitments and Contingencies | | | | | | | | |
| Stockholders’ Equity: | | | | | | | | |
| Common stock | | | — | | | | — | |
| Limited Vote Common Stock | | | — | | | | — | |
| Additional paid-in capital | | | 1,071,701 | | | | 1,081,200 | |
| Deferred compensation | | | (7,359 | ) | | | (11,369 | ) |
| Retained deficit | | | (389,485 | ) | | | (401,179 | ) |
| Treasury stock, at cost | | | (11,725 | ) | | | (14,605 | ) |
| | | |
| | | |
| |
| Total stockholders’ equity | | | 663,132 | | | | 654,047 | |
| | | |
| | | |
| |
| Total liabilities and stockholders’ equity | | $ | 1,466,435 | | | $ | 1,440,359 | |
| | | |
| | | |
| |
| | | | | |
|
Quanta Services, Inc. | | ©2004 Quanta Services, Inc. All rights reserved. | | Page 35 |
NYSE: PWR | | | | |
Forward-looking statements contained herein are subject to certain risks and uncertainties as further described on page 37 of this Company Profile.
Readers should carefully review the cautionary statement described in this and other documents filed from time to time with the SEC, including on Form 10-K.
| | | | |
| Company Profile | | | | May 2004 |
QUANTA SERVICES, INC. AND SUBSIDIARIES
CONSOLIDATED STATEMENTS OF CASH FLOWS
(In thousands)
(Unaudited)
| | | | | | | | | |
| | | Three Months Ended |
| | | March 31, |
| | | 2003
| | 2004
|
Cash Flows from Operating Activities: | | | | | | | | |
| Net income (loss) attributable to common stock | | $ | (2,734 | ) | | $ | (11,694 | ) |
Adjustments to reconcile net income (loss) attributable to common stock to net cash provided by operating activities : | | | | | | | | |
| Depreciation and amortization | | | 14,901 | | | | 14,976 | |
| Loss on sale of property and equipment | | | 433 | | | | 172 | |
| Provision for doubtful accounts | | | 243 | | | | 83 | |
| Deferred income tax provision (benefit) | | | 2,055 | | | | (12,914 | ) |
| Amortization of deferred compensation | | | 206 | | | | 900 | |
| Preferred stock dividend, net of forfeitures | | | (2,109 | ) | | | — | |
Changes in operating assets and liabilities, net of non-cash transactions: | | | | | | | | |
(Increase) decrease in: | | | | | | | | |
| Accounts receivable | | | 44,552 | | | | 39,552 | |
| Costs and estimated earnings in excess of billings on uncompleted contracts | | | 1,505 | | | | (4,067 | ) |
| Inventories | | | (1,558 | ) | | | (2,233 | ) |
| Prepaid expenses and other current assets | | | (1,231 | ) | | | 1,742 | |
Increase (decrease) in - | | | | | | | | |
| Accounts payable and accrued expenses and other non-current liabilities | | | (19,784 | ) | | | 9,879 | |
| Billings in excess of costs and estimated earnings on uncompleted contracts | | | 855 | | | | (1,302 | ) |
| Other, net | | | (42 | ) | | | (443 | ) |
| | | |
| | | |
| |
| Net cash provided by operating activities | | | 37,292 | | | | 34,651 | |
| | | |
| | | |
| |
Cash Flows from Investing Activities: | | | | | | | | |
| Proceeds from sale of property and equipment | | | 213 | | | | 559 | |
| Additions of property and equipment | | | (4,853 | ) | | | (11,591 | ) |
| Cash restricted for self-insurance programs | | | — | | | | 3,248 | |
| | | |
| | | |
| |
| Net cash used in investing activities | | | (4,640 | ) | | | (7,784 | ) |
| | | |
| | | |
| |
Cash Flows from Financing Activities: | | | | | | | | |
| Net borrowings (payments) under bank lines of credit | | | — | | | | (10,700 | ) |
| Proceeds from other long-term debt | | | 914 | | | | 130 | |
| Payments on other long-term debt | | | (1,965 | ) | | | (1,941 | ) |
| Issuances of stock, net of offering costs | | | 1,931 | | | | 1,650 | |
| Exercise of stock options | | | — | | | | 48 | |
| | | |
| | | |
| |
| Net cash provided by (used in) financing activities | | | 880 | | | | (10,813 | ) |
| | | |
| | | |
| |
| Net Increase in Cash and Cash Equivalents | | | 33,532 | | | | 16,054 | |
| Cash and Cash Equivalents, beginning of period | | | 27,901 | | | | 179,626 | |
| | | |
| | | |
| |
| Cash and Cash Equivalents, end of period | | $ | 61,433 | | | $ | 195,680 | |
| | | |
| | | |
| |
Supplemental Disclosure of Cash Flow Information | | | | | | | | |
Cash paid for: | | | | | | | | |
| Interest | | $ | 5,741 | | | $ | 821 | |
| Income taxes, net of refunds | | | (931 | ) | | | (199 | ) |
| | | | | |
|
Quanta Services, Inc. | | ©2004 Quanta Services, Inc. All rights reserved. | | Page 36 |
NYSE: PWR | | | | |
Forward-looking statements contained herein are subject to certain risks and uncertainties as further described on page 37 of this Company Profile.
Readers should carefully review the cautionary statement described in this and other documents filed from time to time with the SEC, including on Form 10-K.
| | | | |
| Company Profile | | | | May 2004 |
Forward-Looking Statements and Risk Factors
Quanta Services’ business is subject to a variety of risks, including the risks and uncertainties summarized below and more fully in Quanta Services’ Form 10-K for the year ended December 31, 2003 under Item 1. “Business— Risk Factors.” These risks and uncertainties are not the only ones facing Quanta Services. Additional risks and uncertainties not known to Quanta Services or not summarized below may also impair its business operations. If any of the following risks actually occur, Quanta Services’ business, financial condition and results of operations could be harmed and it may not be able to achieve its goals.
This Company Profile also includes statements reflecting assumptions, expectations, projections, intentions, or beliefs about future events that are intended as “forward-looking statements” under the Private Securities Litigation Reform Act of 1995. You can identify these statements by the fact that they do not relate strictly to historical or current facts. They use words such as “anticipate,” “estimate,” “project,” “forecast,” “may,” “will,” “should,” “could,” “expect,” “believe” and other words of similar meaning. In particular, these include, but are not limited to, statements relating to the following:
| | • | | Projected operating or financial results; |
| |
| | • | | Expectations regarding capital expenditures; |
| |
| | • | | The effects of competition in Quanta Services’ markets; |
| |
| | • | | The duration and extent of the current economic downturn; |
| |
| | • | | Materially adverse changes in economic conditions in the markets served by Quanta Services or by its customers; and |
| |
| | • | | Quanta Services’ ability to achieve cost savings. |
Any or all of Quanta Services’ forward-looking statements may turn out to be wrong. They can be affected by inaccurate assumptions and by known or unknown risks and uncertainties, including the following:
| | • | | Quarterly variations in Quanta Services’ operating results due to seasonality and adverse weather conditions; |
| |
| | • | | The future possibility of an economic downturn; |
| |
| | • | | Quanta Services’ dependence on fixed price contracts; |
| |
| | • | | Material adverse changes in economic conditions in the markets served by Quanta Services or by its customers; |
| |
| | • | | Rapid technological and structural changes that could reduce the demand for the services Quanta Services provides; |
| |
| | • | | Quanta Services’ ability to effectively compete for market share; |
| |
| | • | | Cancellation provisions within Quanta Services’ contracts; and |
| |
| | • | | Potential liabilities relating to occupational health and safety matters; |
| |
| | • | | Retention of key personnel and qualified employees; |
| |
| | • | | The impact of Quanta Services’ unionized workforce on its operations and acquisition strategy; |
| |
| | • | | Quanta Services’ growth outpacing its infrastructure; |
| |
| | • | | Potential exposure to environmental liabilities; |
| |
| | • | | The cost of borrowing, availability of credit, debt covenant compliance and other factors affecting Quanta Services’ financing activities; |
| |
| | • | | Quanta Services’ ability to generate internal growth; |
| |
| | • | | The adverse impact of goodwill impairments; |
| |
| | • | | Replacement of Quanta Services’ contracts as they are completed or expire; |
| |
| | • | | Quanta Services’ ability to effectively integrate the operations of its companies; |
| |
| | • | | Beliefs and assumptions about the collectibility of receivables; and |
| |
| | • | | Beliefs or assumptions about the outlook for markets Quanta Services serves. |
Many of these factors will be important in determining Quanta Services’ actual future results. Consequently, no forward-looking statement can be guaranteed. Quanta Services’ actual future results may vary materially from those expressed or implied in any forward-looking statements.
All of Quanta Services’ forward-looking statements, whether written or oral, are expressly qualified by these cautionary statements and any other cautionary statements that may accompany such forward-looking statements. In addition, Quanta Services disclaims any obligation to update any forward-looking statements to reflect events or circumstances after the date of this report.
| | | | | |
|
Quanta Services, Inc. | | ©2004 Quanta Services, Inc. All rights reserved. | | Page 37 |
NYSE: PWR | | | | |
Forward-looking statements contained herein are subject to certain risks and uncertainties as further described on page 37 of this Company Profile.
Readers should carefully review the cautionary statement described in this and other documents filed from time to time with the SEC, including on Form 10-K.