Exhibit 99.1

April 5, 2013
Mr. Stephen C. Larkin, CFO
Bayou City Exploration,
Inc. 632 Adams Street, Suite
700 Bowling Green, Ky.
42101
| RE: | | Bayou City Exploration, Inc. Evaluation of Proved Oil and Gas Assets As of December 31, 2012 |
Dear Mr. Larkin:
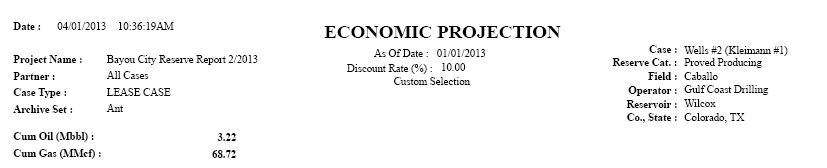
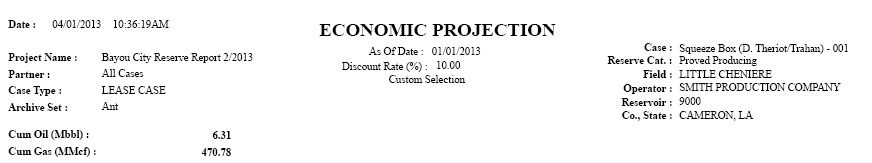
Pursuant to your request, Pressler Petroleum Consultants, Inc. (Pressler) has estimated proved reserves and prepared a projection of future production and cash flow attributable to certain oil and gas interests owned by Bayou City Exploration, Inc. (Bayou City). Projections of the reserves and cash flow to the evaluated interests were based on applicable economic parameters and operating conditions pursuant to the financial reporting requirements of the Securities and Exchange Commission (SEC). It is the understanding of Pressler that the purpose of this evaluation is for year-end financial reporting.
The properties evaluated are located in the Gulf Coast Area of South Texas and Cameron Parish, Louisiana. As of December 31, 2012 the properties consist of interests in a total of 6 active oil and gas wells, all of which are producing. All properties were evaluated by Pressler along with their associated total proved net reserves and values as of December 31, 2012. It is the understanding of Pressler that the reserves contained herein represent 100% of Bayou City's reserves as of the effective date of this report.
Oil and gas reserves were evaluated for proved developed producing (PDP) only.
All data utilized in the preparation of this report with respect to interests, oil and gas prices, operating expenses, investments and current operating conditions were provided by Bayou City.
It should be emphasized that revisions to the projection of reserves and economics included in this report may be required if the production data are revised for any reason. No inspection of the properties was made as this was not considered to be within the scope of this evaluation.
Oil reserves are expressed in United States (U.S.) barrels of 42 U.S. gallons. Gas volumes are expressed in thousands of standard cubic feet (Mcf) at the official temperature and pressure base of the areas in which the gas reserves are located.
The ownership interests and property identification were accepted as provided by Bayou City and incorporated into our analysis. We were provided with updated Lease Operating Statements and Check Stubs with which we calculated price differentials and operating costs. Additionally, we obtained performance information from the operators of the subject properties. We projected the future production performance for each well using production data reported to state regulatory bodies, as well as the provided accounting data and ownership interests to generate future net reserves and cash flows. The results of these calculations are summarized below:
Page 2 of 4
Estimated Oil and Gas Reserves and Future Net Revenue
As of December 31, 2012
Net to Bayou City Exploration, Inc.
| | Net Oil | | | Net Gas | | | Undiscounted | | | FNR Discounted | |
| Reserve Category | | (Bbls) | | | (Mcf) | | | FNR, $ | | | at 10%, $ | |
| Producing (PDP) | | | 5,400 | | | | 68,180 | | | | 612,240 | | | | 544,710 | |
| Total Proved | | | 5,400 | | | | 68,180 | | | | 612,240 | | | | 544,710 | |
Included in this report is a one-line summary, and individual well estimated production and cash flowprojections.
COMMODITY PRICE
As specified by the SEC regulations, when calculating economic producibility, the base product price must be the 12-month average price, calculated as the un-weighted arithmetic average of the first-day-of-the-month price for each month within the prior 12-month period. The benchmark base prices used for this evaluation were $94.71 per barrel of oil for West Texas Intermediate oil at Cushing, OK, and $2.849 per thousand standard cubic feet of natural gas at Henry Hub, LA. The oil and gas prices were adjusted on each well based on deductions such as quality, energy content, and basis differential, as appropriate. Prices for oil and natural gas were held constant throughout the remaining life of the properties.
No attempt has been made to account for oil and gas price fluctuations that have occurred in the market subsequent to the effective date of this report. It should be emphasized that with current economic uncertainties, fluctuations in market conditions could significantly change the economics in this report.
OPERATING EXPENSE
Operating expenses were provided by Bayou City. The evaluation utilized up to twelve months of operating expense records depending upon when the wells were completed. Detailed joint interest billing statements were provided and reviewed. Operating costs were held constant for thelife of the properties. Standard state severance taxes have been deducted as appropriate.
This report includes only cost and revenues which were provided by Bayou City that are directly attributable to the individual leases and areas. All workover costs and operating costs have been deducted as applicable. These costs were supplied by Bayou City. No adjustments were made to account for the potential effect of inflation on these costs.
ENVIRONMENTAL & REGULATORY
The wells evaluated herein,which Bayou City owns an interest, may be subject to various levels of governmental controls and regulations. These controls and regulations may include matters relating to land tenure, drilling, production practices, environmental protection, marketing and pricing policies, and various taxes and are subject to change from time to time. Such changes in governmental regulations and policies may cause volumes of reserves actually recovered and amounts of income actually received to differ significantly from the estimated quantities in this report.
No consideration was given in this report to potential environmental liabilities that may exist concerning the properties evaluated. There are no costs included in this evaluation for potential liability for restoration and to clean up damages, if any, caused by past or future operating practices.
Page 3 of 4
RESERVE ESTIMATES
The estimates of reserves obtained in this report were determined by accepted industry methods and in accordance with the attached Definitions of Oil and Gas Reserves. Methods utilized in this report include extrapolation of historical production trends and analogy to similar producing properties. Pressler believes the assumptions, data, methods and procedures utilized in this report are appropriate for the purpose served by this report, and that it utilized all methods and procedures it considered necessary to prepare this report.
There are significant uncertainties in estimating reserves, future rates of production, and the timing and amount of future costs. Oil and gas reserves estimates must be recognized as a subjective process that cannot be measured in an exact way and estimates of others may differ materially from those of Pressler. Production data subsequent to the date of these estimates may warrant revisions of such estimates. Accordingly, reserves estimates are often different from the quantities of oil and gas that are ultimately recovered.
Pressler is an independent petroleum consulting firm founded in 1985 and does not own any interests in the oil and gas properties covered by this report or this evaluation. No employee, officer, or director of Pressler is an employee, officer, or director of Bayou City. Neither the employment of nor the compensation received by Pressler is contingent upon the values assigned to the properties covered by the report or this evaluation.
This report should be considered in its entirety and should not be used for any purpose other than that outlined herein without the express written consent of an officer of Pressler.
SUMMARY
The estimates of reserves obtained in this report were determined by accepted industry methods and in accordance with the attached Definitions of Oil and Gas Reserves. There are significant uncertainties in estimating reserves, future rates of production, and the timing and amount of future costs. The professional qualifications of the petroleum consultants responsible for the evaluation of the reserves and economics information contained in this report meet the standards of Reserves Estimator as defined in the "Standards Pertaining to the Estimating and Auditing of Oil and Gas Reserves Information" as promulgated by the Society of Petroleum Engineers.
Thank you for the opportunity to prepare this evaluation. Should you have any questions concerning the report, please do not hesitate to contact us.
| �� | Yours truly, |
| | |
| | PRESSLER PETROLEUM CONSULTANTS, INC. |
| | Firm Registration No. 7807 |
| | |
| | By:/s/ Andrew Tharp |
| | Andrew Tharp, E.I.T. |
| | |
| | /s/Stan Valdez |
| | Stan Valdez, P.E. |
| | TBPE # 110367 |
Page 4 of 4
Professional Qualifications
Stan S. Valdez, P.E.
I, Stan S. Valdez, am the primary technical person responsible for the resulting estimate of reserves and associated cash flow and economics presented herein on behalf of Pressler Petroleum Consultants, Inc. (Pressler) to Bayou City Exploration, Inc. I have a Bachelor of Science degree in Petroleum Engineering from Texas A&M University.
I am a qualified Reserves Estimator as set forth in the"Standards Pertaining to the Estimating and Auditing of Oil and Gas Reserves Information"promulgated by the Society of Petroleum Engineers. This qualification is based on more than 16 years of practical experience in the estimation and evaluation of petroleum reserves, as well as continuing education concerning the estimating and auditing of oil and gas reserves.
I am a registered Professional Engineer in the state of Texas (TBPE # 110367).
Professional Qualifications
Andrew Tharp, E.I.T.
I, Andrew Tharp, am a qualified Reserves Estimator as set forth in the"Standards Pertaining to the Estimating and Auditing of Oil and Gas Reserves Information"promulgated by the Society of Petroleum Engineers. This qualification is based on more than 1 year of practical experience in the estimation and evaluation of petroleum reserves, as well as continuing education concerning the estimating and auditing of oil and gas reserves. I have a Bachelor of Science degree in Petroleum Engineering from The University of Texas at Austin.
Reserve Definitions Tables 2 and 3 excerpted from the Society of
Petroleum Engineers Petroleum Resources Management System
(SPE-PRMS) approved 2007.
Table 2: Reserves Status Definitions and Guidelines
| Status | Definition | Guidelines |
| Developed Reserves | Developed Reserves are expected quantities to be recovered from existing wells and facilities. | Reserves are considered developed only after the necessary equipment has been installed, or when the costs to do so are relatively minor compared to the cost of a well. Where required facilities become unavailable, it may be necessary to reclassify Developed Reserves as Undeveloped. Developed Reserves may be further sub-classified as Producing or Non-Producing. |
Developed
Producing
Reserves | Developed Producing Reserves are expected to be recovered from completion intervals that are open and producing at the time of the estimate. | Improved recovery reserves are considered producing only after the improved recovery project Is in operation. |
| Developed Non- Producing Reserves | Developed Non-Producing Reserves include shut-in and behind-pipe Reserves. | Shut-in Reserves are expected to be recovered from (1)completion intervals which are open at the time of the estimate but which have not yet started producing, (2) wells which were shut-in for market conditions or pipeline . connections, or (3) wells notcapable of production for mechanical reasons. Behind-pipe Reserves are expected to be recovered from zones in existing wells which will require additional completion work or future re-completion prior to start of production. In all cases, production can be initiated or restored with relatively low expenditure compared to the cost of drilling a new well. |
| Undeveloped Reserves | Undeveloped Reserves are quantities expected to be recovered through future investments: | (1) from new wells on undrilled acreage In known accumulations, (2) from deepening existing wells to a different (but known) reservoir, (3) from infill wells that will increase recovery, or (4) where a relatively large expenditure (e.g. when compared to the cost of drilling a new well) is required to (a) recomplete an existing well or (b) install production or transportation facilities for primary or improved recovery projects. |
Table 3: Reserves Category Definitions and Guidelines
| Category | Definition | Guidelines |
Proved Reserves | Proved Reserves are thosequantities of petroleum, which by analysis of geoscience andengineering data, can beestimated with reasonable certainty to be commerciallyrecoverable, from a given dateforward, from known reservoirs and under defined economicconditions, operating methods, and government regulations. | If deterministic methods are used, the term reasonable certainty isintended to express a high degree of confidence that the quantitieswill be recovered. If probabilistic methods are used, there should be at least a 90% probability that the quantities actually recoveredwill equal or exceed the estimate. The area of the reservoir considered as Proved includes (1) thearea delineated by drilling and defined by fluid contacts, if any, and(2) adjacent undrilled portions of the reservoir that can reasonablybe judged as continuous with it and commercially productive on the basis of available geoscience and engineering data. In the absence of data on fluid contacts, Proved quantities in a reservoir are limited by the lowest known hydrocarbon (LKH) as seen in a well penetration unless otherwise indicated by definitive geoscience, engineering, or performance data. Such definitive information may include pressure gradient analysis and seismic indicators. Seismic data alone may not be sufficient to define fluidContacts for Proved reserves (see "2001 Supplemental Guidelines," Chapter 8). Reserves in undeveloped locations may be classified as Proved provided that: · The locations are in undrilled areas of the reservoir that can bejudged withreasonable certainty to be commercially productive. · Interpretations of available geoscience and engineering data indicate with reasonable certainty that the objective formation is laterally continuous with drilled Proved locations. For Proved Reserves, the recovery efficiency applied to these reservoirs should be defined based on a range of possibilities supported by analogs and sound engineering judgment considering the characteristics of the Proved area and the applied development program. |
Probable Reserves | Probable Reserves are those additional Reserves whichanalysis of geoscience andengineering data indicate are less likely to be recovered thanProved Reserves but more certain to be recovered thanPossible Reserves. | It is equally likely that actual remaining quantities recovered will be greater than or less than the sum of the estimated Proved plusProbable Reserves (2P). In this context, when probabilisticmethods are used, there should be at least a 50% probability thatthe actual quantities recovered will equal or exceed the 2Pestimate. Probable Reserves may be assigned to areas of a reservoir adjacent to Proved where data control or interpretations of available data are less certain. The interpreted reservoir continuity may not meet the reasonable certainty criteria. Probable estimates also include incremental recoveries associated with project recovery efficiencies beyond that assumed for Proved, |
| Category | Definition | Guidelines |
Possible Reserves | Possible Reserves are those additional reserves whichanalysis of geoscience andengineering data indicate are less likely to be recoverablethan Probable Reserves. | The total quantities ultimately recovered from the project have a low probability to exceed the sum of Proved plus Probable plusPossible (3P), which is equivalent to the high estimate scenario. When probabilistic methods are used, there should be at least a10% probability that the actual quantities recovered will equal orexceed the 3P estimate. Possible Reserves may be assigned to areas of a reservoir adjacent to Probable where data control and interpretations of available data are progressively less certain. Frequently, this may be in areas where geoscience and engineering data are unable to dearly define the area and vertical reservoir limits of commercial production from the reservoir by a defined project. Possible estimates also include incremental quantities associatedWith project recovery efficiencies beyond that assumed forProbable. |
Probable and Possible Reserves | (See above for separate criteria for Probable Reservesand Possible Reserves.) | The 2P and 3P estimates may be based on reasonable alternative technical and commercial interpretations within the reservoir and/or |
| subject project that are dearly documented, including comparisons |
| to results in successful similar projects. |
| In conventional accumulations, Probable and/or Possible Reserves may be assigned where geoscience and engineering data identifydirectly adjacent portions of a reservoir within the same accumulation that may be separated from Proved areas by minor faulting or other geological discontinuities and have not beenpenetrated by a wellbore but are interpreted to be in communication with the known (Proved) reservoir. Probable or |
| Possible Reserves may be assigned to areas that are structurallyhigher than the Proved area. Possible (and in some cases, Probable) Reserves may be assigned to areas that are structurally lower than the adjacent Proved or 2P area. |
| Caution should be exercised in assigning Reserves to adjacent reservoirs isolated by major, potentially sealing, faults until this reservoir is penetrated and evaluated as commercially productive. |
Justification for assigning Reserves in such cases should be clearly documented. Reserves should not be assigned to areas that are dearly separated from a known accumulation by non-productive reservoir (i.e., absence of reservoir, structurally low reservoir, ornegative test results); such areas may contain ProspectiveResources. In conventional accumulations, where drilling has defined a highest known oil (HKO) elevation and there exists the potential for an associated gas cap, Proved oil Reserves should only be assignedin the structurally higher portions of the reservoir if there is reasonable certainty that such portions are initially above bubblepoint pressure based on documented engineering analyses.Reservoir portions that do not meet this certainty may be assigned as Probable and Possible oil and/or gas based on reservoir fluid properties and pressure gradient interpretations. |
4/1/2013 10:34:23AM
Economic One-Liners
Project Name : Bayou City Reserve Report 2/2013 As of Date: 1/1/2013
Ownership Group : All CasesLease Name
| | | Net Reserves | | Net Revenue | Expense | | Cash Flow | |
Lease Name
Risked/ UnRisked | Reserve Category | Oil
(Mbbl) | Gas
(MMcf) | | Oil
(M$) | Gas
(M$) | Other
(M$) |
& Tax
(M$) | Invest.
(M$) | Non-Disc.
(M$) | Disc. CF
(M$) | Life
(years) |
| Grand Total | Total | 5.40 | 68.18 | | 522.59 | 289.09 | 0.00 | 199.43 | 0.00 | 612.24 | 544.71 | 19.74 |
| Koehn #2 | P-DP | 3.95 | 33.93 | | 381.82 | 146.20 | 0.00 | 88.60 | 0.00 | 439.42 | 399.26 | 4.73 |
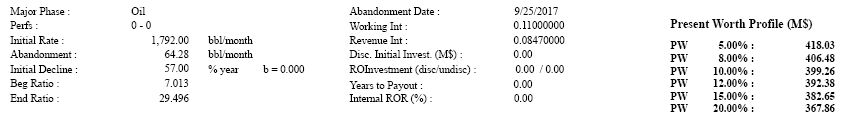
| Wells #2 (Kleimann #1) | P-DP | 1.09 | 16.16 | | 105.38 | 78.03 | 0.00 | 79.08 | 0.00 | 104.33 | 89.88 | 7.90 |
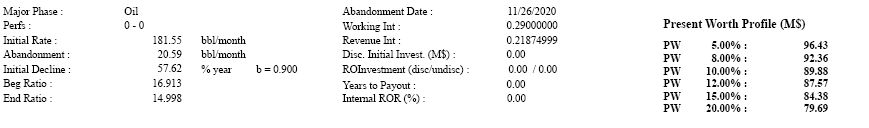
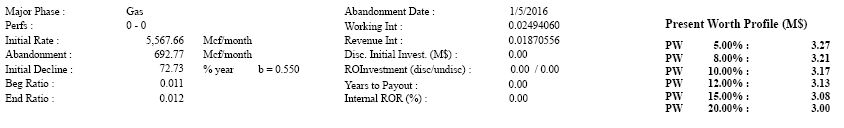
| Squeeze Box (D. Theriot/Trahan) - 001 | P-DP | 0.07 | 13.88 | | 7.66 | 47.45 | 0.00 | 10.49 | 0.00 | 44.62 | 35.05 | 19.74 |
| Glasscock E-1 | P-DP | 0.10 | 2.91 | | 9.80 | 13.08 | 0.00 | 5.42 | 0.00 | 17.46 | 14.44 | 13.49 |
| Trad #3 (Taylor #1) | P-DP | 0.02 | 1.31 | | 1.51 | 4.32 | 0.00 | 2.45 | 0.00 | 3.38 | 3.17 | 3.01 |
| Rooke #2 | P-DP | 0.17 | 0.00 | | 16.43 | 0.00 | 0.00 | 13.40 | 0.00 | 3.03 | 2.91 | 1.35 |

| Year | | Gross
Oil
(Mbbl) | | | Gross
Gas
(MMcf) | | | Net
Oil
(Mbbl) | | | Net
Gas
(MMcf) | | | Oil
Price
($/bbl) | | | Gas
Price
($/Mcf) | | | Oil
Revenue
(M$) | | | Gas
Revenue
(M$) | | | Misc.
Revenue
(M$) | |
| 2013 | | | 40.34 | | | | 776.52 | | | | 2.76 | | | | 26.89 | | | | 96.76 | | | | 4.25 | | | | 267.17 | | | | 114.35 | | | | 0.00 | |
| 2014 | | | 19.20 | | | | 425.42 | | | | 1.31 | | | | 15.07 | | | | 96.78 | | | | 4.25 | | | | 126.67 | | | | 64.12 | | | | 0.00 | |
| 2015 | | | 9.46 | | | | 263.18 | | | | 0.61 | | | | 9.22 | | | | 96.84 | | | | 4.26 | | | | 59.13 | | | | 39.27 | | | | 0.00 | |
| 2016 | | | 5.24 | | | | 172.06 | | | | 0.32 | | | | 6.10 | | | | 96.86 | | | | 4.29 | | | | 30.69 | | | | 26.16 | | | | 0.00 | |
| 2017 | | | 3.08 | | | | 118.06 | | | | 0.17 | | | | 3.90 | | | | 96.91 | | | | 4.30 | | | | 16.18 | | | | 16.77 | | | | 0.00 | |
| 2018 | | | 1.85 | | | | 76.02 | | | | 0.08 | | | | 1.85 | | | | 97.02 | | | | 4.32 | | | | 8.12 | | | | 8.00 | | | | 0.00 | |
| 2019 | | | 1.54 | | | | 60.36 | | | | 0.07 | | | | 1.54 | | | | 96.99 | | | | 4.34 | | | | 6.93 | | | | 6.67 | | | | 0.00 | |
| 2020 | | | 1.29 | | | | 48.91 | | | | 0.06 | | | | 1.23 | | | | 96.99 | | | | 4.33 | | | | 5.55 | | | | 5.35 | | | | 0.00 | |
| 2021 | | | 0.90 | | | | 37.36 | | | | 0.00 | | | | 0.41 | | | | 99.42 | | | | 3.59 | | | | 0.45 | | | | 1.48 | | | | 0.00 | |
| 2022 | | | 0.79 | | | | 31.39 | | | | 0.00 | | | | 0.35 | | | | 99.32 | | | | 3.59 | | | | 0.39 | | | | 1.24 | | | | 0.00 | |
| 2023 | | | 0.70 | | | | 26.74 | | | | 0.00 | | | | 0.30 | | | | 99.23 | | | | 3.59 | | | | 0.34 | | | | 1.06 | | | | 0.00 | |
| 2024 | | | 0.62 | | | | 23.11 | | | | 0.00 | | | | 0.26 | | | | 99.15 | | | | 3.59 | | | | 0.30 | | | | 0.92 | | | | 0.00 | |
| 2025 | | | 0.56 | | | | 20.08 | | | | 0.00 | | | | 0.22 | | | | 99.08 | | | | 3.59 | | | | 0.27 | | | | 0.80 | | | | 0.00 | |
| 2026 | | | 0.28 | | | | 13.70 | | | | 0.00 | | | | 0.18 | | | | 100.31 | | | | 3.51 | | | | 0.15 | | | | 0.64 | | | | 0.00 | |
| 2027 | | | 0.03 | | | | 8.49 | | | | 0.00 | | | | 0.15 | | | | 105.30 | | | | 3.42 | | | | 0.06 | | | | 0.50 | | | | 0.00 | |
| Rem | | | 0.11 | | | | 29.81 | | | | 0.00 | | | | 0.52 | | | | 105.30 | | | | 3.42 | | | | 0.21 | | | | 1.76 | | | | 0.00 | |
| Total | | | 86.00 | | | | 2,131.19 | | | | 5.40 | | | | 68.18 | | | | 96.80 | | | | 4.24 | | | | 522.59 | | | | 289.09 | | | | 0.00 | |
| Ult | | | 139.99 | | | | 3,358.28 | | | | | | | | | | | | | | | | | | | | | | | | | | | | | |
| Year | | | Well Count | | | | Net Tax Production
(M$) | | | | NetTax
AdValorem
(M$) | | | | Net
Investment
(M$) | | | | Net
Lease Costs (M$) | | | | Net
Well Costs (M$) | | | | Other Costs (M$) | | | | NetProfits(M$) | | | | Annual
Cash Flow
(M$) | | | | Cum Disc.Cash Flow (M$) | |
| 2013 | | | 6.00 | | | | 17.29 | | | | 0.00 | | | | 0.00 | | | | 30.68 | | | | 0.00 | | | | 0.00 | | | | 0.00 | | | | 333.56 | | | | 319.81 | |
| 2014 | | | 6.00 | | | | 10.50 | | | | 0.00 | | | | 0.00 | | | | 27.41 | | | | 0.00 | | | | 0.00 | | | | 0.00 | | | | 152.88 | | | | 453.21 | |
| 2015 | | | 5.00 | | | | 5.58 | | | | 0.00 | | | | 0.00 | | | | 24.17 | | | | 0.00 | | | | 0.00 | | | | 0.00 | | | | 68.65 | | | | 507.66 | |
| 2016 | | | 5.00 | | | | 3.32 | | | | 0.00 | | | | 0.00 | | | | 23.49 | | | | 0.00 | | | | 0.00 | | | | 0.00 | | | | 30.04 | | | | 529.34 | |
| 2017 | | | 4.00 | | | | 1.97 | | | | 0.00 | | | | 0.00 | | | | 19.60 | | | | 0.00 | | | | 0.00 | | | | 0.00 | | | | 11.38 | | | | 536.81 | |
| 2018 | | | 3.00 | | | | 0.98 | | | | 0.00 | | | | 0.00 | | | | 9.29 | | | | 0.00 | | | | 0.00 | | | | 0.00 | | | | 5.85 | | | | 540.28 | |
| 2019 | | | 3.00 | | | | 0.82 | | | | 0.00 | | | | 0.00 | | | | 9.29 | | | | 0.00 | | | | 0.00 | | | | 0.00 | | | | 3.48 | | | | 542.17 | |
| 2020 | | | 3.00 | | | | 0.66 | | | | 0.00 | | | | 0.00 | | | | 8.46 | | | | 0.00 | | | | 0.00 | | | | 0.00 | | | | 1.77 | | | | 543.04 | |
| 2021 | | | 2.00 | | | | 0.15 | | | | 0.00 | | | | 0.00 | | | | 0.59 | | | | 0.00 | | | | 0.00 | | | | 0.00 | | | | 1.18 | | | | 543.57 | |
| 2022 | | | 2.00 | | | | 0.12 | | | | 0.00 | | | | 0.00 | | | | 0.59 | | | | 0.00 | | | | 0.00 | | | | 0.00 | | | | 0.91 | | | | 543.93 | |
| 2023 | | | 2.00 | | | | 0.11 | | | | 0.00 | | | | 0.00 | | | | 0.59 | | | | 0.00 | | | | 0.00 | | | | 0.00 | | | | 0.70 | | | | 544.19 | |
| 2024 | | | 2.00 | | | | 0.09 | | | | 0.00 | | | | 0.00 | | | | 0.59 | | | | 0.00 | | | | 0.00 | | | | 0.00 | | | | 0.53 | | | | 544.37 | |
| 2025 | | | 2.00 | | | | 0.08 | | | | 0.00 | | | | 0.00 | | | | 0.59 | | | | 0.00 | | | | 0.00 | | | | 0.00 | | | | 0.39 | | | | 544.49 | |
| 2026 | | | 2.00 | | | | 0.06 | | | | 0.00 | | | | 0.00 | | | | 0.44 | | | | 0.00 | | | | 0.00 | | | | 0.00 | | | | 0.29 | | | | 544.57 | |
| 2027 | | | 1.00 | | | | 0.05 | | | | 0.00 | | | | 0.00 | | | | 0.29 | | | | 0.00 | | | | 0.00 | | | | 0.00 | | | | 0.22 | | | | 544.62 | |
| | | | | | | | | | | | | | | | | | | | | | | | | | | | | | | | | | | | | | | | | |
| Rem. | | | | | | | 0.16 | | | | 0.00 | | | | 0.00 | | | | 1.39 | | | | 0.00 | | | | 0.00 | | | | 0.00 | | | | 0.42 | | | | 0.09 | |
| Total | | | | | | | 41.93 | | | | 0.00 | | | | 0.00 | | | | 157.50 | | | | 0.00 | | | | 0.00 | | | | 0.00 | | | | 612.24 | | | | 544.71 | |


| | | | Gross | | | | Gross | | | | Net | | | | Net | | | | Oil | | | | Gas | | | | Oil | | | | Gas | | | | Misc. | |
| Year | | | Oil | | | | Gas | | | | Oil | | | | Gas | | | | Price | | | | Price | | | | Revenue | | | | Revenue | | | | Revenue | |
| | | | (Mbbl) | | | | (MMcf) | | | | (Mbbl) | | | | (MMcf) | | | | ($/bbl) | | | | ($/Mcf) | | | | (M$) | | | | (M$) | | | | (M$) | |
| 2013 | | | 26.16 | | | | 186.84 | | | | 2.22 | | | | 15.57 | | | | 96.71 | | | | 4.31 | | | | 214.29 | | | | 67.10 | | | | 0.00 | |
| 2014 | | | 12.17 | | | | 104.15 | | | | 1.03 | | | | 8.68 | | | | 96.71 | | | | 4.31 | | | | 99.71 | | | | 37.40 | | | | 0.00 | |
| 2015 | | | 5.24 | | | | 59.52 | | | | 0.44 | | | | 4.96 | | | | 96.71 | | | | 4.31 | | | | 42.90 | | | | 21.37 | | | | 0.00 | |
| 2016 | | | 2.26 | | | | 37.40 | | | | 0.19 | | | | 3.12 | | | | 96.71 | | | | 4.31 | | | | 18.49 | | | | 13.43 | | | | 0.00 | |
| 2017 | | | 0.78 | | | | 19.20 | | | | 0.07 | | | | 1.60 | | | | 96.71 | | | | 4.31 | | | | 6.42 | | | | 6.90 | | | | 0.00 | |
| | | | | | | | | | | | | | | | | | | | | | | | | | | | | | | | | | | | | |
| | | | | | | | | | | | | | | | | | | | | | | | | | | | | | | | | | | | | |
| Rem | | | 0.00 | | | | 0.00 | | | | 0.00 | | | | 0.00 | | | | 0.00 | | | | 0.00 | | | | 0.00 | | | | 0.00 | | | | 0.00 | |
| Total | | | 46.61 | | | | 407.10 | | | | 3.95 | | | | 33.93 | | | | 96.71 | | | | 4.31 | | | | 381.82 | | | | 146.20 | | | | 0.00 | |
| Ult | | | 55.12 | | | | 446.38 | | | | | | | | | | | | | | | | | | | | | | | | | | | | | |
| | | | | | | | | | | | | | | | | | | | | | | | | | | | | | | | | | | | | |
| | | | Well | | | | Net Tax | | | | Net Tax | | | | Net | | | | Net
Lease | | | | Net
Well | | | | Other | | | | Net | | | | Annual
Cash | | | | Cum Disc.
Cash | |
| Year | | | Count | | | | Production | | | | AdValorem | | | | Investment | | | | Costs | | | | Costs | | | | Costs | | | | Profits | | | | low | | | | Flow | |
| | | | (M$) | | | | (M$) | | | | (M$) | | | | (M$) | | | | (M$) | | | | (M$) | | | | (M$) | | | | (M$) | | | | (M$) | | | | (M$) | |
| 2013 | | | 1.00 | | | | 11.19 | | | | 0.00 | | | | 0.00 | | | | 11.29 | | | | 0.00 | | | | 0.00 | | | | 0.00 | | | | 258.91 | | | | 248.17 | |
| 2014 | | | 1.00 | | | | 7.21 | | | | 0.00 | | | | 0.00 | | | | 14.19 | | | | 0.00 | | | | 0.00 | | | | 0.00 | | | | 115.72 | | | | 349.20 | |
| 2015 | | | 1.00 | | | | 3.47 | | | | 0.00 | | | | 0.00 | | | | 14.19 | | | | 0.00 | | | | 0.00 | | | | 0.00 | | | | 46.62 | | | | 386.22 | |
| 2016 | | | 1.00 | | | | 1.79 | | | | 0.00 | | | | 0.00 | | | | 14.19 | | | | 0.00 | | | | 0.00 | | | | 0.00 | | | | 15.94 | | | | 397.76 | |
| 2017 | | | 1.00 | | | | 0.78 | | | | 0.00 | | | | 0.00 | | | | 10.30 | | | | 0.00 | | | | 0.00 | | | | 0.00 | | | | 2.24 | | | | 399.26 | |
| | | | | | | | | | | | | | | | | | | | | | | | | | | | | | | | | | | | | | | | | |
| | | | | | | | | | | | | | | | | | | | | | | | | | | | | | | | | | | | | | | | | |
| Rem. | | | | | | | 0.00 | | | | 0.00 | | | | 0.00 | | | | 0.00 | | | | 0.00 | | | | 0.00 | | | | 0.00 | | | | 0.00 | | | | 0.00 | |
| Total | | | | | | | 24.44 | | | | 0.00 | | | | 0.00 | | | | 64.16 | | | | 0.00 | | | | 0.00 | | | | 0.00 | | | | 439.42 | | | | 399.26 | |
| | | | Gross | | | | Gross | | | | Net | | | | Net | | | | Oil | | | | Gas | | | | Oil | | | | Gas | | | | Misc. | |
| Year | | | Oil | | | | Gas | | | | Oil | | | | Gas | | | | Price | | | | Price | | | | Revenue | | | | Revenue | | | | Revenue | |
| | | | (Mbbl) | | | | (MMcf) | | | | (Mbbl) | | | | (MMcf) | | | | ($/bbl) | | | | ($/Mcf) | | | | (M$) | | | | (M$) | | | | (M$) | |
| 2013 | | | 1.57 | | | | 25.62 | | | | 0.34 | | | | 5.31 | | | | 96.73 | | | | 4.83 | | | | 33.15 | | | | 25.63 | | | | 0.00 | |
| 2014 | | | 0.94 | | | | 14.75 | | | | 0.21 | | | | 3.06 | | | | 96.73 | | | | 4.83 | | | | 19.89 | | | | 14.76 | | | | 0.00 | |
| 2015 | | | 0.67 | | | | 10.26 | | | | 0.15 | | | | 2.12 | | | | 96.73 | | | | 4.83 | | | | 14.08 | | | | 10.26 | | | | 0.00 | |
| 2016 | | | 0.51 | | | | 7.83 | | | | 0.11 | | | | 1.62 | | | | 96.73 | | | | 4.83 | | | | 10.86 | | | | 7.83 | | | | 0.00 | |
| 2017 | | | 0.41 | | | | 6.28 | | | | 0.09 | | | | 1.30 | | | | 96.73 | | | | 4.83 | | | | 8.76 | | | | 6.28 | | | | 0.00 | |
| 2018 | | | 0.35 | | | | 5.23 | | | | 0.08 | | | | 1.08 | | | | 96.73 | | | | 4.83 | | | | 7.33 | | | | 5.23 | | | | 0.00 | |
| 2019 | | | 0.30 | | | | 4.48 | | | | 0.07 | | | | 0.93 | | | | 96.73 | | | | 4.83 | | | | 6.29 | | | | 4.48 | | | | 0.00 | |
| 2020 | | | 0.24 | | | | 3.56 | | | | 0.05 | | | | 0.74 | | | | 96.73 | | | | 4.83 | | | | 5.02 | | | | 3.56 | | | | 0.00 | |
| | | | | | | | | | | | | | | | | | | | | | | | | | | | | | | | | | | | | |
| | | | | | | | | | | | | | | | | | | | | | | | | | | | | | | | | | | | | |
| | | | | | | | | | | | | | | | | | | | | | | | | | | | | | | | | | | | | |
| Rem | | | 0.00 | | | | 0.00 | | | | 0.00 | | | | 0.00 | | | | 0.00 | | | | 0.00 | | | | 0.00 | | | | 0.00 | | | | 0.00 | |
| Total | | | 4.98 | | | | 78.00 | | | | 1.09 | | | | 16.16 | | | | 96.73 | | | | 4.83 | | | | 105.38 | | | | 78.03 | | | | 0.00 | |
| Ult | | | 8.20 | | | | 146.72 | | | | | | | | | | | | | | | | | | | | | | | | | | | | | |
| | | | Well | | | | Net Tax | | | | Net Tax | | | | Net | | | | Net
Lease | | | | Net
Well | | | | Other | | | | Net | | | | Annual
Cash | | | | Cum Disc.
Cash | |
| Year | | | Count | | | | Production | | | | AdValorem | | | | Investment | | | | Costs | | | | Costs | | | | Costs | | | | Profits | | | | Flow | | | | Flow | |
| | | | | | | | (M$) | | | | (M$) | | | | (M$) | | | | (M$) | | | | (M$) | | | | (M$) | | | | (M$) | | | | (M$) | | | | (M$) | |
| | | | | | | | | | | | | | | | | | | | | | | | | | | | | | | | | | | | | | | | | |
| 2013 | | | 1.00 | | | | 3.32 | | | | 0.00 | | | | 0.00 | | | | 8.70 | | | | 0.00 | | | | 0.00 | | | | 0.00 | | | | 46.76 | | | | 44.87 | |
| 2014 | | | 1.00 | | | | 1.95 | | | | 0.00 | | | | 0.00 | | | | 8.70 | | | | 0.00 | | | | 0.00 | | | | 0.00 | | | | 24.00 | | | | 65.78 | |
| 2015 | | | 1.00 | | | | 1.37 | | | | 0.00 | | | | 0.00 | | | | 8.70 | | | | 0.00 | | | | 0.00 | | | | 0.00 | | | | 14.27 | | | | 77.07 | |
| 2016 | | | 1.00 | | | | 1.05 | | | | 0.00 | | | | 0.00 | | | | 8.70 | | | | 0.00 | | | | 0.00 | | | | 0.00 | | | | 8.94 | | | | 83.50 | |
| 2017 | | | 1.00 | | | | 0.84 | | | | 0.00 | | | | 0.00 | | | | 8.70 | | | | 0.00 | | | | 0.00 | | | | 0.00 | | | | 5.49 | | | | 87.09 | |
| 2018 | | | 1.00 | | | | 0.70 | | | | 0.00 | | | | 0.00 | | | | 8.70 | | | | 0.00 | | | | 0.00 | | | | 0.00 | | | | 3.16 | | | | 88.97 | |
| 2019 | | | 1.00 | | | | 0.60 | | | | 0.00 | | | | 0.00 | | | | 8.70 | | | | 0.00 | | | | 0.00 | | | | 0.00 | | | | 1.47 | | | | 89.77 | |
| 2020 | | | 1.00 | | | | 0.48 | | | | 0.00 | | | | 0.00 | | | | 7.87 | | | | 0.00 | | | | 0.00 | | | | 0.00 | | | | 0.23 | | | | 89.88 | |
| | | | | | | | | | | | | | | | | | | | | | | | | | | | | | | | | | | | | | | | | |
| | | | | | | | | | | | | | | | | | | | | | | | | | | | | | | | | | | | | | | | | |
| | | | | | | | | | | | | | | | | | | | | | | | | | | | | | | | | | | | | | | | | |
| | | | | | | | | | | | | | | | | | | | | | | | | | | | | | | | | | | | | | | | | |
| Rem. | | | | | | | 0.00 | | | | 0.00 | | | | 0.00 | | | | 0.00 | | | | 0.00 | | | | 0.00 | | | | 0.00 | | | | 0.00 | | | | 0.00 | |
| Total | | | | | | | 10.31 | | | | 0.00 | | | | 0.00 | | | | 68.77 | | | | 0.00 | | | | 0.00 | | | | 0.00 | | | | 104.33 | | | | 89.88 | |
| | | | Gross | | | | Gross | | | | Net | | | | Net | | | | Oil | | | | Gas | | | | Oil | | | | Gas | | | | Misc. | |
| Year | | | Oil | | | | Gas | | | | Oil | | | | Gas | | | | Price | | | | Price | | | | Revenue | | | | Revenue | | | | Revenue | |
| | | | (Mbbl) | | | | (MMcf) | | | | (Mbbl) | | | | (MMcf) | | | | ($/bbl) | | | | ($/Mcf) | | | | (M$) | | | | (M$) | | | | (M$) | |
| 2013 | | | 1.55 | | | | 242.37 | | | | 0.03 | | | | 4.20 | | | | 105.30 | | | | 3.42 | | | | 2.88 | | | | 14.35 | | | | 0.00 | |
| 2014 | | | 0.76 | | | | 140.76 | | | | 0.01 | | | | 2.44 | | | | 105.30 | | | | 3.42 | | | | 1.41 | | | | 8.33 | | | | 0.00 | |
| 2015 | | | 0.45 | | | | 91.98 | | | | 0.01 | | | | 1.59 | | | | 105.30 | | | | 3.42 | | | | 0.84 | | | | 5.45 | | | | 0.00 | |
| 2016 | | | 0.30 | | | | 64.96 | | | | 0.01 | | | | 1.13 | | | | 105.30 | | | | 3.42 | | | | 0.56 | | | | 3.85 | | | | 0.00 | |
| 2017 | | | 0.21 | | | | 48.09 | | | | 0.00 | | | | 0.83 | | | | 105.30 | | | | 3.42 | | | | 0.39 | | | | 2.85 | | | | 0.00 | |
| 2018 | | | 0.16 | | | | 37.13 | | | | 0.00 | | | | 0.64 | | | | 105.30 | | | | 3.42 | | | | 0.29 | | | | 2.20 | | | | 0.00 | |
| 2019 | | | 0.12 | | | | 29.53 | | | | 0.00 | | | | 0.51 | | | | 105.30 | | | | 3.42 | | | | 0.23 | | | | 1.75 | | | | 0.00 | |
| 2020 | | | 0.10 | | | | 24.11 | | | | 0.00 | | | | 0.42 | | | | 105.30 | | | | 3.42 | | | | 0.18 | | | | 1.43 | | | | 0.00 | |
| 2021 | | | 0.08 | | | | 19.95 | | | | 0.00 | | | | 0.35 | | | | 105.30 | | | | 3.42 | | | | 0.15 | | | | 1.18 | | | | 0.00 | |
| 2022 | | | 0.07 | | | | 16.83 | | | | 0.00 | | | | 0.29 | | | | 105.30 | | | | 3.42 | | | | 0.12 | | | | 1.00 | | | | 0.00 | |
| 2023 | | | 0.06 | | | | 14.39 | | | | 0.00 | | | | 0.25 | | | | 105.30 | | | | 3.42 | | | | 0.10 | | | | 0.85 | | | | 0.00 | |
| 2024 | | | 0.05 | | | | 12.47 | | | | 0.00 | | | | 0.22 | | | | 105.30 | | | | 3.42 | | | | 0.09 | | | | 0.74 | | | | 0.00 | |
| 2025 | | | 0.04 | | | | 10.86 | | | | 0.00 | | | | 0.19 | | | | 105.30 | | | | 3.42 | | | | 0.08 | | | | 0.64 | | | | 0.00 | |
| 2026 | | | 0.04 | | | | 9.56 | | | | 0.00 | | | | 0.17 | | | | 105.30 | | | | 3.42 | | | | 0.07 | | | | 0.57 | | | | 0.00 | |
| 2027 | | | 0.03 | | | | 8.49 | | | | 0.00 | | | | 0.15 | | | | 105.30 | | | | 3.42 | | | | 0.06 | | | | 0.50 | | | | 0.00 | |
| | | | | | | | | | | | | | | | | | | | | | | | | | | | | | | | | | | | | |
| | | | | | | | | | | | | | | | | | | | | | | | | | | | | | | | | | | | | |
| Rem | | | 0.11 | | | | 29.81 | | | | 0.00 | | | | 0.52 | | | | 105.30 | | | | 3.42 | | | | 0.21 | | | | 1.76 | | | | 0.00 | |
| Total | | | 4.13 | | | | 801.30 | | | | 0.07 | | | | 13.88 | | | | 105.30 | | | | 3.42 | | | | 7.66 | | | | 47.45 | | | | 0.00 | |
| Ult | | | 10.44 | | | | 1,272.09 | | | | | | | | | | | | | | | | | | | | | | | | | | | | | |
| | | | Well | | | | Net Tax | | | | Net Tax | | | | Net | | | | Net
Lease | | | | Net
Well | | | | Other | | | | Net | | | | Annual
Cash | | | | Cum Disc.
Cash | |
| Year | | | Count | | | | Production | | | | AdValorem | | | | Investment | | | | Costs | | | | Costs | | | | Costs | | | | Profits | | | | Flow | | | | Flow | |
| | | | | | | | (M$) | | | | (M$) | | | | (M$) | | | | (M$) | | | | (M$) | | | | (M$) | | | | (M$) | | | | (M$) | | | | (M$) | |
| | | | | | | | | | | | | | | | | | | | | | | | | | | | | | | | | | | | | | | | | |
| 2013 | | | 1.00 | | | | 1.49 | | | | 0.00 | | | | 0.00 | | | | 0..29 | | | | 0.00 | | | | 0.00 | | | | 0.00 | | | | 15.44 | | | | 14.81 | |
| 2014 | | | 1.00 | | | | 0.83 | | | | 0.00 | | | | 0.00 | | | | 0..29 | | | | 0.00 | | | | 0.00 | | | | 0.00 | | | | 8.62 | | | | 22.31 | |
| 2015 | | | 1.00 | | | | 0.53 | | | | 0.00 | | | | 0.00 | | | | 0..29 | | | | 0.00 | | | | 0.00 | | | | 0.00 | | | | 5.46 | | | | 26.63 | |
| 2016 | | | 1.00 | | | | 0.37 | | | | 0.00 | | | | 0.00 | | | | 0..29 | | | | 0.00 | | | | 0.00 | | | | 0.00 | | | | 3.74 | | | | 29.31 | |
| 2017 | | | 1.00 | | | | 0.27 | | | | 0.00 | | | | 0.00 | | | | 0..29 | | | | 0.00 | | | | 0.00 | | | | 0.00 | | | | 2.67 | | | | 31.06 | |
| 2018 | | | 1.00 | | | | 0.21 | | | | 0.00 | | | | 0.00 | | | | 0..29 | | | | 0.00 | | | | 0.00 | | | | 0.00 | | | | 1.99 | | | | 32.24 | |
| 2019 | | | 1.00 | | | | 0.17 | | | | 0.00 | | | | 0.00 | | | | 0..29 | | | | 0.00 | | | | 0.00 | | | | 0.00 | | | | 1.52 | | | | 33.06 | |
| 2020 | | | 1.00 | | | | 0.14 | | | | 0.00 | | | | 0.00 | | | | 0..29 | | | | 0.00 | | | | 0.00 | | | | 0.00 | | | | 1.18 | | | | 33.64 | |
| 2021 | | | 1.00 | | | | 0.11 | | | | 0.00 | | | | 0.00 | | | | 0..29 | | | | 0.00 | | | | 0.00 | | | | 0.00 | | | | 0.93 | | | | 34.05 | |
| 2022 | | | 1.00 | | | | 0.09 | | | | 0.00 | | | | 0.00 | | | | 0..29 | | | | 0.00 | | | | 0.00 | | | | 0.00 | | | | 0.73 | | | | 34.34 | |
| 2023 | | | 1.00 | | | | 0.08 | | | | 0.00 | | | | 0.00 | | | | 0..29 | | | | 0.00 | | | | 0.00 | | | | 0.00 | | | | 0.58 | | | | 34.56 | |
| 2024 | | | 1.00 | | | | 0.07 | | | | 0.00 | | | | 0.00 | | | | 0..29 | | | | 0.00 | | | | 0.00 | | | | 0.00 | | | | 0.47 | | | | 34.72 | |
| 2025 | | | 1.00 | | | | 0.06 | | | | 0.00 | | | | 0.00 | | | | 0..29 | | | | 0.00 | | | | 0.00 | | | | 0.00 | | | | 0.37 | | | | 34.83 | |
| 2026 | | | 1.00 | | | | 0.05 | | | | 0.00 | | | | 0.00 | | | | 0..29 | | | | 0.00 | | | | 0.00 | | | | 0.00 | | | | 0.29 | | | | 34.91 | |
| 2027 | | | 1.00 | | | | 0.05 | | | | 0.00 | | | | 0.00 | | | | 0.29 | | | | 0.00 | | | | 0.00 | | | | 0.00 | | | | 0.22 | | | | 34.96 | |
| | | | | | | | | | | | | | | | | | | | | | | | | | | | | | | | | | | | | | | | | |
| Rem. | | | | | | | 0.16 | | | | 0.00 | | | | 0.00 | | | | 1.39 | | | | 0.00 | | | | 0.00 | | | | 0.00 | | | | 0.42 | | | | 0.09 | |
| Total | | | | | | | 4.69 | | | | 0.00 | | | | 0.00 | | | | 5.880 | | | | 0.00 | | | | 0.00 | | | | 0.00 | | | | 44.62 | | | | 35.05 | |


| Year | | Gross
Oil
(Mbbl) | | | Gross
Gas
(MMcf) | | | Net
Oil
(Mbbl) | | | Net
Gas
(MMcf) | | | Oil
Price
($/bbl) | | | Gas
Price
($/Mcf) | | | Oil
Revenue
(M$) | | | Gas
Revenue
(M$) | | | Misc.
Revenue
(M$) | |
| 2013 | | | 8.66 | | | | 280.82 | | | | 0.03 | | | | 1.05 | | | | 96.72 | | | | 4.50 | | | | 3.14 | | | | 4.74 | | | | 0.00 | |
| 2014 | | | 4.57 | | | | 147.46 | | | | 0.02 | | | | 0.55 | | | | 96.72 | | | | 4.50 | | | | 1.66 | | | | 2.49 | | | | 0.00 | |
| 2015 | | | 2.98 | | | | 90.87 | | | | 0.01 | | | | 0.34 | | | | 96.72 | | | | 4.50 | | | | 1.08 | | | | 1.53 | | | | 0.00 | |
| 2016 | | | 2.17 | | | | 61.75 | | | | 0.01 | | | | 0.23 | | | | 96.72 | | | | 4.50 | | | | 0.79 | | | | 1.04 | | | | 0.00 | |
| 2017 | | | 1.67 | | | | 44.49 | | | | 0.01 | | | | 0.17 | | | | 96.72 | | | | 4.50 | | | | 0.61 | | | | 0.75 | | | | 0.00 | |
| 2018 | | | 1.35 | | | | 33.66 | | | | 0.01 | | | | 0.13 | | | | 96.72 | | | | 4.50 | | | | 0.49 | | | | 0.57 | | | | 0.00 | |
| 2019 | | | 1.12 | | | | 26.35 | | | | 0.00 | | | | 0.10 | | | | 96.72 | | | | 4.50 | | | | 0.41 | | | | 0.44 | | | | 0.00 | |
| 2020 | | | 0.95 | | | | 21.24 | | | | 0.00 | | | | 0.08 | | | | 96.72 | | | | 4.50 | | | | 0.35 | | | | 0.36 | | | | 0.00 | |
| 2021 | | | 0.82 | | | | 17.40 | | | | 0.00 | | | | 0.07 | | | | 96.72 | | | | 4.50 | | | | 0.30 | | | | 0.29 | | | | 0.00 | |
| 2022 | | | 0.72 | | | | 14.55 | | | | 0.00 | | | | 0.05 | | | | 96.72 | | | | 4.50 | | | | 0.26 | | | | 0.25 | | | | 0.00 | |
| 2023 | | | 0.64 | | | | 12.35 | | | | 0.00 | | | | 0.05 | | | | 96.72 | | | | 4.50 | | | | 0.23 | | | | 0.21 | | | | 0.00 | |
| 2024 | | | 0.58 | | | | 10.64 | | | | 0.00 | | | | 0.04 | | | | 96.72 | | | | 4.50 | | | | 0.21 | | | | 0.18 | | | | 0.00 | |
| 2025 | | | 0.52 | | | | 9.22 | | | | 0.00 | | | | 0.03 | | | | 96.72 | | | | 4.50 | | | | 0.19 | | | | 0.16 | | | | 0.00 | |
| 2026 | | | 0.24 | | | | 4.14 | | | | 0.00 | | | | 0.02 | | | | 96.72 | | | | 4.50 | | | | 0.09 | | | | 0.07 | | | | 0.00 | |
| Rem | | | 0.00 | | | | 0.00 | | | | 0.00 | | | | 0.00 | | | | 0.00 | | | | 0.00 | | | | 0.00 | | | | 0.00 | | | | 0.00 | |
| Total | | | 26.99 | | | | 774.94 | | | | 0.10 | | | | 2.91 | | | | 96.72 | | | | 4.50 | | | | 9.80 | | | | 13.08 | | | | 0.00 | |
| Ult | | | 48.86 | | | | 1,315.48 | | | | | | | | | | | | | | | | | | | | | | | | | | | | | |
| | | | Well | | | | Net Tax | | | | Net Tax | | | | Net | | | | Net
Lease | | | | Net
Well | | | | Other | | | | Net | | | | Annual
Cash | | | | Cum Disc.
Cash | |
| Year | | | Count | | | | Production | | | | AdValorem | | | | Investment | | | | Costs | | | | Costs | | | | Costs | | | | Profits | | | | Flow | | | | Flow | |
| | | | | | | | (M$) | | | | (M$) | | | | (M$) | | | | (M$) | | | | (M$) | | | | (M$) | | | | (M$) | | | | (M$) | | | | (M$) | |
| | | | | | | | | | | | | | | | | | | | | | | | | | | | | | | | | | | | | | | | | |
| 2013 | | | 1.00 | | | | 0.48 | | | | 0.00 | | | | 0.00 | | | | 0.30 | | | | 0.00 | | | | 0.00 | | | | 0.00 | | | | 7.11 | | | | 6.82 | |
| 2014 | | | 1.00 | | | | 0.25 | | | | 0.00 | | | | 0.00 | | | | 0.30 | | | | 0.00 | | | | 0.00 | | | | 0.00 | | | | 3.60 | | | | 9.95 | |
| 2015 | | | 1.00 | | | | 0.16 | | | | 0.00 | | | | 0.00 | | | | 0.30 | | | | 0.00 | | | | 0.00 | | | | 0.00 | | | | 2.16 | | | | 11.66 | |
| 2016 | | | 1.00 | | | | 0.11 | | | | 0.00 | | | | 0.00 | | | | 0.30 | | | | 0.00 | | | | 0.00 | | | | 0.00 | | | | 1.42 | | | | 12.68 | |
| 2017 | | | 1.00 | | | | 0.08 | | | | 0.00 | | | | 0.00 | | | | 0.30 | | | | 0.00 | | | | 0.00 | | | | 0.00 | | | | 0.98 | | | | 13.32 | |
| 2018 | | | 1.00 | | | | 0.06 | | | | 0.00 | | | | 0.00 | | | | 0.30 | | | | 0.00 | | | | 0.00 | | | | 0.00 | | | | 0.69 | | | | 13.73 | |
| 2019 | | | 1.00 | | | | 0.05 | | | | 0.00 | | | | 0.00 | | | | 0.30 | | | | 0.00 | | | | 0.00 | | | | 0.00 | | | | 0.50 | | | | 14.00 | |
| 2020 | | | 1.00 | | | | 0.04 | | | | 0.00 | | | | 0.00 | | | | 0.30 | | | | 0.00 | | | | 0.00 | | | | 0.00 | | | | 0.36 | | | | 14.18 | |
| 2021 | | | 1.00 | | | | 0.03 | | | | 0.00 | | | | 0.00 | | | | 0.30 | | | | 0.00 | | | | 0.00 | | | | 0.00 | | | | 0.26 | | | | 14.30 | |
| 2022 | | | 1.00 | | | | 0.03 | | | | 0.00 | | | | 0.00 | | | | 0.30 | | | | 0.00 | | | | 0.00 | | | | 0.00 | | | | 0.18 | | | | 14.37 | |
| 2023 | | | 1.00 | | | | 0.03 | | | | 0.00 | | | | 0.00 | | | | 0.30 | | | | 0.00 | | | | 0.00 | | | | 0.00 | | | | 0.12 | | | | 14.41 | |
| 2024 | | | 1.00 | | | | 0.02 | | | | 0.00 | | | | 0.00 | | | | 0.30 | | | | 0.00 | | | | 0.00 | | | | 0.00 | | | | 0.07 | | | | 14.43 | |
| 2025 | | | 1.00 | | | | 0.02 | | | | 0.00 | | | | 0.00 | | | | 0.30 | | | | 0.00 | | | | 0.00 | | | | 0.00 | | | | 0.02 | | | | 14.44 | |
| 2026 | | | 1.00 | | | | 0.01 | | | | 0.00 | | | | 0.00 | | | | 0.15 | | | | 0.00 | | | | 0.00 | | | | 0.00 | | | | 0.00 | | | | 14.44 | |
| | | | | | | | | | | | | | | | | | | | | | | | | | | | | | | | | | | | | | | | | |
| | | | | | | | | | | | | | | | | | | | | | | | | | | | | | | | | | | | | | | | | |
| Rem. | | | | | | | 0.00 | | | | 0.00 | | | | 0.00 | | | | 0.00 | | | | 0.00 | | | | 0.00 | | | | 0.00 | | | | 0.00 | | | | 0.00 | |
| Total | | | | | | | 1.37 | | | | 0.00 | | | | 0.00 | | | | 4.05 | | | | 0.00 | | | | 0.00 | | | | 0.00 | | | | 17.46 | | | | 14.44 | |


| Year | | Gross
Oil
(Mbbl) | | | Gross
Gas
(MMcf) | | | Net
Oil
(Mbbl) | | | Net
Gas
(MMcf) | | | Oil
Price
($/bbl) | | | Gas
Price
($/Mcf) | | | Oil
Revenue
(M$) | | | Gas
Revenue
(M$) | | | Misc.
Revenue
(M$) | |
| 2013 | | | 0.47 | | | | 40.89 | | | | 0.01 | | | | 0.76 | | | | 98.98 | | | | 3.31 | | | | 0.88 | | | | 2.53 | | | | 0.00 | |
| 2014 | | | 0.21 | | | | 18.29 | | | | 0.00 | | | | 0.34 | | | | 98.98 | | | | 3.31 | | | | 0.40 | | | | 1.13 | | | | 0.00 | |
| 2015 | | | 0.12 | | | | 10.55 | | | | 0.00 | | | | 0.20 | | | | 98.98 | | | | 3.31 | | | | 0.23 | | | | 0.65 | | | | 0.00 | |
| 2016 | | | 0.00 | | | | 0.11 | | | | 0.00 | | | | 0.00 | | | | 98.98 | | | | 3.31 | | | | 0.00 | | | | 0.01 | | | | 0.00 | |
| Rem | | | 0.00 | | | | 0.00 | | | | 0.00 | | | | 0.00 | | | | 0.00 | | | | 0.00 | | | | 0.00 | | | | 0.00 | | | | 0.00 | |
| Total | | | 0.81 | | | | 69.85 | | | | 0.02 | | | | 1.31 | | | | 98.98 | | | | 3.31 | | | | 1.51 | | | | 4.32 | | | | 0.00 | |
| Ult | | | 1.40 | | | | 111.96 | | | | | | | | | | | | | | | | | | | | | | | | | | | | | |
| | | | Well | | | | Net Tax | | | | Net Tax | | | | Net | | | | Net
Lease | | | | Net
Well | | | | Other | | | | Net | | | | Annual
Cash | | | | Cum Disc.
Cash | |
| Year | | | Count | | | | Production | | | | AdValorem | | | | Investment | | | | Costs | | | | Costs | | | | Costs | | | | Profits | | | | Flow | | | | Flow | |
| | | | | | | | (M$) | | | | (M$) | | | | (M$) | | | | (M$) | | | | (M$) | | | | (M$) | | | | (M$) | | | | (M$) | | | | (M$) | |
| | | | | | | | | | | | | | | | | | | | | | | | | | | | | | | | | | | | | | | | | |
| 2013 | | | 1.00 | | | | 0.22 | | | | 0.00 | | | | 0.00 | | | | 0.69 | | | | 0.00 | | | | 0.00 | | | | 0.00 | | | | 2.50 | | | | 2.41 | |
| 2014 | | | 1.00 | | | | 0.10 | | | | 0.00 | | | | 0.00 | | | | 0.69 | | | | 0.00 | | | | 0.00 | | | | 0.00 | | | | 0.74 | | | | 3.06 | |
| 2015 | | | 1.00 | | | | 0.06 | | | | 0.00 | | | | 0.00 | | | | 0.69 | | | | 0.00 | | | | 0.00 | | | | 0.00 | | | | 0.14 | | | | 3.17 | |
| 2016 | | | 1.00 | | | | 0.00 | | | | 0.00 | | | | 0.00 | | | | 0.01 | | | | 0.00 | | | | 0.00 | | | | 0.00 | | | | 0.00 | | | | 3.17 | |
| | | | | | | | | | | | | | | | | | | | | | | | | | | | | | | | | | | | | | | | | |
| | | | | | | | | | | | | | | | | | | | | | | | | | | | | | | | | | | | | | | | | |
| | | | | | | | | | | | | | | | | | | | | | | | | | | | | | | | | | | | | | | | | |
| Rem. | | | | | | | 0.00 | | | | 0.00 | | | | 0.00 | | | | 0.00 | | | | 0.00 | | | | 0.00 | | | | 0.00 | | | | 0.00 | | | | 0.00 | |
| Total | | | | | | | 0.37 | | | | 0.00 | | | | 0.00 | | | | 2.07 | | | | 0.00 | | | | 0.00 | | | | 0.00 | | | | 3.38 | | | | 3.17 | |

| Year | | Gross
Oil
(Mbbl) | | | Gross
Gas
(MMcf) | | | Net
Oil
(Mbbl) | | | Net
Gas
(MMcf) | | | Oil
Price
($/bbl) | | | Gas
Price
($/Mcf) | | | Oil
Revenue
(M$) | | | Gas
Revenue
(M$) | | | Misc.
Revenue
(M$) | |
| 2013 | | | 1.93 | | | | 0.00 | | | | 0.13 | | | | 0.00 | | | | 95.72 | | | | 0.00 | | | | 12.83 | | | | 0.00 | | | | 0.00 | |
| 2014 | | | 0.54 | | | | 0.00 | | | | 0.04 | | | | 0.00 | | | | 95.72 | | | | 0.00 | | | | 3.60 | | | | 0.00 | | | | 0.00 | |
| Rem | | | 0.00 | | | | 0.00 | | | | 0.00 | | | | 0.00 | | | | 0.00 | | | | 0.00 | | | | 0.00 | | | | 0.00 | | | | 0.00 | |
| Total | | | 2.48 | | | | 0.00 | | | | 0.17 | | | | 0.00 | | | | 95.72 | | | | 0.00 | | | | 16.43 | | | | 0.00 | | | | 0.00 | |
| Ult | | | 15.96 | | | | 65.65 | | | | | | | | | | | | | | | | | | | | | | | | | | | | | |
| | | | Well | | | | Net Tax | | | | Net Tax | | | | Net | | | | Net
Lease | | | | Net
Well | | | | Other | | | | Net | | | | Annual
Cash | | | | Cum Disc.
Cash | |
| Year | | | Count | | | | Production | | | | AdValorem | | | | Investment | | | | Costs | | | | Costs | | | | Costs | | | | Profits | | | | Flow | | | | Flow | |
| | | | | | | | (M$) | | | | (M$) | | | | (M$) | | | | (M$) | | | | (M$) | | | | (M$) | | | | (M$) | | | | (M$) | | | | (M$) | |
| | | | | | | | | | | | | | | | | | | | | | | | | | | | | | | | | | | | | | | | | |
| 2013 | | | 1.00 | | | | 0.59 | | | | 0.00 | | | | 0.00 | | | | 9.41 | | | | 0.00 | | | | 0.00 | | | | 0.00 | | | | 2.84 | | | | 2.73 | |
| 2014 | | | 1.00 | | | | 0.17 | | | | 0.00 | | | | 0.00 | | | | 3.24 | | | | 0.00 | | | | 0.00 | | | | 0.00 | | | | 0.20 | | | | 2.91 | |
| | | | | | | | | | | | | | | | | | | | | | | | | | | | | | | | | | | | | | | | | |
| | | | | | | | | | | | | | | | | | | | | | | | | | | | | | | | | | | | | | | | | |
| | | | | | | | | | | | | | | | | | | | | | | | | | | | | | | | | | | | | | | | | |
| Rem. | | | | | | | 0.00 | | | | 0.00 | | | | 0.00 | | | | 0.00 | | | | 0.00 | | | | 0.00 | | | | 0.00 | | | | 0.00 | | | | 0.00 | |
| Total | | | | | | | 0.76 | | | | 0.00 | | | | 0.00 | | | | 12.64 | | | | 0.00 | | | | 0.00 | | | | 0.00 | | | | 3.03 | | | | 2.91 | |
