UNITED STATES
SECURITIES AND EXCHANGE COMMISSION
Washington, D.C. 20549
FORM 10-K
(Mark One)
| x | ANNUAL REPORT PURSUANT TO SECTION 13 OR 15(d) OF THE SECURITIES EXCHANGE ACT OF 1934 |
For the year ended December 31, 2005
OR
| ¨ | TRANSITION REPORT PURSUANT TO SECTION 13 OR 15(d) OF THE SECURITIES EXCHANGE ACT OF 1934 |
For the transition period from to
Commission file number 000-25661
TenFold Corporation
(Exact name of registrant as specified in its charter)
| | |
| Delaware | | 83-0302610 |
(State or other jurisdiction of incorporation or organization) | | (I.R.S. Employer Identification No.) |
698 West 10000 South
South Jordan, Utah 84095
(Address of principal executive offices, including zip code)
(801) 495-1010
(Registrant’s telephone number, including area code)
Securities registered pursuant to Section 12(g) of the Act:
Common Stock, par value $0.001 per share
Indicate by check mark if the registrant is a well-known seasoned issuer, as defined in Rule 405 of the Securities Act. Yes ¨ No x
Indicate by check mark if the registrant is not required to file reports pursuant to Section 13 or 15(d) of the Act. Yes ¨ No x
Indicate by check mark whether the registrant (1) has filed all reports required to be filed by Section 13 or 15(d) of the Securities Exchange Act of 1934 during the preceding 12 months (or for such shorter period that the registrant was required to file such reports), and (2) has been subject to such filing requirements for the past 90 days. Yes x No ¨
Indicate by check mark if disclosure of delinquent filers pursuant to Item 405 of Regulation S-K is not contained herein, and will not be contained, to the best of registrant’s knowledge, in definitive proxy or information statements incorporated by reference in Part III of this Form 10-K or any amendment to this Form 10-K. x
Indicate by check mark whether the registrant is a large accelerated filer, an accelerated filer, or a non-accelerated filer. (Check one):
| | | | |
| Large Accelerated Filer ¨ | | Accelerated Filer ¨ | | Non-Accelerated Filer x |
Indicate by check mark whether the registrant is an accelerated filer (as defined in Rule 12b-2 of the Exchange Act). Yes ¨ No x
Indicate by check mark whether the registrant is a shell company (as defined in Rule 12b-2 of the Exchange Act). Yes ¨ No x
Market value of shares of Common Stock held by non-affiliates of the registrant, based on the closing price of the Common Stock on June 30, 2005 was approximately $8,002,000. Shares of Common Stock held by each current executive officer and director, and by each person who is known by the registrant to own 10 percent or more of the outstanding Common Stock, have been excluded from this computation in that such persons may be deemed to be affiliates of the Company. Share ownership information of certain persons known by the Company to own greater than 10 percent of the outstanding common stock for purposes of the preceding calculation is based solely on information known by the Company and is as of June 30, 2005. This determination of affiliate status is not a conclusive determination for other purposes.
As of February 28, 2006, there were 46,502,013 shares of the registrant’s Common Stock outstanding.
DOCUMENTS INCORPORATED BY REFERENCE
Portions of the Proxy Statement for the Registrant’s 2006 Annual Meeting of Stockholders are incorporated by reference into Part III of this Form 10-K.
TENFOLD CORPORATION
2005 FORM 10-K AND ANNUAL REPORT
TABLE OF CONTENTS
2
FORWARD-LOOKING STATEMENTS
In addition to historical information, this Annual Report on Form 10-K contains forward-looking statements that involve risks and uncertainties that could cause our actual results to differ materially from those contained in the forward-looking statements. Factors that might cause or contribute to such differences include, but are not limited to, those discussed in the section entitled “Management’s Discussion and Analysis of Financial Condition and Results of Operations—Factors That May Affect Future Results and the Market Price of Stock.” When used in this report, the words “expects,” “intends,” “anticipates,” “should,” “believes,” “will,” “plans,” “estimates,” “may,” “seeks,” “estimates” and similar expressions are generally intended to identify forward-looking statements. You should not place undue reliance on these forward-looking statements, which reflect our opinions only as of the date of this Annual Report. We undertake no obligation to publicly release any revisions to the forward-looking statements after the date of this document. You should carefully review the risk factors described in this Annual Report and in other documents we file from time to time with the Securities and Exchange Commission, including our Quarterly Reports on Form 10-Q.
3
PART I
Item 1. Business
Business Overview
TenFold provides services and technology for building complex, Service Oriented Architecture (“SOA”)-compliant, mission-critical applications in significantly less time and cost than it would otherwise take using traditional development technologies. We believe that with TenFold’s technology, EnterpriseTenFold™ (formerly “Universal Application”), customers will also experience significantly reduced ongoing applications maintenance and enhancement costs compared to what they generally experience with legacy applications.
At the end of 2005, we replaced our former Chief Executive Officer, with long-time TenFold director and shareholder, Robert W. Felton. Under his leadership, we have recently changed our business model to focus on selling larger consulting projects, instead of the smaller prototype application projects that we primarily sold in 2005. We believe that providing larger consulting projects (that include the full breadth of applications consulting from applications design through production implementation) will be a more successful model for both us and our customers. We believe that some of our customers would have been more successful with their projects with more consulting assistance than they chose to purchase under our prior business model. Although we hope to be more successful with this new business model, we have limited experience with it as we have introduced it only recently, and have not yet closed any sales under this model. As a result, it is unclear if or when we can expect to close significant sales to new or existing customers, and until we do so we are likely to continue to experience declining revenues and increasing losses.
EnterpriseTenFold automates most of what applications programmers typically do, and empowers small teams of business people and information technology (“IT”) professionals to design, build, test, deploy, and maintain complex, transaction and database-intensive applications, with significantly reduced demand on scarce IT resources as compared to other applications development approaches and technologies. Using a small team of business people supplemented with IT professionals for rapid applications development is a significant change from the industry-standard approach that relies on large teams of IT professionals who expend significant numbers of person years of effort to design, program, test, change, and deploy enterprise applications. We believe that with EnterpriseTenFold, customers get high-quality, complex enterprise applications into production faster and at significantly lower cost than with other applications development technologies.
We believe that in EnterpriseTenFold, TenFold has developed the first, complete service oriented technology. TenFold provides an applications development environment that enables corporations to custom-build and maintain complex, database, transactional, enterprise applications rapidly with high quality and functional richness.
We believe EnterpriseTenFold has two unique attributes that make building complex, database-intensive and transaction-intensive applications substantially cheaper, easier, and faster than traditional applications development methodologies and tools. First, EnterpriseTenFold is a model-driven architecture that renders modeled applications, which means that EnterpriseTenFold already includes most of what applications programmers typically do and automatically provides advanced applications functionality. Because of its model-driven architecture, we believe customers get more powerful, higher quality applications faster and at a fraction of the cost of traditional programming approaches. Second, since TenFold-powered applications development provides a tool and methodology that business people can effectively use, we believe it enables organizations to directly leverage their business experience and insight, and to adapt applications easily to meet changing business requirements. Thus we believe TenFold’s model-driven architecture lets a TenFold-trained team do Extremely Rapid Applications Development. As a result, a TenFold-trained team can build applications so quickly that customers experience both trying the application and improving the application in very short turnaround cycles to help ensure what is built is what the business really needs.
4
We believe EnterpriseTenFold offers three unique benefits:
| | 1. | Speed. EnterpriseTenFold lets a small, trained team of business people and IT professionals build and enhance high-quality, high-performance, powerful applications much faster than other technology because building or enhancing a TenFold-powered application using EnterpriseTenFold requires only describing applications features and functionality. Other applications development technologies also let you build and enhance applications, but most require large teams of programmers, take longer, and are risky for complex applications because those other technologies require detailed, complex, logic programming. The high failure rate of complex applications development projects suggests that other applications development technologies often lead to project cost and schedule overruns, applications quality problems, and sometimes project cancellations. |
| | 2. | Quality. EnterpriseTenFold includes the TenFold RenderingEngine, which renders an application from its description (or model). With EnterpriseTenFold, there is no need to write or test newly-written code in the building of an application. Thus, it is less likely for the application to have defects or quality problems. We believe that a TenFold-powered application works just as you describe it to work; it may not do what you want, but it does do what your description says for it to do. Because the code that every TenFold-powered application executes is the same well-tested code that TenFold provides before a project begins, we believe TenFold-powered applications are much higher quality than most other applications. |
| | 3. | Power. The TenFold RenderingEngine contains thousands of features that make any TenFold-powered application more functionally-rich than the same application that a programmer-staffed applications development team could pragmatically afford to program. TenFold-powered applications have clever, powerful features unavailable in most other applications. |
Our business model focuses on providing applications development services and our EnterpriseTenFold technology, support, and training, to customers who can use a TenFold team or their own business teams to build and maintain applications.
Business History
We founded TenFold in 1993. We spent the first several years primarily developing our patented EnterpriseTenFold technology. In 1996, we began using EnterpriseTenFold to build applications for customers.
In 1999, we completed our initial public offering. In 1999 and early 2000, we tested a new business model that caused us to face significant financial, legal, and operational issues. Starting in late 2000 we took steps to resolve the financial and legal liabilities that arose as a result of the interim business model and to restore the company to sound business health.
We raised capital twice during 2003. In February 2003, Robert W. Felton, a long-time TenFold director (who also recently became our Chairman, President, and Chief Executive Officer), made an investment of $700,000 in TenFold, by acquiring restricted TenFold common stock. In December 2003, we closed a $10 million private placement of restricted TenFold common stock.
During 2003 and 2004, we continued sales and marketing related initiatives including establishing alliance relationships with distributors such as VARs; prototyped a new sales model focusing on selling small, paid proof-of-concept projects; initiated internet access to TenFold technology; introduced TenFold Support SpeedPro, making expert consultants available for short-duration projects; and increased marketing and public relations efforts to broaden awareness of and interest in TenFold technology.
5
During 2004 and 2005, we enhanced EnterpriseTenFold adding substantial new functionality and features:
| | • | | SOA-compliance, including expanded web services standards support, authentication, single-sign-on and security integration, and enhanced integration tools |
| | • | | A new-generation browser user interface based on the XML and Ajax technologies |
| | • | | Multi-language support that includes Japanese and other multi-byte languages, and an auto-translation feature |
| | • | | The new generation of applications development environment – TenFoldTools – that we believe greatly improves developers’ productivity |
| | • | | User interface enhancements that allow developers to add graphical and web content to applications, and that we believe make our user interface more intuitive for untrained end-users |
| | • | | Support for new applications platforms including various types of the open-source Linux operating system, open-source databases MySQL and EnterpriseDB, and support for recent versions of Oracle and other platforms |
| | • | | Improvements in applications server stability, performance, and scalability |
During 2005, we continued to focus substantial effort on our marketing and public relations efforts to increase awareness of TenFold, TenFold technology, and to generate leads. We used a multi-faceted, integrated approach to marketing that included e-mail, direct mail, and telemarketing to support our TenFold Seminars as our principal approach to introducing people to TenFold and TenFold technology. We conducted numerous TenFold Seminars in various major metropolitan areas during 2005. Our lead generation increased substantially.
During 2005, we earned revenues from 45 customers. We continued to focus new-customer sales on selling small, proof-of-concept projects as part of our penetrate and radiate sales program. Once we completed an initial project, we attempted to radiate into the account by selling additional services and licenses. The financial impact of the new-account, or “penetrate”, transactions was immaterial to our overall financial performance. Some of these accounts radiated from proof-of-concept projects to purchase larger production licenses and additional services. However, they were not sufficiently large for us to achieve profitability or positive cash flow.
Some of our customers accounted for more than 10 percent of our annual revenues in 2005. XanGo accounted for 20 percent, JPMorgan Chase accounted for 18 percent, and DevonWay (a related party,see Management’s Discussion and Analysis of Financial Condition and Results of Operations – Related Party Transactions for more information) accounted for 11 percent of our revenues for the year ended December 31, 2005. XanGo completed its use of our consulting services for its application development project during the quarter ended December 31, 2005. XanGo has currently decided not to implement its TenFold-powered application into production. JPMorgan Chase substantially completed its application development project during the quarter ended March 31, 2005, and has its TenFold-powered application in production use. It continues to purchase support from us, and other services from time to time. DevonWay completed its application development project with us during the quarter ended December 31, 2005, is in the process of further enhancing and preparing its TenFold-powered application for production use, and continues to purchase support from us, and other services from time to time. In future periods, however, we do not expect the amount of revenue from these customers to be significant as they have completed their current projects with us. We have not sold new projects to replace these projects, and are not currently working on any significant consulting projects. SeeManagement’s Discussion and Analysis of Financial Condition and Results of Operations – 2005 as Compared to 2004 - Revenues for more information.
Cedars-Sinai Medical Center accounted for 50 percent, JPMorgan Chase accounted for 22 percent, and Sapient accounted for 15 percent of our revenues for the year ended December 31, 2004. Allstate accounted for 41 percent, JPMorgan Chase accounted for 25 percent, and Sapient accounted for 23 percent of our revenues for the year ended December 31, 2003.
6
Revenues from customers outside of North America were approximately 11 percent of total revenues for 2005, 20 percent of total revenues for 2004, and 29 percent of total revenues for 2003. Revenues from customers in the United Kingdom were 9 percent of total revenues for 2005, 19 percent of total revenues for 2004, and 29 percent of total revenues for 2003. Revenues from operations in Argentina were 2 percent of total revenues for 2005, 0.9 percent of total revenues for 2004, and 0.5 percent of total revenues for 2003. Our long-lived assets are deployed in the United States.
Customers with TenFold-powered applications in production today include, among others, Abbey National Bank, Allstate Insurance, Barclays Global Investors, Cedars-Sinai Medical Center, Deutsche Bank, Franklin Templeton, Guidant, Ingenix (a subsidiary of UnitedHealth Group), iplan networks, JPMorgan Chase, MedCath, Rand Technology, RCM Capital Management LLC, Trinity Health, and Vertex (a subsidiary of United Utilities).
Industry Challenge
Organizations worldwide face increasing pressure to replace their legacy enterprise applications and introduce new applications as they seek to increase productivity, cut costs, introduce new products and services, address changing regulatory and competitive demands, and access new technology. But, organizations face daunting odds of failure because traditional processes for building, integrating, and deploying complex applications are costly and risky. Consequently, many organizations continue to make substantial investments to maintain legacy applications that inadequately meet current needs and do not address new business requirements. To obtain new or replacement applications, companies choose between buying a packaged software application or building a custom software application.
Organizations generally turn to independent software vendors, such as Enterprise Resource Planning (“ERP”) vendors or vertical software vendors, when seeking packaged applications. In general, packaged applications promise predictable quality and relatively quick implementation. However, packaged applications frequently require that an organization adapt its business practices to the software. ERP systems generally fail to address specific industry problems, such as patient management or securities lending; often cost considerably more than planned to implement; and, once installed, are difficult to modify to adapt to changing business needs. In addition, when an organization chooses the costly and time-consuming path of customizing a packaged application, cost and risk rise rapidly and the organization is generally inhibited from future opportunities to upgrade the packaged application when subsequent new releases are available.
Alternatively, organizations can build custom applications, either internally or with third parties. This approach promises organizations the functionality, flexibility, and fit they seek, but custom applications development carries a high risk of failure, with projects often exceeding budgets and schedules, and with many projects being cancelled prior to implementation due to time delays, budget overruns, and functional or technical deficiencies. Companies often hire software integration or services firms to build and implement mission-critical applications. These firms generally engage a large number of consultants who may remain on the project for years, and may exceed budgets and schedules without producing significantly better results than internal development organizations. In addition, these firms typically do not offer ongoing product enhancements because they build custom solutions for a single customer.
Applications development projects fail because the process of designing, programming, and testing complex applications with conventional tools and approaches is very complex and labor intensive. Designing, programming, testing, integrating, and deploying complex applications can be difficult, take a long time, be expensive, and tie up scarce IT resources. This high cost and high risk is in stark contrast to the business need for new applications that address current business practices and can be adapted quickly and easily to meet the evolving business requirements of a dynamic, highly competitive business environment.
7
TenFold Technology and Products
We believe TenFold’s patented EnterpriseTenFold presents a significantly new approach to applications development. We believe that this approach reduces applications development and maintenance cost and time in two ways: first, by automating tedious, time-consuming, error-prone tasks that programmers would generally do; and, second, by providing an applications development tool and methodology that lets business people actively participate in applications development. We believe that EnterpriseTenFold enables organizations to directly leverage their business experience and insight and to adapt applications easily to meet changing business requirements.
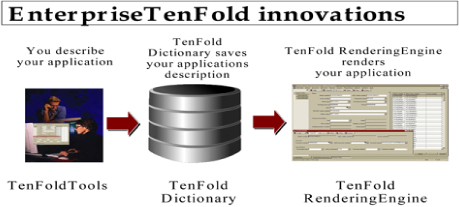
EnterpriseTenFold has three key innovations that make designing, building, testing, deploying, and maintaining an application completely different from traditional programming-oriented technologies:
| | |
Innovation | | Description |
| TenFold Tools | | • Can be used by non-technical business people with relatively little training and some help from an experienced TenFoldTools consultant. • Provides a sophisticated applications developer environment that is convenient for describing applications requirements. • Is itself a set of easy-to-use applications with security, concurrency control, audit trails, et cetera. • Is a set of TenFold-powered applications, so an applications developer has the same intuitive user interface, benefits from the same Quality and Power as other applications end-users. |
| |
TenFold Dictionary | | • Saves the applications description in an RDBMS to make changing the description easy and fast. • Secures and manages the applications description just as an RDBMS does for any applications database data such as invoices or insurance policies. |
| |
| TenFold Rendering-Engine | | • Reads the applications description and renders the application. • Supports using and changing an application as you describe it. • Scales to support tens of thousands of simultaneous end-users. |
These EnterpriseTenFold innovations work together to automate tedious, repetitive, and error-prone tasks like writing SQL, Java, C++, or VisualBasic code. We believe that automating tedious programming tasks lets applications developers focus their intellect and energy on solving the business problem instead of fighting technology problems.
8
We believe this revolutionary EnterpriseTenFold approach has important implications:
| | |
Implication | | Description |
| Requirements are easier, faster, and more rewarding | | • Accelerates the difficult, time-consuming, resource intensive, traditional first step in applications development, Requirements. • Lets applications developers describe and unambiguously record requirements with TenFoldTools. • Lets applications developers see a running application as they describe requirements. • Lets applications developers build and modify their application quickly, so they can evolve requirements in concert with developing and trying their application. |
| |
| Power features make applications functionally richer | | • Built-in TenFold RenderingEngine features make applications automatically powerful with a slick Windows user-interface, a slick browser interface that includes Ajax behavior, powerful database features like TimeRelation, AuditTrail, and more. |
| |
| The meaning and purpose of Testing changes to everyone’s benefit | | • TenFold RenderingEngine renders a working application, so testing becomes ‘an exercise to verify the business solution,’ instead of ‘figure out where it blows up and fix it.’ • With portions of the application running almost at the very start of the project, users can demonstrate it to business people and get feedback throughout the project, not just at the end when the project should be complete. • Automated regression testing tools let users capture what they want to automatically test and help them ensure that ongoing applications changes do not impact things that work as they wish. |
| |
| Change is fast, responsive, and significantly lower cost | | • Since changing an application involves only changing its description, change is much faster and less costly than alternative reprogramming strategies that are prevalent with traditional technologies and inherent in legacy systems. • Automated regression testing tools make it possible to fully test a new applications version quickly and verify that new features work and that existing features still work as before. • Built-in change management tools automate most of the work in promoting new applications versions into production. |
The EnterpriseTenFold value proposition provides three major benefits – Speed, Quality, and Power – to its customers.Speed. EnterpriseTenFold makes building complex applications faster than other technologies so projects can be finished in months, not years.Quality. EnterpriseTenFold addresses eleven key attributes of quality applications. Since TenFold RenderingEngine renders an application from its description, tedious, error-prone, programming-like tasks are avoided in building or enhancing a TenFold-powered application. Thus, we believe the quality of the application is excellent.Power. EnterpriseTenFold renders an application from its description and automatically includes considerable, rich built-in functionality in the application. Interestingly, complex feature requirements, which traditionally generate complexity and a high likelihood of project failure, add little incremental cost to TenFold applications development, just as a spreadsheet requiring more-complex formulas is not significantly more costly to build than one with only simple formulas.
EnterpriseTenFold has been in development for more than 13 years, contains more than 3.3 million lines of C and C++ code, and is covered by three issued United States patents. We believe that with EnterpriseTenFold, business people or applications developers with little or no traditional programming skills can collaborate with IT professionals to build and maintain an application by describing the application without needing to program in C, C++, Java, HTML, Structured Query Language (“SQL”) or other programming languages and without the need to do other programming-like tasks such as designing screens and writing technical designs.
9
We believe EnterpriseTenFold delivers these benefits:
| | • | | Faster development of complex applications because EnterpriseTenFold automates tasks that programmers would otherwise have to do such as coding SQL, coding logic functions, managing computer-to-computer communications, and coding user interface screens; |
| | • | | Longer-lived applications that can survive changes in underlying technologies without requiring applications rewrites, because EnterpriseTenFold insulates applications from many technical changes such as new operating system and database software releases; |
| | • | | Relatively easy development of web services as a customer can expose any part of a TenFold-powered application as an industry-standard web service; |
| | • | | Reduced maintenance costs because there is little or no code to maintain; |
| | • | | Improved quality because EnterpriseTenFold replaces individually-coded logic with already-existing, thoroughly-tested algorithms that provide both basic and sophisticated applications behavior such as security, menus, transaction behavior, and powerful windows and browser user interface features; |
| | • | | Greater consistency to look, feel and operation across the entire application, by replacing individually-built screen designs and transactions with a systematic, optimal, standard design and by eliminating the details of screen layout and repetitive transaction behavior from the application developer’s task list; |
| | • | | Demonstrated scalability as customers add simultaneous end-users and computing capacity; and |
| | • | | Typically sub-second response-time on properly configured hardware for most applications actions, because EnterpriseTenFold is carefully optimized to provide good performance. |
In addition to the above benefits, EnterpriseTenFold has many distinguishing advanced features. The following is a partial listing of these features:
| | • | | Portability across popular databases such as Oracle, DB2, SQL Server, Sybase, EnterpriseDB, and MySQL; |
| | • | | Generation of all SQL statements for accessing and updating data, each highly optimized for each relational database; |
| | • | | Automatic screen layout to ensure consistency and quality in both web and desktop environments; |
| | • | | Automatic creation of both a Windows and web browser user interface; |
| | • | | Built-in support for query and update of time-varying data such as effective-dated employee or insurance policy records; |
| | • | | Real-time, server-supplied screen refresh of detail and summary information as underlying data changes; |
| | • | | Simplified business rule definition and optimized rule execution for workflow, posting, access control, and other sophisticated rule types; |
| | • | | Formal rule abstractions for validation, propagation, population, without requiring application developers to master complex event models; |
| | • | | Shared middle-tier caching, deferred query execution, and optimistic concurrency control to minimize database server load; |
| | • | | Codeless integration with third-party applications via real-time messages, APIs, or files based on a simple interface description including support for many different messaging layers such as Tibco, TCP/IP, MQSeries, and Pipes; and |
| | • | | Application-level data synchronization between central servers and intermittently connected laptops. |
10
EnterpriseTenFold is composed of components for developing, executing, integrating, and configuring applications.
Developing an Application. TenFoldTools provides a sophisticated user interface that lets applications developers describe an application without traditional programming activities. Business people or other applications developers describe the database that the application uses and manages, transactions that business end-users use to do each end-user activity, and rules that control transaction behavior. TenFoldTools is itself a TenFold-powered application, that applications developers use to describe their application. TenFold AutoTest, a portion of TenFoldTools, uses patented techniques to simplify and automate functional and regression testing. TenFold Reporter and TenFoldAnalyzer, each a portion of TenFoldTools, let business people define their own reports and real-time data analysis. TenFoldTools store the description of their applications objects in a relational database called TenFold Dictionary.
Executing an Application. TenFold RenderingEngine is an executable program, generally deployed in various configurations on multiple client and server computers, that reads an applications description from TenFold Dictionary and runs as that application. TenFold RenderingEngine has these four major components:
| | |
Component | | Description |
TenFold Client | | The TenFoldClient part of the TenFold RenderingEngine typically runs on a client computer and interacts with you as you use a TenFold-powered application. TenFoldClient is a feature-rich, secure, portable, and graphical, transaction-execution environment that implements transaction requirements that applications developers describe in the TenFold Dictionary. TenFoldClient includes TenFold Browser UI Library, TenFold Windows UI Library, TenFold TransactionManager, TenFold FrameComposer, TenFold FrameManager, TenFold GraphicInterface Library, TenFold TransactionEngine, and TenFold GraphicInterface standard. |
| |
TenFold Server | | The TenFoldServer part of the TenFold Rendering Engine typically runs on a server computer and provides non-visible applications services. TenFoldServer provides an open-to-industry-standards messaging layer, applications server technologies, and standard business engines, and distributes data-intensive and computing-intensive processing across multiple server computers and multiple distributed databases. TenFoldServer includes TenFold Security Library, TenFold Server Manager, TenFold FastConnect, TenFold Messages Library, TenFold Scheduler, TenFold Network Library, TenFold BusinessEngines, and TenFold Messages standard. |
| |
| LogicXpress | | The LogicXpress part of the TenFold RenderingEngine includes TenFold Language for describing complex applications logic, reports, and processes, and technologies to compile, distribute, and efficiently run that logic portably across the various client and server computers on which you deploy an application. LogicXpress includes TenFold Compiler, TenFold Interpreter, TenFold MetaFile Library, TenFold Language, and TenFold MetaFile standards. |
| |
TenFold Kernel | | The TenFoldKernel part of the TenFold RenderingEngine provides rich, portable, data-related functionality and powerful, standard, basic-applications functions to other TenFold RenderingEngine components. TenFoldKernel provides a dictionary-driven, read-write set interface to supported relational databases, and provides optimal performance, guaranteed portability, low development cost, low maintenance cost, and rich functionality to both applications and EnterpriseTenFold. TenFoldKernel includes TenFold Database Library, TenFold OptionsFile Library, TenFold Validation Library, TenFold Knobs&Dials Library, TenFold Error Library, TenFold CommonRoutines Library, and TenFold OperatingSystem Library. |
11

Integrating an Application. TenFoldTools contains integration tools, called TenFoldConnect, that connect a TenFold-powered application to other applications, both within a company and at its customers and suppliers. Whether exchanging files, directly accessing another database, or using real-time messaging, applications developers codelessly describe the path that data follows to interface with typically-inflexible legacy or third party applications. Applications developers can convert and cleanse data during its passage to or from a TenFold-powered application.
Configuring an Application. EnterpriseTenFold supports leading relational databases, server operating systems, client operating systems, web servers and browsers, and communications systems. EnterpriseTenFold is highly configurable so that it can distribute components of the TenFold RenderingEngine across many computers to provide n-tier processing or run on a single computer. Configuration options let customers tune performance and scalability by configuring EnterpriseTenFold to match the underlying hardware and software environment. The EnterpriseTenFold architectural design simplifies adding support for additional technologies to respond to customer needs and emerging new technology market changes.
TenFold ComponentWare
TenFold ComponentWare is a family of pre-written applications components that easily plug into EnterpriseTenFold to extend its functionality without programming. For example, PowerBilling provides a robust suite of billing transactions, engines, and features. PowerAccounting makes it easy to include accounting-system integration to application descriptions.
TenFold Services
We offer consulting services that provide end-to-end custom applications development solutions and systems integration; basic and advanced applications development training; EnterpriseTenFold maintenance training; and customer support.
Training
TenFold University offers training so that customers can learn how to successfully build, implement, operate, maintain, and enhance their applications. Available training services include classroom instruction (with detailed courseware) offered at TenFold locations on a published schedule or at customer locations scheduled on demand, and on-site, on-the-job training working alongside TenFold expert consultants.
Consulting Services
Our consulting services offer expertise in using EnterpriseTenFold to provide end-to-end custom applications development solutions and systems integration. Our consultants help customers design, develop, test, integrate, deploy, operate and maintain their applications.
12
Implementation services include converting and cleansing legacy data, systems integration, running parallel application testing, and managing the implementation project. We use TenFold technology to leverage open standards, such as web services to build, connect, and streamline business processes.
Our consulting services provide technology transfer, which helps customer staff become self-sufficient with TenFold technology and tools.
Customer Support and SpeedPro Consulting
We provide customers who buy support services with new releases of EnterpriseTenFold as new releases become available, telephone technical support for EnterpriseTenFold, and, optionally, telephone applications support for their TenFold-powered application. We make SpeedPro consulting available to customers who maintain a support relationship with TenFold. SpeedPro offers customers a way to obtain the services of a TenFold expert at a moment’s notice for immediate help or for short projects.
Competition
The competitive landscape for new and legacy-replacement enterprise applications is split among the options available to corporations today. These options are:
| | • | | Buy a packaged application (with or without modification); and |
| | • | | Build a new application using internal IT resources or third-party consulting and software integration firms. |
Status quo
TenFold’s largest competitor is “status quo.” Corporations continually wrestle with the issue of when to take on the challenge of building strategic new applications or attempting to retire and replace “legacy” applications. In recent years, most companies chose to invest large amounts of money to maintain legacy applications rather than replace them. Remaining with the status quo results in: continuously increasing costs as maintenance on top of maintenance gets harder; acceptance of barely adequate applications; limitations on lowering costs; limitations to embracing new technologies; and, difficulty in adding products or expanding markets. Status quo postpones the inevitable replacement of the application.
Buy a Packaged Application (with or without modification)
Many corporations prefer to obtain an off-the-shelf application from ERP or vertical packaged software vendors. Corporations license software packages to limit the risks associated with new software development projects. However, packaged applications force corporations to conform their business problems to the packaged solution, often with a poor fit. Corporations can modify a packaged application to solve their business problems, but such blended solutions are expensive, slow to implement, and suffer from poor integration.
We believe buying packaged applications is not a viable solution for replacing many legacy applications for most customers in most industries, as reasonable-fit packaged applications do not exist.
Build New Applications
When companies contemplate building their own applications on their own or with help, TenFold competes primarily with suppliers of traditional programming technologies and development tools. Internal IT organizations and third party consulting firms frequently use tools from Oracle, IBM, Microsoft, BEA, Computer Associates, and others.
Programming languages such as COBOL, C, and C++ perform well and scale well, but require extraordinarily large project teams to spend multiple years to complete projects. Such projects generally run
13
over budget in time and dollars and frequently fail. Visual Basic, SmallTalk, and other personal computer technologies support rapid applications development and improved productivity for smaller projects, but do not scale to support large numbers of end-users.
Today’s typical technologies include Java, J2EE, .NET, and other component-enabling technologies intending to make Java and Java-like languages viable for complex applications. Such technologies, all of which rely on programmers, have not significantly reduced the time and cost of large applications development at this time. Using such technologies for very large, complex applications development projects is likely to result in continued high failure rates for applications build projects since longer projects and large numbers of programmers on a project increase risk of failure exponentially according to most industry pundits.
Patents, Intellectual Property Rights and Licensing
We rely primarily on a combination of patent, copyright, trade secret and trademark laws, and nondisclosure and other contractual restrictions on copying and distribution to protect our proprietary technology. We have received three separate patents in the United States. The first patent (US Patent # 6016394) relates to EnterpriseTenFold. The second (US Patent # 6016643) relates to TenFold AutoTest, our automated testing technology. The third patent (US Patent # 6301701) relates to our computer-assisted testing of software application components. We have these patents issued and pending in other countries. Our trademark portfolio contains a variety of U.S. and international trademark registrations and pending trademark applications.
In addition, as part of our confidentiality procedures, we enter into nondisclosure agreements with our employees, customers, consultants, and corporate partners, and limit access to and distribution of our software, documentation, and other proprietary information. We retain ownership of EnterpriseTenFold. Under our prior business model we generally retained ownership of the applications products that we developed for customers; however, we allowed a small number of customers to own rights to the applications we developed for them. In some cases, our contracts obligate us to pay royalties on future sales of specific applications, or prohibit us from licensing applications for specified periods of time or to specified third parties.
For information concerning risks associated with intellectual property rights, see “Management’s Discussion and Analysis of Financial Condition and Results of Operations – Factors that May Affect Future Results and Market Price of Stock.”
Research and Development
Our technology development organization consists of teams of development engineers and product managers. These teams use a “documentation-centric” development process that includes planning and documenting deliverables in advance, adhering to coding standards, and performing nightly regression tests of all technology. We continuously monitor quality, analyze the root-cause of defects, report daily and weekly status, and regularly communicate individual and team performance and adherence to schedule and functionality requirements.
Our development infrastructure and processes produce documentation, quality assurance, platform certification, release management, and delivery capabilities (in addition to design and implementation functions) for our technology and products. Developers use TenFold AutoTest – our patented integrated testing technology – to perform nightly regression tests on all products, components, and technologies under development or modification. Developers use DocuManage, our web-based documentation management and reference system, to access and maintain product documentation.
Our development organization regularly produces new versions and releases of our EnterpriseTenFold technology. Our latest major release of EnterpriseTenFold includes many new features that we believe, make building enterprise applications faster, production deployment more robust, and production management more cost-effective.
14
Research and development expenses were $3.5 million for the year ended December 31, 2005, $3.7 million for the year ended December 31, 2004, and $3.5 million in 2003. As of December 31, 2005, we had 21 staff engaged in research and development activities. We intend to continue to make investments in research and development to maintain and enhance our technology.
Employees
As of December 31, 2005, we had 47 employees, including 9 in consulting, training and support, 21 in research and development, 7 in sales and marketing, and 10 in finance, administrative, and information technology support functions. During the year ended December 31, 2005, our average headcount was 62. None of our employees is represented by a labor union or a collective bargaining agreement and all are at-will employees.
15
Executive Officers
The executive officers of TenFold are as follows:
| | | | |
Name | | Age | | Position(s) |
| Robert Felton | | 67 | | Chairman of the Board of Directors, Chief Executive Officer, and President |
| | |
| Alexei Chadovich | | 46 | | Senior Vice President, Research and Development |
| | |
| Samer Diab | | 37 | | Vice President, Customer Services |
| | |
| Robert Hughes | | 46 | | Chief Financial Officer, Chief of Staff |
| | |
| Robert Trounce | | 35 | | Vice President, Consulting |
| | |
| Jeffrey Walker | | 63 | | Executive Vice President, Chief Technology Officer |
| | |
| Sally White | | 45 | | Vice President, Business Development |
Robert Feltonjoined TenFold as an executive officer in November 2005, and has served as Chairman of the Board of Directors, Chief Executive Officer, and President since that time. Mr. Felton has also served as a member of TenFold’s Board of Directors since March 1997. Mr. Felton is the founder and Chairman of DevonWay, a software applications company, which he founded in May 2005, and a customer of TenFold. Mr. Felton was the founder and served as a member of the Board of Directors of Indus International, Inc., a software applications company, since its inception in 1988 until 2002, at which point he retired. From 1988 to January 1999, Mr. Felton also served as Indus’s Chairman, President, and Chief Executive Officer. Mr. Felton holds a BS in mechanical engineering from Cornell University and an MS in nuclear engineering from the University of Washington.
Alexei Chadovich joined TenFold in October 1997, and has served as Senior Vice President of Research & Development since February 2002. Prior to that, Mr. Chadovich held various technical and development management roles at TenFold including Director, Development, Vice President of Universal Application Client, Director of Universal Application Core, Senior Developer, and Architect for Universal Application Client. Prior to joining TenFold, Mr. Chadovich served from 1996 to 1997 as software architect and developer with Corel Corporation, a business and graphics software development company. From 1990 to 1996, Mr. Chadovich served in various software development and architect positions with WordPerfect Corp., a business software development company, and after its merger with Novell Inc. in 1994, a business and networking software development company. Prior to joining WordPerfect, Mr. Chadovich held various software development management positions with Kurchatov Atomic Energy Institute in Russia, a physics research institute. Mr. Chadovich holds MS in Computer Science from Moscow Institute of Electronic Technology, Russia.
Samer Diab joined TenFold in June 1994 and has served as Vice President, Customer Services since April 2004. From September 2002 to April 2004, Mr. Diab served as TenFold’s Operations Chief of Staff, and from October 1999 to September 2002, he served as a Vice President of Applications Development for TenFold and a prior wholly owned subsidiary. From June 1994 to October 1999, Mr. Diab served in various technical and management roles in TenFold’s development and consulting organizations. Prior to joining TenFold, Mr. Diab served from 1989 to 1994 in various technical, architectural, and managerial roles in the Applications Division of Oracle Corporation, a large database and applications software company. Mr. Diab holds a BS in Electrical Engineering from the California Institute of Technology.
Robert Hughesjoined TenFold in February 1995, and has served as Chief Financial Officer since January 2006 and as Chief of Staff since November 2005. Mr. Hughes has also served as Senior Vice President Finance since December 2000 and Chief Accounting Officer since May 2003. From September 2000 until December 2000, Mr. Hughes served as Chief Financial Officer of a TenFold subsidiary. From February 1995 until August 2000, Mr. Hughes served as TenFold’s Chief Financial Officer. Prior to joining TenFold, Mr. Hughes served in various finance and administrative capacities at Oracle Corporation, a large database and applications software company, from 1989 to 1995. Prior to joining Oracle, from 1982 to 1989, Mr. Hughes served in various audit positions for KPMG LLP, a public accounting firm. Mr. Hughes holds a BA in business administration from the Haas School of Business, University of California, Berkeley, and is a Certified Public Accountant.
16
Robert Trouncejoined TenFold in February 1998 and has served as Vice President, Consulting since October 2005. From May 2005 to October 2005, Mr. Trounce served as Client Services Executive. From February 1998 to May 2005, Mr. Trounce served in various technical, account management and project management roles in TenFold’s applications development and consulting organizations. Prior to joining TenFold, Mr. Trounce served as an Associate Systems Engineer at Electronic Data Systems, an information technology and business process outsourcing services company. Mr. Trounce holds a BS in Business Management with an emphasis in Management Information Systems from the Marriott School of Management, Brigham Young University.
Jeffrey Walkerfounded TenFold in February 1993 and has served as Executive Vice President, and Chief Technology Officer since October 1996. He served as its Chairman from TenFold’s inception to November 2005. From TenFold’s inception to October 1996, Mr. Walker served as TenFold’s President, Chief Executive Officer, and Chief Technology Officer. Prior to founding TenFold, from 1991 to 1993, Mr. Walker was an independent consultant. From 1985 to 1991, Mr. Walker held several management positions at Oracle Corporation, a large database and applications software company, including Executive Vice President from 1987 to 1991, General Manager Applications Division from 1985 to 1991, Chief Financial Officer from 1987 to 1991, and Senior Vice President of Marketing during 1986. Prior to joining Oracle, Mr. Walker founded and served as Chief Executive Officer of Walker Interactive Products, an application software company, from 1980 to 1985. Mr. Walker holds a BA in mathematics from Brown University.
Sally White joined TenFold in May 2000 and has served as Vice President, Business Development since February 2002. From May 2000 to February 2002, Ms. White served as TenFold’s Training Sales Director. Prior to joining TenFold, Ms. White held several management positions with Provant, Inc., a performance improvement training services organization, including Director of Business Development from 1997 to 1999 and Vice President of Sales Strategies from 1999 to 2000. From 1988 to 1997, Ms. White was Vice President of Sales and Marketing for Innovations, a leadership seminar company. From 1982 to 1988, Ms. White served as the Director of Marketing, then Vice President of Sales and Marketing for Mrs. Fields Cookies, Inc. a global chain of premier cookie shops. Ms. White holds BS in communications from Westminster College and an MBA from Alameda College.
Available Information
Our Annual Report on Form 10-K, Quarterly Reports on Form 10-Q, Current Reports on Form 8-K and amendments to reports filed or furnished pursuant to Sections 13(a) and 15(d) of the Securities Exchange Act of 1934, as amended, are available free of charge from links on our website at www.tenfold.com as soon as reasonably practicable after such reports are electronically filed with, or furnished to, the Securities and Exchange Commission. Registration statements and amendments thereto filed pursuant to the Securities Act of 1933, as amended, are similarly available from our website. The information posted on our web site is not incorporated into this Annual Report.
You may read and copy all or any portion of reports, statements or other information we file with the SEC at the public reference facility maintained by the SEC at 100 F Street, N.E., Washington, DC 20549.
Please call the SEC at 1-800-SEC-0330 for more information on the public reference room. You can also find our SEC filings at the SEC’s website at http://www.sec.gov.
17
Item 1A. Risk Factors
We operate in a rapidly changing environment that involves numerous risks, some of which are beyond our control. The following discussion elaborates on some of these risks.
If we are unable to generate sufficient cash flow from operations, or secure additional sources of financing in the future, we will be unable to continue operations as a going concern
While our financial statements have been prepared under the assumption that we will continue as a going concern, the independent accounting firm’s report on our December 31, 2005 financial statements, prepared by Tanner LC, included an explanatory paragraph relating to their substantial doubt as to our ability to continue as a going concern. Our business model relies upon generating new sales to existing and new customers. On March 30, 2006 we completed a capital raising transaction for gross proceeds of approximately $6.3 million (before expenses and repayment of $1.1 million of interim financing obligations). We believe that with the proceeds of this capital transaction, and new sales that we believe that we can close during 2006, we will have sufficient liquidity for our operations during 2006. However, if we do not close sufficient new sales to existing and new customers, we would be required to pursue one or a combination of the following remedies: seek additional sources of financing, further reduce operating expenses, sell part or all of our assets, or terminate operations. There can be no assurance that we will be successful achieving sufficient cash flow.
We continue to experience difficulty in securing customer revenue
We have experienced difficulty closing substantial new sales, and it is unclear when or if we can expect to predictably close material sales to new or existing customers. Our recent strategy of selling small, proof-of-concept initial “penetrate” projects, and then seeking to “radiate” into the account by selling additional services and licenses was not successful in generating sufficient sales to achieve profitability or positive cash flow. Under the leadership of our new Chief Executive Officer, Robert W. Felton, we have recently changed our business model to focus on selling larger consulting projects but we have not yet closed any sales under this model. Furthermore, our uncertain future may make it less likely for customers to want to do business with us. As a result, there is no assurance that we will be able to convince existing customers or future prospective customers to purchase products or services from us or that any customer revenue that is achieved can be sustained. If we are unable to obtain future customer revenue or outside financing, our operations, financial condition, liquidity, and prospects will be materially and adversely affected, and we would be required to pursue one or a combination of the following remedies: seek additional sources of financing, further reduce operating expenses, sell part or all of our assets, or terminate operations.
Our sales cycle can be lengthy and subject to delays and these delays could cause our operating results to suffer
We believe that a customer’s decision to purchase significant products or services from us can involve a significant commitment of resources and be influenced by customer budget cycles. To successfully sell our products and services, we generally must educate our potential customers regarding the use and benefit of our products and services. Getting new customers to purchase significant licenses or services can require significant time and resources. Consequently, the period between initial contact and the purchase of our products or services can be long and subject to delays associated with the lengthy budgeting, approval, and competitive evaluation processes that typically accompany significant capital expenditures. Sales delays could cause our operating results to vary widely. There can be no assurance that we will not experience sales delays in the future. In addition, we face a challenging sales environment and there can be no assurance that we will have sales in the future.
We are substantially dependent on a small number of customers and the loss of one or more of these customers may cause revenues and cash flow to decline
We have derived, and over the near term we expect to continue to derive, a significant portion of our revenues and cash flow from a limited number of customers. For example, three customers accounted for a
18
total of 49 percent of our total revenues for the year ended December 31, 2005 (individually 20 percent, 18 percent, and 11 percent, respectively). For the year ended December 31, 2004, three customers accounted for a total of 87 percent of total revenue (individually 50 percent, 22 percent and 15 percent, respectively). Significant reductions in the amount of business major customers conduct with us has previously and may in the future, materially and adversely affect our business, results of operations, financial position and liquidity. Replacing the loss of a major customer is unpredictable, and we have not been successful in doing so in the past. Revenues and cash flows from a single customer or a few major customers may constitute a significant portion of our total revenues and cash inflows in a particular period, then decline as the volume of work performed for specific customers decreases as they complete projects. A major customer in one period may not continue to purchase significant licenses or services from us in a subsequent period.
The customer accounting for 20 percent of our total revenues for the year ended December 31, 2005, completed its use of our time-and-materials consulting services for its application development project during the quarter ended December 31, 3005. The customer accounting for 18 percent of our total revenues for the year ended December 31, 2005, substantially completed its application development project during the quarter ended March 31, 2005. The customer accounting for 11 percent of our total revenues for the year ending December 31, 2005, DevonWay, is a related party. See Note 18 of Notes to Financial Statements for more information. In future periods, we do not expect the amount of revenue from these customers to be significant as they have completed their current projects. We have not sold new projects to replace these projects, and are not currently working on any significant consulting projects (which have been our primary source of revenue in recent years).
Our growth and success depends on our ability to successfully implement our new business model; however, we have limited experience with the new model
Under the leadership of our new Chief Executive Officer, Robert W. Felton, we have recently changed our business model to focus on selling larger consulting projects, instead of the smaller prototype application projects that we primarily sold in 2005. Although we hope to be more successful with this new model, we have limited experience with the new model as we have introduced it only recently, and have not yet closed any sales under this model. Under this new model, we expect to take on larger, more difficult and complex consulting projects than we typically have in recent years. Under our original fixed-price project business model that we discontinued several years ago, we received customer complaints and lawsuits concerning some of our projects. Although we have substantially changed our business model, including no longer offering to do such projects on a fixed-price basis or providing a money-back guarantee, we cannot be certain that we will not receive customer complaints in the future. Such complaints would likely adversely affect our ability to sell to other customers. If our new strategy for selling and delivering our services and products is unsuccessful, or if we are unable to close significant new business within the time frames anticipated, our revenues and operating results will continue to suffer.
Our historical quarterly operating results have varied significantly and our future operating results could vary
Historically, our quarterly operating results have varied significantly. For example, during some years, we have had quarterly profits followed by losses in subsequent quarters. Our future operating results may vary significantly in the future as well. Until we achieve and sustain material sales to new or existing customers, we expect to continue to experience declining revenues and losses.
Our future prospects are difficult to evaluate
In light of our operating results for recent periods and the continued difficult sales environment we face and in the technology sector in general, it is difficult to evaluate our future prospects. There can be no assurance that we will be able to successfully complete current or new projects. Additionally, our failure to successfully complete any current or new projects may have a material adverse impact on our financial position and results of operations. We cannot be certain that our business strategy will succeed.
19
Our failure to attract and retain highly skilled employees, particularly consultants, project managers and other senior technical personnel, could impair our ability to complete projects and expand our business
Our services business is labor intensive. We currently have only a small number of consultants in our consulting organization. We expect to supplement them on projects with members of our Development organization for projects in the near term. Longer term, our success will depend in large part upon our ability to attract, retain, train, and motivate highly skilled employees, particularly consultants, project managers and other senior technical personnel. Any failure on our part to do so would impair our ability to adequately manage and complete existing projects, bid for and obtain new projects, and expand business. There exists significant competition for employees with the skills required to perform the services we offer. Qualified consultants, project managers and senior technical staff are in great demand and are likely to remain a limited resource for the foreseeable future. Our current financial condition, and our prior restructurings and related headcount reductions, may make it more difficult for us to retain and compete for such employees. There can be no assurance that we will be successful in retaining, training, and motivating our employees or in attracting new, highly skilled employees. If we are unsuccessful in this effort or if our employees are unable to achieve expected performance levels, our business will be harmed.
A loss of Robert W. Felton, Jeffrey L. Walker, or any other key employee could impair our business
Our industry is competitive and we are substantially dependent upon the continued service of our existing executive personnel, especially Robert W. Felton, Chairman, President, and Chief Executive Officer. Furthermore, our products and technologies are complex and we are substantially dependent upon the continued service of our senior technical staff, including Jeffrey L. Walker, Executive Vice President, and Chief Technology Officer. If a key employee resigns to join a competitor or to form a competing company, the loss of the employee and any resulting loss of existing or potential customers to the competing company would harm our business. We do not carry key-man life insurance on any of our employees. We have not entered into employment agreements with our executives. In the event of the loss of key personnel, there can be no assurance that we would be able to prevent their unauthorized disclosure or use of our technical knowledge, practices, or procedures.
If we fail to adequately anticipate employee and resource utilization rates, our operating results could suffer
A high percentage of our operating expenses, particularly personnel and rent, are relatively fixed in advance of any particular quarter. As a result, unanticipated variations in the number, or progress toward completion, of our projects or in employee utilization rates did and may continue to cause significant variations in operating results in any particular quarter and could result in quarterly losses. Time-and-materials consulting arrangements can typically be terminated by a customer on short notice. An unanticipated termination of a major project, the delay of a project, or the completion during a quarter of several projects has in the past and may continue to result in under-utilized employees and could, therefore, cause us to suffer quarterly losses or cause adverse results of operations.
Our errors and omissions coverage may not cover contractual disputes
While we maintain errors and omissions insurance coverage for claims related to customer contract disputes within the coverage scope and term, given the nature and complexity of the factors affecting the estimated liabilities, actual liabilities may exceed or be outside the scope of our current errors and omissions coverage. We can give no assurance that our insurance carrier will extend coverage to future claims. In addition, no assurance can be given that we will not be subject to material additional liabilities and significant additional litigation relating to errors and omissions arising from future claims.
Our errors and omissions insurance policy is in the form of an industry standard software errors and omissions policy. As such, it only covers software errors and omissions that occur after the delivery of software and excludes contractual disputes such as service commitments and cost and time related guarantees. We have previously had contractual disputes related to our guarantees. While we have substantially changed our business model and no longer offer a money-back guarantee, no assurance can
20
be given that we will not be subject to these types of claims in the future. In the event that liabilities from claims are not covered by or exceed our errors and omissions coverage, our business, results of operations, financial position, or liquidity could be materially and adversely affected.
If our software contains defects or other limitations, we could face product liability exposure
Because of our limited operating history and our small number of customers, we have completed a limited number of projects that are now in production. As a result, there may be undiscovered material defects in our products or technology. Furthermore, complex software products often contain errors or defects, particularly when first introduced or when new versions or enhancements are released. Despite internal testing and testing by current and potential customers, our current and future products may contain serious defects. Serious defects or errors could result in lost revenues or a delay in market acceptance, which would damage our reputation and business.
Because our customers may use our products for mission-critical applications, errors, defects, or other performance problems could result in financial or other damages to customers. Our customers could seek damages for these losses. Any successful claims for these losses, to the extent not covered by insurance, could result in our being obligated to pay substantial damages, which would cause operating results to suffer. Although our license agreements typically contain provisions designed to limit our liability, existing or future laws or unfavorable judicial decisions could negate these limitations of liability provisions. A product liability claim brought against us, even if not successful, would likely be time consuming and costly.
We are involved in one litigation matter and in settlement discussions with our prior CEO, and may in the future be involved in further litigation or disputes that may be costly and time-consuming, and if we suffer adverse outcomes, our operating results could suffer
We are involved in a class action suit against more than 300 issuers involving the underwriters of those issuers’ initial public offerings. Although we currently expect to resolve this matter without significant cost to TenFold, we may in the future face other litigation or disputes with customers, employees, business partners, stockholders, or other third parties. Such litigation or disputes could result in substantial costs and diversion of resources that would harm our business. An unfavorable outcome of this matter may have a material adverse impact on our business, results of operations, financial position, or liquidity.
For the year ended December 31, 2005, we recognized estimated severance related charges related to the departure of our prior CEO totaling $670,000, including an estimated option modification charge of $157,000; which represents our best estimate as the separation terms have not been finalized. The parties are in settlement discussions but a settlement has not been reached. An unfavorable outcome of this matter could have a material adverse impact on our business, results of operations, financial position, or liquidity.
See Note 9 “Legal Proceedings and Contingencies” of Notes to Financial Statements for more information concerning our litigation and disputes.
Our settlements with Perot Systems and Cedars-Sinai Medical Center require that if we do not meet certain obligations their claims may be re-instated or re-asserted, and if this were to happen and we suffer adverse judgments, our operating results could suffer
Although we have settled prior disputes with Perot Systems and Cedars-Sinai Medical Center, and during 2004 entered into revised agreements with Cedars that confirm our completion of the earlier project and provide for mutual releases from prior related claims, our agreements still require that we perform and meet certain obligations. If we are unable to or do not perform or meet these obligations, Perot Systems and Cedars may re-instate or re-assert their respective prior claims against us. If either Perot Systems or Cedars were to re-instate or re-assert their respective claims, an unfavorable outcome of the matter may have a material adverse impact on our business, results of operations, financial position, or liquidity.
If we cannot protect or enforce our intellectual property rights, our competitive position would be impaired and we may become involved in costly and time-consuming litigation
Our success is dependent, in large part, upon our proprietary EnterpriseTenFold technology and other intellectual property rights. If we are unable to protect and enforce these intellectual property rights, our competitors will have the ability to introduce competing products that are similar to ours, and our revenues, market share, and operating results will suffer. To date, we have relied primarily on a combination of patent, copyright, trade secret, and trademark laws, and nondisclosure and other
21
contractual restrictions on copying and distribution to protect our proprietary technology. We have been issued three patents in the United States and intend to continue to seek patents on our technology when appropriate. There can be no assurance that the steps we have taken in this regard will be adequate to deter misappropriation of our proprietary information or that we will be able to detect unauthorized use and take appropriate steps to enforce our intellectual property rights. The laws of some countries may not protect our intellectual property rights to the same extent as do the laws of the United States. Furthermore, litigation may be necessary to enforce our intellectual property rights, to protect our trade secrets, to determine the validity and scope of the proprietary rights of others, or to defend against claims of infringement or invalidity. This litigation could result in substantial costs and diversion of resources that would harm our business.
To date, we have not been notified that our products infringe the proprietary rights of third parties, but there can be no assurance that third parties will not claim infringement by us with respect to current or future products. We expect software developers will increasingly be subject to infringement claims as the number of products and competitors in our industry segment grows and the functionality of products in different industry segments overlaps. Any of these claims, with or without merit, could be time-consuming to defend, result in costly litigation, divert management’s attention and resources, cause product shipment delays, or require us to enter into royalty or licensing agreements. These royalty or licensing agreements, if required, may not be available on terms acceptable to us, or at all. A successful claim against us of product infringement and our failure or inability to license the infringed or similar technology on favorable terms would harm our business.
If we fail to successfully compete, our revenues and market share will be adversely affected
The market for our products and services is highly competitive, and if we are not successful in competing in this market, our revenues and market share will suffer. Many of our competitors have significantly greater financial, technical and marketing resources, generate greater revenues, and have greater name recognition than we do. In addition, there are relatively low barriers to entry into our markets and we have faced, and expect to continue to face, additional competition from new entrants into our markets.
International political and economic uncertainty could have an adverse impact on our business and on our operating results
Revenues from customers outside of North America were approximately 11 percent of total revenues for 2005, and approximately 20 percent of total revenues for 2004. The international political and economic uncertainty caused by the ongoing war on terrorism and other international political developments may adversely impact our ability to continue existing relationships with our foreign customers and to develop new business abroad.
Our stock price may continue to be volatile
Our stock price has fluctuated widely in the past and could continue to do so in the future. Your investment in our stock could lose value. Some of the factors that could significantly affect the market price of our stock, in addition to those mentioned in this section, include: further decreases in our cash resources, changes in our revenue; changes in our customer base including the loss of a major customer; changes in management; variations in our quarterly financial results; problems implementing our business model; reports or earnings estimates published by financial analysts; changes in political, economic and market conditions either generally or specifically to particular industries; and fluctuations in stock prices generally, particularly with respect to the stock prices for other technology companies. A significant drop in our stock price could expose us to the risk of securities class action lawsuits. Defending against such lawsuits could result in substantial costs and divert management’s attention and resources. An unfavorable outcome of such a matter may have a material adverse impact on our business, results of operations, financial position, or liquidity.
22
No corporate actions requiring stockholder approval can take place without the approval of our controlling stockholders
The executive officers, directors, and entities affiliated with them, in the aggregate, beneficially own approximately 70 percent of our voting stock (as calculated using the SEC’s conventions). These stockholders acting together or with others would be able to decide or significantly influence all matters requiring approval by our stockholders, including the election of directors and the approval of mergers or other business combination transactions. This concentration of ownership may have the effect of delaying or preventing a merger or other business combination transaction, even if the transaction would be beneficial to our other stockholders.
The anti-takeover provisions in our charter documents and/or under Delaware law could discourage a takeover that stockholders may consider favorable
Provisions of our certificate of incorporation, bylaws, stock incentive plans and Delaware law may discourage, delay, or prevent a merger or acquisition that a stockholder may consider favorable.
23
Item 1B. Unresolved Staff Comments
None.
Item 2. Properties
TenFold currently owns no real property. Below is a description of our leased property and the status of each facility at December 31, 2005:
| | | | | | |
Location | | Sq. Feet | | Lease expires | | Use |
| South Jordan , UT | | 22,310 | | September 2007 | | Corporate headquarters, research and development, consulting, support, education, sales, executive and administrative activities. |
| | | |
| San Francisco, CA | | 3,518 | | Month to month | | Research and development, consulting, and sales activities. |
| | | |
| Chicago, IL | | 1,000 | | May 2006 | | Previously, sales and consulting activities (no longer used). |
We conduct much of our operations from our corporate headquarters located near Salt Lake City, Utah. Our staff currently work at this office, at our San Francisco office, at customer sites, or from home offices. During 2006, we do not presently anticipate needing material additional office space.
Item 3. Legal Proceedings
See Part IV, Item 15, Note 9 of Notes to Financial Statements for a description of legal proceedings.
Item 4. Submission of Matters to a Vote of Security Holders
None.
24
PART II
Item 5. Market for Registrant’s Common Equity, Related Stockholder Matters and Issuer Purchases of Equity Securities
Our common stock is quoted on the OTC Bulletin Board under the trading symbol “TENF.OB.” Our high and low prices by quarter during 2005 and 2004 are presented below. These prices reflect inter-dealer quotations and may not represent actual transactions.
| | | | | | |
| | | 2005 |
| | | HIGH | | LOW |
First Quarter | | $ | 0.99 | | $ | 0.36 |
Second Quarter | | $ | 0.59 | | $ | 0.34 |
Third Quarter | | $ | 0.41 | | $ | 0.31 |
Fourth Quarter | | $ | 0.40 | | $ | 0.21 |
| |
| | | 2004 |
| | | HIGH | | LOW |
First Quarter | | $ | 5.11 | | $ | 2.55 |
Second Quarter | | $ | 2.68 | | $ | 0.88 |
Third Quarter | | $ | 1.76 | | $ | 1.05 |
Fourth Quarter | | $ | 1.35 | | $ | 0.60 |
On December 31, 2005, we had approximately 235 stockholders of record of our common stock and 46,445,749 shares of our common stock were issued and outstanding.
We have never declared or paid dividends on our common stock. We expect to retain any earnings generated by our operations for the development and growth of our business, and we do not anticipate paying any dividends to our stockholders for the foreseeable future.
Equity Compensation Plan Information
The following table provides the information about our common stock that may be issued upon the exercise of options and rights under all of our existing equity compensation plans as of December 31, 2005, including the 1993 Flexible Stock Incentive Plan, the 1999 Stock Plan, the 1999 Employee Stock Purchase Plan, and the 2000 Employee Stock Option Plan.
| | | | | | | | | |
Plan category | | Number of securities to be issued upon exercise of outstanding options, warrants and rights as of December 31, 2005 (a) | | | Weighted-average exercise price of outstanding options, warrants and rights (b) | | Number of securities remaining available for future issuance under equity
compensation plans as of December 31, 2005 (excluding
securities reflected in column (a)) (c) | |
Equity compensation plans approved by security holders | | 20,342,379 | (1) | | $ | 1.92 | | 7,841,328 | (2) |
25
| | | | | | | | | |
Plan category | | Number of securities to be issued upon exercise of outstanding options, warrants and rights as of December 31, 2005 (a) | | | Weighted-average exercise price of outstanding options, warrants and rights (b) | | Number of Securities remaining available for future issuance under equity
compensation plans as of December 31, 2005 (excluding
securities reflected in column (a)) (c) | |
Equity compensation plans not approved by security holders | | 3,108,080 | (3) | | $ | 1.02 | | 3,658,347 | (4) |
| | | | | | | | | |
Total | | 23,450,459 | | | $ | 1.80 | | 11,499,675 | |
| | | | | | | | | |
| (1) | 4,787,535 to be issued under the 1993 Flexible Stock Incentive Plan, and 15,554,844 to be issued under the 1999 Stock Plan. |
| (2) | 624,673 available for future issuance under the 1993 Flexible Stock Incentive Plan, 5,610,587 available for future issuance under the 1999 Stock Plan, and 1,606,068 available for future issuance under the 1999 Employee Stock Purchase Plan. |
| (3) | Issued under the 2000 Employee Stock Option Plan. |
| (4) | Shares available at December 31, 2005 under the 2000 Employee Stock Option Plan. |
2000 Employee Stock Option Plan. Our 2000 Employee Stock Option Plan was adopted by the Board of Directors in December 2000. A total of 7,000,000 shares of common stock have been reserved for issuance under the 2000 Stock Option Plan. The 2000 Stock Option Plan provides for the granting of nonstatutory options to purchase shares of our common stock to employees, excluding officers and members of our Board of Directors. Nonstatutory options do not qualify as an Incentive Stock Option within the meaning of Section 422 of the Internal Revenue Code of 1986, as amended. The 2000 Employee Stock Option Plan is administered by the Board of Directors. The plan administrator determines the terms of options granted under the 2000 Stock Option Plan, including the number of shares subject to an option, the exercise price, the term and exercisability of options, and any vesting or other restrictions that apply to awards. The 2000 Stock Option Plan allows us to issue options with an exercise price equal to any price determined appropriate by the administrator. To date, all options issued under the 2000 Stock Option Plan have had exercise prices equal to the fair market value of the common stock on the date the option was granted. The plan allows for payment of the exercise price with cash, check, promissory note, or other shares of TenFold common stock, through a brokered cashless exercise program, or with any other form of consideration permitted by the administrator. Options issued under the 2000 Stock Option Plan generally vest over a four-year period and expire ten years from the date of grant.
The 2000 Stock Option Plan provides for automatic adjustment of shares remaining available for issuance as well as adjustment of outstanding awards in the event of any stock split, stock dividend, or similar change in our capital structure. In the event we were to be acquired by a third-party acquiror, we would expect that outstanding options would be assumed by our acquiror so that they would convert into awards to purchase acquiror stock (adjusted to reflect the terms of the transaction). If our acquiror did not agree to assume outstanding awards, then the vesting of such awards would accelerate in full prior to the closing of the acquisition and unexercised awards would terminate upon the closing. Unless terminated earlier, the 2000 Stock Plan will terminate in December 2010.
26
Recent Sales of Unregistered Securities
We had no sales of unregistered stock during 2005 or 2004. Our unregistered stock sales during 2003 were as follows:
| | • | | On February 5, 2003, we entered into a Purchase Agreement with the Robert W. Felton Trust for the sale of 3,888,889 shares of unregistered common stock at a purchase price of $0.18 per share. |
| | • | | On December 22, 2003, we entered into a Securities Purchase Agreement for the sale of 5,000,000 shares of unregistered common stock for a purchase price of $2.00 per share. |
On March 29, 2006, we entered into a Securities Purchase Agreement for the sale of 1,500,000 shares of unregistered convertible preferred stock and warrants. The preferred shares are convertible into 20,315,805 shares of common stock. The warrants are to purchase 10,157,899 shares of common stock at an exercise price of $0.62 per share, with a 5 year term. The transaction generated gross proceeds of approximately $6.3 million (before expenses and repayment of $1.1 million of interim financing obligations). Several members of our Board of Directors (or investment entities associated with them) and an Executive Officer participated in the transaction, providing a total of approximately $4.7 million of the gross proceeds raised:
| • | | Robert W. Felton Trust invested $2 million. We repaid $709,000 of interim financing to Mr. Felton, our Chairman, President, and Chief Executive Officer, from the proceeds of the capital raising. |
| • | | First Media TF Holdings LLC, an investment entity associated with TenFold Director Ralph W. Hardy Jr., invested $2 million. We repaid $205,000 of interim financing to First Media TF Holdings LLC from the proceeds of the capital raising. |
| • | | TenFold Director Steven H. Coltrin invested $500,000. We expect to use approximately $206,000 of the proceeds of the capital raising to pay accounts payable due to his firm, Coltrin & Associates, for marketing and public relations work provided to TenFold in earlier periods. |
| • | | Samer Diab, Vice President, Customer Services, invested $230,000. |
The other purchasers under the Securities Purchase Agreement were GMS Family Investors LLC, Jon M. Huntsman, Ronald Mika and Rationalwave Onshore Equity Fund L.P.
We also repaid $205,000 of interim financing to Wasatch Investments LLC, an investment entity associated with TenFold Director Robert E. Parsons, Jr., from the proceeds of the capital raising.
All sales of unregistered securities listed above were made to “accredited investors” pursuant to the exemption from registration provided in Rule 506, which is part of Regulation D under the Securities Act of 1933.
27
Item 6. Selected Financial Data
The selected statement of operations data for the years ended December 31, 2005, 2004, 2003, 2002, and 2001, and the selected balance sheet data as of December 31, 2005, 2004, 2003, 2002, and 2001, are derived from, and are qualified by reference to, our audited financial statements. The historical results are not necessarily indicative of future results.
| | | | | | | | | | | | | | | | | | | | |
| | | Year ended December 31, | |
| | | 2005 | | | 2004 | | | 2003 | | | 2002 | | | 2001 | |
| | | (in thousands, except per share data) | |
Statement of Operations Data: | | | | | | | | | | | | | | | | | | | | |
Revenues: | | | | | | | | | | | | | | | | | | | | |
License | | $ | 515 | | | $ | 359 | | | $ | 248 | | | $ | 207 | | | $ | 8,532 | |
Subscription | | | — | | | | — | | | | 10,431 | | | | 15,548 | | | | 689 | |
Services and other | | | 5,195 | | | | 17,234 | | | | 17,030 | | | | 12,475 | | | | 45,692 | |
| | | | | | | | | | | | | | | | | | | | |
Total revenues | | | 5,710 | | | | 17,593 | | | | 27,709 | | | | 28,230 | | | | 54,913 | |
| | | | | | | | | | | | | | | | | | | | |
Operating expenses: | | | | | | | | | | | | | | | | | | | | |
Cost of revenues | | | 2,940 | | | | 5,883 | | | | 9,454 | | | | 12,998 | | | | 30,990 | |
Sales and marketing | | | 2,896 | | | | 2,861 | | | | 1,088 | | | | 1,985 | | | | 5,556 | |
Research and development | | | 3,531 | | | | 3,734 | | | | 3,471 | | | | 6,229 | | | | 12,672 | |
General and administrative | | | 2,986 | | | | 2,315 | | | | 3,046 | | | | 7,803 | | | | 11,113 | |
Amortization of goodwill and acquired intangibles | | | — | | | | — | | | | — | | | | — | | | | 962 | |
Special charges | | | — | | | | — | | | | (673 | ) | | | 2,838 | | | | 18,876 | |
| | | | | | | | | | | | | | | | | | | | |
Total operating expenses | | | 12,353 | | | | 14,793 | | | | 16,386 | | | | 31,853 | | | | 80,169 | |
| | | | | | | | | | | | | | | | | | | | |
Income (loss) from operations | | | (6,643 | ) | | | 2,800 | | | | 11,323 | | | | (3,623 | ) | �� | | (25,256 | ) |
| | | | | | | | | | | | | | | | | | | | |
Total other income, net | | | 137 | | | | 240 | | | | 2,456 | | | | 1,938 | | | | 12,553 | |
| | | | | | | | | | | | | | | | | | | | |
Income (loss) before income taxes | | | (6,506 | ) | | | 3,040 | | | | 13,779 | | | | (1,685 | ) | | | (12,703 | ) |
Provision (benefit) for income taxes | | | (1,072 | ) | | | (376 | ) | | | 32 | | | | (497 | ) | | | 2,965 | |
| | | | | | | | | | | | | | | | | | | | |
Net income (loss) | | $ | (5,434 | ) | | $ | 3,416 | | | $ | 13,747 | | | $ | (1,188 | ) | | $ | (15,668 | ) |
| | | | | | | | | | | | | | | | | | | | |
Basic earnings (loss) per common share | | $ | (0.12 | ) | | $ | 0.07 | | | $ | 0.34 | | | $ | (0.03 | ) | | $ | (0.44 | ) |
| | | | | | | | | | | | | | | | | | | | |
Diluted earnings (loss) per common share | | $ | (0.12 | ) | | $ | 0.06 | | | $ | 0.29 | | | $ | (0.03 | ) | | $ | (0.44 | ) |
| | | | | | | | | | | | | | | | | | | | |
Weighted average shares - basic (1) | | | 46,423 | | | | 46,204 | | | | 40,634 | | | | 37,249 | | | | 35,623 | |
| | | | | | | | | | | | | | | | | | | | |
Weighted average shares - diluted (1) | | | 46,423 | | | | 54,924 | | | | 47,623 | | | | 37,249 | | | | 35,623 | |
| | | | | | | | | | | | | | | | | | | | |
Balance Sheet Data (at period end): | | | | | | | | | | | | | | | | | | | | |
Cash and cash equivalents | | $ | 1,344 | | | $ | 5,225 | | | $ | 12,236 | | | $ | 3,838 | | | $ | 10,969 | |
Total current assets | | | 1,716 | | | | 5,715 | | | | 13,489 | | | | 7,654 | | | | 16,604 | |
Total assets | | | 2,142 | | | | 6,415 | | | | 14,417 | | | | 9,284 | | | | 27,476 | |
Total current liabilities | | | 5,078 | | | | 4,098 | | | | 15,857 | | | | 34,484 | | | | 50,942 | |
Long-term obligations, redeemable preferred and common stock, less current portion | | | 10 | | | | 36 | | | | — | | | | 25 | | | | 1,878 | |
Stockholders’ equity (deficit) | | | (2,946 | ) | | | 2,281 | | | | (1,440 | ) | | | (25,225 | ) | | | (25,344 | ) |
Working capital (deficit) | | | (3,362 | ) | | | 1,617 | | | | (2,368 | ) | | | (26,830 | ) | | | (34,338 | ) |
| (1) | See Note 4 to the financial statements for an explanation of the determination of the method used to determine the number of shares used in computing net earnings (loss) per share. |
28
Supplementary Financial Information
The following tables set forth certain unaudited quarterly results of our operations for 2005 and 2004. In the opinion of management, this information has been prepared on the same basis as the audited financial statements and all necessary adjustments, consisting only of normal recurring adjustments, have been included in the amounts stated below to present fairly the quarterly information when read in conjunction with the audited financial statements and notes thereto included elsewhere in this Annual Report on Form 10-K. The quarterly operating results are not necessarily indicative of future results.
| | | | | | | | | | | | | | | | | | | | | | | | | | | | | | | |
| | | Quarter ended | |
| | | Mar 31,
2004 | | | June 30,
2004 | | Sept 30,
2004 | | | Dec 31,
2004 | | | Mar 31,
2005 | | | June 30,
2005 | | | Sept 30,
2005 | | | Dec 31,
2005 | |
| | | (in thousands, except per share data)(unaudited) | |
Revenues: | | | | | | | | | | | | | | | | | | | | | | | | | | | | | | | |
License | | $ | 152 | | | $ | 108 | | $ | 33 | | | $ | 66 | | | $ | 93 | | | $ | 223 | | | $ | 124 | | | $ | 75 | |
Services and other | | | 3,439 | | | | 10,385 | | | 1,723 | | | | 1,687 | | | | 1,515 | | | | 1,478 | | | | 1,368 | | | | 834 | |
| | | | | | | | | | | | | | | | | | | | | | | | | | | | | | | |
Total revenues | | | 3,591 | | | | 10,493 | | | 1,756 | | | | 1,753 | | | | 1,608 | | | | 1,701 | | | | 1,492 | | | | 909 | |
| | | | | | | | | | | | | | | | | | | | | | | | | | | | | | | |
Operating expenses: | | | | | | | | | | | | | | | | | | | | | | | | | | | | | | | |
Cost of revenues | | | 2,187 | | | | 1,794 | | | 1,038 | | | | 864 | | | | 994 | | | | 757 | | | | 707 | | | | 482 | |
Sales and marketing | | | 315 | | | | 581 | | | 1,045 | | | | 920 | | | | 714 | | | | 846 | | | | 667 | | | | 669 | |
Research and development | | | 824 | | | | 980 | | | 982 | | | | 948 | | | | 943 | | | | 876 | | | | 824 | | | | 888 | |
General and administrative | | | 578 | | | | 644 | | | 676 | | | | 417 | | | | 631 | | | | 592 | | | | 637 | | | | 1,126 | |
| | | | | | | | | | | | | | | | | | | | | | | | | | | | | | | |
Total operating expenses | | | 3,904 | | | | 3,999 | | | 3,741 | | | | 3,149 | | | | 3,282 | | | | 3,071 | | | | 2,835 | | | | 3,165 | |
| | | | | | | | | | | | | | | | | | | | | | | | | | | | | | | |
Income (loss) from operations | | | (313 | ) | | | 6,494 | | | (1,985 | ) | | | (1,396 | ) | | | (1,674 | ) | | | (1,370 | ) | | | (1,343 | ) | | | (2,256 | ) |
| | | | | | | | | | | | | | | | | | | | | | | | | | | | | | | |
Total other income, net | | | 107 | | | | 86 | | | 23 | | | | 24 | | | | 99 | | | | 20 | | | | 12 | | | | 6 | |
| | | | | | | | | | | | | | | | | | | | | | | | | | | | | | | |
Income (loss) before income taxes | | | (206 | ) | | | 6,580 | | | (1,962 | ) | | | (1,372 | ) | | | (1,575 | ) | | | (1,350 | ) | | | (1,331 | ) | | | (2,250 | ) |
| | | | | | | | |
Provision (benefit) for income taxes | | | — | | | | 4 | | | — | | | | (380 | ) | | | 1 | | | | 6 | | | | (990 | ) | | | (89 | ) |
| | | | | | | | | | | | | | | | | | | | | | | | | | | | | | | |
Net income (loss) | | $ | (206 | ) | | $ | 6,576 | | $ | (1,962 | ) | | $ | (992 | ) | | $ | (1,576 | ) | | $ | (1,356 | ) | | $ | (341 | ) | | $ | (2,161 | ) |
| | | | | | | | | | | | | | | | | | | | | | | | | | | | | | | |
| | | | | | | | |
Basic earnings (loss) per common share | | $ | (0.00 | ) | | $ | 0.14 | | $ | (0.04 | ) | | $ | (0.02 | ) | | $ | (0.03 | ) | | $ | (0.03 | ) | | $ | (0.01 | ) | | $ | (0.05 | ) |
| | | | | | | | | | | | | | | | | | | | | | | | | | | | | | | |
| | | | | | | | |
Diluted earnings (loss) per common share | | $ | (0.00 | ) | | $ | 0.12 | | $ | (0.04 | ) | | $ | (0.02 | ) | | $ | (0.03 | ) | | $ | (0.03 | ) | | $ | (0.01 | ) | | $ | (0.05 | ) |
| | | | | | | | | | | | | | | | | | | | | | | | | | | | | | | |
29
Item 7. Management’s Discussion and Analysis of Financial Condition and Results of Operations
Business Overview
TenFold provides services and technology for building complex, Service Oriented Architecture (“SOA”)-compliant, mission-critical applications in significantly less time and cost that it would otherwise take using traditional development technologies. We believe that with TenFold’s technology, EnterpriseTenFold, customers will also experience significantly reduced ongoing applications maintenance and enhancement costs compared to what they generally experience with legacy applications.
Our business model focuses on providing applications development services and our EnterpriseTenFold technology, support and training, to customers who can use a TenFold team or their own business teams to build and maintain applications.
Critical Accounting Policies
The fundamental objective of financial reporting is to provide useful information that allows a reader to comprehend our business activities. To aid in that understanding, management has identified the “critical accounting policies” below. These policies have the potential to have a more significant impact on our financial statements, either because of the significance of the financial statement item to which they relate, or because they require judgment and estimation due to the uncertainty involved in measuring, at a specific point in time, events which are continuous in nature.
Revenue Recognition and Project Profitability
We believe risks relating to revenue recognition include the judgment required to determine project profit or loss projections on time-and-materials contracts. We recognize time-and-materials revenue at the lowest point in the range of estimated profit margin, which represents our best estimate of the profit to be achieved. Variances may occur if we are unable to collect time-and-materials billings or if we grant concessions to time-and-materials customers in order to sell additional business or collect cash under the contract. As we occasionally provide services on a fixed price basis, risks relating to revenue recognition also include the judgment and estimation required to determine fixed-price project completion percentages, and fixed-price project profit or loss projections. Variances between management’s estimates and actual results may result in significant adjustments to our results of operations and financial position.
For a license agreement that we executed in August 2005 that contains a discount that cannot be determined at the inception of the agreement, we expect to recognize the related license revenue at the end of the estimated economic life of the release of EnterpriseTenFold provided to the customer. We are using the end of the estimated economic life to recognize the revenue because we do not have vendor specific objective evidence of fair value (“VSOE”) for the related post-contract customer support, due to the discount, and therefore we cannot allocate the revenue until the discount is known at the end of the estimated economic life. For accounting purposes, management estimates that the economic life is 16 months after considering factors such as the rapid pace of technological change in the software industry generally and particularly in TenFold’s market, the pace at which TenFold produces new releases of TenFold technology with substantial technological improvements, and the pace at which TenFold’s customers adopt new releases of TenFold technology.
Litigation Reserves
We review asserted litigation claims each quarter to determine the likelihood that the claim will result in a loss. Significant management judgment is required to conclude on the likely outcome of outstanding litigation. If a loss is probable on a litigation claim, management estimates the loss and we accrue the estimated loss. If a loss is considered probable but cannot be reasonably estimated, we disclose the contingency in the notes to our financial statements. Losses may result on litigation claims that are not considered probable or are not estimable at the current time, potentially having a significant impact on future financial results.
30
Results of Operations
The following table sets forth, for the periods indicated, the percentage relationship of selected items from our statements of operations to total revenues.
| | | | | | | | | |
| | | Years Ended December 31, | |
| | | 2005 | | | 2004 | | | 2003 | |
Revenues: | | | | | | | | | |
License | | 9 | % | | 2 | % | | 1 | % |
Subscription | | — | | | — | | | 38 | % |
Services and other | | 91 | % | | 98 | % | | 61 | % |
| | | | | | | | | |
Total revenues | | 100 | % | | 100 | % | | 100 | % |
| | | |
Operating expenses: | | | | | | | | | |
Cost of revenues | | 51 | % | | 34 | % | | 34 | % |
Sales and marketing | | 51 | % | | 16 | % | | 4 | % |
Research and development | | 62 | % | | 21 | % | | 12 | % |
General and administrative | | 52 | % | | 13 | % | | 11 | % |
Special charges | | — | | | — | | | (2 | )% |
| | | | | | | | | |
Total operating expenses | | 216 | % | | 84 | % | | 59 | % |
| | | | | | | | | |
Income (loss) from operations | | (116 | )% | | 16 | % | | 41 | % |
Total other income, net | | 2 | % | | 1 | % | | 9 | % |
| | | | | | | | | |
Income (loss) before income taxes | | (114 | )% | | 17 | % | | 50 | % |
Provision (benefit) for income taxes | | (19 | )% | | (2 | )% | | — | |
| | | | | | | | | |
Net income (loss) | | (95 | )% | | 19 | % | | 50 | % |
| | | | | | | | | |
2005 as Compared to 2004
Revenues
Total revenues decreased $11.9 million or 68 percent, to $5.7 million for the year ended December 31, 2005, as compared to $17.6 million for the year ended December 31, 2004.
Services and other revenues decreased $12 million, or 70 percent, to $5.2 million for the year ended December 31, 2005 as compared to $17.2 million for the year ended December 31, 2004. Services and other revenues for the year ended December 31, 2004 include $8.1 million in revenues, and $150,000 in operating costs, recognized during the quarter ended June 30, 2004, related to the completion of an earlier fixed-price applications development project with Cedars-Sinai Medical Center (“Cedars”). This completed the recognition of these revenues and related costs that were deferred in prior years pending confirmation of the completion of the applications development project and resolution of potential disputes between the parties. Excluding the effect of this Cedars transaction, we would have had total revenues of $9.5 million, and a net loss of $4.5 million for the year ended December 31, 2004.
In addition to the decrease related to the Cedars transaction, services and other revenues decreased due to decreases in revenues from certain customers who purchased less time-and-materials consulting from us over time as they completed their applications development projects and became more self-sufficient. One customer completed its use of our time-and-materials consulting services for its applications development project during the quarter ended September 30, 2004. Another large customer’s time-and-materials consulting engagement was substantially completed during the quarter ended March 31, 2005. These decreases were partially offset by consulting revenues from new customers.
During 2005, we entered into agreements with a new customer, DevonWay, to provide licenses, consulting services, technical support services, and training, for a total of approximately $1.6 million. A long-time member of our Board of Directors and our recently elected Chairman, CEO and President, Robert W. Felton, is the founder and majority shareholder of DevonWay. All disinterested members of our Board
31
of Directors approved of these related party transactions and our general ongoing business relationship with DevonWay. Our revenues from DevonWay for the year ended December 31, 2005, are license revenues of $160,000, and services and other revenue of $439,000. See Note 18 of the Notes to Financial Statements for more information.
Although customers purchased licenses with contract values totaling $1.5 million (including a $1 million license sold to DevonWay) for the year ending December 31, 2005, we recorded license revenues for accounting purposes of $515,000, up from $359,000 for the year ending December 31, 2004. For accounting purposes, the amounts allocated to individual contract elements (such as licenses) may differ from the amounts stated in the contract for those individual elements, and the timing of their recognition as revenue may be later than the period in which they are sold. See Note 3 of the Notes to Financial Statements for more information.
Three customers accounted for 20 percent, 18 percent and 11 percent of our total revenues for the year ended December 31, 2005, compared to three customers accounting for 50 percent (Cedars), 22 percent and 15 percent of our total revenues for the year ended December 31, 2004. No other single customer accounted for more than 10 percent of our total revenues for the year ended December 31, 2005 or 2004.
The customer accounting for 20 percent of our total revenues for the year ended December 31, 2005, completed its use of our time-and-materials consulting services for its application development project during the quarter ended December 31, 2005. The customer accounting for 18 percent of our total revenues for the year ended December 31, 2005, substantially completed its application development project during the quarter ended March 31, 2005. The customer accounting for 11 percent of our total revenues for the year ended December 31, 2005, DevonWay, is a related party, as noted above. In future periods, we do not expect the amount of revenue from these customers to be significant as they have completed their current projects. We have not sold new projects to replace these projects, and are not currently working on any significant consulting projects.
We continue to actively market to new and existing customers. However, we continue to face a challenging sales environment. As a result, it is unclear if or when we can expect to close material sales to new or existing customers, and until we do so we are likely to continue to experience declining revenues and increasing losses.
Operating Expenses
Cost of Revenues.Cost of revenues consists primarily of compensation and other related costs of personnel and contractors to provide applications development and implementation, support, and training services. Cost of revenues decreased $2.9 million, or 50 percent, to $2.9 million for the year ended December 31, 2005 as compared to $5.9 million for the year ended December 31, 2004. The decrease in cost of revenues is primarily due to having a smaller staff (particularly subcontractors) working on customer projects as these customers complete their current application development projects and become more self-sufficient. In particular, the UK project that ended during the quarter ended September 30, 2004 was staffed with subcontractors who we released upon completion of the services.
Sales and Marketing.Sales and marketing expenses consist primarily of compensation, travel, and other related expenses for sales and marketing personnel; and marketing seminars, public relations, advertising and other marketing expenses. Sales and marketing expenses increased $35,000, or 1 percent, to $2.9 million for the year ended December 31, 2005 as compared to $2.9 million for the year ended December 31, 2004. In connection with the change in sales focus under our new Chief Executive Officer, Robert W. Felton, and to conserve our financial resources, we discontinued most discretionary marketing spending in December 2005.
Research and Development.Research and development expenses consist primarily of compensation and other related costs of personnel dedicated to research and development activities. Research and development expenses decreased $203,000, or 5%, to $3.5 million for the year ended December 31, 2005, as compared to $3.7 million for the year ended December 31, 2004.
32
General and Administrative.General and administrative expenses consist primarily of the costs of executive management, finance and administrative staff, business insurance, and professional fees. General and administrative expenses increased $671,000, or 29 percent, to $3.0 million for the year ended December 31, 2005 as compared to $2.3 million for the year ended December 31, 2004. The increase in general and administrative expenses for the year ended December 31, 2005 is primarily due to the recognition of estimated severance related charges related to the departure of our prior CEO totaling $670,000, including an estimated option modification charge of $157,000; which represents our best estimate as the separation terms have not been finalized. The parties are in settlement discussions but a settlement has not been reached. An unfavorable outcome of this matter could have a material adverse impact on our business, results of operations, financial position, or liquidity.
During the quarter ended March 31, 2004, we reduced some variable compensation accrued during 2003, to lower levels that we believe better reflect our estimates. This reduced operating expenses for the first quarter of 2004 by $219,000.
Special Charges.We incurred no special charges during the years ended December 31, 2005 and 2004.
Total Other Income, net
Net total other income was $137,000 for the year ended December 31, 2005, as compared to $240,000 for the year ended December 31, 2004.
Provision for Income Taxes
The benefit for income taxes was $1.1 million for the year ended December 31, 2005 as compared to a benefit of $376,000 for the year ended December 31, 2004. The benefit for income taxes for the years ended December 31, 2005 and 2004 relate primarily to reversing accruals for foreign and state taxes that were no longer deemed necessary.
At December 31, 2005, we had established a valuation allowance of $39.1 million for the net deferred tax assets related to temporary differences, foreign tax credit carryforwards and projected net operating loss carryforwards. The valuation allowance was recorded in accordance with the provisions of Statement of Financial Accounting Standards (“SFAS”) No. 109,Accounting for Income Taxes, which requires that a valuation allowance be established when there is significant uncertainty as to the realizability of the deferred tax assets. Based on a number of factors, including the size of the prior operating losses, the currently available, objective evidence indicates that it is more likely than not that the net deferred tax assets will not be realized.
Balance Sheet Items
Notes payable.In December 2005, we executed promissory notes due to three members of our Board of Directors (or investment entities associated with those Directors), for a total of $600,000. During the quarter ended March 31, 2006, we executed additional similar notes totaling $500,000 to our Chief Executive Officer, Robert W. Felton. See Note 7 of the Notes to Financial Statements for more information.
Deferred revenues. We had deferred revenues of $2.2 million at December 31, 2005 compared to $1.1 million at December 31, 2004. The increase results primarily from a $1 million license payment we received from DevonWay in August 2005. For accounting purposes we have deferred revenue recognition of this revenue until the end of the estimated economic life of the release of EnterpriseTenFold provided to DevonWay, because the license agreement contains a discount that cannot be determined at inception of the agreement, as discussed above.
33
2004 as Compared to 2003
Revenues
Total revenues decreased $10.1 million or 37 percent, to $17.6 million for the year ended December 31, 2004, as compared to $27.7 million for the year ended December 31, 2003.
Services and other revenues increased $204,000, or 1 percent, to $17.2 million for the year ended December 31, 2004 as compared to $17.0 million for the year ended December 31, 2003. Services and other revenues for the year ended December 31, 2004 include $8.1 million in revenues, and $150,000 in operating costs, recognized during the quarter ended June 30, 2004, related to the completion of the earlier fixed-price applications development project with Cedars. This completed the recognition of these revenues and related costs that were deferred in prior years pending confirmation of the completion of the applications development project and resolution of potential disputes between the parties. The new contractual terms between Cedars and TenFold confirmed TenFold’s completion of the earlier project and provided for mutual releases from prior related claims. Since this completed our recognition of this project-related revenue, Cedars did not account for a significant portion of our revenue in subsequent periods.
Excluding the effect of this Cedars transaction, we would have had total revenues of $9.5 million, and a net loss of $4.5 million for the year ended December 31, 2004. The increase in services and other revenues during the year ended December 31, 2004 from this transaction, was partially offset by decreases in revenues from certain other customers who are purchasing less time-and-materials consulting from us over time as they completed their current application development projects and became more self-sufficient. Services and other revenues for the year ended December 31, 2003 include $1.5 million from the reduction over time of a guarantee on one prior fixed-price contract, and $600,000 recognized upon completion of training obligations associated with a contract signed in 2002.
License revenues increased $111,000 to $359,000 for the year ended December 31, 2004, as compared to $248,000 for the year ended December 31, 2003. The increase in license revenues was primarily due to the amortization of the revenue from a project related license sold in late 2003 into revenues during early 2004, and an increase in the volume of new license sales during 2004 as compared to 2003.
We had no subscription revenues for the year ended December 31, 2004, as compared to $10.4 million for the year ended December 31, 2003. Subscription revenues represent revenue from contracts that include a subscription to new product releases on a “when and if available” basis. For certain contracts, including a subscription to future software products when and if they become available, we recognize the fees for the software products ratably over the subscription term beginning with delivery of the first software product. For contracts that include a service element for which the fair value is undeterminable, and the contract includes a subscription to new product releases on a “when and if available basis,” we recognize the entire contract fee ratably over the subscription period as subscription revenue. During the quarter ended June 30, 2003, our existing subscription contracts reached the end of their subscription periods, and we recognized the final remaining subscription revenue for these contracts.
Three customers accounted for 50 percent (Cedars), 22 percent and 15 percent of our total revenues for the year ended December 31, 2004, compared to three customers accounting for 41 percent, 25 percent and 23 percent of our total revenues for the year ended December 31, 2003. No other single customer accounted for more than 10 percent of our total revenues for the year ended December 31, 2004 or 2003.
Our revenues from the two customers accounting for 22 percent and 15 percent of our total revenues for the year ended December 31, 2004, which was primarily time-and-materials consulting revenue, decreased over time as these customers completed their current application development projects and became more self-sufficient. The customer accounting for 15 percent of our total revenues for the year ended December 31, 2004 completed its use of our time-and-materials consulting services for its current application development project during the quarter ended September 30, 2004. During Q3 and Q4, the end-user customer for this project engaged directly with us for some short-term time-and-materials consulting services. The other customer project, accounting for 22 percent of our total revenues for the year ended December 31, 2004, was substantially completed at the end of the first quarter of 2005.
34
During the quarter ended December 31, 2004, we recognized from previously deferred revenues, service revenues of approximately $261,000 for work performed and from a reduction of our estimate of work remaining on a customer project.
Operating Expenses
Cost of Revenues.Cost of revenues decreased $3.6 million, or 38 percent, to $5.9 million for the year ended December 31, 2004 compared to $9.5 million for the year ended December 31, 2003. The decreases in cost of revenues were primarily due to having a smaller staff (particularly subcontractors) working on customer projects as these customers completed their application development projects and became more self-sufficient.
Sales and Marketing.Sales and marketing expenses increased $1.8 million, or 163 percent, to $2.9 million for the year ended December 31, 2004 as compared to $1.1 million for the year ended December 31, 2003. These increases in sales and marketing expenses were primarily due to expanding sales staffing and increasing marketing activities.
Research and Development.Research and development expenses increased $263,000, or 8%, to $3.7 million for the year ended December 31, 2004, as compared to $3.5 million for the year ended December 31, 2003.
General and Administrative.General and administrative expenses decreased $731,000, or 24 percent, to $2.3 million for the year ended December 31, 2004 as compared to $3.0 million for the year ended December 31, 2003. The decreases in general and administrative expenses were primarily due to lower variable compensation accruals and lower legal expenses.
During the quarter ended March 31, 2004, we reduced some variable compensation accrued during 2003, to lower levels that we believe better reflect our estimates. This reduced operating expenses for the first quarter of 2004 by $219,000.
During the quarter ended December 31, 2003, we similarly reduced some variable compensation accrued during the first half of 2003. This reduced operating expenses for the fourth quarter of 2003 by $550,000.
Special Charges.We incurred no special charges during the year ended December 31, 2004. Special charges for the year ended December 31, 2003 of $(673,000) include restructuring charge adjustments of $(578,000) and asset loss impairment adjustments of $(95,000).
Total Other Income, net
Net total other income was $240,000 for the year ended December 31, 2004, as compared to $2.5 million for the year ended December 31, 2003. Net total other income for the year ended December 31, 2003 included a gain of approximately $2.2 million that we recognized on the retirement of capital lease obligations at a significant discount to their carrying value.
Provision for Income Taxes
The benefit for income taxes was $376,000 for the year ended December 31, 2004 as compared to a provision of $32,000 for the year ended December 31, 2003. The benefit for income taxes for the year ended December 31, 2004 relates primarily to reversing accruals for foreign and state taxes that were no longer deemed necessary. The provision for income taxes for the year ended December 31, 2003 relates primarily to foreign taxes.
35
At December 31, 2004, we had established a valuation allowance of $36.9 million for the net deferred tax assets related to temporary differences, foreign tax credit carryforwards and projected net operating loss carryforwards.
Liquidity and Capital Resources
Net cash used in operating activities was $4.5 million for the year ended December 31, 2005 as compared to $7.3 million for 2004. The decrease in cash flow used in operating activities results primarily from decreases in cash outflows from reduced expenses. This decrease in cash outflows was partially offset by a decrease in cash inflows as the customers of some of our prior time-and-materials consulting engagements completed their projects with us.
Net cash used in investing activities was $17,000 for the year ended December 31, 2005 as compared to net cash provided by investing activities of $10,000 for 2004.
Net cash provided by financing activities was $604,000 for the year ended December 31, 2005 as compared to $273,000 for 2004. Net cash provided by financing activities for the year ended December 31, 2005 included $600,000 from the issuance of promissory notes to three members of our Board of Directors (or investment entities associated with those Directors). See Note 7 of the Notes to Financial Statements for more information. Net cash provided by financing activities also included $36,000 of proceeds from employee stock purchase plan stock issuances. Net cash provided by financing activities for the year ended December 31, 2004 included $142,000 of proceeds from employee stock purchase plan stock issuances, and $146,000 from employee stock option exercises.
Our deferred revenue balance generally results from contractual commitments made by customers to pay amounts to us in advance of revenues earned. We had deferred revenues balances of $2.2 million at December 31, 2005 and $1.1 million at December 31, 2004. When, over time, we recognize these deferred revenue balances as revenues in the statement of operations, we will not have corresponding increases in cash, as the related cash amounts have previously been received by us. Our unbilled accounts receivable represents revenue that we have earned but which we have not yet billed.
As of December 31, 2005, our principal source of liquidity was our cash and cash equivalents of $1.3 million. On March 30, 2006 we completed a capital raising transaction for gross proceeds of approximately $6.3 million (before expenses and repayment of $1.1 million of interim financing obligations). We believe that with the proceeds of this capital transaction, and new sales that we believe that we can close during 2006, we will have sufficient liquidity for our operations during 2006. However, significant challenges and risks remain:
| | • | | We have not been able to generate positive cash flow from operations for the three years ended December 31, 2005. Our net cash used in operating activities was $4.5 million for the year ended December 31, 2005. |
| | • | | For the last several years, we have derived a significant portion of our cash inflows from time-and-materials consulting services performed for a limited number of large customers for whom we were completing enterprise applications development projects. These parties initially became customers of TenFold under our prior business model in earlier years. As these customers completed their initial projects and became self-sufficient, they reduced their purchases of time-and-materials consulting services (although most continue to purchase support from us and other services from time to time). These reductions have materially reduced our cash inflows. The last of these large time-and-materials consulting engagements was substantially completed during the quarter ended March 31, 2005. |
| | • | | We have experienced difficulty closing substantial new sales, and it is unclear when or if we can expect to predictably close material sales to new or existing customers, and to achieve and sustain positive cash flow from operations. Under the leadership of our new Chief Executive Officer, Robert W. Felton, we have recently changed our business model to focus on selling larger consulting projects, instead of the smaller prototype application projects that we primarily sold in 2005. Although we expect to be more successful with this new model, we have limited experience with the new model as we have introduced it only recently, and have not yet closed any sales under this model. If we do not close significant sales in 2006, the funds from our recent capital raising will not be sufficient to fund our operations through all of 2006. |
36
There can be no assurance that we will be successful closing sufficient new sales and these risks may have a materially adverse affect on our future cash flow and operations.
See “Risk Factors” for more information about risks facing TenFold.
Disclosure about Contractual Obligations
The following table sets forth certain contractual obligations recorded in the audited financial statements as of December 31, 2005 and summary information is presented in the following table (in thousands):
| | | | | | | | | | | | | |
Contractual Obligations | | Total | | Less
than 1
year | | 1-3
years | | 4-5
years | | More
than 5
years |
Long-term debt | | $ | — | | | — | | | — | | — | | — |
Capital lease obligations | | | 47 | | | 37 | | | 10 | | — | | — |
Operating lease obligations | | | 741 | | | 442 | | | 299 | | — | | — |
Notes payable | | | 615 | | | 615 | | | — | | — | | — |
Purchase obligations | | | 11 | | | 11 | | | — | | — | | — |
Other long term liabilities reflected on the registrant’s Balance Sheet under GAAP | | | — | | | — | | | — | | — | | — |
| | | | | | | | | | | | | |
Total | | $ | 1,414 | | $ | 1,105 | | $ | 309 | | — | | — |
| | | | | | | | | | | | | |
Related Party Transactions
During 2005, we entered into agreements with a new customer, DevonWay, to provide licenses, consulting services, technical support services, and training, for a total of approximately $1.6 million. A long-time member of our Board of Directors and our recently elected Chairman, CEO and President, Robert W. Felton, is the founder and majority shareholder of DevonWay. All disinterested members of our Board of Directors approved of these related party transactions and our general ongoing business relationship with DevonWay.
Our revenues from DevonWay for the year ended December 31, 2005, are license revenues of $160,000, and services and other revenue of $439,000. As of December 31, 2005, we had accounts receivable from DevonWay of $24,500. For the year ended December 31, 2005, we received cash inflows from DevonWay of $1.6 million.
Although we received a $1 million license payment from DevonWay in August 2005, for accounting purposes we have deferred recognition of this revenue until the end of the estimated economic life of the release of EnterpriseTenFold provided to DevonWay, because the license agreement contains a discount that cannot be determined at inception of the agreement. We are using the end of the estimated economic life to recognize the revenue because we do not have vendor specific objective evidence of fair value (“VSOE”) for the related post-contract customer support, due to the discount, and therefore we cannot allocate the revenue until the discount is known at the end of the estimated economic life. For accounting purposes, management estimates that the economic life is 16 months, and as a result no revenue will be recognized from this license until it is all recognized in a lump sum in the latter part of 2006.
On December 23, 2005, we executed a Promissory Note due to Robert W. Felton, our Chairman, President, and Chief Executive Officer, in the amount of $200,000.
On December 23, 2005, we executed a Promissory Note due to Wasatch Investments LLC, an investment entity associated with TenFold Director Robert E. Parsons, Jr., in the amount of $200,000.
37
On December 28, 2005, we executed a Promissory Note due to First Media TF Holdings LLC, an investment entity associated with TenFold Director Ralph W. Hardy, Jr., in the amount of $200,000.
On February 23, 2006, TenFold executed a Promissory Note due to Mr. Felton, in the amount of $250,000.
On March 15, 2006, TenFold executed a Promissory Note due to Mr. Felton, in the amount of $250,000.
These identical Promissory Notes were intended to provide interim financing to TenFold while we sought to secure equity financing. The notes are senior to other TenFold indebtedness and equity, bear interest at 10% and were due upon the earlier to occur of March 31, 2006, the closing of equity financing of $2 million or more, or a liquidation event. We repaid these notes in full in March 2006, upon completing the equity financing transaction described below.
On March 29, 2006, we entered into a Securities Purchase Agreement for the sale of 1,500,000 shares of unregistered convertible preferred stock and warrants. The preferred shares are convertible into 20,315,805 shares of common stock. The warrants are to purchase 10,157,899 shares of common stock at an exercise price of $0.62 per share, with a 5 year term. The transaction generated gross proceeds of approximately $6.3 million (before expenses and repayment of $1.1 million of interim financing obligations). Several members of our Board of Directors (or investment entities associated with them) and an Executive Officer participated in the transaction, providing a total of approximately $4.7 million of the gross proceeds raised:
| • | | Robert W. Felton Trust invested $2 million. We repaid $709,000 of interim financing to Mr. Felton, our Chairman, President, and Chief Executive Officer, from the proceeds of the capital raising. |
| • | | First Media TF Holdings LLC, an investment entity associated with TenFold Director Ralph W. Hardy Jr., invested $2 million. We repaid $205,000 of interim financing to First Media TF Holdings LLC from the proceeds of the capital raising. |
| • | | TenFold Director Steven H. Coltrin invested $500,000. We expect to use approximately $206,000 of the proceeds of the capital raising to pay accounts payable due to his firm, Coltrin & Associates, for marketing and public relations work provided to TenFold in earlier periods. |
| • | | Samer Diab, Vice President, Customer Services, invested $230,000. |
We also repaid $205,000 of interim financing to Wasatch Investments LLC, an investment entity associated with TenFold Director Robert E. Parsons, Jr., from the proceeds of the capital raising.
The disinterested members of our Board of Directors approved these transactions.
Recent Accounting Pronouncements
In December 2004, the FASB issued SFAS No. 153,Exchanges of Nonmonetary Assets, which amends Accounting Principles Board (APB) Opinion No. 29,Accounting for Nonmonetary Transactions. The guidance in APB Opinion 29 is based on the principle that exchanges of nonmonetary assets should be measured based on the fair value of the assets exchanged. The guidance in APB Opinion 29, however, included certain exceptions to that principle. SFAS No. 153 amends APB Opinion 29 to eliminate the exception for nonmonetary exchanges of similar productive assets and replaces it with a general exception for exchanges of nonmonetary assets that do not have commercial substance. A nonmonetary exchange has commercial substance if the future cash flows of the entity are expected to change significantly as a result of the exchange. SFAS No. 153 is effective for fiscal periods beginning after June 15, 2005. The adoption of SFAS No. 153 has not had a material impact on our financial position or results of operations.
In December 2004, the FASB issued SFAS No. 123R,Share-Based Payment, which supersedes APB Opinion No. 25,Accounting for Stock Issued to Employees. SFAS No. 123R focuses primarily on accounting for transactions in which an entity obtains employee services through share-based payment transactions. SFAS
38
No. 123R requires a public entity to measure the cost of employee services received in exchange for the award of equity investments based on the fair value of the award at the date of grant. The cost will be recognized over the period during which an employee is required to provide services in exchange for the award. On April 14, 2005, the Securities and Exchange Commission issued a release announcing the adoption of a new rule delaying the required implementation of SFAS No. 123R. Under this new rule, SFAS No. 123R is effective as of the beginning of the first annual reporting period that begins after June 15, 2005 and, thus, will be effective for us beginning with the first quarter of 2006. We are currently evaluating the impact of SFAS 123R and expect the adoption to have a material impact on our financial position and results of operations. SeeStock-Based Compensation in Note 3 of Notes to Financial Statements for more information related to the pro forma effects on our reported net loss and loss per share of applying the fair value recognition provisions of the previous SFAS 123,Accounting for Stock-Based Compensation, to stock-based employee compensation.
In May 2005, the FASB issued SFAS No. 154,Accounting Changes and Error Corrections. SFAS No. 154 is a replacement of APB No. 20,Accounting Changes, and SFAS No. 3,Reporting Accounting Changes in Interim Financial Statements. SFAS No. 154 provides guidance on the accounting for and reporting of accounting changes and error corrections. It establishes retrospective application as the required method for reporting a change in accounting principle. SFAS No. 154 provides guidance for determining whether retrospective application of a change in accounting principle is impracticable and how to report a change in such circumstances. SFAS No. 154 also provides that a change in method of depreciating or amortizing a long-lived non-financial asset be accounted for as a change in estimate effected by a change in accounting principle, and also provides that correction of errors in previously issued financial statements should be termed a “restatement.” SFAS No. 154 is effective for accounting changes and corrections of errors made in fiscal years beginning after December 15, 2005.
In February 2006, the FASB issued SFAS No. 155,Accounting for Certain Hybrid Instruments, which amends SFAS No. 133,Accounting for Derivative Instruments and Hedging Activities, and SFAS No. 140Accounting for Transfers and Servicing of Financial Assets and Extinguishments of Liabilities. SFAS No. 155 allows financial instruments that have embedded derivatives to be accounted for as a whole (eliminating the need to bifurcate the derivative from its host) if the holder elects to account for the whole instrument on a fair value basis. SFAS No. 155 also clarifies and amends certain other provisions of SFAS No. 133 and SFAS No. 140. This statement is effective for all financial instruments acquired or issued in financial years beginning after September 15, 2006. We do not expect our adoption of this new standard to have a material impact on our financial position, results of operations or cash flows.
39
Item 7A. Quantitative and Qualitative Disclosures about Market Risk
Interest Rate Risk
As of December 31, 2005, we had cash and cash equivalents of $1.3 million, and restricted cash of $74,000. Substantially all of the cash equivalents consist of highly liquid investments with remaining maturities at the date of purchase of less than ninety days. These investments are subject to interest rate risk and will decrease in value if market interest rates increase. A hypothetical increase or decrease in market interest rates by 10 percent from the December 31, 2005 rates would cause the fair value of these cash investments to change by an insignificant amount. We do not invest in any financial derivatives or any other complex financial instruments. TenFold does not own any equity investments. Therefore, we do not currently have any direct equity price risk.
Currency Risk
Our operations include some transactions with customers and partners in the United Kingdom. Some of these transactions are denominated in British pounds. For example, we have had projects in the United Kingdom for which we received payment from our customer in British pounds, and paid a contractor we used in British pounds. As a result, our financial results could be affected by factors such as a change in the foreign currency exchange rate between the U.S. dollar and the British pound, or by weak economic conditions in the United Kingdom. When the U.S. dollar strengthens against the British pound, the value of receivables or payables denominated in British pounds decreases. When the U.S. dollar weakens against the British pound, the value of receivables or payables denominated in British pounds increases. The monetary activities which are impacted by foreign currency fluctuations are cash, accounts receivable, accounts payable, and certain accrued liabilities. A hypothetical 10 percent increase or decrease in the exchange rate between the U.S. dollar and the British pound from the December 31, 2005 rate would cause the fair value of such monetary assets and liabilities denominated in British pounds to change by an insignificant amount. We are not currently engaged in any foreign currency hedging activities.
40
Item 8. Financial Statements and Supplementary Data
The responses to this item are submitted in other sections of this Form 10-K. See Item 6 for Supplementary Data. See Item 15 for Financial Statements.
Item 9. Changes In and Disagreements with Accountants on Accounting and Financial Disclosure
None.
Item 9A. Controls and Procedures
Evaluation of Disclosure Controls and Procedures. Our Chief Executive Officer and our Chief Financial Officer, after evaluating the effectiveness of our “disclosure controls and procedures” (as defined in the Securities Exchange Act of 1934 (Exchange Act) Rules 13a-15(e) or 15d-15(e)) as of the end of the period covered by this annual report, have concluded that our disclosure controls and procedures are effective based on their evaluation of these controls and procedures required by paragraph (b) of Exchange Act Rules 13a-15 or 15d-15.
Changes in Internal Control over Financial Reporting. There were no changes in our internal control over financial reporting that occurred during our last fiscal quarter that have materially affected, or are reasonably likely to materially affect, our internal control over financial reporting.
Item 9B. Other Information
None.
41
Part III
Certain information required by Part III is omitted from this Report on Form 10-K since we will file a definitive Proxy pursuant to Regulation 14A of the Securities Exchange Act of 1934, as amended (the “Proxy Statement”), not later than 120 days after the end of the fiscal year covered by this Report, and certain information included in the Proxy Statement is incorporated herein by reference.
Item 10. Directors and Executive Officers of the Registrant
(a) Executive Officers
The information required by this Item is incorporated by reference to the section entitled “Executive Officers” in Part I of this Form 10-K and by reference to the Section entitled “Code of Ethics” in the Proxy Statement.
(b) Directors
The information required by this Item is incorporated by reference to the sections entitled “Board of Directors” and “Nominations” in the Proxy Statement.
(c) Section 16
The information required by this Item is incorporated by reference to the section entitled “Section 16 (a) Beneficial Ownership Reporting Compliance” in the Proxy Statement.
Item 11. Executive Compensation
The information required by this Item is incorporated by reference to the section entitled “Executive Compensation” in the Proxy Statement.
Item 12. Security Ownership of Certain Beneficial Owners and Management and Related Stockholder Matters
The information required by this Item is incorporated by reference to the section entitled “Equity Compensation Plan Information” in Part II of this Form 10-K and by reference to the section entitled “Security Ownership of Certain Beneficial Owners and Management” in the Proxy Statement.
Item 13. Certain Relationships and Related Transactions
The information required by this Item is incorporated by reference to the section entitled “Certain Transactions” in the Proxy Statement.
Item 14. Principal Accountant Fees and Services
The information required by this Item is incorporated by reference to the section entitled “Independent Public Accountants” in the Proxy Statement.
42
Part IV
Item 15. Exhibits, Financial Statement Schedules.
| | 1. | Financial Statements and Notes to Financial Statements |
The following financial statements are filed as part of this report:
TENFOLD CORPORATION
INDEX TO FINANCIAL STATEMENTS
| | 2. | Financial Statement Schedule |
The following financial statement schedule is filed as a part of this report:
Schedule II – Valuation and Qualifying Accounts for the Years Ended December 31, 2005, 2004, and 2003
All other schedules are omitted because they are not required or the required information is shown in the financial statements or notes thereto.
43
3. Exhibits. The following is a list of exhibits required by Item 601 of Regulation S-K filed as part of this Form 10-K. Where so indicated by footnote, exhibits which were previously filed are incorporated by reference. For exhibits incorporated by reference, the location of the exhibit in the previous filing is indicated in parentheses.
| | |
| Number | | Description |
| |
| 3.2** | | Fourth Amended and Restated Certificate of Incorporation of TenFold. (1) |
| |
| 3.3 | | Certificate of Designations of Convertible Preferred Class A Stock. |
| |
| 3.4** | | Bylaws of TenFold. (1) |
| |
| 3.5** | | Amendment to Bylaws dated March 2, 1999. (3) |
| |
| 3.6** | | Amendment to Bylaws dated May 19, 2005. (15) |
| |
| 4.1** | | Reference is made to Exhibits 3.2, 3.3, 3.4, 3.5 and 3.6. (1) and (3) |
| |
| 4.2** | | Specimen Stock Certificate. (1) |
| |
| 4.3** | | Amended and Restated Investors’ Rights Agreement dated November 24, 1997, as Amended, by and among TenFold, Gary D. Kennedy, Jeffrey L. Walker, the Walker Children’s Trust and the Investors (as defined therein). (1) |
| |
| 4.4** | | Form of Securities Purchase Agreement dated December 22, 2003, between Registrant and purchasers of stock (12) |
| |
| 4.5** | | Form of Amendment No. 1 to Securities Purchase Agreement dated December 22, 2003, between Registrant and purchasers of stock (13) |
| |
| 4.6 | | Form of Securities Purchase Agreement dated March 29, 2006, between Registrant and purchasers of securities. |
| |
| 4.7 | | Form of Warrant issued pursuant to the Securities Purchase Agreement, dated March 29, 2006, between Registrant and purchasers of securities. |
| |
| 10.1** | | Form of Indemnification Agreement between TenFold and an executive officer and its directors. (1) |
| |
| 10.2**# | | 1993 Flexible Stock Incentive Plan, as amended. (2) |
| |
| 10.3**# | | 1999 Stock Plan, as amended. (8) |
| |
| 10.4**# | | 1999 Employee Stock Purchase Plan, as amended. (8) |
| |
| 10.5**# | | 2000 Employee Stock Option Plan. (5) |
| |
| 10.6** | | Restructuring Agreement effective December 8, 2000 between Perot Systems Corporation and TenFold. (5) |
| |
| 10.7** | | Lease Agreement effective April 28, 2000 between Boyer Jordan Valley 1, L.C. and TenFold. (4) |
| |
| 10.8** | | First Amendment to Lease Agreement effective November 30, 2000 between Boyer Jordan Valley 1, L.C. and TenFold. (5) |
| |
| 10.9** | | Second Amendment to Lease Agreement between Boyer Jordan Valley 1, L.C. and TenFold. (9) |
| |
| 10.10** | | Third Amendment to Lease Agreement Between Boyer Jordan Valley 1, L.C. and TenFold. (10) |
| |
| 10.11**# | | Employment Agreement between TenFold and Nancy M. Harvey. (6) |
| |
| 10.12**# | | Amendment to Employment Agreement TenFold Corporation and Nancy M. Harvey. (8) |
| |
| 10.13**# | | Amendment No. 2 to Employment Agreement between TenFold and Nancy M. Harvey. (9) |
| |
| 10.14**# | | Amendment No. 3 to Employment Agreement between TenFold and Nancy M. Harvey. (12) |
| |
| 10.15**# | | Amendment No. 4 to Employment Agreement between TenFold and Nancy M. Harvey. (14) |
| |
| 10.16**# | | Restricted Stock Bonus Agreement Between TenFold and Nancy M. Harvey. (7) |
| |
| 10.17** | | Master Software License and Services Agreement, dated September 27, 1999, as amended, between TenFold and Allstate Insurance Company. (9) |
| |
| 10.18** | | Stock Issuance Agreement and Release, dated as of February 5, 2003, between TenFold and the Robert W. Felton Trust. (11) |
| |
| 10.19** | | Placement Agent Agreement dated December 12, 2003 between Registrant and Brean Murray & Co., Inc. (13) |
| |
| 11* | | Computation of Shares used in Computing Basic and Diluted Net Income (Loss) Per Share. |
| |
| 23.1 | | Consent of Tanner LC. |
| |
| 31.1 | | Certification of the Chief Executive Officer pursuant to Section 302 of the Sarbanes-Oxley Act of 2002. |
| |
| 31.2 | | Certification of the Chief Financial Officer pursuant to Section 302 of the Sarbanes-Oxley Act of 2002. |
| |
| 32.1 | | Certification of the Chief Executive Officer pursuant to Section 906 of the Sarbanes-Oxley Act of 2002. |
| |
| 32.2 | | Certification of the Chief Financial Officer pursuant to Section 906 of the Sarbanes-Oxley Act of 2002. |
44
| * | Incorporated by reference to “Notes to Financial Statements” herein |
| # | Indicates management contract or compensatory plan or arrangement |
| 1) | Filed on March 8, 1999 as an exhibit to the Company’s Registration Statement on Form S-1 and incorporated by reference. |
| 2) | Filed on April 20, 1999 as an exhibit to Amendment No. 1 to the Company’s Registration Statement on Form S-1 and incorporated by reference. |
| 3) | Filed on May 18, 1999 as an exhibit to Amendment No. 4 to the Company’s Registration Statement on Form S-1 and incorporated by reference. |
| 4) | Filed on May 5, 2000 as an exhibit to the Company’s Quarterly Report on Form 10-Q and incorporated by reference. |
| 5) | Filed on April 12, 2001 as an exhibit to the Company’s Annual Report on Form 10-K and incorporated by reference. |
| 6) | Filed on May 21, 2001 as an exhibit to the Company’s Quarterly Report on Form 10-Q and incorporated by reference. |
| 7) | Filed on July 27, 2001 as an exhibit to the Company’s Quarterly Report on Form 10-Q and incorporated by reference. |
| 8) | Filed on April 15, 2002 as an exhibit to the Company’s Annual Report on Form 10-K and incorporated by reference. |
| 9) | Filed on August 14, 2002 as an exhibit to the Company’s Quarterly Report on Form 10-Q and incorporated by reference. |
| 10) | Filed on November 19, 2002 as an exhibit to the Company’s Quarterly Report on Form 10-Q and incorporated by reference. |
| 11) | Filed on March 31, 2003 as an exhibit to the Company’s Annual Report on Form 10-K and incorporated by reference. |
| 12) | Filed on May 13, 2003 as an exhibit to the Company’s Quarterly Report on Form 10-Q and incorporated by reference. |
| 13) | Filed on December 23, 2003 as an exhibit to the Company’s Report on Form 8-K and incorporated by reference. |
| 14) | Filed on March 22, 2004 as an exhibit to the Company’s Report on Form 10-K and incorporated by reference. |
| 15) | Filed on August 15, 2005 as an exhibit to the Company’s Quarterly Report on Form 10-Q and incorporated by reference. |
45
REPORT OF REGISTERED INDEPENDENT PUBLIC ACCOUNTING FIRM
Board of Directors and Stockholders
TenFold Corporation:
We have audited the balance sheets of TenFold Corporation as of December 31, 2005 and 2004 and the related statements of operations, stockholders equity and cash flows for each of the three years in the period ended December 31, 2005. In connection with our audits of the financial statements, we also have audited the financial statement schedule as of December 31, 2005 and 2004 and for the three years then ended as listed in Item 15.2 of the accompanying index. These financial statements and financial statement schedule are the responsibility of the Company’s management. Our responsibility is to express an opinion on these financial statements and financial statement schedule based on our audits.
We conducted our audits in accordance with standards of the Public Company Accounting Oversight Board (United States). Those standards require that we plan and perform the audit to obtain reasonable assurance about whether the financial statements are free of material misstatement. An audit includes examining, on a test basis, evidence supporting the amounts and disclosures in the financial statements. An audit also includes assessing the accounting principles used and significant estimates made by management, as well as evaluating the overall financial statement presentation. We believe that our audits provide a reasonable basis for our opinion.
In our opinion, the financial statements referred to above present fairly, in all material respects, the financial position of TenFold Corporation as of December 31, 2005 and 2004, and the results of their operations and their cash flows for the three years ended December 31, 2005, in conformity with accounting principles generally accepted in the United States of America. Also in our opinion, the related financial statement schedule as of and for the three years ended December 31, 2005, when considered in relation to the basic financial statements taken as a whole, presents fairly, in all material respects, the information set forth therein.
The accompanying financial statements and schedule referred to above have been prepared assuming that the Company will continue as a going concern. As discussed in Note 2 to the financial statements, the Company has used significant balances of its cash in operating activities and at present levels of cash consumption will not have sufficient resources to meet operating needs. This raises substantial doubt about the Company’s ability to continue as a going concern. Management’s plans in regard to these matters are also described in Note 2. The financial statements and schedule do not include any adjustments that might result from the outcome of this uncertainty.
/s/ Tanner LC.
Salt Lake City, Utah
March 31, 2006
46
TENFOLD CORPORATION
BALANCE SHEETS
(in thousands, except share data)
| | | | | | | | |
| | | December 31, | |
| | | 2005 | | | 2004 | |
| Assets | | | | | | | | |
Current assets: | | | | | | | | |
Cash and cash equivalents | | $ | 1,344 | | | $ | 5,225 | |
Accounts receivable, (net of allowances for doubtful accounts of $9 and $29, respectively) (includes related party receivable of $25 and $0, respectively) | | | 209 | | | | 240 | |
Unbilled accounts receivable, (net of allowances for doubtful accounts of $0 and $3, respectively) | | | 2 | | | | 74 | |
Prepaid expenses and other assets | | | 161 | | | | 176 | |
| | | | | | | | |
Total current assets | | | 1,716 | | | | 5,715 | |
| | | | | | | | |
Restricted cash | | | 74 | | | | 74 | |
Property and equipment, net | | | 352 | | | | 626 | |
| | | | | | | | |
Total assets | | $ | 2,142 | | | $ | 6,415 | |
| | | | | | | | |
| Liabilities and Stockholders’ Equity | | | | | | | | |
Current liabilities: | | | | | | | | |
Accounts payable | | $ | 483 | | | $ | 265 | |
Income taxes payable | | | 250 | | | | 1,340 | |
Accrued liabilities | | | 1,492 | | | | 1,406 | |
Deferred revenue | | | 2,218 | | | | 1,062 | |
Current installments of obligations under capital leases | | | 35 | | | | 25 | |
Notes payable – related parties | | | 600 | | | | — | |
| | | | | | | | |
Total current liabilities | | | 5,078 | | | | 4,098 | |
| | | | | | | | |
Long-term liabilities: | | | | | | | | |
Obligations under capital leases, excluding current installments | | | 10 | | | | 36 | |
| | | | | | | | |
Total long-term liabilities | | | 10 | | | | 36 | |
| | | | | | | | |
Commitments and contingencies | | | | | | | | |
| | |
Stockholders’ equity: | | | | | | | | |
Common stock, $0.001 par value:
Authorized: 120,000,000 shares
Issued and outstanding shares: 46,445,749 shares at December 31, 2005 and 46,377,219 shares at December 31, 2004 | | | 46 | | | | 46 | |
Additional paid-in capital | | | 76,411 | | | | 76,218 | |
Deferred compensation | | | (6 | ) | | | (20 | ) |
Accumulated deficit | | | (79,397 | ) | | | (73,963 | ) |
| | | | | | | | |
Total stockholders’ equity (deficit) | | | (2,946 | ) | | | 2,281 | |
| | | | | | | | |
Total liabilities and stockholders’ equity | | $ | 2,142 | | | $ | 6,415 | |
| | | | | | | | |
The accompanying notes to financial statements are an integral part of these financial statements
47
TENFOLD CORPORATION
STATEMENTS OF OPERATIONS
(in thousands, except per share data)
| | | | | | | | | | | | |
| | | Year Ended December 31, | |
| | | 2005 | | | 2004 | | | 2003 | |
Revenues: | | | | | | | | | | | | |
License | | $ | 515 | | | $ | 359 | | | $ | 248 | |
Subscription | | | — | | | | — | | | | 10,431 | |
Services and other | | | 5,195 | | | | 17,234 | | | | 17,030 | |
| | | | | | | | | | | | |
Total revenues | | | 5,710 | | | | 17,593 | | | | 27,709 | |
| | | | | | | | | | | | |
Operating expenses: | | | | | | | | | | | | |
Cost of revenues | | | 2,940 | | | | 5,883 | | | | 9,454 | |
Sales and marketing | | | 2,896 | | | | 2,861 | | | | 1,088 | |
Research and development | | | 3,531 | | | | 3,734 | | | | 3,471 | |
General and administrative | | | 2,986 | | | | 2,315 | | | | 3,046 | |
Special charges | | | — | | | | — | | | | (673 | ) |
| | | | | | | | | | | | |
Total operating expenses | | | 12,353 | | | | 14,793 | | | | 16,386 | |
| | | | | | | | | | | | |
Income (loss) from operations | | | (6,643 | ) | | | 2,800 | | | | 11,323 | |
| | | | | | | | | | | | |
Other income (expense): | | | | | | | | | | | | |
Interest income | | | 60 | | | | 92 | | | | 50 | |
Interest expense | | | (7 | ) | | | (10 | ) | | | (173 | ) |
Other income | | | 84 | | | | 158 | | | | 373 | |
Gain on retirement of debt | | | — | | | | — | | | | 2,206 | |
| | | | | | | | | | | | |
Total other income, net | | | 137 | | | | 240 | | | | 2,456 | |
| | | | | | | | | | | | |
Income (loss) before income taxes | | | (6,506 | ) | | | 3,040 | | | | 13,779 | |
Provision (benefit) for income taxes | | | (1,072 | ) | | | (376 | ) | | | 32 | |
| | | | | | | | | | | | |
Net income (loss) | | $ | (5,434 | ) | | $ | 3,416 | | | $ | 13,747 | |
| | | | | | | | | | | | |
Basic earnings (loss) per common share | | $ | (0.12 | ) | | $ | 0.07 | | | $ | 0.34 | |
| | | | | | | | | | | | |
Diluted earnings (loss) per common share | | $ | (0.12 | ) | | $ | 0.06 | | | $ | 0.29 | |
| | | | | | | | | | | | |
Weighted average common and common equivalent Shares used to calculate earnings (loss) per share: | | | | | | | | | | | | |
| | | |
Basic | | | 46,423 | | | | 46,204 | | | | 40,634 | |
| | | | | | | | | | | | |
Diluted | | | 46,423 | | | | 54,924 | | | | 47,623 | |
| | | | | | | | | | | | |
The accompanying notes to financial statements are an integral part of these financial statements
48
TENFOLD CORPORATION
STATEMENTS OF CHANGES IN STOCKHOLDERS’ EQUITY
(in thousands, except share data)
| | | | | | | | | | | | | | | | | | | | | | |
| | | Common Stock | | Additional Paid-in
Capital | | | Deferred
Compensation | | | Accumulated
Deficit | | | Total Stockholders’ Equity (Deficit) | |
| | Shares | | | Amount | | | | |
Balance at December 31, 2002 | | 37,382,080 | | | $ | 37 | | $ | 65,953 | | | $ | (89 | ) | | $ | (91,126 | ) | | $ | (25,225 | ) |
| | | | | | | | | | | | | | | | | | | | | | |
Common stock issued upon exercise of options | | 283,988 | | | | — | | | 173 | | | | — | | | | — | | | | 173 | |
Common stock issued for ESPP | | 47,478 | | | | — | | | 6 | | | | — | | | | — | | | | 6 | |
Restricted common stock issued | | 8,888,889 | | | | 9 | | | 9,741 | | | | — | | | | — | | | | 9,750 | |
Restricted stock cancelled | | (632,911 | ) | | | — | | | — | | | | — | | | | — | | | | — | |
Amortization of deferred compensation | | — | | | | — | | | — | | | | 109 | | | | — | | | | 109 | |
Cancellation of stock options | | — | | | | — | | | (9 | ) | | | 9 | | | | — | | | | — | |
Deferred compensation related to grants of stock options | | — | | | | — | | | 72 | | | | (72 | ) | | | — | | | | — | |
Net income | | — | | | | — | | | — | | | | — | | | | 13,747 | | | | 13,747 | |
| | | | | | | | | | | | | | | | | | | | | | |
Balance at December 31, 2003 | | 45,969,524 | | | $ | 46 | | $ | 75,936 | | | $ | (43 | ) | | $ | (77,379 | ) | | $ | (1,440 | ) |
| | | | | | | | | | | | | | | | | | | | | | |
Common stock issued upon exercise of options | | 297,639 | | | | — | | | 146 | | | | — | | | | — | | | | 146 | |
Common stock issued for ESPP and other | | 110,056 | | | | — | | | 142 | | | | — | | | | — | | | | 142 | |
Amortization of deferred compensation | | — | | | | — | | | — | | | | 17 | | | | — | | | | 17 | |
Cancellation of stock options | | — | | | | — | | | (6 | ) | | | 6 | | | | — | | | | — | |
Net income | | — | | | | — | | | — | | | | — | | | | 3,416 | | | | 3,416 | |
| | | | | | | | | | | | | | | | | | | | | | |
Balance at December 31, 2004 | | 46,377,219 | | | $ | 46 | | $ | 76,218 | | | $ | (20 | ) | | $ | (73,963 | ) | | $ | 2,281 | |
| | | | | | | | | | | | | | | | | | | | | | |
Common stock issued for ESPP and other | | 68,530 | | | | — | | | 36 | | | | — | | | | — | | | | 36 | |
Amortization of deferred compensation | | — | | | | — | | | — | | | | 171 | | | | — | | | | 171 | |
Deferred compensation related to modification of stock options | | — | | | | — | | | 157 | | | | (157 | ) | | | — | | | | — | |
Net loss | | — | | | | — | | | — | | | | — | | | | (5,434 | ) | | | (5,434 | ) |
| | | | | | | | | | | | | | | | | | | | | | |
Balance at December 31, 2005 | | 46,445,749 | | | $ | 46 | | $ | 76,411 | | | $ | (6 | ) | | $ | (79,397 | ) | | $ | (2,946 | ) |
| | | | | | | | | | | | | | | | | | | | | | |
The accompanying notes to financial statements are an integral part of these financial statements
49
TENFOLD CORPORATION
STATEMENTS OF CASH FLOWS
(in thousands)
| | | | | | | | | | | | |
| | | Year Ended December 31, | |
| | | 2005 | | | 2004 | | | 2003 | |
Cash flows from operating activities: | | | | | | | | | | | | |
Net income (loss) | | $ | (5,434 | ) | | $ | 3,416 | | | $ | 13,747 | |
Adjustments to reconcile net income (loss) to net cash used in operating activities: | | | | | | | | | | | | |
Depreciation and amortization | | | 305 | | | | 356 | | | | 766 | |
Provision (reversal) to bad debt reserve | | | (19 | ) | | | 33 | | | | 6 | |
Amortization of deferred compensation | | | 171 | | | | 17 | | | | 109 | |
Gain on retirement of debt | | | — | | | | — | | | | (2,206 | ) |
(Gain) loss on sale of property and equipment | | | 2 | | | | (62 | ) | | | (113 | ) |
Changes in operating assets and liabilities: | | | | | | | | | | | | |
Accounts receivable | | | 40 | | | | 672 | | | | 422 | |
Unbilled accounts receivable | | | 82 | | | | (19 | ) | | | (27 | ) |
Prepaid expenses and other assets | | | 15 | | | | 77 | | | | 2,051 | |
Accounts payable | | | 218 | | | | (862 | ) | | | 190 | |
Income taxes payable, net | | | (1,090 | ) | | | (388 | ) | | | 2 | |
Accrued liabilities | | | 86 | | | | (4,010 | ) | | | (1,020 | ) |
Deferred revenue | | | 1,156 | | | | (6,524 | ) | | | (12,742 | ) |
Other current and long-term liabilities | | | — | | | | — | | | | (2,053 | ) |
| | | | | | | | | | | | |
Net cash used in operating activities | | | (4,468 | ) | | | (7,294 | ) | | | (868 | ) |
| | | | | | | | | | | | |
Cash flows from investing activities: | | | | | | | | | | | | |
Additions to property and equipment | | | (19 | ) | | | (52 | ) | | | (178 | ) |
(Additions) decreases to restricted cash | | | — | | | | (1 | ) | | | 65 | |
Proceeds from sale of property and equipment | | | 2 | | | | 63 | | | | 137 | |
| | | | | | | | | | | | |
Net cash provided by (used in) investing activities | | | (17 | ) | | | 10 | | | | 24 | |
| | | | | | | | | | | | |
Cash flows from financing activities: | | | | | | | | | | | | |
Proceeds from employee stock purchase plan stock issuance | | | 36 | | | | 142 | | | | 6 | |
Exercise of common stock options | | | — | | | | 146 | | | | 173 | |
Principal payments on obligations under capital lease | | | (32 | ) | | | (15 | ) | | | (687 | ) |
Proceeds from issuance of notes payable | | | 600 | | | | — | | | | — | |
Proceeds from issuance of restricted stock | | | — | | | | — | | | | 9,750 | |
| | | | | | | | | | | | |
Net cash provided by financing activities | | | 604 | | | | 273 | | | | 9,242 | |
| | | | | | | | | | | | |
Net increase (decrease) in cash and cash equivalents | | | (3,881 | ) | | | (7,011 | ) | | | 8,398 | |
Cash and cash equivalents at beginning of year | | | 5,225 | | | | 12,236 | | | | 3,838 | |
| | | | | | | | | | | | |
Cash and cash equivalents at end of year | | $ | 1,344 | | | $ | 5,225 | | | $ | 12,236 | |
| | | | | | | | | | | | |
Supplemental disclosure of cash flow information: | | | | | | | | | | | | |
Cash paid for income taxes | | $ | 19 | | | $ | 24 | | | $ | 32 | |
Cash paid for interest | | | 4 | | | | 3 | | | | 8 | |
| | | |
Non cash investing and financing activities: | | | | | | | | | | | | |
Deferred compensation related to grants of stock or stock options | | $ | 157 | | | $ | — | | | $ | 72 | |
Equipment purchased under capital leases | | | 16 | | | | 76 | | | | — | |
The accompanying notes to financial statements are an integral part of these financial statements
50
TENFOLD CORPORATION
NOTES TO FINANCIAL STATEMENTS
1. Nature of Operations
TenFold provides services and technology for building complex, Service Oriented Architecture (“SOA”)-compliant, mission-critical applications. We believe that with TenFold’s technology, EnterpriseTenFold, applications can be created in significantly less time and cost than using traditional development technologies and that customers will experience significantly reduced ongoing applications maintenance and enhancement costs compared to what they generally experience with legacy applications. Our business model focuses on providing applications development services and our EnterpriseTenFold technology, support and training, to customers who can use a TenFold team or their own business teams to build and maintain applications.
TenFold sells its products and services primarily to customers in the United States, but it currently has a small number of customers outside the United States.
TenFold was incorporated in the state of Delaware in February 1993.
2. Going Concern and Liquidity
Our financial statements have been prepared under the assumption that TenFold will continue as a going concern. The independent auditors’ opinion on our December 31, 2005 financial statements includes an explanatory paragraph relating to our ability to continue as a going concern.
As of December 31, 2005, our principal source of liquidity was our cash and cash equivalents of $1.3 million. On March 30, 2006 we completed a capital raising transaction for gross proceeds of approximately $6.3 million (before expenses and repayment of $1.1 million of interim financing obligations). We believe that with the proceeds of this capital transaction, and new sales that we believe that we can close during 2006, we will have sufficient liquidity for our operations during 2006. However, significant challenges and risks remain:
| | • | | We have not been able to generate positive cash flow from operations for the three years ended December 31, 2005. Our net cash used in operating activities was $4.5 million for the year ended December 31, 2005. |
| | • | | For the last several years, we have derived a significant portion of our cash inflows from time-and-materials consulting services performed for a limited number of large customers for whom we were completing enterprise applications development projects. These parties initially became customers of TenFold under our prior business model in earlier years. As these customers completed their initial projects and became self-sufficient, they reduced their purchases of time-and-materials consulting services (although most continue to purchase support from us and other services from time to time). These reductions have materially reduced our cash inflows. The last of these large time-and-materials consulting engagements was substantially completed during the quarter ended March 31, 2005. |
| | • | | We have experienced difficulty closing substantial new sales, and it is unclear when or if we can expect to predictably close significant sales to new or existing customers, and to achieve and sustain positive cash flow from operations. Under the leadership of our new Chief Executive Officer, Robert W. Felton, we have recently changed our business model to focus on selling larger consulting projects, instead of the smaller prototype application projects that we primarily sold in 2005. Although we expect to be more successful with this new model, we have limited experience with the new model as we have introduced it only recently, and have not yet closed any sales under this model. If we do not close significant sales in 2006, the funds from our recent capital raising will not be sufficient to fund our operations through all of 2006. |
51
TENFOLD CORPORATION
NOTES TO FINANCIAL STATEMENTS
There can be no assurance that we will be successful closing sufficient new sales and these risks may have a materially adverse affect on our future cash flow and operations.
3. Significant Accounting Policies
Basis of Presentation
As used herein, “TenFold,” the “Company,” “we,” “our” and similar terms refer to TenFold Corporation, unless the context indicates otherwise.
Use of Estimates
The preparation of financial statements in conformity with accounting principles generally accepted in the United States requires management to make estimates and assumptions, including for example, estimated project costs and profitability and accounts receivable allowances. These assumptions affect the reported amounts of assets and liabilities and disclosure of contingent assets and liabilities at the date of the financial statements and the reported amounts of revenues and expenses during the reporting period. Actual results could differ from these estimates.
We believe risks relating to revenue recognition include the judgment required to determine project profit or loss projections on time-and-material contracts. We recognize time-and-materials revenue at the lowest point in the range of estimated profit margin, which represents our best estimate of the profit to be achieved. Variances may occur if we are unable to collect time-and-materials billings or if we grant concessions to time-and-materials customers in order to sell additional business or collect cash under the contract. As we occasionally provide services on a fixed price basis, risks relating to revenue recognition also include the judgment and estimation required to determine fixed-price project completion percentages, and fixed-price project profit or loss projections. Variances between management’s estimates and actual results may result in significant adjustments to our results of operations and financial position.
For a license agreement that we executed in August 2005 that contains a discount that cannot be determined at the inception of the agreement, we expect to recognize the related license revenue at the end of the estimated economic life of the release of EnterpriseTenFold provided to the customer. We are using the end of the estimated economic life to recognize the revenue because we do not have vendor specific objective evidence of fair value (“VSOE”) for the related post-contract customer support, due to the discount, and therefore we cannot allocate the revenue until the discount is known at the end of the estimated economic life. For accounting purposes, management estimates that the economic life is 16 months after considering factors such as the rapid pace of technological change in the software industry generally and particularly in TenFold’s market, the pace at which TenFold produces new releases of TenFold technology with substantial technological improvements, and the pace at which TenFold’s customers adopt new releases of TenFold technology.
We review asserted litigation claims each quarter to determine the likelihood that the claim will result in a loss. Significant management judgment is required to conclude on the likely outcome of outstanding litigation. If a loss is probable on a litigation claim, management estimates the loss and we accrue the estimated loss. If a loss is considered probable but cannot be reasonably estimated, we disclose the contingency in the notes to our financial statements. Losses may result on litigation claims that are not considered probable or are not estimable at the current time, potentially having a significant impact on future financial results.
52
TENFOLD CORPORATION
NOTES TO FINANCIAL STATEMENTS
Revenue Recognition
We derive revenues from license fees, applications development and implementation consulting services, support, and training services. License revenues consist of fees for licensing EnterpriseTenFold (formerly known as Universal Application) as an applications development tool. Service revenues consist of fees for applications development and implementation consulting, support and training. Other revenues include fees for reimbursement of out of pocket expenses incurred for customer projects.
We follow the provisions of Statement of Position (“SOP”) 97-2, Software Revenue Recognition, as modified by SOP 98-9,Modification of SOP 97-2 with Respect to Certain Transactions, and SOP 81-1,Accounting for Performance of Construction-Type and Certain Production-Type Contracts, in recognizing revenue under each of our contracts.
We generally enter into contracts that involve multiple elements, such as software products, enhancements, post-contract customer support (“PCS”), training, and time-and-material services. For accounting purposes, we allocate a portion of the contract fee to each undelivered element based on the relative fair values of the elements and allocate the fee for delivered software products using the residual method. The fair values of an element must be based on VSOE. We establish VSOE based on the price charged when the same element is sold separately. VSOE for services is based on standard rates for the individuals providing services. These rates are the same rates charged when the services are sold separately under time-and-materials contracts. We base VSOE for training on standard rates charged for each particular training course. These rates are the rates charged when the training is sold separately for supplemental training courses. For PCS, VSOE is determined by reference to the renewal rate we charge the customer in future periods.
As a result, the amounts allocated to individual contract elements (such as license, consulting, training and support) for accounting purposes may differ from the amounts stated in the contract for those individual elements, but not in total.
For time-and-materials contracts, we generally estimate a profit range and recognize the related revenue using the lowest probable level of profit estimated in the range. Billings in excess of revenue recognized under time-and-material contracts are deferred and recognized upon completion of the time-and-materials contract or when the results can be estimated more precisely.
We recognize support revenue from contracts for ongoing technical support and product updates ratably over the support period. We recognize training revenue as we perform the services.
We recognize license revenues from EnterpriseTenFold licenses that do not include services or where the related services are not considered essential to the functionality of the software, when the following criteria are met: we have signed a noncancellable license agreement with nonrefundable fees; we have shipped the software product; there are no uncertainties surrounding product acceptance; the fees are fixed and determinable; and collection is considered probable. This policy applies both when the licenses are sold separately or when an EnterpriseTenFold license is sold with an applications development project. Services relating to the licenses typically include post contract customer support services, general time-and-materials consulting, and training; and do not add significant functionality, features, or significantly alter the software. In addition, similar services are available from other vendors; there are no milestones or customer specific acceptance criteria which affect the realizability of the software license fee; and the software license fee is non-cancelable and non-refundable.
For software arrangements that include a service element that is considered essential to the functionality of the software, we recognize license fees related to the application, and the
53
TENFOLD CORPORATION
NOTES TO FINANCIAL STATEMENTS
applications development service fees, over time as we perform the services, using the percentage-of-completion method of accounting and following the guidance in Statement of Position (“SOP”) 81-1,Accounting for Performance of Construction-Type and Certain Production-Type Contracts. We make adjustments, if necessary, to the estimates used in the percentage-of-completion method of accounting as work progresses under the contract and as we gain experience. Fixed-price project revenues are split between license and service based upon the relative fair value of the components.
For certain projects, we limit revenue recognition in the period to the amount of project costs incurred in the same period, resulting in zero profit during the period, and postpone recognition of profits until results can be estimated more precisely.
For certain contracts for which reasonably dependable estimates cannot be made or for which inherent hazards make estimates doubtful, we recognize revenue under the completed-contract method of contract accounting.
For license agreements that contain a discount that cannot be determined at the inception of the agreement, we recognize the related license revenue at the end of the estimated economic life of the release of the software version provided to the customer. We use the end of the estimated economic life to recognize the revenue when we do not VSOE for the related post-contract customer support, due to the discount, and therefore we cannot allocate the revenue until the discount is known at the end of the estimated economic life.
We record billings and cash received in excess of revenue earned as deferred revenue. Our deferred revenue balance generally results from contractual commitments made by customers to pay amounts to us in advance of revenues earned. Our unbilled accounts receivable represents revenue that we have earned but which we have not yet billed. We bill customers as payments become due under the terms of the customer’s contract. We consider current information and events regarding our customers and their contracts and establish allowances for doubtful accounts when it is probable that we will be unable to collect amounts due under the terms of existing contracts.
The following table sets forth, for the periods indicated, the revenue recognized by type (in thousands):
| | | | | | | | | |
| | | Year ended December 31, |
| | | 2005 | | 2004 | | 2003 |
EnterpriseTenFold license revenue | | $ | 515 | | $ | 209 | | $ | 198 |
Other license revenue | | | — | | | 150 | | | 50 |
| | | | | | | | | |
Total license revenues | | $ | 515 | | $ | 359 | | $ | 248 |
| | | |
Subscription revenue | | $ | — | | $ | — | | $ | 10,431 |
| | | |
Percentage-of-completion and completed-contract service revenue | | $ | 803 | | $ | 8,426 | | $ | 254 |
Time-and-materials service revenue | | | 2,102 | | | 6,478 | | | 10,145 |
Maintenance revenue | | | 1,567 | | | 1,638 | | | 3,183 |
Training revenue | | | 456 | | | 234 | | | 822 |
Reimbursed expenses and other revenues | | | 267 | | | 458 | | | 2,626 |
| | | | | | | | | |
Total services and other revenues | | $ | 5,195 | | $ | 17,234 | | $ | 17,030 |
| | | | | | | | | |
Total revenues | | $ | 5,710 | | $ | 17,593 | | $ | 27,709 |
| | | | | | | | | |
Cash Equivalents
Cash equivalents include all highly-liquid investments purchased with remaining maturities of three or fewer months. Cash equivalents are recorded at cost, which approximates fair value, and consist primarily of investments in money market mutual funds, which at times, exceed federally insured limits. We have not experienced any losses in such accounts. We believe that we are not exposed to any significant credit risk on cash equivalents.
54
TENFOLD CORPORATION
NOTES TO FINANCIAL STATEMENTS
Accounts Receivable (Billed and Unbilled)
Our billed accounts receivable are recorded when invoiced and represent claims against third parties that will be settled in cash. Our unbilled accounts receivable represents revenue that we have earned but which we have not yet billed. The carrying value of our receivables, net of the allowance for doubtful accounts, represents their estimated net realizable value. We estimate our allowances for doubtful accounts based on historical collection trends, the age of outstanding receivables, customers’ financial condition and creditworthiness, and existing economic conditions. If events or changes in circumstances indicate that specific receivable balances may be impaired, further consideration is given to the collectibility of those balances and the allowance is adjusted accordingly. We charge off accounts receivable against the allowance for doubtful accounts when an account is deemed to be uncollectible.
Financial Instruments
The carrying values of accounts receivable, unbilled accounts receivable, accounts payable, accrued liabilities, and income taxes payable, approximate their estimated fair values due to the relative short maturity of these instruments.
Restricted Cash
Restricted cash of $74,000 at December 31, 2005 and December 31, 2004 is maintained to support various accounts payable activities.
Property and Equipment
Property and equipment, including leasehold improvements, are stated at cost, as adjusted for impairment charges. See Note 5 for more information. Depreciation is computed using the straight-line method over the estimated useful lives of the assets, generally three to five years, or the life of the lease, whichever is shorter.
Expenditures for repairs and maintenance are charged to expense when incurred. Expenditures for major renewals and betterments that extend the useful lives of existing equipment are capitalized and depreciated. On retirement or disposition of property and equipment, the cost and related accumulated depreciation are removed from the accounts and any resulting gain or loss is recognized in the statement of operations.
Accounting for Impairment of Long-Lived Assets
We review our long-lived assets, including goodwill, for impairment whenever events or changes in circumstances indicate that the carrying amount of an asset may not be recoverable. Recoverability of assets held and used is measured by a comparison of the carrying amount of an asset to future un-discounted net cash flows expected to be generated by the asset. If such assets are considered to be impaired, the impairment to be recognized is measured by the amount by which the carrying amount of the assets exceeds the estimated fair value of the assets. Fair value is determined utilizing cash flow analyses, and other market valuations.
55
TENFOLD CORPORATION
NOTES TO FINANCIAL STATEMENTS
Cost of Revenues
Cost of revenues consists primarily of compensation and other related costs of services personnel, and contractor and distributor costs related to customer projects. Costs of license revenues, including product packaging, documentation, and reproduction have not been significant.
Advertising
Advertising costs are expensed as incurred. Advertising costs amounted to $14,000 in 2005, $112,000 in 2004, and $1,000 in 2003.
Research and Development Costs
Research and development expenses consist primarily of costs for development and enhancement of our EnterpriseTenFold technologies. In accordance with Financial Accounting Standards Board (“FASB”) Statement of Financial Accounting Standards No. 86,Accounting for the Costs of Computer Software to be Sold, Leased, or Otherwise Marketed (“SFAS 86”), development costs incurred in the research and development of new software products to be sold, leased or otherwise marketed are expensed as incurred until technological feasibility has been established. We achieve technological feasibility through a working model. We have charged our software development costs to research and development expense in the accompanying Statements of Operations.
Warranty
We provide reserves for warranty costs expected to be incurred. To date, we have not incurred significant warranty costs.
Income Taxes
We record income taxes using the asset and liability method. Deferred income tax assets and liabilities are recognized for the future tax consequences attributable to differences between the financial statement basis amounts of existing assets and liabilities and their respective income tax bases. Future tax benefits, such as net operating loss carryforwards and tax credits, are recognized to the extent that realization of such benefits is more likely than not.
Stock-Based Compensation
We apply the intrinsic value-based method of accounting prescribed by Accounting Principles Board (“APB”) Opinion No. 25, Accounting for Stock Issued to Employeesand related interpretations including FASB Interpretation No. 44,Accounting for Certain Transactions Involving Stock Compensation—an Interpretation of APB Opinion No. 25 issued in March 2000, to account for our stock options. Under this method, compensation expense is recorded on the date of grant only if the current market price of the underlying stock exceeded the exercise price. SFAS No. 123, Accounting for Stock-Based Compensationestablished accounting and disclosure requirements using a fair value-based method of accounting for stock-based employee compensation plans. As allowed by SFAS No. 123, we have elected to continue to apply the intrinsic value-based method of accounting described above, and have adopted the disclosure requirements of SFAS No. 123. We have also adopted the disclosure provisions of SFAS No. 148,Accounting for Stock-Based Compensation — Transition and Disclosure – an amendment of FASB Statement No. 123, into these financial statements and related notes.
Had compensation expense for our stock option plan and the employee stock purchase plan been determined based on the fair value at the grant date for awards or purchase rights under these
56
TENFOLD CORPORATION
NOTES TO FINANCIAL STATEMENTS
plans consistent with the methodology prescribed under SFAS No. 123,Accounting for Stock Based Compensation, our net income (loss) for the years ended December 31, 2005, 2004, and 2003 would have been as follows (in thousands except per share information):
| | | | | | | | | | | | |
| | | 2005 | | | 2004 | | | 2003 | |
Net income (loss) applicable to common stock – as reported | | $ | (5,434 | ) | | $ | 3,416 | | | $ | 13,747 | |
Add: Stock-based employee compensation expense included in reported net income (loss), net of related tax effects | | | 171 | | | | 17 | | | | 109 | |
Deduct: Total stock-based employee compensation expense determined under fair value based method for all awards, net of related tax effects | | | (6,348 | ) | | | (11,658 | ) | | | (5,348 | ) |
| | | | | | | | | | | | |
Net income (loss) applicable to common stock – pro forma | | $ | (11,611 | ) | | $ | (8,225 | ) | | $ | 8,508 | |
| | | | | | | | | | | | |
Earnings (loss) per common share – as reported: | | | | | | | | | | | | |
Basic | | $ | (0.12 | ) | | $ | 0.07 | | | $ | 0.34 | |
Diluted | | $ | (0.12 | ) | | $ | 0.06 | | | $ | 0.29 | |
| | | |
Earnings (loss) per common share – pro forma: | | | | | | | | | | | | |
Basic | | $ | (0.25 | ) | | $ | (0.18 | ) | | $ | 0.21 | |
Diluted | | $ | (0.25 | ) | | $ | (0.15 | ) | | $ | 0.18 | |
The effect of SFAS 123 on pro forma net income (loss) and net income (loss) per share disclosed for 2005, 2004, and 2003 may not be representative of the effects on pro forma results in future years.
See Note 12 for more information.
Recent Accounting Pronouncements
In December 2004, the FASB issued SFAS No. 153,Exchanges of Nonmonetary Assets, which amends Accounting Principles Board (APB) Opinion No. 29,Accounting for Nonmonetary Transactions. The guidance in APB Opinion 29 is based on the principle that exchanges of nonmonetary assets should be measured based on the fair value of the assets exchanged. The guidance in APB Opinion 29, however, included certain exceptions to that principle. SFAS No. 153 amends APB Opinion 29 to eliminate the exception for nonmonetary exchanges of similar productive assets and replaces it with a general exception for exchanges of nonmonetary assets that do not have commercial substance. A nonmonetary exchange has commercial substance if the future cash flows of the entity are expected to change significantly as a result of the exchange. SFAS No. 153 is effective for fiscal periods beginning after June 15, 2005. The adoption of SFAS No. 153 has not had a material impact on our financial position or results of operations.
In December 2004, the FASB issued SFAS No. 123R,Share-Based Payment, which supersedes APB Opinion No. 25,Accounting for Stock Issued to Employees. SFAS No. 123R focuses primarily on accounting for transactions in which an entity obtains employee services through share-based payment transactions. SFAS No. 123R requires a public entity to measure the cost of employee services received in exchange for the award of equity investments based on the fair value of the award at the date of grant. The cost will be recognized over the period during which an employee is required to provide services in exchange for the award. On April 14, 2005, the Securities and Exchange Commission issued a release announcing the adoption of a new rule delaying the required implementation of SFAS No. 123R. Under this new rule, SFAS No. 123R is effective as of the beginning of the first annual reporting period that begins after June 15, 2005 and, thus, will be effective for us beginning with the first quarter of 2006. We are currently evaluating the impact of SFAS 123R and expect the adoption to have a material impact on our financial position and results of operations. SeeStock-Based Compensation in this note above for more information related to the pro forma effects on our reported net loss and loss per share of applying the fair value recognition provisions of the previous SFAS 123,Accounting for Stock-Based Compensation, to stock-based employee compensation.
57
TENFOLD CORPORATION
NOTES TO FINANCIAL STATEMENTS
In May 2005, the FASB issued SFAS No. 154,Accounting Changes and Error Corrections. SFAS No. 154 is a replacement of APB No. 20,Accounting Changes, and SFAS No. 3, Reporting Accounting Changes in Interim Financial Statements. SFAS No. 154 provides guidance on the accounting for and reporting of accounting changes and error corrections. It establishes retrospective application as the required method for reporting a change in accounting principle. SFAS No. 154 provides guidance for determining whether retrospective application of a change in accounting principle is impracticable and how to report a change in such circumstances. SFAS No. 154 also provides that a change in method of depreciating or amortizing a long-lived non-financial asset be accounted for as a change in estimate effected by a change in accounting principle, and also provides that correction of errors in previously issued financial statements should be termed a “restatement.” SFAS No. 154 is effective for accounting changes and corrections of errors made in fiscal years beginning after December 15, 2005.
In February 2006, the FASB issued SFAS No. 155,Accounting for Certain Hybrid Instruments, which amends SFAS No. 133,Accounting for Derivative Instruments and Hedging Activities, and SFAS No. 140Accounting for Transfers and Servicing of Financial Assets and Extinguishments of Liabilities. SFAS No. 155 allows financial instruments that have embedded derivatives to be accounted for as a whole (eliminating the need to bifurcate the derivative from its host) if the holder elects to account for the whole instrument on a fair value basis. SFAS No. 155 also clarifies and amends certain other provisions of SFAS No. 133 and SFAS No. 140. This statement is effective for all financial instruments acquired or issued in financial years beginning after September 15, 2006. We do not expect our adoption of this new standard to have a material impact on our financial position, results of operations or cash flows.
4. Earnings (Loss) Per Share
The following table sets forth the computation of basic and diluted earnings (loss) per share (in thousands except per share data):
| | | | | | | | | | |
| | | Year ended December 31, |
| | | 2005 | | | 2004 | | 2003 |
Numerator: | | | | | | | | | | |
Net income (loss) | | $ | (5,434 | ) | | $ | 3,416 | | $ | 13,747 |
| | | | | | | | | | |
Numerator for diluted earnings (loss) per share | | $ | (5,434 | ) | | $ | 3,416 | | $ | 13,747 |
| | | | | | | | | | |
Denominator: | | | | | | | | | | |
Denominator for basic earnings (loss) per share – Weighted-average shares | | | 46,423 | | | | 46,204 | | | 40,634 |
| | | | | | | | | | |
Employee stock options | | | — | | | | 8,720 | | | 6,989 |
| | | | | | | | | | |
Denominator for diluted earnings (loss) per share | | | 46,423 | | | | 54,924 | | | 47,623 |
| | | | | | | | | | |
Earnings (loss) per common share: | | | | | | | | | | |
Basic earnings (loss) per common share | | $ | (0.12 | ) | | $ | 0.07 | | $ | 0.34 |
| | | | | | | | | | |
Diluted earnings (loss) per common share | | $ | (0.12 | ) | | $ | 0.06 | | $ | 0.29 |
| | | | | | | | | | |
Employee stock options that could potentially dilute basic earnings (loss) per share in the future, of which there were 23,450,459 outstanding during the year ended December 31, 2005, that have a weighted average exercise price of $1.80 per share, were not included in the computation of diluted earnings (loss) per share for the year ended December 31, 2005, because to do so would have been anti-dilutive for the period.
58
TENFOLD CORPORATION
NOTES TO FINANCIAL STATEMENTS
Employee stock options that could potentially dilute basic earnings (loss) per share in the future, of which there were 4,962,685 outstanding during the year ended December 31, 2004, that have a weighted average exercise price of $6.21 per share, were not included in the computation of diluted earnings (loss) per share for the year ended December 31, 2004, because to do so would have been anti-dilutive for the period.
Employee stock options of 3,792,372 outstanding during the year ended December 31, 2003, that have a weighted average exercise price of $5.99 per share, and that could potentially dilute basic earnings (loss) per share in the future, were not included in the computation of diluted earnings (loss) per share for the year ended December 31, 2003, because to do so would have been anti-dilutive for the period.
5. Property and Equipment
Property and equipment consists of the following (in thousands):
| | | | | | | | |
| | | December 31, | |
| | | 2005 | | | 2004 | |
Computer equipment | | $ | 4,737 | | | $ | 6,801 | |
Software | | | 1,351 | | | | 1,675 | |
Leasehold improvements | | | 904 | | | | 2,237 | |
Furniture and fixtures | | | 736 | | | | 738 | |
Office equipment | | | 604 | | | | 1,394 | |
Computer equipment under capital lease | | | 88 | | | | 76 | |
| | | | | | | | |
Total cost | | | 8,420 | | | | 12,921 | |
Less accumulated depreciation and amortization | | | (8,068 | ) | | | (12,295 | ) |
| | | | | | | | |
| | $ | 352 | | | $ | 626 | |
| | | | | | | | |
Accumulated amortization under capital leases amounted to $44,000, $15,000, and $0 at December 31, 2005, 2004, and 2003, respectively.
During the year ended December 31, 2003, we executed agreements with our two major prior equipment leasing vendors to buy out and retire their equipment lease debt at a substantial discount, and return substantially all the equipment. Net total other income for the year ended December 31, 2003 includes a gain of $2.2 million that we recognized on the retirement of these capital lease obligations.
59
TENFOLD CORPORATION
NOTES TO FINANCIAL STATEMENTS
6. Accrued Liabilities
Accrued liabilities consists of the following (in thousands):
| | | | | | |
| | | December 31, |
| | | 2005 | | 2004 |
Accrued compensation | | $ | 533 | | $ | 107 |
Accrued vacation | | | 345 | | | 463 |
Sales & other business taxes | | | 182 | | | 245 |
Accrued medical claims | | | 139 | | | 141 |
Accrued restructuring costs | | | 26 | | | 132 |
Legal and accounting fees | | | 25 | | | 8 |
Other accrued expenses | | | 242 | | | 310 |
| | | | | | |
Total accrued liabilities | | $ | 1,492 | | $ | 1,406 |
| | | | | | |
Accrued liabilities at December 31, 2005 included estimated severance and related benefits of approximately $492,000, accrued in connection with the departure of our prior Chief Executive Officer in late 2005.
7. Notes Payable – Related Parties
On December 23, 2005, we executed a Promissory Note due to Robert W. Felton, our Chairman, President, and Chief Executive Officer, in the amount of $200,000.
On December 23, 2005, we executed a Promissory Note due to Wasatch Investments LLC, an investment entity associated with TenFold Director Robert E. Parsons, Jr., in the amount of $200,000.
On December 28, 2005, we executed a Promissory Note due to First Media TF Holdings LLC, an investment entity associated with TenFold Director Ralph W. Hardy Jr., in the amount of $200,000.
On February 23, 2006, TenFold executed a Promissory Note due to Mr. Felton, in the amount of $250,000.
On March 15, 2006, TenFold executed a Promissory Note due to Mr. Felton, in the amount of $250,000.
These identical Promissory Notes were intended to provide interim financing to TenFold while we sought to secure equity financing. The notes are senior to other TenFold indebtedness and equity, bear interest at 10% and were due upon the earlier to occur of March 31, 2006, the closing of equity financing of $2 million or more, or a liquidation event. We repaid these notes in full in March 2006, upon completing the equity financing transaction described in Note 11.
The disinterested members of our Board of Directors approved these transactions.
60
TENFOLD CORPORATION
NOTES TO FINANCIAL STATEMENTS
8. Commitments
We lease office space and equipment under non-cancelable lease agreements, which expire at various dates through 2007. Future minimum lease payments under non-cancelable lease obligations, in excess of one year, as of December 31, 2005 are as follows (in thousands):
| | | | | | | | | | |
| | | Total | | Operating | | Capital | |
2006 | | $ | 479 | | $ | 442 | | $ | 37 | |
2007 | | | 309 | | | 299 | | | 10 | |
Thereafter | | | — | | | — | | | — | |
| | | | | | | | | | |
Total minimum lease payments | | $ | 788 | | $ | 741 | | | 47 | |
| | | | | | | | | | |
Less: Amount representing interest | | | | | | | | | (2 | ) |
| | | | | | | | | | |
Present value of net minimum capital lease payments | | | | | | | | | 45 | |
Less: Current installments of obligations under capital leases | | | | | | | | | (35 | ) |
| | | | | | | | | | |
Obligations under capital leases, excluding current installments | | | | | | | | $ | 10 | |
| | | | | | | | | | |
Total rental expense under operating leases was $541,000, $492,000, and $431,000, for the years ended December 31, 2005, 2004, and 2003, respectively.
We previously had significant capital lease obligations from equipment leases we had entered into in prior years. During the year ended December 31, 2003, we executed agreements with our two major prior equipment lessors to buy out and fully retire their equipment lease debt at a substantial discount, and return substantially all the related equipment. We recognized the difference between the amount paid to retire these lease obligations and the carrying amount of the lease obligations as a gain on retirement of debt of $2.2 million.
9. Legal Proceedings and Contingencies
Unresolved Stockholder Matter
On November 6, 2001, a class action complaint alleging violations of the federal securities laws was filed in the United States District Court for the Southern District of New York naming as defendants TenFold, certain of our officers and directors, and certain underwriters of our initial public offering. An amended complaint was filed on April 24, 2002. TenFold and certain of our officers and directors are named in the suit pursuant to Section 11 of the Securities Act of 1933 and Section 10(b) of the Securities Exchange Act 1934 on the basis of an alleged failure to disclose the underwriters’ alleged compensation and manipulative practices. Similar complaints have been filed against over 300 other issuers that have had initial public offerings since 1998. The individual officer and director defendants entered into tolling agreements and, pursuant to a Court Order dated October 9, 2002, were dismissed from the litigation without prejudice. On February 19, 2003, the Court granted a Motion to Dismiss the Rule 10b-5 claims against 116 defendants, including TenFold. On June 27, 2003, our Board of Directors approved a proposed partial settlement with the plaintiffs in this matter. The settlement would provide, among other things, a release of TenFold and of the individual defendants for the alleged wrongful conduct in the Amended Complaint. We agreed to undertake other responsibilities under the partial settlement, including agreeing to assign away, not assert, or release certain potential claims we may have against our underwriters. In June 2004, a motion for preliminary approval of the settlement was filed with the Court. The underwriters filed a memorandum with the Court opposing preliminary approval of the settlement. The court granted preliminary approval of the settlement on February 15, 2005, subject to certain modifications. On
61
TENFOLD CORPORATION
NOTES TO FINANCIAL STATEMENTS
August 31, 2005, the court issued a preliminary order further approving the modifications to the settlement and certifying the settlement classes. The court also appointed the Notice Administrator for the settlement and ordered that notice of the settlement be distributed to all settlement class members beginning on November 15, 2005. The settlement fairness hearing has been set for April 24, 2006. Following the hearing, if the court determines that the settlement is fair to the class members, the settlement will be approved. There can be no assurance that this proposed settlement would be approved and implemented in its current form, or at all. Any direct financial impact of the proposed settlement is expected to be borne by our insurers. At this point, we do not believe that this lawsuit will have a material adverse impact on our business, results of operations, financial position, or liquidity. Accordingly, no related losses have been provided for in our accompanying financial statements.
Assessing litigation
We review litigation claims each quarter to determine the likelihood that the claim will result in a loss. Due to the inherent uncertainties of litigation, predicting the ultimate outcome of litigation is very difficult. Significant management judgment is required to conclude on the likely outcome of outstanding litigation. As part of that review, we consider our available insurance coverage. Such coverage is subject to the particular policy’s total limit, and typically subject to the insurer’s standard reservation of rights regarding conditions or findings that might exclude coverage for a particular matter.
If a loss is considered probable on a litigation claim, management estimates the loss and we accrue the estimated loss. If a loss is considered probable but cannot be reasonably estimated, we disclose the contingency in these notes to our financial statements. Losses may however result on litigation claims that are not considered probable or are not estimable at the current time, potentially having a material adverse impact on our future business, results of operations, financial position, or liquidity.
Indemnifications, Warranties and Insurance
As permitted under Delaware law, and as provided in agreements with our officers and Directors, we have indemnified officers and Directors for certain claims asserted against them in connection with their service as an officer or Director of TenFold. The maximum potential amount of future payments that we could be required to make under these indemnification provisions is unlimited. However, we have purchased Directors’ and Officers’ insurance policies that reduce our monetary exposure and enable us to recover a portion of any future amounts paid. As a result of this insurance coverage, we believe the estimated fair value of these indemnification agreements is not material.
Our agreements with customers generally require us to indemnify the customer against claims that our software infringes third party patent, copyright, or other proprietary rights. Such indemnification obligations are generally limited in a variety of industry-standard respects, including a right to replace an infringing product or cancel the software license and return the fees paid by the customer. To date, we have not incurred costs to defend lawsuits or settle claims related to these indemnification agreements, and no such claims were outstanding at December 31, 2005. As a result, we have not recorded a liability for infringement costs as of December 31, 2005.
Our agreements with customers also generally provide a warranty that for so long as the customer is paying for support services, our software will materially conform to the related documentation, and that our software has been developed in a workmanlike manner. To date, we have not incurred significant warranty costs. As a result, we have not recorded a liability for warranty costs as of December 31, 2005.
62
TENFOLD CORPORATION
NOTES TO FINANCIAL STATEMENTS
We have an industry-standard, errors and omissions insurance policy. This policy excludes contractual related disputes such as cost and time guarantees, and only covers software errors or omissions that occur after the delivery of software. We believe this policy provides adequate coverage for potential damages related to errors and omissions in our delivered software.
10. Income Taxes
The components of the provision (benefit) for income taxes are presented below (in thousands):
| | | | | | | | | | | |
| | | Year ended December 31, |
| | | 2005 | | | 2004 | | | 2003 |
Provision (benefit) for income taxes: | | | | | | | | | | | |
Current: | | | | | | | | | | | |
Federal | | $ | — | | | $ | — | | | $ | — |
State | | | (1,081 | ) | | | (52 | ) | | | 4 |
Foreign | | | 9 | | | | (324 | ) | | | 28 |
| | | | | | | | | | | |
Total current | | | (1,072 | ) | | | (376 | ) | | | 32 |
| | | |
Deferred: | | | | | | | | | | | |
Federal | | | — | | | | — | | | | — |
State | | | — | | | | — | | | | — |
| | | | | | | | | | | |
Total deferred | | | — | | | | — | | | | — |
| | | | | | | | | | | |
Total provision (benefit) for income taxes | | $ | (1,072 | ) | | $ | (376 | ) | | $ | 32 |
| | | | | | | | | | | |
The table below reconciles the expected U.S. federal statutory income tax rate to the recorded income tax provision (benefit) (in thousands):
| | | | | | | | | | | | |
| | | Year ended December 31, | |
| | | 2005 | | | 2004 | | | 2003 | |
Tax expense (benefit) at U.S. statutory rates | | $ | (2,212 | ) | | $ | 1,034 | | | $ | 4,685 | |
State tax (benefit), net of federal tax impact | | | 5 | | | | 5 | | | | 4 | |
Meals & entertainment | | | 14 | | | | 14 | | | | 11 | |
Foreign taxes | | | 9 | | | | 19 | | | | 28 | |
Change in tax contingencies and other estimates | | | (1,080 | ) | | | (398 | ) | | | 25 | |
Change in valuation allowance attributable to operations | | | 2,192 | | | | (1,050 | ) | | | (4,721 | ) |
| | | | | | | | | | | | |
Provision (benefit) for income taxes | | $ | (1,072 | ) | | $ | (376 | ) | | $ | 32 | |
| | | | | | | | | | | | |
Our deferred tax assets are comprised of the following (in thousands):
| | | | | | | | |
| | | December 31, | |
| | | 2005 | | | 2004 | |
Deferred tax assets: | | | | | | | | |
Reserves and accruals | | $ | 782 | | | $ | 456 | |
Stock option compensation | | | 55 | | | | 8 | |
Credits for research activities and foreign taxes | | | 7,170 | | | | 7,161 | |
Differences in timing of revenue recognition | | | 385 | | | | — | |
Loss carryovers | | | 30,362 | | | | 28,603 | |
Depreciation for book in excess of tax | | | 367 | | | | 701 | |
| | | | | | | | |
Total deferred tax assets | | | 39,121 | | | | 36,929 | |
Valuation allowance | | | (39,121 | ) | | | (36,929 | ) |
| | | | | | | | |
Deferred tax assets after valuation allowance | | $ | — | | | $ | — | |
| | | | | | | | |
63
TENFOLD CORPORATION
NOTES TO FINANCIAL STATEMENTS
Domestic and foreign components of income (loss) before taxes are as follows (in thousands):
| | | | | | | | | | |
| | | Year ended December 31, |
| | | 2005 | | | 2004 | | 2003 |
Domestic | | $ | (6,506 | ) | | $ | 3,040 | | $ | 13,779 |
Foreign | | | — | | | | — | | | — |
| | | | | | | | | | |
Income (loss) before taxes | | $ | (6,506 | ) | | $ | 3,040 | | $ | 13,779 |
| | | | | | | | | | |
The benefit for income taxes for the year ended December 31, 2005 relates primarily to reversing accruals for foreign and state taxes that were no longer deemed necessary. As of December 31, 2005, we had federal net operating loss carryforwards of approximately $80.8 million that begin to expire in 2020. As of December 31, 2005, we had state net operating loss carryforwards of approximately $61.1 million, which are subject to various state carryover provisions that generally provide shorter carryover periods than federal. In addition, as of December 31, 2005, we had federal credit carryforwards for increasing research activities of approximately $4.1 million that begin to expire in 2014. We also had $1.7 million of state credits for increasing research activities that are subject to various state carryover provisions. The net operating losses and credits carryforwards will be subject to annual use limitations under Code Sections 382 and 383 as a result of the capital raising transaction that we completed in March 2006 described below.
The ultimate realization of the deferred income tax assets is dependent, in part, upon the tax laws in effect, our future earnings, and other events. As of December 31, 2005, we had recorded a valuation allowance of $39.1 million. During the year ended December 31, 2005, the valuation allowance increased approximately $2.2 million, and for the year ended December 31, 2004, the valuation allowance decreased approximately $1.1 million. The increase for the year ended December 31, 2005 relates primarily to the current operating loss, whereas the decrease for the year ended December 31, 2004 relates primarily to the income from operations. The general valuation allowance has been established under the provisions of SFAS No. 109,Accounting for Income Taxes, which requires that a valuation allowance be established when it is more likely than not that the net deferred tax assets will not be realized. The valuation allowance as of December 31, 2005 includes the benefit for stock option exercises that increased the size of the net operating loss carryovers. Future reductions to the valuation allowance will be allocated $29.7 million to operations and $9.4 million to paid-in capital.
11. Capital Stock
On December 22, 2003, we completed a private placement of 5 million shares of restricted common stock, with no warrants, which we sold at $2.00 per share (before related fees and expenses). Under the terms of the private placement, we filed a shelf registration statement to register such shares that initially became effective on May 14, 2004. The remaining unsold shares have been removed from registration, but the holding period provided by federal securities laws has been satisfied, and the unsold shares may be freely transferred by non-affiliates of TenFold.
During February 2003, we sold 3,888,889 shares of common stock to a member of our Board of Directors for a total purchase price of $700,000. These shares are not registered and are therefore subject to certain holding period and other trading restrictions provided by federal securities laws.
64
TENFOLD CORPORATION
NOTES TO FINANCIAL STATEMENTS
On March 29, 2006, we entered into a Securities Purchase Agreement for the sale of 1,500,000 shares of unregistered convertible preferred stock and warrants. The preferred shares are convertible into 20,315,805 shares of common stock. The warrants are to purchase 10,157,899 shares of common stock at an exercise price of $0.62 per share, with a 5 year term. The transaction generated gross proceeds of approximately $6.3 million (before expenses and repayment of $1.1 million of interim financing obligations). Several members of our Board of Directors (or investment entities associated with them) and an Executive Officer participated in the transaction, providing a total of approximately $4.7 million of the gross proceeds raised:
| • | | Robert W. Felton Trust invested $2 million. We repaid $709,000 of interim financing to Mr. Felton, our Chairman, President, and Chief Executive Officer, from the proceeds of the capital raising. |
| • | | First Media TF Holdings LLC, an investment entity associated with TenFold Director Ralph W. Hardy Jr., invested $2 million. We repaid $205,000 of interim financing to First Media TF Holdings LLC from the proceeds of the capital raising. |
| • | | TenFold Director Steven H. Coltrin invested $500,000. We expect to use approximately $206,000 of the proceeds of the capital raising to pay accounts payable due to his firm, Coltrin & Associates, for marketing and public relations work provided to TenFold in earlier periods. |
| • | | Samer Diab, Vice President, Customer Services, invested $230,000. |
We also repaid $205,000 of interim financing to Wasatch Investments LLC, an investment entity associated with TenFold Director Robert E. Parsons, Jr., from the proceeds of the capital raising.
12. Stock Option Plans
1993 Flexible Stock Incentive Plan.Our 1993 Flexible Stock Incentive Plan (the “1993 Stock Plan”) was adopted by the Board of Directors and approved by our stockholders in February 1993. A total of 10,000,000 shares of common stock are reserved for issuance under the 1993 Stock Plan. The 1993 Stock Plan is administered by the Board of Directors and the Board Compensation Committee, and with respect to option grants to purchase up to 10,000 shares to any one employee, option grants may be approved by a separate committee of the board. The 1993 Stock Plan provides for the issuance of incentive stock options to employees, including officers and employee directors, and of nonqualified stock options, stock purchase rights, stock bonus awards, and stock appreciation rights to employees, including officers and directors, consultants, and non-employee directors. The options generally vest over a four or five-year period and expire ten years from the date of grant. On January 1, 2003, the Plan terminated with respect to the grant of incentive stock options. To date, we have not issued any incentive stock options, stock purchase rights, stock bonus awards, or stock appreciation rights under the 1993 Stock Plan.
1999 Stock Plan.Our 1999 Stock Plan was adopted by the Board of Directors and approved by the stockholders in March 1999 and June 2002. A total of 6,500,000 shares of common stock were initially reserved for issuance under the 1999 Stock Plan, plus an automatic annual increase on the first day of 2000, 2001, 2002, 2003, and 2004. This automatic annual increase was equal to the lesser of 1,000,000 shares or 3 percent of our outstanding common stock on the last day of the immediately preceding year, or such lesser number of shares as the Board of Directors determined. Under this provision, on each of January 1, 2004, January 1, 2003, January 1, 2002, January 1, 2001 and January 1, 2000 the number of shares reserved for issuance under the plan increased by 1,000,000 shares. At the 2003 Annual Meeting our stockholders approved a plan amendment that increased the number of shares of common stock available for issuance by 5,000,000 shares, and increased the annual limit on the number of shares of common stock that may be granted to any one employee by 1,000,000 shares to an annual maximum of 2,000,000 shares. At the 2005 Annual Meeting our stockholders approved a plan amendment that increased the number of shares of common stock available for issuance by
65
TENFOLD CORPORATION
NOTES TO FINANCIAL STATEMENTS
5,000,000 shares. The 1999 Stock Plan provides for the granting to employees, including officers and directors, of incentive stock options within the meaning of Section 422 of the Internal Revenue Code of 1986, as amended, and for the granting to employees and consultants, including non-employee directors, of nonqualified stock options and stock purchase rights. We have historically granted only nonqualified stock options. The 1999 Stock Plan is administered by the Board of Directors and the Board Compensation Committee, and with respect to option grants to purchase up to 10,000 shares to any one employee, option grants may be approved by a separate committee of the board. The plan administrator determines the terms of options and stock purchase rights granted under the 1999 Stock Plan, including the number of shares subject to an option or purchase right, the exercise or purchase price, and the term and exercisability of options. The options generally vest over a four or five year period and expire ten years from the date of grant. Unless terminated earlier, the 1999 Stock Plan will terminate in March 2009. Through December 31, 2005, we have not issued any stock purchase rights or stock appreciation rights under the 1999 stock plan; and have issued only one incentive stock option grant and one stock bonus award.
2000 Employee Stock Option Plan.Our 2000 Stock Option Plan was adopted by the Board of Directors in December 2000. A total of 7,000,000 shares of common stock have been reserved for issuance under the 2000 Stock Option Plan. The 2000 Stock Option Plan provides for the granting of nonstatutory rights of purchase of our common stock to employees, excluding section 16 officers, directors, and non-employee directors. Nonstatutory options do not qualify as an Incentive Stock Option within the meaning of Section 422 of the Internal Revenue Code of 1996, as amended. The 2000 Stock Option Plan is administered by the Board of Directors. The plan administrator determines the terms of options and stock purchase rights granted under the 2000 Stock Option Plan, including the number of shares subject to an option or purchase right, the exercise or purchase price, and the term and exercisability of options. The options generally vest over a four-year period and expire ten years from the date of grant. Unless terminated earlier, the 2000 Stock Plan will terminate in December 2010.
Stock option activity under our 1993, 1999, and 2000 stock option plans is as follows:
| | | | | |
| | | Option
Shares | | Weighted Average Exercise Price Per Share |
Outstanding at December 31, 2002 | | 10,050,679 | | $ | 2.75 |
| | | | | |
Granted | | 8,869,000 | | $ | 1.03 |
Exercised | | 283,988 | | $ | 0.61 |
Canceled | | 1,771,702 | | $ | 3.33 |
| | | | | |
Outstanding at December 31, 2003 | | 16,863,989 | | $ | 1.85 |
| | | | | |
Granted | | 5,609,500 | | $ | 2.79 |
Exercised | | 297,639 | | $ | 0.49 |
Canceled | | 1,272,529 | | $ | 1.82 |
| | | | | |
Outstanding at December 31, 2004 | | 20,903,321 | | $ | 2.12 |
| | | | | |
Granted | | 4,181,000 | | $ | 0.40 |
Exercised | | — | | $ | — |
Canceled | | 1,633,862 | | $ | 2.33 |
| | | | | |
Outstanding at December 31, 2005 | | 23,450,459 | | $ | 1.80 |
| | | | | |
At December 31, 2005, 20,450,740 options were vested and exercisable as compared to 12,883,266 in 2004 and 8,010,608 in 2003, under the stock option plans. Included in the table above are options granted to consultants that were recorded at their estimated fair value. To date, the number of options granted to consultants and the related fair value of such options has been insignificant.
66
TENFOLD CORPORATION
NOTES TO FINANCIAL STATEMENTS
The following table summarizes information about stock options under the plans outstanding at December 31, 2005:
| | | | | | | | | | | | | | | | |
| | | Options Outstanding | | Options Exercisable |
Range of Exercise Prices | | Options
Outstanding
at 12/31/05 | | Weighted
Average
Remaining
Contractual
Life | | Weighted
Average
Exercise
Price | | Number
Exercisable
at 12/31/05 | | Weighted
Average
Exercise
Price |
| $0.15 to $0.25 | | 3,752,125 | | 7.06 Years | | $ | 0.21 | | 3,081,781 | | $ | 0.21 |
| 0.35 to 0.49 | | 7,687,991 | | 7.77 Years | | | 0.39 | | 6,834,241 | | | 0.39 |
| 0.60 to 0.89 | | 1,186,250 | | 5.64 Years | | | 0.75 | | 1,185,250 | | | 0.75 |
| 1.04 to 2.05 | | 6,553,330 | | 7.13 Years | | | 1.44 | | 6,001,268 | | | 1.43 |
| 2.49 to 2.92 | | 1,258,528 | | 7.46 Years | | | 2.71 | | 729,715 | | | 2.67 |
| 3.80 to 9.82 | | 2,621,435 | | 7.47 Years | | | 4.59 | | 2,227,685 | | | 4.73 |
| 12.60 to 21.00 | | 24,100 | | 3.94 Years | | | 16.73 | | 24,100 | | | 16.73 |
| 25.75 to 55.88 | | 366,700 | | 4.15 Years | | | 33.31 | | 366,700 | | | 33.31 |
| | | | | | | | | | | | | | | | |
| $0.15 to $55.88 | | 23,450,459 | | 7.26 Years | | $ | 1.80 | | 20,450,740 | | $ | 1.85 |
| | | | | | | | | | | | | | | | |
The number of remaining options available to grant under the 1993, 1999, and 2000 plans is 9,893,607 as of December 31, 2005.
The weighted-average fair value of the options granted under the plans in 2005 is $0.36 as compared to $2.62 in 2004 and $0.90 in 2003. The fair value of these options was estimated at the date of grant using the Black-Scholes model with the following weighted-average assumptions for 2005, 2004, and 2003: risk-free interest rate of 3.95 percent in 2005, 2.54 percent in 2004, and 2.15 percent in 2003; a dividend yield of 0 percent; a volatility factor of 170.2 percent for 2005, 185.3 percent for 2004 and 202.2 percent in 2003; and an expected life of 3.5 years in 2005, 3.9 years in 2004, and 3.0 years in 2003.
We recorded deferred compensation of $157,000 in 2005; $0 in 2004; and $72,000 in 2003; relating to modifications of stock options. We recognized compensation expense of $171,000 in 2005, $17,000 in 2004, and $109,000 in 2003, related to the vesting of options with associated deferred compensation.
13. 1999 Employee Stock Purchase Plan
Our 1999 Employee Stock Purchase Plan was adopted by our Board of Directors and approved by our stockholders in March 1999. A total of 1,000,000 shares of common stock were initially reserved for issuance under the purchase plan. In addition, the number of shares reserved for issuance under the purchase plan automatically increased on the first day of each of our fiscal years beginning in 2000, 2001, 2002, 2003, and 2004 equal to the lesser of 300,000 shares, 0.75 percent of our outstanding common stock on the last day of the immediately preceding fiscal year, or such lesser number of shares as the Board of Directors determined. Under this provision, the number of shares reserved for issuance under the purchase plan increased by 1,385,490 shares. The purchase plan, which is intended to qualify under Section 423 of the Internal Revenue Code, has two six-month offering periods each year, with new offering periods (other than the first offering period) commencing on February 1 and August 1 of each year. The first offering period commenced on the date of the initial public offering and ended on January 31, 2000. We issued 68,530, 95,496, and 47,478, shares under this plan during the years ended December 31, 2005, 2004, and 2003, respectively.
67
TENFOLD CORPORATION
NOTES TO FINANCIAL STATEMENTS
As of December 31, 2005, 1,606,068 shares were available for issuance under the 1999 Employee Stock Purchase Plan.
The purchase plan is administered by the Board of Directors or by a committee appointed by the Board. Employees (including officers and employee directors) of TenFold, or of any majority-owned subsidiary designated by the Board, are eligible to participate in the purchase plan if they are employed by TenFold or any such subsidiary for at least 20 hours per week and more than 5 months per year. The purchase plan permits eligible employees to purchase common stock through payroll deductions of up to 10 percent of an employee’s compensation, at a price equal to 85 percent of the lower of the fair market value of the common stock at the beginning of the offering period or at the end of such period. No employee may purchase more than 3,000 shares of common stock under the purchase plan in any single offering period. No employee may purchase shares in an offering period if the purchase would cause such employee to own stock or hold outstanding stock options equal to or in excess of 5 percent of the total voting power of all classes of our stock. In addition, no employee shall be granted an option under the purchase plan if the option would permit an employee to purchase stock under all our employee stock purchase plans at a rate that exceeds $25,000 of fair market value of the stock for each calendar year in which the option is outstanding. An employee has the option of increasing or decreasing the percentage of payroll deductions once or of discontinuing the deduction during the offering period. We have elected to follow Accounting Principles Board Opinion No. 25,Accounting for Stock Issued to Employees (“APB 25”) in accounting for its employee stock purchase plan. Under APB 25, the plan is considered non-compensatory.
The weighted-average fair value of employee stock purchase rights granted under the employee stock purchase plan in 2005 was $0.32 as compared to $1.66 in 2004 and $1.17 in 2003. The fair value of the employee stock purchase rights was estimated using the Black-Scholes model with the following assumptions for 2005: a weighted-average risk-free interest rate of 3.24 percent, dividend yield of 0 percent, an expected life of 6 months, and a volatility factor of 169.2 percent.
14. 401(k) Retirement Plan
We established a 401(k) retirement savings plan for employees in January 1996. All employees age 21 and over are eligible to participate. Each participant may elect to have amounts deducted from his or her compensation and contributed to the plan. Through January 15, 2002, we matched 20 percent of the first 6 percent of an employees’ contributions, up to a maximum of $2,000 per employee per year. On January 15, 2002, we discontinued matching of employee contributions.
15. Operating Segments
Our CEO reviews financial information on a consolidated basis, similar in format to the accompanying Statements of Operations. We consolidate revenue and expense information for all business groups for internal and external reporting and for decision-making purposes. We operate in a single operating segment, which is applications products and services.
Revenues from customers outside of North America were approximately 11 percent of total revenues for 2005, 20 percent of total revenues for 2004, and 29 percent of total revenues for 2003. Revenues from customers in the United Kingdom were 9 percent of total revenues for 2005, 19 percent of total revenues for 2004, and 29 percent of total revenues for 2003. The decrease in percent on total revenues from the United Kingdom is primarily the result of the completion during the quarter ended September 30, 2004, of a UK consulting project we commenced in 2002. Revenues from operations in Argentina were 2 percent of total revenues for 2005, 0.9 percent of total revenues for 2004, and 0.5 percent of total revenues for 2003. At December 31, 2005, our long-lived assets are deployed in the United States.
68
TENFOLD CORPORATION
NOTES TO FINANCIAL STATEMENTS
16. Additional Significant Risks and Uncertainties
We have derived, and over the near term we expect to continue to derive, a significant portion of our revenues and cash flow from a limited number of customers. Replacing the loss of an important customer is unpredictable. Revenues and cash flows from a single customer or a few important customers may constitute a significant portion of our total revenues and cash inflows in a particular period, then decline as the volume of work performed for specific customers is likely to vary from period to period, and a major customer in one period may not continue to purchase licenses or services from us in a subsequent period. Although we plan to expand and diversify our customer base, currently the loss of any of our large customers, without their replacement by new customers, would likely have a material adverse effect on our revenue and cash flow. The following table provides customer revenue concentrations greater than 10% of annual revenues, for each of the three years ended December 31, 2005, 2004 and 2003. No other customer accounted for more than 10 percent of total annual revenues during any of these years.
| | | | | | | | | |
| | | December 31, | |
| | | 2005 | | | 2004 | | | 2003 | |
Customer A | | 20 | % | | | | | | |
Customer B | | 18 | % | | 22 | % | | 25 | % |
Customer C | | 11 | % | | | | | | |
Customer D | | | | | 50 | % | | | |
Customer E | | | | | 15 | % | | 23 | % |
Customer F | | | | | | | | 41 | % |
The customer accounting for 20 percent of our total revenues for the year ended December 31, 2005, completed its use of our time-and-materials consulting services for its application development project during the quarter ended December 31, 2005. The customer accounting for 18 percent of our total revenues for the year ended December 31, 2005, substantially completed its application development project during the quarter ended March 31, 2005. The customer accounting for 11 percent of our total revenues for the year ended December 31, 2005, DevonWay, is a related party. See Note 18 for more information.
17. Special Charges
We incurred no special charges during the years ended December 31, 2005 and 2004. Special charges for the year ended December 31, 2003 of $(673,000) include restructuring charge adjustments of $(578,000) and asset loss impairment adjustments of $(95,000).
Asset Impairment Charges. During year ended December 31, 2003, we recorded asset loss provision adjustments of $(95,000) to eliminate remaining estimated asset loss accruals that were no longer necessary upon our completing the return of previously leased equipment.
Restructuring Charges. During the year ended December 31, 2003, we recorded restructuring charge adjustments of $(578,000) to reduce previously accrued restructuring charges for negotiated reductions in remaining lease payments due for unoccupied properties, and to reflect higher sublease income received than previously estimated.
18. Related Party Transactions
During 2005, we entered into agreements with a new customer, DevonWay, to provide licenses, consulting services, technical support services, and training, for a total of approximately $1.6 million. A long-time member of our Board of Directors and our recently elected Chairman, CEO and President, Robert W. Felton, is the founder and majority shareholder of DevonWay. All disinterested members of our Board of Directors approved of these related party transactions and our general ongoing business relationship with DevonWay.
69
TENFOLD CORPORATION
NOTES TO FINANCIAL STATEMENTS
Our revenues from DevonWay for the year ended December 31, 2005, are license revenues of $160,000, and services and other revenue of $439,000. As of December 31, 2005, we had accounts receivable from DevonWay of $24,500. For the year ended December 31, 2005, we received cash inflows from DevonWay of $1.6 million.
Although we received a $1 million license payment from DevonWay in August 2005, for accounting purposes we have deferred recognition of this revenue until the end of the estimated economic life of the release of EnterpriseTenFold provided to DevonWay, because the license agreement contains a discount that cannot be determined at inception of the agreement. We are using the end of the estimated economic life to recognize the revenue because we do not have vendor specific objective evidence of fair value (“VSOE”) for the related post-contract customer support, due to the discount, and therefore we cannot allocate the revenue until the discount is known at the end of the estimated economic life. For accounting purposes, management estimates that the economic life is 16 months, and as a result no revenue will be recognized from this license until it is all recognized in a lump sum in the latter part of 2006.
See Note 7 for information about Promissory Notes we have entered into with members of our Board of Directors.
See Note 11 for information about our capital raising transaction completed in March 2006, that included the sale of stock to members of our Board of Directors and Executive Officers.
70
Schedule II
TENFOLD CORPORATION
Valuation and Qualifying Accounts
For the Years Ended December 31, 2005, 2004, and 2003
(in thousands)
| | | | | | | | | | | | | | |
Allowances for Doubtful Accounts (Billed and Unbilled) | | Balance at
beginning of
period | | Additions
charged to
costs and
expenses | | | Deductions | | | Balance at
end of
period |
Year ended December 31, 2003 | | $ | 296 | | $ | 6 | | | $ | (302 | )* | | $ | — |
| | | | | | | | | | | | | | |
Year ended December 31, 2004 | | $ | — | | $ | 33 | | | $ | (1 | )* | | $ | 32 |
| | | | | | | | | | | | | | |
Year ended December 31, 2005 | | $ | 32 | | $ | (19 | ) | | $ | (4 | )* | | $ | 9 |
| | | | | | | | | | | | | | |
_________ * Represents write-offs of accounts receivable | | | | | | | | | | | | | | |
| | | | |
Allowances for Doubtful Stockholder Notes Receivable (Principal and Interest) | | Balance at
beginning of
period | | Additions
charged to
costs and
expenses | | | Deductions | | | Balance at
end of
period |
Year ended December 31, 2003 | | $ | 1,236 | | $ | (20 | ) | | $ | (1,216 | ) | | $ | — |
| | | | | | | | | | | | | | |
Year ended December 31, 2004 | | $ | — | | $ | — | | | $ | — | | | $ | — |
| | | | | | | | | | | | | | |
Year ended December 31, 2005 | | $ | — | | $ | — | | | $ | — | | | $ | — |
| | | | | | | | | | | | | | |
| | | | |
Deferred Tax Valuation Account | | Balance at
beginning of
period | | Additions
charged to
costs and
expenses | | | Deductions | | | Balance at
end of
period |
Year ended December 31, 2003 | | $ | 42,700 | | $ | (4,721 | ) | | $ | — | | | $ | 37,979 |
| | | | | | | | | | | | | | |
Year ended December 31, 2004 | | $ | 37,979 | | $ | (1,050 | ) | | $ | — | | | $ | 36,929 |
| | | | | | | | | | | | | | |
Year ended December 31, 2005 | | $ | 36,929 | | $ | 2,192 | | | $ | — | | | $ | 39,121 |
| | | | | | | | | | | | | | |
71
SIGNATURES
Pursuant to the requirements of Section 13 or 15(d) of the Securities Exchange Act of 1934, the Registrant has duly caused this report to be signed on its behalf by the undersigned, thereunto duly authorized, on March 31, 2006.
| | |
| Dated: March 31, 2006 | | /s/ Robert P. Hughes |
| | Robert P. Hughes, Chief Financial Officer and Chief of Staff |
Pursuant to the requirements of the Securities Exchange Act of 1934, this report has been signed below by the following persons on behalf of the Registrant and in the capacities and on the dates indicated.
| | |
| Dated: March 31, 2006 | | /s/ Robert W. Felton |
| | Robert W. Felton, Chairman of the Board of Directors, President, Chief Executive Officer, and Director (Principal Executive Officer) |
| |
| Dated: March 31, 2006 | | /s/ Robert P. Hughes |
| | Robert P. Hughes |
| | Chief Financial Officer and Chief of Staff (Principal Financial and Accounting Officer) |
| |
| Dated: March 31, 2006 | | /s/ Jeffrey L. Walker |
| | Jeffrey L. Walker, Executive Vice President, and Chief Technology Officer |
| |
| Dated: March 31, 2006 | | /s/ Richard H. Bennett, Jr. |
| | Richard H. Bennett |
| | Director |
| |
| Dated: March 31, 2006 | | /s/ Stephen H. Coltrin |
| | Stephen H. Coltrin |
| | Director |
| |
| Dated: March 31, 2006 | | /s/ Ralph W. Hardy, Jr. |
| | Ralph W. Hardy, Jr. |
| | Director |
| |
| Dated: March 31, 2006 | | /s/ Nancy M. Harvey |
| | Nancy M. Harvey |
| | Director |
| |
| Dated: March 31, 2006 | | /s/ Robert E. Parsons Jr. |
| | Robert E. Parsons Jr. |
| | Director |
72