 PROJECT JADE SPECIAL COMMITTEE OF THE BOARD OF DIRECTORS Exhibit (c)(2) November 22, 2010 |
 2 Confidential TABLE OF CONTENTS I. Transaction Overview II. Financial Analysis |
 I. TRANSACTION OVERVIEW |
 4 Confidential Sources: 11/17/2010 Jade Management projections, company filings, FactSet. Jade shares, options, and RSUs as of 10/2/2010 Notes: (1) Represent Q3 FY2010 ending debt and cash balances (2) Based on actual reported EBITDA of $315.9MM, adjusted for one-time items (benefit related to forfeited share-based awards, lease termination, and severance costs) TRANSACTION OVERVIEW (1) (1) 11/19/10 Close Transaction Price Share Price $36.49 $43.50 Premium To: Metric 11/19/10 Close $36.49 0.0% 19.2% 1 Month Average 33.57 8.7% 29.6% 3 Month Average 33.66 8.4% 29.2% 12 Month Average 40.01 (8.8%) 8.7% Fully Diluted Shares Outstanding 68.4 69.1 Equity Value $2,495 $3,005 Add: Debt 0 0 Less: Cash (312) (312) Enterprise Value $2,184 $2,693 EV/LTM EBITDA (Q3 2010) $314 7.0x 8.6x IBES CONSENSUS EV/EBITDA FY 2010E $303 7.2x 8.9x FY 2011E 317 6.9 8.5 Price/Earnings FY 2010E $2.25 16.2x 19.3x FY 2011E 2.45 14.9 17.8 CURRENT PLAN EV/EBITDA FY 2010E $281 7.8x 9.6x FY 2011E 326 6.7 8.3 Price/Earnings FY 2010E $2.07 17.6x 21.0x FY 2011E 2.43 15.0 17.9 US$ IN MM, EXCEPT MULTIPLES AND PER SHARE AMOUNTS (2) |
 5 Confidential CAPITAL STRUCTURE AND TRANSACTION SOURCES AND USES Sources: 11/17/2010 Jade Management projections. Jade shares, options, and RSUs as of 10/2/2010 Note: (1) Based on FY2010E EBITDA SOURCES AND USES Multiple of EBITDA % of Total Amount Cash (FY2010E) 1.30x 12% $367 Revolver ($250MM committed, $0MM utilized at close, L + 250bps) 0.00x 0% 0 Term Loan (L + 450 bps) 3.55x 32% 1,000 Senior Notes (L + 800 bps) 2.13x 19% 600 TPG Equity 2.83x 25% 797 LGP Equity 0.94x 8% 266 Rollover Equity 0.50x 4% 140 Total Sources 100% $3,170 % of Total Amount Purchase of Equity 95% $3,005 Estimated Fees & Expenses 3% 90 Minimum Cash 2% 75 Total Uses 100% $3,170 (US$ in MM) (1) |
 II. FINANCIAL ANALYSIS |
 7 Confidential VALUATION SUMMARY – EQUITY VALUE PER SHARE $40.00 $39.00 $38.00 $32.00 $30.00 $30.06 $52.00 $47.00 $50.00 $41.00 $50.00 $50.96 $20.00 $25.00 $30.00 $35.00 $40.00 $45.00 $50.00 $55.00 $60.00 $65.00 DCF Precedents Premia Paid Comps Equity Research Price Targets 52 Week Range 52 Week Range Equity Research Price Targets Public Companies 6.5x – 8.0x 2010E EBITDA, 16.0x – 20.0x 2010E EPS 6.0x – 7.5x 2011E EBITDA, 15.0x – 17.0x 2011E EPS Relevant Transactions 7.5x – 9.5x LTM EBITDA Discounted Cash Flow Analysis 11% - 15% WACC, 6.0x – 7.5x Exit Multiple Current Price: $36.49 (11/19/10) Premiums Paid 1-Day Premium: 11% - 36% 1-Week Premium: 18% - 39% 1-Month Premium: 22% - 34% Transaction Price: $43.50 Sources: FactSet, company filings, Wall Street Research, 11/17/2010 Jade Management projections. Jade shares, options, and RSUs as of 10/2/2010 |
 8 Confidential RELATIVE SHARE PRICE PERFORMANCE LTM SHARE PRICE PERFORMANCE SHARE PRICE PERFORMANCE SINCE IPO (6/27/06) Source: FactSet as of 11/19/2010 Notes: Selected Peers represented by equal weighted index of Abercrombie & Fitch, Aeropostale, American Eagle, Ann Taylor, Bebe, Carter’s, Chico’s, Children’s Place, Coach, Coldwater Creek, The Dress Barn, The Gap, Guess?, Limited Brands, New York & Company, Polo Ralph Lauren, Talbots, Under Armour, and Urban Outfitters. Peers indexed to Jade share price of $41.11 for LTM performance and $20.00 for performance since IPO (1) XRT represents the S&P Retail Index $0.00 $10.00 $20.00 $30.00 $40.00 $50.00 $60.00 Jun-06 May-07 Mar-08 Feb-09 Jan-10 Nov-10 Jade 82% Peers 50% XRT 26% $25.00 $35.00 $45.00 $55.00 $65.00 $75.00 Nov-09 Jan-10 Apr-10 Jun-10 Sep-10 Nov-10 Jade (11%) XRT 31% Peers 40% (1) (1) Jade Since IPO High (6/19/2007) $56.63 Low (12/1/2008) 8.77 Average 34.65 |
 9 Confidential Sell 5% Hold 62% Buy 33% EQUITY RESEARCH PRICE TARGETS Source: Wall Street research 8/27 8/27 11/15 8/27 8/27 8/26 7/15 8/26 8/27 10/25 10/5 11/9 10/21 11/11 8/26 10/21 11/18 Buy Buy Buy Buy Buy Buy Hold Hold Hold Hold Hold Hold Hold Hold Hold Hold Sell Upside to Current 37% 34% 21% 15% 10% 10% 1% (4%) (4%) (4%) (4%) (7%) (7%) (10%) (15%) (15%) (18%) $50.00 $49.00 $44.00 $35.00 $35.00 $31.00 $30.00 $34.00 $33.00 $31.00 $35.00 $37.00 $40.00 $42.00 $40.00 $35.00 $34.00 Current Price: $36.49 $25.00 $35.00 $45.00 $55.00 Oppenheimer Baird Atlantic Equities B. MurrayWedbush Weeden JP Morgan UBS Jefferies MKM BOA Nomura P. Jaffray Goldman BMO Janney Morgan Stanley Median Price Target: $35.00 |
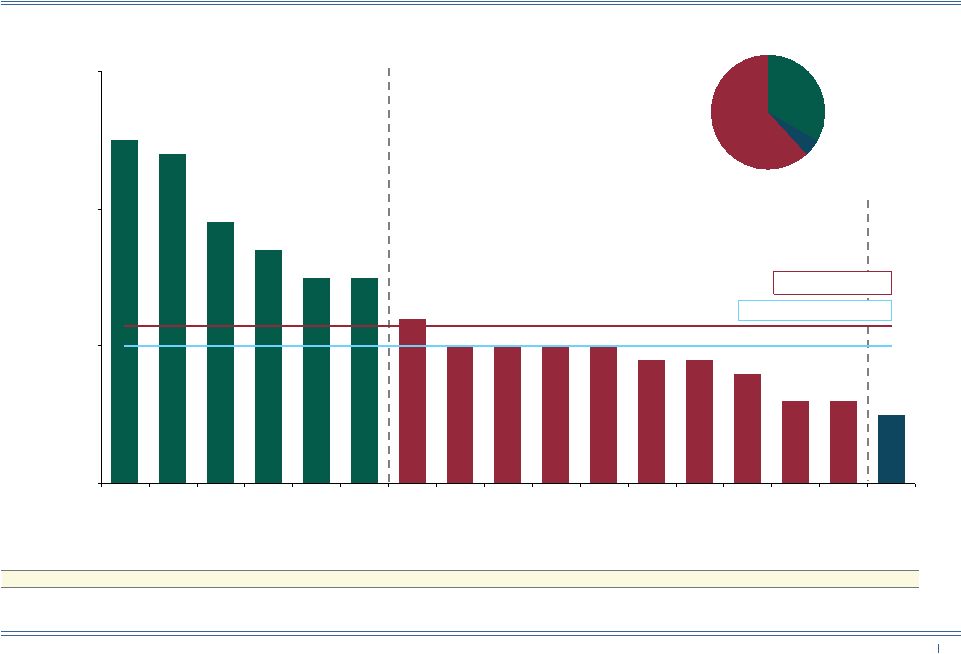
 10 Confidential PUBLIC COMPANIES – EV / FY2010E EBITDA Selected Peers Other Peers Jade 4.6x 5.5x 8.3x 10.6x 4.9x 5.5x 7.8x 8.2x 10.4x 16.8x 5.8x 6.0x 7.8x 7.2x 4.8x 6.9x 7.6x 6.1x 6.6x Selected Peers Median: 6.9x Other Peers Median: 6.6x 0.0x 5.0x 10.0x 15.0x 20.0x Current Plan IBES Aeropostale Chico's A&F Urban Outfitters The Gap Dress Barn American Eagle Talbots Children's Place Ann Taylor Coldwater Creek Carter's Coach Limited Brands Guess? Polo Bebe Sources: Company Filings, Factset, 11/17/2010 Jade Management projections, IBES. Jade shares, options, and RSUs as of 10/2/2010. Based on Jade Q3 FY2010 ending debt and cash balances |
 11 Confidential 10.0x 17.2x 25.7x 12.3x 12.3x 12.9x 16.1x 20.9x 21.1x 22.0x 15.3x 11.4x 16.2x 17.6x 17.3x 17.1x 22.3x Selected Peers Median: 19.7x Other Peers Median: 16.1x 0.0x 7.0x 14.0x 21.0x 28.0x Current Plan IBES Aeropostale Chico's Urban Outfitters A&F The Gap Dress Barn Carter's Talbots Guess? American Eagle Limited Brands Children's Place Polo Coach Ann Taylor PUBLIC COMPANIES – PRICE / FY2010E EARNINGS Sources: Company Filings, Factset, 11/17/2010 Jade Management projections, IBES Other Peers Jade Selected Peers |
 12 Confidential RELATIVE VALUATION OVER TIME PRICE / NTM EPS EV / NTM EBITDA Jade 7.0x Peers 6.5x 0.0x 3.0x 6.0x 9.0x 12.0x 15.0x Nov-08 Apr-09 Sep-09 Jan-10 Jun-10 Nov-10 Jade 15.1x S&P500 13.3x Peers 15.3x 0.0x 10.0x 20.0x 30.0x 40.0x 50.0x Nov-08 Apr-09 Sep-09 Jan-10 Jun-10 Nov-10 Sources: FactSet as of 11/19/2010, company filings. Earnings estimates based on IBES consensus median Note: Peers represented by median of group, and include Abercrombie & Fitch, Aeropostale, American Eagle, Ann Taylor, Bebe, Carter’s, Chico’s, Children’s Place, Coach, Coldwater Creek, The Dress Barn, The Gap, Guess?, Limited Brands, New York & Company, Polo Ralph Lauren, Talbots, Under Armour, and Urban Outfitters Company 12-Mo. Avg 18-Mo. Avg 24-Mo. Avg Jade 7.7x 8.4x 7.6x Peers 6.2x 6.5x 6.1x Company 12-Mo. Avg 18-Mo. Avg 24-Mo. Avg Jade 17.3x 21.5x 21.0x S&P 500 13.6x 14.2x 13.7x Peers 15.8x 16.0x 14.7x |
 13 Confidential Premiums Paid (2nd Quartile High and 3rd Quartile Low) Implied Share Price 2nd Quartile High $49.72 $47.08 $42.52 Median 44.25 41.05 39.89 3rd Quartile Low 40.55 40.07 38.48 11.1% 18.2% 21.5% 36.2% 38.8% 34.2% 0.0% 10.0% 20.0% 30.0% 40.0% 50.0% 1 Day Prior 1 Week Prior 1 Month Prior PREMIUMS PAID Sources: FactSet, Dealogic Note: Analysis includes 100% cash transactions with U.S. targets from 2005 to present between $2.0Bn and $4.0Bn 19.2% 28.3% 37.3% 25.9% 21.0% 21.3% Median of Precedents Current Offer Premia |
 14 Confidential RELEVANT TRANSACTIONS EV / LTM EBITDA Specialty Apparel Branded Private Equity Buyer Strategic Buyer (2) Acquiror Apax Apollo Lee Equity Advent V. Heusen Bain Jones Federated Consortium Consortium Apollo Bain Consortium Consortium Istithmar Date Announced 12/05 3/07 7/07 8/09 3/10 10/10 11/04 2/05 3/05 5/05 11/05 1/06 6/06 7/06 6/07 Transaction Value $1,547 $2,581 $259 $312 $3,136 $1,761 $400 $17,260 $6,213 $4,981 $1,305 $1,958 $5,604 $1,819 $942 6.6x 8.9x 9.4x 10.2x 12.2x 14.1x 8.7x 8.8x 8.2x 7.2x 7.9x 7.9x 7.8x 7.9x 8.1x Branded Median: 8.9x Specialty Apparel Median: 7.9x Overall Median: 8.2x 0.0x 2.0x 4.0x 6.0x 8.0x 10.0x 12.0x 14.0x 16.0x Tommy Hilfiger Claire's Stores Deb Shops Charlotte Russe Tommy Hilfiger Gymboree Barney's May Toys R Us Neiman Marcus Linens n Things Burlington Coat Factory Michaels Stores Petco Barney's IMPLIED TRANSACTION MULTIPLE: 8.6x (1) Sources: Company filings. Jade shares, options, and RSUs as of 10/2/2010. Implied offer multiple based on Jade LTM EBITDA as of Q3 FY2010 and Q3 FY2010 ending debt and cash balances Note: (1) Based on actual reported EBITDA of $315.9MM, adjusted for one-time items (benefit related to forfeited share-based awards, lease termination benefit, and severance costs) (2) Defined as Transaction Enterprise Value. Figures shown in millions of US dollars |
 15 Confidential HISTORICAL AND PROJECTED FINANCIAL PERFORMANCE: REVENUE AND GROSS MARGIN Sources: 11/17/2010 Jade Management projections, company filings (2.5%) 16.4% 13.4% 13.0% 5.6% (4.0%) 4.1% 5.3% 2.5% 3.5% 3.7% 3.9% 4.1% $690 $804 $953 $1,152 $1,335 $1,428 $1,578 $1,731 $1,914 $2,148 $2,425 $2,719 $3,031 $0 $1,500 $3,000 $4,500 2003A 2004A 2005A 2006A 2007A 2008A 2009A 2010E 2011E 2012E 2013E 2014E 2015E REVENUE GROSS MARGIN (US$ in MM) HISTORICAL CURRENT PLAN 36.2% 40.5% 41.8% 43.4% 44.1% 38.9% 44.1% 43.4% 44.8% 44.7% 44.7% 45.0% 45.3% 35.0% 40.0% 45.0% 50.0% 2003A 2004A 2005A 2006A 2007A 2008A 2009A 2010E 2011E 2012E 2013E 2014E 2015E 2003-2009 CAGR: 14.8% 2010-2015 CAGR: 11.9% 2003-2009 AVERAGE: 41.3% 2010-2015 AVERAGE: 44.7% (Wall Street Consensus: 11.5%) (Wall Street Consensus: 45.0%) Comp Store Sales |
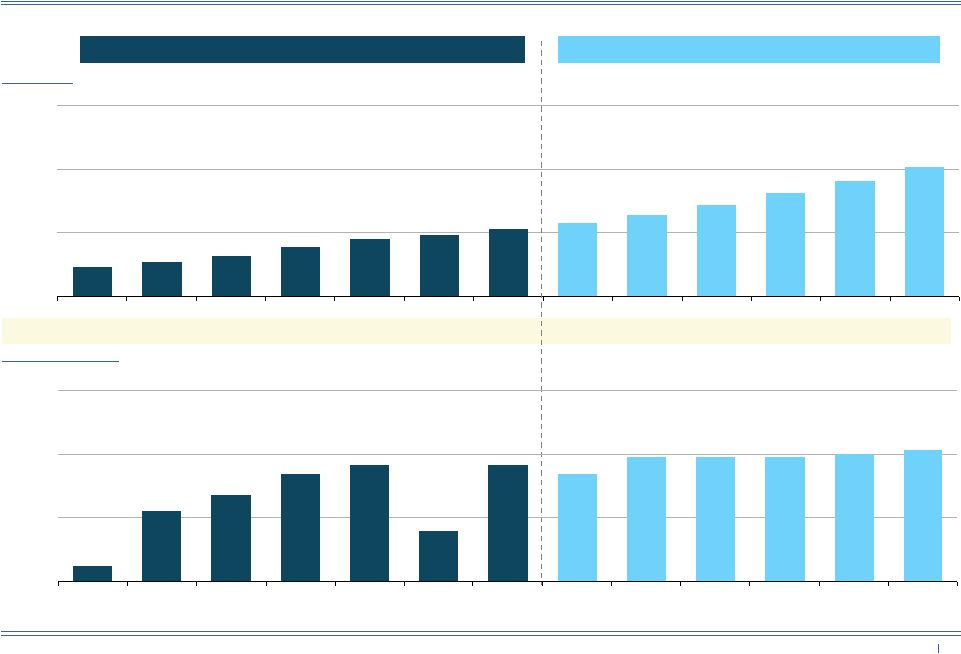
 16 Confidential HISTORICAL AND PROJECTED FINANCIAL PERFORMANCE: EBITDA AND EBIT $12 $75 $113 $159 $207 $141 $263 $281 $326 $372 $423 $478 $535 $0 $250 $500 $750 2003A 2004A 2005A 2006A 2007A 2008A 2009A 2010E 2011E 2012E 2013E 2014E 2015E ($31) $38 $79 $126 $172 $97 $211 $232 $270 $308 $356 $408 $463 ($500) $0 $500 $1,000 2003A 2004A 2005A 2006A 2007A 2008A 2009A 2010E 2011E 2012E 2013E 2014E 2015E EBITDA EBIT 2003-2009 CAGR: 66.6% 2010-2015 CAGR: 13.7% 2004-2009 CAGR: 41.2% 2010-2015 CAGR: 14.9% (US$ in MM) HISTORICAL CURRENT PLAN (Wall Street Consensus: 15.0%) (Wall Street Consensus: 14.5%) Sources: 11/17/2010 Jade Management projections, company filings |
 17 Confidential HISTORICAL AND PROJECTED FINANCIAL PERFORMANCE: EPS AND CAPEX Sources: 11/17/2010 Jade Management projections, company filings, FactSet, IBES Note: (1) Excludes reversal of accrued equity compensation expense related to departure of senior executive in July; impact of reversal is approximately $0.03 per share EPS CAPEX (1) (US$ in MM, except per share amounts) Consensus LTGR: 15.2% HISTORICAL CURRENT PLAN $10 $13 $22 $46 $81 $78 $45 $55 $90 $103 $69 $69 $67 $0 $50 $100 $150 2003A 2004A 2005A 2006A 2007A 2008A 2009A 2010E 2011E 2012E 2013E 2014E 2015E ($3.31) ($0.39) $1.49 $1.52 $0.85 $1.91 $2.07 $2.43 $2.72 $3.09 $3.48 $3.89 ($4.82) ($5.00) $0.00 $5.00 2003A 2004A 2005A 2006A 2007A 2008A 2009A 2010E 2011E 2012E 2013E 2014E 2015E 2006-2009 CAGR: 8.6% 2010-2015 CAGR: 13.4% (Wall Street Consensus: 16.5%) Average % of Revenues: 3.4% Avg % of Revenues: 3.4% (Wall Street Consensus: 3.2%) Consensus $2.25 $2.45 $2.85 |
 18 Confidential DISCOUNTED CASH FLOW ANALYSIS (US$ in MM, except per share amounts) (1) Fiscal Year FY2011E FY2012E FY2013E FY2014E FY2015E EBITDA $326 $372 $423 $478 $535 Less: Depreciation (56) (63) (67) (70) (71) EBIT $270 $308 $356 $408 $463 Less: Taxes (109) (124) (143) (164) (186) After-Tax EBIT $162 $184 $213 $244 $277 Add: Depreciation 56 63 67 70 71 Net: Change in Deferred Credits (6) 2 2 2 2 Net: Change in Other Liabilities 0 0 0 0 0 Add: Stock Based Compensation 15 20 21 21 21 Less: Increase in NWC 3 4 4 5 5 Less: Capex (90) (103) (69) (69) (67) Unlevered Free Cash Flow $139 $171 $237 $272 $309 Unlevered Free Cash Flows $139 $171 $237 $272 $309 Terminal Value (Assumes 6.5x Exit Multiple) $3,475 Total Free Cash Flows $139 $171 $237 $272 $309 $3,475 Multiply: Discount Factor (Assumes 13.0% WACC) 0.94x 0.83x 0.74x 0.65x 0.58x 0.54x Discounted Free Cash Flows $131 $142 $175 $177 $178 $1,886 Implied Enterprise Value Implied Value Per Share Terminal Multiple Terminal Multiple WACC 6.0x 6.5x 7.0x 7.5x WACC 6.0x 6.5x 7.0x 7.5x 11% $2,747 $2,906 $3,064 $3,223 11% $45.00 $47.18 $49.36 $51.55 12% 2,643 2,795 2,947 3,099 12% 43.57 45.66 47.75 49.83 13% 2,545 2,690 2,835 2,980 13% 42.22 44.22 46.21 48.21 14% 2,451 2,590 2,729 2,868 14% 40.93 42.84 44.75 46.66 15% 2,362 2,495 2,628 2,761 15% 39.71 41.53 43.36 45.19 Sources: Company filings, 11/17/2010 Jade Management projections. Jade shares, options, and RSUs as of 10/2/2010 Note: (1) Assumes tax rate of 40.2% |
  19 Confidential WEIGHTED AVERAGE COST OF CAPITAL ANALYSIS Sources: Bloomberg, Company Filings Notes: (1) 2 year adjusted beta (2) Assumes 40% tax rate (3) Based on yield on 10-Year U.S. Government Bond as of 11/19/2010 (4) Based on 2009 Ibbotson Report ASSET BETA ANALYSIS Levered Debt / Unlevered Company Beta (1) Equity Beta (2) Jade 1.58 0.0% 1.58 The Gap 0.99 0.0% 0.99 American Eagle 1.20 0.0% 1.20 Urban Outfitters 1.14 0.0% 1.14 Ann Taylor 1.52 0.0% 1.52 Pacific Sunwear 1.55 0.0% 1.55 Chico's 1.34 0.0% 1.34 Aeropostale 0.89 0.0% 0.89 Zumiez 1.33 0.0% 1.33 Guess? 1.52 0.4% 1.52 Buckle 1.02 0.0% 1.02 A&F 1.64 2.0% 1.62 Talbots 1.77 4.4% 1.73 Bebe 1.22 0.0% 1.22 Hot Topic 1.14 0.0% 1.14 Coldwater Creek 2.16 4.5% 2.10 Limited Brands 1.55 20.4% 1.38 Polo 1.24 2.8% 1.22 Coach 1.43 0.2% 1.43 Children's Place 1.10 0.0% 1.10 Carter's 1.12 12.5% 1.04 Dress Barn 1.11 1.6% 1.10 New York & Co 2.36 5.9% 2.28 Gymboree 1.21 0.0% 1.21 Under Armour 1.45 0.6% 1.44 Mean 1.38 2.2% 1.36 Median 1.33 0.0% 1.33 High 2.36 20.4% 2.28 Low 0.89 0.0% 0.89 WACC ANALYSIS Cost of Equity U.S. Risk Free Rate (3) 2.88% Equity Risk Premium (4) 6.70% Asset Beta 1.50 Relevered Beta (0% Target Debt / Equity) 1.50 Adjusted Equity Market Risk Premium 10.05% Cost of Equity 12.93% Cost of Debt Cost of Debt (Pre-Tax) 6.00% Tax Rate 40.00% Cost of Debt (After-Tax) 3.60% % Debt 0.00% % Equity 100.00% Weighted Average Cost of Capital 12.93% Selected Range 11.00% 15.00% |
 20 Confidential LEGAL NOTICE |