
Materials for Restricted Ad Hoc PIK Noteholders March 13, 2017 SUBJECT TO APPLICABLE NON-DISCLOSURE AGREEMENTS AND FRE 408 CONFIDENTIAL Exhibit 99.1
Disclaimer By accepting this presentation, recipients acknowledge that they have read, understood and accepted the terms of this Disclaimer. This presentation is the property of, and contains the proprietary and confidential information of J. Crew Group, Inc. and its subsidiaries (collectively, the "Company") and is being provided solely for informational purposes. No representation or warranty, express or implied, is or will be given by the Company or its affiliates, directors, officers, partners, employees, agents or advisers or any other person as to the accuracy, completeness, reasonableness or fairness of any information contained in this presentation and no responsibility or liability whatsoever is accepted for the accuracy or sufficiency thereof or for any errors, omissions or misstatements, negligent or otherwise, relating thereto. Accordingly, this presentation should not be relied upon for the purpose of evaluating the performance of the Company or for any other purpose, and neither the Company nor any of its affiliates, directors, officers, partners, employees, agents or advisers nor any other person, shall be liable for any direct, indirect or consequential liability, loss or damages suffered by any person as a result of this presentation or their reliance on any statement, estimate, target, projection or forward-looking information in or omission from this presentation and any such liability is expressly disclaimed. In all cases, interested parties should conduct their own investigation and analysis of the Company and the information contained herein. All information herein speaks only as of (1) the date hereof, in the case of information about the Company (2) the date of such information, in the case of information from persons other than the Company. The Company does not undertake any duty to update or revise the information contained herein, publicly or otherwise. You are cautioned not to place undue reliance on the utility of the information in this presentation as a predictor of future performance, as projected financial and other information are based on estimates and assumptions that are inherently subject to various significant risks, uncertainties and other factors, many of which are beyond the Company’s control. Risks, uncertainties and other factors may cause future results to differ materially, and potentially adversely from the historical results or projections contained herein. The historical financial information in this presentation includes information that is not presented in accordance with International Financial Reporting Standards (GAAP). Non-GAAP financial measures may be considered in addition to GAAP financial information, but should not be used as substitutes for the corresponding GAAP measures. Non-GAAP measures in this presentation may be calculated in ways that are not comparable to similarly titled measures reported by other companies. This presentation is subject to the confidentiality provision set forth in the recipients’ applicable Non-Disclosure Agreement. This presentation should not be considered as a recommendation by the Company or any affiliate or other person in relation to the Company, nor does it constitute an offer or invitation for the sale or purchase of the shares, assets or business of the Company and shall not form the basis of any contract. THIS PRESENTATION MAY CONTAIN MATERIAL, NON-PUBLIC INFORMATION WITHIN THE MEANING OF THE UNITED STATES FEDERAL SECURITIES LAWS WITH RESPECT TO THE COMPANY AND ITS SUBSIDIARIES AND THEIR RESPECTIVE SECURITIES. All amounts in this presentation are in USD unless otherwise stated.
Agenda Company Overview Q4 / Fiscal 2016 Financial Review Fiscal 2017 Guidance Summary of Proposed Transaction Today’s presentation will cover the following topics:

Company Overview
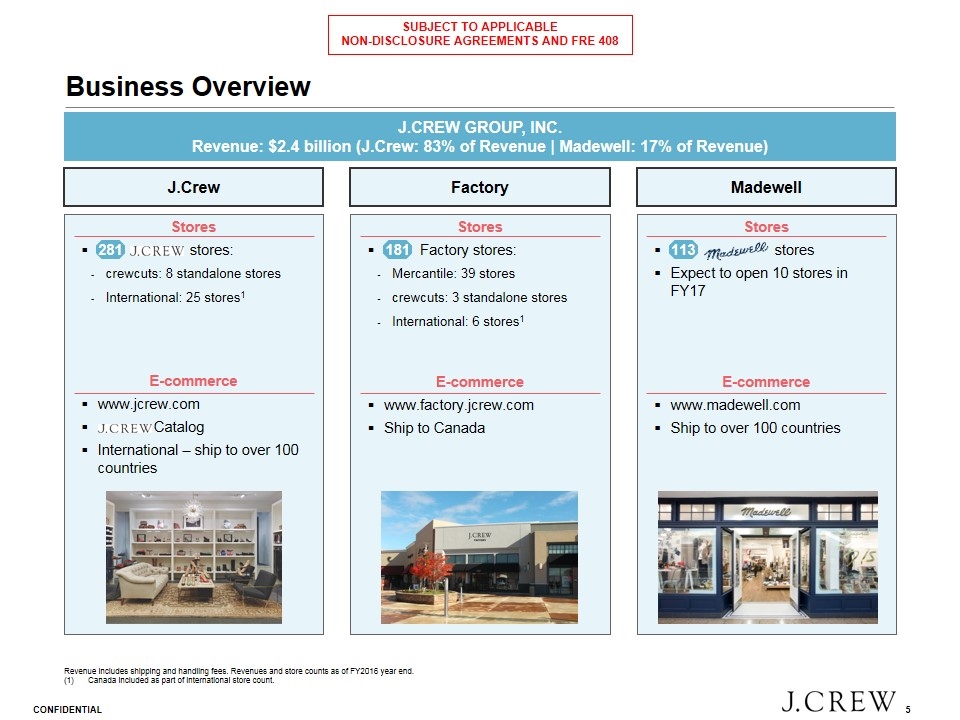
Business Overview Stores stores Expect to open 10 stores in FY17 E-commerce www.madewell.com Ship to over 100 countries Stores Factory stores: Mercantile: 39 stores crewcuts: 3 standalone stores International: 6 stores1 E-commerce www.factory.jcrew.com Ship to Canada Stores stores: crewcuts: 8 standalone stores International: 25 stores1 E-commerce www.jcrew.com Catalog International – ship to over 100 countries J.CREW GROUP, INC. Revenue: $2.4 billion (J.Crew: 83% of Revenue | Madewell: 17% of Revenue) Revenue includes shipping and handling fees. Revenues and store counts as of FY2016 year end. Canada included as part of international store count. J.Crew Factory Madewell 281 181 113
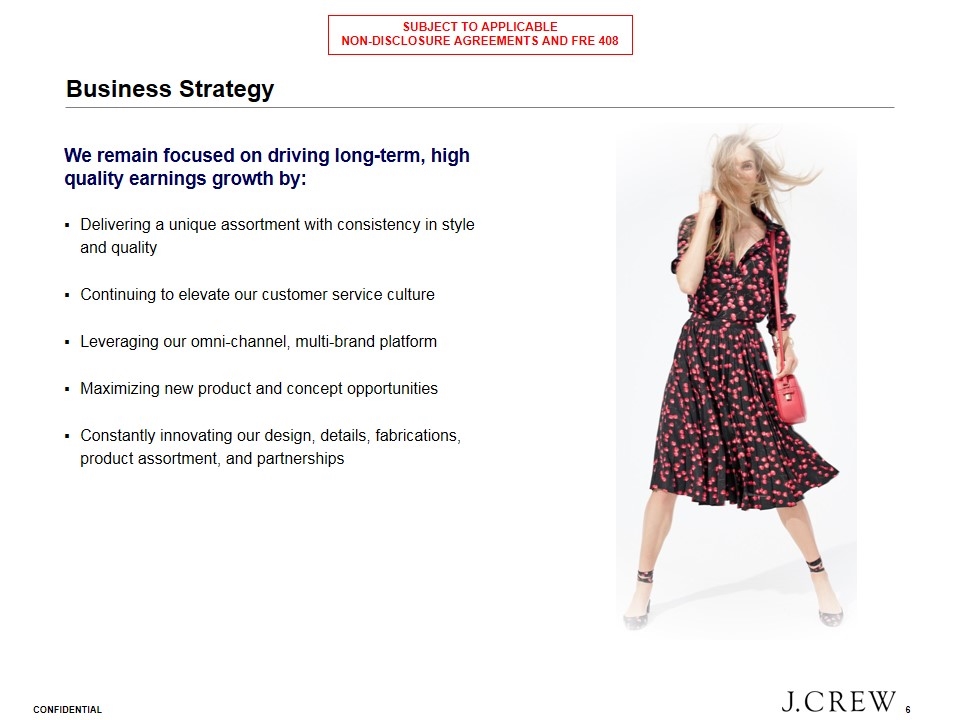
Business Strategy We remain focused on driving long-term, high quality earnings growth by: Delivering a unique assortment with consistency in style and quality Continuing to elevate our customer service culture Leveraging our omni-channel, multi-brand platform Maximizing new product and concept opportunities Constantly innovating our design, details, fabrications, product assortment, and partnerships
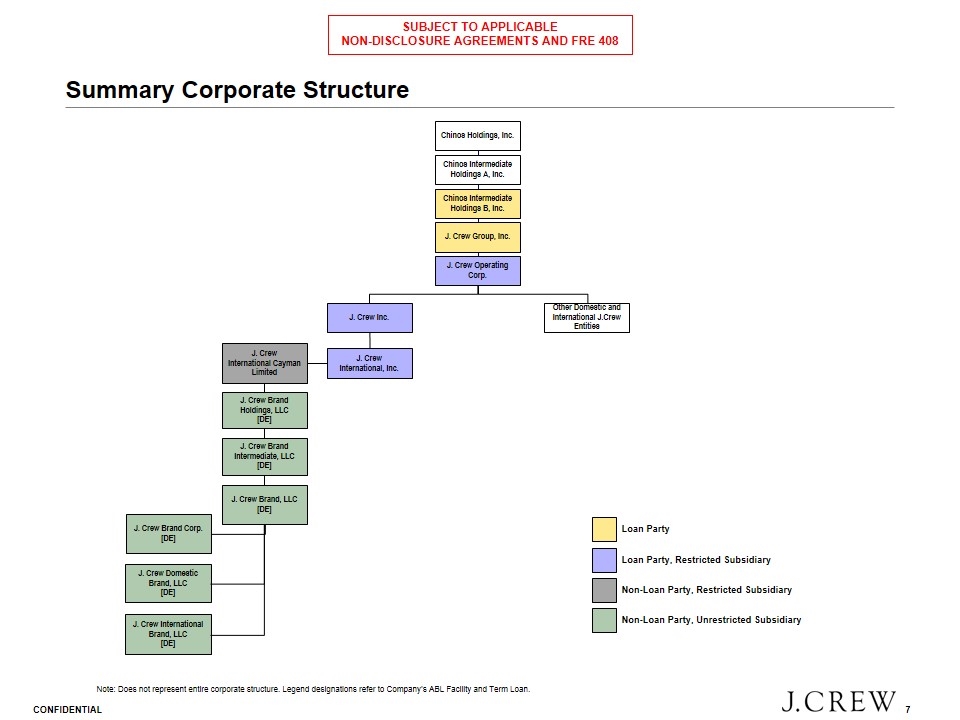
Summary Corporate Structure Chinos Holdings, Inc. Chinos Intermediate Holdings A, Inc. Chinos Intermediate Holdings B, Inc. J. Crew Operating Corp. J. Crew Inc. Other Domestic and International J.Crew Entities J. Crew International, Inc. J. Crew International Cayman Limited J. Crew Brand, LLC [DE] J. Crew Brand Corp. [DE] J. Crew Domestic Brand, LLC [DE] J. Crew International Brand, LLC [DE] J. Crew Brand Holdings, LLC [DE] J. Crew Brand Intermediate, LLC [DE] J. Crew Group, Inc. Note: Does not represent entire corporate structure. Legend designations refer to Company’s ABL Facility and Term Loan. Loan Party Non-Loan Party, Unrestricted Subsidiary Loan Party, Restricted Subsidiary Non-Loan Party, Restricted Subsidiary
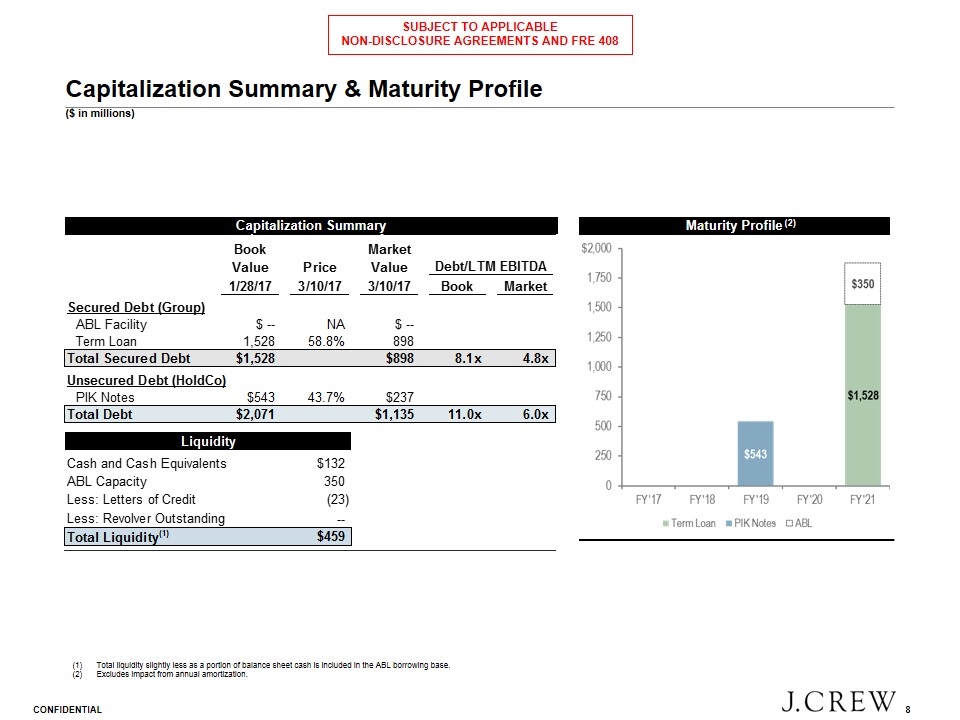
Capitalization Summary & Maturity Profile ($ in millions) Total liquidity slightly less as a portion of balance sheet cash is included in the ABL borrowing base. Excludes impact from annual amortization. Capitalization Summary Maturity Profile (2)

Q4 / Fiscal 2016 Financial Review
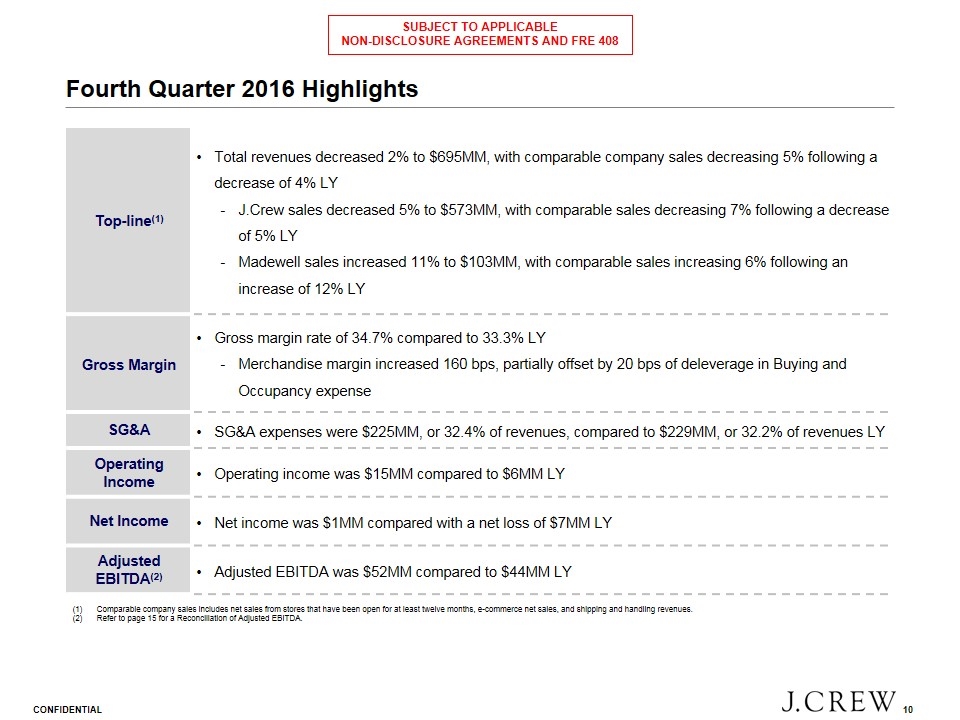
Fourth Quarter 2016 Highlights Comparable company sales includes net sales from stores that have been open for at least twelve months, e-commerce net sales, and shipping and handling revenues. Refer to page 15 for a Reconciliation of Adjusted EBITDA. Top-line(1) Total revenues decreased 2% to $695MM, with comparable company sales decreasing 5% following a decrease of 4% LY J.Crew sales decreased 5% to $573MM, with comparable sales decreasing 7% following a decrease of 5% LY Madewell sales increased 11% to $103MM, with comparable sales increasing 6% following an increase of 12% LY Gross Margin Gross margin rate of 34.7% compared to 33.3% LY Merchandise margin increased 160 bps, partially offset by 20 bps of deleverage in Buying and Occupancy expense SG&A SG&A expenses were $225MM, or 32.4% of revenues, compared to $229MM, or 32.2% of revenues LY Operating Income Operating income was $15MM compared to $6MM LY Net Income Net income was $1MM compared with a net loss of $7MM LY Adjusted EBITDA(2) Adjusted EBITDA was $52MM compared to $44MM LY
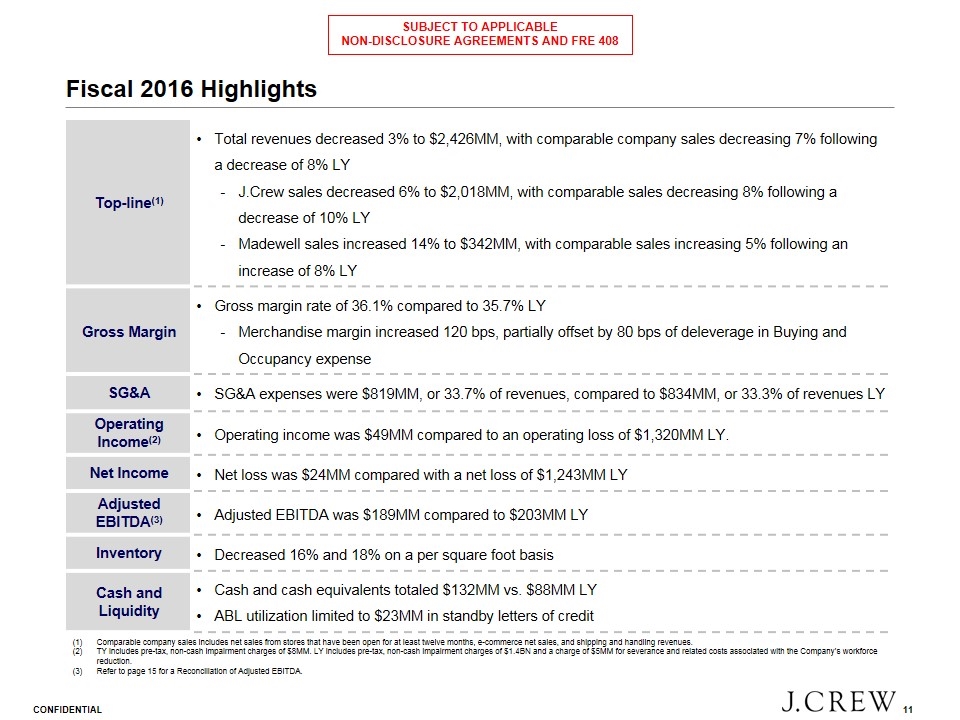
Fiscal 2016 Highlights Top-line(1) Total revenues decreased 3% to $2,426MM, with comparable company sales decreasing 7% following a decrease of 8% LY J.Crew sales decreased 6% to $2,018MM, with comparable sales decreasing 8% following a decrease of 10% LY Madewell sales increased 14% to $342MM, with comparable sales increasing 5% following an increase of 8% LY Gross Margin Gross margin rate of 36.1% compared to 35.7% LY Merchandise margin increased 120 bps, partially offset by 80 bps of deleverage in Buying and Occupancy expense SG&A SG&A expenses were $819MM, or 33.7% of revenues, compared to $834MM, or 33.3% of revenues LY Operating Income(2) Operating income was $49MM compared to an operating loss of $1,320MM LY. Net Income Net loss was $24MM compared with a net loss of $1,243MM LY Adjusted EBITDA(3) Adjusted EBITDA was $189MM compared to $203MM LY Inventory Decreased 16% and 18% on a per square foot basis Cash and Liquidity Cash and cash equivalents totaled $132MM vs. $88MM LY ABL utilization limited to $23MM in standby letters of credit Comparable company sales includes net sales from stores that have been open for at least twelve months, e-commerce net sales, and shipping and handling revenues. TY includes pre-tax, non-cash impairment charges of $8MM. LY includes pre-tax, non-cash impairment charges of $1.4BN and a charge of $5MM for severance and related costs associated with the Company’s workforce reduction. Refer to page 15 for a Reconciliation of Adjusted EBITDA.
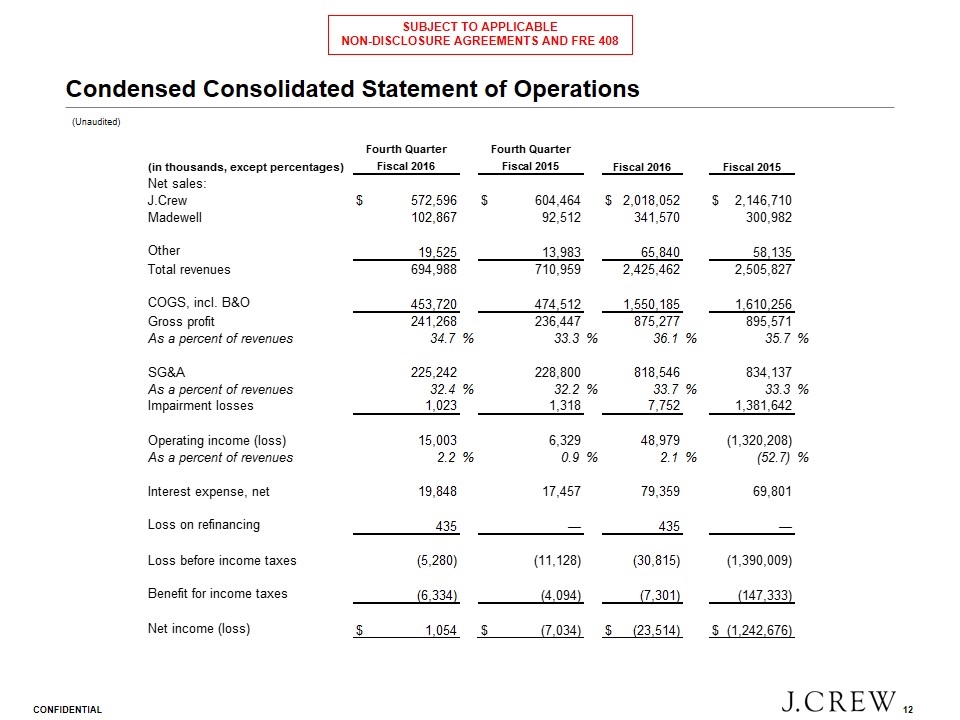
Condensed Consolidated Statement of Operations (Unaudited)
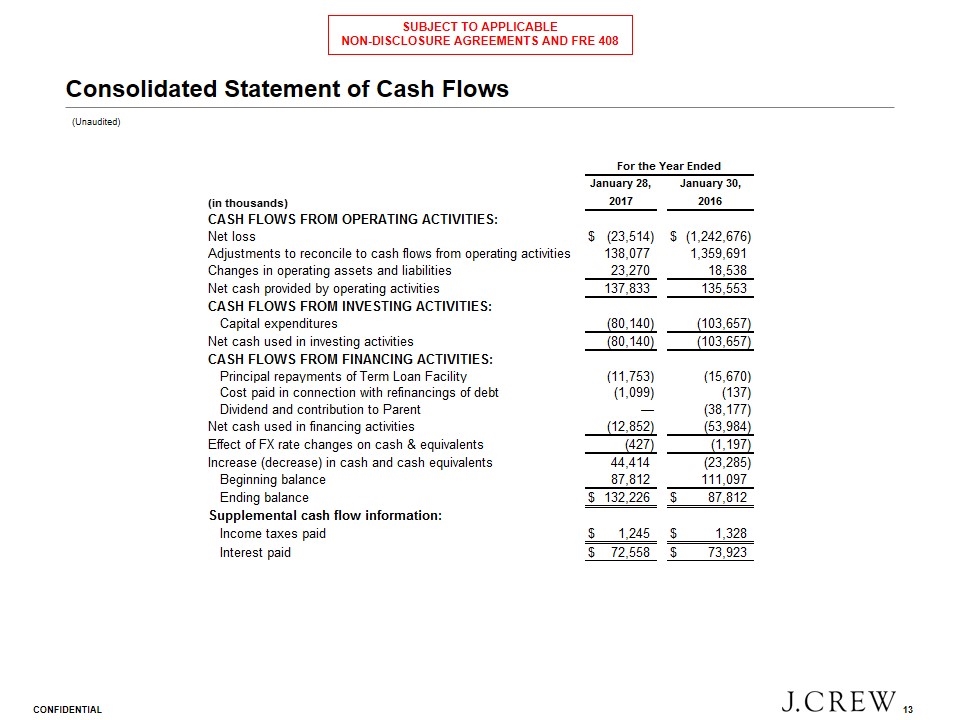
Consolidated Statement of Cash Flows (Unaudited)
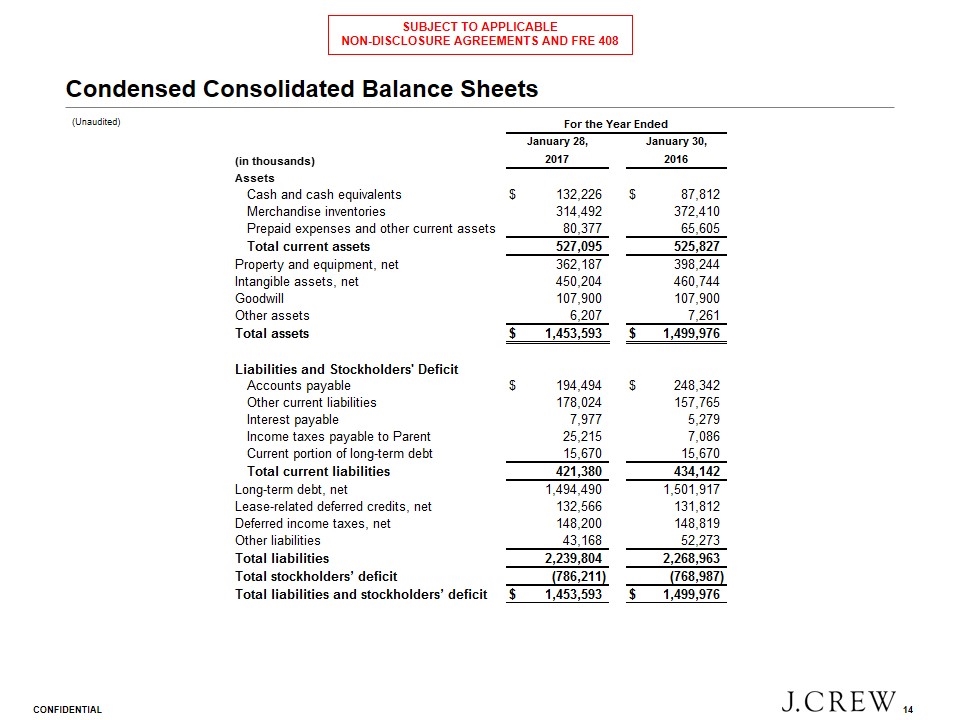
Condensed Consolidated Balance Sheets (Unaudited)
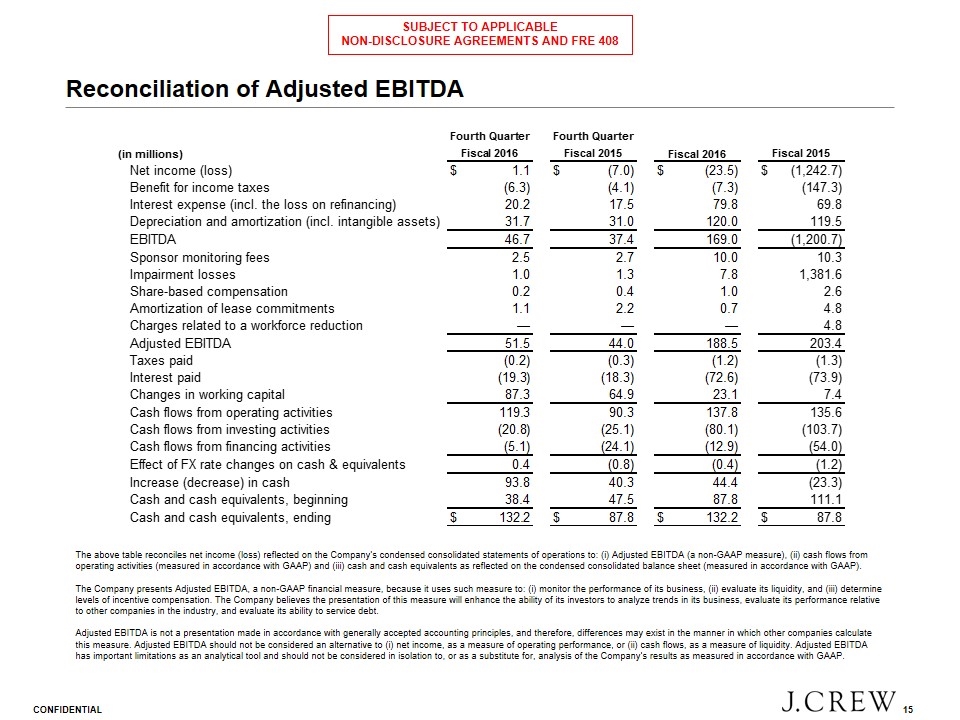
Reconciliation of Adjusted EBITDA The above table reconciles net income (loss) reflected on the Company’s condensed consolidated statements of operations to: (i) Adjusted EBITDA (a non-GAAP measure), (ii) cash flows from operating activities (measured in accordance with GAAP) and (iii) cash and cash equivalents as reflected on the condensed consolidated balance sheet (measured in accordance with GAAP). The Company presents Adjusted EBITDA, a non-GAAP financial measure, because it uses such measure to: (i) monitor the performance of its business, (ii) evaluate its liquidity, and (iii) determine levels of incentive compensation. The Company believes the presentation of this measure will enhance the ability of its investors to analyze trends in its business, evaluate its performance relative to other companies in the industry, and evaluate its ability to service debt. Adjusted EBITDA is not a presentation made in accordance with generally accepted accounting principles, and therefore, differences may exist in the manner in which other companies calculate this measure. Adjusted EBITDA should not be considered an alternative to (i) net income, as a measure of operating performance, or (ii) cash flows, as a measure of liquidity. Adjusted EBITDA has important limitations as an analytical tool and should not be considered in isolation to, or as a substitute for, analysis of the Company’s results as measured in accordance with GAAP.

Fiscal 2017 Guidance
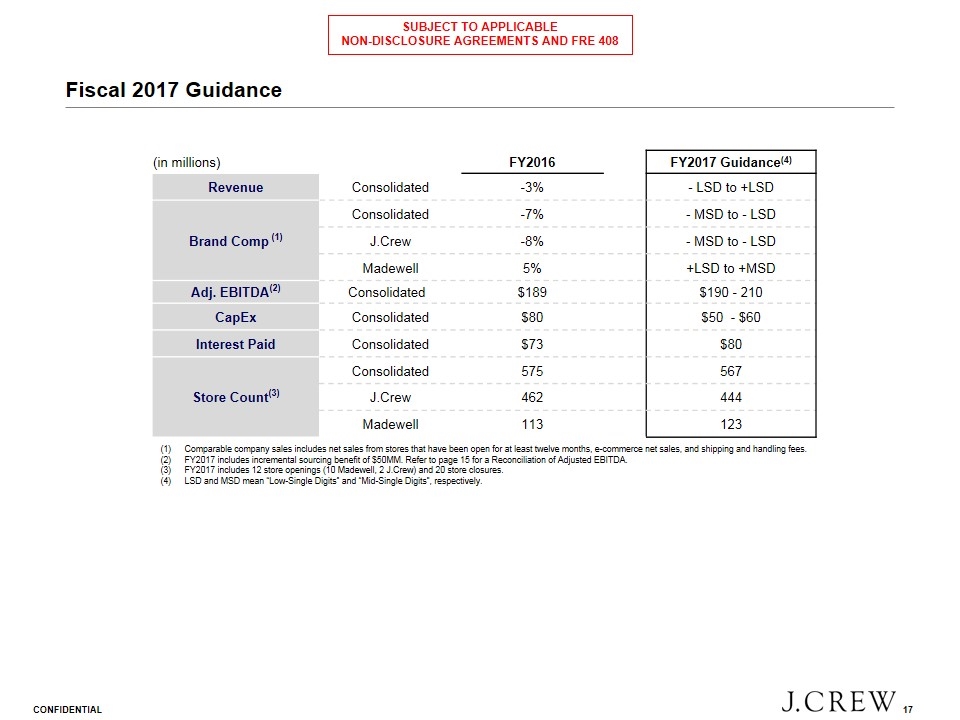
Fiscal 2017 Guidance Comparable company sales includes net sales from stores that have been open for at least twelve months, e-commerce net sales, and shipping and handling fees. FY2017 includes incremental sourcing benefit of $50MM. Refer to page 15 for a Reconciliation of Adjusted EBITDA. FY2017 includes 12 store openings (10 Madewell, 2 J.Crew) and 20 store closures. LSD and MSD mean “Low-Single Digits” and “Mid-Single Digits”, respectively. (in millions) FY2016 FY2017 Guidance(4) Revenue Consolidated -3% - LSD to +LSD Brand Comp (1) Consolidated -7% - MSD to - LSD J.Crew -8% - MSD to - LSD Madewell 5% +LSD to +MSD Adj. EBITDA(2) Consolidated $189 $190 - 210 CapEx Consolidated $80 $50 - $60 Interest Paid Consolidated $73 $80 Store Count(3) Consolidated 575 567 J.Crew 462 444 Madewell 113 123
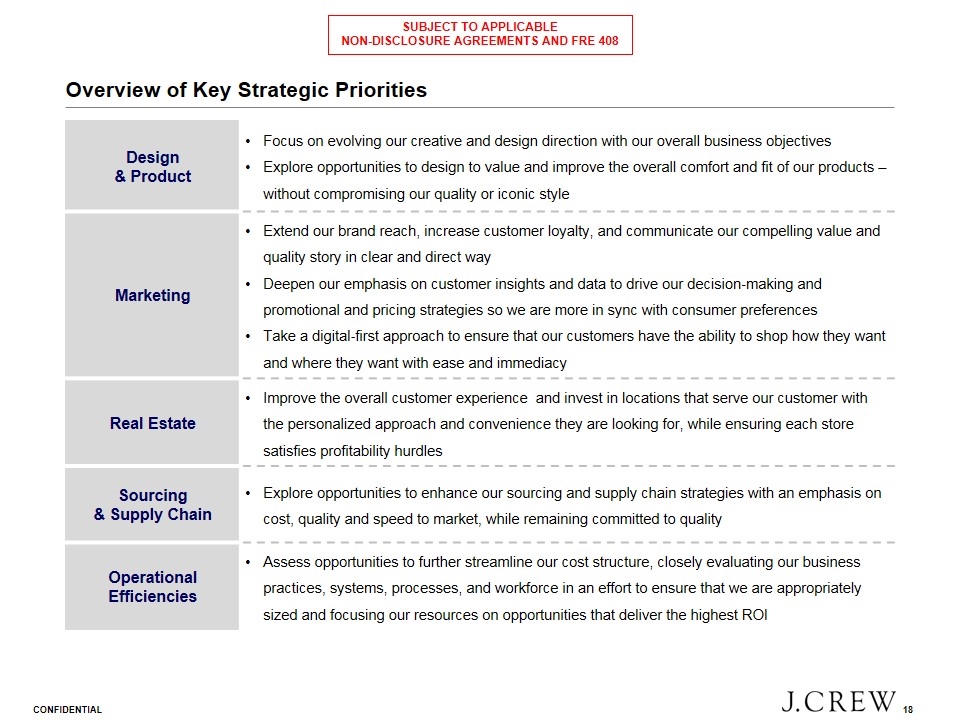
Overview of Key Strategic Priorities Design & Product Focus on evolving our creative and design direction with our overall business objectives Explore opportunities to design to value and improve the overall comfort and fit of our products – without compromising our quality or iconic style Marketing Extend our brand reach, increase customer loyalty, and communicate our compelling value and quality story in clear and direct way Deepen our emphasis on customer insights and data to drive our decision‐making and promotional and pricing strategies so we are more in sync with consumer preferences Take a digital‐first approach to ensure that our customers have the ability to shop how they want and where they want with ease and immediacy Real Estate Improve the overall customer experience and invest in locations that serve our customer with the personalized approach and convenience they are looking for, while ensuring each store satisfies profitability hurdles Sourcing & Supply Chain Explore opportunities to enhance our sourcing and supply chain strategies with an emphasis on cost, quality and speed to market, while remaining committed to quality Operational Efficiencies Assess opportunities to further streamline our cost structure, closely evaluating our business practices, systems, processes, and workforce in an effort to ensure that we are appropriately sized and focusing our resources on opportunities that deliver the highest ROI
Summary of Proposed Transaction
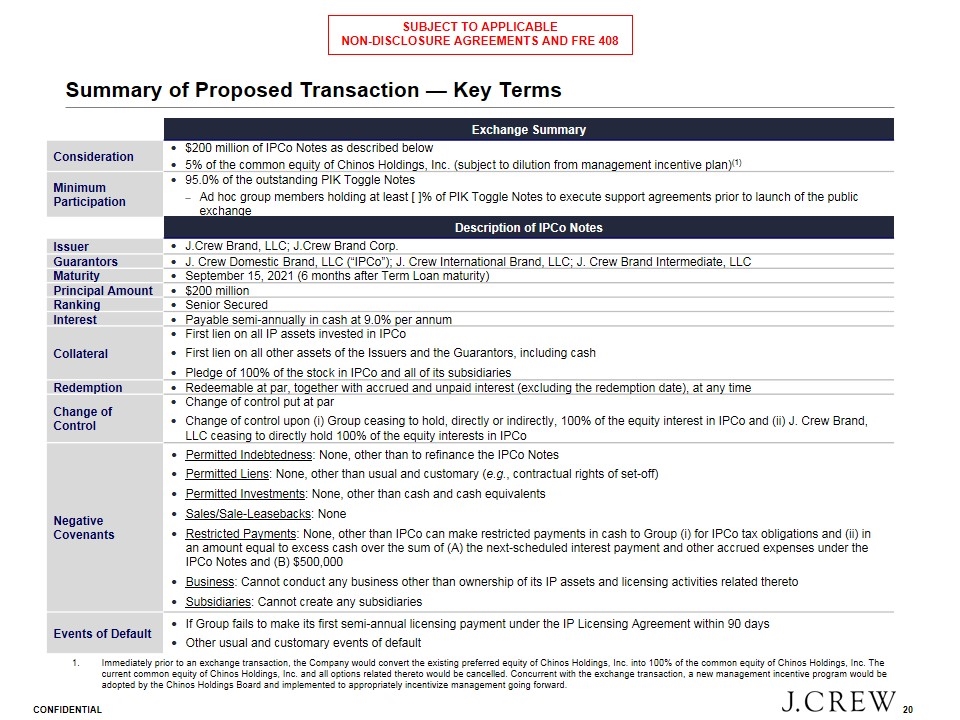
Summary of Proposed Transaction — Key Terms Exchange Summary Consideration $200 million of IPCo Notes as described below 5% of the common equity of Chinos Holdings, Inc. (subject to dilution from management incentive plan)(1) Minimum Participation 95.0% of the outstanding PIK Toggle Notes Ad hoc group members holding at least [ ]% of PIK Toggle Notes to execute support agreements prior to launch of the public exchange Description of IPCo Notes Issuer J.Crew Brand, LLC; J.Crew Brand Corp. Guarantors J. Crew Domestic Brand, LLC (“IPCo”); J. Crew International Brand, LLC; J. Crew Brand Intermediate, LLC Maturity September 15, 2021 (6 months after Term Loan maturity) Principal Amount $200 million Ranking Senior Secured Interest Payable semi-annually in cash at 9.0% per annum Collateral First lien on all IP assets invested in IPCo First lien on all other assets of the Issuers and the Guarantors, including cash Pledge of 100% of the stock in IPCo and all of its subsidiaries Redemption Redeemable at par, together with accrued and unpaid interest (excluding the redemption date), at any time Change of Control Change of control put at par Change of control upon (i) Group ceasing to hold, directly or indirectly, 100% of the equity interest in IPCo and (ii) J. Crew Brand, LLC ceasing to directly hold 100% of the equity interests in IPCo Negative Covenants Permitted Indebtedness: None, other than to refinance the IPCo Notes Permitted Liens: None, other than usual and customary (e.g., contractual rights of set-off) Permitted Investments: None, other than cash and cash equivalents Sales/Sale-Leasebacks: None Restricted Payments: None, other than IPCo can make restricted payments in cash to Group (i) for IPCo tax obligations and (ii) in an amount equal to excess cash over the sum of (A) the next-scheduled interest payment and other accrued expenses under the IPCo Notes and (B) $500,000 Business: Cannot conduct any business other than ownership of its IP assets and licensing activities related thereto Subsidiaries: Cannot create any subsidiaries Events of Default If Group fails to make its first semi-annual licensing payment under the IP Licensing Agreement within 90 days Other usual and customary events of default Immediately prior to an exchange transaction, the Company would convert the existing preferred equity of Chinos Holdings, Inc. into 100% of the common equity of Chinos Holdings, Inc. The current common equity of Chinos Holdings, Inc. and all options related thereto would be cancelled. Concurrent with the exchange transaction, a new management incentive program would be adopted by the Chinos Holdings Board and implemented to appropriately incentivize management going forward.
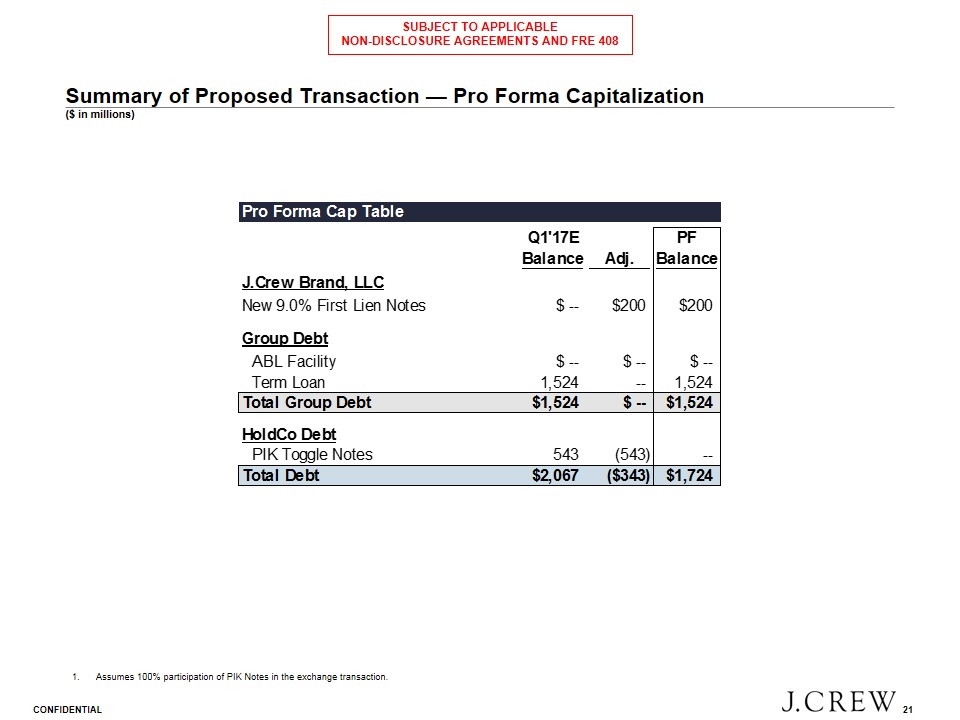
Summary of Proposed Transaction — Pro Forma Capitalization ($ in millions) Assumes 100% participation of PIK Notes in the exchange transaction. (1)


