Exhibit 99.1

Hovde Group Financial Services Conference November 2 - 4, 2022

Forward Looking Statements This presentation contains forward - looking statements within the meaning of the Private Securities Litigation Reform Act of 1995. These statements are based on the current beliefs and expectations of Community West Bancshares’ management and on information available to Community West Bancshares as of the date of this presentation. It is important to note that these forward - looking statements are not guarantees of future performance and are subject to significant risks and uncertainties, including, but not limited to, the ability of Community West Bancshares to implement its business strategy. Actual results may differ from those set forth in the forward - looking statements. Factors that could cause Community West Bancshares’ actual results to differ materially from those described in the forward - looking statements can be found in Community West Bancshares’ Annual Report on Form 10 - K for the year ended December 31, 2021, which has been filed with the Securities and Exchange Commission and is available on the Securities and Exchange Commission’s website (www.sec.gov). Community West Bancshares does not undertake to update the forward - looking statements to reflect the impact of circumstances or events that may arise after the date of the forward - looking statements. 2
Company Overview • Community West Bank established in 1989 • Community West Bancshares formed in 1996 • Headquarters: Goleta, CA • $1.09 billion in total assets at September 30, 2022 • Well Capitalized • 26% Insider Ownership at June 30, 2022 • Market Capitalization at 10/21/22: $122 million • Price to Book at 10/21/22: 111% 3
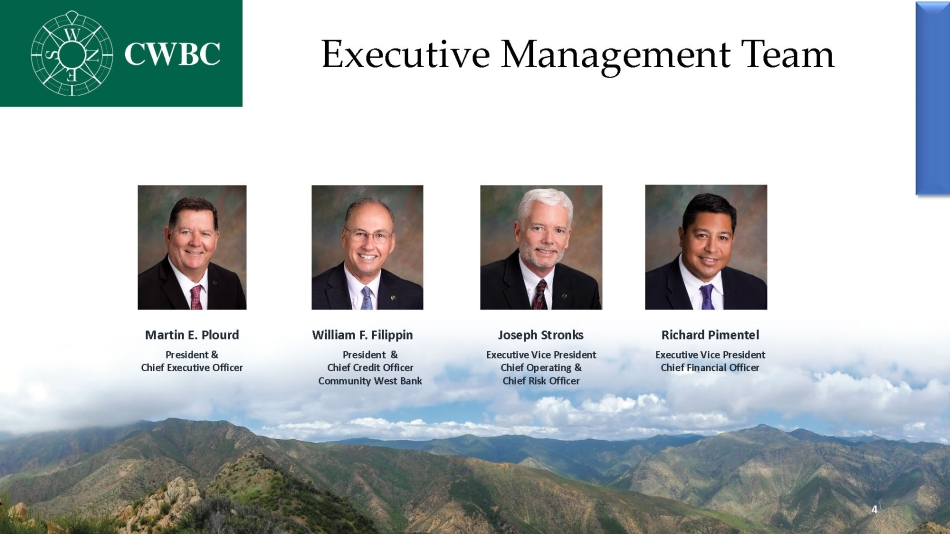
Executive Management Team Martin E. Plourd President & Chief Executive Officer William F. Filippin President & Chief Credit Officer Community West Bank Richard Pimentel Executive Vice President Chief Financial Officer Joseph Stronks Executive Vice President Chief Operating & Chief Risk Officer 4
Community Banking Model • Client Focused Community Bank • Full range of financing options with deposit and treasury management services for business and consumers • Focus on small to medium size businesses, professional firms, non - profit and retail • Three Core Competencies • Relationship Banking • Manufactured Housing Lending • Government Guaranteed Lending 5
Target Segments • Agriculture • Construction Industry • Health Care • Manufactured Housing • Manufacturing • Non - Profit Organizations • Professional Services 6

California Markets Guaranteed Loan Programs Manufactured Housing Lending Relationship Banking Strategy 7
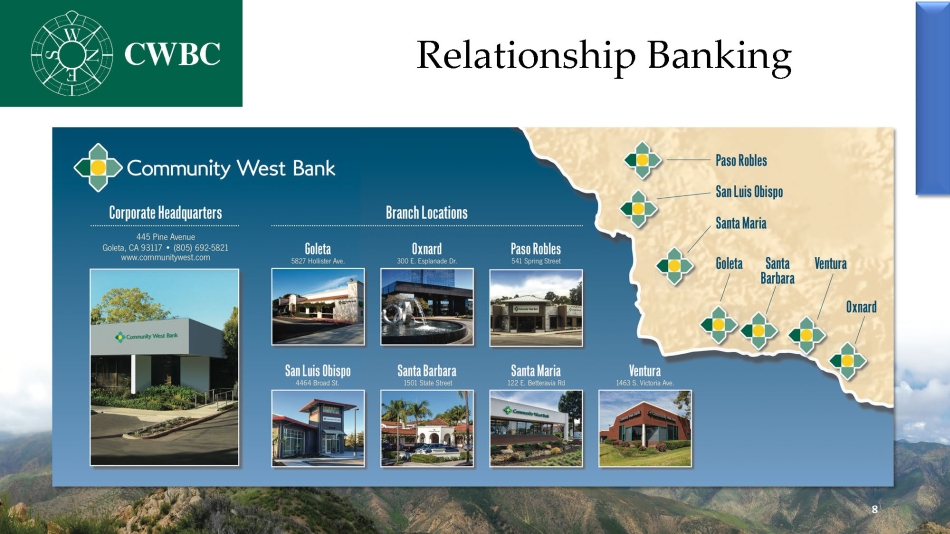
Relationship Banking 8

Manufactured Housing (as of 9/30/22) • Program serves California’s coastline from San Diego to San Francisco • Affordable housing option on California’s coast • Serving 337 well maintained mobile home parks • $310 million portfolio and 33% of total loans • 2,132 total loans with and $145,000 average loan size • 759 weighted average FICO and 61% weighted average LTV at origination • 0.16% total delinquencies in the manufactured housing portfolio 9
Government Guaranteed Lending • Preferred SBA 7a and 504 lender • Farmer Mac Lending Program • FSA Lending Program • Cal Coastal Lending Program 10

Financial Highlights Earnings Performance Deposits Loans Credit Quality • Net income of $3.5 million for the quarter and $10.1 million YTD • Earnings per diluted share of $0.39 for the quarter and $1.13 YTD • ROA of 1.25% for the quarter and 1.19% YTD • ROE of 12.65% for the quarter and 12.66% YTD • NIM of 4.39% for the quarter and 4.09% YTD • Efficiency ratio of 59% for the quarter and 62% YTD • Total deposits decreased 8.6% year - over - year to $852.2 million • Non - interest - bearing demand deposits increased 11% year - over - year to $243.1 million and represent 29% of total deposits • Total loans increased 6.2% year over year to $945.7 million • Total loans (excluding SBA PPP) increased 10.5% year over year to $943.9 million • Net non - accrual loans decreased to $239,000 compared to $1.7 million a year ago • Allowance for loan losses of $11.2 million, or 1.20% of total loans held for investment 11
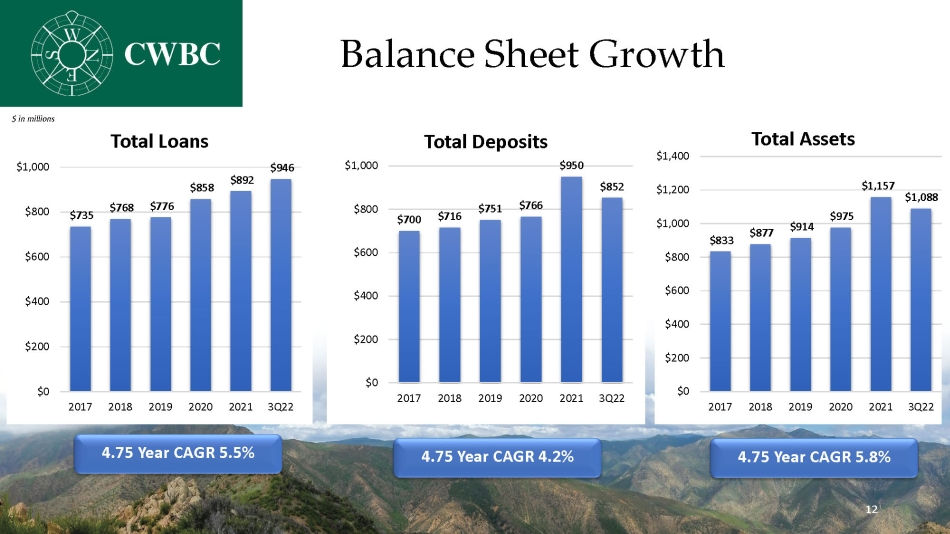
Balance Sheet Growth $735 $768 $776 $858 $892 $946 $0 $200 $400 $600 $800 $1,000 2017 2018 2019 2020 2021 3Q22 Total Loans 4.75 Year CAGR 5.5% $700 $716 $751 $766 $950 $852 $0 $200 $400 $600 $800 $1,000 2017 2018 2019 2020 2021 3Q22 Total Deposits 4.75 Year CAGR 4.2% $833 $877 $914 $975 $1,157 $1,088 $0 $200 $400 $600 $800 $1,000 $1,200 $1,400 2017 2018 2019 2020 2021 3Q22 Total Assets 4.75 Year CAGR 5.8% $ in millions 12
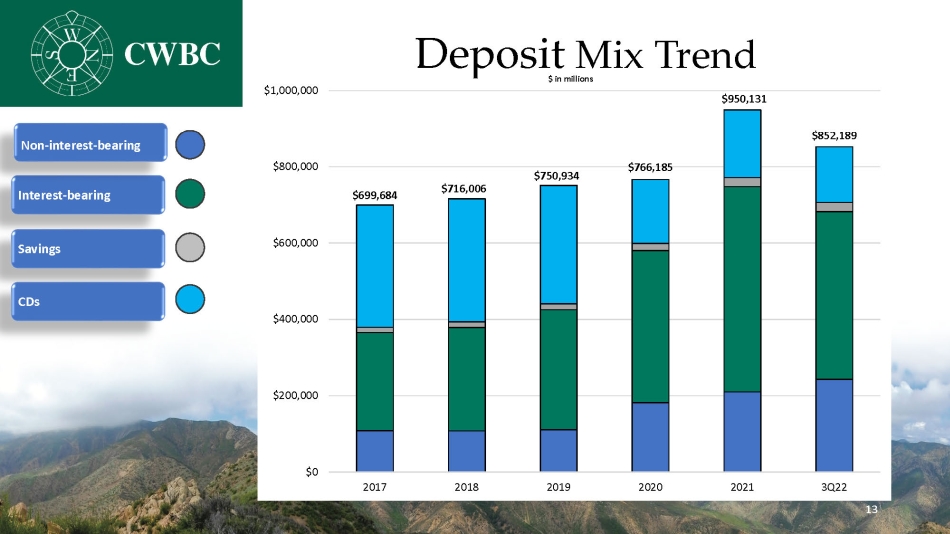
Deposit Mix Trend Interest - bearing Savings Non - interest - bearing CDs 13 $699,684 $716,006 $750,934 $766,185 $950,131 $852,189 $0 $200,000 $400,000 $600,000 $800,000 $1,000,000 2017 2018 2019 2020 2021 3Q22 $ in millions
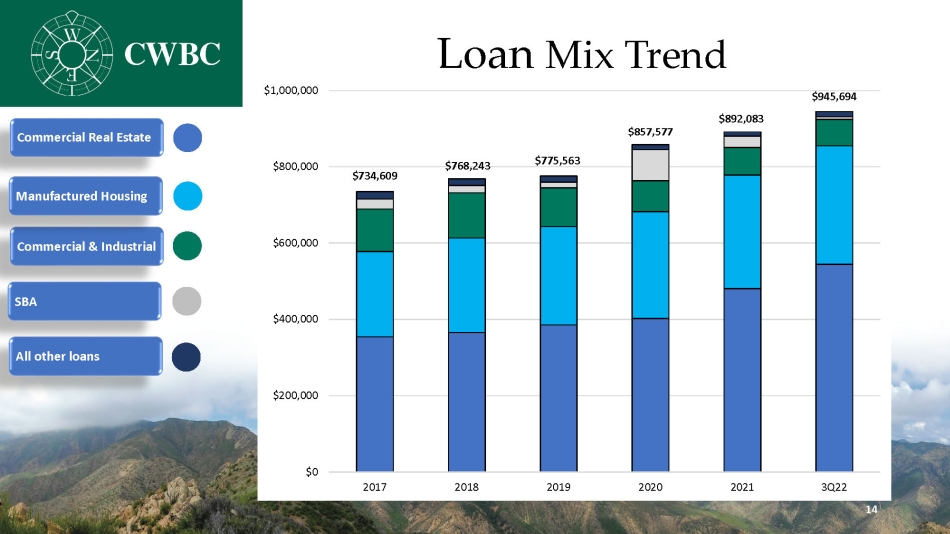
Loan Mix Trend Commercial & Industrial Commercial Real Estate SBA Manufactured Housing All other loans 14 $734,609 $768,243 $775,563 $857,577 $892,083 $945,694 $0 $200,000 $400,000 $600,000 $800,000 $1,000,000 2017 2018 2019 2020 2021 3Q22
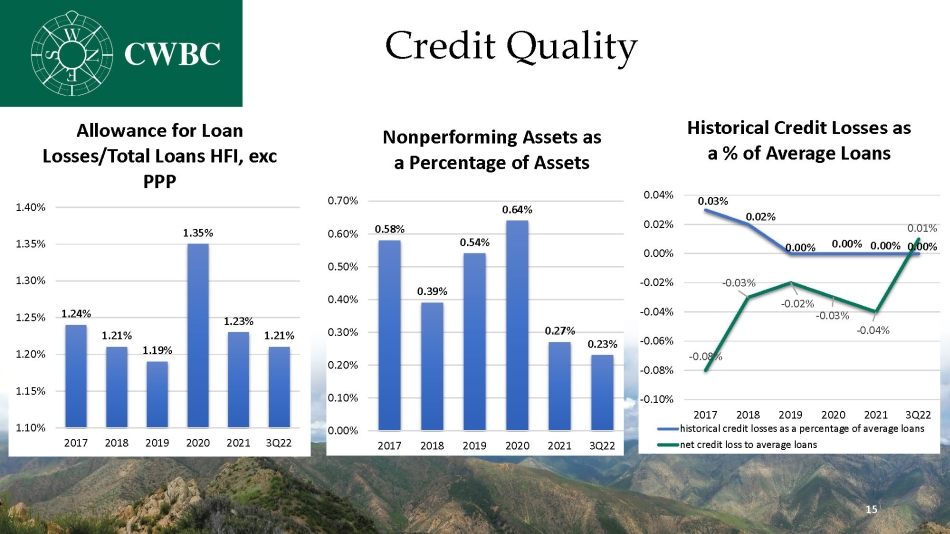
Credit Quality 0.58% 0.39% 0.54% 0.64% 0.27% 0.23% 0.00% 0.10% 0.20% 0.30% 0.40% 0.50% 0.60% 0.70% 2017 2018 2019 2020 2021 3Q22 Nonperforming Assets as a Percentage of Assets 1.24% 1.21% 1.19% 1.35% 1.23% 1.21% 1.10% 1.15% 1.20% 1.25% 1.30% 1.35% 1.40% 2017 2018 2019 2020 2021 3Q22 Allowance for Loan Losses/Total Loans HFI, exc PPP 0.03% 0.02% 0.00% 0.00% 0.00% 0.00% - 0.08% - 0.03% - 0.02% - 0.03% - 0.04% 0.01% -0.10% -0.08% -0.06% -0.04% -0.02% 0.00% 0.02% 0.04% 2017 2018 2019 2020 2021 3Q22 Historical Credit Losses as a % of Average Loans historical credit losses as a percentage of average loans net credit loss to average loans 15
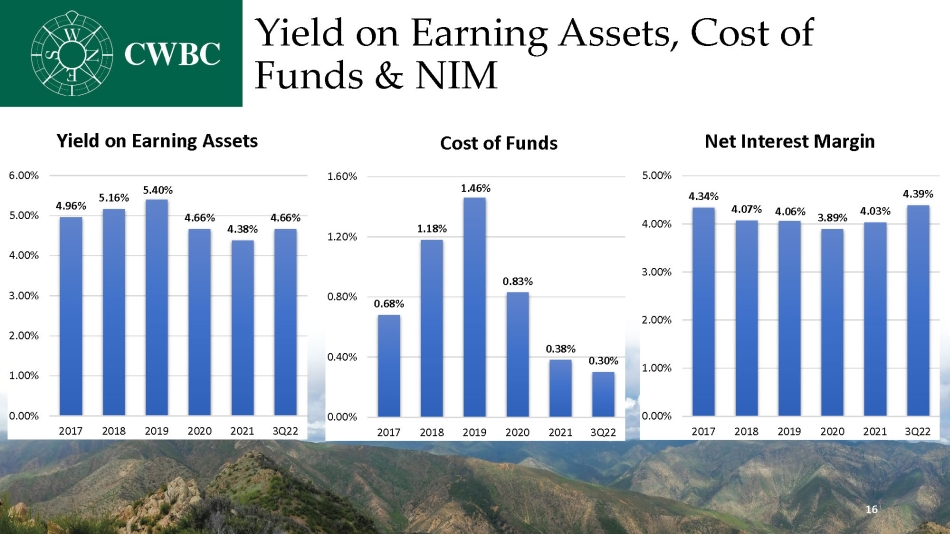
Yield on Earning Assets, Cost of Funds & NIM 4.96% 5.16% 5.40% 4.66% 4.38% 4.66% 0.00% 1.00% 2.00% 3.00% 4.00% 5.00% 6.00% 2017 2018 2019 2020 2021 3Q22 Yield on Earning Assets 0.68% 1.18% 1.46% 0.83% 0.38% 0.30% 0.00% 0.40% 0.80% 1.20% 1.60% 2017 2018 2019 2020 2021 3Q22 Cost of Funds 16 4.34% 4.07% 4.06% 3.89% 4.03% 4.39% 0.00% 1.00% 2.00% 3.00% 4.00% 5.00% 2017 2018 2019 2020 2021 3Q22 Net Interest Margin
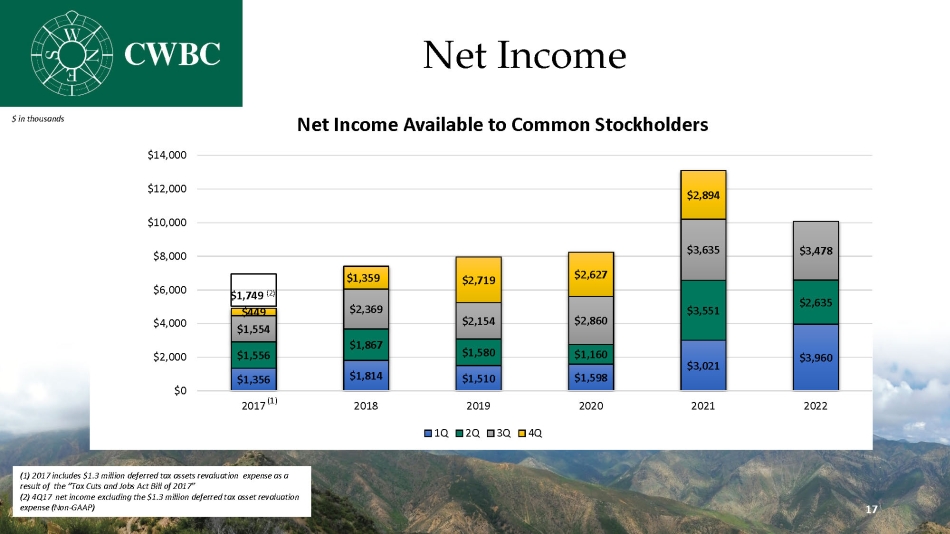
$1,356 $1,814 $1,510 $1,598 $3,021 $3,960 $1,556 $1,867 $1,580 $1,160 $3,551 $2,635 $1,554 $2,369 $2,154 $2,860 $3,635 $3,478 $449 $1,359 $2,719 $2,627 $2,894 $0 $2,000 $4,000 $6,000 $8,000 $10,000 $12,000 $14,000 2017 2018 2019 2020 2021 2022 Net Income Available to Common Stockholders 1Q 2Q 3Q 4Q $1,749 (2) Net Income (1) 2017 includes $1.3 million deferred tax assets revaluation expense as a result of the “Tax Cuts and Jobs Act Bill of 2017” (2) 4Q17 net income excluding the $1.3 million deferred tax asset revaluation expense (Non - GAAP) $ in thousands (1) 17
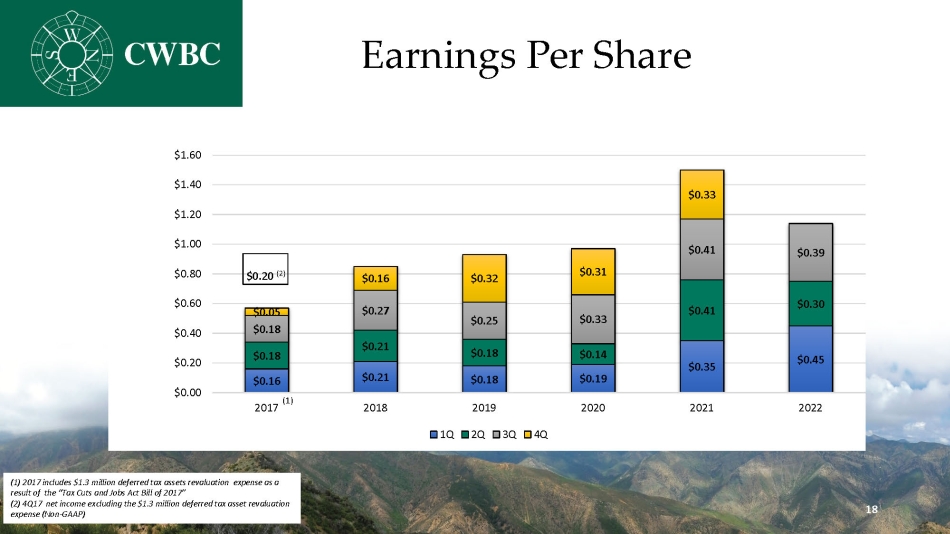
Earnings Per Share $0.16 $0.21 $0.18 $0.19 $0.35 $0.45 $0.18 $0.21 $0.18 $0.14 $0.41 $0.30 $0.18 $0.27 $0.25 $0.33 $0.41 $0.39 $0.05 $0.16 $0.32 $0.31 $0.33 $0.00 $0.20 $0.40 $0.60 $0.80 $1.00 $1.20 $1.40 $1.60 2017 2018 2019 2020 2021 2022 1Q 2Q 3Q 4Q (1) (1) 2017 includes $1.3 million deferred tax assets revaluation expense as a result of the “Tax Cuts and Jobs Act Bill of 2017” (2) 4Q17 net income excluding the $1.3 million deferred tax asset revaluation expense (Non - GAAP) $0.20 (2) 18

Performance Metrics 5 Year Trend 0.64% 0.88% 0.91% 0.85% 1.21% 1.19% 0.00% 0.20% 0.40% 0.60% 0.80% 1.00% 1.20% 1.40% 2017 2018 2019 2020 2021 YTD 2022 ROA 7.16% 10.02% 10.15% 9.70% 13.68% 12.66% 0.00% 2.00% 4.00% 6.00% 8.00% 10.00% 12.00% 14.00% 16.00% 2017 2018 2019 2020 2021 YTD 2022 ROE 19
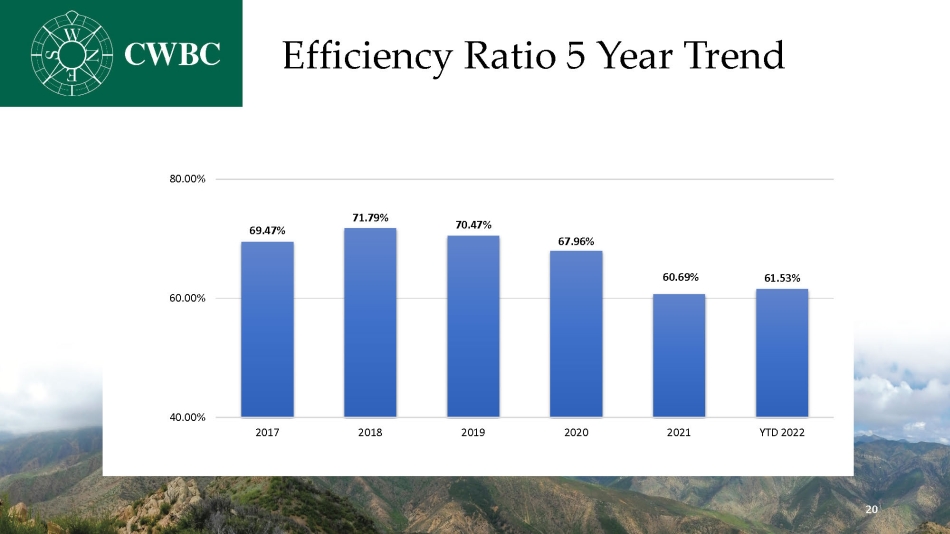
Efficiency Ratio 5 Year Trend 69.47% 71.79% 70.47% 67.96% 60.69% 61.53% 40.00% 60.00% 80.00% 2017 2018 2019 2020 2021 YTD 2022 20
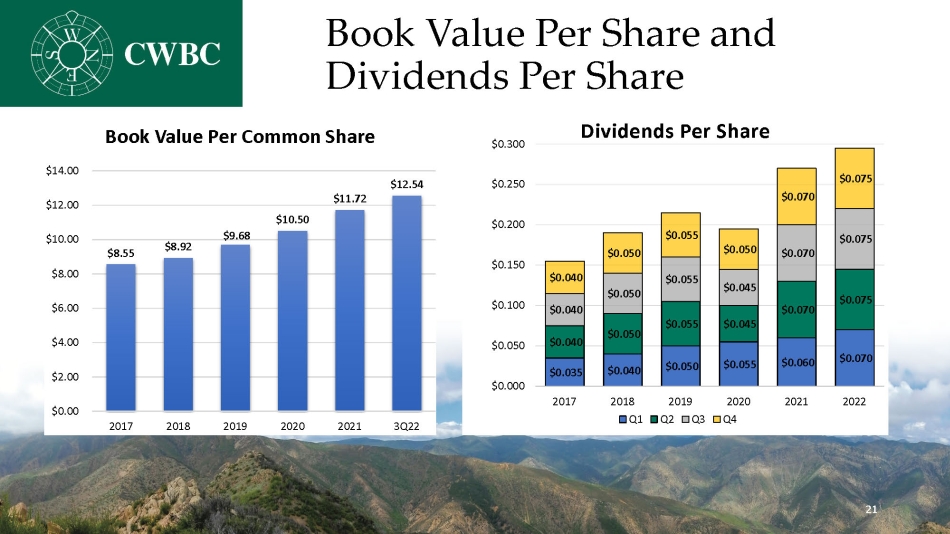
Book Value Per Share and Dividends Per Share $8.55 $8.92 $9.68 $10.50 $11.72 $12.54 $0.00 $2.00 $4.00 $6.00 $8.00 $10.00 $12.00 $14.00 2017 2018 2019 2020 2021 3Q22 Book Value Per Common Share $0.035 $0.040 $0.050 $0.055 $0.060 $0.070 $0.040 $0.050 $0.055 $0.045 $0.070 $0.075 $0.040 $0.050 $0.055 $0.045 $0.070 $0.075 $0.040 $0.050 $0.055 $0.050 $0.070 $0.075 $0.000 $0.050 $0.100 $0.150 $0.200 $0.250 $0.300 2017 2018 2019 2020 2021 2022 Dividends Per Share Q1 Q2 Q3 Q4 21
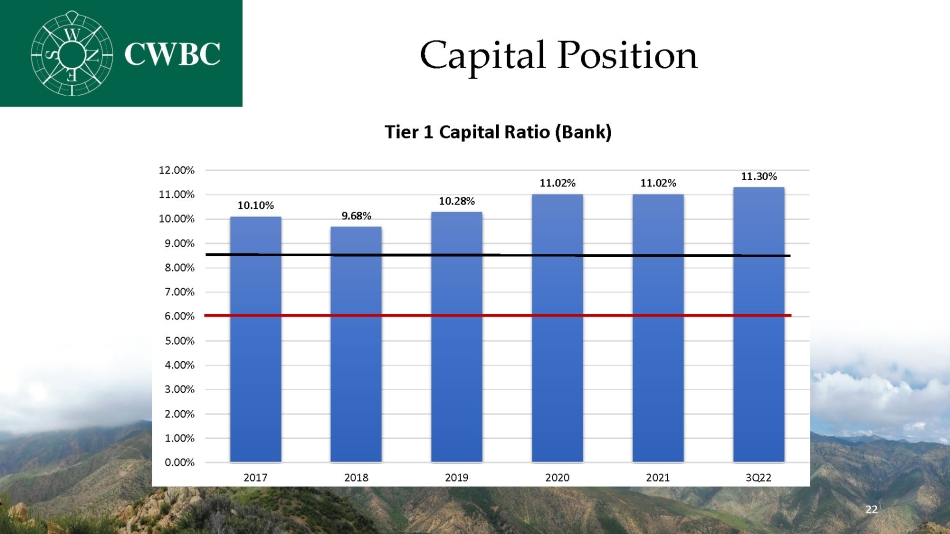
Capital Position 22 10.10% 9.68% 10.28% 11.02% 11.02% 11.30% 0.00% 1.00% 2.00% 3.00% 4.00% 5.00% 6.00% 7.00% 8.00% 9.00% 10.00% 11.00% 12.00% 2017 2018 2019 2020 2021 3Q22 Tier 1 Capital Ratio (Bank)

Focused on Core Deposit Growth Note: Deposit Market Share Data as of 6/30/22 Source: S&P Global Market Intelligence City Branches CWB Deposits CWB Market CWB # of Branches Total Market Deposits 1 Goleta $2,572 13 $347 13.5% 1 2 Ventura $4,230 22 $130 3.1% 1 3 Santa Maria $2,992 18 $70 2.3% 1 4 Santa Barbara $8,864 33 $166 1.9% 1 5 San Luis Obispo $3,614 17 $61 1.7% 1 6 Oxnard $3,223 20 $83 2.6% 1 7 Paso Robles $1,812 12 $39 2.2% 1 Total $27,307 135 $896 Branch Summary Branch Map 23
Strategic Objectives • Drive top line revenue growth • Expand market share of Core deposits • Leverage operating model to improve earnings and efficiency • Invest in talent for future growth and profitability • Maintain solid margin and credit quality • Take advantage of disruptive events 24

Why Community West Bancshares? • Great locations and markets • Market disruptions are creating new opportunities • Experienced board and management • Good & improving core earnings • High insider ownership • Trading at attractive levels • Well positioned for long - term value creation 25
