Exhibit 99.2
Supplemental Information Package
and Non-GAAP Reconciliations
Second Quarter • June 30, 2014
The Foundation for a Wireless World.
CrownCastle.com
Crown Castle International Corp.
Second Quarter 2014
|
| |
| TABLE OF CONTENTS |
| | Page |
| Company Overview | |
| Profile and Strategy | |
| Historical Dividend and AFFO per Share | |
| Portfolio Footprint | |
| Corporate Information | |
| Research Coverage | |
| Historical Common Stock Data | |
| Portfolio and Financial Highlights | 6-7 |
| Outlook - 3Q14 and Full Year 2014 | 7-8 |
| Financials & Metrics | |
| Consolidated Balance Sheet | |
| Consolidated Statement of Operations | |
| Segment Operating Results | |
| FFO and AFFO Reconciliations | |
| Consolidated Statement of Cash Flows | |
| Site Rental Revenue Growth | |
| Site Rental Gross Margin Growth | |
| Summary of Straight-Line, Prepaid Rent Activity, and Capital Expenditures | |
| Lease Renewal and Lease Distribution | |
| Customer Overview | |
| Asset Portfolio Overview | |
| Summary of Tower Portfolio by Vintage | |
| Portfolio Overview | 19-20 |
| Ground Interest Overview | |
| Ground Interest Activity | |
| Small Cell Network Overview | |
| Capitalization Overview | |
| Capitalization Overview | |
| Debt Maturity Overview | |
| Liquidity Overview | |
| Maintenance and Financial Covenants | 26-27 |
| Interest Rate Sensitivity | |
| Appendix | |
Cautionary Language Regarding Forward-Looking Statements
This supplemental information package ("Supplement") contains forward-looking statements and information that are based on our management's current expectations as of the date of this Supplement. Statements that are not historical facts are hereby identified as forward-looking statements. Words such as "Outlook", "guide", "forecast", "estimate", "anticipate", "project", "plan", "intend", "believe", "expect", "likely", "predicted", and any variations of these words and similar expressions are intended to identify such forward looking statements. Such statements include, but are not limited to, our Outlook for the second quarter of 2014 and full year 2014.
Such forward-looking statements are subject to certain risks, uncertainties and assumptions, including, but not limited to, prevailing market conditions. Should one or more of these or other risks or uncertainties materialize, or should underlying assumptions prove incorrect, actual results may vary materially from those expected. More information about potential risk factors which could affect our results is included in our filings with the Securities and Exchange Commission. Crown Castle assumes no obligation to update publicly any forward-looking statements, whether as a result of new information, future events or otherwise.
The components of financial information presented herein, both historical and forward looking, may not sum due to rounding. Definitions and reconciliations of non-GAAP measures, including FFO and AFFO, are provided in the Appendix to this Supplement.
As used herein, the term "including" and any variation thereof, means "including without limitation." The use of the word "or" herein is not exclusive.
Crown Castle International Corp.
Second Quarter 2014
|
| | | | |
COMPANY OVERVIEW | FINANCIALS & METRICS | ASSET PORTFOLIO OVERVIEW | CAPITALIZATION OVERVIEW | APPENDIX |
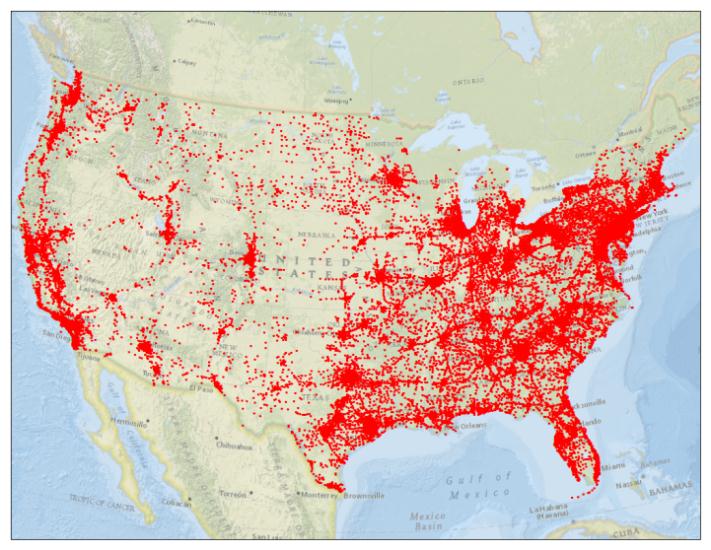
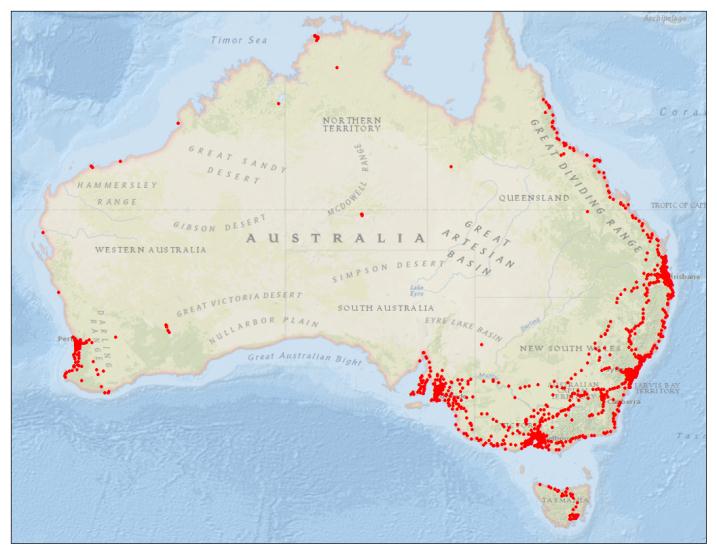
Crown Castle International Corp. (to which the terms "Crown Castle," "CCIC," "we," "our," "our Company," "the Company" or "us" as used herein refer) owns, operates and leases shared wireless infrastructure, including: (1) towers and other structures, such as rooftops (collectively, "towers"), and to a lesser extent, (2) distributed antenna systems, a type of small cell network ("small cells"), and (3) interests in land under third party towers in various forms ("third party land interests") (collectively, "wireless infrastructure"). Crown Castle offers significant wireless communications coverage in each of the top 100 US markets and to substantially all of the Australian population. Crown Castle owns, operates and manages approximately 40,000 and 1,800 towers in the US and Australia, respectively.
Our core business is providing access, including space or capacity, to our towers, and to a lesser extent, to our small cells and third party land interests via long-term contracts in various forms, including license, sublease and lease agreements (collectively, "contracts"). Our wireless infrastructure can accommodate multiple customers ("co-location") for antennas or other equipment necessary for the transmission of signals for wireless communication devices. We seek to increase our site rental revenues by adding more tenants on our wireless infrastructure, which we expect to result in significant incremental cash flows due to our relatively fixed operating costs.
Effective January 1, 2014, Crown Castle commenced operating as a Real Estate Investment Trust ("REIT") for U.S. federal income tax purposes as it relates to our towers and third party land interests, excluding our operations in Australia.
Our strategy is to translate anticipated demand for our wireless infrastructure into growth in our cash flows and long-term stockholder value. We measure "long-term stockholder value" as the combined growth in our per share results and dividends to common stockholders. The key elements of our strategy are to:
| |
| • | Organically grow the cash flows from our wireless infrastructure. We seek to maximize the site rental cash flows derived from our wireless infrastructure by co-locating additional tenants on our wireless infrastructure through long-term contracts as our customers deploy and improve their wireless networks. We seek to maximize new tenant additions or modifications of existing installations (collectively, "new tenant additions") through our focus on customer service and deployment speed. Due to the relatively fixed nature of the costs to operate our wireless infrastructure (which tend to increase at approximately the rate of inflation), we expect increases in cash rental receipts from new tenant additions and the related subsequent impact from contracted escalations to result in growth in our operating cash flows. We believe there is considerable additional future demand for our existing wireless infrastructure based on their location and the anticipated growth in the wireless communications industry. Substantially all of our wireless infrastructure can accommodate additional tenancy, either as currently constructed or with appropriate modifications to the structure, which we expect to have high incremental returns. |
| |
| • | Allocate capital efficiently. We seek to allocate our available capital, including the net cash provided by our operating activities, in a manner that will increase long-term stockholder value, including dividends to common stockholders. Our historical discretionary investments have included the following (in no particular order): |
| |
| ▪ | purchase shares of our common stock ("common stock") from time to time; |
| |
| ▪ | acquire or construct wireless infrastructure; |
| |
| ▪ | acquire land interests under towers; |
| |
| ▪ | make improvements and structural enhancements to our existing wireless infrastructure; or |
| |
| ▪ | purchase, repay or redeem our debt. |
Our long-term strategy is based on our belief that additional demand for our wireless infrastructure will be created by the expected continued growth in the wireless communications industry, which is predominately driven by the demand for wireless data services by consumers. We believe that additional demand for wireless infrastructure will create future growth opportunities for us. We believe that such demand for our wireless infrastructure will continue, will result in organic growth of our cash flows due to new tenant additions on our existing wireless infrastructure, and will create other growth opportunities for us, such as demand for new wireless infrastructure.
Crown Castle International Corp.
Second Quarter 2014
|
| | | | |
COMPANY OVERVIEW | FINANCIALS & METRICS | ASSET PORTFOLIO OVERVIEW | CAPITALIZATION OVERVIEW | APPENDIX |
|
| | | | |
HISTORICAL DIVIDEND AND AFFO PER SHARE (1) |
|
| | | | |
| U.S. FOOTPRINT | | AUSTRALIAN FOOTPRINT |
| |
| (1) | See reconciliations and definitions provided herein. See also "Definitions of Non-GAAP Financial Measures and Other Calculations" in the Appendix for a discussion of the definitions of FFO and AFFO. |
| |
| (2) | Last quarter annualized ("LQA") calculated as the most recently completed quarterly period times four. |
Crown Castle International Corp.
Second Quarter 2014
|
| | | | |
COMPANY OVERVIEW | FINANCIALS & METRICS | ASSET PORTFOLIO OVERVIEW | CAPITALIZATION OVERVIEW | APPENDIX |
|
| |
| GENERAL COMPANY INFORMATION |
| Principal executive offices | 1220 Augusta Drive, Suite 600, Houston, TX 77057 |
| Common shares trading symbol | CCI |
| Stock exchange listing | New York Stock Exchange |
| Fiscal year ending date | December 31 |
| Fitch - Long Term Issuer Default Rating | BB |
| Moody’s - Long Term Corporate Family Rating | Ba2 |
| Standard & Poor’s - Long Term Local Issuer Credit Rating | BB |
Note: These credit ratings may not reflect the potential risks relating to the structure or trading of the Company’s securities and are provided solely for informational purposes. Credit ratings are not recommendations to buy, sell or hold any security, and may be revised or withdrawn at any time by the issuing organization in its sole discretion. The Company does not undertake any obligation to maintain the ratings or to advise of any change in the ratings. Each agency’s rating should be evaluated independently of any other agency’s rating. An explanation of the significances of the ratings can be obtained from each of the ratings agencies.
|
| | | |
| EXECUTIVE MANAGEMENT TEAM |
| Name | Age | Years with Company | Position |
| W. Benjamin Moreland | 50 | 14 | President and Chief Executive Officer |
| Jay A. Brown | 41 | 14 | Senior Vice President, Chief Financial Officer and Treasurer |
| James D. Young | 52 | 8 | Senior Vice President and Chief Operating Officer |
| E. Blake Hawk | 64 | 15 | Executive Vice President and General Counsel |
| Patrick Slowey | 57 | 13 | Senior Vice President and Chief Commercial Officer |
| Philip M. Kelley | 41 | 17 | Senior Vice President-Corporate Development and Strategy |
|
| | | | |
| BOARD OF DIRECTORS |
| Name | Position | Committees | Age | Years as Director |
| J. Landis Martin | Chairman | NCG(1) | 68 | 17 |
| P. Robert Bartolo | Director | Audit | 42 | <1 |
| Cindy Christy | Director | NCG(1), Strategy | 48 | 6 |
| Ari Q. Fitzgerald | Director | Compensation, Strategy | 51 | 11 |
| Robert E. Garrison II | Director | Audit, Compensation | 72 | 9 |
| Dale N. Hatfield | Director | NCG(1), Strategy | 76 | 12 |
| Lee W. Hogan | Director | Audit, Compensation, Strategy | 69 | 13 |
| Edward C. Hutcheson | Director | Strategy | 68 | 17 |
| John P. Kelly | Director | Strategy | 56 | 14 |
| Robert F. McKenzie | Director | Audit, Strategy | 70 | 19 |
| W. Benjamin Moreland | Director | | 50 | 7 |
| |
| (1) | Nominating & Corporate Governance Committee |
Crown Castle International Corp.
Second Quarter 2014
|
| | | | |
COMPANY OVERVIEW | FINANCIALS & METRICS | ASSET PORTFOLIO OVERVIEW | CAPITALIZATION OVERVIEW | APPENDIX |
|
| | |
| RESEARCH COVERAGE |
| Equity Research |
Bank of America David Barden (646) 855-1320 | Barclays Amir Rozwadowski (212) 526-4043 | Canaccord Genuity Greg Miller (212) 389-8128 |
Citigroup Michael Rollins (212) 816-1116 | Cowen and Company Colby Synesael (646) 562-1355 | Credit Suisse
Joseph Mastrogiovanni
(212) 325-3757 |
Evercore Partners
Jonathan Schildkraut
(212) 497-0864 | Jefferies
Mike McCormack
(212) 284-2516 | JPMorgan
Philip Cusick
(212) 622-1444 |
Macquarie
Kevin Smithen
(212) 231-0695 | Morgan Stanley
Simon Flannery
(212) 761-6432 | New Street Research
Jonathan Chaplin
(212) 921-9876 |
Nomura
Adam Ilkowitz
(212) 298-4121 | Oppenheimer & Co.
Timothy Horan
(212) 667-8137 | Pacific Crest Securities
Michael Bowen
(503) 727-0721 |
Raymond James
Ric Prentiss
(727) 567-2567 | RBC Capital Markets
Jonathan Atkin
(415) 633-8589 | UBS
Batya Levi
(212) 713-8824 |
Wells Fargo Securities, LLC
Jennifer Fritzsche
(312) 920-3548 | | |
| | | |
| Rating Agency |
Fitch John Culver (312) 368-3216 | Moody’s Christopher Wimmer (212) 553-2947 | Standard & Poor’s Michael Weinstein (212) 438-4861 |
|
| | | | | | | | | | | | | | | |
| HISTORICAL COMMON STOCK DATA |
| | Three Months Ended |
| (in millions, except per share data) | 6/30/14 | 3/31/14 | 12/31/13 | 9/30/13 | 6/30/13 |
High price(1) | $ | 77.58 |
| $ | 75.82 |
| $ | 76.49 |
| $ | 77.26 |
| $ | 80.39 |
|
Low price(1) | $ | 70.95 |
| $ | 67.79 |
| $ | 69.21 |
| $ | 66.10 |
| $ | 66.32 |
|
Period end closing price(2) | $ | 74.26 |
| $ | 73.43 |
| $ | 72.74 |
| $ | 72.34 |
| 71.71 |
|
| Dividends paid per common share | $ | 0.35 |
| $ | 0.35 |
| — |
| — |
| — |
|
Volume weighted average price for the period(1) | $ | 74.56 |
| $ | 72.58 |
| $ | 73.58 |
| $ | 70.99 |
| $ | 72.06 |
|
| Common shares outstanding - diluted, at period end | 333 |
| 333 |
| 334 |
| 293 |
| 294 |
|
Market value of outstanding common shares, at period end(3) | $ | 24,793 |
| $ | 24,510 |
| $ | 24,299 |
| $ | 21,173 |
| 20,988 |
|
| |
| (1) | Based on the sales price, adjusted for dividends, as reported by Bloomberg. |
| |
| (2) | Based on the period end closing price as reported by Bloomberg. |
| |
| (3) | Period end market value of outstanding common shares is calculated as the product of (a) basic shares of common stock outstanding at period end and (b) closing share price at period end, adjusted for dividends, as reported by Bloomberg. |
Crown Castle International Corp.
Second Quarter 2014
|
| | | | |
COMPANY OVERVIEW | FINANCIALS & METRICS | ASSET PORTFOLIO OVERVIEW | CAPITALIZATION OVERVIEW | APPENDIX |
|
| | | | | | |
| SUMMARY PORTFOLIO HIGHLIGHTS |
| (as of June 30, 2014) | U.S. | Australia |
Number of towers(1) | 39,600 |
| 1,761 |
|
| Average number of tenants per tower | 2.3 |
| 2.3 |
|
Remaining contracted customer receivables ($ in billions)(2) | $ | 21 |
| $ | 1 |
|
Weighted average remaining customer contract term (years)(3) | 7 |
| 6 |
|
| Percent of towers in the Top 50 / 100 Basic Trading Areas | 56% / 71% |
| Not Applicable |
|
| Percent of ground leased / owned (by site rental gross margin) | 66% / 34% |
| 87% / 13% |
|
Weighted average maturity of ground leases (years)(4) | 30 |
| 18 |
|
|
| | | | | | | | | | | | | | | |
| SUMMARY FINANCIAL HIGHLIGHTS |
| | Three Months Ended June 30, | | Six Months Ended June 30, |
| (dollars in thousands, except per share amounts) | 2014 | | 2013 | | 2014 | | 2013 |
| Operating Data: | | | | | | | |
| Net revenues | | | | | | | |
| Site rental | $ | 746,340 |
| | $ | 616,849 |
| | $ | 1,493,502 |
| | $ | 1,232,264 |
|
| Network services and other | 170,005 |
| | 118,079 |
| | 298,793 |
| | 242,724 |
|
| Net revenues | $ | 916,345 |
| | $ | 734,928 |
| | $ | 1,792,295 |
| | $ | 1,474,988 |
|
| | | | | | | | |
| Gross margin | | | | | | | |
| Site rental | $ | 509,349 |
| | $ | 437,834 |
| | $ | 1,028,435 |
| | $ | 875,643 |
|
| Network services and other | 66,558 |
| | 47,880 |
| | 122,472 |
| | 95,148 |
|
| Total gross margin | $ | 575,907 |
| | $ | 485,714 |
| | $ | 1,150,907 |
| | $ | 970,791 |
|
| | | | | | | | |
| Net income (loss) attributable to CCIC common stockholders | $ | 23,012 |
| | $ | 52,359 |
| | $ | 113,512 |
| | $ | 67,821 |
|
| Net income (loss) attributable to CCIC common stockholders per share - diluted | 0.07 |
| | 0.18 |
| | 0.34 |
| | 0.23 |
|
| | | | | | | | |
Non-GAAP Data(5): | | | | | | | |
| Adjusted EBITDA | $ | 530,629 |
| | $ | 444,395 |
| | $ | 1,057,612 |
| | $ | 885,189 |
|
FFO(6) | 275,632 |
| | 243,496 |
| | 613,285 |
| | 444,428 |
|
| AFFO | 350,526 |
| | 272,877 |
| | 699,270 |
| | 535,449 |
|
| AFFO per share | $ | 1.05 |
| | $ | 0.93 |
| | $ | 2.10 |
| | $ | 1.83 |
|
| | | | | | | | |
| Summary Cash Flow Data: | | | | | | | |
| Net cash provided by (used for) operating activities | $ | 401,393 |
| | $ | 273,401 |
| | 763,676 |
| | 560,027 |
|
Net cash provided by (used for) investing activities(7) | (193,585 | ) | | (146,440 | ) | | (397,804 | ) | | (275,456 | ) |
| Net cash provided by (used for) financing activities | (181,297 | ) | | (159,610 | ) | | (355,756 | ) | | (596,097 | ) |
| |
| (1) | Includes towers and rooftops, excludes small cells and third-party land interests. |
| |
| (2) | Excludes renewal terms at customers' opinion. |
| |
| (3) | Excludes renewal terms at customers' option, weighted by site rental revenues. |
| |
| (4) | Includes renewal terms at the Company's option, weighted by site rental gross margin. |
| |
| (5) | See reconciliations and definitions provided herein. See also "Definitions of Non-GAAP Measures and Other Terms" in the Appendix for a discussion of the definition of FFO and AFFO. |
| |
| (6) | Calculated to present the periods shown in a manner which is consistent with our commencement of operations as a REIT on January 1, 2014. |
| |
| (7) | Includes net cash used for acquisitions of approximately $28 million and $14 million for the three months ended June 30, 2014 and 2013, respectively, and $90 million and $27 million for the six months ended June 30, 2014 and 2013, respectively. |
Crown Castle International Corp.
Second Quarter 2014
|
| | | | |
COMPANY OVERVIEW | FINANCIALS & METRICS | ASSET PORTFOLIO OVERVIEW | CAPITALIZATION OVERVIEW | APPENDIX |
|
| | | | | | | | |
| SUMMARY FINANCIAL HIGHLIGHTS (CONTINUED) |
| | | Three Months Ended June 30, |
| (dollars in thousands) | | 2014 | | 2013 |
| Other Data: | | | | |
| Net debt to last quarter annualized adjusted EBITDA | | 5.3x |
| | 6.0x |
|
| Dividend per common share | | $ | 0.35 |
| | $ | — |
|
AFFO payout ratio(2) | | 33 | % | | — |
|
| | | | | |
| (in thousands of dollars) | | June 30, 2014 | | December 31, 2013 |
| Balance Sheet Data (at period end): | | | | |
| Cash and cash equivalents | | $ | 227,479 |
| | $ | 223,394 |
|
| Property and equipment, net | | 8,888,426 |
| | 8,947,677 |
|
| Total assets | | 20,672,059 |
| | 20,594,908 |
|
| Total debt and other long-term obligations | | 11,570,251 |
| | 11,594,500 |
|
| Total CCIC stockholders' equity | | 6,861,338 |
| | 6,926,717 |
|
|
| | |
| OUTLOOK FOR THIRD QUARTER 2014 AND FULL YEAR 2014 |
| (dollars in millions, except per share amounts) | Third Quarter 2014 | Full Year 2014 |
| Site rental revenues | $746 to $751 | $2,990 to $3,000 |
| Site rental cost of operations | $237 to $242 | $933 to $943 |
| Site rental gross margin | $506 to $511 | $2,052 to $2,062 |
Adjusted EBITDA(2) | $521 to $526 | $2,100 to $2,115 |
Interest expense and amortization of deferred financing costs(1) | $139 to $144 | $569 to $579 |
FFO(2) | $337 to $342 | $1,286 to $1,301 |
AFFO(2) | $332 to $337 | $1,376 to $1,391 |
AFFO per share(2)(3) | $1.00 to $1.01 | $4.13 to $4.18 |
| Net income (loss) | $81 to $114 | $292 to $376 |
Net income (loss) per share - diluted(3) | $0.24 to $0.34 | $0.88 to $1.13 |
| Net income (loss) attributable to CCIC common stockholders | $69 to $102 | $243 to $327 |
Net income (loss) attributable to CCIC common stockholders per share - diluted(3) | $0.21 to $0.31 | $0.73 to $0.98 |
| |
| (1) | See the reconciliation of "components of interest expense and amortization of deferred financing costs" in the Appendix. |
| |
| (2) | See reconciliations and definitions provided herein. |
| |
| (3) | Based on 333.1 million diluted shares outstanding as of June 30, 2014. |
Crown Castle International Corp.
Second Quarter 2014
|
| | | | |
COMPANY OVERVIEW | FINANCIALS & METRICS | ASSET PORTFOLIO OVERVIEW | CAPITALIZATION OVERVIEW | APPENDIX |
|
| | | | | | |
OUTLOOK FOR FULL YEAR 2014 SITE RENTAL REVENUE GROWTH |
| (dollars in millions) | Midpoint of Full Year 2014 Outlook | Full Year 2013 |
| Reported GAAP site rental revenues | $ | 2,995 |
| $ | 2,504 |
|
| Site rental straight-line revenues | (188 | ) | (219 | ) |
Site Rental Revenues, as Adjusted(1) | $ | 2,807 |
| $ | 2,285 |
|
| Cash adjustments: | | |
| FX and other | 2 |
| |
| New tower acquisitions and builds | (379 | ) | |
Organic Site Rental Revenues(2)(3) | $ | 2,430 |
| |
| Year-Over-Year Revenue Growth | | |
| Reported GAAP site rental revenues | 19.6 | % | |
| Site Rental Revenues, as Adjusted | 22.9 | % | |
Organic Site Rental Revenues(4) | 6.4 | % | |
|
| | | | | | |
| OUTLOOK FOR ORGANIC SITE RENTAL REVENUE GROWTH |
| | Midpoint of Full Year 2014 Outlook |
| New leasing activity | 5.4% |
| Escalators | 3.6% |
| Organic Site Rental Revenue Growth, before non-renewals | 9.0% |
| Non-renewals | (2.6)% |
Organic Site Rental Revenue Growth(4) | 6.4% |
| | |
OUTLOOK FOR FULL YEAR 2014 SITE RENTAL GROSS MARGIN GROWTH |
| (dollars in millions) | Midpoint of Full Year 2014 Outlook | Full Year 2013 |
| Reported GAAP site rental gross margin | $ | 2,057 |
| $ | 1,779 |
|
| Straight line revenues and expenses, net | (83 | ) | (138 | ) |
Site Rental Gross Margin, as Adjusted(1) | $ | 1,974 |
| $ | 1,640 |
|
| Cash adjustments: | | |
| FX and other | — |
| |
| New tower acquisitions and builds | (218 | ) | |
Organic Site Rental Gross Margin(2)(3) | $ | 1,756 |
| |
| Year-Over-Year Gross Margin Growth | | |
| Reported GAAP site rental gross margin | 15.7 | % | |
| Site Rental Gross Margin, as Adjusted | 20.3 | % | |
Organic Site Rental Gross Margin(5) | 7.0 | % | |
| Year-Over-Year Incremental Margin | | |
| Reported GAAP site rental gross margin | 56.7 | % | |
| Site Rental Gross Margin, as Adjusted | 63.9 | % | |
Organic Site Rental Gross Margin(6) | 79.6 | % | |
| |
| (1) | Includes amortization of prepaid rent. |
| |
| (2) | Includes Site Rental Revenues, as Adjusted, from the construction of new small cell nodes. |
| |
| (3) | See definitions provided herein. |
| |
| (4) | Calculated as the percentage change from Site Rental Revenues, as Adjusted, for the prior period when compared to Organic Site Rental Revenues for the current period. |
| |
| (5) | Calculated as the percentage change from Site Rental Gross Margin, as Adjusted for the prior period when compared to Organic Site Rental Gross Margin in the current period. |
Crown Castle International Corp.
Second Quarter 2014
|
| | | | |
COMPANY OVERVIEW | FINANCIALS & METRICS | ASSET PORTFOLIO OVERVIEW | CAPITALIZATION OVERVIEW | APPENDIX |
| |
| (6) | Calculated as the change from Site Rental Gross Margin, as Adjusted for the prior period when compared to Organic Site Rental Gross Margin in the current period, divided by the change from Site Rental Revenues, as Adjusted in the prior period when compared to Organic Site Rental Revenues for the current period. |
Crown Castle International Corp.
Second Quarter 2014
|
| | | | |
COMPANY OVERVIEW | FINANCIALS & METRICS | ASSET PORTFOLIO OVERVIEW | CAPITALIZATION OVERVIEW | APPENDIX |
|
| | | | | | | |
| CONSOLIDATED BALANCE SHEET (Unaudited) |
| (dollars in thousands, except share amounts) | June 30,
2014 | | December 31,
2013 |
| | | | |
| ASSETS | | | |
| Current assets: | | | |
| Cash and cash equivalents | $ | 227,479 |
| | $ | 223,394 |
|
| Restricted cash | 155,725 |
| | 183,526 |
|
| Receivables, net | 304,015 |
| | 249,925 |
|
| Prepaid expenses | 150,873 |
| | 132,003 |
|
| Deferred income tax assets | 33,379 |
| | 26,714 |
|
| Other current assets | 76,275 |
| | 77,121 |
|
| Total current assets | 947,746 |
| | 892,683 |
|
| Deferred site rental receivables | 1,180,646 |
| | 1,078,995 |
|
| Property and equipment, net | 8,888,426 |
| | 8,947,677 |
|
| Goodwill | 4,939,755 |
| | 4,916,426 |
|
| Other intangible assets, net | 3,922,063 |
| | 4,057,865 |
|
| Deferred income tax assets | 13,283 |
| | 19,008 |
|
| Long-term prepaid rent, deferred financing costs and other assets, net | 780,140 |
| | 682,254 |
|
| Total assets | $ | 20,672,059 |
| | $ | 20,594,908 |
|
| | | | |
| LIABILITIES AND EQUITY | | | |
| Current liabilities: | | | |
| Accounts payable | $ | 132,529 |
| | $ | 145,390 |
|
| Accrued interest | 66,848 |
| | 65,582 |
|
| Deferred revenues | 320,134 |
| | 260,114 |
|
| Other accrued liabilities | 170,743 |
| | 181,715 |
|
| Current maturities of debt and other obligations | 105,624 |
| | 103,586 |
|
| Total current liabilities | 795,878 |
| | 756,387 |
|
| Debt and other long-term obligations | 11,464,627 |
| | 11,490,914 |
|
| Deferred income tax liabilities | 54,123 |
| | 56,513 |
|
| Deferred credits and other liabilities | 1,477,995 |
| | 1,349,919 |
|
| Total liabilities | 13,792,623 |
| | 13,653,733 |
|
| Commitments and contingencies |
| |
|
| CCIC stockholders' equity: | | | |
| Common stock, $.01 par value; 600,000,000 shares authorized; shares issued and outstanding: June 30, 2014—333,861,080 and December 31, 2013—334,070,016 | 3,339 |
| | 3,341 |
|
| 4.50% Mandatory Convertible Preferred Stock, Series A, $.01 par value; 20,000,000 shares authorized; shares issued and outstanding: June 30, 2014 and December 31, 2013—9,775,000; aggregate liquidation value: June 30, 2014 and December 31, 2013—$977,500 | 98 |
| | 98 |
|
| Additional paid-in capital | 9,488,414 |
| | 9,482,769 |
|
| Accumulated other comprehensive income (loss) | 26,205 |
| | (23,612 | ) |
| Dividends/distributions in excess of earnings | (2,656,718 | ) | | (2,535,879 | ) |
| Total CCIC stockholders' equity | 6,861,338 |
| | 6,926,717 |
|
| Noncontrolling interest | 18,098 |
| | 14,458 |
|
| Total equity | 6,879,436 |
| | 6,941,175 |
|
| Total liabilities and equity | $ | 20,672,059 |
| | $ | 20,594,908 |
|
Crown Castle International Corp.
Second Quarter 2014
|
| | | | |
COMPANY OVERVIEW | FINANCIALS & METRICS | ASSET PORTFOLIO OVERVIEW | CAPITALIZATION OVERVIEW | APPENDIX |
|
| | | | | | | | | | | | | | | |
| CONSOLIDATED STATEMENT OF OPERATIONS (Unaudited) |
| | Three Months Ended June 30, | | Six Months Ended June 30, |
| (dollars in thousands, except share and per share amounts) | 2014 | | 2013 | | 2014 | | 2013 |
| Net revenues: | | | | | | | |
| Site rental | $ | 746,340 |
| | $ | 616,849 |
| | $ | 1,493,502 |
| | $ | 1,232,264 |
|
| Network services and other | 170,005 |
| | 118,079 |
| | 298,793 |
| | 242,724 |
|
| Net revenues | 916,345 |
| | 734,928 |
| | 1,792,295 |
| | 1,474,988 |
|
| Operating expenses: | | | | | | | |
Costs of operations(1): | | | | | | | |
| Site rental | 236,991 |
| | 179,015 |
| | 465,067 |
| | 356,621 |
|
| Network services and other | 103,447 |
| | 70,199 |
| | 176,321 |
| | 147,576 |
|
| Total costs of operations | 340,438 |
| | 249,214 |
| | 641,388 |
| | 504,197 |
|
| General and administrative | 69,153 |
| | 54,790 |
| | 134,002 |
| | 113,035 |
|
| Asset write-down charges | 3,136 |
| | 3,097 |
| | 5,869 |
| | 6,812 |
|
| Acquisition and integration costs | 19,197 |
| | 7,215 |
| | 24,856 |
| | 8,817 |
|
| Depreciation, amortization and accretion | 254,235 |
| | 190,651 |
| | 504,426 |
| | 377,110 |
|
| Total operating expenses | 686,159 |
| | 504,967 |
| | 1,310,541 |
| | 1,009,971 |
|
| Operating income (loss) | 230,186 |
| | 229,961 |
| | 481,754 |
| | 465,017 |
|
| Interest expense and amortization of deferred financing costs | (144,534 | ) | | (140,256 | ) | | (290,934 | ) | | (304,625 | ) |
| Gains (losses) on retirement of long-term obligations | (44,629 | ) | | (577 | ) | | (44,629 | ) | | (36,486 | ) |
| Interest income | 189 |
| | 328 |
| | 362 |
| | 625 |
|
| Other income (expense) | (6,063 | ) | | 507 |
| | (8,799 | ) | | (122 | ) |
| Income (loss) before income taxes | 35,149 |
| | 89,963 |
| | 137,754 |
| | 124,409 |
|
| Benefit (provision) for income taxes | 208 |
| | (36,587 | ) | | 396 |
| | (54,295 | ) |
| Net income (loss) | 35,357 |
| | 53,376 |
| | 138,150 |
| | 70,114 |
|
| Less: net income (loss) attributable to the noncontrolling interest | 1,348 |
| | 1,017 |
| | 2,644 |
| | 2,293 |
|
| Net income (loss) attributable to CCIC stockholders | 34,009 |
| | 52,359 |
| | 135,506 |
| | 67,821 |
|
| Dividends on preferred stock | (10,997 | ) | | — |
| | (21,994 | ) | | — |
|
| Net income (loss) attributable to CCIC common stockholders | $ | 23,012 |
| | $ | 52,359 |
| | $ | 113,512 |
| | $ | 67,821 |
|
| | | | | | | | |
| Net income (loss) attributable to CCIC common stockholders, per common share: | | | | | | | |
| Basic | $ | 0.07 |
| | $ | 0.18 |
| | $ | 0.34 |
| | $ | 0.23 |
|
| Diluted | $ | 0.07 |
| | $ | 0.18 |
| | $ | 0.34 |
| | $ | 0.23 |
|
| | | | | | | | |
| Weighted-average common shares outstanding (in thousands): | | | | | | | |
| Basic | 332,344 |
| | 291,225 |
| | 332,189 |
| | 291,164 |
|
| Diluted | 333,081 |
| | 292,706 |
| | 333,034 |
| | 292,570 |
|
| |
(1) | Exclusive of depreciation, amortization and accretion shown separately |
Crown Castle International Corp.
Second Quarter 2014
|
| | | | |
COMPANY OVERVIEW | FINANCIALS & METRICS | ASSET PORTFOLIO OVERVIEW | CAPITALIZATION OVERVIEW | APPENDIX |
|
| | | | | | | | | | | |
| SEGMENT OPERATING RESULTS |
| | Three Months Ended June 30, 2014 |
| (dollars in thousands) | CCUSA | | CCAL | | Consolidated Total |
| Net Revenues | | | | | |
| Site rental | $ | 710,783 |
| | $ | 35,557 |
| | $ | 746,340 |
|
| Services | 167,459 |
| | 2,546 |
| | 170,005 |
|
| Total net revenues | 878,242 |
| | 38,103 |
| | 916,345 |
|
| | | | | | |
Operating expenses(1) | | | | | |
| Site rental | 227,032 |
| | 9,959 |
| | 236,991 |
|
| Services | 101,901 |
| | 1,546 |
| | 103,447 |
|
| Total operating expenses | 328,933 |
| | 11,505 |
| | 340,438 |
|
| | | | | | |
| General and administrative | 63,318 |
| | 5,835 |
| | 69,153 |
|
| | | | | | |
| Adjusted EBITDA | $ | 509,537 |
| | $ | 21,092 |
| | $ | 530,629 |
|
| |
| (1) | Exclusive of depreciation, amortization and accretion. |
|
| | | | | | | | | | | | | | | |
| FFO AND AFFO RECONCILIATIONS |
| | Three Months Ended June 30, | | Six Months Ended June 30, |
| (dollars in thousands, except share and per share amounts) | 2014 | | 2013 | | 2014 | | 2013 |
| Net income | $ | 35,357 |
| | $ | 53,376 |
| | $ | 138,150 |
| | $ | 70,114 |
|
| Real estate related depreciation, amortization and accretion | 249,484 |
| | 188,039 |
| | 493,904 |
| | 369,794 |
|
| Asset write-down charges | 3,136 |
| | 3,097 |
| | 5,869 |
| | 6,812 |
|
Adjustment for noncontrolling interest(1) | (1,348 | ) | | (1,017 | ) | | (2,644 | ) | | (2,293 | ) |
| Dividends on preferred stock | (10,997 | ) | | — |
| | (21,994 | ) | | — |
|
FFO(2) | $ | 275,632 |
| | $ | 243,496 |
| | $ | 613,285 |
| | $ | 444,428 |
|
| Weighted average common shares outstanding — diluted | 333,081 |
| | 292,706 |
| | 333,034 |
| | 292,570 |
|
FFO per share(2) | $ | 0.83 |
| | $ | 0.83 |
| | $ | 1.84 |
| | $ | 1.52 |
|
| | | | | | | | |
| FFO (from above) | 275,632 |
| | 243,496 |
| | 613,285 |
| | 444,428 |
|
| Adjustments to increase (decrease) FFO: | | | | | | | |
| Straight-line revenue | (52,134 | ) | | (56,919 | ) | | (102,940 | ) | | (116,318 | ) |
| Straight-line expense | 27,416 |
| | 20,572 |
| | 53,796 |
| | 41,278 |
|
| Stock-based compensation expense | 18,212 |
| | 9,608 |
| | 31,149 |
| | 19,707 |
|
Non-cash portion of tax provision(3) | (2,553 | ) | | 34,747 |
| | (4,885 | ) | | 50,808 |
|
| Non-real estate related depreciation, amortization and accretion | 4,751 |
| | 2,612 |
| | 10,521 |
| | 7,316 |
|
| Amortization of non-cash interest expense | 20,604 |
| | 20,551 |
| | 41,485 |
| | 57,471 |
|
| Other (income) expense | 6,063 |
| | (507 | ) | | 8,799 |
| | 122 |
|
| Gains (losses) on retirement of long-term obligations | 44,629 |
| | 577 |
| | 44,629 |
| | 36,486 |
|
| Acquisition and integration costs | 19,197 |
| | 7,215 |
| | 24,856 |
| | 8,817 |
|
Adjustment for noncontrolling interest(1) | 1,348 |
| | 1,017 |
| | 2,644 |
| | 2,293 |
|
| Capital improvement capital expenditures | (4,469 | ) | | (2,399 | ) | | (8,329 | ) | | (5,713 | ) |
| Corporate capital expenditures | (8,171 | ) | | (7,694 | ) | | (15,742 | ) | | (11,246 | ) |
AFFO(2) | $ | 350,526 |
| | $ | 272,877 |
| | $ | 699,270 |
| | $ | 535,449 |
|
| Weighted average common shares outstanding — diluted | 333,081 |
| | 292,706 |
| | 333,034 |
| | 292,570 |
|
AFFO per share(2) | $ | 1.05 |
| | $ | 0.93 |
| | $ | 2.10 |
| | $ | 1.83 |
|
| |
| (1) | Inclusive of the noncontrolling interest related to real estate related depreciation, amortization and accretion and asset write-downs. |
| |
| (2) | See reconciliations and definitions provided herein. See also "Definitions of Non-GAAP Measures and Other Calculations"in the Appendix for a discussion of the definitions of FFO and AFFO. |
| |
| (3) | Adjusts the income tax provision for 2013 to reflect our estimate of the cash taxes had we been a REIT, which predominately relates to foreign taxes paid. As a result, income tax expense (benefit) is lower by the amount of the adjustment. |
Crown Castle International Corp.
Second Quarter 2014
|
| | | | |
COMPANY OVERVIEW | FINANCIALS & METRICS | ASSET PORTFOLIO OVERVIEW | CAPITALIZATION OVERVIEW | APPENDIX |
|
| | | | | | | | | | | | |
| CONSOLIDATED STATEMENT OF CASH FLOWS (Unaudited) |
| | Six Months Ended June 30, |
| (dollars in thousands) | 2014 | | 2013 |
| Cash flows from operating activities: | | | |
| Net income (loss) | $ | 138,150 |
| | $ | 70,114 |
|
| Adjustments to reconcile net income (loss) to net cash provided by (used for) operating activities: | | | |
| Depreciation, amortization and accretion | 504,426 |
| | 377,110 |
|
| Gains (losses) on retirement of long-term obligations | 44,629 |
| | 36,486 |
|
| Amortization of deferred financing costs and other non-cash interest | 41,485 |
| | 57,471 |
|
| Stock-based compensation expense | 27,373 |
| | 19,472 |
|
| Asset write-down charges | 5,869 |
| | 6,812 |
|
| Deferred income tax benefit (provision) | (4,885 | ) | | 50,143 |
|
| Other adjustments, net | (1,328 | ) | | 1,291 |
|
| Changes in assets and liabilities, excluding the effects of acquisitions: | | | |
| Increase (decrease) in liabilities | 171,148 |
| | 82,652 |
|
| Decrease (increase) in assets | (163,191 | ) | | (141,524 | ) |
| Net cash provided by (used for) operating activities | 763,676 |
| | 560,027 |
|
| Cash flows from investing activities: | | | |
| Payments for acquisition of businesses, net of cash acquired | (90,442 | ) | | (27,280 | ) |
| Capital expenditures | (309,740 | ) | | (254,820 | ) |
| Other investing activities, net | 2,378 |
| | 6,644 |
|
| Net cash provided by (used for) investing activities | (397,804 | ) | | (275,456 | ) |
| Cash flows from financing activities: | | | |
| Proceeds from issuance of long-term debt | 845,750 |
| | 30,941 |
|
| Principal payments on debt and other long-term obligations | (55,385 | ) | | (51,085 | ) |
| Purchases and redemptions of long-term debt | (836,899 | ) | | (675,480 | ) |
| Purchases of capital stock | (21,730 | ) | | (98,867 | ) |
| Borrowings under revolving credit facility | 494,000 |
| | 48,000 |
|
| Payments under revolving credit facility | (534,000 | ) | | (255,000 | ) |
| Payments for financing costs | (15,834 | ) | | (5,654 | ) |
| Net decrease (increase) in restricted cash | 24,386 |
| | 411,048 |
|
| Dividends/distributions paid on common stock | (233,684 | ) | | — |
|
| Dividends paid on preferred stock | (22,360 | ) | | — |
|
| Net cash provided by (used for) financing activities | (355,756 | ) | | (596,097 | ) |
| Effect of exchange rate changes on cash | (6,031 | ) | | (2,952 | ) |
| Net increase (decrease) in cash and cash equivalents | 4,085 |
| | (314,478 | ) |
| Cash and cash equivalents at beginning of period | 223,394 |
| | 441,364 |
|
| Cash and cash equivalents at end of period | $ | 227,479 |
| | $ | 126,886 |
|
| Supplemental disclosure of cash flow information: | | | |
| Interest paid | 248,183 |
| | 212,592 |
|
| Income taxes paid | 12,690 |
| | 10,242 |
|
Crown Castle International Corp.
Second Quarter 2014
|
| | | | |
COMPANY OVERVIEW | FINANCIALS & METRICS | ASSET PORTFOLIO OVERVIEW | CAPITALIZATION OVERVIEW | APPENDIX |
|
| | | | | | | |
| SITE RENTAL REVENUE GROWTH |
| | Three Months Ended June 30, |
| (dollars in millions) | 2014 | | 2013 |
| Beginning towers as of June 30, 2013 | 31,601 |
| | |
| Net tower additions/(dispositions) | 9,760 |
| | |
| Ending towers as of June 30, 2014 | 41,361 |
| | |
| | | | |
| Reported GAAP site rental revenues | $ | 746 |
| | $ | 617 |
|
| Site rental straight-line revenues | (52 | ) | | (57 | ) |
Site Rental Revenues, as Adjusted(1) | $ | 694 |
| | $ | 560 |
|
| Cash adjustments: | | | |
| FX and other | 2 |
| | |
| New tower acquisitions and builds | (99 | ) | | |
Organic Site Rental Revenues(2)(3) | $ | 597 |
| | |
| Year-Over-Year Revenue Growth | | | |
| Reported GAAP site rental revenues | 21.0 | % | | |
| Site Rental Revenues, as Adjusted | 24.0 | % | | |
Organic Site Rental Revenues(4) | 6.7 | % | | |
|
| |
| ORGANIC SITE RENTAL REVENUE GROWTH |
| | Three Months Ended June 30, |
| | 2014 |
| New leasing activity | 5.5% |
| Escalators | 3.6% |
| Organic Site Rental Revenue growth, before non-renewals | 9.1% |
| Non-renewals | (2.4)% |
Organic Site Rental Revenue Growth(4) | 6.7% |
| |
| (1) | Includes amortization of prepaid rent; see the table “Summary of Prepaid Rent Activity” on page 15 for further details. |
| |
| (2) | Includes Site Rental Revenues, as Adjusted from the construction of new small cell nodes. |
| |
| (3) | See definitions provided herein. |
| |
| (4) | Calculated as the percentage change from Site Rental Revenues, as Adjusted, for the prior period when compared to Organic Site Rental Revenues for the current period. |
Crown Castle International Corp.
Second Quarter 2014
|
| | | | |
COMPANY OVERVIEW | FINANCIALS & METRICS | ASSET PORTFOLIO OVERVIEW | CAPITALIZATION OVERVIEW | APPENDIX |
|
| | | | | | | |
| SITE RENTAL GROSS MARGIN GROWTH |
| | Three Months Ended June 30, |
| (dollars in millions) | 2014 | | 2013 |
| Reported GAAP site rental gross margin | $ | 509 |
| | $ | 438 |
|
| Straight line revenues and expenses, net | (25 | ) | | (36 | ) |
| Site rental gross margin, as adjusted | $ | 485 |
| | $ | 402 |
|
| Cash adjustments: | | | |
| FX and other | 2 |
| | |
| New tower acquisitions and builds | (57 | ) | | |
Organic Site Rental Gross Margin(1)(2) | $ | 429 |
| | |
| Year-Over-Year Gross Margin Growth | | | |
| Reported GAAP site rental gross margin | 16.3 | % | | |
| Site Rental Gross Margin, as Adjusted | 20.7 | % | | |
Organic Site Rental Gross Margin(3) | 6.9 | % | | |
| Year-Over-Year Incremental Margin | | | |
| Reported GAAP site rental gross margin | 55.2 | % | | |
| Site Rental Gross Margin, as Adjusted | 61.8 | % | | |
Organic Site Rental Gross Margin(4) | 73.9 | % | | |
| |
| (1) | Includes Site Rental Revenues, as Adjusted, from the construction of new small cell nodes. |
| |
| (2) | See definitions provided herein. |
| |
| (3) | Calculated as the percentage change from Site Rental Gross Margin, as Adjusted for the prior period when compared to Organic Site Rental Gross Margin in the current period. |
| |
| (4) | Calculated as the change from Site Rental Gross Margin, as Adjusted for the prior period when compared to Organic Site Rental Gross Margin in the current period, divided by the change from Site Rental Revenues, as Adjusted in the prior period when compared to Organic Site Rental Revenues for the current period. |
Crown Castle International Corp.
Second Quarter 2014
|
| | | | |
COMPANY OVERVIEW | FINANCIALS & METRICS | ASSET PORTFOLIO OVERVIEW | CAPITALIZATION OVERVIEW | APPENDIX |
|
| | | | | | | | | | | | | | | |
SUMMARY OF SITE RENTAL STRAIGHT-LINE REVENUES AND EXPENSES(1) |
| | Three Months Ended June 30, | | Six Months Ended June 30, |
| (dollars in thousands) | 2014 | | 2013 | | 2014 | | 2013 |
| Total site rental straight-line revenue | $ | 52,134 |
| | $ | 56,919 |
| | $ | 102,940 |
| | $ | 116,318 |
|
| Total site rental straight-line expenses | 27,416 |
| | 20,572 |
| | 53,796 |
| | 41,278 |
|
|
| | | | | | | | | | | | | | | |
SUMMARY OF PREPAID RENT ACTIVITY(2) |
| | Three Months Ended June 30, | | Six Months Ended June 30, |
| (dollars in thousands) | 2014 | | 2013 | | 2014 | | 2013 |
| Prepaid rent received | $ | 83,607 |
| | $ | 45,947 |
| | $ | 151,830 |
| | $ | 89,690 |
|
| Amortization of prepaid rent | (22,143 | ) | | (14,932 | ) | | (41,514 | ) | | (29,952 | ) |
|
| | | | | | | |
| SUMMARY OF CAPITAL EXPENDITURES |
| | Three Months Ended June 30, |
| (dollars in thousands) | 2014 | | 2013 |
| Discretionary: | | | |
| Purchases of land interests | $ | 24,861 |
| | $ | 26,909 |
|
| Wireless infrastructure construction and improvements | 129,296 |
| | 101,465 |
|
| Sustaining | 12,640 |
| | 10,093 |
|
| Total | $ | 166,797 |
| | $ | 138,467 |
|
| |
| (1) | In accordance with GAAP accounting, if payment terms call for fixed escalations, or rent free periods, the revenue is recognized on a straight-line basis over the fixed, non-cancelable term of the contract. Since the Company recognizes revenue on a straight-line basis, a portion of the site rental revenue in a given period represents cash collected or contractually collectible in other periods. |
| |
| (2) | Reflects prepaid rent received from long-term tenant contracts and the amortization thereof for GAAP revenue recognition purposes. |
Crown Castle International Corp.
Second Quarter 2014
|
| | | | |
COMPANY OVERVIEW | FINANCIALS & METRICS | ASSET PORTFOLIO OVERVIEW | CAPITALIZATION OVERVIEW | APPENDIX |
|
| | | | | | | | | | | | | | | |
PROJECTED REVENUE FROM EXISTING CUSTOMER CONTRACTS(1) |
| | Remaining six months | Years Ended December 31, |
| (as of June 30, 2014; dollars in millions) | 2014 | 2015 | 2016 | 2017 | 2018 |
| Site rental revenue (GAAP) | $ | 1,474 |
| $ | 2,913 |
| $ | 2,926 |
| $ | 2,951 |
| $ | 2,977 |
|
| Site rental straight-line revenue | (82 | ) | (100 | ) | (27 | ) | 37 |
| 88 |
|
| Site Rental Revenues, as Adjusted | $ | 1,392 |
| $ | 2,813 |
| $ | 2,899 |
| $ | 2,989 |
| $ | 3,065 |
|
|
| | | | | | | | | | | | | | | |
PROJECTED GROUND LEASE EXPENSE FROM EXISTING GROUND LEASES(2) |
| | Remaining six months | Years Ended December 31, |
| (as of June 30, 2014; dollars in millions) | 2014 | 2015 | 2016 | 2017 | 2018 |
| Ground lease expense (GAAP) | $ | 339 |
| $ | 681 |
| $ | 685 |
| $ | 692 |
| $ | 698 |
|
| Site rental straight-line expense | (47 | ) | (86 | ) | (73 | ) | (61 | ) | (50 | ) |
| Ground Lease Expense, as Adjusted | $ | 291 |
| $ | 595 |
| $ | 613 |
| $ | 631 |
| $ | 648 |
|
|
| | | | | | | | | | | | | | | |
ANNUALIZED CASH SITE RENTAL REVENUE AT TIME OF RENEWAL(3) |
| | Remaining six months | Years Ended December 31, |
| (as of June 30, 2014; dollars in millions) | 2014 | 2015 | 2016 | 2017 | 2018 |
| AT&T | $ | 6 |
| $ | 27 |
| $ | 45 |
| $ | 20 |
| $ | 38 |
|
Sprint(4) | 12 |
| 29 |
| 45 |
| 41 |
| 38 |
|
| T-Mobile | 6 |
| 12 |
| 33 |
| 24 |
| 33 |
|
| Verizon | 5 |
| 11 |
| 11 |
| 16 |
| 17 |
|
| Optus | — |
| 29 |
| 3 |
| 9 |
| 2 |
|
| VHA | — |
| 2 |
| 7 |
| 11 |
| 2 |
|
| Telstra | — |
| 2 |
| 4 |
| 2 |
| 1 |
|
| All Others Combined | 18 |
| 45 |
| 39 |
| 28 |
| 32 |
|
| Total | $ | 48 |
| $ | 156 |
| $ | 187 |
| $ | 152 |
| $ | 164 |
|
|
| | | | |
| HISTORICAL ANNUAL NON-RENEWALS AS PERCENTAGE OF SITE RENTAL REVENUES, AS ADJUSTED |
| Years Ended December 31, |
| 2013 | 2012 | 2011 | 2010 | 2009 |
| 1.7% | 2.2% | 1.9% | 2.0% | 2.6% |
| |
| (1) | Based on existing contracts as of June 30, 2014. All contracts, except for Sprint contracts associated with the iDen network and contracts where non-renewal notices have been received, are assumed to renew for a new term at current term end date. CPI-linked customer contracts are assumed to escalate at 3% per annum. Assumes a US dollar to Australian dollar exchange rate of 0.93 US dollar to 1.0 Australian dollar. |
| |
| (2) | Based on existing ground leases as of June 30, 2014. CPI-linked leases are assumed to escalate at 3% per annum. Assumes a US dollar to Australian dollar exchange rate of 0.93 US dollar to 1.0 Australian dollar. |
| |
| (3) | Reflects lease renewals by year by customer; dollar amounts represent annualized cash site rental revenues from assumed renewals or extension as reflected in the table “Projected Revenue from Existing Customer Contracts.” |
| |
| (4) | Excludes Sprint leases associated with the iDen network, which are assumed to not renew as reflected in the table “Projected Revenue from Existing Customer Contracts.” |
Crown Castle International Corp.
Second Quarter 2014
|
| | | | |
COMPANY OVERVIEW | FINANCIALS & METRICS | ASSET PORTFOLIO OVERVIEW | CAPITALIZATION OVERVIEW | APPENDIX |
|
| | | | | |
| CUSTOMER OVERVIEW |
| (as of June 30, 2014) | Percentage of Q2 2014 LQA Site Rental Revenues | Weighted Average Current Term Remaining(1) | Long-Term Credit Rating (S&P / Moody’s) |
| AT&T | 29 | % | 8 |
| A- / A3 |
| Sprint | 22 | % | 6 |
| BB- / Ba3 |
| T-Mobile | 22 | % | 8 |
| BB |
| Verizon | 15 | % | 9 |
| BBB+ / Baa1 |
| Optus | 1 | % | 2 |
| A+ / Aa3 |
| VHA | 1 | % | 6 |
| A- / A3(2) |
| Telstra | 1 | % | 13 |
| A / A2 |
| All Others Combined | 9 | % | 4 |
| N/A |
| Total / Weighted Average | 100 | % | 7 |
|
|
| |
| (1) | Weighted by site rental revenue contributions; excludes renewals at the customers' option. |
| |
| (2) | Vodafone Hutchison Australia ("VHA") is a joint venture between Vodafone Group Plc and Hutchison Telecommunications Australia, a subsidiary of Hutchison Whompoa; Vodafone Group Plc and Hutchison Whompoa each are rated A- and A3 by S&P and Moody's, respectively, as of June 30, 2014. |
Crown Castle International Corp.
Second Quarter 2014
|
| | | | |
COMPANY OVERVIEW | FINANCIALS & METRICS | ASSET PORTFOLIO OVERVIEW | CAPITALIZATION OVERVIEW | APPENDIX |
|
| |
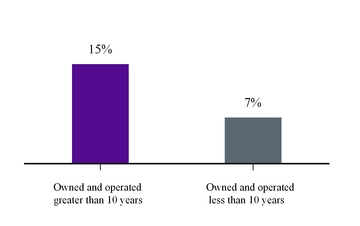
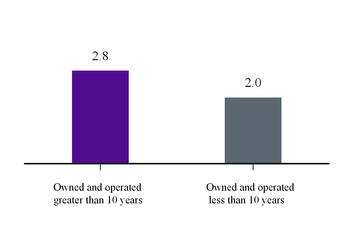
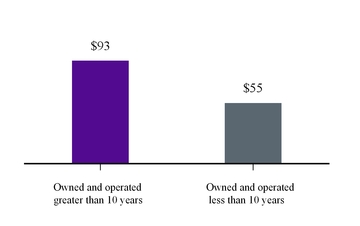
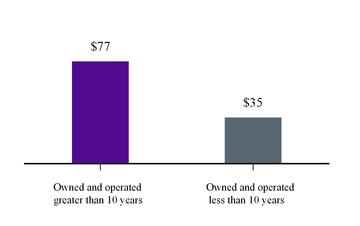
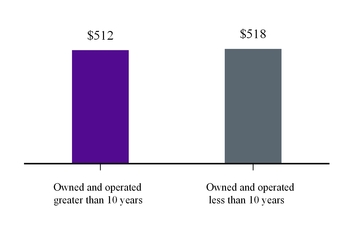
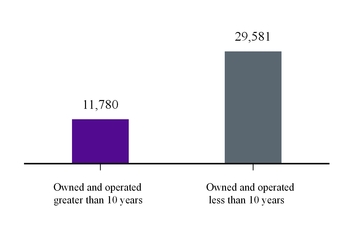
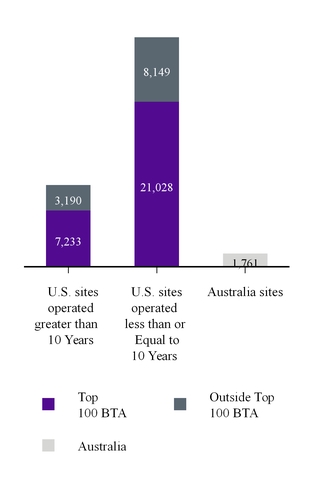
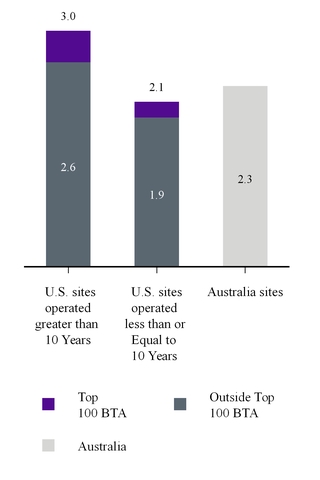
| SUMMARY OF TOWER PORTFOLIO BY VINTAGE |
| (as of June 30, 2014; dollars in thousands) | |
YIELD(1) | NUMBER OF TENANTS PER TOWER |
|
| |
| LQA SITE RENTAL REVENUE PER TOWER | LQA SITE RENTAL GROSS MARGIN PER TOWER |
|
| |
INVESTED CAPITAL PER TOWER(2) | NUMBER OF TOWERS |
_______________________________
| |
| (1) | Yield is calculated as LQA site rental gross margin divided by invested capital. |
| |
| (2) | Reflects gross total assets, including incremental capital invested by the Company since time of acquisition or construction completion. |
Crown Castle International Corp.
Second Quarter 2014
|
| | | | |
COMPANY
OVERVIEW | FINANCIALS & METRICS | ASSET PORTFOLIO OVERVIEW | CAPITALIZATION OVERVIEW | APPENDIX |
|
| | |
PORTFOLIO OVERVIEW(1) |
| (as of June 30, 2014; dollars in thousands) |
| NUMBER OF TOWERS | TENANTS PER TOWER | LQA SITE RENTAL REVENUE PER TOWER |
| |
| (1) | Includes towers and rooftops, excludes small cells and third-party land interests. |
Crown Castle International Corp.
Second Quarter 2014
|
| | | | |
COMPANY
OVERVIEW | FINANCIALS & METRICS | ASSET PORTFOLIO OVERVIEW | CAPITALIZATION OVERVIEW | APPENDIX |
|
| | | | | |
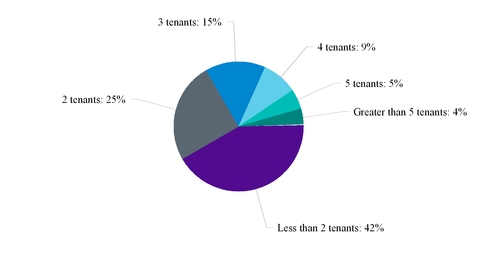
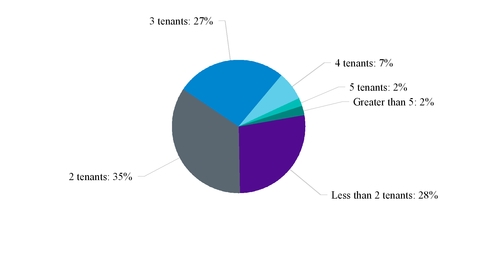
| DISTRIBUTION OF TOWER TENANCY (as of June 30, 2014) |
PERCENTAGE OF TOWERS BY TENANTS PER TOWER(1) |
| U.S. PORTFOLIO | AUSTRALIA PORTFOLIO |
|
| |
| Average: 2.3 | Average: 2.3 |
| | |
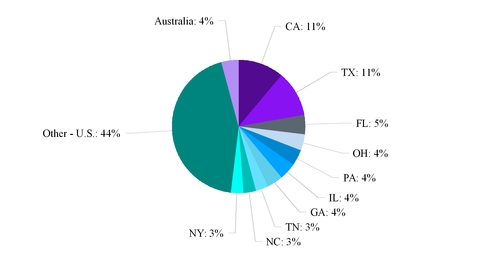
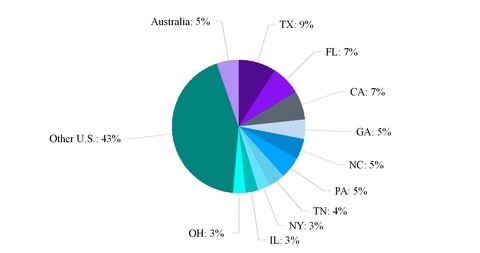
GEOGRAPHIC TOWER DISTRIBUTION (as of June 30, 2014)(1) |
| PERCENTAGE OF TOWERS BY GEOGRAPHIC LOCATION | PERCENTAGE OF LQA SITE RENTAL REVENUE BY GEOGRAPHIC LOCATION |
| |
| (1) | Includes towers and rooftops, excludes small cells and third-party land interests. |
Crown Castle International Corp.
Second Quarter 2014
|
| | | | |
COMPANY OVERVIEW | FINANCIALS & METRICS | ASSET PORTFOLIO OVERVIEW | CAPITALIZATION OVERVIEW | APPENDIX |
|
| | | | | | | | | | | | | | | | |
| U.S. GROUND INTEREST OVERVIEW |
(as of June 30, 2014; dollars in millions) | LQA Site Rental Revenue | Percentage of U.S. LQA Site Rental Revenue | LQA Site Rental Gross Margin | Percentage of U.S. LQA Site Rental Gross Margin | Number of U.S. Towers(1) | Percentage of U.S. Towers | Weighted Average Term Remaining (by years)(2) |
| Less than 10 years | $ | 341 |
| 13 | % | $ | 194 |
| 11 | % | 5,768 |
| 15 | % | |
| 10 to 20 years | 551 |
| 21 | % | 318 |
| 17 | % | 10,550 |
| 27 | % | |
| Greater 20 years | 1,033 |
| 40 | % | 697 |
| 38 | % | 15,571 |
| 39 | % | |
| Total leased | $ | 1,926 |
| 75 | % | $ | 1,210 |
| 66 | % | 31,889 |
| 81 | % | 30 |
|
| | | | | | | | |
| Owned | 658 |
| 25 | % | 616 |
| 34 | % | 7,711 |
| 19 | % | |
| Total / Average | $ | 2,583 |
| 100 | % | $ | 1,825 |
| 100 | % | 39,600 |
| 100 | % | |
|
| | | | | | | | | | | | | | | | |
| AUSTRALIA GROUND INTEREST OVERVIEW |
(as of June 30, 2014; dollars in millions) | LQA Site Rental Revenue | Percentage of Australia LQA Site Rental Revenue | LQA Site Rental Gross Margin | Percentage of Australia LQA Site Rental Gross Margin | Number of Australia Towers(1) | Percentage of Australia Towers | Weighted Average Term Remaining (by years)(2) |
| Less than 10 years | $ | 43 |
| 32 | % | $ | 29 |
| 29 | % | 572 |
| 32 | % | |
| 10 to 20 years | 43 |
| 32 | % | 32 |
| 32 | % | 555 |
| 32 | % | |
| Greater 20 years | 34 |
| 26 | % | 27 |
| 26 | % | 497 |
| 28 | % | |
| Total leased | $ | 119 |
| 90 | % | $ | 88 |
| 87 | % | 1,624 |
| 92 | % | 18 |
|
| | | | | | | | |
| Owned | 13 |
| 10 | % | 13 |
| 13 | % | 137 |
| 8 | % | |
| Total / Average | $ | 132 |
| 100 | % | $ | 101 |
| 100 | % | 1,761 |
| 100 | % | |
| |
| (1) | Includes towers and rooftops, excludes small cells and third-party land interests. |
| |
| (2) | Includes renewal terms at the Company’s option; weighted by site rental gross margin. |
Crown Castle International Corp.
Second Quarter 2014
|
| | | | |
COMPANY OVERVIEW | FINANCIALS & METRICS | ASSET PORTFOLIO OVERVIEW | CAPITALIZATION OVERVIEW | APPENDIX |
|
| | | | | | |
| U.S. GROUND INTEREST ACTIVITY |
| (dollars in millions) | Three Months Ended June 30, 2014 | Six Months Ended June 30, 2014 |
| Ground Extensions Under Crown Castle Towers: | | |
| Number of ground leases extended | 370 | 699 |
|
| Average number of years extended | 26 | 26 |
|
Percentage increase in consolidated cash ground lease expense due to extension activities(1) | 0.1 | % | 0.2 | % |
| | | |
| Ground Purchases Under Crown Castle Towers: | | |
| Number of ground leases purchased | 121 | 251 |
|
| Land lease purchases (including capital expenditures, acquisitions and capital leases) | $ | 31 |
| $ | 62 |
|
| Percentage of consolidated site rental gross margin from towers residing on land purchased | <1% |
| <1% |
|
|
| | | | | | |
| AUSTRALIA GROUND INTEREST ACTIVITY |
| (dollars in millions) | Three Months Ended June 30, 2014 | Six Months Ended June 30, 2014 |
| Ground Extensions Under Crown Castle Towers: | | |
| Number of ground leases extended | 19 |
| 30 |
|
| Average number of years extended | 19 |
| 18 |
|
Percentage increase in consolidated cash ground lease expense due to extension activities(1) | Not Meaningful |
| Not Meaningful |
|
| | | |
| Ground Purchases Under Crown Castle Towers: | | |
| Number of ground leases purchased | 4 |
| 6 |
|
| Land lease purchases (including capital expenditures, acquisitions and capital leases) | $ | 2 |
| $ | 3 |
|
| Percentage of consolidated site rental gross margin from towers residing on land purchased | Not Meaningful |
| Not Meaningful |
|
|
| | | |
| SMALL CELL NETWORK OVERVIEW |
Number of Nodes(3) (in thousands) | Miles of Fiber (in thousands) | Percentage of LQA Site Rental Revenues | Weighted Average Current Term Remaining for Customer Contracts(2) |
| 13 | 6 | 6% | 8 |
| |
| (1) | Includes the impact from the amortization of lump sum payments. |
| |
| (2) | Excludes renewal terms at customers’ option; weighted by site rental revenue. |
| |
| (3) | Includes nodes currently in-process. |
Crown Castle International Corp.
Second Quarter 2014
|
| | | | |
| COMPANY OVERVIEW | FINANCIALS & METRICS | ASSET PORTFOLIO OVERVIEW | CAPITALIZATION OVERVIEW | APPENDIX |
|
| | | | | | | | |
| CAPITALIZATION OVERVIEW |
| | Face Value as Reported 6/30/14 | Fixed vs. Floating | Secured vs. Unsecured | Interest Rate(1) | Net Debt to LQA EBITDA(2) | Maturity |
| Cash | $ | 227 |
| | | | | |
| | | | | | | |
Senior Secured Tower Revenue Notes, Series 2010-2-2010-3(3) | 1,600 |
| Fixed | Secured | 5.98% | | Various(8) |
Senior Secured Tower Revenue Notes, Series 2010-4-2010-6(3) | 1,550 |
| Fixed | Secured | 4.48% | | Various(8) |
2012 Secured Notes(4) | 1,500 |
| Fixed | Secured | 3.36% | | 2017/2023 |
Senior Secured Notes, Series 2009-1(5) | 170 |
| Fixed | Secured | 7.38% | | Various(8) |
WCP Secured Wireless Site Contracts Revenue Notes, Series 2010-1(6) | 268 |
| Fixed | Secured | 5.64% | | 2040 |
| Subtotal | $ | 5,088 |
| | | 4.78% | 2.4x | |
Revolving Credit Facility(7) | 334 |
| Floating | Secured | 1.9% | | 2018 |
| Term Loan A | 654 |
| Floating | Secured | 1.9% | | 2018 |
| Term Loan B | 2,850 |
| Floating | Secured | 3.0% | | 2019/2021(9) |
| Total CCOC Facility Debt | $ | 3,838 |
| | | 2.72% | 1.8x | |
| 4.875% Senior Notes | 850 |
| Fixed | Unsecured | 4.88% | | 2022 |
| 5.250% Senior Notes | 1,650 |
| Fixed | Unsecured | 5.25% | | 2023 |
| Capital Leases & Other Debt | 142 |
| Various | Various | Various | | Various |
| Total HoldCo and other Debt | $ | 2,642 |
| | | 5.12% | 1.3x | |
| Total Net Debt | $ | 11,341 |
| | | 4.16% | 5.3x | |
| Preferred Stock, at liquidation value | 978 |
| | | | | |
Market Capitalization(10) | 24,793 |
| | | | | |
Firm Value(11) | $ | 37,112 |
| | | | | |
| |
| (1) | Represents the weighted-average stated interest rate. |
| |
| (2) | Represents the applicable amount of debt divided by LQA consolidated Adjusted EBITDA. |
| |
| (3) | If the Senior Secured Tower Revenue Notes 2010-2, and 2010-3 and Senior Secured Tower Revenue Notes, 2010-4, 2010-5, and 2010-6 (“2010 Tower Revenue Notes”) are not paid in full on or prior to 2015, 2017 and 2020, as applicable, then Excess Cash Flow (as defined in the indenture) of the issuers (of such notes) will be used to repay principal of the applicable series and class of the 2010 Tower Revenue Notes, and additional interest (of an additional approximately 5% per annum) will accrue on the respective 2010 Tower Revenue Notes. The Senior Secured Tower Revenue Notes, 2010-2, and 2010-3 consist of two series of notes with principal amounts of $350 million and $1.3 billion, having anticipated repayment dates in 2017 and 2020, respectively. The Senior Secured Tower Revenue Notes, 2010-4, 2010-5, and 2010-6 consist of three series of notes with principal amounts of $250 million, $300 million and $1.0 billion, having anticipated repayment dates in 2015, 2017 and 2020, respectively. |
| |
| (4) | The 2012 Secured Notes consist of $500 million aggregate principal amount of 2.381% secured notes due 2017 and $1.0 billion aggregate principal amount of 3.849% secured notes due 2030. |
| |
| (5) | The Senior Secured Notes, Series 2009-1 consist of $100 million of principal as of June 30, 2014 that amortizes through 2019, and $70 million of principal as of June 30, 2014 that amortizes during the period beginning in 2019 and ending in 2029. |
| |
| (6) | The anticipated repayment date is 2015 for each class of the WCP Secured Wireless Site Contracts Revenue Notes, Series 2010-1 ("WCP Securitized Notes"). If the WCP Securitized Notes are not repaid in full by their anticipated repayment dates, the applicable interest rate increases by an additional approximately 5% per annum. If the WCP Securitized Notes are not repaid in full by their rapid amortization date of 2017, monthly principal payments commence using the excess cash flows of the issuers of the WCP Securitized Notes. |
| |
| (7) | As of June 30, 2014, the undrawn availability under the $1.5 billion Revolving Credit Facility is $1.2 billion. |
| |
| (8) | Notes are prepayable at par if voluntarily repaid six months or less prior to maturity; earlier prepayment may require additional consideration. |
| |
| (9) | As of June 30, 2014, approximately $570 million of the Term Loan B have 101 soft call until the next call date. |
| |
| (10) | Market capitalization calculated based on $74.26 closing price and 333.9 million shares outstanding as of June 30, 2014. |
| |
| (11) | Represents the sum of net debt, preferred stock (at liquidation value) and market capitalization. |
Crown Castle International Corp.
Second Quarter 2014
|
| | | | |
| COMPANY OVERVIEW | FINANCIALS & METRICS | ASSET PORTFOLIO OVERVIEW | CAPITALIZATION OVERVIEW | APPENDIX |
|
|
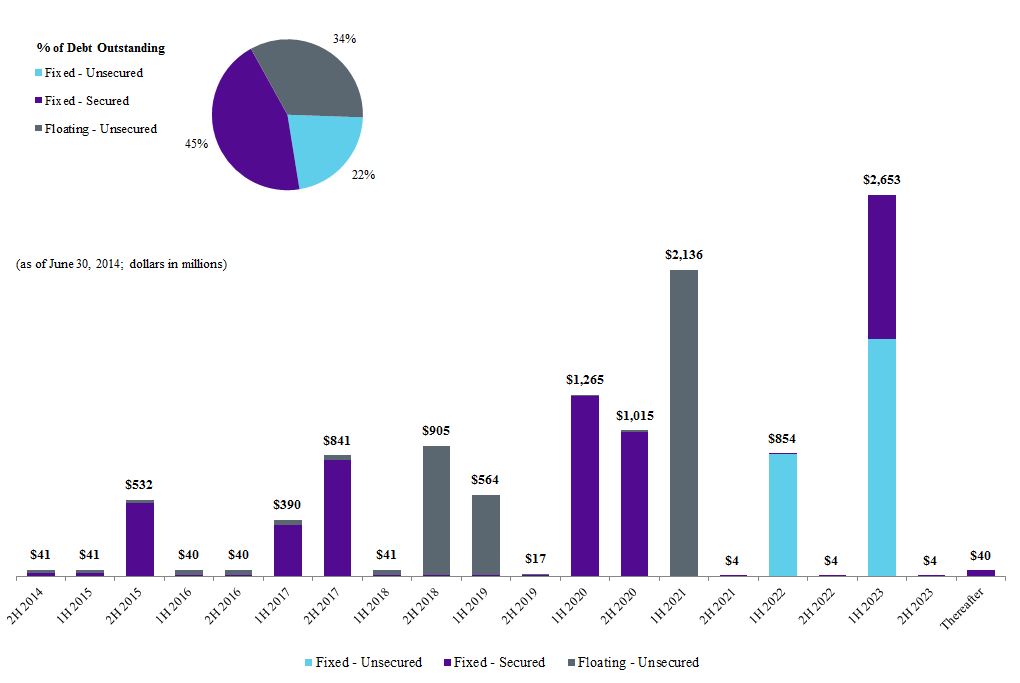
DEBT MATURITY OVERVIEW(1) |
| |
| (1) | Where applicable, maturities reflect the Anticipated Repayment Date as defined in the respective debt agreement; excludes capital leases and other obligations; amounts presented at face value net of repurchases held at CCIC. |
Crown Castle International Corp.
Second Quarter 2014
|
| | | | |
COMPANY OVERVIEW | FINANCIALS & METRICS | ASSET PORTFOLIO OVERVIEW | CAPITALIZATION OVERVIEW | APPENDIX |
|
| | |
| LIQUIDITY OVERVIEW |
| (dollars in thousands) | June 30, 2014 |
Cash and cash equivalents(1) | 227,479 |
|
Undrawn revolving credit facility availability(2) | 1,166,000 |
|
| Restricted cash | 160,725 |
|
| Debt and other long-term obligations | 11,570,251 |
|
| Total equity | 6,879,436 |
|
| |
| (1) | Exclusive of restricted cash. |
| |
| (2) | Availability at any point in time is subject to reaffirmation of the representations and warranties in, and there being no default under, our credit agreement governing our senior credit facilities (“2012 Credit Facility”). |
Crown Castle International Corp.
Second Quarter 2014
|
| | | | |
COMPANY OVERVIEW | FINANCIALS & METRICS | ASSET PORTFOLIO OVERVIEW | CAPITALIZATION OVERVIEW | APPENDIX |
|
| | | | | |
| SUMMARY OF MAINTENANCE AND FINANCIAL COVENANTS |
| Debt | Borrower / Issuer | Covenant(1) | Covenant Level Requirement | | As of June 30, 2014 |
Maintenance Financial Covenants(2) |
| 2012 Credit Facility | CCOC | Total Net Leverage Ratio | ≤ 5.50x | | 4.2x |
| 2012 Credit Facility | CCOC | Consolidated Interest Coverage Ratio | ≥ 2.50x | | 6.0x |
| | | | | | |
| Restrictive Negative Financial Covenants | | | | |
| Financial covenants restricting ability to make restricted payments, including dividends |
| 4.875% Senior Notes | CCIC | Debt to Adjusted Consolidated Cash Flow Ratio | ≤ 7.00x | | 5.6x |
| 5.25% Senior Notes | CCIC | Debt to Adjusted Consolidated Cash Flow Ratio | ≤ 7.00x | | 5.6x |
| 2012 Credit Facility | CCOC | Total Net Leverage Ratio | ≤ 5.50x | | 4.2x |
| | | | | | |
| Financial covenants restricting ability to incur additional debt |
| 4.875% Senior Notes | CCIC | Debt to Adjusted Consolidated Cash Flow Ratio | ≤ 7.00x | | 5.6x |
| 5.25% Senior Notes | CCIC | Debt to Adjusted Consolidated Cash Flow Ratio | ≤ 7.00x | | 5.6x |
| 2012 Credit Facility | CCOC | Total Net Leverage Ratio | ≤ 6.00x | (3) | 4.2x |
| 2012 Credit Facility | CCOC | Holdings Leverage Ratio | ≤ 7.00x | (4) | 5.6x |
| 2012 Credit Facility | CCOC | Consolidated Interest Coverage Ratio | ≥ 2.50x | | 6.0x |
| 2012 Secured Notes | CC Holdings GS V LLC and Crown Castle GS III Corp. | Debt to Adjusted Consolidated Cash Flow Ratio | ≤ 3.50x | | 3.8x |
| | | | | | |
| Financial covenants restricting ability to make investments |
| 2012 Credit Facility | CCOC | Total Net Leverage Ratio | ≤ 5.50x | | 4.2x |
| |
| (1) | As defined in the respective debt agreement. |
| |
| (2) | Failure to comply with the financial maintenance covenants would, absent a waiver, result in an event of default under the credit agreement governing our 2012 Credit Facility. |
| |
| (3) | Applicable for debt issued at CCOC or its subsidiaries. |
| |
| (4) | Applicable for debt issued at CCIC or its subsidiaries. |
Crown Castle International Corp.
Second Quarter 2014
|
| | | | |
COMPANY OVERVIEW | FINANCIALS & METRICS | ASSET PORTFOLIO OVERVIEW | CAPITALIZATION OVERVIEW | APPENDIX |
|
| | | | | |
| SUMMARY OF MAINTENANCE AND FINANCIAL COVENANTS (CONTINUED) |
| Debt | Borrower / Issuer | Covenant(1) | Covenant Level Requirement | | As of June 30, 2014 |
| Restrictive Negative Financial Covenants |
| Financial covenants requiring excess cash flows to be deposited in a cash trap reserve account and not released |
| 2010 Tower Revenue Notes | Crown Castle Towers LLC and its Subsidiaries | Debt Service Coverage Ratio | > 1.75x | (2) | 4.3x |
| WCP Securitized Notes | Certain WCP Subsidiaries | Debt Service Coverage Ratio | > 1.30x | (2) | 1.4x |
| 2009 Securitized Notes | Pinnacle Towers Acquisition Holdings LLC and its Subsidiaries | Debt Service Coverage Ratio | > 1.30x | (2) | 4.4x |
| | | | | | |
| Financial covenants restricting ability of relevant issuer to issue additional notes under the applicable indenture |
| 2010 Tower Revenue Notes | Crown Castle Towers LLC and its Subsidiaries | Debt Service Coverage Ratio | ≥ 2.00x | (3) | 4.3x |
| WCP Securitized Notes | Certain WCP Subsidiaries | Debt Service Coverage Ratio | ≥ 1.50x | (3) | 1.4x |
| 2009 Securitized Notes | Pinnacle Towers Acquisition Holdings LLC and its Subsidiaries | Debt Service Coverage Ratio | ≥ 2.34x | (3) | 4.4x |
| |
| (1) | As defined in the respective debt agreement. In the indentures for the 2010 Tower Revenue Notes, WCP Securitized Notes, and the 2009 Securitized Notes, the defined term for Debt Service Coverage Ratio is "DSCR". |
| |
| (2) | The 2010 Tower Revenue Notes, WCP Securitized Notes, and 2009 Securitized Notes also include the potential for amortization events, which could result in applying current and future cash flow to the prepayment of debt with applicable prepayment consideration. An amortization event occurs when the Debt Service Coverage Ratio falls below 1.45x, 1.15x or 1.15x, in each case as described under the indentures for the 2010 Tower Revenue Notes, WCP Securitized Notes, or 2009 Securitized Notes, respectively. |
| |
| (3) | Rating Agency Confirmation (as defined in the respective debt agreement) is also required. |
Crown Castle International Corp.
Second Quarter 2014
|
| | | | |
COMPANY OVERVIEW | FINANCIALS & METRICS | ASSET PORTFOLIO OVERVIEW | CAPITALIZATION OVERVIEW | APPENDIX |
|
| | | | | | | | | |
INTEREST RATE SENSITIVITY(1) |
| | Remaining six months, | Years Ended December 31, |
| (as of June 30, 2014; dollars in millions) | 2014 | 2015 | 2016 |
| Fixed Rate Debt: | | | |
Face Value of Principal Outstanding(2) | $ | 7,570 |
| $ | 7,536 |
| $ | 7,517 |
|
Current Interest Payment Obligations(3) | 185 |
| 369 |
| 368 |
|
Effect of 0.125% Change in Interest Rates(4) | — |
| 1 |
| 2 |
|
| Floating Rate Debt: | | | |
Face Value of Principal Outstanding(2) | $ | 3,815 |
| $ | 3,770 |
| $ | 3,708 |
|
Current Interest Payment Obligations(5) | 52 |
| 109 |
| 143 |
|
Effect of 0.125% Change in Interest Rates(6) | 1 |
| 2 |
| 2 |
|
| |
| (1) | Excludes capital lease and other obligations. |
| |
| (2) | Face value net of required amortizations; assumes no maturity or balloon principal payments; excludes capital leases. |
| |
| (3) | Interest expense calculated based on current interest rates. |
| |
| (4) | Interest expense calculated based on current interest rates until the sooner of the (1) stated maturity date or (2) the Anticipated Repayment Date, at which time the face value amount outstanding of such indebtedness is refinanced at current rates plus 12.5 bps. |
| |
| (5) | Interest expense calculated based on current interest rates. Forward LIBOR assumptions are derived from the 1-month LIBOR forward curve as of June 30, 2014. Calculation takes into account any LIBOR floors in place and assumes no changes to future interest rate margin spread over LIBOR due to changes in the Borrower’s net leverage ratio. |
| |
| (6) | Interest expense calculated based on current interest rates using forward LIBOR assumptions until the stated maturity date, at which time the face value amount outstanding of such indebtedness is refinanced at current rates plus 12.5 bps. |
Crown Castle International Corp.
Second Quarter 2014
|
| | | | |
| COMPANY OVERVIEW | FINANCIALS & METRICS | ASSET PORTFOLIO OVERVIEW | CAPITALIZATION OVERVIEW | APPENDIX |
Non-GAAP Financial Measures and Other Calculations
This Supplement includes presentations of Adjusted EBITDA, Funds from Operations, Adjusted Funds from Operations, Organic Site Rental Revenues, Site Rental Revenues, as Adjusted, Organic Site Rental Gross Margin, and Site Rental Gross Margin, as Adjusted, and Ground Lease Expense, as Adjusted, which are non-GAAP financial measures. These non-GAAP financial measures are not intended as alternative measures of operating results or cash flow from operations (as determined in accordance with Generally Accepted Accounting Principles ("GAAP")). Each of the amounts included in the calculation of Adjusted EBITDA, FFO, AFFO, Organic Site Rental Revenues, Site Rental Revenues, as Adjusted, Organic Site Rental Gross Margin, and Site Rental Gross Margin, as Adjusted, and Ground Lease Expense, as Adjusted, are computed in accordance with GAAP, with the exception of: (1) sustaining capital expenditures, which is not defined under GAAP and (2) our adjustment to the income tax provision in calculations of AFFO for periods prior to our REIT conversion.
Our measures of Adjusted EBITDA, FFO, AFFO, Organic Site Rental Revenues, Site Rental Revenues, as Adjusted, Organic Site Rental Gross Margin, and Site Rental Gross Margin, as Adjusted, and Ground Lease Expense, as Adjusted, may not be comparable to similarly titled measures of other companies, including other companies in the tower sector or those reported by other REITs. Our FFO and AFFO may not be comparable to those reported in accordance with National Association of Real Estate Investment Trusts, including with respect to the impact of income taxes for periods prior to our REIT conversion.
Adjusted EBITDA, FFO, AFFO, Organic Site Rental Revenues, Site Rental Revenues, as Adjusted, Organic Site Rental Gross Margin, and Site Rental Gross Margin, as Adjusted, and Ground Lease Expense, as Adjusted, are presented as additional information because management believes these measures are useful indicators of the financial performance of our core businesses. In addition, Adjusted EBITDA is a measure of current financial performance used in our debt covenant calculations.
During the first quarter of 2014, Crown Castle updated its definitions of FFO and AFFO. The updated definitions of FFO and AFFO are intended to reflect the recurring nature of Crown Castle's site rental business and assist in comparing Crown Castle’s performance with the performance of its public tower company peers. Under the updated calculation of AFFO, Crown Castle reflects the benefit of prepaid rent from customers over the weighted-average life of customer contracts rather than in the period in which the prepaid rent was received. The updates to the definition of FFO were primarily made to present the periods shown in a manner which is consistent with our commencement of operations as a REIT on January 1, 2014. These measures are not intended to replace financial performance measures determined in accordance with GAAP. Unless otherwise noted, FFO and AFFO as set forth in this Supplement are presented based on the updated definitions. Crown Castle has provided reconciliations of the updated definitions of FFO and AFFO to the prior definitions on pages 34-36 of this Supplement.
Adjusted EBITDA. Crown Castle defines Adjusted EBITDA as net income (loss) plus restructuring charges (credits), asset write-down charges, acquisition and integration costs, depreciation, amortization and accretion, amortization of prepaid lease purchase price adjustments, interest expense and amortization of deferred financing costs, gains (losses) on retirement of long-term obligations, net gain (loss) on interest rate swaps, impairment of available-for-sale securities, interest income, other income (expense), benefit (provision) for income taxes, cumulative effect of change in accounting principle, income (loss) from discontinued operations, and stock-based compensation expense.
Funds from Operations ("FFO"). Crown Castle defines Funds from Operations as net income plus real estate related depreciation, amortization and accretion and asset write-down charges, less non controlling interest and cash paid for preferred stock dividends, and is a measure of funds from operations attributable to CCIC common stockholders.
FFO per share. Crown Castle defines FFO per share as FFO divided by the diluted weighted average common shares outstanding.
Crown Castle International Corp.
Second Quarter 2014
|
| | | | |
| COMPANY OVERVIEW | FINANCIALS & METRICS | ASSET PORTFOLIO OVERVIEW | CAPITALIZATION OVERVIEW | APPENDIX |
FFO, as previously defined. Crown Castle defines FFO, as previously defined, as FFO plus non cash portion of tax provision, less asset write-down charges and non controlling interests.
Adjusted Funds from Operations ("AFFO"). Crown Castle defines Adjusted Funds from Operations as FFO before straight-line revenue, straight-line expense, stock-based compensation expense, non-cash portion of tax provision, non-real estate related depreciation, amortization and accretion, amortization of non-cash interest expense, other (income) expense, gains (loss) on retirement of long-term obligations, net gain (loss) on interest rate swaps, acquisition and integration costs, and adjustments for noncontrolling interests, and less capital improvement capital expenditures and corporate capital expenditures.
AFFO per share. Crown Castle defines AFFO per share as AFFO divided by diluted weighted average common shares outstanding.
AFFO, as previously defined. Crown Castle defines AFFO, as previously defined, as AFFO plus prepaid rent received less amortization of prepaid rent.
AFFO payout ratio. Dividends per common share divided by AFFO per share.
Site Rental Revenues, as Adjusted. Crown Castle defines Site Rental Revenues, as Adjusted, as site rental revenues, as reported, less straight-line revenues.
Organic Site Rental Revenues. Crown Castle defines Organic Site Rental Revenues as site rental revenues, as reported, less straight-line revenues, the impact of tower acquisitions and construction, foreign currency adjustments and certain non recurring items.
Site Rental Gross Margins, as Adjusted. Crown Castle defines Site Rental Gross Margins, as Adjusted, as site rental gross margin as reported less straight-line revenues and straight-line expenses.
Organic Site Rental Gross Margins. Crown Castle defines Organic Site Rental Gross Margins as site rental gross margins, as reported less straight-line revenues, straight-line expenses, the impact of tower acquisitions and construction, foreign currency adjustments and certain non recurring items.
Ground Lease Expense, as Adjusted. Crown Castle defines Ground Lease Expense, as Adjusted as ground lease expense, as reported, less straight line ground lease expense.
Sustaining capital expenditures. Crown Castle defines sustaining capital expenditures as either (1) corporate related capital improvements, such as buildings, information technology equipment and office equipment or (2) capital improvements to tower sites that enable our customers' ongoing quiet enjoyment of the tower.
The tables set forth below reconcile non-GAAP financial measures to comparable GAAP financial measures and provide certain other calculations. The components in these tables may not sum to the total due to rounding.
Crown Castle International Corp.
Second Quarter 2014
|
| | | | |
| COMPANY OVERVIEW | FINANCIALS & METRICS | ASSET PORTFOLIO OVERVIEW | CAPITALIZATION OVERVIEW | APPENDIX |
Adjusted EBITDA for the three and six months ended June 30, 2014 and 2013 is computed as follows:
|
| | | | | | | | | | | | | | | |
| | Three Months Ended June 30, | | Six Months Ended June 30, |
| (dollars in thousands) | 2014 | | 2013 | | 2014 |
| 2013 |
| Net income (loss) | $ | 35,357 |
| | $ | 53,376 |
| | $ | 138,150 |
| | $ | 70,114 |
|
| Adjustments to increase (decrease) net income (loss): | | | | | | | |
| Asset write-down charges | 3,136 |
| | 3,097 |
| | 5,869 |
| | 6,812 |
|
| Acquisition and integration costs | 19,197 |
| | 7,215 |
| | 24,856 |
| | 8,817 |
|
| Depreciation, amortization and accretion | 254,235 |
| | 190,651 |
| | 504,426 |
| | 377,110 |
|
| Amortization of prepaid lease purchase price adjustments | 5,663 |
| | 3,863 |
| | 9,558 |
| | 7,726 |
|
Interest expense and amortization of deferred financing costs(1) | 144,534 |
| | 140,256 |
| | 290,934 |
| | 304,625 |
|
| Gains (losses) on retirement of long-term obligations | 44,629 |
| | 577 |
| | 44,629 |
| | 36,486 |
|
| Interest income | (189 | ) | | (328 | ) | | (362 | ) | | (625 | ) |
| Other income (expense) | 6,063 |
| | (507 | ) | | 8,799 |
| | 122 |
|
| Benefit (provision) for income taxes | (208 | ) | | 36,587 |
| | (396 | ) | | 54,295 |
|
| Stock-based compensation expense | 18,212 |
| | 9,608 |
| | 31,149 |
| | 19,707 |
|
Adjusted EBITDA(2) | $ | 530,629 |
| | $ | 444,395 |
| | $ | 1,057,612 |
| | $ | 885,189 |
|
Adjusted EBITDA for the three months ended September 30, 2013 and 2012 and years ended December 31, 2013 and 2012 is computed as follows:
|
| | | | | | | | | | | | | | | |
| | Three Months Ended September 30, | | Years Ended December 31, |
| (dollars in thousands) | 2013 | | 2012 | | 2013 | | 2012 |
| Net income (loss) | $ | 46,468 |
| | $ | 43,178 |
| | $ | 93,901 |
| | $ | 200,888 |
|
| Adjustments to increase (decrease) net income (loss): | | | | | | | |
| Asset write-down charges | 3,893 |
| | 1,560 |
| | 14,863 |
| | 15,548 |
|
| Acquisition and integration costs | 4,369 |
| | 2,937 |
| | 26,005 |
| | 18,298 |
|
| Depreciation, amortization and accretion | 195,408 |
| | 154,867 |
| | 774,215 |
| | 622,592 |
|
| Amortization of prepaid lease purchase price adjustments | 3,870 |
| | 3,858 |
| | 15,473 |
| | 14,166 |
|
Interest expense and amortization of deferred financing costs(1) | 142,016 |
| | 144,949 |
| | 589,630 |
| | 601,044 |
|
| Gains (losses) on retirement of long-term obligations | 1 |
| | — |
| | 37,127 |
| | 131,974 |
|
| Interest income | (236 | ) | | (291 | ) | | (1,355 | ) | | (4,556 | ) |
| Other income (expense) | 631 |
| | 632 |
| | 3,872 |
| | 5,392 |
|
| Benefit (provision) for income taxes | 33,959 |
| | 32,300 |
| | 198,628 |
| | (100,061 | ) |
| Stock-based compensation expense | 10,178 |
| | 16,182 |
| | 41,788 |
| | 47,382 |
|
Adjusted EBITDA(2) | $ | 440,557 |
| | $ | 400,172 |
| | $ | 1,794,147 |
|
| $ | 1,552,667 |
|
| |
| (1) | See the reconciliation of “components of interest expense and amortization of deferred financing costs” herein. |
| |
| (2) | The above reconciliation excludes line items included in our Adjusted EBITDA definition which are not applicable for the periods shown. |
Crown Castle International Corp.
Second Quarter 2014
|
| | | | |
| COMPANY OVERVIEW | FINANCIALS & METRICS | ASSET PORTFOLIO OVERVIEW | CAPITALIZATION OVERVIEW | APPENDIX |
Adjusted EBITDA for the three months ended June 30, 2014 is computed as follows:
|
| | | | | | | | | | | | | | | |
| | Three Months Ended June 30, 2014 |
| (dollars in thousands) | CCUSA | | CCAL | | Eliminations | | Consolidated Total |
| Net income (loss) | $ | 29,234 |
| | $ | 6,123 |
| | $ | — |
| | $ | 35,357 |
|
| Adjustments to increase (decrease) net income (loss): | | | | | | | |
| Asset write-down charges | 3,105 |
| | 31 |
| | — |
| | 3,136 |
|
| Acquisition and integration costs | 19,125 |
| | 72 |
| | — |
| | 19,197 |
|
| Depreciation, amortization and accretion | 246,583 |
| | 7,652 |
| | — |
| | 254,235 |
|
| Amortization of prepaid lease purchase price adjustments | 5,663 |
| | — |
| | — |
| | 5,663 |
|
Interest expense and amortization of deferred financing costs(1) | 144,534 |
| | 3,930 |
| | (3,930 | ) | | 144,534 |
|
| Gains (losses) on retirement of long-term obligations | 44,629 |
| | — |
| | — |
| | 44,629 |
|
| Interest income | (108 | ) | | (81 | ) | | — |
| | (189 | ) |
| Other income (expense) | 1,990 |
| | 143 |
| | 3,930 |
| | 6,063 |
|
| Benefit (provision) for income taxes | (3,101 | ) | | 2,893 |
| | — |
| | (208 | ) |
| Stock-based compensation expense | 17,883 |
| | 329 |
| | — |
| | 18,212 |
|
Adjusted EBITDA(2) | $ | 509,537 |
| | $ | 21,092 |
| | $ | — |
| | $ | 530,629 |
|
Adjusted EBITDA for the quarter ending September 30, 2014 and the year ending December 31, 2014 is forecasted as follows:
|
| | | |
| | Q3 2014 | | Full Year 2014 |
| (dollars in millions) | Outlook | | Outlook |
| Net income (loss) | $81 to $114 | | $292 to $376 |
| Adjustments to increase (decrease) net income (loss): | | | |
| Asset write-down charges | $2 to $4 | | $7 to $17 |
| Acquisition and integration costs | $2 to $6 | | $28 to $38 |
| Depreciation, amortization and accretion | $252 to $257 | | $1,003 to $1,023 |
| Amortization of prepaid lease purchase price adjustments | $4 to $6 | | $18 to $20 |
Interest expense and amortization of deferred financing costs(1) | $139 to $144 | | $569 to $579 |
| Gains (losses) on retirement of long-term obligations | $0 to $0 | | $45 to $45 |
| Interest income | $(1) to $1 | | $(2) to $0 |
| Other income (expense) | $2 to $4 | | $14 to $16 |
| Benefit (provision) for income taxes | $(1) to $3 | | $(1) to $7 |
| Stock-based compensation expense | $13 to $15 | | $58 to $63 |
Adjusted EBITDA(2) | $521 to $526 | | $2,100 to $2,115 |
| |
| (1) | See the reconciliation of “components of interest expense and amortization of deferred financing costs” herein. |
| |
| (2) | The above reconciliation excludes line items included in our Adjusted EBITDA definition which are not applicable for the periods shown. |
Crown Castle International Corp.
Second Quarter 2014
|
| | | | |
| COMPANY OVERVIEW | FINANCIALS & METRICS | ASSET PORTFOLIO OVERVIEW | CAPITALIZATION OVERVIEW | APPENDIX |
The components of interest expense and amortization of deferred financing costs for the quarters ending June 30, 2014 and 2013 are as follows:
|
| | | | | | | |
| | Three Months Ended June 30, |
| (dollars in thousands) | 2014 | | 2013 |
| Interest expense on debt obligations | $ | 123,930 |
|
| $ | 119,705 |
|
| Amortization of deferred financing costs | 5,521 |
| | 5,013 |
|
| Amortization of adjustments on long-term debt | (896 | ) | | (965 | ) |
Amortization of interest rate swaps(1) | 16,162 |
| | 16,242 |
|
| Other, net | (183 | ) | | 261 |
|
| Interest expense and amortization of deferred financing costs | $ | 144,534 |
| | $ | 140,256 |
|
The components of interest expense and amortization of deferred financing costs for the quarter ending September 30, 2014 and the year ending December 31, 2014 are forecasted as follows:
|
| | | |
| | Q3 2014 | | Full Year 2014 |
| (dollars in millions) | Outlook | | Outlook |
| Interest expense on debt obligations | $121 to $123 | | $488 to $498 |
| Amortization of deferred financing costs | $5 to $6 | | $21 to $23 |
| Amortization of adjustments on long-term debt | $(1) to $0 | | $(5) to $(3) |
Amortization of interest rate swaps (1) | $15 to $17 | | $60 to $65 |
| Other, net | $0 to $0 | | $(1) to $1 |
| Interest expense and amortization of deferred financing costs | $139 to $144 | | $569 to $579 |
| |
| (1) | Relates to the amortization of interest rate swaps; the swaps were cash settled in prior periods. |
Crown Castle International Corp.
Second Quarter 2014
|
| | | | |
| COMPANY OVERVIEW | FINANCIALS & METRICS | ASSET PORTFOLIO OVERVIEW | CAPITALIZATION OVERVIEW | APPENDIX |
FFO and AFFO for the three and six months ended June 30, 2014 and 2013 are computed as follows:
|
| | | | | | | | | | | | | | | |
| | Three Months Ended June 30, | | Six Months Ended June 30, |
| (dollars in thousands, except share and per share amounts) | 2014 | | 2013 | | 2014 | | 2013 |
| Net income | $ | 35,357 |
| | $ | 53,376 |
| | $ | 138,150 |
| | $ | 70,114 |
|
| Real estate related depreciation, amortization and accretion | 249,484 |
| | 188,039 |
| | 493,904 |
| | 369,794 |
|
| Asset write-down charges | 3,136 |
| | 3,097 |
| | 5,869 |
| | 6,812 |
|
Adjustment for noncontrolling interest(1) | (1,348 | ) | | (1,017 | ) | | (2,644 | ) | | (2,293 | ) |
| Dividends on preferred stock | (10,997 | ) | | — |
| | (21,994 | ) | | — |
|
FFO(3) | $ | 275,632 |
| | $ | 243,496 |
| | $ | 613,285 |
| | $ | 444,428 |
|
| | | | | | | | |
| FFO (from above) | 275,632 |
| | 243,496 |
| | 613,285 |
| | 444,428 |
|
| Adjustments to increase (decrease) FFO: | | | | | | | |
| Straight-line revenue | (52,134 | ) | | (56,919 | ) | | (102,940 | ) | | (116,318 | ) |
| Straight-line expense | 27,416 |
| | 20,572 |
| | 53,796 |
| | 41,278 |
|
| Stock-based compensation expense | 18,212 |
| | 9,608 |
| | 31,149 |
| | 19,707 |
|
Non-cash portion of tax provision(4) | (2,553 | ) | | 34,747 |
| | (4,885 | ) | | 50,808 |
|
| Non-real estate related depreciation, amortization and accretion | 4,751 |
| | 2,612 |
| | 10,521 |
| | 7,316 |
|
| Amortization of non-cash interest expense | 20,604 |
| | 20,551 |
| | 41,485 |
| | 57,471 |
|
| Other (income) expense | 6,063 |
| | (507 | ) | | 8,799 |
| | 122 |
|
| Gains (losses) on retirement of long-term obligations | 44,629 |
| | 577 |
| | 44,629 |
| | 36,486 |
|
| Acquisition and integration costs | 19,197 |
| | 7,215 |
| | 24,856 |
| | 8,817 |
|
Adjustment for noncontrolling interest(1) | 1,348 |
| | 1,017 |
| | 2,644 |
| | 2,293 |
|
| Capital improvement capital expenditures | (4,469 | ) | | (2,399 | ) | | (8,329 | ) | | (5,713 | ) |
| Corporate capital expenditures | (8,171 | ) | | (7,694 | ) | | (15,742 | ) | | (11,246 | ) |
AFFO(2) | $ | 350,526 |
| | $ | 272,877 |
| | $ | 699,270 |
| | $ | 535,449 |
|
| Weighted average common shares outstanding — diluted | 333,081 |
| | 292,706 |
| | 333,034 |
| | 292,570 |
|
AFFO per share(2) | $ | 1.05 |
| | $ | 0.93 |
| | $ | 2.10 |
| | $ | 1.83 |
|
| | | | | | | | |
| AFFO (from above) | $ | 350,526 |
| | $ | 272,877 |
| | $ | 699,270 |
| | $ | 535,449 |
|
| Prepaid rent received | 83,607 |
| | 45,947 |
| | 151,830 |
| | 89,690 |
|
| Amortization of prepaid rent | (22,143 | ) | | (14,932 | ) | | (41,514 | ) | | (29,952 | ) |
AFFO, as previously defined(2) | $ | 411,990 |
| | $ | 303,892 |
| | $ | 809,586 |
| | $ | 595,186 |
|
| |
| (1) | Inclusive of the noncontrolling interest related to real estate related depreciation, amortization and accretion and asset write-downs. |
| |
| (2) | See definitions herein. See also “Definitions of Non-GAAP Financial Measures and Other Calculations” herein for a discussion of the definitions of FFO and AFFO. |
| |
| (3) | FFO, as previously defined, for Q2 and year to date 2014 was $271.3 million and $605.2 million respectively, which is exclusive of the net impact from the update of the definition of $4.3 million and $8.1 million, respectively, which amount includes the adjustment for non-cash portion of tax provision and excludes the adjustments for asset write-down charges and noncontrolling interests. FFO, as previously defined, for Q2 and year to date 2013 was previously reported as $276.2 million and $490.8 million, respectively, which is exclusive of the net impact from the update of the definition of $32.7 million and $46.4 million, respectively, which amount includes the adjustment for non-cash portion of tax provision and excludes the adjustments for asset write down charges and noncontrolling interests. |
| |
| (4) | Adjusts the income tax provision for 2013 to reflect our estimate of the cash taxes had we been a REIT, which predominately relates to foreign taxes paid. As a result, income tax expense (benefit) is lower by the amount of the adjustment. |
Crown Castle International Corp.
Second Quarter 2014
|
| | | | |
| COMPANY OVERVIEW | FINANCIALS & METRICS | ASSET PORTFOLIO OVERVIEW | CAPITALIZATION OVERVIEW | APPENDIX |
FFO and AFFO for the years ended December 31, 2013, 2012, 2011, 2010, 2009, 2008 and 2007 are computed as follows:
|
| | | | | | | | | | | | | | | | | | | | | | | | | | | |
| | Years Ended December 31, | | | | | | |
| (in thousands of dollars, except share and per share amounts) | 2013 | | 2012 | | 2011 | | 2010 | | 2009 | | 2008 | | 2007 |
| Net income | $ | 93,901 |
| | $ | 200,888 |
| | $ | 171,460 |
| | $ | (311,259 | ) | | $ | (114,123 | ) | | $ | (48,858 | ) | | $ | (222,964 | ) |
| Real estate related depreciation, amortization and accretion | 761,070 |
| | 601,372 |
| | 531,869 |
| | 522,514 |
| | 520,820 |
| | 492,319 |
| | 502,550 |
|
| Asset write-down charges | 14,863 |
| | 15,548 |
| | 22,285 |
| | 13,687 |
| | 19,237 |
| | 16,888 |
| | 65,515 |
|
Adjustment for noncontrolling interest(1) | (3,790 | ) | | (12,304 | ) | | (383 | ) | | 319 |
| | (209 | ) | | — |
| | 151 |
|
| Dividends on preferred stock | — |
| | (2,481 | ) | | (19,487 | ) | | (19,879 | ) | | (19,878 | ) | | (19,878 | ) | | (19,879 | ) |
FFO(3) | $ | 866,043 |
| | $ | 803,023 |
| | $ | 705,744 |
| | $ | 205,381 |
| | $ | 405,847 |
| | $ | 440,471 |
| | $ | 325,373 |
|
| | | | | | | | | | | | | | |
| FFO (from above) | 866,043 |
| | 803,023 |
| | 705,744 |
| | 205,381 |
| | 405,847 |
| | 440,471 |
| | 325,373 |
|
| Adjustments to increase (decrease) FFO: | | | | | | | | | | | | | |
| Straight-line revenue | (218,631 | ) | | (251,327 | ) | | (199,969 | ) | | (161,716 | ) | | (100,721 | ) | | (39,926 | ) | | (42,910 | ) |
| Straight-line expense | 80,953 |
| | 54,069 |
| | 39,025 |
| | 38,759 |
| | 37,625 |
| | 39,381 |
| | 41,223 |
|
| Stock-based compensation expense | 41,788 |
| | 47,382 |
| | 35,991 |
| | 39,965 |
| | 30,305 |
| | 28,767 |
| | 25,087 |
|
Non-cash portion of tax provision(2) | 191,729 |
| | (106,742 | ) | | 4,970 |
| | (29,033 | ) | | (78,304 | ) | | (106,857 | ) | | (95,622 | ) |
| Non-real estate related depreciation, amortization and accretion | 13,145 |
| | 21,220 |
| | 21,082 |
| | 18,257 |
| | 8,919 |
| | 34,123 |
| | 37,354 |
|
| Amortization of non-cash interest expense | 99,244 |
| | 109,337 |
| | 102,944 |
| | 85,454 |
| | 61,357 |
| | 24,831 |
| | 23,913 |
|
| Other (income) expense | 3,872 |
| | 5,392 |
| | 5,577 |
| | 603 |
| | (2,447 | ) | | 62,103 |
| | 80,444 |
|
| Gains (losses) on retirement of long-term obligations | 37,127 |
| | 131,974 |
| | — |
| | 138,367 |
| | 91,079 |
| | (42 | ) | | — |
|
| Net gain (loss) on interest rate swaps | — |
| | — |
| | — |
| | 286,435 |
| | 92,966 |
| | 37,888 |
| | — |
|
| Acquisition and integration costs | 26,005 |
| | 18,298 |
| | 3,310 |
| | 2,102 |
| | — |
| | 2,504 |
| | 25,418 |
|
Adjustment for noncontrolling interest(1) | 3,790 |
| | 12,304 |
| | 383 |
| | (319 | ) | | 209 |
| | — |
| | (151 | ) |
| Capital improvement capital expenditures | (19,312 | ) | | (21,647 | ) | | (13,965 | ) | | (14,795 | ) | | (17,781 | ) | | (14,203 | ) | | (9,489 | ) |
| Corporate capital expenditures | (28,409 | ) | | (15,459 | ) | | (9,429 | ) | | (9,531 | ) | | (10,278 | ) | | (12,862 | ) | | (13,829 | ) |
AFFO(3) | $ | 1,097,347 |
| | $ | 807,823 |
| | $ | 695,661 |
| | $ | 599,931 |
| | $ | 518,776 |
| | $ | 496,178 |
| | $ | 396,811 |
|
| Weighted average common shares outstanding — diluted | 299,293 |
| | 291,270 |
| | 285,947 |
| | 286,764 |
| | 286,622 |
| | 282,007 |
| | 279,937 |
|
AFFO per share(3) | $ | 3.67 |
| | $ | 2.77 |
| | $ | 2.43 |
| | $ | 2.09 |
| | $ | 1.81 |
| | $ | 1.76 |
| | $ | 1.42 |
|
| | | | | | | | | | | | | | |
| AFFO (from above) | $ | 1,097,347 |
| | $ | 807,823 |
| | $ | 695,661 |
| | $ | 599,931 |
| | $ | 518,776 |
| | $ | 496,178 |
| | $ | 396,811 |
|
| Prepaid rent received | 241,451 |
| | 117,419 |
| | 34,395 |
| | 16,965 |
| | 17,096 |
| | 17,881 |
| | 12,623 |
|
| Amortization of prepaid rent | (66,728 | ) | | (41,592 | ) | | (12,890 | ) | | (5,598 | ) | | (1,060 | ) | | (833 | ) | | (761 | ) |
| Dividends on preferred stock | — |
| | 2,481 |
| | 19,487 |
| | 19,879 |
| | 19,878 |
| | 19,878 |
| | 19,879 |
|
AFFO, as previously defined(3) | $ | 1,272,070 |
| | $ | 886,131 |
| | $ | 736,653 |
| | $ | 631,177 |
| | $ | 554,690 |
| | $ | 533,104 |
| | $ | 428,552 |
|
| |
| (1) | Inclusive of the noncontrolling interest related to real estate related depreciation, amortization and accretion and asset write-downs. |
| |
| (2) | Adjusts the income tax provision to reflect our estimate of the cash taxes had we been a REIT, which predominately relates to foreign taxes paid. As a result income tax expense (benefit) is lower by the amount of the adjustment. |
| |
| (3) | See reconciliations and definitions provided herein. See also "Definitions of Non-GAAP Measures and Other Terms" herein for a discussion of the definitions of FFO and AFFO. |
Crown Castle International Corp.
Second Quarter 2014
|
| | | | |
| COMPANY OVERVIEW | FINANCIALS & METRICS | ASSET PORTFOLIO OVERVIEW | CAPITALIZATION OVERVIEW | APPENDIX |
FFO and AFFO for the three months ended September 30, 2013 and 2012 are computed as follows:
|
| | | | | | | |
| | Three Months Ended September 30, |
| (in thousands of dollars, except share and per share amounts) | 2013 | | 2012 |
| Net income | $ | 46,468 |
| | $ | 43,178 |
|
| Real estate related depreciation, amortization and accretion | 192,707 |
| | 149,484 |
|
| Asset write-down charges | 3,893 |
| | 1,560 |
|
Adjustment for noncontrolling interest(1) | (632 | ) | | (1,133 | ) |
FFO(3) | $ | 242,434 |
| | $ | 193,089 |
|
| | | | |
| FFO (from above) | 242,434 |
| | 193,089 |
|
| Adjustments to increase (decrease) FFO: | | | |
| Straight-line revenue | (53,294 | ) | | (69,244 | ) |
| Straight-line expense | 20,604 |
| | 13,079 |
|
| Stock-based compensation expense | 10,178 |
| | 16,182 |
|
Non-cash portion of tax provision(2) | 32,510 |
| | 28,687 |
|
| Non-real estate related depreciation, amortization and accretion | 2,701 |
| | 5,383 |
|
| Amortization of non-cash interest expense | 20,771 |
| | 24,879 |
|
| Other (income) expense | 631 |
| | 632 |
|
| Gains (losses) on retirement of long-term obligations | 1 |
| | — |
|
| Acquisition and integration costs | 4,369 |
| | 2,937 |
|
Adjustment for noncontrolling interest(1) | 632 |
| | 1,133 |
|
| Capital improvement capital expenditures | (3,741 | ) | | (4,259 | ) |
| Corporate capital expenditures | (6,478 | ) | | (3,218 | ) |
AFFO(3) | $ | 271,319 |
| | $ | 209,279 |
|
| Weighted average common shares outstanding — diluted | 291,378 |
| | 292,098 |
|
AFFO per share(3) | $ | 0.93 |
| | $ | 0.72 |
|
| | | | |
| AFFO (from above) | $ | 271,319 |
| | $ | 209,279 |
|
| Prepaid rent received | 63,940 |
| | 34,086 |
|
| Amortization of prepaid rent | (17,105 | ) | | (13,415 | ) |
AFFO, as previously defined(3) | $ | 318,154 |
| | $ | 229,950 |
|
| |
| (1) | Inclusive of the noncontrolling interest related to real estate related depreciation, amortization and accretion and asset write-downs. |
| |
| (2) | Adjusts the income tax provision to reflect our estimate of the cash taxes had we been a REIT, which predominately relates to foreign taxes paid. As a result income tax expense (benefit) is lower by the amount of the adjustment. |
| |
| (3) | See reconciliations and definitions provided herein. See also "Definitions of Non-GAAP Measures and Other Terms" herein for a discussion of the definitions of FFO and AFFO. |
Crown Castle International Corp.
Second Quarter 2014
|
| | | | |
| COMPANY OVERVIEW | FINANCIALS & METRICS | ASSET PORTFOLIO OVERVIEW | CAPITALIZATION OVERVIEW | APPENDIX |
FFO and AFFO for the quarter ending September 30, 2014 and the year ending December 31, 2014 are forecasted as follows:
|
| | | |
| | Q3 2014 | | Full Year 2014 |
| (in millions of dollars, except share and per share amounts) | Outlook | | Outlook |
| Net income | $81 to $114 | | $292 to $376 |
| Real estate related depreciation, amortization and accretion | $248 to $251 | | $985 to $1,000 |
| Asset write-down charges | $2 to $4 | | $7 to $17 |
Adjustment for noncontrolling interest(1) | $(2) to $2 | | $(7) to $1 |
| Dividends on preferred stock | $(11) to $(11) | | $(44) to $(44) |
FFO(3) | $337 to $342 | | $1,286 to $1,301 |
| | | | |
| FFO (from above) | $337 to $342 | | $1,286 to $1,301 |
| Adjustments to increase (decrease) FFO: | | | |
| Straight-line revenue | $(49) to $(44) | | $(193) to $(183) |
| Straight-line expense | $24 to $29 | | $100 to $110 |
| Stock-based compensation expense | $13 to $15 | | $58 to $63 |
| Non-cash portion of tax provision | $(4) to $1 | | $(13) to $2 |
| Non-real estate related depreciation, amortization and accretion | $4 to $6 | | $18 to $23 |
| Amortization of non-cash interest expense | $19 to $23 | | $75 to $86 |
| Other (income) expense | $2 to $4 | | $14 to $16 |
| Gains (losses) on retirement of long-term obligations | $0 to $0 | | $45 to $45 |
| Acquisition and integration costs | $2 to $6 | | $28 to $38 |
Adjustment for noncontrolling interest(1) | $2 to $(2) | | $7 to $(1) |
| Capital improvement capital expenditures | $(14) to $(12) | | $(34) to $(32) |
| Corporate capital expenditures | $(17) to $(15) | | $(46) to $(44) |
AFFO(3) | $332 to $337 | | $1,376 to $1,391 |
Weighted-average common shares outstanding—diluted(2) | 333.1 | | 333.1 |
AFFO per share(3) | $1.00 to $1.01 | | $4.13 to $4.18 |
| |
| (1) | Inclusive of the noncontrolling interest related to real estate related depreciation, amortization and accretion and asset write-downs. |
| |
| (2) | Based on 333.1 million diluted shares outstanding as of June 30, 2014. |
| |
| (3) | See definitions herein. See also “Definitions of Non-GAAP Financial Measures and Other Calculations” herein for a discussion of the definitions of FFO and AFFO. |
Crown Castle International Corp.
Second Quarter 2014
|
| | | | |
| COMPANY OVERVIEW | FINANCIALS & METRICS | ASSET PORTFOLIO OVERVIEW | CAPITALIZATION OVERVIEW | APPENDIX |
Net Debt to Last Quarter Annualized EBITDA calculation: |
| | | | | | |
| | Three Months Ended June 30, |
| (dollars in millions) | 2014 | 2013 |
| Total face value of debt | $ | 11,568.8 |
| $ | 10,780.6 |
|
| Ending cash and cash equivalents | 227.5 |
| 126.9 |
|
| Total Net Debt | $ | 11,341.3 |
| $ | 10,653.7 |
|
| | | |
| Adjusted EBITDA for the three months ended June 30, | $ | 530.6 |
| $ | 444.4 |
|
| Last quarter annualized adjusted EBITDA | 2,122.4 |
| 1,777.6 |
|
| Net Debt to Last Quarter Annualized Adjusted EBITDA | 5.3x |
| 6.0x |
|
Cash Interest Coverage Ratio Calculation: |
| | | | | | | |
| | Three Months Ended June 30, |
| (dollars in thousands) | 2014 | | 2013 |
| Adjusted EBITDA | $ | 530,629 |
| | $ | 444,395 |
|
| Interest expense on debt obligations | 123,930 |
| | 119,705 |
|
| Interest Coverage Ratio | 4.3x |
| | 3.7x |
|
AFFO Payout Ratio Calculation: |
| | | |
| | Three Months Ended June 30, |
| (per share) | 2014 |
| Dividend per share | $ | 0.35 |
|
| AFFO per share | $ | 1.05 |
|
| AFFO Payout Ratio | 33 | % |