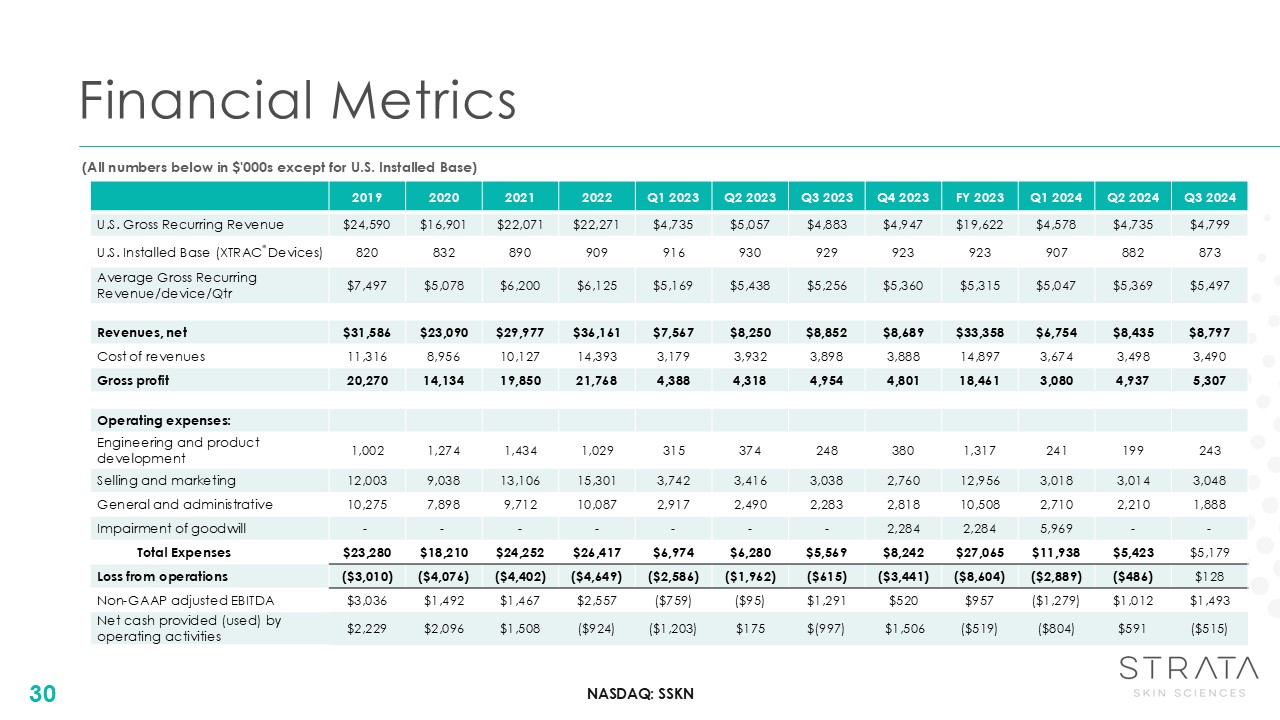
Financial Metrics Unaudited quarterly results 30 2019 2020 2021 2022 Q1 2023 Q2 2023 Q3 2023 Q4 2023 FY 2023 Q1 2024 Q2 2024 Q3 2024 U.S. Gross Recurring Revenue $24,590 $16,901 $22,071 $22,271 $4,735 $5,057 $4,883 $4,947 $19,622 $4,578 $4,735 $4,799 U.S. Installed Base (XTRAC® Devices) 820 832 890 909 916 930 929 923 923 907 882 873 Average Gross Recurring Revenue/device/Qtr $7,497 $5,078 $6,200 $6,125 $5,169 $5,438 $5,256 $5,360 $5,315 $5,047 $5,369 $5,497 Revenues, net $31,586 $23,090 $29,977 $36,161 $7,567 $8,250 $8,852 $8,689 $33,358 $6,754 $8,435 $8,797 Cost of revenues 11,316 8,956 10,127 14,393 3,179 3,932 3,898 3,888 14,897 3,674 3,498 3,490 Gross profit 20,270 14,134 19,850 21,768 4,388 4,318 4,954 4,801 18,461 3,080 4,937 5,307 Operating expenses: Engineering and product development 1,002 1,274 1,434 1,029 315 374 248 380 1,317 241 199 243 Selling and marketing 12,003 9,038 13,106 15,301 3,742 3,416 3,038 2,760 12,956 3,018 3,014 3,048 General and administrative 10,275 7,898 9,712 10,087 2,917 2,490 2,283 2,818 10,508 2,710 2,210 1,888 Impairment of goodwill - - - - - - - 2,284 2,284 5,969 - - Total Expenses $23,280 $18,210 $24,252 $26,417 $6,974 $6,280 $5,569 $8,242 $27,065 $11,938 $5,423 $5,179 Loss from operations ($3,010) ($4,076) ($4,402) ($4,649) ($2,586) ($1,962) ($615) ($3,441) ($8,604) ($2,889) ($486) $128 Non-GAAP adjusted EBITDA $3,036 $1,492 $1,467 $2,557 ($759) ($95) $1,291 $520 $957 ($1,279) $1,012 $1,493 Net cash provided (used) by operating activities $2,229 $2,096 $1,508 ($924) ($1,203) $175 $(997) $1,506 ($519) ($804) $591 ($515) (All numbers below in $'000s except for U.S. Installed Base)