EXHIBIT 99.1
| AmerUs Group's Equity Index Annuities and Equity Index Life Insurance September 30, 2003 |
| Safe Harbor Statement All statements, trend analyses and other information contained in this report relative to markets for our products and trends in our operating or financial results, as well as other statements including words such as "anticipate", "believe", "plan", "estimate", "expect", "intend", and other similar expressions, constitute forward-looking statements under the Private Securities Litigation Reform Act of 1995. Factors that may cause our actual results to differ materially from those contemplated by these forward-looking statements include, among others, the following possibilities: (a) general economic conditions and performance of our investment portfolio (b) customer response to new products and marketing initiatives; (c) increasing competition in the sale of insurance and annuities and the recruitment of sales representatives; (d) regulatory changes including those related to the sale of products; and (e) expected product margins. Please refer to the Company's 10-K and most recent 10-Q for additional factors. There can be no assurances that other factors not currently anticipated by us will not materially and adversely our results of operations. You are cautioned not to place undue reliance on any forward-looking statements made by us on our behalf. All statements speak only as of the date of the presentation was made or as of the date specified in the statement. We undertake no obligation to update or revise any forward-looking or historical statements or other factual assertions contained in the presentation. |
| Non-GAAP Information Sales Sales are presented as annualized premium, which is measured in accordance with industry practice, and represent the amount of new business sold during the period. Sales are a non- GAAP financial measure for an insurance company for which there is no comparable GAAP financial measure. We use sales to measure the productivity of our distribution network and as a basis for compensation of sales and marketing employees and agents. Sales are also a leading indicator of future revenue trends. However, revenues are driven by prior period sales as well as current period sales and therefore, a reconciliation of sales to revenues would not be meaningful or determinable. Product-Related Measures This presentation contains statistical and other measures which are not GAAP financial measures and for which there are no comparable GAAP measures. Since these measures are derived in part from statutory financial measures and other measures used in industry practice, no reconciliation to a comparable GAAP measure would be determinable or meaningful These measures are in accordance with insurance industry practice and are, we believe, useful in describing the characteristics and profitability of the Company's products. These measures include, for example, the expected internal rate of return on statutory distributable earnings, expected margins, spreads on premium allocation strategies and blocks of business and policyholder account value. |
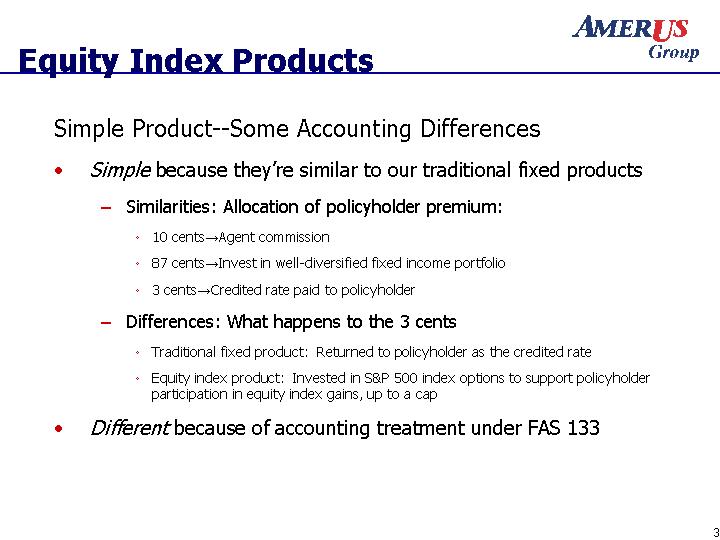
| Equity Index Products Simple Product--Some Accounting Differences Simple because they're similar to our traditional fixed products Similarities: Allocation of policyholder premium: 10 cents^Agent commission 87 cents^Invest in well-diversified fixed income portfolio 3 cents^Credited rate paid to policyholder Differences: What happens to the 3 cents Traditional fixed product: Returned to policyholder as the credited rate Equity index product: Invested in S&P 500 index options to support policyholder participation in equity index gains, up to a cap Different because of accounting treatment under FAS 133 |
| Agenda Equity Index Annuities Product structure, profitability and experience Question and answer session Equity Index Life Insurance Product structure, profitability and experience Question and answer session Hedging and accounting Overview Question and answer session Summary |
| Equity Index Product Rationale Equity index (EI) products: Meet consumer's need and financial objectives Offer greater profit potential Offer a sustainable advantage Leverage AmerUs Group's management skills |
| Equity Index Annuities |
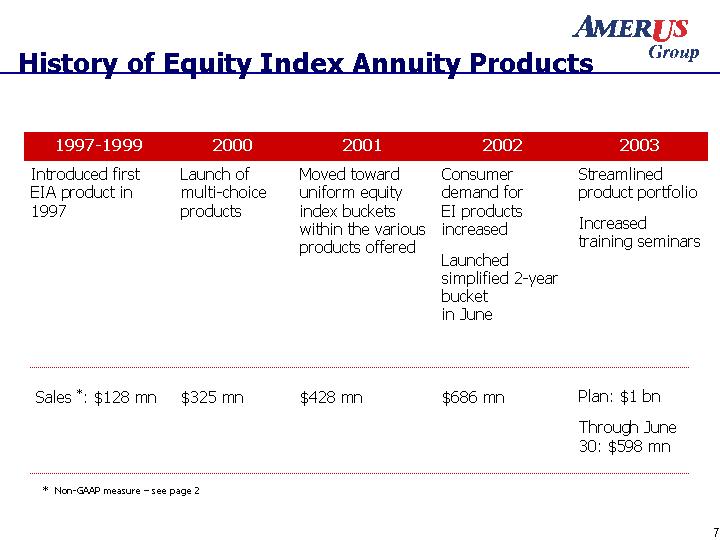
| History of Equity Index Annuity Products 1997-1999 2000 2001 2002 2003 Introduced first EIA product in 1997 Launch of multi-choice products Moved toward uniform equity index buckets within the various products offered Consumer demand for EI products increased Launched simplified 2-year bucket in June Streamlined product portfolio Increased training seminars Sales *: $128 mn $325 mn $428 mn $686 mn Plan: $1 bn Through June 30: $598 mn * Non-GAAP measure - see page 2 |
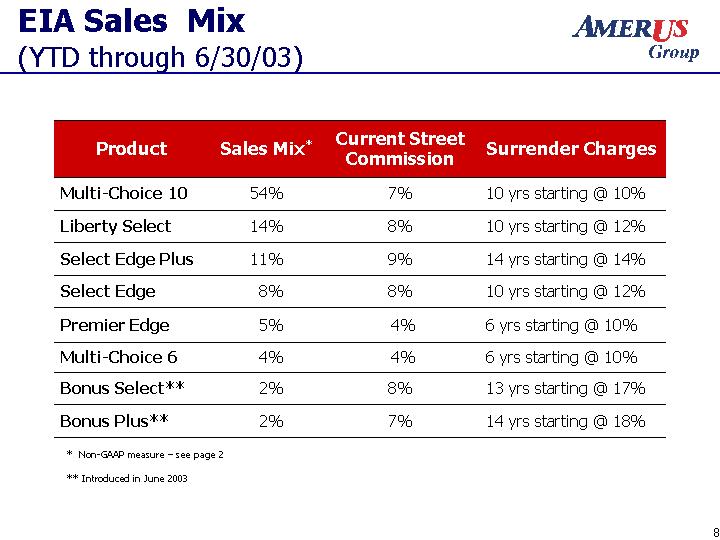
| EIA Sales Mix (YTD through 6/30/03) Product Sales Mix* Current Street Commission Surrender Charges Multi-Choice 10 54% 7% 10 yrs starting @ 10% Liberty Select 14% 8% 10 yrs starting @ 12% Select Edge Plus 11% 9% 14 yrs starting @ 14% Select Edge 8% 8% 10 yrs starting @ 12% Premier Edge 5% 4% 6 yrs starting @ 10% Multi-Choice 6 4% 4% 6 yrs starting @ 10% Bonus Select** 2% 8% 13 yrs starting @ 17% Bonus Plus** 2% 7% 14 yrs starting @ 18% ** Introduced in June 2003 * Non-GAAP measure - see page 2 |
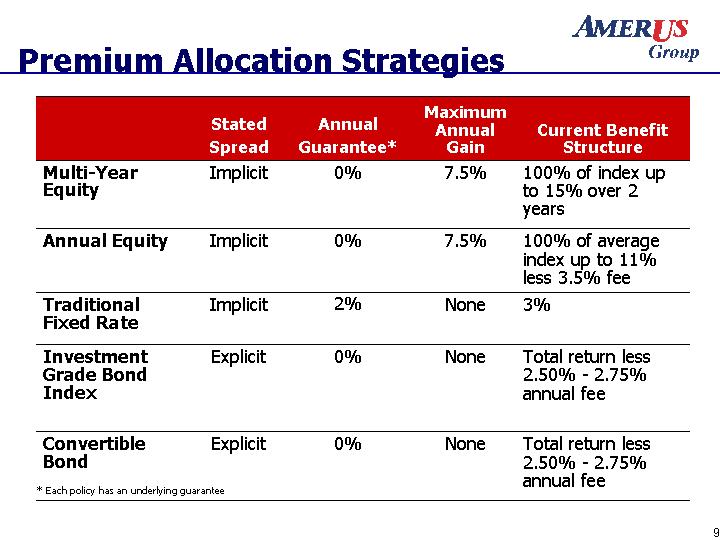
| Premium Allocation Strategies Stated Spread Annual Guarantee* Maximum Annual Gain Current Benefit Structure Multi-Year Equity Implicit 0% 7.5% 100% of index up to 15% over 2 years Annual Equity Implicit 0% 7.5% 100% of average index up to 11% less 3.5% fee Traditional Fixed Rate Implicit 2% None 3% Investment Grade Bond Index Explicit 0% None Total return less 2.50% - 2.75% annual fee Convertible Bond Explicit 0% None Total return less 2.50% - 2.75% annual fee * Each policy has an underlying guarantee |
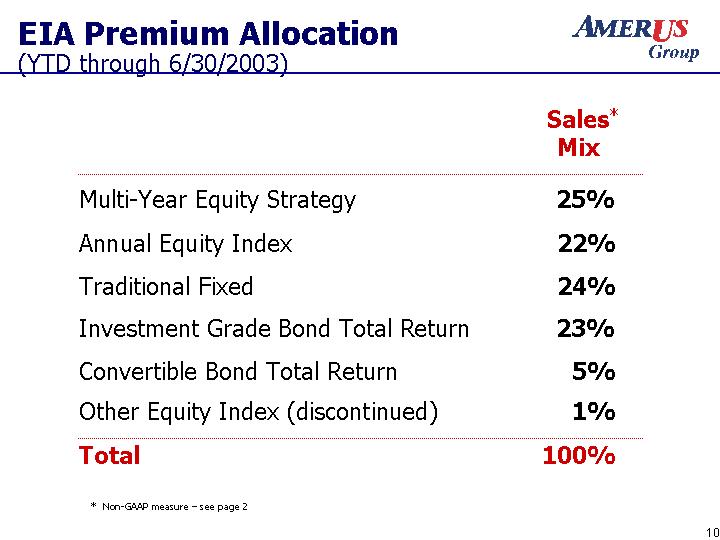
| EIA Premium Allocation (YTD through 6/30/2003) Sales* Mix Multi-Year Equity Strategy 25% Annual Equity Index 22% Traditional Fixed 24% Investment Grade Bond Total Return 23% Convertible Bond Total Return 5% Other Equity Index (discontinued) 1% Total 100% * Non-GAAP measure - see page 2 |
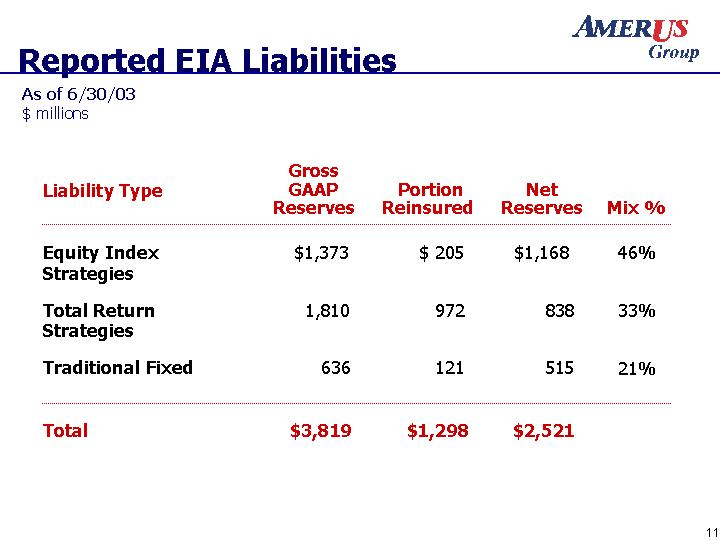
| Reported EIA Liabilities Liability Type Gross GAAP Reserves Portion Reinsured Portion Reinsured Net Reserves Mix % Equity Index Strategies $1,373 $1,373 $ 205 $1,168 46% Total Return Strategies 1,810 1,810 972 838 33% Traditional Fixed 636 636 121 515 21% Total $3,819 $3,819 $1,298 $2,521 As of 6/30/03 $ millions |
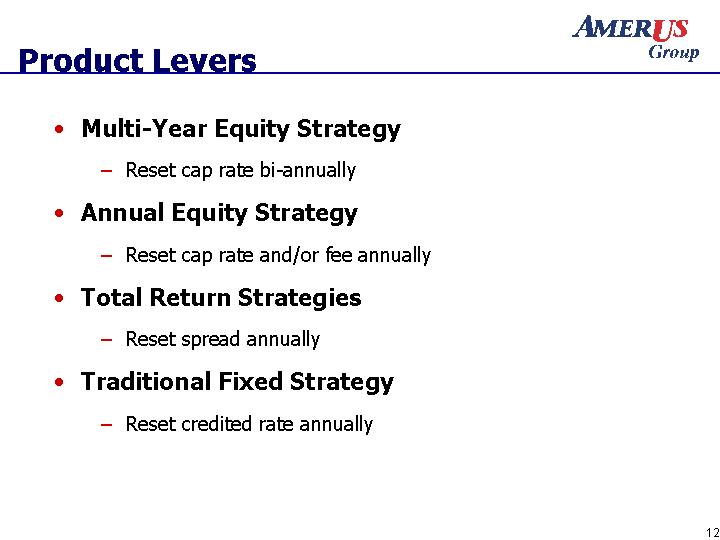
| Product Levers Multi-Year Equity Strategy Reset cap rate bi-annually Annual Equity Strategy Reset cap rate and/or fee annually Total Return Strategies Reset spread annually Traditional Fixed Strategy Reset credited rate annually |
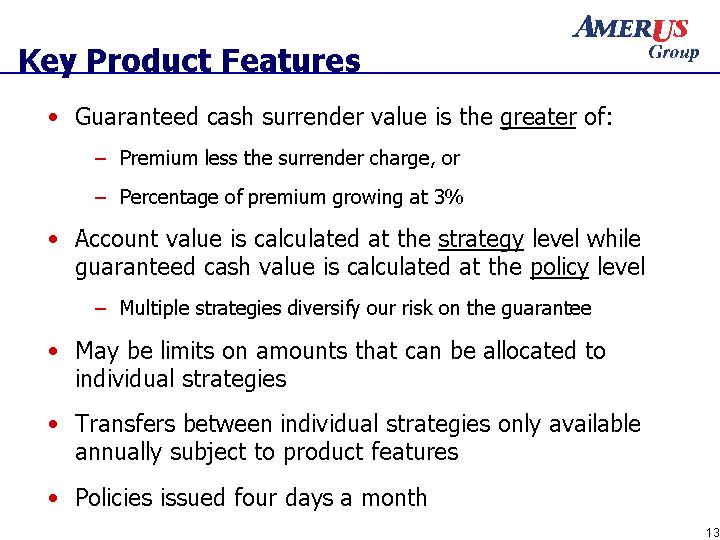
| Key Product Features Guaranteed cash surrender value is the greater of: Premium less the surrender charge, or Percentage of premium growing at 3% Account value is calculated at the strategy level while guaranteed cash value is calculated at the policy level Multiple strategies diversify our risk on the guarantee May be limits on amounts that can be allocated to individual strategies Transfers between individual strategies only available annually subject to product features Policies issued four days a month |
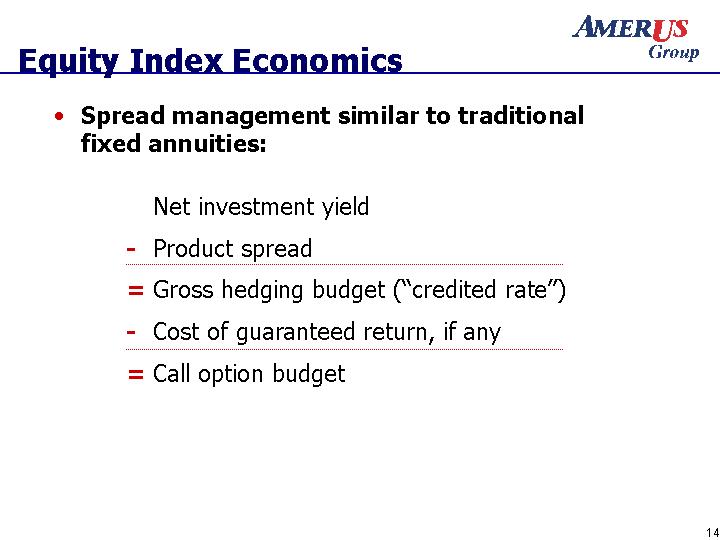
| Equity Index Economics Spread management similar to traditional fixed annuities: Net investment yield - Product spread = Gross hedging budget ("credited rate") - Cost of guaranteed return, if any = Call option budget |
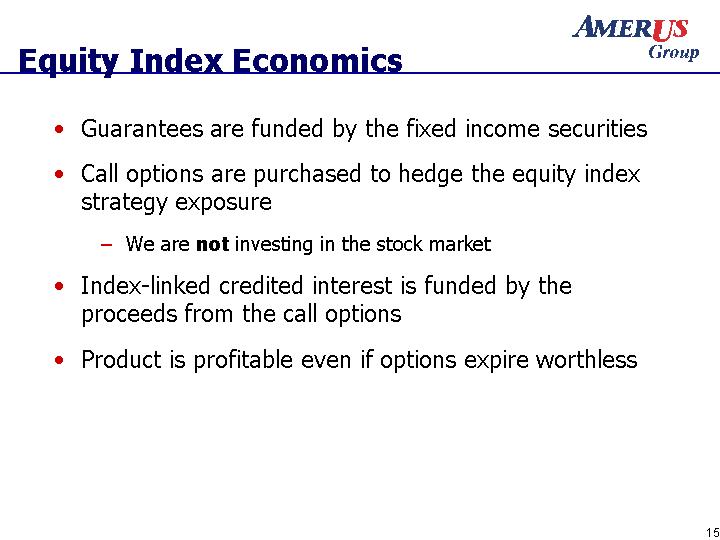
| Equity Index Economics Guarantees are funded by the fixed income securities Call options are purchased to hedge the equity index strategy exposure We are not investing in the stock market Index-linked credited interest is funded by the proceeds from the call options Product is profitable even if options expire worthless |
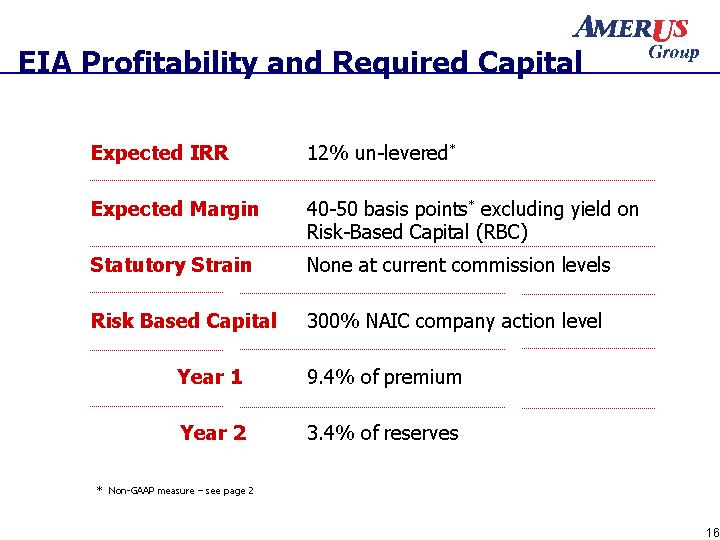
| EIA Profitability and Required Capital Expected IRR 12% un-levered* Expected Margin 40-50 basis points* excluding yield on Risk-Based Capital (RBC) Statutory Strain None at current commission levels Risk Based Capital 300% NAIC company action level Year 1 9.4% of premium Year 2 3.4% of reserves * Non-GAAP measure - see page 2 |
| Experience To Date Spreads have been better than pricing Generally in the 250 basis point range (excluding IL Annuity block)* Slow account value growth has offset some of this favorable experience Anti-selection on exercise of free look was minimal during the bear market Surrenders consistent with expectations Overall performance has met expectations * Non-GAAP measure - see page 2 |
| Recent EIA Product Changes Managing our profitability Lowered commissions on all annuity products Adjusted the annual caps Reduced annual guarantees on fixed strategy Mitigating our interest rate risk Added Market Value Adjustment (MVA) endorsement Responding to the marketplace Rolled out two Bonus EIA products in June Added first year premium bonus |
| Equity Index Annuity Key Points EIA market fits naturally with our traditional fixed annuity business Effective, proactive controls are in place to: Manage risk through effective product design Provide effective hedging Preserve levers to maintain profitability Market conditions and consumer demand favor the EI segment of fixed annuities at this time EI is most profitable segment currently Expect product mix to change as market conditions shift |
| Equity Index Annuities Q & A |
| Equity Index Life Insurance |
| Strategic Rationale for EIL Competitive alternative to par whole life, traditional universal life and variable life Market growth and distribution recruiting opportunity Concept sale positioned between traditional fixed and variable Primary competition is traditional fixed as expected credited rate is a function of fixed interest rates |
| Strategic Rationale Power of equity index engine The equity index account is expected to outperform a fixed rate product over time Policyholders expect a higher credited rate compared to traditional fixed rate over the long-term Company expects to earn higher margins on EI products compared to traditional fixed products Barriers to entry Expensive and complex administration system Patent pending |
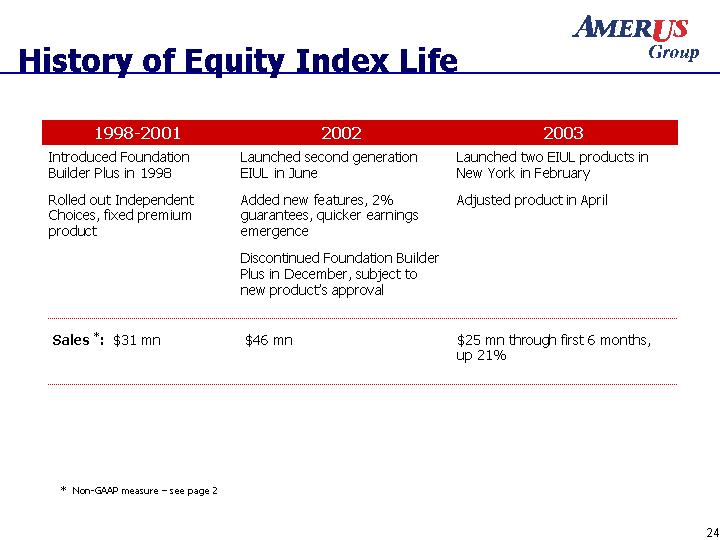
| History of Equity Index Life 1998-2001 2002 2003 Introduced Foundation Builder Plus in 1998 Rolled out Independent Choices, fixed premium product Launched second generation EIUL in June Added new features, 2% guarantees, quicker earnings emergence Discontinued Foundation Builder Plus in December, subject to new product's approval Launched two EIUL products in New York in February Adjusted product in April Sales *: $31 mn $46 mn $25 mn through first 6 months, up 21% * Non-GAAP measure - see page 2 |

| Equity Index Life Sales Mix ** Two EIUL products sold by each life company Product YTD through 6/30/03 June 2003 Account Value * Underlying Guarantee Current Annual Cap Premium Structure Foundation Builder Plus 21% 6% $95.4 mn 3% 10% Flexible Independent Choices 7% 8% $4.7 mn 5% 9% Fixed Second Generation** 72% 86% $28.6 mn 2% 11% Flexible * Non-GAAP measure - see page 2 |
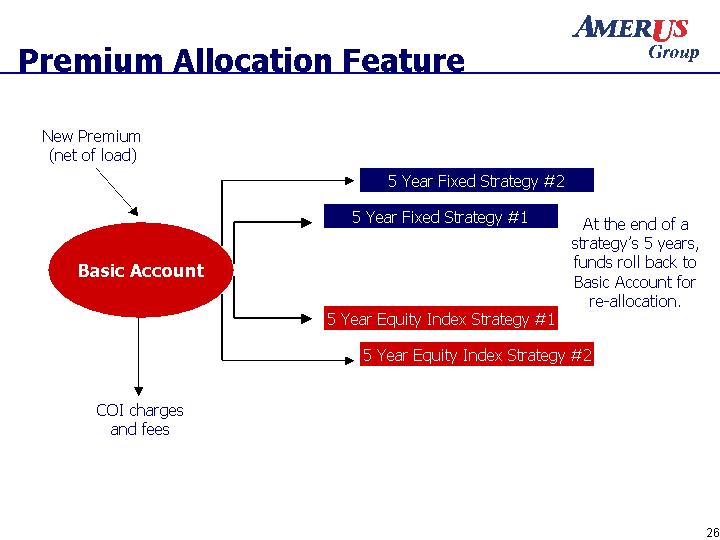
| Premium Allocation Feature Basic Account 5 Year Fixed Strategy #2 5 Year Fixed Strategy #1 5 Year Equity Index Strategy #2 5 Year Equity Index Strategy #1 New Premium (net of load) COI charges and fees At the end of a strategy's 5 years, funds roll back to Basic Account for re-allocation. |
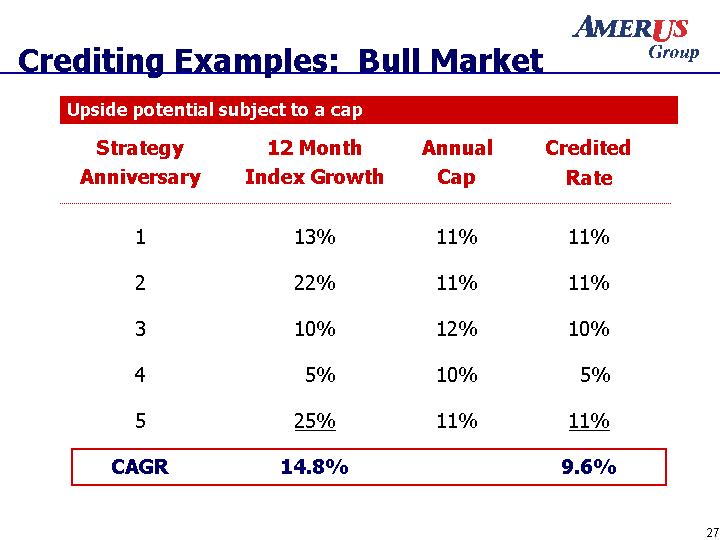
| Crediting Examples: Bull Market Strategy Anniversary 12 Month Index Growth Annual Cap Credited Rate 1 13% 11% 11% 2 22% 11% 11% 3 10% 12% 10% 4 5% 10% 5% 5 25% 11% 11% CAGR 14.8% 9.6% Upside potential subject to a cap |
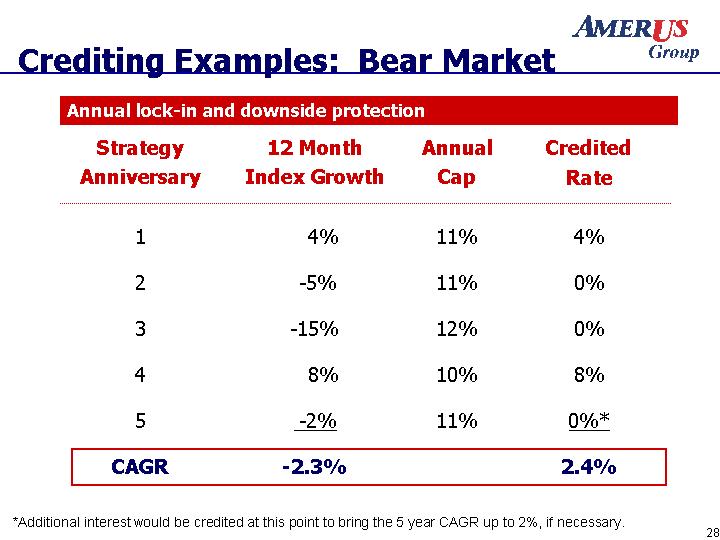
| Crediting Examples: Bear Market Strategy Anniversary 12 Month Index Growth Annual Cap Credited Rate 1 4% 11% 4% 2 -5% 11% 0% 3 -15% 12% 0% 4 8% 10% 8% 5 -2% 11% 0%* CAGR -2.3% 2.4% *Additional interest would be credited at this point to bring the 5 year CAGR up to 2%, if necessary. Annual lock-in and downside protection |
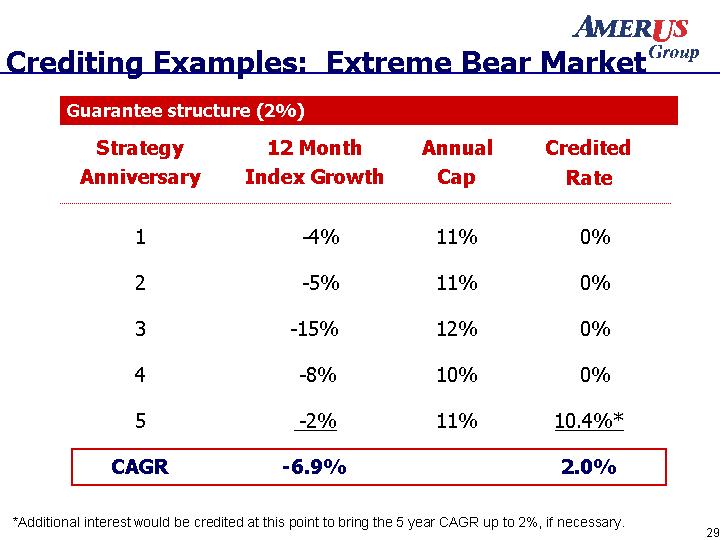
| Crediting Examples: Extreme Bear Market Strategy Anniversary 12 Month Index Growth Annual Cap Credited Rate 1 -4% 11% 0% 2 -5% 11% 0% 3 -15% 12% 0% 4 -8% 10% 0% 5 -2% 11% 10.4%* CAGR -6.9% 2.0% Guarantee structure (2%) *Additional interest would be credited at this point to bring the 5 year CAGR up to 2%, if necessary. |
| EIL Cost of the Guarantee Expected cost of 2% guarantee structure is very small Based on historical analysis of S&P 500 index performance (1950 - 2003) Credited interest in positive years is applied to the cumulative guarantee (negative years are floored at zero) Downside is lower profits, not losses, if the index performance does not generate sufficient interest credits to cover the guarantee |
| EIL Cost of the Guarantee Potential management actions in the event the index declines perpetually Fund some of the cost of the guarantee by not hedging the 5th year after 4 consecutive down years since the cumulative guarantee (e.g. 10.4%) will likely be credited in the 5th year regardless of index performance Reduce the annual cap to reduce the hedging costs Extend the 5-year true-up period for newly created index buckets |
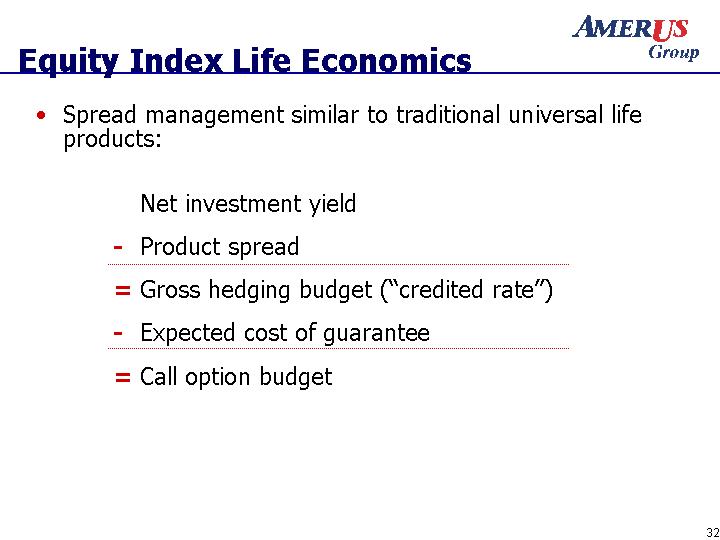
| Equity Index Life Economics Spread management similar to traditional universal life products: Net investment yield - Product spread = Gross hedging budget ("credited rate") - Expected cost of guarantee = Call option budget |
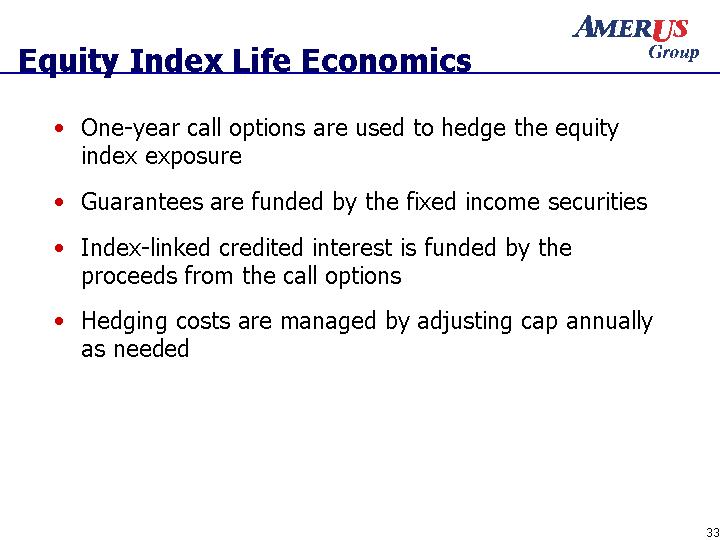
| Equity Index Life Economics One-year call options are used to hedge the equity index exposure Guarantees are funded by the fixed income securities Index-linked credited interest is funded by the proceeds from the call options Hedging costs are managed by adjusting cap annually as needed |
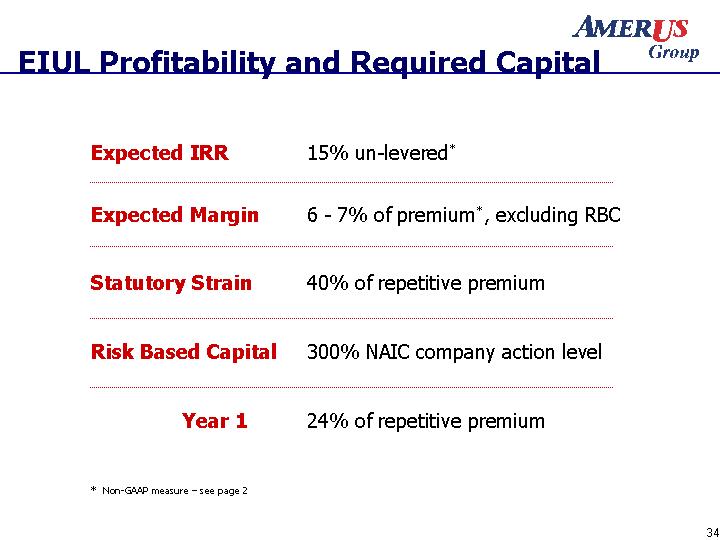
| EIUL Profitability and Required Capital Expected IRR 15% un-levered* Expected Margin 6 - 7% of premium*, excluding RBC Statutory Strain 40% of repetitive premium Risk Based Capital 300% NAIC company action level Year 1 24% of repetitive premium * Non-GAAP measure - see page 2 |
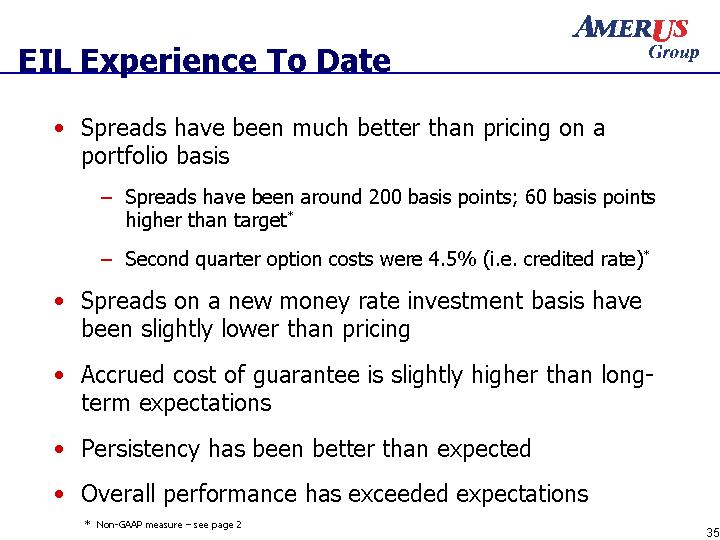
| EIL Experience To Date Spreads have been much better than pricing on a portfolio basis Spreads have been around 200 basis points; 60 basis points higher than target* Second quarter option costs were 4.5% (i.e. credited rate)* Spreads on a new money rate investment basis have been slightly lower than pricing Accrued cost of guarantee is slightly higher than long- term expectations Persistency has been better than expected Overall performance has exceeded expectations * Non-GAAP measure - see page 2 |
| Recent EIL Developments Added a No Lapse Guarantee rider to the second generation products Guarantees death benefit for a fee Excellent tool for competing against par whole life, traditional UL and variable life Replacing Indianapolis Life's niche Interest Sensitive Whole Life product with an equity-index version |
| Equity Index Life Key Points Niche segment of the traditional fixed life market "Sweet spot" of competitiveness and profitability due to product innovation and administrative barriers to entry for smaller companies Product challenges and risks are effectively managed Accelerated statutory pay back enhances our ability to finance sales growth, reduce risk and boost statutory capital Experience is consistent with expectations |
| Equity Index Life Q & A |

| Hedging and Accounting |
| Hedging For Equity-Linked Strategies Most of the premiums are invested consistent with other products (e.g. fixed income security) Small part of the premium is used to purchase call options to hedge the equity index account exposure Proceeds from the call option replicates the credited interest |
| Equity Index Hedging Guidelines Hedging guidelines approved by board of directors Replicate embedded options sold Purchase one year options to back annual reset Purchase two year option to back two year point-to-point Utilize uniform product features to maximize effectiveness Dynamic hedging not utilized Hedge 100% of premium at issue Four explicit buy dates per month maximizes effectiveness Counter-party must be "AA" or better unless collateralized |

| Adjusted Net Operating Income vs. Net Income: Key Differences Change in market value of option assets vs. change in FAS 133 liability on equity-linked strategies Effect of the cumulative guarantee on total return strategies when the value of the assets is below the guarantee |
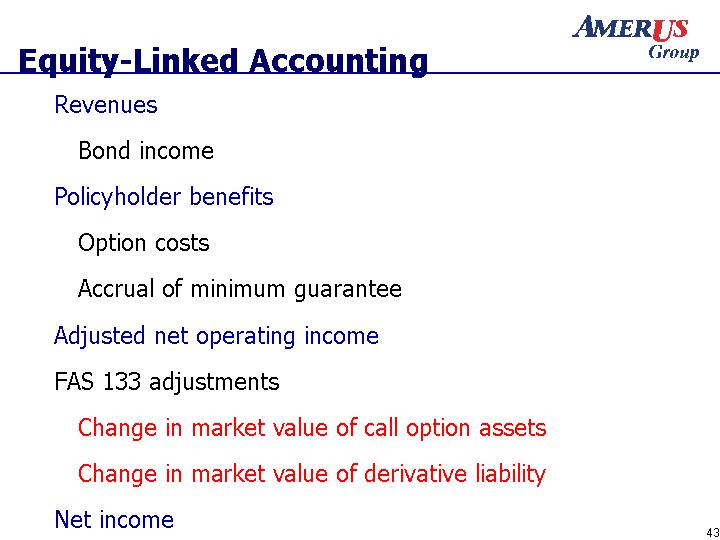
| Equity-Linked Accounting Revenues Bond income Policyholder benefits Option costs Accrual of minimum guarantee Adjusted net operating income FAS 133 adjustments Change in market value of call option assets Change in market value of derivative liability Net income |
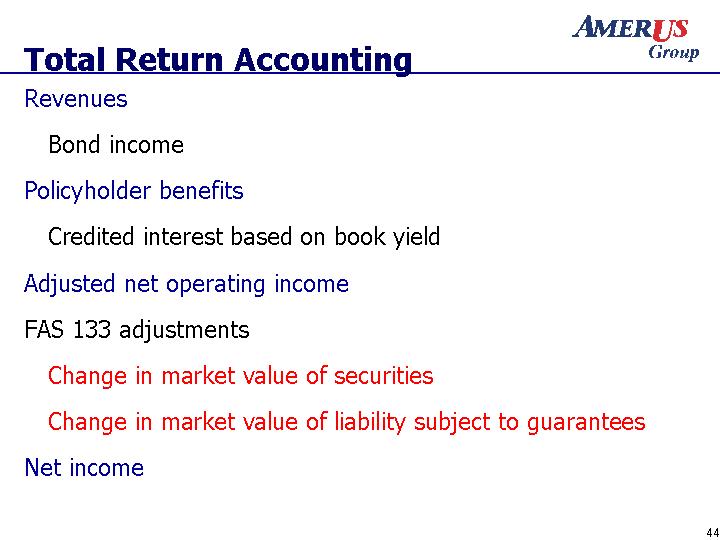
| Total Return Accounting Revenues Bond income Policyholder benefits Credited interest based on book yield Adjusted net operating income FAS 133 adjustments Change in market value of securities Change in market value of liability subject to guarantees Net income |
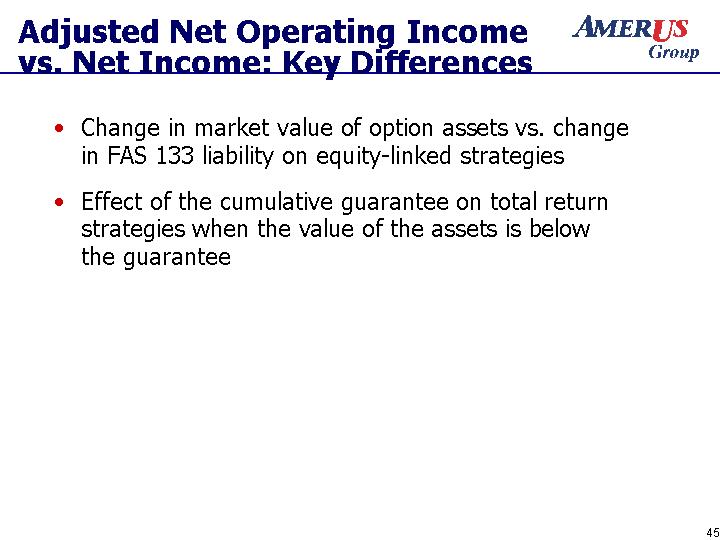
| Adjusted Net Operating Income vs. Net Income: Key Differences Change in market value of option assets vs. change in FAS 133 liability on equity-linked strategies Effect of the cumulative guarantee on total return strategies when the value of the assets is below the guarantee |
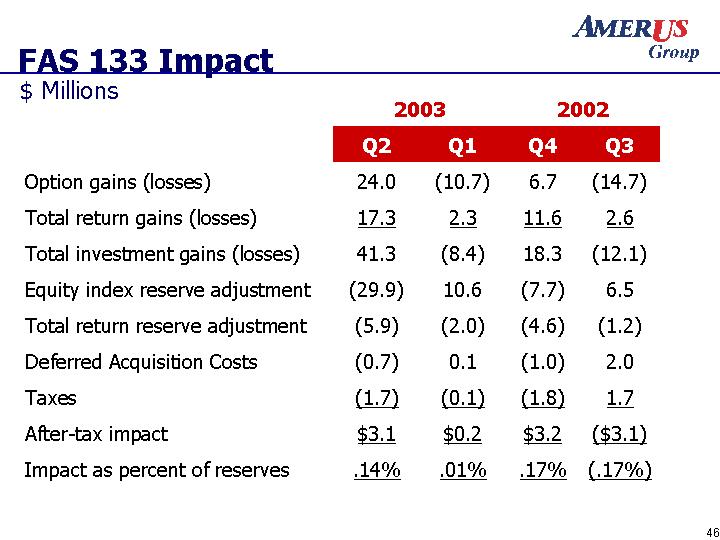
| FAS 133 Impact $ Millions 2003 2003 2002 2002 Q2 Q1 Q4 Q3 Option gains (losses) 24.0 (10.7) 6.7 (14.7) Total return gains (losses) 17.3 2.3 11.6 2.6 Total investment gains (losses) 41.3 (8.4) 18.3 (12.1) Equity index reserve adjustment Total return reserve adjustment Deferred Acquisition Costs Taxes After-tax impact Impact as percent of reserves (29.9) (5.9) (0.7) (1.7) $3.1 ..14% 10.6 (2.0) 0.1 (0.1) $0.2 ..01% (7.7) (4.6) (1.0) (1.8) $3.2 ..17% 6.5 (1.2) 2.0 1.7 ($3.1) (.17%) |
| Hedging and Accounting Q & A |
| Equity Index Product Rationale Equity index (EI) products meet consumers' needs and financial objectives EI products offer greater profit potential EI products offer a sustainable advantage EI products leverage AmerUs Group's management skills |
| AmerUs Group's Equity Index Annuities and Equity Index Life Insurance September 30, 2003 |