Exhibit 99.1
February 22, 2005

| AmerUs Group 2005 Investor Conference February 22, 2005 |
1
February 22, 2005
| Safe Harbor All statements, trends, estimates, goals, targets, projections or other financial information contained in this investor presentation relative to trends in the Company's operations or financial results constitute forward-looking statements under the Private Securities Litigation Reform Act of 1995. These forward-looking statements are subject to factors which may cause actual results to be materially different from those contemplated by the forward-looking statements. There can be no assurances that other factors not currently anticipated by management will not also materially and adversely affect the Company's results of operations. Please refer to the Company's 10-K, most recent 10-Q, and Management's Discussion and Analysis (MD&A) for a listing of factors which could cause actual results to differ materially from those contemplated by the forward-looking statements. |
2
February 22, 2005
| Explanatory Note On Non-GAAP Measures The historical and forward-looking financial information presented at this conference and contained in the written materials provided include non-GAAP and performance measures which are based on methodologies other than Generally Accepted Accounting Principles ("GAAP"), such as adjusted net operating income, adjusted net operating income per share, operating return on equity and sales. Each of these non-GAAP measures is listed and described in the Appendix to the printed version of the presentation and in conjunction with the webcast at the "Investor Relations" section of our website at www.amerus.com. Also included with the descriptions of those measures are reconciliations to the most directly comparable GAAP measures, if any. |
3
February 22, 2005
| Roger Brooks Chairman and Chief Executive Officer AmerUs Group |
4
February 22, 2005
| Beginning The Journey... As a mutual, couldn’t grow fast enough on earnings alone Industry consolidation $ 4 billion |
5
February 22, 2005
| Viability Factors Large enough to achieve goals Selected core businesses Scale and other efforts Establish real, attainable targets Results-focused management to make it happen Scale Defendable niches Low-cost producer Increase ROE Shareholder- oriented team |
6
February 22, 2005
| We Managed Our Evolution Well Mutual holding company Three strategic, successful acquisitions Two demutualizations Seven divestitures of non-core businesses Executed our plan and built a strong foundation Now moving to the next level |
7
February 22, 2005

| We Have Scale Leading provider of life insurance and annuity products Attracting producers and managers Rate of sales outpaces peers by 150-200 percent 7th fastest growing financial services company from 1998-2003, based on revenue Scale Source: Merrill Lynch Global Markets & Investment Banking Group, May 2004 |
8
February 22, 2005
| We've Built A Defendable Niche Leading writer of equity indexed products in both our businesses Improved profitability and powered growth Scale Defendable niches |
9
February 22, 2005
| We Are A Proven Low-Cost Producer Reduced expenses by about $100 million, while growing Currently $172 million in expenses Industry benchmarks show us as a top expense manager Unit costs are better than companies 10 times our size Scale Defendable niches Low-cost producer |
10
February 22, 2005
| Our ROE Has Increased As Planned ROE Post-IPO: 7.6% ROE in 2003-2004: 11.9% Net income impacts of demutualizations and restructuring are completed Earnings power is strong and growing Scale Defendable niches Low-cost producer Increase ROE |
11
February 22, 2005
| We Built A Shareholder-Oriented Management Team Management is experienced and part of our public company culture Management selection is a critical competency Scale Defendable niches Low-cost producer Increase ROE Shareholder- oriented team |
12
February 22, 2005
| Experienced Management Team Executive Title AmerUs Group Experience Industry Experience Roger K. Brooks Chairman & Chief Executive Officer 46 years 46 years Thomas C. Godlasky President & Chief Operating Officer 10 years 25 years Gregory D. Boal Executive Vice President & Chief Investment Officer 2 years 20 years Brian J. Clark Executive Vice President & Chief Product Officer 16 years 16 years Mark V. Heitz President, AmerUs Annuity Group 18 years 30 years Gary R. McPhail President, AmerUs Life Insurance Group 7 years 31 years Melinda S. Urion Executive Vice President & Chief Financial Officer 3 years 26 years |
13
February 22, 2005
| Tom Godlasky President and Chief Operating Officer AmerUs Group |
14
February 22, 2005
| Goals To utilize our core competencies to seek out innovative opportunities in our targeted markets. To rapidly accelerate growth in shareholder value through efficient delivery of high return products and value-added services from our core lines of business. Core Competencies Distribution management Product development innovation Investment management Asset/liability management Acquisition integration |
15
February 22, 2005
| 2004: An Outstanding Year Record earnings Significantly stronger capital levels Expanded distribution Improved efficiencies 2005 earnings guidance: $4.45-$4.57 per share |
16
February 22, 2005
| How AMH Investors Benefited Stock price... 30% increase We outperformed... Our peer group All major indices Ratings Moody's outlook: negative A.M. Best outlook: stable S&P outlook: stable Tell our story... 6 major conferences 76 individual investor calls New coverage: bulge bracket firm |
17
February 22, 2005

| Growth Opportunities Mature markets Continue to take market share Price products to meet our return targets Growth markets Maintain leadership positions Equity indexed universal life Equity indexed annuities |
18
February 22, 2005
| Consumer Risk/Return Spectrum Fixed Equity Indexed Variable Lowest risk Lowest expected return Highest risk Highest expected return Low risk Higher expected return Equity indexed is the "all-weather" product strategy Similar core competencies required for fixed and equity indexed market segments |
19
February 22, 2005
| EI Products Are Good For Customers Higher expected credited rate Equity participation with guarantees Premium allocation flexibility in a fixed product Appealing concept for distribution to sell Lock-in gains annually |
20
February 22, 2005
| EI Products Are Good For Shareholders Concept has strong growth potential Higher profit margins Stronger net investment returns Higher product fees Unvested gains upon surrender Minimal cost of guarantees |
21
February 22, 2005
| Support For Retirement Products 1998 2001 2004 2006 2010 2011 2015 2020 2025 2035 57 62 69 74 79 81 82 81 79 80 Projected number of Americans aged 45-64 In millions Baby boomers transitioning from consumers to savers Sources: Bureau of the Census; Department of Commerce; Federal Reserve |
22
February 22, 2005
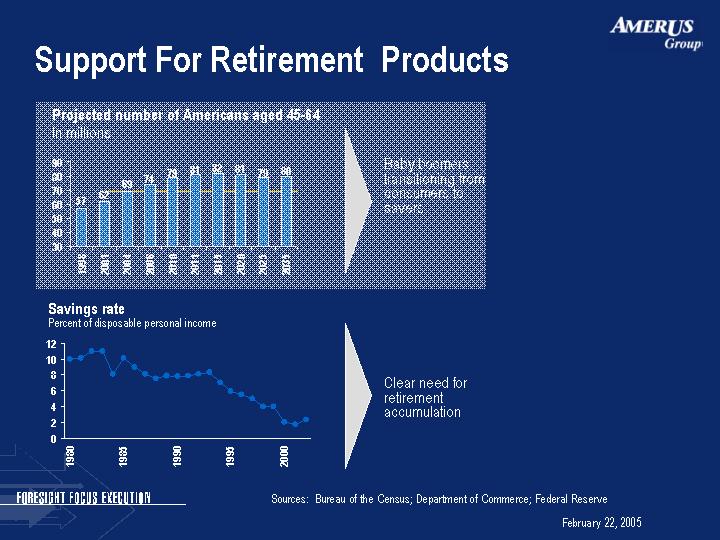
| Support For Retirement Products Baby boomers transitioning from consumers to savers 1980 1981 1982 1983 1984 1985 1986 1987 1988 1989 1990 1991 1992 1993 1994 1995 1996 1997 1998 1999 2000 2001 2002 10 10.1 11 11 8.1 10.1 9 8.1 7.5 7.9 7.8 7.9 8.1 8.3 7 5.9 5.5 5 4 4 2 1.7 2.3 Savings rate Percent of disposable personal income Clear need for retirement accumulation Sources: Bureau of the Census; Department of Commerce; Federal Reserve 1998 2001 2004 2006 2010 2011 2015 2020 2025 2035 57 62 69 74 79 81 82 81 79 80 Projected number of Americans aged 45-64 In millions |
23
February 22, 2005
| Support For Retirement Products Baby boomers entering peak asset accumulation years will fuel high savings and investment growth Substantial growth Savings- oriented life insurance Annuities Clear need for retirement accumulation Sources: Bureau of the Census; Department of Commerce; Federal Reserve 1998 2001 2004 2006 2010 2011 2015 2020 2025 2035 57 62 69 74 79 81 82 81 79 80 1980 1981 1982 1983 1984 1985 1986 1987 1988 1989 1990 1991 1992 1993 1994 1995 1996 1997 1998 1999 2000 2001 2002 10 10.1 11 11 8.1 10.1 9 8.1 7.5 7.9 7.8 7.9 8.1 8.3 7 5.9 5.5 5 4 4 2 1.7 2.3 Baby boomers transitioning from consumers to savers Savings rate Percent of disposable personal income Projected number of Americans aged 45-64 In millions |
24
February 22, 2005
| Evidence Of Underserved Markets 1976 1984 1992 1998 82 81 78 74 Middle income consumers Who own life insurance Report in surveys that they need more insurance Who do not own life insurance Recognize the need, but often have not had contact with a credible agent Traditional sales forces have not yet reached the mass market Percent of Households Owning Life Insurance Source: LIMRA |
25
February 22, 2005
| We Are Well-Positioned Our equity indexed products Tested Proven Our hedging strategies Clear Uncomplicated Our administrative systems Superior: built for equity indexed products Advantage...and barrier to competitors Our distribution systems Strong recruiting and developing Understand value of equity indexed products |
26
February 22, 2005
| Superior Execution Results #1 market share: equity indexed life insurance Top 5 market share: equity indexed annuities Strategic shift in sales mix: Our equity indexed life insurance sales in 2004 exceeded our total life insurance sales in 1999 Our equity indexed annuity sales in 2004 exceeded our total annuity sales in 2000 |
27
February 22, 2005

| Agenda AmerUs Annuity Group Mark Heitz AmerUs Life Insurance Group Gary McPhail AmerUs Group-Product Management Brian Clark AmerUs Capital Management Greg Boal AmerUs Group-Finance Melinda Urion Summary Tom Godlasky |
28
February 22, 2005
| AmerUs Group Highlights Foresight Small mutual to national public company Focus On core lines of business, revenues and efficiencies Execution Create and deliver shareholder value |
29
February 22, 2005
| Mark Heitz President and Chief Executive Officer AmerUs Annuity Group |
30
February 22, 2005
| Growing Equity Indexed Annuity Market 2000 2001 2002 2003 2004E East 5.4 6.5 11.7 14 22 CAGR 42.1% $ billions Source: Advantage Compendium |
31
February 22, 2005
| Fixed Annuity Production 2000 2001 2002 2003 2004E East 52.7 71.5 103.8 87.6 91.2 Fixed annuity production growing at one-third the rate of EIAs $ billions CAGR 14.7% Source: LIMRA |
32
February 22, 2005
| One Out Of Four Fixed Annuity Sales Is An EIA 2000 2001 2002 2003 2004E East 0.1 0.087 0.113 0.16 0.25 Source: Advantage Compendium and LIMRA |
33
February 22, 2005
| Generation Profile Age People (millions) Buying Power ($ trillions) Other Generation Y 10 - 27 76 $0.6 More sophisticated about money than parents (Baby Boomers) Generation X 28 - 39 53 $1.5 More conservative than Baby Boomers, better target for insurance Baby Boomers 40 - 58 77 $2.1 Will retire with $0.5-1.0 million in assets, on average Concerned with protecting assets and retirement 4 million turn 50 each year for next ten years Mature Market Above 58 59 $1.6 Control 77% of financial assets Expected to pass $7-10 trillion to heirs Source: Insurance Advisory Board |
34
February 22, 2005
| The "Age Wave" Expands Market Opportunity Age 0-9 10-19 20-29 30-39 40-49 50-59 60-69 70-79 85+ East 2.43 0.255 4.666 -2.759 0.888 10.33 8.451 0.00759 2.47 The two age groups most interested in EIAs are growing by 19 million over the next ten years Average age of AmerUs Group's EIA buyer: 63 years Source: Bureau of the Census |
35
February 22, 2005
| EIAs: The All-Weather Product When fixed rates are down... Customers can shift to indexed buckets for market participation When equity markets are down... Customers can shift to EIA's fixed bucket Principal is always protected Strong and growing demand for EIAs |
36
February 22, 2005
| 2004 Goals And Results Goal Result Increase production to $1.9 B ^ $1.84 B EIA production 85% ^ 83% Owned/proprietary product 85% ^ 79% Lapse rate 9% or less ^ 8.5% Product IRRs ^ 11% (unleveraged) ^ 12.6% |
37
February 22, 2005
| AmerUs Annuity Group Core Strategies Owned/proprietary product distribution Efficient operations EIA market focus |
38
February 22, 2005
| Owned/Proprietary Product Distribution Type Number of Groups 100% owned national marketing organizations 4 Represent 79% of production Proprietary product distribution - -National marketing organization, 20% ownership - -AmerUs Life Insurance Group agents 2 Represent 79% of production Other key independent relationships (potential acquisitions) 4 Represent another 14% of production Other groups (potential key independent groups) 3-5 Represent 7% of production |
39
February 22, 2005
| Controlled Distribution Owned and Proprietary Product ALIG Key Independent Relationships Other East 0.7 0.09 0.14 0.07 Ten key marketing relationships accounted for 94% of premium 1,150 agents wrote over 80% of premium 2004 ALIG: AmerUs Life Insurance Group |
40
February 22, 2005
| Execution: Owned/Proprietary Distribution 2000 2001 2002 2003 2004 2005P East 0.3 0.5 0.7 0.77 0.79 0.8 Five-year strategy is delivering |
41
February 22, 2005
| Distribution Flexibility 2000 2001 2002 2003 2004 2005P EIA Sales 0.25 0.32 0.38 0.75 0.83 0.875 Non-EIA Sales 0.75 0.68 0.62 0.25 0.17 0.125 EIA production "turned on a dime" |
42
February 22, 2005
| Agent Productivity Competitor 2003 Fixed Premium Number of Agents Production Per Agent Number of IMOs Channel "A" $6.0 B 160,000 $37,500 200 Independent Agent "B" $2.2 B 70,000 $31,429 80 Independent Agent "C" $2.0 B 68,000 $29,412 60 Independent Agent/Stockbroker AmerUs $1.8 B 13,000 $138,462 10 Proprietary Product/ Owned Marketing Organizations 270% greater than the next best High productivity drives strong relationships. System is scalable. |
43
February 22, 2005
| Keeping The Business 2000 2001 2002 2003 2004 2005P East 0.14 0.114 0.106 0.095 0.085 0.08 Outstanding persistency results: another benefit of owned/proprietary distribution |
44
February 22, 2005
| Strong Annuity Cash Flows 2000 2001 2002 2003 2004 2005P East 144 762 803 639 727 1025 Cash flow growing from new EIA premium and lower lapse rates $ millions |
45
February 22, 2005
| Owned/Proprietary Distribution Strengths Uniquely defensible More distribution control Strong agent productivity Flexibility Better persistency Positioned for growth AmerUs Annuity Group's unique competitive advantage |
46
February 22, 2005
| EIA Market Focus 2000 2001 2002 2003 2004 2005P 375 612 684 1311 1528 1900 2000-2004 CAGR 42.1% $ millions |
47
February 22, 2005
| National Provider Of Annuities Top 15 states provided 73% of 2004 sales |
48
February 22, 2005
| Leading Provider Of Annuities # 5 in Equity Indexed Annuity Sales # 8 in Fixed Sales Through Independent Agents Estimated rankings at 12/31/2004 |
49
February 22, 2005
| Advantages Of EIA Focus Leader in a growing market Specialized EIA team Producer focus on EIAs More cross-selling with AmerUs Life Insurance Group Systems and strategies in place for growth |
50
February 22, 2005
| Efficient Operations Single system for annuities Common AmerUs Group workflow High-touch, high-tech service Constantly improving unit costs |
51
February 22, 2005
| 2000 2001 2002 2003 2004 2005P East 45 40 34 26 23 22 Efficient Operations Fewer marketing groups and fewer agents result in lower expenses |
52
February 22, 2005
| Advantages Of Efficient Operations Better service Stronger producer relationships Enhanced profitability Positioned for growth |
53
February 22, 2005
| Increasing Shareholder Value - 2005 Goals Increase production 20% to $2.2B ($1.9B EIA) Market leadership Over 80% of total production Owned/ Proprietary Product Distribution 85-90% EIA production Focus on EIA products GAAP expenses ^22 basis points of average invested assets Efficient operations Achieve 12% unleveraged IRR Maintain product pricing discipline |
54
February 22, 2005
| Gary McPhail President and Chief Executive Officer AmerUs Life Insurance Group |
55
February 22, 2005
| 2004 Goals And Results Goal Result Grow sales to $130 million ^ $124 million Increase EI sales ^ 45% increase Increase production of top 50 distributors by 15% ^ 15.7% increase Lower unit costs ^ 3.8% reduction Achieve 12.5% unleveraged IRR ^ 12.7% |
56
February 22, 2005
| Total Industry Life Sales Growth 1999 2000 2001 2002 2003 2004E 10.7 11.6 11.1 11.7 11.8 11.8 $ billions Source: LIMRA. 2004 is LIMRA estimate. 1999-2004 CAGR 2.0% |
57
February 22, 2005
| Generation Profile Age People (millions) Buying Power ($ trillions) Other Generation Y 10 - 27 76 $0.6 More sophisticated about money than parents (Baby Boomers) Generation X 28 - 39 53 $1.5 More conservative than Baby Boomers, better target for insurance Baby Boomers 40 - 58 77 $2.1 Will retire with $0.5-1.0 million in assets, on average Concerned with protecting assets and retirement 4 million turn 50 each year for next ten years Mature Market Above 58 59 $1.6 Control 77% of financial assets Expected to pass $7-10 trillion to heirs 64% of 2004 EIUL sales from the 40-65 age group Source: Insurance Advisory Board |
58
February 22, 2005
| U. S. Life Product Mix - 2004 $11.8 Billion in Total Life Sales $ billions $9 billion opportunity Source: LIMRA. 2004 is LIMRA estimate. |
59
February 22, 2005
| Equity Indexed Universal Life Market 2000 2001 2002 2003 2004E 2005E Total Industry EIUL Sales 63 85 96 99 128 175 AmerUs EIUL Sales 6.93 26.35 46.08 51.48 74.24 114 AmerUs EIUL Market Share 0.11 0.31 0.48 0.52 0.58 0.57 AmerUs Life Insurance Group (ALIG) has held the number one market share position for 14 consecutive quarters Source: Advantage Compendium for 2000 - 2004 ALIG Market Share |
60
February 22, 2005
| Why The EIUL Market Will Grow Outstanding customer value proposition Guaranteed protection of principal Potential to participate in market upside with annual lock-in of gains Increasing agent and customer awareness Growth of equity indexed annuity market ALIG's focused EIUL training efforts Shifting demographics Older population less risk tolerant Wealth transfer issues becoming more important |
61
February 22, 2005
| Core Strategies Market fixed life products with an EI focus Grow multi-channel distribution Maximize operating efficiency |
62
February 22, 2005

| Equity Indexed Sales 1999 2000 2001 2002 2003 2004 2005P Equity Indexed Life 0 7 26 46 52 75 97 Traditional UL 24 28 28 33 32 29 28 Traditional Life (Term & WL) 50 48 42 51 35 20 10 Growth in EIL: 2000-2004 CAGR 81% $ millions Combined sales for AmerUs Life and Indianapolis Life and subsidiaries pre-2001 merger. |
63
February 22, 2005
| Fixed Life Product Mix 1999 2000 2001 2002 2003 2004 2005P Equity Indexed Life 0 7 27 46 52 75 97 Traditional UL 24 28 28 33 32 29 28 Traditional Life (Term & WL) 50 48 42 51 35 20 10 Growth in high-margin products: 1999-2004 CAGR 34% $ millions Combined sales for AmerUs Life and Indianapolis Life and subsidiaries pre-2001 merger. |
64
February 22, 2005
| Change In Mix Of Recurring Premiums 2002 2003 2004 2005P Open Block 0.63 0.69 0.72 0.76 Closed Block 0.37 0.31 0.28 0.24 1 1 1 1 Mix is shifting: over $900 million in recurring premium projected for 2005 |
65
February 22, 2005
| Balanced Distribution Strategy Focus on experienced agents Operate under a variable cost structure Grow multiple agent-based channels Build strong relationships with producers Agents choose the channel that fits their needs |
66
February 22, 2005
| Focus On Experienced Agents Active in our target market Require less training Become productive more quickly Sell more persistent business |
67
February 22, 2005
| Why Agents Choose ALIG Attractive products Competitive compensation Responsive service Superior marketing support Flexible distribution structure A winning combination |
68
February 22, 2005
| Growing Agent Base 1999 2004 IMOs 1487 11885 PPGA 3413 5158 NY Distribution 220 5658 Career 786 1212 5906 23913 1999 not restated for subsequent acquisitions. |
69
February 22, 2005

| Operate Under A Variable Cost Structure Compensate all field and home office distribution management on a variable basis Manage all channels to the same allowables Eliminate primary fixed costs Consumer advertising Agent health insurance Inexperienced agent financing Field office leasing, including furniture and equipment 90% of distribution costs are variable |
70
February 22, 2005
| Grow Multiple Agent-Based Channels Our channel options meet the needs of experienced agents |
71
February 22, 2005
| Career Marketing Organizations 2002 2003 2004 2005P East 16 17 23 29 Operate in 3 or fewer states Focus on 50 to 60 core producers Seek primary carrier relationship Want close ties with the company Aggressively compete for incentives and rewards Value AmerUs brand $ millions CAGR 21.9% |
72
February 22, 2005
| Independent Marketing Organizations 2002 2003 2004 2005P East 16 19 29 34 Operate in 5 or more states Tend to have several hundred producers under contract Split business among 3 or 4 carriers Seek to protect producer relationships by limiting any direct dealings with the company Incentives and rewards are delivered at top of hierarchy $ millions CAGR 28.6% |
73
February 22, 2005
| Personal Producing General Agents 2002 2003 2004 2005P East 14 15 19 22 Local market focus Independent, self-supporting producers Some small groups usually less than 10 Focus on one primary carrier Two or three secondary carriers for special cases $ millions CAGR 16.3% |
74
February 22, 2005
| NY Distribution 2002 2003 2004 2005P East 0 1 4 12 Operates in tri-state area with primarily NY focus Combination of IMO/PPGA One of only two EIUL providers in New York Shifting business mix One of the NY new premium market leaders $ millions 1 1. EIUL product approved in NY in 2003. |
75
February 22, 2005
| Balanced And Diversified Distribution IMO New York Distribution CMO PPGA PPGA 0.3 0.18 0.27 0.25 2005 Plan $135 Million Top 50 distributors accounted for 61% of premiums in 2004 |
76
February 22, 2005
| Build Strong Relationships With Producers Personalized approach to service Service associates aligned with distribution channel Direct access to underwriters and new business staff High accessibility and visibility of senior management Leading-edge technology and support One of top 15 agent extranet sites A high-touch, high-tech approach |
77
February 22, 2005
| 2005 Growth Initiatives Expand geographic presence Partner with top 50 distributors Increase sales through five national IMOs Increase sales through owned annuity distribution |
78
February 22, 2005
| Expand Geographic Presence Entered 12 new cities in 2004 Targeting 25 additional cities in 2005 Increasing market share in our top 15 states in 2005 Geographic Expansion: $8-$12 million |
79
February 22, 2005
| Strong Presence In Key States Top 15 states provided 78% of 2004 sales |
80
February 22, 2005
| Strong Presence In Key States 2005 targeted cities |
81
February 22, 2005
| Partner With Top 50 Distributors Assist in recruiting and management development Provide local field support in key markets Capitalize on superior technology platform Promote value-added marketing services Partner with top distributors: $8-$12 million |
82
February 22, 2005
| Increase Sales Through Five National IMOs Co-sponsor agent and administrative training Enhance product promotion Facilitate sharing of new EI marketing concepts Align technology more closely with IMO needs National IMO penetration: $5-$7 million |
83
February 22, 2005
| Increase Life Sales Through Owned Annuity Distribution Introduce single premium wealth transfer product Align incentives to reward life sales Assist in training and product promotion Provide administrative support Move existing life sales to ALIG Owned annuity distribution: $3-$5 million |
84
February 22, 2005
| 2005 Distribution: Sales From New Initiatives Geographic expansion $8-$12 million Partner with top distributors $8-$12 million National IMO penetration $5- $7 million Owned annuity distribution $3- $5 million Total growth from new initiatives $24 - $36 million |
85
February 22, 2005

| 2005: 23% Increase In Baseline Sales 2004 2005 Plan Baseline Sales 110 135 Impacted Sales: exiting market 14 0 $ millions Eliminating low margin products and exiting markets challenged by new regulation. Focused on both top and bottom line growth. Exiting selected products/markets |
86
February 22, 2005
| Maximize Operating Efficiency Complete migration to common operating platform One issue system for life business Common imaging and workflow Single agency system for licensing, contracting and commissions Building an outstanding operating platform |
87
February 22, 2005
| Maximize Operating Efficiency Increase agent self-service options Industry leading agent extranet site State-of-the-art illustration system Electronic application submission Since 2001, we have reduced headcount by 50%, while increasing sales and improving service |
88
February 22, 2005
| ALIG Strengths EIUL market poised for growth Market leadership position Attractive high-margin products Strong, productive distribution channels Outstanding field relationships Efficient cost structure Well-positioned for growth |
89
February 22, 2005
| Increasing Shareholder Value - 2005 Goals Grow sales to $135 million Increase sales Increase EI sales from 60% to 72% Increase production of top 50 distributors by 15% from $76.2 to $87.6 million Achieve 13% unleveraged IRR Increase equity indexed mix Focus marketing resources Improve returns on new business Realize additional operating efficiencies Lower unit costs by 3% |
90
February 22, 2005
| Brian Clark Executive Vice President and Chief Product Officer AmerUs Group |
91
February 22, 2005
| Product Management Philosophy Look for "win-win-win" situations Set clear objectives and strategies Employ realistic product pricing Get paid for risk assumed Be a disciplined innovator Deliver competitive and profitable products with strategic and operational fit |
92
February 22, 2005
| Applying Our Philosophy Focused on equity indexed products Approached UL death benefit guarantees cautiously Avoided table-shaving programs Reduced reinsurance support on life sales Implemented interest rate risk management features Priced out of life-contingent immediate annuities Maintaining product discipline |
93
February 22, 2005
| Significant Annuity Product Changes Launched innovative multi-index strategy Unique to United States Indices selected based on consumer preferences S&P 500, Dow Jones, NASDAQ Three indices weighted 50%, 30%, 20% Weighting assigned post-performance period Fully hedged |
94
February 22, 2005
| Other Annuity Product Changes Added a monthly cap index strategy Introduced highly competitive income bonus feature Rolled out survivorship rider |
95
February 22, 2005
| Rapid Shift In Annuity Sales Mix 2002 2003 2004 2005P Equity Indexed 0.38 0.75 0.83 0.85 Traditional SPDA 0.57 0.22 0.14 0.13 Multi-year Guarantee 0.03 0 0.01 0 Fixed Payout 0.02 0.03 0.02 0.02 Rapid shift toward higher margin equity indexed annuities continues |
96
February 22, 2005
| Higher Profitability With Faster Payback 2002 2003 2004 2005P East 0.089 0.104 0.126 0.12 West 3 1 1 1 Statutory break-even period (years) IRR on new sales @ 300% RBC Year of Annuity Sales Cohort |
97
February 22, 2005
| 2002 2003 2004 2005P East 0.006 0.004 0.003 0.008 Managing Interest Rate And Guarantee Risk Annualized minimum guarantee over surrender charge period Year of Equity Indexed Annuity Sales Cohort Modest increase in 2005 due to new minimum guarantee law |
98
February 22, 2005
| 2002 2003 2004 2005P East 0.006 0.004 0.003 0.008 West 0.18 0.49 0.9 0.92 Managing Interest Rate And Guarantee Risk Annualized minimum guarantee over surrender charge period Year of Equity Indexed Annuity Sales Cohort % sales with market value adjustment |
99
February 22, 2005
| 2002 2003 2004 2005P East 0.031 0.027 0.023 0.022 West 0.05 0.17 0.650000000130967 0.710000000130967 Increased Interest Rate Protection % sales with market value adjustment Guarantee rate on traditional fixed annuities Year of Traditional Fixed Annuity Sales Cohort |
100
February 22, 2005

| Annuity Product Margins 2002 2003 2004 2005P East 0.0212 0.0209 0.0232 0.0222 Traditional Fixed And Equity Indexed Combined EIA margins have exceeded pricing and pushed up total company margins Target Margin |
101
February 22, 2005
| Significant Life Product Changes Launched UL death benefit guarantee product Equity indexed chassis Targets 40-65 age segment Added new equity indexed option Two-year point-to-point Delivered fixed premium equity indexed product for qualified markets Updated traditional UL product line |
102
February 22, 2005
| Driving Shift In Life Sales Mix 2002 2003 2004 2005P Equity Indexed 0.35 0.44 0.6 0.72 Traditional UL 0.25 0.27 0.24 0.21 Term 0.13 0.12 0.11 0.07 Int. Sens. WL 0.24 0.17 0.05 0 Par Whole Life 0.03 0 0 0 New products and repricing will accelerate change in mix |
103
February 22, 2005
| Equity Indexed Life Portfolio % of 4Q2004 Sales Guaranteed Guaranteed Non-Guaranteed Non-Guaranteed Product1 % of 4Q2004 Sales Premium Death Benefit Cash Value Death Benefit Cash Value Performance Builder 18% Fixed ^ ^ ^ Independent Choices 3% Fixed ^ ^ ^ Vision Builder 38% Flexible ^ ^ Liberty Builder 21% Flexible ^ ^ New in August 2004 Advantage Builder 10% Flexible ^ ^ Advantage Builder with No-Lapse Guarantee Rider 10% Flexible ^ 1. Product names may vary by ALIG company. Meeting multiple customer needs ^ Primary need ^ Secondary need |
104
February 22, 2005
| Higher Profitability With Faster Payback 2002 2003 2004 2005P East 0.109 0.119 0.127 0.13 West 9 8 6 6 Statutory break-even period (years) IRR on new sales @ 300% RBC Year of Life Insurance Sales Cohort |
105
February 22, 2005
| 2002 2003 2004 2005P East 0.03 0.027 0.025 0.025 West 0.012 0.011 0.009 0.009 Reducing Spread Compression Risk Life Insurance Sales Cohort for All Non-Term Production Required spread Guarantee rate |
106
February 22, 2005
| Business Shift Drives Margins 2002 2003 2004 2005P 75.9 95.1 118.3 152.1 0.042 0.044 0.047 0.053 Pre-tax open block margins net of DAC excluding expenses |
107
February 22, 2005
| New Business Profitability At 300% RBC 2002 2003 2004 2005P Life Insurance 10.9% 11.9% 12.7% 13.0% Annuities 8.9% 10.4% 12.6% 12.0% Stat IRR on new sales 10.0% 11.1% 12.7% 12.6% Stat to GAAP equity difference (1.0%) (1.0%) (1.0%) (1.0%) Leverage 2.5% 2.5% 2.5% 2.5% Average GAAP ROE 11.5% 12.6% 14.2% 14.1% |
108
February 22, 2005
| Increasing Shareholder Value Migrate toward 14% operating ROE Lower risk; Finance growth internally Profitable sales growth; Market differentiation Rising rate protection Lower spread compression risk Shift product mix Competitive equity index portfolio Shorter statutory payback Lower required yields Annuity market value adjustment |
109
February 22, 2005

| Investor Conference February 22, 2005 |
110
February 22, 2005
| Greg Boal Executive Vice President and Chief Investment Officer, AmerUs Group President, AmerUs Capital Management |
111
February 22, 2005
| Investment Management Philosophy Competitive performance is derived from our focus on optimizing income by applying a value-added investment process that: Balances income needs with capital efficiency Applies common investment decision framework Adheres to strict sell discipline Focuses on clear and effective risk management objectives |
112
February 22, 2005
| Key Investment Metrics Strong net investment income results 2004P 2004 Average invested assets $18.0B $18.1B Average new money rate 5.83% 5.50% Avg. NAIC rating <1.50 1.48 MBS/total assets* 10.5% 10.5% BIG/total assets* 6.8% 6.7% Credit writedowns $10M $3.3M Unrealized real gain/loss - - $547.6M Duration mismatch +/- .50 year (.21) year Challenges Strengths Interest rate environment Liability durations Upgrades Portfolio positioning * Percentages based upon GAAP book value |
113
February 22, 2005
| Focus And Expectations For 2005 Maintain discipline around asset allocation Utilize comprehensive risk management Expect interest rates to rise Expect credit spreads to widen |
114
February 22, 2005
| 2005 Market And Asset Base Expectations Category Base Case 10-Year T-Note Average Yield 4.60-4.80% New cash flows $2.6B Average invested assets (GAAP book value) $19.0B Effective book yield (fixed income) 5.71% New money rate (consolidated) 5.90% |
115
February 22, 2005
| We Monitor And Analyze Key Indicators Change in market rates Change in asset cash flows Unrealized gain/loss Change in option costs We manage our portfolio to optimize our results in a continually changing environment |
116
February 22, 2005
| Asset Category Asset Category Allocation Ranges and Current Allocation 2005 Target Government Treasury/Agency 3.0% Structure MBS 10.5% Structure CMBS 5.5% Structure ABS 2.5% Credit Investment Grade 43.0% Credit Below Investment Grade 6.8% Credit Private Debt 12.5% Mortgage Commercial Loans 5.2% Other 11.0% Asset Class Allocation Other includes Cash, Policy Loans, Derivatives, Preferred Stock, Common Stock, BA Assets etc. Percent of total invested assets 3 5 10 12 3 6 2 5 50 35 6 7 10 15 4 10 Range Min/Max % |
117
February 22, 2005
| Proactive Risk Management Operational Comprehensive policy and procedures Effective technology tools Investment Effectively manage and monitor key risks ^ Interest rates ^ Hedging ^ Liquidity ^ Credit |
118
February 22, 2005

| Effective Duration Matching Assets Liabilities Mismatch Guideline 0.5 -0.5 12/1/2001 4.66 4.41 0.25 0.5 -0.5 3/2/2002 4.61 4.36 0.25 0.5 -0.5 6/2/2002 4.69 4.49 0.2 0.5 -0.5 9/2/2002 4.62 4.78 -0.16 0.5 -0.5 12/2/2002 4.56 4.98 -0.43 0.5 -0.5 3/3/2003 4.53 4.95 -0.42 0.5 -0.5 6/3/2003 4.53 5.02 -0.49 0.5 -0.5 9/3/2003 4.84 4.99 -0.15 0.5 -0.5 12/3/2003 4.77 4.82 -0.05 0.5 -0.5 3/4/2004 4.89 4.9 0.01 0.5 -0.5 6/4/2004 4.87 4.5 0.37 0.5 -0.5 9/30/2004 5.01 4.82 0.19 0.5 -0.5 12/31/2004 5 4.75 -0.21 0.5 -0.5 0.5 -0.5 Maintain duration mismatch within +/- 0.5 years |
119
February 22, 2005
| Conservative EI Hedging Replicate embedded options sold Over-the-counter options Utilize uniform product features to maximize effectiveness Hedge 100% of premium at issue Counterparty exposure managed Counterparty must be "AA" or better, unless collateral agreement in place No dynamic hedging Manage to conservative asset and liability guidelines |
120
February 22, 2005
| Emphasis On Liquidity Equivalent rating Equivalent rating Liquidity Ratio(%) Liquidity Ratio(%) AmerUs AmerUs Level Description Low High Horizon Ratio Rating AAA Superior 260 -- AA Excellent 220 259 1 year 228% AA A Strong 180 219 2 year 207% A S&P Liquidity Analysis, 12/31/2004 |
121
February 22, 2005
| Credit Risk Is Well-Diversified Top 100 Issuers Credit Composite 2004 39.4% 59.85% 2003 39.3% 58.04% Change 0.1% 1.81% Measure, monitor and manage credit diversification "Top 100 Issuers" indicates the percentage of creditor exposure. "Credit Composite" is the Lehman Brothers Credit Index; does not include private debt. |
122
February 22, 2005
| Increasing Shareholder Value Preserve portfolio flexibility Invest in opportunities where we are compensated for the risk Emphasize diversification Investment and asset/liability management processes Enhance net investment income Emphasize liquidity Adhere to disciplined philosophy Maintain high-quality asset portfolio |
123
February 22, 2005
| Melinda Urion Executive Vice President & Chief Financial Officer AmerUs Group |
124
February 22, 2005
| Strong Operating Results 2004P 2004 Operating earnings per share $4.00-$4.10 $4.10 Adjusted net operating income ($ millions) $158-$162 $168.6 Operating ROE 11.6% 11.9% Book value per share (excluding AOCI) $37.41 $38.29 RBC ratio ^300% 356% Exceeded plan in all areas |
125
February 22, 2005
| 1Q01 2Q01 3Q01 4Q01 1Q02 2Q02 3Q02 4Q02 1Q03 2Q03 3Q03 4Q03 1Q04 2Q04 3Q04 4Q04 Traditional Spread Measure 0.75 0.75 0.77 0.79 0.86 0.89 0.91 0.92 0.92 0.94 0.94 0.96 0.99 1.02 1.03 1.06 Quarterly Operating EPS Continues To Grow CAGR 10% Operating EPS has grown and the rate of growth has increased due to the shift to more profitable business |
126
February 22, 2005
| Operating Income By Segment Growing 2003 2004 2005P 2003-2005 CAGR Protection $128.3 $140.2 $160 11.7% Accumulation 130.9 163.9 175 15.6% Taxes (90.7) (106.4) (117) -- Other, net of taxes (19.6) (29.1) (26) -- Adj. Net Operating Income $148.9 $168.6 $192 1 13.6% $ millions 1. Midpoint of guidance range. |
127
February 22, 2005
| Operational Efficiencies 2001 2002 2003 2004 2005P Baseline Expenses 182.7 178 172.7 Commissions 306.5 336.9 393.6 Other 8.1 6.2 5.9 Sub-total 497.3 521.1 572.2 Deferrals -358.3 -390.3 -445.1 Net GAAP Expenses 158.6 150 139 130.8 127.1 $ millions Excludes IMO expenses in all years and includes restructuring costs in 2001 through 2003. ILICO expenses included in 2001 as if acquired on January 1. Expenses continue to decline |
128
February 22, 2005
| Solid Coverage Of DAC 12/31/03 12/31/04 12/31/05P DAC, VOBA, capitalized interest $1,539.7 $1,760.3 $1,937.8 Unearned revenue reserve (60.7) (64.2) (65.8) Total $1,479.0 $1,696.1 $1,872.0 $ millions DAC: Deferred Acquisition Costs VOBA: Value of Business Acquired Total includes impact of FAS 115. % of total covered by surrender charges and MVAs with FAS 115 98.0% 95.4% 96.5% without FAS 115 85.1% 84.0% 85.2% Number of years of statutory income to recover total 24.6 9.8 9.9 |
129
February 22, 2005
| Focused Capital Strategy We are executing our capital plan Maintain capital target at or above 300% RBC ratio Maintain financial flexibility within debt-to-capital ratio limit of 25% Execute capital plan - -Capital-efficient products - -Internal capital for up to 30% growth |
130
February 22, 2005
| Capital Plan In Place $ millions Type of Security Maturity Date Interest Rate 12/31/04 6/30/05P 12/31/05P 12/31/06E New OCEANs 3/32 3.83% plus dividend $189.2 $190.0 $190.7 $192.0 Total $571.2 $571.8 $572.5 $448.6 |
131
February 22, 2005
| Capital Plan In Place $ millions Type of Security Maturity Date Interest Rate 12/31/04 6/30/05P 12/31/05P 12/31/06E New OCEANs 3/32 3.83% plus dividend $189.2 $190.0 $190.7 $192.0 Senior Notes 6/05 6.95% 125.0 0.0 0.0 0.0 Total $571.2 $571.8 $572.5 $448.6 |
132
February 22, 2005
| Capital Plan In Place $ millions Type of Security Maturity Date Interest Rate 12/31/04 6/30/05P 12/31/05P 12/31/06E New OCEANs 3/32 3.83% plus dividend $189.2 $190.0 $190.7 $192.0 Senior Notes 6/05 6.95% 125.0 0.0 0.0 0.0 Revolving Credit 12/07 Flexible 0.0 125.0 125.0 0.0 Total $571.2 $571.8 $572.5 $448.6 |
133
February 22, 2005

| Capital Plan In Place $ millions Type of Security Maturity Date Interest Rate 12/31/04 6/30/05P 12/31/05P 12/31/06E New OCEANs 3/32 3.83% plus dividend $189.2 $190.0 $190.7 $192.0 Senior Notes 6/05 6.95% 125.0 0.0 0.0 0.0 Revolving Credit 12/07 Flexible 0.0 125.0 125.0 0.0 PRIDES 8/06 6.25% 143.8 143.8 143.8 143.8 Total $571.2 $571.8 $572.5 $448.6 |
134
February 22, 2005
| Capital Plan In Place $ millions Capital plan is forward-looking Type of Security Maturity Date Interest Rate 12/31/04 6/30/05P 12/31/05P 12/31/06E New OCEANs 3/32 3.83% plus dividend $189.2 $190.0 $190.7 $192.0 Senior Notes 6/05 6.95% 125.0 0.0 0.0 0.0 Revolving Credit 12/07 Flexible 0.0 125.0 125.0 0.0 PRIDES 8/06 6.25% 143.8 143.8 143.8 143.8 AmerUs Capital I 2/27 8.85% 50.8 50.8 50.8 50.8 Surplus Notes 4/11 8.66% 25.0 25.0 25.0 25.0 Other Various Various 37.4 37.2 37.2 Total $571.2 $571.8 $572.5 Increase 25% debt-to-cap |
135
February 22, 2005
| Stronger Capital Structure 2003 2004 2005P Debt $621.9 $571.2 $572.5 Common equity 1 1,325.3 1,508.8 1,680.0 Total capitalization $1,947.2 $2,080.0 $2,252.5 Debt-to-capital ratios Standard & Poor's 2 16.94% 12.46% 10.42% Moody's 2 25.84% 24.00% 21.15% 1. Excludes AOCI 2. In all years, for Standard & Poor's, the PRIDES, the OCEANs, AmerUs Capital I and AmerUs Capital II are treated as 100% equity, except to the extent they exceed 15% of capital, then the excess is treated as debt. In 2003 for Moody's, AmerUs Capital I and AmerUs Capital II were treated as 100% debt, the OCEANs were treated as 75% debt and 25% equity, and the PRIDES were treated as 50% debt and 50% equity. In 2004, the OCEANs were exchanged for New OCEANs and these are treated as 100% debt. $ millions Stronger capital structure with more flexibility |
136
February 22, 2005
| 2003 2004 2005P Net Gain from Operations 60.1 168.8 189.2 Statutory Net Income Continues To Grow $ millions Emergence of earnings and more profitable mix of sales have dramatically improved results |
137
February 22, 2005
| 2002 2003 2004 2005P East 866 986 1185 1272 2.68 3.17 3.56 3.65 Statutory Adjusted Capital Risk-Based Capital Capital And RBC Levels Continue To Grow $ millions Statutory adjusted capital defined as the sum of capital and surplus, asset valuation reserve and one-half of the dividend liability. |
138
February 22, 2005

| Strong Free Cash Flow 2003 2004 2005 116.4 108.8 200.7 Free cash flow Represents dividend capacity from insurance subsidiaries and Dividends expected from non- insurance subsidiaries Dividend capacity from insurance subsidiaries Determined by statutory income and capital levels as of the prior year-end. 2005 determined by results as of 12/31/2004 $ millions |
139
February 22, 2005
| Strong Interest Coverage Ratio 2003 2004 2005 Statutory With Dividends 2.5 2.3 4.3 Statutory Without Dividends 3.9 3.4 6.5 GAAP 8.6 8.2 10 Statutory with dividends: Stat dividend capacity from insurance subsidiaries and expected dividends from non-insurance subsidiaries divided by interest expense and dividend expense. Statutory without dividends: Stat dividend capacity from insurance subsidiaries and expected dividends from non-insurance subsidiaries divided by interest expense. GAAP: GAAP income before taxes and interest expense divided by interest expense. |
140
February 22, 2005
| Rating Agency Criteria Rating Criteria 12/31/03 12/31/04 12/31/05P NAIC RBC 317% 356% 365% Statutory capitalization 6.1% 6.9% 7.4% Debt-to-capital 25.8% 24.0% 21.2% Cash interest coverage 2.5x 2.3x 4.3x Statutory net income $60.1 $168.8 $189.2 Operating ROE 11.9% 11.9% 11.9% We continue to improve on significant rating agency criteria |
141
February 22, 2005
| Strong Operating Results 2003 2004 2005P Operating earnings per share $3.76 $4.10 $4.45-$4.57 Adj. net operating income ($ millions) $148.9 $168.6 $190-$194 Operating ROE 11.9% 11.9% 11.9% Book value per share (excluding AOCI) $33.81 $38.29 $42.66 RBC ratio 317% 356% 365% We delivered strong operating results in 2003 and 2004 and you can expect even stronger results in 2005 |
142
February 22, 2005
| Increasing Shareholder Value Higher GAAP and statutory earnings Long-term operating ROE of 13% - 14% Capability to internally generate capital to support up to 30% growth Higher product margins Higher capital levels Profitable growth |
143
February 22, 2005
| Tom Godlasky President and Chief Operating Officer AmerUs Group |
144
February 22, 2005
| Increasing Shareholder Value Exit par whole life De-emphasize term life Conserve higher margin business Equity indexed life and annuities Universal life insurance Geographic expansion Multi-channel and owned/ proprietary Competitive products attract agents Conservative hedging Realistic product pricing Appropriate capital levels Reduce low margin products Expand distribution Maintain financial discipline Growth in ROE, EPS and book value Increase higher margin sales |
145
February 22, 2005
| Management Incentives Aligned With Shareholders Annual management incentive plan Operating earnings per share (50%) GAAP net income per share (50%) Long-term incentive plan (3 year measuring period) Total shareholder return vs. peer group (50%) Growth in book value per share (50%) Stock ownership guidelines CEO and President: 5X base salary Senior management team: 3X base salary |
146
February 22, 2005
| Strategy Drives Results: Shareholder Value 1999 2000 2001 2002 2003 2004 AMH 100 143.62 160.94 128.6 160.85 210.23 SNL Life Index 100 134.51 126.04 111.99 146.54 184.28 Peer Group 100 120.67 122.95 110.88 138.32 165.13 Russell 2000 100 96.98 99.39 79.03 116.38 137.71 Shareholder value defined as increase in stock price plus reinvested dividends |
147
February 22, 2005
| Attractive Valuation 5.61868428726782E-02 0.669401523390186 0.11270532573344 1.08916605016833 0.10180699208215 1.09587374848189 0.170235073941614 2.05835430093183 0.140663016303902 1.49973726747139 0.122068254258046 1.40419115316673 0.110029842557579 1.08584903146299 0.134250496454392 1.9451307781277 0.125286461633233 1.37554237816512 0.121505221754587 1.47317455485561 0.128915935086459 1.50705256448545 0.166994111522161 1.92962388634626 0.095 0.81078431372549 Source: Industry data. ROE is a non-GAAP measure Excluding the effects of FAS 115. Excludes AFL because of its 23% ROE & 4x PB. |
148
February 22, 2005
| Closing the Value Gap 5.61868428726782E-02 0.669401523390186 0.11270532573344 1.08916605016833 0.10180699208215 1.09587374848189 0.170235073941614 2.05835430093183 0.140663016303902 1.49973726747139 0.122068254258046 1.40419115316673 0.110029842557579 1.08584903146299 0.134250496454392 1.9451307781277 0.125286461633233 1.37554237816512 0.121505221754587 1.47317455485561 0.128915935086459 1.50705256448545 0.166994111522161 1.92962388634626 0.095 0.81078431372549 Source: Industry data. ROE is a non-GAAP measure Excluding the effects of FAS 115. Excludes AFL because of its 23% ROE & 4x PB. 1.3x 1.05x |
149
February 22, 2005

| The Value Opportunity 5.61868428726782E-02 0.669401523390186 0.11270532573344 1.08916605016833 0.10180699208215 1.09587374848189 0.170235073941614 2.05835430093183 0.140663016303902 1.49973726747139 0.122068254258046 1.40419115316673 0.110029842557579 1.08584903146299 0.134250496454392 1.9451307781277 0.125286461633233 1.37554237816512 0.121505221754587 1.47317455485561 0.128915935086459 1.50705256448545 0.166994111522161 1.92962388634626 0.095 0.81078431372549 Source: Industry data. ROE is a non-GAAP measure Excluding the effects of FAS 115. Excludes AFL because of its 23% ROE & 4x PB. AMH 1.7x 1.05x 1.3x |
150
February 22, 2005
| Investor Conference February 22, 2005 |
151