
First Niagara Financial Group Daniel E. Cantara Gregory W. Norwood Chief Banking Officer Chief Financial Officer May 1, 2013

Safe Harbor Statement Any statements contained in this presentation regarding the outlook for FNFG’s business and markets, such as projections of future earnings performance, statements of FNFG’s plans and objectives, forecasts or market trends and other matters, are forward-looking statements based on FNFG’s assumptions and beliefs. Such statements may be identified by such words or phrases as “will likely result,” “are expected to,” “will continue,” “outlook,” “will benefit,” “is anticipated,” “estimate,” “project,” “management believes” or similar expressions. These forward-looking statements are subject to certain risks and uncertainties that could cause actual results to differ materially from those discussed in such statements and no assurance can be given that the results in any forward-looking statement will be achieved. For these statements, FNFG claims the protection of the safe harbor for forward-looking statements contained in the Private Securities Litigation Reform Act of 1995. Any forward-looking statement speaks only as of the date on which it is made, and we disclaim any obligation to subsequently revise any forward-looking statement to reflect events or circumstances after such date or to reflect the occurrence of anticipated or unanticipated events. Certain factors could cause FNFG’s future results to differ materially from those expressed or implied in any forward-looking statements contained in this presentation. These factors include the factors discussed in Part I, Item 1A of FNFG’s 2012 Annual Report on Form 10-K under the heading “Risk Factors” and any other cautionary statements, written or oral, which may be made or referred to in connection with any such forward-looking statements. Since it is not possible to foresee all such factors, these factors should not be considered as complete or exhaustive. 2

2013 Priority: Positive Operating Leverage Continue to integrate the Retail, Commercial and Consumer Finance businesses into a cohesive unit under new CBO position Leverage existing infrastructure with modest, focused investments Continued focus on greater market share gains and share of wallet with significant near-term opportunity to sell to underpenetrated customer base Evaluate branch network for further consolidation and optimization Improve alternative delivery channel effectiveness Generate Positive Operating Leverage Lower absolute level of operating expenses Measured & focused new investments Profitable balance sheet rotation Fee income opportunities Effective cross-solving to maximize revenue output 3

Balance Sheet Rotation Focused Roadmap to Drive Growth and Improved Profitability 4 • Commercial capacity in place to continue growth trajectory with current complement of lenders • Capacity built to originate up to $300 million in indirect auto loans per quarter at profitable yields • Expanding auto dealer network in 2013 Balance Sheet Rotation • Enhancing Treasury Management and Digital Banking offerings in 2013 to further increase competitiveness and fee income • Further transforming culture of retail bank with focus on growth and cross- solve • Targeted marketing spend to drive better product penetration Fee Income Growth • Provide clear prioritization and allocation of resources across the franchise • Further increase our capacity without adding overhead • Examine all delivery channels for efficiency and consolidation Positive Operating Leverage
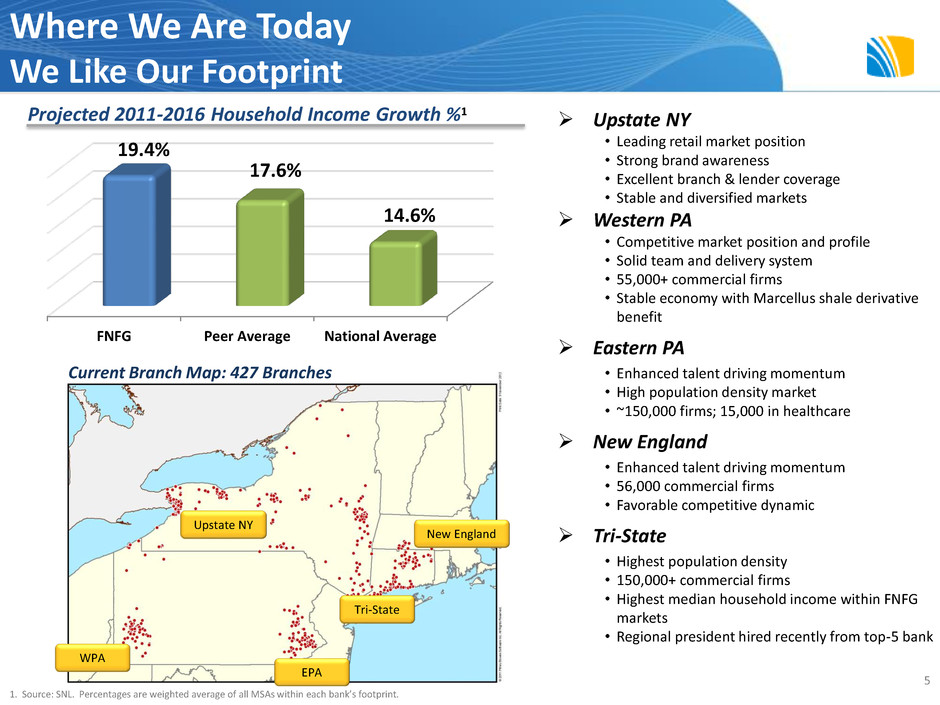
FNFG Peer Average National Average 19.4% 17.6% 14.6% Where We Are Today We Like Our Footprint 1. Source: SNL. Percentages are weighted average of all MSAs within each bank’s footprint. 5 Upstate NY • Leading retail market position • Strong brand awareness • Excellent branch & lender coverage • Stable and diversified markets Western PA • Competitive market position and profile • Solid team and delivery system • 55,000+ commercial firms • Stable economy with Marcellus shale derivative benefit Eastern PA • Enhanced talent driving momentum • High population density market • ~150,000 firms; 15,000 in healthcare New England • Enhanced talent driving momentum • 56,000 commercial firms • Favorable competitive dynamic Tri-State • Highest population density • 150,000+ commercial firms • Highest median household income within FNFG markets • Regional president hired recently from top-5 bank Projected 2011-2016 Household Income Growth %1 Current Branch Map: 427 Branches Tri-State EPA WPA Upstate NY New England
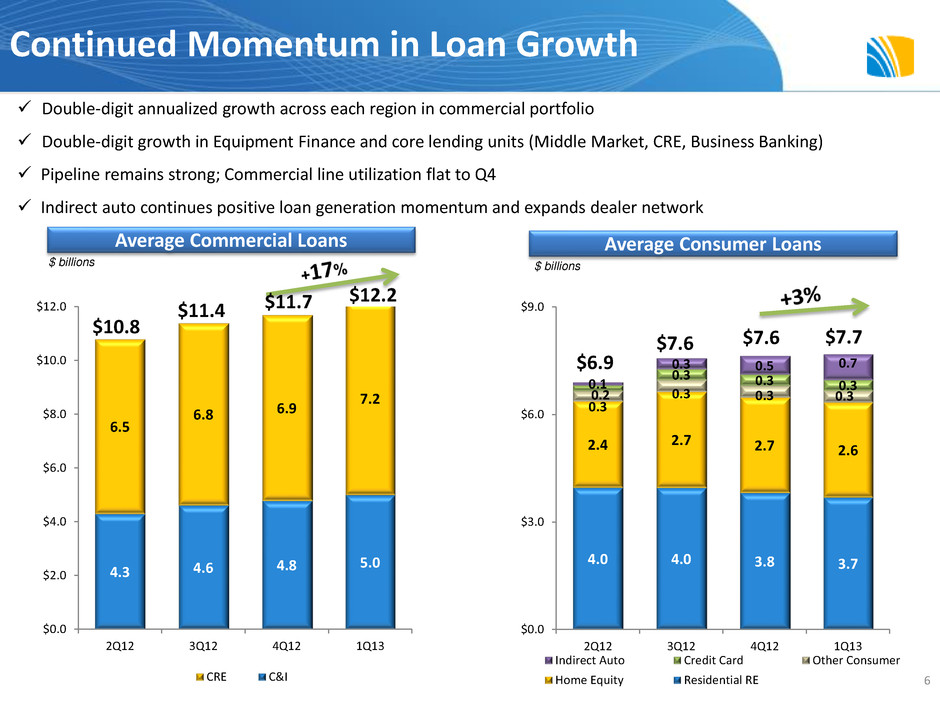
4.0 4.0 3.8 3.7 2.4 2.7 2.7 2.6 0.3 0.3 0.3 0.3 0.2 0.3 0.3 0.3 0.1 0.3 0.5 0.7 $0.0 $3.0 $6.0 $9.0 2Q12 3Q12 4Q12 1Q13 Indirect Auto Credit Card Other Consumer Home Equity Residential RE 4.3 4.6 4.8 5.0 6.5 6.8 6.9 7.2 $0.0 $2.0 $4.0 $6.0 $8.0 $10.0 $12.0 2Q12 3Q12 4Q12 1Q13 CRE C&I Continued Momentum in Loan Growth Average Commercial Loans Average Consumer Loans $10.8 $6.9 $7.6 $ billions $ billions Double-digit annualized growth across each region in commercial portfolio Double-digit growth in Equipment Finance and core lending units (Middle Market, CRE, Business Banking) Pipeline remains strong; Commercial line utilization flat to Q4 Indirect auto continues positive loan generation momentum and expands dealer network $11.4 $7.6 $11.7 $12.2 $7.7 6

31% 11% 13% 38% -2% -6% -10% -5% 0% 5% 10% 15% 20% 25% 30% 35% 40% 45% Middle Market Business Banking CRE Equipment Finance Capital Markets Others 10% 29% 30% 25% -2% 50% -10% 0% 10% 20% 30% 40% 50% 60% NY WPA EPA NE Specialized Lending Tri State Robust Commercial Loan Growth Across Regions Notes: Average balances. Growth rates are annualized. Specialized lending includes capital markets and community development. Balances do not include small business loans that roll up into retail segment. QOQ Commercial Growth by Region QOQ Commercial Growth by Business Unit $5.6 $1.4 $1.9 $2.2 $0.6 $3.3 $2.6 $4.2 $0.7 $0.6 $0.3 Average Loan Balance (billions) 7 $0.04

$171 $247 $213 $263 2Q12 3Q12 4Q12 1Q13 2013 Priority: Indirect Auto Accelerates Balance Sheet Rotation 8 ($ millions) Originations Per Quarter 3.52% 3.55% 3.43% Origination volume % Origination yield Expansion of dealer network continues Used vehicles represent two-thirds of volume Credit quality continues to track better than original expectations; Average FICO of 735 on Q1 originations Short duration asset improves interest-rate profile Indirect Auto Footprint 3.34%
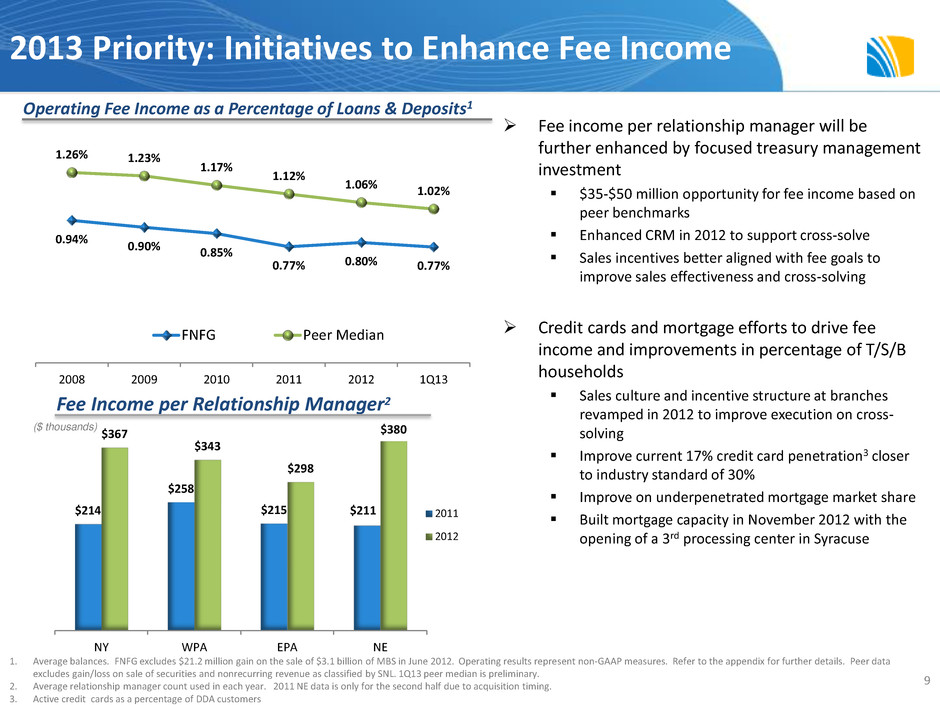
2013 Priority: Initiatives to Enhance Fee Income 9 Fee income per relationship manager will be further enhanced by focused treasury management investment $35-$50 million opportunity for fee income based on peer benchmarks Enhanced CRM in 2012 to support cross-solve Sales incentives better aligned with fee goals to improve sales effectiveness and cross-solving Credit cards and mortgage efforts to drive fee income and improvements in percentage of T/S/B households Sales culture and incentive structure at branches revamped in 2012 to improve execution on cross- solving Improve current 17% credit card penetration3 closer to industry standard of 30% Improve on underpenetrated mortgage market share Built mortgage capacity in November 2012 with the opening of a 3rd processing center in Syracuse 1. Average balances. FNFG excludes $21.2 million gain on the sale of $3.1 billion of MBS in June 2012. Operating results represent non-GAAP measures. Refer to the appendix for further details. Peer data excludes gain/loss on sale of securities and nonrecurring revenue as classified by SNL. 1Q13 peer median is preliminary. 2. Average relationship manager count used in each year. 2011 NE data is only for the second half due to acquisition timing. 3. Active credit cards as a percentage of DDA customers Operating Fee Income as a Percentage of Loans & Deposits1 Fee Income per Relationship Manager2 $214 $258 $215 $211 $367 $343 $298 $380 NY WPA EPA NE 2011 2012 ($ thousands) 0.94% 0.90% 0.85% 0.77% 0.80% 0.77% 1.26% 1.23% 1.17% 1.12% 1.06% 1.02% 2008 2009 2010 2011 2012 1Q13 FNFG Peer Median
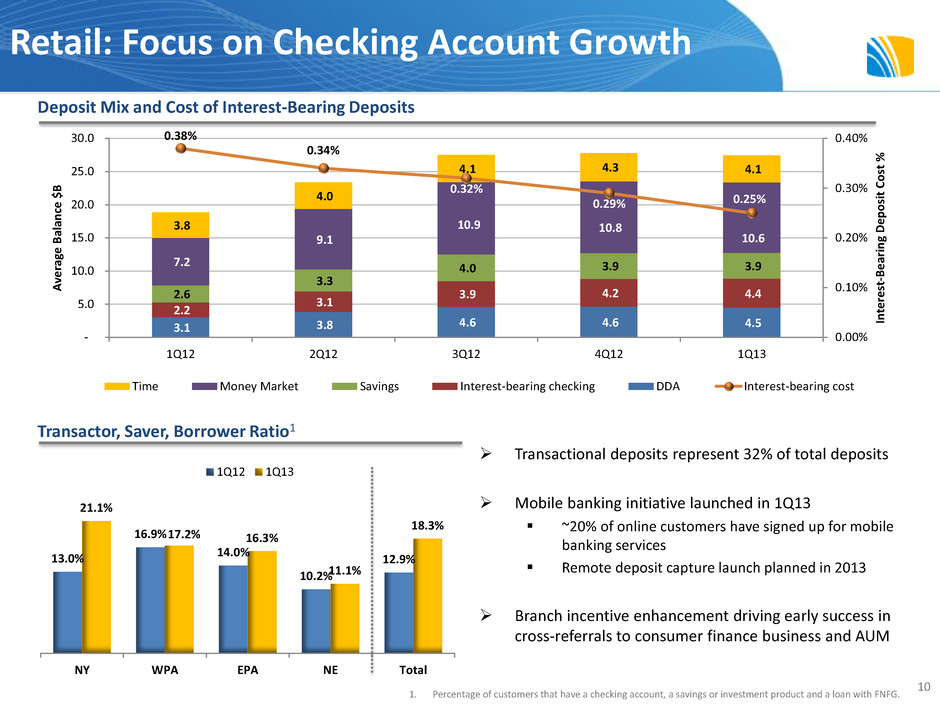
3.1 3.8 4.6 4.6 4.5 2.2 3.1 3.9 4.2 4.4 2.6 3.3 4.0 3.9 3.9 7.2 9.1 10.9 10.8 10.6 3.8 4.0 4.1 4.3 4.1 0.38% 0.34% 0.32% 0.29% 0.25% 0.00% 0.10% 0.20% 0.30% 0.40% - 5.0 10.0 15.0 20.0 25.0 30.0 1Q12 2Q12 3Q12 4Q12 1Q13 In te re st -B e ar in g De p o si t C o st % A ve ra ge B al an ce $ B Time Money Market Savings Interest-bearing checking DDA Interest-bearing cost Transactional deposits represent 32% of total deposits Mobile banking initiative launched in 1Q13 ~20% of online customers have signed up for mobile banking services Remote deposit capture launch planned in 2013 Branch incentive enhancement driving early success in cross-referrals to consumer finance business and AUM Retail: Focus on Checking Account Growth 10 1. Percentage of customers that have a checking account, a savings or investment product and a loan with FNFG. Deposit Mix and Cost of Interest-Bearing Deposits Transactor, Saver, Borrower Ratio1 13.0% 16.9% 14.0% 10.2% 12.9% 21.1% 17.2% 16.3% 11.1% 18.3% NY WPA EPA NE Total 1Q12 1Q13
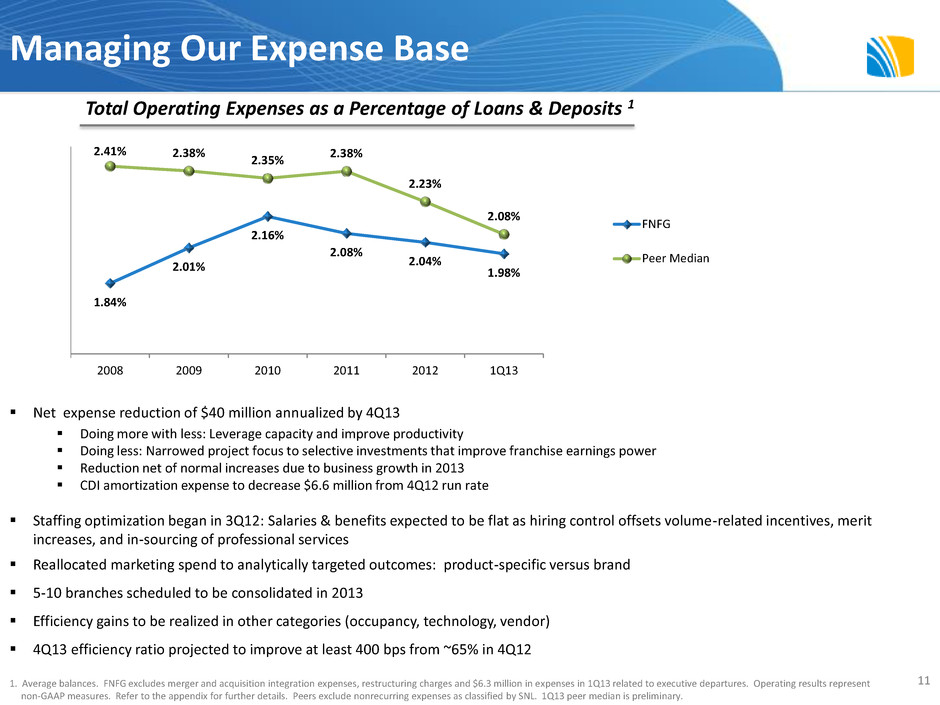
Managing Our Expense Base Net expense reduction of $40 million annualized by 4Q13 Doing more with less: Leverage capacity and improve productivity Doing less: Narrowed project focus to selective investments that improve franchise earnings power Reduction net of normal increases due to business growth in 2013 CDI amortization expense to decrease $6.6 million from 4Q12 run rate Staffing optimization began in 3Q12: Salaries & benefits expected to be flat as hiring control offsets volume-related incentives, merit increases, and in-sourcing of professional services Reallocated marketing spend to analytically targeted outcomes: product-specific versus brand 5-10 branches scheduled to be consolidated in 2013 Efficiency gains to be realized in other categories (occupancy, technology, vendor) 4Q13 efficiency ratio projected to improve at least 400 bps from ~65% in 4Q12 11 1. Average balances. FNFG excludes merger and acquisition integration expenses, restructuring charges and $6.3 million in expenses in 1Q13 related to executive departures. Operating results represent non-GAAP measures. Refer to the appendix for further details. Peers exclude nonrecurring expenses as classified by SNL. 1Q13 peer median is preliminary. Total Operating Expenses as a Percentage of Loans & Deposits 1 1.84% 2.01% 2.16% 2.08% 2.04% 1.98% 2.41% 2.38% 2.35% 2.38% 2.23% 2.08% 2008 2009 2010 2011 2012 1Q13 FNFG Peer Median

6 1 % 7 1 % 5 2 % 5 5 % 5 8 % 6 1 % 40% 45% 50% 55% 60% 65% 70% 75% 80% 4Q11 1Q12 2Q12 3Q12 4Q12 1Q13 2Q13E 3Q13E 4Q13E FNFG Peer Median • 76% of CMBS book has a credit enhancement of 30+; 67% of CLO book has a credit enhancement of 25+ • Average credit securities rating of AA- exceeds traditional commercial banking lending relationships CMO $4.7 40% MBS $0.8 6% CMBS $1.9 16% CLO $1.6 13% ABS $1.0 8% CORP $0.9 8% MUNI $0.6 5% US Govt $0.4 3% Other $0.1 Investment Securities1 Portfolio as of March 31, 2013 12 Portfolio Stats – Q1’13 Market Value $12.2 B Yield 2.99% Average Rating AA Remaining RMBS Purchase Premium $78 M Remaining Premium as a % of RMBS Portfolio 1.5% Q1’13 Purchases Total $625 M Yield 2.5% Average Rating Aa2 1. Excludes FHLB and Federal Reserve Bank stock 2. Commercial assets include C&I and CRE loans plus CLO, CMBS, corporates and commercial ABS at amortized cost HSBC Pre-Closing Investment Activity Investment Security Mix (Book Value $11.8B) Commercial Assets2 to Total Deposits 92% of CMBS purchases completed before spreads began tightening Traditional Portfolio $6.5B; 55% Credit Securities $5.4B; 45%

CMBS Purchases by Quarter 92% of CMBS purchases completed before spreads began tightening 87% of portfolio rated A or higher by Moody’s; 39% AAA; remaining 13% rated BBB Significant credit enhancement provides for protection from defaults Structure of CMBS and underlying mortgage prepayment penalties limits principal payments No unscheduled prepayment risk; no material maturities until 2016/2017 76% 14% 8% 2% 30+ 30-25 25-20 20-18 Current Credit Enhancements Maturity Profile Low Risk CMBS Portfolio 13 0 100 200 300 400 500 600 700 Q4 2010 Q1 2011 Q2 2011 Q3 2011 Q4 2011 Q1 2012 Q2 2012 Q3 2012 Q4 2012 Q1 2013 M ill io n s Par Value 0.00% 5.00% 10.00% 15.00% 20.00% 25.00%

97% of the portfolio is rated A or higher; 74% AA or better Provides a 3% yield at a credit quality level superior to middle-market lending Underlying CLO collateral consists of 90% senior secured loans; over 90% of obligors domiciled in U.S. Half of the portfolio comprised of CLOs originated in 2011 or later; No CLO investments were made prior to 4Q11 Internal stress-test based on default and severity rates experienced during the credit crisis Low Risk CLO Portfolio Credit Ratings Credit Enhancements 14 18% 15% 27% 40% 11-20% 20-25% 25-30% 30+% AAA/AA Rated 75% A Rated 22% BBB Rated 3% Yield= 5.76% Yield= 4.30% Yield= 2.69%
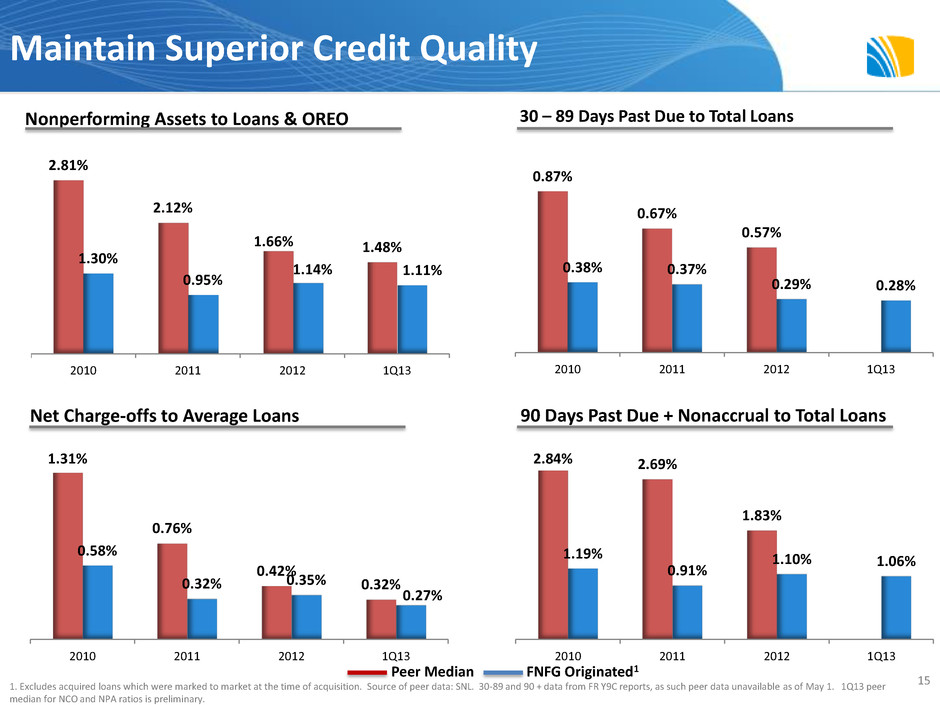
2.84% 2.69% 1.83% 1.19% 0.91% 1.10% 1.06% 2010 2011 2012 1Q13 0.87% 0.67% 0.57% 0.38% 0.37% 0.29% 0.28% 2010 2011 2012 1Q13 2.81% 2.12% 1.66% 1.48% 1.30% 0.95% 1.14% 1.11% 2010 2011 2012 1Q13 Maintain Superior Credit Quality Nonperforming Assets to Loans & OREO 30 – 89 Days Past Due to Total Loans Net Charge-offs to Average Loans 90 Days Past Due + Nonaccrual to Total Loans Peer Median FNFG Originated1 1. Excludes acquired loans which were marked to market at the time of acquisition. Source of peer data: SNL. 30-89 and 90 + data from FR Y9C reports, as such peer data unavailable as of May 1. 1Q13 peer median for NCO and NPA ratios is preliminary. 1.31% 0.76% 0.42% 0.32% 0.58% 0.32% 0.35% 0.27% 2010 2011 2012 1Q13 15
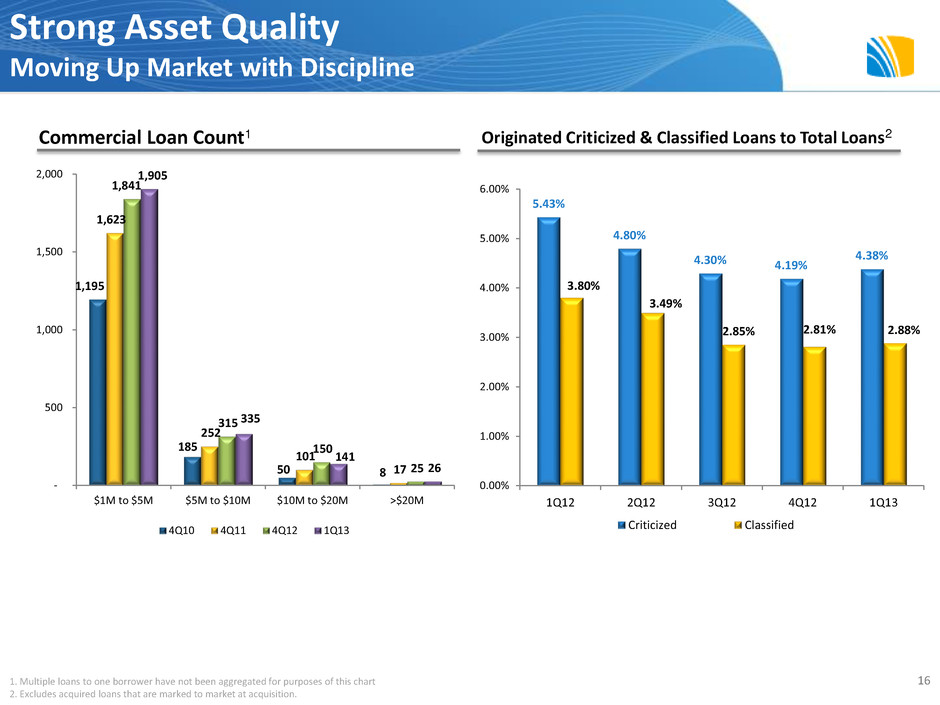
16 Commercial Loan Count1 Originated Criticized & Classified Loans to Total Loans2 1. Multiple loans to one borrower have not been aggregated for purposes of this chart 2. Excludes acquired loans that are marked to market at acquisition. Strong Asset Quality Moving Up Market with Discipline 5.43% 4.80% 4.30% 4.19% 4.38% 3.80% 3.49% 2.85% 2.81% 2.88% 0.00% 1.00% 2.00% 3.00% 4.00% 5.00% 6.00% 1Q12 2Q12 3Q12 4Q12 1Q13 Criticized Classified 1,195 185 50 8 1,623 252 101 17 1,841 315 150 25 1,905 335 141 26 - 500 1,000 1,500 2,000 $1M to $5M $5M to $10M $10M to $20M >$20M 4Q10 4Q11 4Q12 1Q13

Capital Update • Basel III – Capital structure well-optimized with preferred issuance in December 2011 – Will adjust balance sheet and product offerings based on final rule – Pro Forma B3 Tier 1 Common Capital Ratio exceeds phase-in levels with cushion – Flexibility in strategic direction mitigates B3 impact (investment securities, resi product redesign, HTM / AFS Portfolio) • Stress Testing – Revised Fed deadline: March 2014 for BHCs with $10B to $50B in assets – Continue to make significant progress with internal assessment – Preliminary assessment exceeds CCAR stress test requirements with adequate cushion – Investments in resources (people, technology & process) throughout 2012 position us well for 2013/14 Regulatory process/effort 17

CEO Search Update • CEO search is well underway. • Board has formed independent search committee and retained Korn/Ferry International to assist. – Candidate list being developed – Internal /external candidates to be considered • Board is committed to securing a CEO who sees the long-term value of our strategy, able to enhance that strategy and drive continued improvement in business results. • Other qualifications: – Seasoned banker and a proven operator – Successful track record of driving business growth in financial services companies of approximately our size or larger – Ability to further build on our relationships with customers, investors and communities • Expeditious process as possible but Overriding goal: Secure the best possible CEO – To guide FNFG as a strong, independent banking franchise that will deliver increasing shareholder value in the years ahead. 18
Appendix 19

GAAP to Non-GAAP Reconciliation 20 (Amounts in millions) Q1 2013 2012 2011 2010 2009 2008 Total noninterest income on operating basis (Non-GAAP) 89.3$ 338.3$ 245.3$ 186.6$ 126.0$ 115.7$ Gain on securities portfolio repositioning - 21.2 - - - - Total reported noninterest income (GAAP) 89.3$ 359.5$ 245.3$ 186.6$ 126.0$ 115.7$ Total noninterest expense on operating basis (Non-GAAP) 237.7$ 867.1$ 665.6$ 472.6$ 283.1$ 226.2$ Salaries and benefits - - - 0.8 - - Merger and acquisition integration expenses - 177.5 98.2 49.9 43.6 2.2 Restructuring charges - 6.5 42.5 - - - Total reported noninterest expense (GAAP) 237.7$ 1,051.1$ 806.3$ 523.3$ 326.7$ 228.4$ Reconciliation of noninterest income on operating basis to reported noninterest income: Reconciliation of noninterest expense on operating basis to reported noninterest expense:

Associated Banc-Corp Hancock Holding Company BOK Financial Corporation Huntington Bancshares Incorporated City National Corporation KeyCorp Comerica Incorporated M&T Bank Corporation Commerce Bancshares, Inc. People's United Financial, Inc. Cullen/Frost Bankers, Inc. Synovus Financial Corp. First Horizon National Corporation Zions Bancorporation (1) Peer group represents commercial banks with total assets between $20 -$100 billion with similar business models. Benchmarking Peer Group (1) 21


