 KeyCorp Fourth Quarter 2015 Earnings Review January 21, 2016 Beth E. Mooney Chairman and Chief Executive Officer Don Kimble Chief Financial Officer Exhibit 99.2 |
FORWARD-LOOKING STATEMENTS AND ADDITIONAL INFORMATION DISCLOSURE This communication contains forward-looking statements within the meaning of the Private Securities Litigation Reform Act of 1995 including, but not limited to, KeyCorp’s and First Niagara’s expectations or predictions of future financial or business performance or conditions. Forward-looking statements are typically identified by words such as “believe,” “expect,” “anticipate,” “intend,” “target,” “estimate,” “continue,” “positions,” “plan,” “predict,” “project,” “forecast,” “guidance,” “goal,” “objective,” “prospects,” “possible” or “potential,” by future conditional verbs such as “assume,” “will,” “would,” “should,” “could” or “may”, or by variations of such words or by similar expressions. These forward-looking statements are subject to numerous assumptions, risks and uncertainties, which change over time. Forward-looking statements speak only as of the date they are made and we assume no duty to update forward-looking statements. Actual results may differ materially from current projections. In addition to factors previously disclosed in KeyCorp’s and First Niagara’s reports filed with the SEC and those identified elsewhere in this communication, the following factors, among others, could cause actual results to differ materially from forward-looking statements or historical performance: ability to obtain regulatory approvals and meet other closing conditions to the merger, including approval by KeyCorp and First Niagara shareholders on the expected terms and schedule, including the risk that regulatory approvals required for the merger are not obtained or are obtained subject to conditions that are not anticipated; delay in closing the merger; difficulties and delays in integrating the First Niagara business or fully realizing cost savings and other benefits; business disruption following the merger; changes in asset quality and credit risk; the inability to sustain revenue and earnings growth; changes in interest rates and capital markets; inflation; customer acceptance of KeyCorp’s products and services; customer borrowing, repayment, investment and deposit practices; customer disintermediation; the introduction, withdrawal, success and timing of business initiatives; competitive conditions; the inability to realize cost savings or revenues or to implement integration plans and other consequences associated with mergers, acquisitions and divestitures; economic conditions; and the impact, extent and timing of technological changes, capital management activities, and other actions of the Federal Reserve Board and legislative and regulatory actions and reforms. Annualized, pro forma, projected and estimated numbers are used for illustrative purpose only, are not forecasts and not reflect actual results. This presentation also includes certain non-GAAP financial measures related to “tangible common equity,” “Common Equity Tier 1,” “Tier 1 common equity,” “pre-provision net revenue,” and “cash efficiency ratio.” Management believes these ratios may assist investors, analysts and regulators in analyzing Key’s financials. Although Key has procedures in place to ensure that these measures are calculated using the appropriate GAAP or regulatory components, they have limitations as analytical tools and should not be considered in isolation, or as a substitute for analysis of results under GAAP. For more information on these calculations and to view the reconciliations to the most comparable GAAP measures, please refer to the appendix of this presentation or page 100 of our Form 10-Q dated September 30, 2015. 2 |
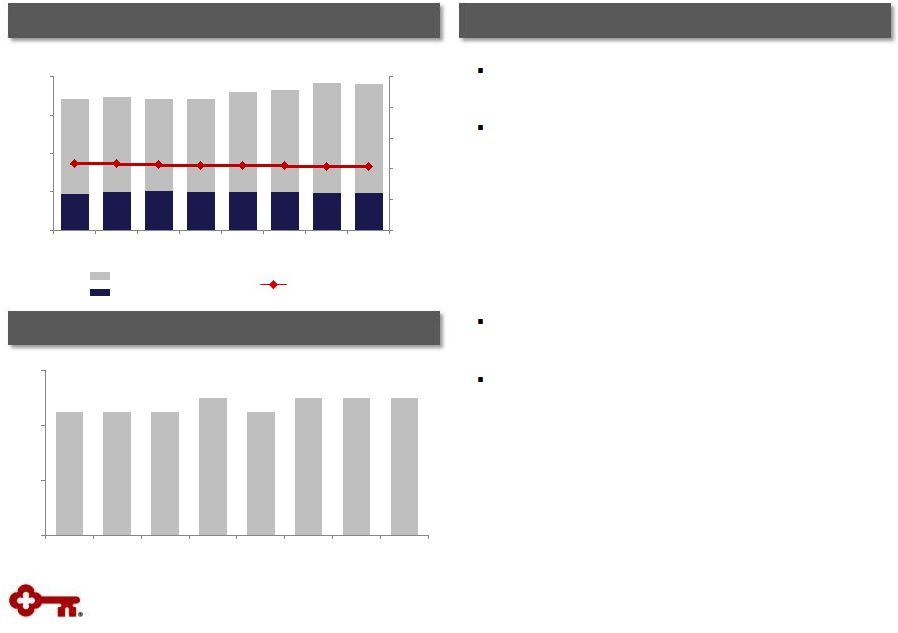
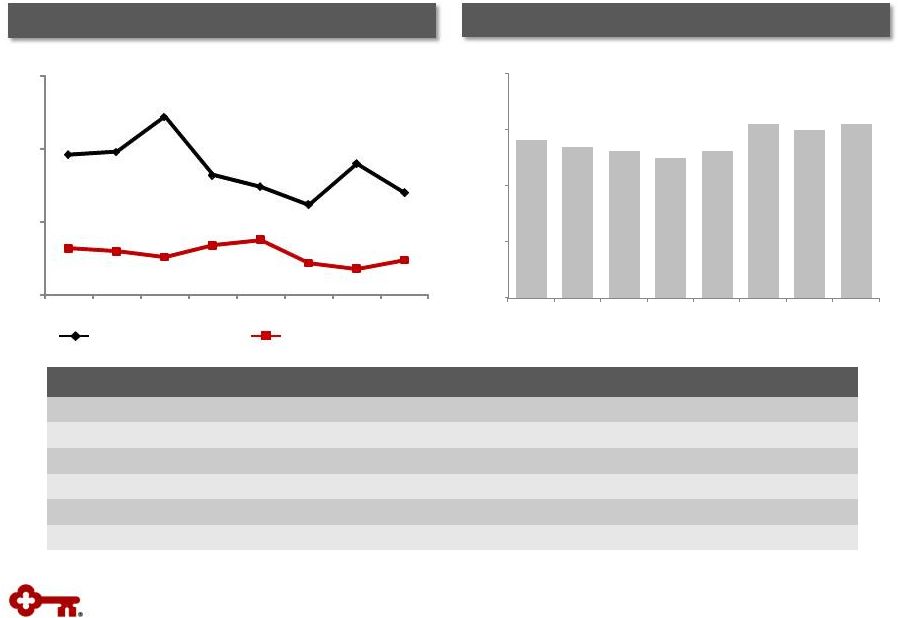
 Note: graphs not to scale; P.E. = period-end (a) Non-GAAP measure; see Appendix for reconciliation (b) 12-31-15 ratio is estimated 3 Disciplined Capital Management Generated positive operating leverage from prior year Total average loans up 5% from prior year Positive trends in fee-based businesses - Investment banking and debt placement (record year, +12%), corporate services (+11%), cards and payments (+10%), and trust & investment services (+7%) Expenses well-managed, reflect strategic investments Strong Risk Management Investor Highlights – 2015 Positive Operating Leverage Strong asset quality - NCOs represented 24 bps of average loans in 2015 - NPLs down 7% from prior year: 65 bps of P.E. loans Maintained credit discipline Maintained strong capital position Increased dividend by 15% in 2Q15; planned increase of 13% in 2016 (subject to Board approval) Expect share repurchases and an increased dividend to be included in 2016 CCAR submission 2015 2014 +5% Pre-Provision Net Revenue (a) Net Charge-offs 2015 NCOs to average loans .24% - .40% .60% 1.00% Targeted range Strong Capital Common Equity Tier 1 Ratio (a), (b) of 11.0% at December 31, 2015 |
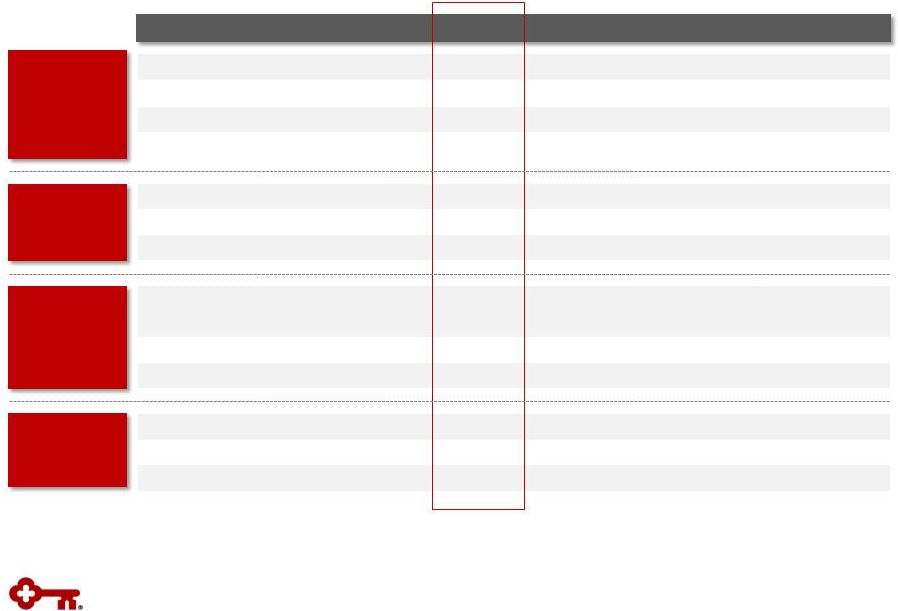
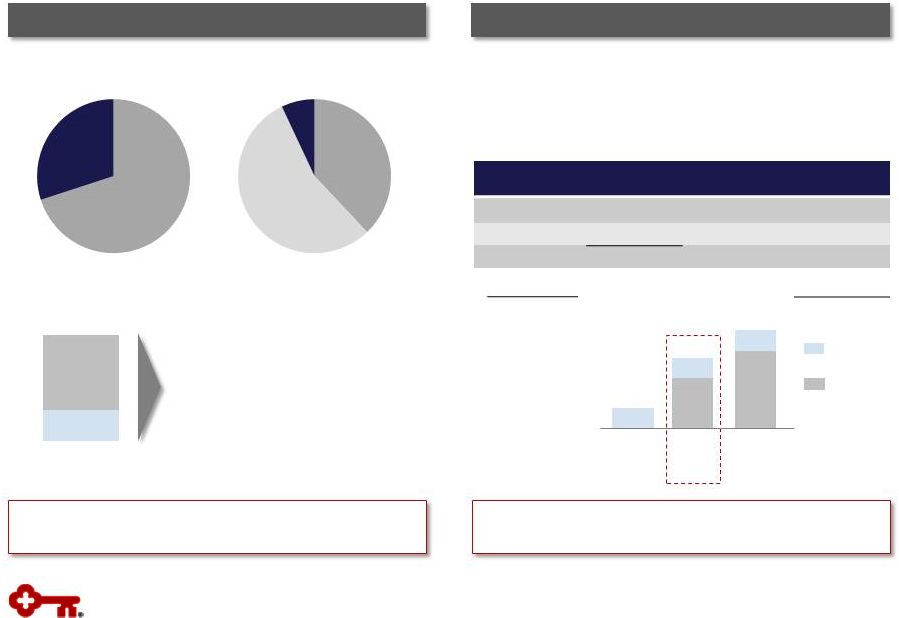
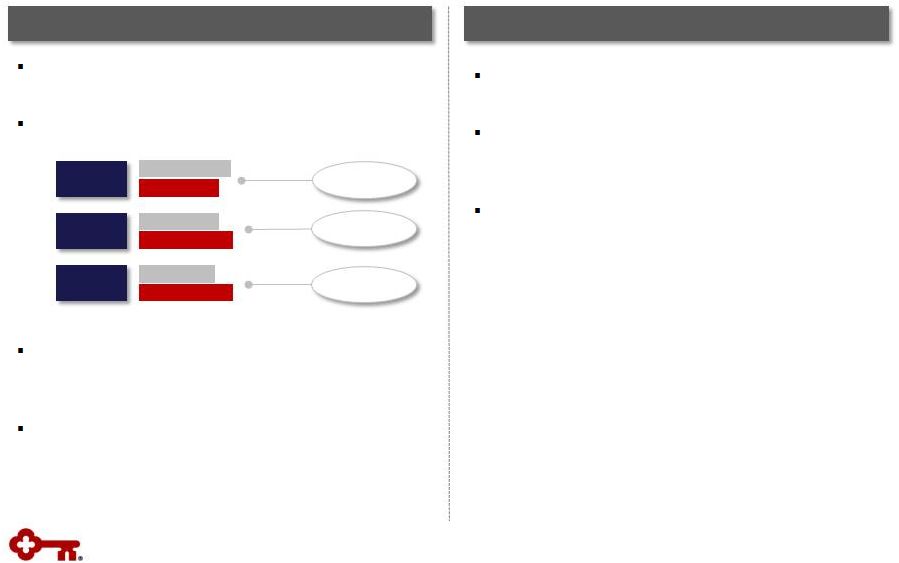 4 First Niagara: A Compelling Opportunity Acquisition Drives Value 4Q15 Updates Executing against comprehensive pre-merger integration plan Merger integration team established – Top talent at KEY and FNFG; significant prior M&A experience Focused on continued assessment, detailed planning and the approval process Continued progress and momentum on announced acquisition; anticipated closing in 3Q16 Accelerates Key’s transformation into a high- performing regional bank Generates attractive financial returns Provides significant revenue opportunities – Broader suite of products to new and existing clients Creates complementary business mix and a more balanced franchise Key Cash Efficiency > 300 bps > 200 bps ~5% ROTCE EPS Key Key Pro Forma Pro Forma Pro Forma |
 5 Financial Review |
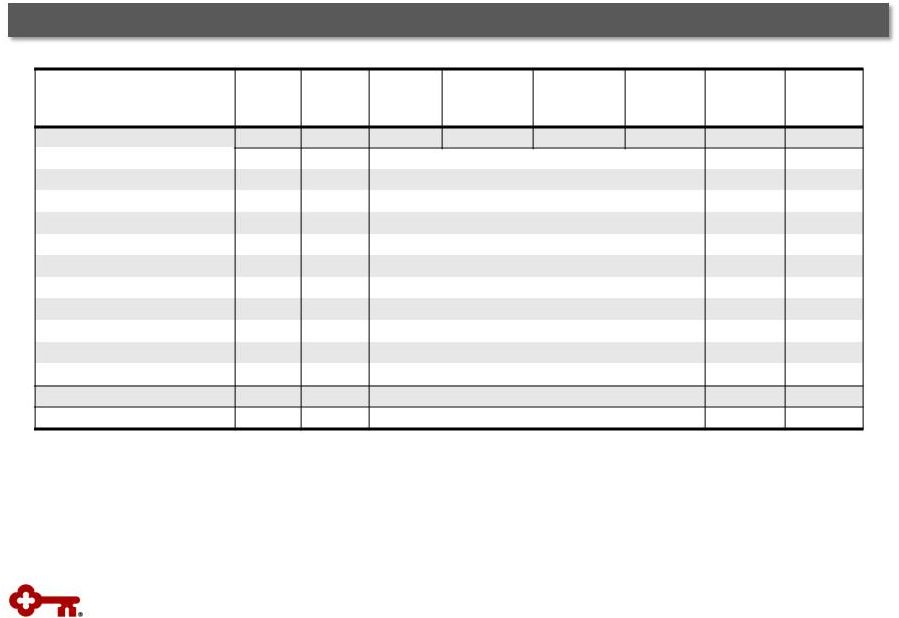
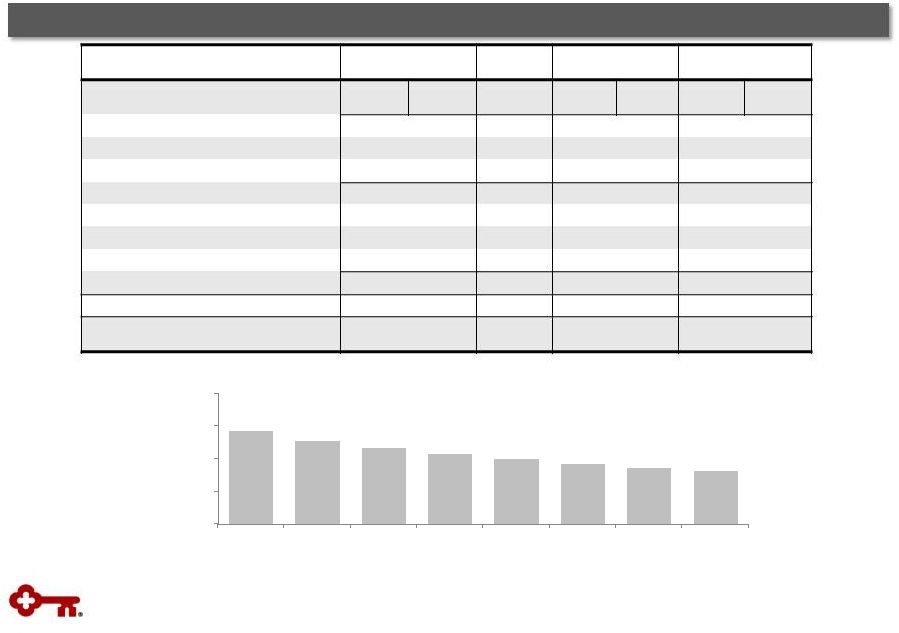
 6 Financial Highlights TE = Taxable equivalent, EOP = End of Period (a) From continuing operations (b) Year-over-year average balance growth (c) From consolidated operations (d) 12-31-15 ratios are estimated (e) Non-GAAP measure: see Appendix for reconciliation EPS – assuming dilution $ .27 $ .26 $ .27 $ .26 $ .28 Cash efficiency ratio (e) 66.4 % 66.9 % 65.1 % 65.1 % 64.4 % Net interest margin (TE) 2.87 2.87 2.88 2.91 2.94 Return on average total assets .97 .95 1.03 1.03 1.12 Total loans and leases 5 % 6 % 4 % 5 % 5 % CF&A loans 14 15 10 12 12 Deposits (excl. foreign deposits) 3 3 6 5 2 Common Equity Tier 1 (d), (e) 11.0 % 10.5 % 10.7 % 10.6 % - Tier 1 common equity (e) - - - - 11.2 % Tier 1 risk-based capital (d) 11.4 10.9 11.1 11.0 11.9 Tangible common equity to tangible assets (e) 10.0 9.9 9.9 9.9 9.9 NCOs to average loans .25 % .27 % .25 % .20 % .22 % NPLs to EOP portfolio loans .65 .67 .72 .75 .73 Allowance for loan losses to EOP loans 1.33 1.31 1.37 1.37 1.38 Balance Sheet Growth (a), (b) Capital (c) Asset Quality (a) Financial Performance (a) Metrics 4Q15 3Q15 2Q15 1Q15 4Q14 |
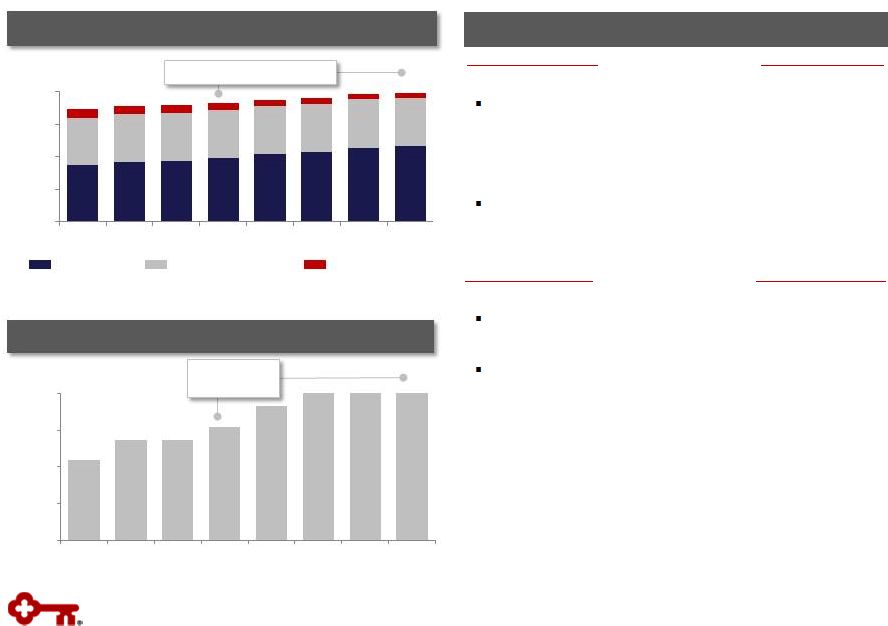 7 Loans $ in billions Average Commercial, Financial & Agricultural Loans Average Commercial, Financial & Agricultural Loans Total Average Loans Total Average Loans Exit Portfolios Home Equity & Other Commercial $ in billions Period-end total loans up 4% in 4Q15 from 4Q14, driven by CF&A loans up 12% Total commitments continue to grow, with utilization relatively stable Average Loans Period-End Loans CF&A loans up 14% CF&A loans up 14% Highlights Highlights Total average loans up 5% Total average loans up 5% Average total loans up 5% in 4Q15 from 4Q14, driven by CF&A loans up 14% – Broad-based growth across Key’s commercial lines of business Community Bank and Corporate Bank 4Q15 average balances up 2% and 13%, respectively, compared to 4Q14 $20.0 $30.0 $40.0 $50.0 $60.0 1Q14 2Q14 3Q14 4Q14 1Q15 2Q15 3Q15 4Q15 $21.0 $23.0 $25.0 $27.0 $29.0 1Q14 2Q14 3Q14 4Q14 1Q15 2Q15 3Q15 4Q15 |
 Deposits up 2% from 3Q15 reflecting: – Seasonal and short-term deposit inflows from commercial clients – Growth in NOW and money market deposit accounts, along with certificates of deposit $26.3 $37.6 $2.3 $5.2 8 4Q15 Average Deposit Mix Deposit growth of 3% from 4Q14 related to: – Growth in commercial mortgage servicing – Inflows from both commercial and consumer clients Average Deposits (a) (a) Excludes deposits in foreign office Cost of total deposits (a) CDs and other time deposits Savings Noninterest-bearing NOW and MMDA Total average deposits (a) Highlights Deposits vs. Prior Quarter vs. Prior Year $ in billions $ in billions Deposit cost remains relatively stable .15% .15% 0.00% 0.10% 0.20% 0.30% 0.40% 0.50% $25.0 $35.0 $45.0 $55.0 $65.0 $75.0 1Q14 2Q14 3Q14 4Q14 1Q15 2Q15 3Q15 4Q15 Total average deposits up 3% |
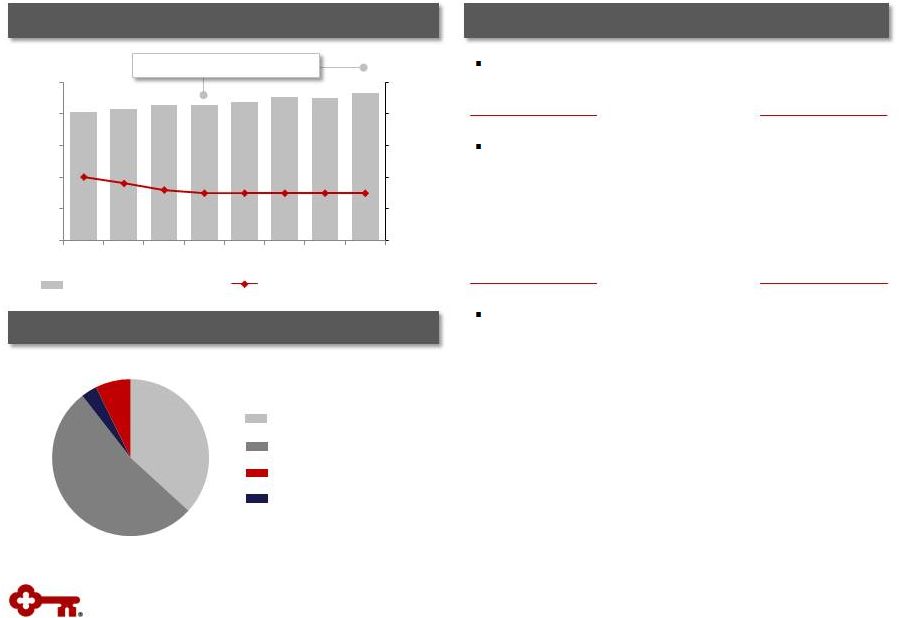
 Net interest income up $12 MM, or 2%, from 3Q15, primarily due to higher earning asset yields and loan fees 9 TE = Taxable equivalent Net interest income (TE) NIM (TE) NIM Change (bps): vs. 3Q15 Higher earning asset yields 0.02 Loan fees 0.02 Higher levels of excess liquidity (0.04) Total change - Maintained moderate asset sensitivity – Naturally asset sensitive balance sheet flows: approximately 70% of loans variable rate – High quality investment portfolio with average life of 3.9 years – Flexibility to quickly adjust interest rate risk position vs. Prior Year Net interest income up $22 MM, or 4%, from 4Q14, reflecting higher earning asset balances, partially offset by lower earning asset yields vs. Prior Quarter Net Interest Income and Margin Net Interest Income & Net Interest Margin Trend (TE) Highlights $ in millions; continuing operations $588 $610 2.94% 2.87% 2.00% 2.50% 3.00% 3.50% 4.00% $500 $540 $580 $620 1Q14 2Q14 3Q14 4Q14 1Q15 2Q15 3Q15 4Q15 |
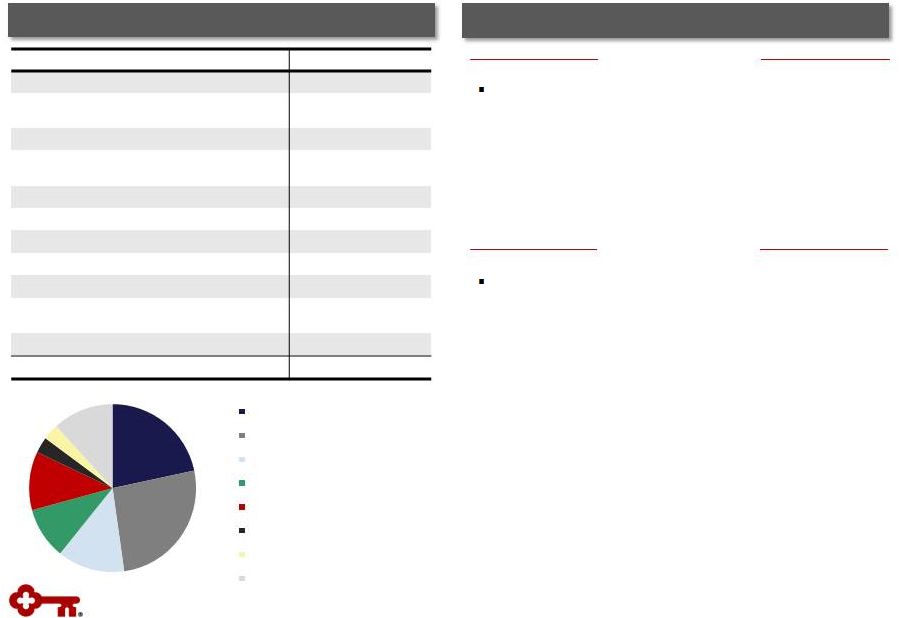 10 Noninterest Income Noninterest Income Noninterest Income $ in millions 4Q15 vs. 3Q15 vs. 4Q14 Trust and investment services income $ $ (3) $ (7) Investment banking and debt placement fees 127 18 1 Service charges on deposit accounts 64 (4) - Operating lease income and other leasing gains 15 - - Corporate services income 55 (2) 2 Cards and payments income 47 - 4 Corporate-owned life insurance 36 6 (2) Consumer mortgage income 2 (1) (1) Mortgage servicing fees 15 4 4 Net gains (losses) from principal investing - (11) (18) Other income 19 8 12 Total noninterest income $ $ 15 $ (5) Highlights Highlights Noninterest income down 1% from 4Q14 – Principal investing down $18 MM – Lower trust and investment services, reflecting market variability – Other income $12 MM higher, impacted by investment gains in Real Estate Capital – Strength in core businesses, with growth in investment banking and debt placement, corporate services, cards and payments and mortgage servicing Noninterest income up 3% from 3Q15 – Investment banking and debt placement fees up $18 MM, or 17% – Growth in other income due to investment gains in Real Estate Capital – Principal investing down $11 MM vs. Prior Quarter vs. Prior Year (a) (a) Other includes corporate-owned life insurance, principal investing, etc. 22% 26% 13% 10% 11% 3% 3% 12% Trust & Investment Services Investment Banking & Debt Placement Deposit Service Charges Cards & Payments Corporate Services Mortgage Servicing Fees Operating Lease Income Other 485 105 |
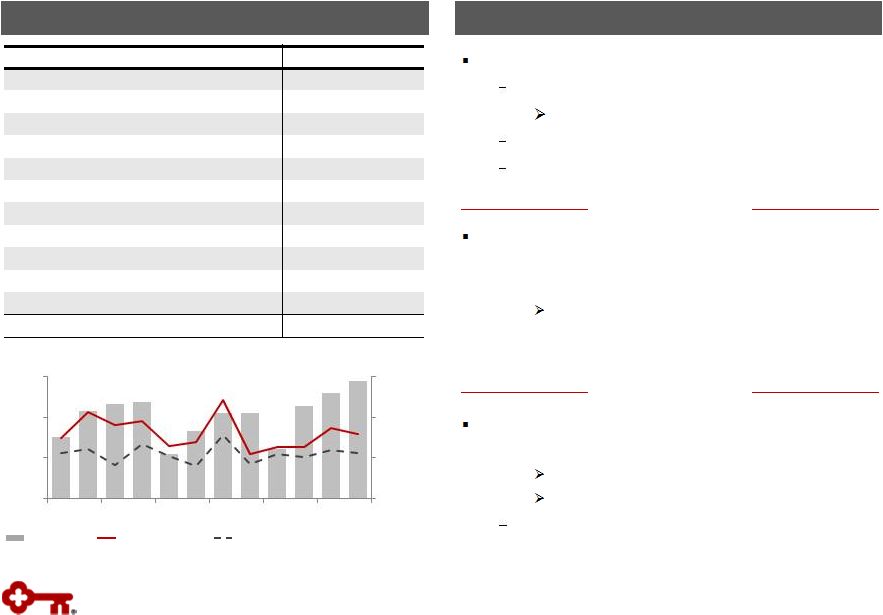 Noninterest expense $ in millions 4Q15 vs. 3Q15 vs. 4Q14 Personnel (a) $ 429 $ (3) $ (20) Net occupancy 64 (4) (1) Computer processing 43 (2) (3) Business services, professional fees 44 (4) (6) Equipment 22 - 1 Operating lease expense 13 (2) (2) Marketing 17 - (1) FDIC assessment 8 - 1 Intangible asset amortization 9 - 1 OREO expense, net 1 1 1 Other expense 86 2 (3) Total noninterest expense $ 736 $ (12) $ (32) 11 Noninterest Expense Noninterest Expense Noninterest Expense (a) (b) Non-GAAP measure: see Appendix for reconciliation Highlights Highlights Cash efficiency ratio, excl. efficiency, pension settlement, and merger- related costs Cash efficiency ratio (b) 4Q15 noninterest expense up 5% from 4Q14 – Higher personnel costs (+$20 MM) Employee benefits expense (+$11 MM) Investments in client-facing personnel Merger-related costs in 4Q15 (+$6 MM) Expense increase of 2% from 3Q15 – Higher incentive compensation (+$12 MM) – Lower employee benefits expense (-$11 MM) Lower pension settlement charge – Merger-related costs in 4Q15 (+$6 MM) – Higher efficiency-related costs (+$6 MM) vs. Prior Year vs. Prior Quarter $736 4Q15 noninterest expense includes: Efficiency-related costs of $10 MM Reflecting branch closures and severance Merger-related costs of $6 MM Pension settlement charge of $4 MM $ in millions $704 60.0% 64.0% 68.0% 72.0% $620 $660 $700 $740 2Q13 4Q13 2Q14 4Q14 2Q15 4Q15 Includes a pension settlement charge of $4 million in 4Q15, $18 million in 3Q15 and $3 million in 4Q14 |
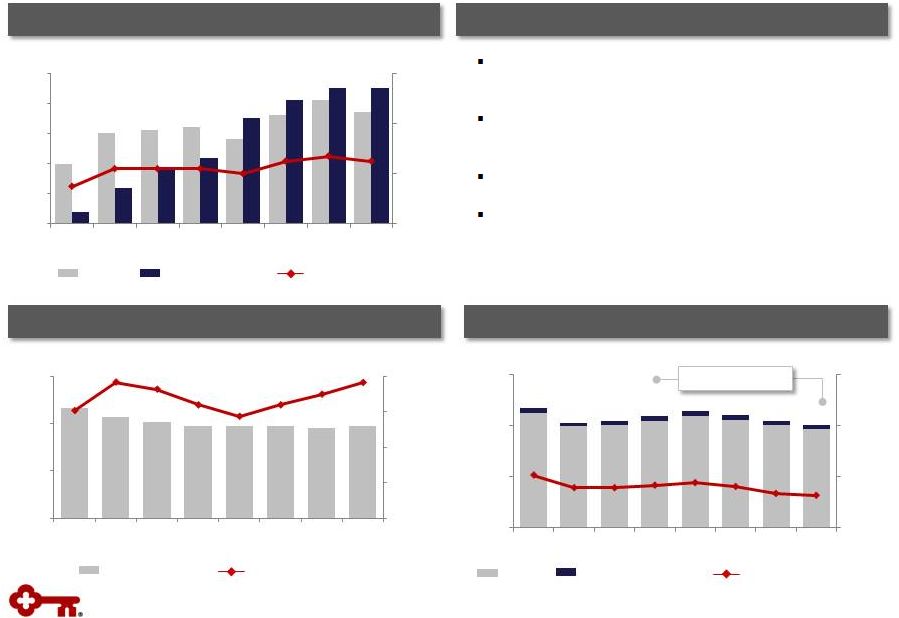 12 Nonperforming Assets Net Charge-offs & Provision for Credit Losses NPLs NPLs to period-end loans NCOs Provision for credit losses NCOs to average loans $ in millions NPLs held for sale, OREO & other NPAs Credit Quality Highlights Net loan charge-offs remain below targeted range, at 25 basis points of average loans Nonperforming loans represented 65 basis points of period-end loans Nonperforming assets down 8% from prior year Allowance for loan and lease losses represented 1.33% of period-end loans; 206% coverage of nonperforming loans Allowance for Loan and Lease Losses Allowance for loan and lease losses to NPLs Allowance for loan and lease losses $ in millions $436 $403 $ in millions NPAs down 8% $32 $37 $22 $45 .22% .25% .00% .20% .40% .60% $0 $10 $20 $30 $40 $50 1Q14 2Q14 3Q14 4Q14 1Q15 2Q15 3Q15 4Q15 .73% .65% 0.40% 0.80% 1.20% 1.60% $0 $200 $400 $600 1Q14 2Q14 3Q14 4Q14 1Q15 2Q15 3Q15 4Q15 $794 $796 190% 206% 110% 135% 160% 185% 210% $600 $700 $800 $900 1Q14 2Q14 3Q14 4Q14 1Q15 2Q15 3Q15 4Q15 |
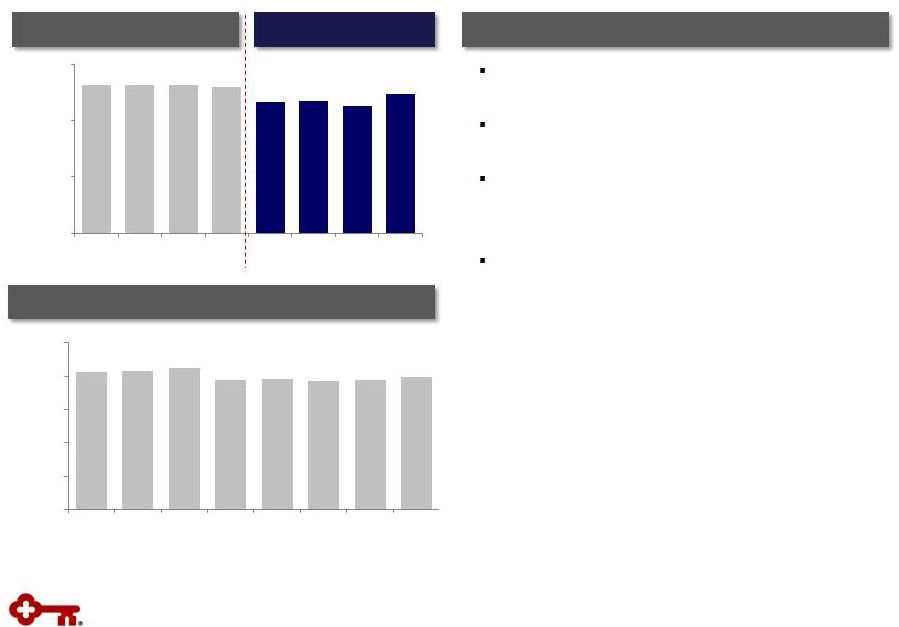 13 Maintained strong capital position Common Equity Tier 1 ratio of 10.95% at 12/31/15 Increased quarterly common share dividend by 15% in 2Q15; planned increase of 13% in 2016 (subject to Board approval) Expect share repurchases and an increased dividend to be included in 2016 CCAR submission Tier 1 Common Equity (a) Tangible Common Equity to Tangible Assets (a) Highlights (a) Non-GAAP measure: see Appendix for reconciliations (b) 12-31-15 ratio is estimated (c) The Regulatory Capital Rules, effective January 1, 2015 for Key, introduced a new capital measure, “Common Equity Tier 1” Common Equity Tier 1 (a), (b), (c) Capital 11.17% 10.95% 6.00% 8.00% 10.00% 12.00% 1Q14 2Q14 3Q14 4Q14 1Q15 2Q15 3Q15 4Q15 9.88% 9.98% 6.00% 7.00% 8.00% 9.00% 10.00% 11.00% 1Q14 2Q14 3Q14 4Q14 1Q15 2Q15 3Q15 4Q15 |
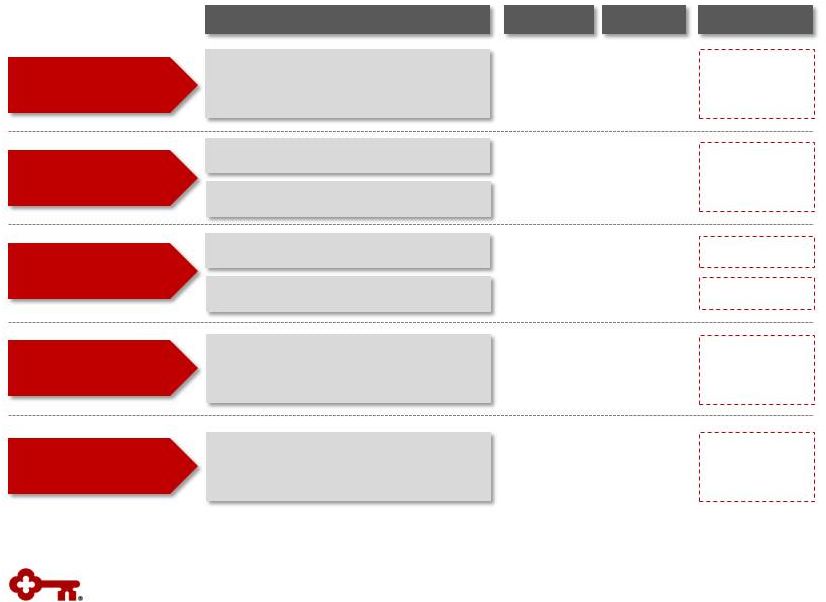
 Outlook and Expectations Average Loans • Mid-single digit growth vs. FY 2015 Net Interest Income • Up low single-digit percentage without the benefit from higher interest rates • Mid-single digit growth with the benefit of higher interest rates Noninterest Income • Mid-single digit growth compared to 2015 Expense • Relatively stable with 2015 Efficiency / Productivity • Positive operating leverage Asset Quality • Net charge-offs to average loans below targeted range of 40 – 60 bps • Allowance, as a percentage of period-end loans, to remain relatively stable with 4Q15 level Capital • Dividend expected to increase to $.085 per common share in 2Q16 (subject to Board approval) • Expect 2016 CCAR submission to include common share repurchases and an increased dividend 14 Guidance ranges: relatively stable: +/- 2%; low single-digit: <5%; mid-single digit: 4% - 6% Note: Guidance provided does not include merger-related charges FY 2016: Key Stand-alone |
 15 Appendix |
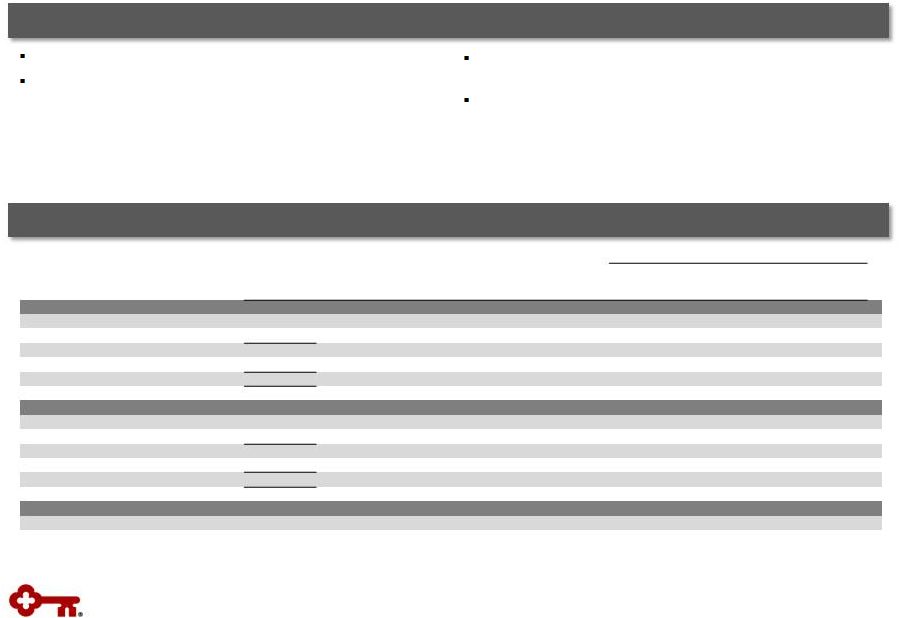
 Progress on Targets for Success: Key Stand-alone (a) Continuing operations, unless otherwise noted (b) Represents period-end consolidated total loans and loans held for sale divided by period-end consolidated total deposits (excluding deposits in foreign office) (c) Excludes intangible asset amortization; non-GAAP measure: see Appendix for reconciliation 16 Balance Sheet Efficiency Moderate Risk Profile High Quality, Diverse Revenue Streams Positive Operating Leverage Financial Returns Metrics (a) 2014 2015 Targets Loan to deposit ratio (b) NCOs to average loans Provision for credit losses to average loans Net interest margin Noninterest income to total revenue Cash efficiency ratio (c) 85% 88% .20% .24% 66.2% 65.9% .10% .28% 2.97% 2.88% 44% 44% 90% -100% 40 - 60 bps 3.00% -3.25% <60% >40% 1.08% .99% 1.00% - 1.25% Return on average assets |
 17 Average Total Investment Securities Highlights Average AFS securities Investment Portfolio Portfolio composed primarily of GNMA and GSE- backed MBS and CMOs Continue to position portfolio for regulatory liquidity requirements: – 2015 average balance growth reflects actions taken to increase liquidity reserves – Growth and reinvestment of portfolio cash flows have been predominantly in GNMA securities (~53% of total portfolio was GNMA at 12/31/15) Securities cash flows of $1.0 B in 4Q15 and $1.1 billion in 3Q15 Average portfolio life at 12/31/15 of 3.9 years vs. 3.8 years at 9/30/15 Securities to Total Assets (b) (a) Yield is calculated on the basis of amortized cost (b) Includes end-of-period held-to-maturity and available-for-sale securities Average yield (a) Average HTM securities 2.10% .00% 1.00% 2.00% 3.00% 4.00% 5.00% $0.0 $5.0 $10.0 $15.0 $20.0 1Q14 2Q14 3Q14 4Q14 1Q15 2Q15 3Q15 4Q15 20% 20% 10% 14% 18% 22% 1Q14 2Q14 3Q14 4Q14 1Q15 2Q15 3Q15 4Q15 2.12% $17.1 $19.1 $ in billions |
 Interest Rate Risk Management Naturally Asset Sensitive Balance Sheet Actively Managing Rate Risk • High quality • Fixed rate agency MBS and CMOs • Average maturity: 3.9 years • GNMAs total 53% of total portfolio at period-end • Reinvesting cash flows into GNMAs $11.7 $18 $7.1 $7.1 Size of swap portfolio Modeled asset sensitivity ~3% 0% 8% $7.1 Flexibility to Adjust Rate Sensitivity with Swaps Loan Portfolio Variable: 70% Fixed: 30% Deposits (a) Flexibility to adjust rate sensitivity for changes in balance sheet growth/mix as well as interest rate outlook Debt hedges A/LM hedges Investment Portfolio Noninterest- bearing: 37% Interest- bearing, non- time: 56% CDs: 7% • Maintained moderate asset sensitive position of ~3% - Assumes 200 basis point increase in short and intermediate- term rates over a 12-month period • Utilize swaps for debt hedging and asset liability management - Fairly even pace of A/LM swap maturities - $2.4B A/LM swaps scheduled to mature by year end 2016 12/31/15 Swaps ($ in B) 12/31/15 Notional Amt. Wtd. Avg. Maturity (Yrs.) Receive Rate Pay Rate A/L Management $ 11.7 2.5 1.1% .3% Debt 7.1 3.6 2.0 .4 $ 18.8 1.4% .3% 4Q15 $19.1 B AFS: $14.2 B HTM: $4.9 B Balance sheet has relatively short duration and is impacted by the short-end of the curve $18.8 B 18 4Q15 4Q15 Note: Loan, deposit and investment portfolio balances reflect quarterly average balances (a) Excludes deposits in foreign office |
 19 Credit Quality Trends Criticized Outstandings (a) to Period-end Total Loans Delinquencies to Period-end Total Loans (a) Loan and lease outstandings (b) From continuing operations 2.5% 3.1% 0.0% 1.0% 2.0% 3.0% 4.0% 1Q14 2Q14 3Q14 4Q14 1Q15 2Q15 3Q15 4Q15 Metric (b) 4Q15 3Q15 2Q15 1Q15 4Q14 Delinquencies to EOP total loans: 30-89 days .35 % .45 % .31 % .37 % .41 % Delinquencies to EOP total loans: 90+ days .12 .09 .11 .19 .17 NPLs to EOP portfolio loans .65 .67 .72 .75 .73 NPAs to EOP portfolio loans + OREO + Other NPAs .67 .69 .75 .79 .76 Allowance for loan losses to period-end loans 1.33 1.31 1.37 1.37 1.38 Allowance for loan losses to NPLs 205.7 197.5 190.0 181.7 190.0 Continuing operations Continuing operations .41% .35% .17% .12% .00% .25% .50% .75% 1Q14 2Q14 3Q14 4Q14 1Q15 2Q15 3Q15 4Q15 30 – 89 days delinquent 90+ days delinquent |
 Period- end loans Average loans Net loan charge- offs Net loan charge-offs (b) / average loans (%) Nonperforming loans (c) Ending allowance (d) Allowance / period-end loans (d) (%) Allowance / NPLs (%) 12/31/15 4Q15 4Q15 4Q15 12/31/15 12/31/15 12/31/15 12/31/15 $ 31,240 $ 30,884 $ 15 .19% $ 82 $ 450 1.44% 548.78% Commercial real estate: Commercial Mortgage 7,959 8,019 (2) N/M 19 134 1.68 705.26 Construction 1,053 1,067 - - 9 25 2.37 277.78 Commercial lease financing 4,020 3,910 6 .61 13 47 1.17 361.54 Real estate – residential mortgage 2,242 2,252 - - 64 17 .76 26.56 Home equity 10,335 10,418 5 .19 190 57 .55 30.00 Credit cards 806 780 7 3.56 2 33 4.09 N/M Consumer other – Key Community Bank 1,600 1,605 5 1.24 2 20 1.25 N/M Consumer other – Exit Portfolio 621 641 1 .62 6 13 2.09 216.67 Continuing total (e) $ 59,876 $ 59,576 $ 37 .25% $ 387 $ 796 1.33 205.68% Discontinued operations 1,828 1,851 8 1.71 7 28 1.53 400.00 Consolidated total $ 61,704 $ 61,427 $ 45 .29% $ 394 $ 824 1.34 209.14% Credit Quality by Portfolio Credit Quality $ in millions 20 (a) 12-31-15 ending loan balance includes $85 million of commercial credit card balances; 12-31-15 average loan balance includes $87 million of assets from commercial credit cards (b) Net loan charge-off amounts are annualized in calculation (c) 12-31-15 NPL amount excludes $11 million of purchased credit impaired loans (d) 12-31-15 allowance by portfolio is estimated (e) 12-31-15 ending loan balance includes purchased loans of $114 million, of which $11 million were purchased credit impaired N/M = Not meaningful Commercial, financial and agricultural (a) |
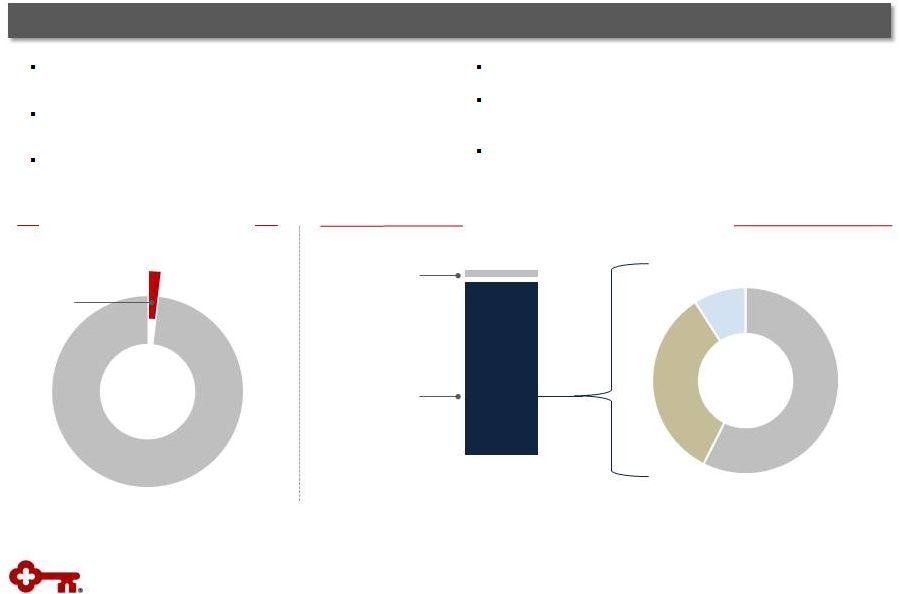 Oil & Gas Longstanding history, expertise and relationships 21 Strong Portfolio Characteristics >10 years of experience in energy lending with >20 specialists dedicated to oil & gas Focused on middle market companies, aligned with our relationship strategy Portfolio regularly stress tested Total Loans Outstanding, 12/31/15 Primarily secured by proven reserves Relationships contributed ~2% of FY15 investment banking and debt placement fees Net charge-offs lower than overall portfolio Oil & Gas Outstanding Balances, 12/31/15 Oil & Gas: 2% Other: 98% Oilfield Services Upstream: 57%, $0.6 B Midstream: 34%, $0.4 B Downstream: 9%, $0.1 B $0.1 B Oil & Gas $1.1 B |
 (a) Average LTVs are at origination; current average LTVs for Community Bank total home equity loans and lines is approximately 67%, which compares to 68% at the end of the third quarter of 2015 Home Equity Portfolio – 12/31/15 $ in millions, except average loan size Home Equity Portfolio Highlights High quality portfolio Community bank loans and lines: 98% of total portfolio; branch- originated – 61% first lien position – Average FICO score of 770 – Average LTV at origination: 71% $4.1 billion of the total portfolio are fixed rate loans that require principal and interest payments; $6.2 billion are lines $1.1 billion in lines outstanding (11% of the total portfolio) come to end of draw period in the next four years – Proactive communication and client outreach initiated near end of draw period 22 Vintage (% of Loans) Loan Balances Average Loan Size ($) Average FICO Average LTV (a) % of Loans LTV>90% 2012 and later 2011 2010 2009 2008 and prior Loans and lines First lien $ 6,128 $ 771 67 % .6 % 58 % 4 % 2 % 3 % 33 % Second lien 3,999 46,102 767 77 3.5 41 4 3 3 49 Community Bank $ 10,127 58,363 770 71 1.7 52 4 3 3 38 Exit portfolio 208 19,066 728 80 28.9 - - - - 100 Total home equity portfolio $ 10,335 Nonaccrual loans and lines First lien 109 $ 64,368 715 73 % 3.5% 14 % 3 % 2 % 5 % 76 % Second lien 73 47,372 709 80 4.0 6 2 2 5 85 Community Bank 182 56,245 713 77 3.7 11 2 2 5 80 Exit portfolio 8 22,333 705 83 23.0 - - - - 100 Total home equity nonaccruals 190 Fourth quarter net charge-offs (NCOs) Total home equity portfolio 5 % of average loans .19 % 70,622 $ $ $ $ |
 Balance Outstanding Change Net Loan Charge-offs Balance on Nonperforming Status 12-31-15 9-30-15 12-31-15 vs. 9-30-15 4Q15 3Q15 (b) 12-31-15 9-30-15 Residential properties – homebuilder $ 6 $ 6 - - - $ 8 $ 5 Marine and RV floor plan 1 1 - - - - - Commercial lease financing (a) 765 798 $ (33) - $ (1) 1 - Total commercial loans 772 805 (33) - (1) 9 5 Home equity – Other 208 222 (14) $ 2 (1) 8 7 Marine 583 620 (37) 1 3 6 6 RV and other consumer 41 44 (3) - (1) - 1 Total consumer loans 832 886 (54) 3 1 14 14 Total exit loans in loan portfolio $ 1,604 $ 1,691 $ (87) $ 3 $ - $ 23 $ 19 Discontinued operations – education lending business (not included in exit loans above) (c) $ 1,828 $ 1,891 $ (63) $ 8 $ 7 $ 7 $ 8 $2,148 $1,648 $0 $1,000 $2,000 $3,000 $4,000 1Q14 2Q14 3Q14 4Q14 1Q15 2Q15 3Q15 4Q15 $ in millions; average balances $ in millions Exit Loan Portfolio Exit Loan Portfolio 23 (a) Includes (1) the business aviation, commercial vehicle, office products, construction and industrial leases; (2) Canadian lease financing portfolios; (3) European lease financing portfolios; and (4) all remaining balances related to lease in, lease out; sale in, lease out; service contract leases; and qualified technological equipment leases. (b) Credit amounts indicate recoveries exceeded charge-offs (c) Excludes loans held for sale of $169 million at September 30, 2015. There were no loans held for sale at December 31, 2015. |
 Three months ended 12-31-15 9-30-15 6-30-15 3-31-15 12-31-14 Tangible common equity to tangible assets at period end Key shareholders’ equity (GAAP) $ 10,746 $ 10,705 $ 10,590 $ 10,603 $ 10,530 Less: Intangible assets (a) 1,080 1,084 1,085 1,088 1,090 Preferred Stock, Series A (b) 281 281 281 281 282 Tangible common equity (non-GAAP) $ 9,3485 $ 9,340 $ 9,224 $ 9,234 $ 9,158 Total assets (GAAP) $ 95,133 $ 95,422 $ 94,606 $ 94,206 $ 93,821 Less: Intangible assets (a) 1,080 1,084 1,085 1,088 1,090 Tangible assets (non-GAAP) $ 94,053 $ 94,338 $ 93,521 $ 93,118 $ 92,731 Tangible common equity to tangible assets ratio (non-GAAP) 9.98 % 9.90 % 9.86 % 9.92 % 9.88 % Common Equity Tier 1 at period end Key shareholders’ equity (GAAP) $ 10,746 $ 10,705 $ 10,590 $ 10,603 - Less: Preferred Stock, Series A (b) 281 281 281 281 - Common Equity Tier 1 capital before adjustments and deductions 10,465 10,424 10,309 10,322 - Less: Goodwill, net of deferred taxes 1,036 1,036 1,034 1,036 - Intangible assets, net of deferred taxes 26 29 33 36 - Deferred tax assets 1 1 1 1 - Net unrealized gains (losses) on available-for-sale securities, net of deferred taxes (58) 54 - 52 - Accumulated gains (losses) on cash flow hedges, net of deferred taxes (20) 21 (20) (8) - Amounts in accumulated other comprehensive income (loss) attributed to pension and postretirement benefit costs, net of deferred taxes (365) (385) (361) (364) - Total Common Equity Tier 1 capital (c) $ 9,845 $ 9,668 $ 9,622 $ 9,569 - Net risk-weighted assets (regulatory) (c) $ 89,889 $ 92,307 $ 89,851 $ 89,967 - Common Equity Tier 1 ratio (non-GAAP) (c) 10.95 % 10.47 % 10.71 % 10.64 % - Tier 1 common equity at period end Key shareholders’ equity (GAAP) - - $ 10,530 Qualifying capital securities - - 339 Less: Goodwill - - - - 1,057 Accumulated other comprehensive income (loss) (d) - - - - (395) Other assets (e) - - - - 83 Total Tier 1 capital (regulatory) - - - - 10,124 Less: Qualifying capital securities - - - - 339 Preferred Stock, Series A (b) - - - - 282 Total Tier 1 common equity (non-GAAP) - - - - $ 9,503 Net risk-weighted assets (regulatory) - - - - $ 85,100 Tier 1 common equity ratio (non-GAAP) - - - - 11.17 % GAAP to Non-GAAP Reconciliation $ in millions 24 a) Three months ended 12/31/15, 9/30/15, 6/30/15, 3/31/15, and 12/31/14, exclude $45 million, $50 million, $55 million, $61 million, and $68 million, respectively, of period-end purchased credit card receivables b) Net of capital surplus c) 12-31-15 amount is estimated d) Includes net unrealized gains or losses on securities available for sale (except for net unrealized losses on marketable equity securities), net gains or losses on cash flow hedges, and amounts resulting from the application of the applicable accounting guidance for defined benefit and other postretirement plans e) Other assets deducted from Tier 1 capital and net risk-weighted assets consist of disallowed intangible assets (excluding goodwill) and deductible portions of nonfinancial equity investments. There were no disallowed deferred tax assets at December 31, 2014. |
 Three months ended 12-31-15 9-30-15 6-30-15 3-31-15 12-31-14 Pre-provision net revenue Net interest income (GAAP) $ 602 $ 591 $ 584 $ 571 $ 582 Plus: Taxable-equivalent adjustment 8 7 7 6 6 Noninterest income (GAAP) 485 470 488 437 490 Less: Noninterest expense (GAAP) 736 724 711 669 704 Pre-provision net revenue from continuing operations (non-GAAP) $ 359 $ 344 $ 368 $ 345 $ 374 Average tangible common equity Average Key shareholders’ equity (GAAP) $ 10,731 $ 10,614 $ 10,590 $ 10,570 $ 10,562 Less: Intangible assets (average) (a) 1,082 1,083 1,086 1,089 1,096 Preferred Stock, Series A (average) 290 290 290 290 291 Average tangible common equity (non-GAAP) $ 9,359 $ 9,241 $ 9,214 $ 9,191 $ 9,175 Return on average tangible common equity from continuing operations Net income (loss) from continuing operations attributable to Key common shareholders (GAAP) $ 224 $ 216 $ 230 $ 222 $ 246 Average tangible common equity (non-GAAP) 9,359 9,241 9,214 9,191 9,175 Return on average tangible common equity from continuing operations (non-GAAP) 9.50 % 9.27 % 10.01 % 9.80 % 10.64 % Return on average tangible common equity consolidated Net income (loss) attributable to Key common shareholders (GAAP) $ 220 $ 213 $ 233 $ 227 $ 248 Average tangible common equity (non-GAAP) 9,359 9,241 9,214 9,191 9,175 Return on average tangible common equity consolidated (non-GAAP) 9.33 % 9.14 % 10.14 % 10.02 % 10.72 % Cash efficiency ratio Noninterest expense (GAAP) $ 736 $ 724 $ 711 $ 669 $ 704 Less: Intangible asset amortization (GAAP) 9 9 9 9 10 Adjusted noninterest expense (non-GAAP) $ 727 $ 715 $ 702 $ 660 $ 694 Net interest income (GAAP) $ 602 $ 591 $ 584 $ 571 $ 582 Plus: Taxable-equivalent adjustment 8 7 7 6 6 Noninterest income (GAAP) 485 470 488 437 490 Total taxable-equivalent revenue (non-GAAP) $ 1,095 $ 1,068 $ 1,079 $ 1,014 $ 1,078 Cash efficiency ratio (non-GAAP) 66.4 % 66.9 % 65.1 % 65.1 % 64.4 % GAAP to Non-GAAP Reconciliation (continued) $ in millions (a) Three months ended 12/31/15, 9/30/15, 6/30/15, 3/31/15, and 12/31/14, exclude $47 million, $52 million, $58 million, $64 million, and $69 million, respectively, of average purchased credit card receivables 25 |
 KeyCorp & Subsidiaries $ in billions Quarter ended December 31, 2015 Common Equity Tier 1 under current RCR Adjustments from current RCR to the fully phased-in RCR: Deferred tax assets and other intangible assets (b) Common Equity Tier 1 anticipated under the fully phased-in RCR (c) Net risk-weighted assets under current RCR Adjustments from current RCR to the fully phased-in RCR: Mortgage servicing assets (d) All other assets (e) Total risk-weighted assets anticipated under the fully phased-in RCR (c) Common Equity Tier 1 under the fully phased-in RCR Table may not foot due to rounding 26 Common Equity Tier 1 Under the Regulatory Capital Rules (RCR) (estimated) (a) (a) Common Equity Tier 1 capital is a non-generally accepted accounting principle (GAAP) financial measure that is used by investors, analysts and bank regulatory agencies to assess the capital position of financial services companies. Management reviews Common Equity Tier 1 along with other measures of capital as part of its financial analyses (b) Includes the deferred tax asset subject to future taxable income for realization, primarily tax credit carryforwards, as well as intangible assets (other than goodwill and mortgage servicing assets) subject to the transition provisions of the final rule. (c) The anticipated amount of regulatory capital and risk-weighted assets is based upon the federal banking agencies’ Regulatory Capital Rules (as fully phased-in on January 1, 2019); Key is subject to the Regulatory Capital Rules under the “standardized approach” (d) Item is included in the 10%/15% exceptions bucket calculation and is risk-weighted at 250% (e) Under the fully implemented rule, certain deferred tax assets and intangible assets subject to the transition provision are no longer required to be risk-weighted because they are deducted directly from capital. - 9.8 9.8 89.9 .5 - 90.4 10.85 % $ $ $ $ |
IMPORTANT ADDITIONAL INFORMATION AND WHERE TO FIND IT In connection with the proposed merger, KeyCorp has filed with the SEC a Registration Statement on Form S-4 on November 30, 2015 that includes the preliminary Joint Proxy Statement of KeyCorp and First Niagara and a preliminary Prospectus of KeyCorp, as well as other relevant documents concerning the proposed transaction. The information in the preliminary Joint Proxy Statement/Prospectus is not complete and may be changed. The definitive Joint Proxy Statement/Prospectus will be mailed to stockholders of KeyCorp and First Niagara after the Registration Statement is declared effective by the SEC. This communication does not constitute an offer to sell or the solicitation of an offer to buy any securities or a solicitation of any vote or approval. INVESTORS AND SHAREHOLDERS ARE URGED TO READ THE REGISTRATION STATEMENT AND THE JOINT PROXY STATEMENT/PROSPECTUS REGARDING THE MERGER AND ANY OTHER RELEVANT DOCUMENTS FILED WITH THE SEC, AS WELL AS ANY AMENDMENTS OR SUPPLEMENTS TO THOSE DOCUMENTS, BECAUSE THEY WILL CONTAIN IMPORTANT INFORMATION. A free copy of the Joint Proxy Statement/Prospectus, as well as other filings containing information about KeyCorp and First Niagara, may be obtained at the SEC’s Internet site (http://www.sec.gov). You will also be able to obtain these documents, free of charge, from KeyCorp at investor.key.com or from First Niagara by accessing First Niagara’s website at www.firstniagara.com. Copies of the Joint Proxy Statement/Prospectus can also be obtained, free of charge, by directing a request to KeyCorp Investor Relations at Investor Relations, KeyCorp, 127 Public Square, Mailcode OH-01-27-0737, Cleveland, Ohio 44114-1306, by calling (216) 689-3000, or by sending an e-mail to investor_relations@keybank.com or to First Niagara Investor Relations at 726 Exchange Street, Suite 618, Buffalo, New York 14210, by calling (716) 819-5669 or by sending an e-mail to investor@fnfg.com. In addition, KeyCorp and First Niagara use their respective Investor Relations websites and social media outlets as channels of distribution of material company information. Such information is accessible on KeyCorp’s and First Niagara’s Investor Relations websites, as well as on their respective Facebook pages and through their Twitter accounts and LinkedIn accounts. KeyCorp and First Niagara and certain of their respective directors and executive officers may be deemed to be participants in the solicitation of proxies from the respective shareholders of KeyCorp and First Niagara in respect of the transaction described in the Joint Proxy Statement/Prospectus. Information regarding KeyCorp’s directors and executive officers is contained in KeyCorp’s Proxy Statement on Schedule 14A, dated April 7, 2015, which is filed with the SEC. Information regarding First Niagara’s directors and executive officers is contained in First Niagara’s Proxy Statement on Schedule 14A, dated March 23, 2015, which is filed with the SEC. Additional information regarding the interests of those participants and other persons who may be deemed participants in the transaction may be obtained by reading the Joint Proxy Statement/Prospectus regarding the proposed merger. Free copies of this document may be obtained as described in the preceding paragraph. 27 |