Exhibit(a)(7)
FAIR MARKET VALUEOF
BELK, INC.
COMMON STOCK
ASOF JANUARY 28, 2012
April 10, 2012
Mr. Ralph Pitts
Belk, Inc.
2801 West Tyvola Road
Charlotte, North Carolina 28217
Dear Mr. Pitts,
Pursuant to your request, we conducted a valuation analysis of the common stock (the “Subject Interest”) of Belk, Inc. (“Belk” or the “Company”) as of January 28, 2012 (the “valuation date”). The results of our analysis are summarized in this transmittal letter and set forth in detail in the attached appraisal report.
PURPOSEAND OBJECTIVEOFTHE APPRAISAL
The purpose of our analysis is to provide an independent opinion of the fair market value of Belk common stock for management planning, tax compliance purposes, and a potential Board of Directors (the “Board”) tender offer. Our analysis was conducted for that purpose specified herein. No other purpose is intended nor should be inferred.
The objective of our analysis is to estimate the fair market value of the Belk equity on a nonmarketable, minority ownership interest basis as of the valuation date.
DEFINITIONAND PREMISEOF VALUE
The standard of value used in this appraisal isfair market value,as set forth in the Internal Revenue Code. For purposes of this appraisal, fair market value is defined as “the price at which the subject property would change hands between a hypothetical willing buyer and a willing seller, with both having reasonable knowledge of all relevant facts, and neither party being under any compulsion to buy or sell.” Fair market value also assumes that the price is paid all in cash or its economic equivalent at closing. The factors surrounding the determination of fair market value are discussed more fully in Revenue Ruling 59-60, as amended and amplified by subsequent Revenue Rulings and interpreted by the courts.
Our analysis was conducted under the premise of value in continued use, as a going concern. The going concern premise assumes that Belk will continue to operate as an income producing entity. Our opinion of value for the Subject Interest is on a nonmarketable, minority ownership interest basis. A nonmarketable interest cannot be sold in a public market, nor can it be sold quickly, with price certainty, or without incurring relatively significant transaction risks and costs. A minority interest lacks the relative ability to control an entity’s operating, investing, and financing decisions.
Mr. Ralph Pitts
Executive Vice President & General Counsel
April 10, 2012
Page 2
VALUATION PROCEDURESAND ANALYSIS
Our analyses, opinions, and conclusions were developed under, and this report was prepared in conformance with, the Uniform Standards of Professional Appraisal Practice.
In developing the valuation analysis, we researched and analyzed the following factors, among others:
| | 1. | comparative industry data; |
| | 2. | economic information and data; |
| | 3. | information relating to publicly traded companies considered suitable for comparison to the subject business entity; |
| | 4. | empirical market evidence regarding historical long-term rates of return on investment measures as developed from nationally recognized investment information publications and studies; and |
| | 5. | contemporaneous costs of debt capital in the public and private market as provided by nationally recognized investment information publications and Willamette Management Associates’ own analysis. |
During our analysis we were provided with certain audited and operational data with respect to Belk. This data was both historical and prospective in nature. We relied on this data as fairly presenting the Company’s results of operations and financial position. We have not audited this data as part of our analysis. Therefore, we express no opinion or other form of assurance regarding this data.
We reviewed and discussed certain documents and information with the Company’s management as we formed our opinion of our initial appraisal conclusions of fair market value under standard valuation procedures, as they applied to this specific case.
We arrived at indications of value through generally accepted valuation approaches. We specifically relied on (1) the discounted cash flow method (under the income approach) and (2) the guideline publicly traded company method (under the market approach) and (3) the previous transactions method (under the market approach).
VALUATION SYNTHESISAND CONCLUSION
Based upon the procedures and analysis mentioned above, and in our independent professional opinion, the fair market value of the Subject Interest on a nonmarketable, minority ownership interest basis as of January 28, 2012, was:
$1,834,745 or $40.80 Per Share
Based on 44,916,349 Shares Outstanding.
A narrative valuation report delineating the scope, analysis, and conclusions of this appraisal follows this transmittal letter. Our individual valuation methods and procedures are summarized in the valuation exhibits that are presented in Appendix A to this narrative valuation report.
The accompanying statement of assumptions and limiting conditions, appraisal certification, and qualifications of the principal analysts are integral parts of this opinion.
Mr. Ralph Pitts
Executive Vice President & General Counsel
April 10, 2012
Page 3
Very truly yours,
WILLAMETTE MANAGEMENT ASSOCIATES
Curtis R. Kimball, CFA, ASA
Managing Director
FAIR MARKET VALUEOF
BELK, INC.
COMMON STOCK
ASOF JANUARY 28, 2012
TABLE OF CONTENTS
| | | | |
| | | PAGE | |
I. INTRODUCTION | | | 1 | |
Introduction | | | 1 | |
Purpose and Objective of the Appraisal | | | 1 | |
Definition and Premise of Value | | | 1 | |
Valuation Procedures and Analysis | | | 2 | |
II. DESCRIPTION AND ANALYSIS OF BELK, INC. | | | 3 | |
History and Description of Belk | | | 3 | |
Capitalization and Equity Ownership | | | 5 | |
Tender Offers | | | 5 | |
Financial Statement Analysis | | | 7 | |
Balance Sheets | | | 7 | |
Income Statements | | | 8 | |
Financial Statement Adjustments | | | 8 | |
Summary of Positive and Negative Factors | | | 9 | |
Positive Factors | | | 9 | |
Negative Factors & Challenges | | | 11 | |
III. IDENTIFICATION OF GUIDELINE COMPANIES | | | 14 | |
Overview | | | 14 | |
Descriptions of Selected Companies | | | 14 | |
The Bon-Ton Stores, Inc. | | | 14 | |
Dillards, Inc. | | | 14 | |
Kohl’s Corporation | | | 15 | |
Nordstrom, Inc. | | | 15 | |
J.C. Penney, Inc. | | | 15 | |
Saks, Inc. | | | 15 | |
Stein Mart, Inc. | | | 16 | |
Macy’s Inc. | | | 16 | |
Stage Stores, Inc. | | | 16 | |
IV. VALUATION ANALYSIS | | | 17 | |
The Market Approach | | | 17 | |
Valuation Theory and Methodology: The Guideline Publicly Traded Company Method | | | 18 | |
Valuation Theory and Methodology: The Previous Transaction Method | | | 20 | |
Income Approach | | | 21 | |
Discounted Cash Flow Method | | | 22 | |
DCF Method Calculations | | | 25 | |
The Asset-Based Approach | | | 27 | |
V. VALUATION SYNTHESIS AND CONCLUSION | | | 28 | |
Indicated Equity Value – Discounted Cash Flow and Guideline Public Company Methods | | | 28 | |
Indicated Equity Value – Previous Transactions Method | | | 29 | |
Conclusion | | | 29 | |
FAIR MARKET VALUEOF
BELK, INC.
COMMON STOCK
ASOF JANUARY 28, 2012
TABLE OF CONTENTS
| | | | |
| | | PAGE | |
APPENDIX A – VALUATION EXHIBITS | | | 30 | |
APPENDIX B – INDUSTRY OVERVIEW | | | 62 | |
APPENDIX C – U.S. ECONOMIC OUTLOOK | | | 71 | |
APPENDIX D – DISCOUNT FOR LACK OF MARKETABILITY | | | 82 | |
APPENDIX E – STATEMENT OF ASSUMPTIONS AND LIMITING CONDITIONS | | | 103 | |
APPENDIX F – APPRAISAL CERTIFICATION | | | 106 | |
APPENDIX G – QUALIFICATIONS OF PRINCIPAL ANALYSTS | | | 108 | |
I. INTRODUCTION
INTRODUCTION
Pursuant to the request of Mr. Ralph Pitts, we conducted a valuation analysis of the common stock (the “Subject Interest”) of Belk, Inc. (“Belk” or the “Company”) as of January 28, 2012 (the “valuation date”). The results of our analysis are summarized in this narrative valuation report.
PURPOSEAND OBJECTIVEOFTHE APPRAISAL
The purpose of our analysis is to provide an independent opinion of the fair market value of Belk common stock for management planning, tax compliance purposes, and a potential Board of Directors (the “Board”) tender offer. Our analysis was conducted for that purpose specified herein. No other purpose is intended nor should be inferred.
The objective of our analysis is to estimate the fair market value of the Belk equity on a nonmarketable, minority ownership interest basis as of the valuation date.
DEFINITIONAND PREMISEOF VALUE
The standard of value used in this appraisal isfair market value,as set forth in the Internal Revenue Code. For purposes of this appraisal, fair market value is defined as “the price at which the subject property would change hands between a hypothetical willing buyer and a willing seller, with both having reasonable knowledge of all relevant facts, and neither party being under any compulsion to buy or sell.” Fair market value also assumes that the price is paid all in cash or its economic equivalent at closing. The factors surrounding the determination of fair market value are discussed more fully in Revenue Ruling 59-60, as amended and amplified by subsequent Revenue Rulings and interpreted by the courts.
Our analysis was conducted under the premise of value in continued use, as a going concern. The going concern premise assumes that Belk will continue to operate as an income producing entity.
Our opinion of value for the Subject Interest is on a nonmarketable, minority ownership interest basis. A nonmarketable interest cannot be sold in a public market, nor can it be sold quickly, with price certainty, or without incurring relatively significant transaction risks and costs. A minority interest lacks the relative ability to control an entity’s operating, investing, and financing decisions.
VALUATION PROCEDURESAND ANALYSIS
Our analyses, opinions, and conclusions were developed under, and this report was prepared in conformance with, the Uniform Standards of Professional Appraisal Practice.
In developing the valuation analysis, we researched and analyzed the following factors, among others:
| | 1. | comparative industry data; |
| | 2. | economic information and data; |
| | 3. | information relating to publicly traded companies considered suitable for comparison to the subject business entity; |
| | 4. | empirical market evidence regarding historical long-term rates of return on investment measures as developed from nationally recognized investment information publications and studies; and |
| | 5. | contemporaneous costs of debt capital in the public and private market as provided by nationally recognized investment information publications and Willamette Management Associates’ own analysis. |
During our analysis we were provided with certain audited and operational data with respect to Belk. This data was both historical and prospective in nature. We relied on this data as fairly presenting the Company’s results of operations and financial position. We have not audited this data as part of our analysis. Therefore, we express no opinion or other form of assurance regarding this data.
We reviewed and discussed certain documents and information with the Company’s management as we formed our opinion of our initial appraisal conclusions of fair market value under standard valuation procedures, as they applied to this specific case.
We arrived at indications of value through generally accepted valuation approaches. We specifically relied on (1) the discounted cash flow method (under the income approach) and (2) the guideline publicly traded company method (under the market approach) and (3) the previous transactions method (under the market approach).
II. DESCRIPTIONAND ANALYSISOF BELK, INC.
HISTORYAND DESCRIPTIONOF BELK1
Belk got its start when 26-year-old William Henry Belk opened a small bargain store in Monroe, N.C., on May 29, 1888. The store measured only 22 by 70 feet, about 1,500 square feet total. Mr. Belk called it the New York Racket, as he thought it made the store sound big and would attract business. Mr. Belk started with $750 in savings, a $500, 10 percent interest loan from a local widow, and about $3,000 worth of goods taken on consignment from a bankrupt store. In less than seven months, he had paid off his debts and netted a $3,300 profit.
Mr. Belk introduced some radically new retailing ideas for those times. He bought large quantities of goods for cash and sold for cash at a low mark-up. Further, all merchandise was clearly marked with its retail price and therefore no haggling ensued and customers could return any merchandise purchased if they were not completely satisfied. These innovative ideas helped the Belk stores succeed and grow.
In 1891, William Henry Belk persuaded his brother, Dr. John Belk, to leave the medical profession and become a partner in the Monroe store, beginning a remarkable 37-year business association. The company became the Belk Brothers Company.
The brothers opened a second store in 1893 in Chester, S.C., and a third in 1894 in Union, S.C. In 1895, William Henry Belk left the Monroe store to open the company’s fourth store in Charlotte, N.C. Dr. John Belk continued to manage the Monroe store until his death in 1928. William Henry Belk headed the Belk stores until his death at age 89 in 1952.
The second generation of management of the Company was led by two sons of William Henry Belk, Thomas M. Belk and John M. Belk. Thomas M. Belk passed away in 1997. John M. Belk retired as chief executive officer in 2004, but remained director emeritus until his death in 2007.
At the present, Belk is privately owned and operated under a third generation of Belk family leadership. Thomas M. (Tim) Belk, Jr. is chairman of the board and chief executive officer and John R. (Johnny) Belk is president and chief operating officer.
1 www.belk.com and Company documents
The children and other descendants of founder William Henry Belk and his brother, Dr. John M. Belk, own the majority of the Company’s stock. The remainder of the stock is mostly held by current and former employees of the Company and their descendants. This came about because the Belk’s had a policy of providing minority ownership interests to key store employees over the decades as the chain expanded. Historically, Belk was composed of a number of separately formed operating companies representing a store or a cluster of stores often using a trade name which included the local manager such as “Hudson-Belk Stores.” In May 1998, Belk, Inc. was formed by combining each store and company into one company.
The Company completed an acquisition of 22 Proffitt’s stores and 25 McRae’s stores from Saks Incorporated effective July 3, 2005. The Proffitt’s and McRae’s stores are regional department stores located in 11 of the 14 Southeastern states in which Belk currently has operations.
In October 2006, Belk completed a purchase transaction with Saks Incorporated for the acquisition of certain Parisian department stores located throughout nine Southeastern and Midwestern states. Belk paid $285 million in cash for Parisian, which includes real and personal property, operating leases, and inventory of 38 Parisian stores. Parisian generated total revenue of approximately $723 million in 2005.
As of the end of fiscal year 2011, the Company operated 303 retail department stores in 16 states, primarily in the southern United States. Belk stores seek to provide customers the convenience of one-stop shopping, with an appealing merchandise mix and extensive offerings of brands, styles, assortments, and sizes. Belk stores sell top national brands of fashion apparel, shoes, and accessories for women, men, and children, as well as cosmetics, home furnishings, house wares, fine jewelry, gifts, and other types of quality merchandise. The Company also sells exclusive private label brands, which offer customers differentiated merchandise selections. Larger Belk stores may include hair salons, spas, restaurants, optical centers, and other amenities. Belk has also planned investments in key strategic initiatives totaling approximately $600 million over a five-year period that began in fiscal year 2011. The Company is investing in store remodels; eCommerce; information technology; branding, marketing, and advertising; merchandise planning and processes; service improvements and improved sourcing practices.
In the third quarter of fiscal year 2011, Belk launched a re-branding program, adopting a new mission and vision. The mission is “to satisfy the modern Southern lifestyle like no one else, so that our customers get the fashion they desire and the value they deserve.” The vision is “for the modern Southern woman to
count on Belk first. For her, for her family, for life.” Belk is committed to providing its customers a compelling shopping experience and merchandise that reflects “Modern. Southern. Style.”
CAPITALIZATIONAND EQUITY OWNERSHIP
In May 1998, Belk completed a merger of 112 individual operating companies (the “Companies”) into a single collective corporate ownership entity. As a direct result, the existing shareholders of the Companies received Class A common stock in the new company (Belk, Inc.) in exchange for the shares of their respective existing corporations. Each Class A common shareholder is entitled to 10 votes per share.
The Class A stock is not restricted, but will automatically convert to Class B common stock if they are transferred to a party that is not a lineal descendant or defined affiliate of the original stockholder. Each Class B common shareholder is entitled to 1 vote per share. As of the valuation date, only a minor fraction of the shares had undergone such conversion.2
Belk stock did not historically trade on any organized securities market. An informal market developed over the years with the Belk corporate secretary’s office acting as a clearinghouse by keeping a list of shareholders who indicated if they wished either to buy or sell Belk stock. The parties could then contact each other and directly negotiate a sale. Subsequently, sometime after 2000, a local stock broker3 in Charlotte began to act in a similar capacity, and the Company eventually abandoned its informal activities in introducing potential buyers and sellers. In May 2005, Belk stock received NASD trading symbols (BLKIA and BLKIB for class A and B shares, respectively), reflecting the fact that trades for which a broker acts as intermediary have to be run through the NASD trading system. Trading volume remains very sparse with only one to three brokerage firms indicating an interest in making a market in the shares at any one time.4 Also, the two classes of stock often track one another in tandem.
TENDER OFFERS
From time to time Belk makes a tender offer for a limited number of its shares. On April 17, 2006, the Company announced a tender offer (“Offer”) to purchase up to 2.6 million shares of Class A and Class B common stock, $0.01 par value per share. Belk offered to purchase these shares at a price of $19.00 per share net to the seller in cash, without interest, subject to the terms and conditions set forth in the official
2 As of the valuation date, there were approximately 44.9 million total Belk shares outstanding. Of these, 864.8 thousand were Class B shares and the remaining 44.1 million shares were Class A shares.
3 Robert L. Stiles, Jr. of RBC Dain Raucher.
4 Dain Raucher accounts for the lion’s share of these trades.
Offer to Purchase documents. On May 19, 2006, the Company accepted tenders of 2,057,757 shares for $39.1 million.
In April, 2007, the Board approved another Offer which resulted in 781,484 shares tendered in May 2007 at an offer price of $31.00 per share for a total repurchase of $24.2 million. We note that each tender offer historically has been undersubscribed, i.e. fewer shares were actually tendered than the Company authorized to be repurchased.
In May 2008, the Board approved an Offer at $25.60 per share. The authorized tender was for $25.6 million (250 thousand Class A shares and 750 thousand Class B shares). The actual tender was $22.3 million (520,063 Class A shares and 352,895 Class B shares).
In May 2009, Belk approved an Offer at a price of $11.90 a share. The authorized tender was for approximately $6 million (200 thousand Class A shares and 300 thousand Class B shares). The actual tender was $2.9 million (102,128 Class A shares and 139,536 Class B shares).
In May 2010 at a price of $26.00 per share an Offer was made. The authorized tender was for approximately $74.9 million, or 2 million Class A shares and 880 thousand Class B shares. The actual tender was for $51.4 million, or approximately 1.5 million Class A shares and 494.7 thousand Class B shares. Additionally, in 2010 the Company made two dividend distributions, both at $0.40 per share.
The purpose of the Offers was part of a plan accepted by the Board of Directors of Belk to enhance stockholder value and provide occasional liquidity for stockholders. From discussions with management and members of the Board, Belk plans to periodically consider tender offers for shares. However, Company management has indicated that such offers are not and would never be done regularly or routinely, and the Board of Directors has not committed to approve any particular tender offer regularly or to commit to any amount or other terms of any such Offer if one is recommended by management. According to Company management, the Board of Directors would, from time to time, consider tendering for shares if and only if certain operational and profitability benchmarks are achieved.
In March 2011, Belk announced approval of an offer to repurchase up to 2.2 million shares of the Company’s common stock at a price of $33.70 per share. The company executed the repurchase offer on April 18, 2011 and completed the transaction on May 16, 2011 when the Company accepted for purchase 1,353,607 shares of Class A and 278,335 shares of Class B common stock for $55 million. The Company
also declared a regular dividend of $0.55 per share for shareholders of record on March 30, 2011.
In March of 2012, Belk’s Board of Directors has agreed to increase their dividend to $0.75 per share and provide a tender offer of $100 million to its shareholders.
FINANCIAL STATEMENT ANALYSIS
An essential step in the valuation of any company is an analysis of its performance over time. Past sales and earnings growth can provide an indication of future growth and can put a company’s earnings in an historical context. Other things being equal, a company with rapidly rising sales and earnings is worth more than one with little or no growth. The following section examines key trends in Belk’s financial statements during the latest five-year period.
Balance Sheets
Belk’s balance sheets as of or near January 29, 2007 through 2012, the valuation date, is incorporated in Exhibit 2 A and 2 B in Appendix A.
| • | | The Company’s total assets decreased from $2.8 billion as of January 29, 2007 to $2.5 billion as of January 28, 2012. This decrease is primarily due to lower net fixed assets and other assets. |
| • | | Net property and equipment totaled $1.3 billion as of January 29, 2007. Net property and equipment was $993.1 million, or 39.5 percent of total assets as of the valuation date. |
| • | | Merchandise inventory was the largest subset of current assets. Inventory totaled $887 million as of January 28, 2012, or 35.3 percent of total assets. |
| • | | Current liabilities increased from $517.6 million as of January 29, 2007 to $560.0 million as of January 28, 2012. This increase is due mainly to increases in current portion of long term debt and deferred income taxes. Accounts payable was the largest portion of current liabilities, which totaled $216.4 million as of January 28, 2012. |
| • | | Long-term liabilities have decreased over the period analyzed, from $1.0 billion in fiscal year end 2007 to $718.3 million as of the valuation date. |
| • | | Total stockholders’ equity decreased from $1.3 billion as of January 29, 2007 to $1.2 billion as of January 28, 2012. |
Income Statements
Belk’s income statements for the fiscal years ended on or near January 29, 2007 through the year ended 2011 and January 28, 2012 (the “LTM period”) are incorporated in Exhibit 3 A and 3 B in Appendix A.
| | — | | The Company’s revenues increased 5.3 percent in the fiscal year of 2012 to $3.7 billion due primarily to a continuation of improved sales trends in both in store and eCommerce sales. |
| | — | | Comparable store revenues increased 5.5 percent as a result of effective execution of key strategic initiatives that included rebranding, marketing, eCommerce, store remodels, and service improvements. Merchandising categories with the highest growth rate for the year included ladies shoes, children’s, and home. |
| | — | | The Company calculates comparable store revenue as sales from stores that have reached the one-year anniversary of their opening as of the beginning of the fiscal year and eCommerce revenues, but excludes closed stores. Stores undergoing remodeling, expansion, or relocation remain in the comparable store revenue calculation. Definitions and calculations of comparable store revenue differ among companies in the retail industry. |
| | — | | Cost of goods sold as a percentage of revenue has primarily stayed the same at 66.5 percent for fiscal year 2007 and the LTM period. |
| | — | | Operating income increased to $300.9 million in the fiscal year 2012 compared to $246.0 million during the same period in fiscal year 2011. |
| | — | | Net income increased to $183.1 million or $4.04 per basic and $4.02 per diluted share in the fiscal year 2012 compared to a net income of $127.6 million or $2.72 per basic and $2.71 per diluted share during the same period in fiscal year 2011. The increase in net income was due primarily to increased sales and improved margins, expense leverage, and the release of a deferred tax valuation allowance. |
FINANCIAL STATEMENT ADJUSTMENTS
Investment return is determined by future cash flows. Expectations about a company’s business activity, its revenue, and operating returns, as measured by earnings and cash flow, are critical to assessing the value of Belk and, hence, its common stock. If Belk’s operations have changed substantially over time in ways that make prior financial data less useful for determining present and prospective earning power, then it becomes necessary to adjust Belk’s income statement to account for these changes.
We made several adjustments to the operating data of Belk because we determined that these expense/income items understate/overstate the normal operations of the Company. These adjustments to normalize earnings are shown in Exhibit 4, and described as follows.
| | • | | Non-recurring asset impairment and store closing costs were added back to earnings in fiscal years 2007 through the LTM in 2012. |
| | • | | Losses on the extinguishment of debt was added back in the LTM period. |
| | • | | Gains were subtracted on the sale of assets and losses on these assets were added in fiscal years 2007 through 2010 because it is an expense that is not associated with the normal operations of the business. |
| | • | | Gains were subtracted for all years analyzed on the sale of property and equipment. |
| | • | | Lastly, pension curtailments were added back in fiscal year 2007 and 2010. |
SUMMARYOF POSITIVEAND NEGATIVE FACTORS
Valuation methodology encompasses the analysis of quantitative fundamental data and empirical capital market evidence, and also of qualitative factors relevant to a subject industry and company. The quantitative fundamental data and empirical capital market evidence will be discussed in later sections of this report. Qualitative factors generally refer to certain aspects specific to an industry or business that are critical in assessing the risk and expected return for such an investment. Perceptions of differences between Belk and comparable alternative investment opportunities provide a basis for identifying risk as well as return potential. The following is a summary of positive and negative qualitative factors pertaining to Belk:
Positive Factors
| • | | Belk has been in existence since 1888 when William Henry Belk opened a small bargain store in Monroe, N.C. Today, there are approximately 303 Belk stores in 16 states (primarily in the Southeast), indicating growth and stability over the years. |
| • | | In October 2006, Belk completed the purchase of Parisian department stores. The transaction netted Belk 38 new stores and the Company believes the purchase will strengthen its competitive advantage in key markets and substantially expand the customer base. Belk managed to retain the key employees of the shoe department, which was Parisian’s top-performing department. |
| • | | In the summer of 2006, Belk purchased the assets of Migerobe, Inc. (an independent company which had been operating jewelry counters within Belk stores) and began operating its own fine jewelry departments. |
| • | | The Company relaunched its totally redesigned and expanded Belk.com website in fiscal year 2009 and began operating a 144,000 square foot eCommerce fulfillment center in Pineville, North Carolina to process handling and shipping of online orders. The new website features a wide assortment of fashion apparel, accessories and shoes, plus a large selection of cosmetics, home and gift merchandise. Many leading national brands are offered at the website along with the Company’s exclusive private brands. In fiscal year 2011, the Company expanded its online capabilities, increased multimedia marketing, implemented social community engagement strategies and expanded its fulfillment facilities. |
| • | | Belk’s net debt (long term debt less cash and equivalents) as of the valuation date was approximately $67.4 million, down from $79.7 million as of January 29, 2011. Cash totaled $456.3 million and $459.6 million as of January 28, 2012 and January 29, 2011, respectively. In discussions with Company management, the year has been very successful and the fourth quarter of 2011 was the best quarter in recent years. |
| • | | The Company declared a regular dividend of $0.75 per share for shareholders of record on March 30, 2012. This is a significant increase over the prior year’s dividend of $0.55 a share in fiscal year 2011 and $0.40 a share, paid twice, in fiscal year 2010. |
| • | | The Company started a new initiative to improve merchandise buying, planning, and assortment performance called Project Impact. Project Impact’s goals are to strengthen and tailor their assortments to meet the needs of their customers and to improve efficiency and margins. Project Impact has seven major initiatives and is led by the CEO. |
| • | | In 2011, the Company began Project SMART (Strategic Merchandising and Retail Technology) which is part of the Company’s five year strategic plan that will invest $100 million in updating their Point of Sale system to work more closely with their growing e-commerce website and integrate their sales systems. Project SMART is a complete redesign of all merchandise and sales systems, which starts with merchandise planning, assortment, and orders and continues to receiving, distribution, the sales floor, point of sale and back to merchandise planning. It involves all points of the supply chain |
| | from planning to the customer sale. Project SMART is expected to improve supply chain management and efficiencies by transforming business processes and technology capabilities to sense and efficiently respond to customer demand. However, as noted below this is also considered a possible negative factor. This solutions driven renovation in technology is expected to be implemented in fiscal year 2014, wherein comparable sales are expected increase 80bps, margins by 40bps, and inventory turnover by 6.1bps and subsequent inventory reductions. |
| • | | Belk launched a company-wide re-branding and corporate marketing initiative in October 2010 that includes a new logo and tag line, “Modern. Southern. Style.” New signs were installed in 60 stores before year-end 2010 with the balance installed in November of 2011. Newly designed charge cards were issued in October 2010 to Belk Elite and Premier customers, to be followed by Belk Rewards cardholders in March 2011. Belk’s new corporate identity is being supported by an extensive branding and advertising campaign that includes market-wide television and print advertising, circulars, direct mail, and social media, all of which incorporate Belk’s new graphic elements and brand messages. Based on discussion with Company management, customers welcomed the re-branding initiative, as based on customer surveys, and have been proven successful due to fiscal year 2012 results. |
| • | | Belk supports charitable giving in the areas of education, building stronger communities, breast cancer awareness and research, and other charitable causes. Fiscal year 2011 Belk Community Contributions including corporate, associate, vendor, and customer giving totaled approximately $13.1 million. |
| • | | During fiscal year 2012, Belk became the sponsor of the annual college football bowl, named the Belk Bowl, held at the Bank of America Stadium in Charlotte, North Carolina. More than 58,000 football fans attended the debut game between North Carolina State University and the University of Louisville, which was nationally televised on ESPN. Belk has also been continuing other unique avenues of advertising, including Pandora. |
Negative Factors & Challenges
| • | | The retail industry in which Belk operates is experiencing very intense direct and indirect competitive pressures from industry giant Wal-Mart Stores, discounters, eCommerce, and specialty stores. Further industry pressures on department stores are discussed in detail in Appendix C of this report. |
| • | | Although the Company’s stock has a ticker symbol (for both Class A and B shares), it is rarely traded over-the-counter and no public trading market of any significant depth or substance has developed for Belk’s stock. This is clearly evidenced by the scarcity of trades as shown on Exhibits 11 A through 11 C in Appendix A of this report. |
| • | | The Company’s corporate structure of Class A and Class B shares makes it an undesirable merger or takeover candidate. New outside investors acquiring shares from the founding stockholders who hold Class A shares automatically lose 9 votes per share due to the conversion of Class A stock to Class B stock. This makes the assembly of a voting control block from the Belk family and the other founding families very difficult. |
| • | | Belk is investing $100 million in information technology in Project SMART as part of a three-year rebuilding program. Company management indicated that Belk was trailing their competitors in this field, and has to play “catch-up.” The Company is investing significant resources into this program, and there are risks that their goals will be unachieved and adversely affect the Company’s financial performance. Specifically these risks include inadequate or poor scoping, lack of executive commitment, insufficient budget allocation, inadequate change in management and training costs, an inexperienced project management and team, and extensive modifications. |
| • | | In October 2010, Belk launched a branding campaign which included a change in the logo and extensive advertising and promotional activity in connection with the Company’s new logo, brand, and tagline. Belk invested approximately $70 million over 18 months in advertising, supplies, and capital and changed exterior and interior signage on all stores. If customers do not accept the new branding efforts, sales, performance, and customer relationships could be adversely affected, although unlikely. |
| • | | Belk’s business depends upon the ability to anticipate the demands of customers for a wide variety of merchandise and services. Belk routinely makes predictions about the merchandise mix, quality, style, service, convenience, and credit availability of its customers. If Belk does not accurately anticipate changes in buying, charging, and payment behavior among customers, or consumer tastes, preferences, spending patterns, and other lifestyle decisions, it could result in an inventory imbalance and adversely affect performance and relationships with their customers. |
| • | | Belk uses vendor allowances as a strategic part of its advertising, payroll, and margin maintenance. A decrease in any of these allowances would cause the Company to shift or reduce the funds and |
| | resources allotted to the given area. A reduction in the amount of cooperative advertising allowances would cause the Company to consider other methods of advertising and could cause them to adjust the volume and frequency of their product advertising, which could increase/decrease expenditures and/or revenue. |
| • | | In fiscal year 2006, Belk sold its proprietary credit card business to, and entered into a 10-year strategic alliance with, GE to operate its private label credit card business. Sales of merchandise and services are facilitated by these credit card operations. The Company receives income from GE relating to the credit card operations based on a variety of variables, but primarily from the amount of purchases made through the proprietary credit cards. The income received from this alliance and the timing of receipt of payments varies based on changes in customers’ credit card use and GE’s ability to extend credit to Belk’s customers, all of which can vary based on changes in federal and state banking and consumer protection laws and from a variety of economic, legal, social, and other factors that the Company cannot control. |
| • | | Belk relies on its distribution centers in South Carolina and Mississippi to service its stores, and an eCommerce fulfillment center in North Carolina that processes belk.com customer orders. The efficient operation of Belk’s business is dependent on receiving and distributing merchandise in a cost-effective and timely manner. Belk also relies on information systems to effectively manage sales, distribution, merchandise planning and allocation functions. The Company continues to implement software technology to assist with these functions. If the distribution network is operated ineffectively or information systems fail to perform as expected, Belk’s business could be disrupted. |
| • | | Belk outsources some business support processes to third parties. The Company makes a diligent effort to ensure that all providers of outsourced services observe proper internal control practices, including secure data transfers between Belk and third-party vendors; however, there are no guarantees that failures will not occur. Failure of third parties to provide adequate services could have an adverse effect on Belk’s operations and financial condition. |
| • | | The Company depends on its senior executives to run the business. The loss of any of these officers could materially adversely affect operations. Competition for qualified employees is intense, and the loss of qualified employees or an inability to attract, retain and motivate additional highly skilled employees required for the operation and expansion of the business could adversely the Company. |
III. IDENTIFICATIONOF GUIDELINE COMPANIES
OVERVIEW
The purpose of compiling guideline company statistics is to develop value measures based on prices at which stocks of similar companies are trading in a public market. The value derived from this method is a marketable minority ownership interest, with the assumption that it is a going concern business. The first step in finding such “guideline companies” is to identify the most appropriate Standard Industrial Classification (SIC) code. Belk most closely resembles companies in the following SIC code:
| | • | | SIC 5311: Department Stores |
DESCRIPTIONSOF SELECTED COMPANIES5
Our SIC search uncovered several companies. We narrowed this list to nine companies that were the most applicable based on markets, business strategies, products offered, and other factors. The following is a description of each of these companies.
The Bon-Ton Stores, Inc.
The Bon-Ton Stores, Inc., through its subsidiaries, operates department stores in the mid-size and metropolitan markets of the United States. Its stores offer brand-name fashion apparel and accessories for women, men, and children, as well as provide cosmetics, home furnishings, and footwear. As of November 1, 2011, the company operated 275 stores under various nameplates, including the Bon-Ton, Bergner’s, Boston Store, Carson Pirie Scott, Elder-Beerman, Herberger’s, and Younkers in 23 northeastern, midwestern, and upper Great Plains states; and under the Parisian nameplate in Detroit, Michigan. The Bon-Ton Stores, Inc. was founded in 1898 and is headquartered in York, Pennsylvania.
Dillards, Inc.
Dillard’s, Inc., together with its subsidiaries, operates as an apparel and home furnishing retailer in the United States. The company offers a selection of merchandise, including fashion apparel for women, men, and children, as well as accessories, cosmetics, home furnishings, and other consumer goods. Its merchandise selections comprise lines of brand merchandise, such as Antonio Melani, Gianni Bini, Roundtree & Yorke, and Daniel Cremieux. It also sells its merchandise on-line through its Web site, dillards.com. In addition, the company operates as a general contracting construction company. As of January 29, 2011, it operated 308 retail department stores located primarily in the southwest, southeast,
5 Business descriptions from S&P Capital IQ.
and midwest regions of the United States. The company was founded in 1938 and is based in Little Rock, Arkansas.
Kohl’s Corporation
Kohl’s Corporation operates department stores in the United States. The company’s stores offer private and exclusive, as well as national branded apparel, footwear, and accessories for women, men, and children; soft home products, such as sheets and pillows; and housewares primarily to middle-income customers. As of November 10, 2011, it operated 1,127 stores in 49 states. The company also offers on-line shopping through its Web site Kohls.com. Kohl’s Corporation was founded in 1962 and is headquartered in Menomonee Falls, Wisconsin.
Nordstrom, Inc.
Nordstrom, Inc., a fashion specialty retailer, offers apparel, shoes, cosmetics, and accessories for women, men, and children in the United States. It offers a selection of brand name and private label merchandise. The company sells its products through various channels, including Nordstrom full-line stores, off-price Nordstrom Rack stores, Jeffrey’ boutiques, treasure & bond, and Last Chance clearance stores; and its online store, nordstrom.com, as well as through catalog. Nordstrom also provides a private label card, two Nordstrom VISA credit cards, and a debit card for Nordstrom purchases. The company’s credit and debit cards feature a shopping-based loyalty program. As of September 30, 2011, it operated 222 stores, including 117 full-line stores, 101 Nordstrom Racks, 2 Jeffrey boutiques, 1 treasure & bond store, and 1 clearance store in 30 states. The company was founded in 1901 and is based in Seattle, Washington.
J.C. Penney, Inc.
J. C. Penney Company, Inc., through its subsidiary, J. C. Penney Corporation, Inc., operates department stores in the United States and Puerto Rico. The company sells family apparel and footwear, accessories, fine and fashion jewelry, beauty products, and home furnishings. It also provides various services, such as styling salon, optical, portrait photography, and custom decorating. The company also sells its products through its Internet Web site, jcp.com. J. C. Penney Company, Inc. has strategic alliance with Martha Stewart Living Omnimedia, Inc. As of December 7, 2011, it operated approximately 1,100 department stores. The company was founded in 1902 and is based in Plano, Texas.
Saks, Inc.
Saks Incorporated, together with its subsidiaries, operates fashion retail stores in the United States. Its stores offer a range of luxury fashion apparel, shoes, accessories, jewelry, cosmetics, and gifts. The
company operates stores under the brand name of Saks Fifth Avenue (SFA) that are principally free-standing stores in shopping destinations or anchor stores in upscale regional malls. It also operates Saks Fifth Avenue OFF 5TH (OFF 5TH) stores, which are primarily located in upscale mixed-use and off-price centers. As of July 5, 2011, the company operated 46 SFA stores and 57 OFF 5TH stores. Saks Incorporated also sells its products through catalogs or Internet at saks.com. The company was founded in 1919 and is headquartered in New York, New York.
Stein Mart, Inc.
Stein Mart, Inc. operates retail stores that offer fashion merchandise for women and men in the United States. The company’s stores provide fashion apparel, accessories, shoes, and home fashions. As of April 19, 2011, it operated a chain of 263 retail stores. The company was founded in 1908 and is headquartered in Jacksonville, Florida.
Macy’s Inc.
Macy’s, Inc., together with its subsidiaries, operates department stores and Internet Web sites in the United States. The company’s retail stores and Internet Web sites sell a range of merchandise, including men’s, women’s, and children’s apparel and accessories, cosmetics, home furnishings, and other consumer goods. It also operates Bloomingdale’s Outlet stores that offer various apparel and accessories, including women’s ready-to-wear, men’s, children’s, women’s shoes, fashion accessories, jewelry, handbags, and intimate apparel. The company operates Web sites, including macys.com and bloomingdales.com. As of November 09, 2011, it operated approximately 850 department stores under the names of Macy’s and Bloomingdale’s in 45 states, the District of Columbia, Guam, and Puerto Rico; and 7 Bloomingdale’s Outlet stores. The company was formerly known as Federated Department Stores, Inc. and changed its name to Macy’s, Inc. in June 2007. Macy’s, Inc. was founded in 1820 and is based in Cincinnati, Ohio.
Stage Stores, Inc.
Stage Stores, Inc. operates as a specialty department store retailer that offers branded and private label apparel, accessories, cosmetics, and footwear for women, men, and children in the United States. The company also offers sportswear, dresses, intimates, home and gift products, outerwear, swimwear, and other products. It primarily focuses on consumers in small and mid-sized markets. The company operates stores under the names of Bealls, Goody’s, Palais Royal, Peebles, and Stage. Stage Stores, Inc. also sells its products through its Web site. As of March 06, 2012, it operated 819 stores in 40 states. Stage Stores, Inc. is headquartered in Houston, Texas.
IV. VALUATION ANALYSIS
In general, the techniques, rules, and factors outlined in Revenue Ruling 59–60 can be categorized into three distinct and general approaches for valuing the stock of closely held companies. Professional appraisers will use various methods under these three approaches to estimate the value of closely held companies. Of course, the objective of using more than one approach is to develop mutually supporting evidence as to the conclusion of value.
While the specific titles of these three approaches may vary, the generic names are as follows:
| | • | | The income approach; and |
| | • | | The asset-based approach. |
In approaching the valuation of Belk, a variety of factors were taken into consideration, including: (1) the nature and history of the business, its current position and its outlook; (2) the general and relevant economic conditions prevailing at the valuation date; and (3) the conditions and outlook for the industry as of the valuation date.
After giving consideration to each of the three general valuation approaches, we determined that the most appropriate approaches for our valuation analysis are the market and income-based approaches.
We were unable to derive any meaningful indications of value from the asset-based approach because as an operating company, the value of Belk’s assets is most accurately represented by their ability to generate earnings. Therefore, the value of the Company’s assets is best estimated through the selected market and income-based approaches.
THE MARKET APPROACH
In the valuation of Belk, we employed two separate methods under the market approach. They are the guideline publicly traded company method and the previous transactions method. The following section outlines the theory and methodology, the calculations of and the conclusions of the two methods under the market approach.
Valuation Theory and Methodology: The Guideline Publicly Traded Company Method
It is often stated that values are best determined and tested in the marketplace. However, when valuing the shares of a closely held company, there is usually no such marketplace. One of the most fundamentally sound approaches for determining the value of closely held common shares is to look to the public market for evidence of prices investors are willing to pay for companies in the same-or similar-lines of business. Such a comparison to ‘guideline’ publicly traded companies is the basis of the guideline method.
The key steps to the guideline publicly traded company method are:
| | 1. | the identification of a set of guideline publicly traded companies; |
| | 2. | the calculation of market pricing multiples based upon the guideline companies’ quoted trading prices and financial fundamentals; |
| | 3. | the selection of appropriate market pricing multiples to be applied to the subject company’s financial fundamentals; |
| | 4. | the calculation of one or more indications of value for the subject company based upon the application of the selected market pricing multiples; |
| | 5. | the selection of the relative emphasis to be placed on each of the resulting indications of value; and |
| | 6. | the estimation of an overall indication of value from this method. |
Since the market pricing multiples used in this method are based on minority transactions in the public markets, the resulting indications of value are on a minority interest basis. Because we are valuing Belk on a minority interest basis, it was unnecessary to make any adjustments for control using this method.
We used a debt-free method in our guideline publicly traded company analysis. Debt-free valuation methods are commonly used in the valuation of closely held companies in order to minimize capital structure differences between a subject company and the guideline companies. The greater the differences between the companies’ capital structures, the more useful it is to use debt-free valuation methods.
Since these methods are based on economic cash flows that accrue to both debt and equity shareholders, they result in indications of value for a subject company’s total capital. For purposes of our analysis we refer to total capital as the market value of invested capital (“MVIC”), which is typically defined as follows:
|
| Market value of short-term interest-bearing debt |
| + Market value of long-term interest-bearing debt, including capitalized leases |
| + Market value of preferred stock outstanding |
| + Market value of common stock outstanding |
| = Market value of invested capital |
Since MVIC includes the value of both debt and equity, the market value of interest-bearing debt must be subtracted from MVIC in order to arrive at the indicated value of stockholders’ equity. As of January 28, 2012, interest-bearing debt, net of cash and equivalents was approximately $67.4 million.
We considered the following debt-free market pricing multiples in our guideline publicly traded company method analysis:
| | 1. | MVIC/ Earnings before interest and taxes (EBIT); |
| | 2. | MVIC/ Earnings before interest, taxes, depreciation, and amortization (EBITDA); |
| | 3. | MVIC/ Debt Free Net Income (DFNI); |
| | 4. | MVIC/ Debt Free Cash Flow (DFCF); and |
We considered these market pricing multiples based on two historical time periods; the latest 12-month period ending January 28, 2012 (the “LTM period”) and a three-year historical average.
Exhibit 9 A presents a summary of (1) Belk’s financial fundamentals, (2) the range of market pricing multiples calculated for the guideline companies, (3) the guideline public company pricing multiples selected to be applied to Belk’s financial fundamentals, (4) the resulting indications of value, and (5) the overall indication of value resulting from the guideline publicly traded company method.
Exhibits 10 A through 10 I present the calculation of the selected market pricing multiples for the guideline companies as well as certain underlying financial information. Exhibit 9 B compares the guideline publicly traded companies used in our analysis against Belk’s financials and operating figures.
The adjusted multiples were based upon consideration of differences in growth, size, risk, and profitability of the guideline companies relative to Belk. Exhibit 9 A summarizes the selection of the debt-free market pricing multiples as applied to Belk. In our opinion, a hypothetical willing buyer would
weigh the latest twelve months period and the three-year historical average period equally. Accordingly, we weighted 50 percent to the latest twelve month period and 50 percent to the three-year historical average.
As shown in Exhibit 9 A, the application of the selected debt-free market pricing multiples resulted in an indicated value for Belk’s MVIC of approximately $2.5 billion. In order to arrive at the indicated value of equity, it is necessary to subtract the interest-bearing debt. After subtracting the interest-bearing debt (net of cash and equivalents) of $67.4 million, the indicated market value of equity on a marketable, minority interest basis was approximately $2.4 billion.
Valuation Theory and Methodology: The Previous Transaction Method
The objective of our analysis is to estimate the fair market value of minority ownership interests in Belk. As part of our consideration of the value, we reviewed previous transactions in the Company’s stock to determine if any of the prior transactions would provide a meaningful indication of value.
Historically, there have been two avenues for achieving transaction-based liquidity for Belk shares: privately negotiated sales and repurchase offers by the Company. The history of these activities was outlined previously in Section II above.
The data show that the tender offers have consistently been undersubscribed, indicating that there was not as much pent-up interest in selling shares as Belk management and the Board had assumed. By the same token, the lack of privately negotiated transactions discussed below also indicates that there has been a lack of buyer interest in acquiring Belk shares historically. It appears that shareholders have used the tender offers as a valuation of price and wait until the Company tenders shares to reduce their holdings.
Arm’s length transactions between unrelated parties involving the subject company stock as of a date proximate to the valuation date can provide meaningful evidence of value if the transactions are timely and truly at arm’s length. Although one must consider prior sales of the Company’s stock as an indication of value, this is not always a reliable valuation method if: (1) the sales are rare or not timely; (2) the number of shares sold differ substantially from the shares to be valued currently; or (3) it is difficult to establish if the selling price to a related party or a family member is an arm’s length price. The details of stock transactions must be investigated to estimate whether they are true indicators of value. Caution should be exercised concerning whether a transaction was between parties who perceived similar benefits of control or lack thereof, relative to the subject block. One must also consider all of the terms of the
transaction.
Belk shares do not trade on any organized securities market. Historically, shareholders seeking to sell or buy shares typically contact the Company, which refers interested parties to a local stock broker in Charlotte who from time to time is able to match buyers and sellers. Because the trades are arranged by the broker as an intermediary, Belk shares have been assigned NASD trading symbols (for Class A and B shares) in the over-the-counter market under the ticker symbol BLKIA and BLKIB, for the Class A and B shares, respectively. Inquiries to the brokerage firms listed from time to time as making a market in Belk shares indicated that no significant inventories of shares are held by the brokerage firms and that trades are, essentially, arranged by linking buyers with sellers in very much the same historic manner in which Belk shares have previously traded.
Upon examining the trading data, we note that the Belk share trading prices were trending upwards during the period prior to the valuation date, reflecting the general improvement in United States equity securities markets and the retailer-department store stocks in particular during this period. Based upon the known terms of the transactions, and the timeliness of the most recent trades, we conclude that the evidence suggests a normative value of $30.65 per privately-marketable share as the starting point for the analysis of the fair market value of the subject shares, based on the sparse number of small block trades prior to the subject valuation date. As summarized on Exhibit 11 C, based on the 44.9 million shares outstanding and a price of $30.65 per share, the indicated market value of equity was $1.38 billion.
INCOME APPROACH
The income approach is based on the premise that the value of a company is equal to the present value of all the future expected economic income to be derived by the company’s shareholders.
All of the different income approach methods may be broadly categorized into the following:
| | 1. | those that rely on direct capitalization, and |
| | 2. | those that rely on yield capitalization. |
In direct capitalization analysis, the analyst estimates the appropriate measure of economic income for one period (i.e., one period future to the valuation date) and divides that measure by an appropriate in-vestment rate of return, or capitalization rate.
In yield capitalization analysis, the analyst projects the appropriate measure of economic income for several discrete time periods into the future. The projection of the prospective economic income is converted into a present value by the use of a present value discount rate, which is the investor’s rate of return or yield rate over the expected term of the economic income projection.
Company management provided us with financial projections for the fiscal years 2012 through 2017. Accordingly, we utilized the yield capitalization analysis. Specifically, we utilized the discounted cash flow method, as summarized in the succeeding paragraphs.
Discounted Cash Flow Method
The discounted cash flow (“DCF”) method is a well-recognized technique used to value companies on a going concern basis. It has intuitive appeal since it incorporates the risk/return perspective, which is so critical to the investment decision process.
The DCF method to valuation is based on the premise that the value of a closely held company is equivalent to the present value of the future economic income to be derived by the Company’s shareholders. This method requires an in-depth analysis of the subject company’s revenue, fixed and variable expenses, capital structure, and growth. The future net free cash flows of the Company are estimated and the present value of these cash flows, along with a residual (or terminal) value, is calculated based upon an appropriate present value discount rate.
Projected Financial Statements
The first step in the DCF method is to develop reasonable projections of income for Belk. The projections were provided by Belk’s management team. We evaluated these projected financial statements in detail and believe them to be a reasonable estimate of the Company’s future financial performance in light of its historical performance and current expectations for the industry. Belk’s projected income statements are depicted on Exhibit 7 and projected balance sheets on Exhibit 6.
Estimation of a Present Value Discount Rate
The second step in the DCF method is to estimate a present value discount rate that is appropriate for the Company’s future cash flows. The appropriate discount rate is Belk’s weighted average cost of capital (“WACC”). The WACC represents the weighted average of the cost of each of the components in the capital structure (i.e., debt and equity capital). These capital costs, expressed as required rates of return, are weighted according to an estimate of Belk’s market-value capital structure. The basic formula for
computing a company’s after-tax WACC is as follows:
| | | | |
WACC | | = | | (Ke x We) + (Kd[1—t] x Wd), where: |
| | |
WACC | | = | | Weighted average cost of capital |
Ke | | = | | Company’s cost of equity capital |
Kd | | = | | Company’s cost of debt capital |
We | | = | | Percentage of equity capital in the capital structure |
Wd | | = | | Percentage of debt capital in the capital structure |
t | | = | | Company’s effective income tax rate |
We estimated the Company’s cost of equity capital using the “build-up” and the adjusted capital asset pricing model (“CAPM”) methods. These methods incorporate various market rates of return and risk premia, including a risk-free rate, a long-term equity risk premium, a small stock risk premium, an industry risk premium, and an unsystematic risk premium. Each of these components is discussed below and is incorporated in Exhibits 5 A through 5 C within Appendix A.
The DCF method is inherently based upon a long-term investment horizon. Therefore, the appropriate risk-free rate is represented by a long-term government security. The yield to maturity of a U.S Treasury bond maturing on or about 20 years after the valuation date is the most appropriate risk-free rate since it best matches the longer-term operating horizon of the subject company. The stated yield on Treasury bonds maturing approximately 20 years from the valuation date was 2.71 percent.
The leading authority on equity risk premiums is Ibbotson Associates. Ibbotson Associates annually publishes a calculation of the long-term equity risk premium. This premium is calculated by subtracting the risk-free rate (20-year Treasury bonds) from the total annual rates of return on common stocks (using the Standard & Poor’s 500 Index as a proxy). According to Ibbotson, the supply side, arithmetic mean equity risk premium for the period 1926 through 2010 was approximately 6.0 percent.
Ibbotson Associates also calculates the difference between the total returns of all public companies and returns exhibited by smaller, more thinly capitalized companies. Ibbotson calculates the premiums and are segmented into deciles based on market capitalization. The fifth decile ranges from $1.8 billion to $2.5 billion. Since Belk’s equity value is easily within this range, it is appropriate to use the fifth decile’s size premium. According to the Ibbotson study, the appropriate premium to be applied to Belk reflected an
arithmetic mean annual return of approximately 1.81 percent above the overall equity risk premium exhibited by the S&P 500 common stock index.
Ibbotson also calculates industry risk premiums. According to Ibbotson, the industry risk premium for SIC Code 5311, Department Stores, was approximately 3.88 percent.
An additional unsystematic (i.e., company-specific) risk premium is often appropriate to reflect risks specific to an investment in a particular closely held company. An investment in Belk is subject to certain unsystematic risk factors (i.e., risks which are specific to Belk relative to the market as a whole). In our opinion a hypothetical willing buyer would incorporate an incremental risk premium of 2 percent based on factors summarized in Section II of this report. Our build-up method results in an estimated cost of equity capital of 16.4 percent. This represents a reasonable estimate of the rate of return that an informed investor would demand in return for an equity investment in the Company. The following table illustrates the cost of equity capital increments and the resulting cost of equity capital conclusion:
| | | | | | |
Build-up Method | |
| | |
| | Risk Free Rate [a] | | | 2.71% | |
+ | | Long term Equity Risk Premium [b] | | | 6.00% | |
+ | | Small Stock Risk Premium [c] | | | 1.81% | |
+ | | Industry Risk Premium [d] | | | 3.88% | |
| | | | | | |
| | |
= | | Market Cost of Equity | | | 14.40% | |
+ | | Company-Specific Risk Premium [e] | | | 2.00% | |
| | | | | | |
| | |
= | | Concluded Cost of Equity | | | 16.40% | |
In addition to calculating Belk’s cost of equity capital by the build-up method, we also utilized the adjusted CAPM to estimate an appropriate equity rate of return. Exhibit 5 C presents the calculation of the industry beta as based on the nine guideline publicly traded companies. We utilized the pure-play method of calculating beta based on data provided by Bloomberg. Based on this analysis, we determined that the median beta is approximately 1.37. The following table illustrates the cost of equity capital increments and the resulting cost of equity capital conclusion of 14.7 percent:
| | | | | | | | | | |
Adjusted Capital Asset Pricing Model | |
| | | |
| | Risk Free Rate [a] | | | | | | | 2.71% | |
| | | |
+ | | Long term Equity Risk Premium [b] | | | 6.00% | | | | | |
x | | Industry Beta [f] | | | 1.37 | | | | | |
| | | | | | | | | | |
+ | | Beta Adjusted Equity Risk Premium | | | | | | | 8.22% | |
+ | | Small Stock Risk Premium [c] | | | | | | | 1.81% | |
+ | | Company-Specific Risk Premium [e] | | | | | | | 2.00% | |
| | | | | | | | | | |
| | | |
= | | Concluded Cost of Equity | | | | | | | 14.74% | |
Based on a 16.4 percent cost of equity from the build-up method and a 14.74 percent cost of equity from the adjusted CAPM method, we determined that an appropriate cost of equity for Belk was the average of these two methods, and therefore we rounded the results to 15.6 percent.
We estimated Belk’s cost of debt capital to be 5.2 percent based on the average rate on Moody’s seasoned Baa Bonds as of the valuation date. After tax-affecting the pretax cost of debt at the Company’s estimated tax rate of 36.0 percent, we arrived at an after tax cost of debt capital of 3.3 percent.
The appropriate weights to accord to these costs of capital are the respective percentages of debt and equity in Belk’s capital structure (on a market value basis). From industry analysis, analysis of the guideline publicly traded companies, an iterative process, and from discussion with Company management, we determined a capital structure of 95 percent equity and 5 percent debt. Using the costs of capital estimated above, we determined Belk’s WACC to be approximately 15 percent. Our calculation of Belk’s WACC is presented in Exhibit 5 A.
DCF Method Calculations
The variables essential to our analysis, and the calculations of our DCF analysis, are outlined below.
Projections of Cash Flow
An investment horizon should reflect two primary factors: (1) the anticipated number of years over which a reasonable estimate of some form of earnings return can be forecasted from existing operations, and (2) the investment objectives of the ownership interest.
The Company’s projected financial statements are presented in Exhibits 6 and 7. We evaluated these projected financial statements in detail and believe them to be a reasonable estimate of the Company’s
future financial performance in light of its historical performance and current expectations for the industry.
Cash Flow Measure
For purposes of our analysis, the most relevant measure of cash flow is cash available for distribution to shareholders, above and beyond the Company’s normal cash requirements. This is often referred to as net cash flow (‘NCF’) and is typically calculated as follows:
|
Earnings before Interest and taxes (EBIT) |
– Taxes (assumed at 36 percent) |
+ Depreciation and Amortization |
– Capital Expenditures |
+ Operating Working Capital Additions |
= Net Cash Flow to Invested Capital (NCF) |
We calculated the Company’s NCF for projected fiscal years 2013 through 2017 based on the projected income statements. Further, depreciation and amortization, capital expenditures, and operating working capital additions were provided by Company management. Our calculations of NCF are presented in Exhibit 8.
Calculation of Present Value
As shown in Exhibit 8, we calculated the present value of the Company’s discrete NCF as $809.4 million. However, since the underlying premise of the DCF method is that of a going concern, it is logical to assume that Belk has value beyond projected fiscal year 2017. Therefore, our DCF analysis also incorporates a terminal value.
Effectively, a terminal value represents the amount for which a company could be sold at the end of the forecast period. Our terminal value calculation incorporates an estimated long-term growth rate of 4 percent, based on industry analysis and discussions with Company management. The terminal value was calculated based upon a standard constant growth model. This widely used method essentially estimates the value for which a company could be sold at the end of the forecasted period. Using the constant growth model we arrived at a present value for the Company’s terminal NCF of approximately $1.5 billion.
By combining the present value of the terminal cash flow with the present value of the discrete cash flows, we arrived at an indication of the Company’s MVIC of approximately $2.3 billion. After subtracting Belk’s net interest-bearing debt of approximately $67.4 million, the indicated value of common equity on a marketable, minority interest basis is approximately $2.3 billion.
THE ASSET-BASED APPROACH
We considered the asset-based approach for use in our analysis but did not rely on any of these methods in arriving at our estimate of value. We did not use any asset-based methods primarily because the value of Belk’s assets are best represented by the economic earnings those assets can generate and because of the difficulty inherent in discretely appraising all of Belk’s individual assets and liabilities.
V. VALUATION SYNTHESISAND CONCLUSION
We arrived at indications of the fair market value of Belk’s equity on a minority, publicly marketable basis through three generally accepted valuation methods: (1) the guideline publicly traded company method; (2) the previous share transaction method; and (3) the discounted cash flow method.
INDICATED EQUITY VALUE – DISCOUNTED CASH FLOWAND GUIDELINE PUBLIC COMPANY METHODS
The (1) guideline publicly traded company method and (2) DCF method indicated values are on a marketable, minority interest basis. These two methods were weighted equally to arrive at the publicly marketable common equity value of approximately $2.4 billion, as shown in the table below.
| | | | | | | | | | | | | | |
$ in 000s (except per share data and shares outstanding) Valuation Analysis | | Reference | | Indicated
Value [a]
$000 | | | Applicable
Weight [b] | | | Weighted
Value
$000 | |
| | | | |
Discounted Cash Flow (DCF) Method | | Exhibit 8 | | $ | 2,270,500 | | | | 50.0% | | | $ | 1,135,250 | |
| | | | |
Guideline Public Company (GPC) Method | | Exhibit 9 A | | | 2,443,600 | | | | 50.0% | | | | 1,221,800 | |
| | | | | | | | | | | | | | |
| | | | | | | | | 100.0% | | | | | |
Indicated Equity Value (Marketable Minority Interest Basis) | | | | | | | | | | | | | 2,357,050 | |
As previously noted, the (1) guideline publicly traded company method and (2) DCF method indicated values are on a marketable, minority interest basis. It is necessary to apply a discount for the relative lack of marketability inherent to the shares of Belk (see Appendix D for detailed analysis and discussion). The adjusted publicly marketable common equity value of $2.4 billion is discounted by 20 percent to reflect the lack of marketability. The magnitude of the discount is influenced, in part, by the size of the block of stock being valued, SEC restrictions, actual trading volume, and the prevailing macro-economic conditions as of the valuation date, the proposed tender offer, and the dividend distribution policy of the firm.
| | | | |
Indicated Equity Value (Marketable Minority Interest Basis) | | | 2,357,050 | |
| |
Less: Discount for Lack of Marketability of 20 percent [c] | | | (471,410 | ) |
| | | | |
| |
Indicated Equity Value from the DCF & GPC Methods [d] | | | 1,885,640 | |
The indicated equity value for Belk on a privately marketable, minority interest basis, as based on the DCF and guideline publicly traded company methods was approximately $1.9 billion.
Indicated Equity Value – Previous Transactions Method
The indicated per share value on a privately marketable, minority basis was $30.65 based on the most recent transaction. As summarized on Exhibit 11 C, based on the 44.9 million shares outstanding and a price of $30.65 per share, the indicated market value of equity was $1.4 billion.
CONCLUSION
We weighted the previous transaction method by 10 percent and the DCF and the guideline publicly traded company method by 90 percent. The reasons for weighting the previous transaction method 10 percent are as follows:
| | • | | Not all of the transactions can be clearly identified as arm’s-length; |
| | • | | The history of the trading indicates that investors tend to follow Willamette Management Associates’ valuations, and therefore trading values tend to be a lagging indicator of value; |
| | • | | The stock is thinly and scarcely traded. This calls into question whether there are an adequate number of participants to create reliable fair market values from trading prices; |
| | • | | No public securities analysts follow Belk stock; and |
| | • | | Over-the-counter market values appear to carry no or virtually no inventory of Belk stock. Therefore, market makers have little or no incentive to price Belk stock correctly for internal purposes. |
Upon placing the relative weightings, the indicated total equity value of Belk on a nonmarketable, minority ownership interest basis, as of January 28, 2012 was:
$1,834,745,000 or $40.80 Per Share
Based on 44,916,349 Shares Outstanding.
APPENDIX A – VALUATION EXHIBITS
APPENDIX B – INDUSTRY OVERVIEW
INDUSTRY OVERVIEW6,7,8,9
In the valuation process, the state of the industry in which Belk operates must be considered. The analyst must have an understanding of the factors that drive the industry. The following is an overview of the department stores industry in the United States.
THE DEPARTMENT STORES INDUSTRYINTHE U.S.
Operators in this industry are large scale department stores which retail a broad range of general merchandise, such as apparel, jewelry, cosmetics, home furnishings, general household products, toys, appliance, and sporting goods. Discount department stores, which are also included in this industry, retail similar lines of goods and services but at lower prices. Supercenters that offer fresh groceries in their stores and warehouse clubs that operate under membership programs are not included in this industry classification. Further, the primary role of this industry is in retailing a general line of merchandise. Major products and services in this industry are children’s wear, drugs and cosmetics, footwear, furniture and household appliances, men’s wear, toys and hobbies, and women’s wear.
IBISWorld estimates that the industry encompasses 308 businesses within the U.S. with estimated 2011 revenue of $187 billion dollars with profits around $7.1 billion. Over the past five years from 2006 to 2011, the industry has seen an average annualized decline of 4.2 percent. Market share in the U.S. is primarily focused upon five large companies: Wal-Mart Stores Inc. (27.8 percent market share), Sears Holdings Corporation (20.3 percent market share), Target Corporation (14.4 percent market share), Macy’s Inc. (14.1 percent market share), and J.C. Penney Corporation Inc. (9.5 percent market share). The department stores industry furthermore is highly competitive with moderate regulations, low revenue volatility, low industry globalization, and medium barriers to entry. The largest concentrations of firms in the U.S. reside in California (16.3 percent), New York (6.1percent), Florida (5.9 percent), Texas (5.7 percent), Illinois (5.3 percent), and Pennsylvania (4.6 percent).
According to IBISWorld, the subprime mortgage crisis and subsequent financial crisis and recession slowed growth in the industry over the past few years to 2011. A contraction of the industry has occurred because of a fall in demand for discretionary products due to weak consumer confidence and low
6 Department Stores in the US, IBISWorld, November 2011.
7 Industry Profile: Department Stores, First Research, October 2011.
8 Advance Monthly Sales for Retail and Food Services, U.S. Census Bureau News, January 12, 2012.
9 Industry Surveys, Retailing: General, Standard & Poor’s, November 24, 2011.
disposable income. Furthermore, in recent years, online retailers have emerged as a threat to traditional retail stores and outlets, stealing customers by offering convenience and low prices. Low demand has caused profits to plummet from 6.9 percent of sales in 2006 to an estimated 3.8 percent in 2011. However, these unfortunate circumstances have allowed discount department stores to thrive, because budget sensitive customers looked for value over luxury goods. Recent improvements in the market however are expected to curb the decline to just 0.8 percent from 2010 to 2011. Over the past five years, mergers and acquisitions and expansions of some large retailers into the food industry have shrunken the industry class to 308 operators an average annual decline of 3.6 percent. Fortunately, with higher expectations for the next five years to 2016, amid a recovering client sentiment, the industry’s revenue is forecast to increase at an average annual rate of 0.5 percent to total $192.1 billion.
First Research analyzes a more specific industry classification of department store retailers which includes about 20 companies with approximately 3,500 stores with combined annual revenue of about $60 billion. Major industry participants include Sears, J.C. Penny, Macy’s, and Dillard’s; with a high concentration of which the top eight companies yield over 95 percent of industry revenue. Globally the department store industry accounts for approximately $400 billion in sales annually, which also include Marks & Spencer (U.K.), El Corte Ingles (Spain), Galeries Lafayette (France), Tokyu Department (Japan), Galeria Kaufhof (Germany), and Debenhams (U.K.). For First Research, discount department stores are not included because traditional department stores have checkout registers within individual merchandise departments instead of a central checkout area.
INDUSTRY INDICATORS
| | • | | U.S. consumer spending on nondurable goods, an indicator of department store sales, rose 6.5 percent in October 2011 compared to the same month in 2010. |
| | • | | U.S. personal income, which indicates how much a consumer might spend at department stores, rose 3.9 percent in October 2011 as compared to the same month in 2010. |
| | • | | U.S. retail sales for general merchandise stores, a potential measure of consumer spending at department stores, increased 3.6 percent in the first eleven months of 2011 compared to the same period in 2010. |
| | • | | U.S. tourism spending on shopping, which impacts department store revenues, increased 6 percent in the second quarter of 2011 as compared to the same period in 2010. |
| | • | | U.S. retail and food services sales for December, adjusted for seasonal variation, holiday, and trading-day differences, but not for price changes, were $400.6 billion, an increase of 0.1 percent from the previous month and 6.5 percent above December 2010. Total sales for the 12 months of |
| | 2011 were up 7.7 percent from the same period a year ago in 2010. The October and November 2011 percent change was unrevised from 0.2 percent to 0.4 percent. |
| | • | | Retail trade sales were unchanged from November 2011 and 6.3 percent above 2010. Gasoline stations sales were up 8.9 percent from 2010 and non-store retailers’ sales were up 10.6 percent from 2010. |
KEY EXTERNAL DRIVERS
| | • | | Department stores rely heavily on the financial health of its customer base, including per capita disposable income. During the periods of low disposable income growth, consumers cut back on spending by delaying purchases or substituting costlier goods with inferior products. This is heavily influenced by the unemployment rate and the general economic environment. With periods of strong economy activity, disposable incomes rise. This driver is expected to increase slowly over 2012, creating a potential opportunity for the industry to recover margins and sales. |
| | • | | Department stores compete with a wide array of other industries due to the range in products and services they provide. Some of the industry’s largest competitors are big-box retail stores and supercenters, which offer similar products and services. Online retailers also pose significant competition to the industry with the increase in e-commerce. E-commerce allows customers to purchase products any time of day with convenience and access to a diversified database of reviews and options. This driver is expected to stay flat but remain high over 2012, representing a potential threat to the industry. |
| | • | | Consumer confidence levels determine the number and frequency of purchases among consumers. Low consumer confidence causes consumers to delay purchases or buy cheaper alternatives or merely necessities. In contrast, purchases increase as consumer confidence rebounds and sentiments change to less uncertain expectations of the future of the U.S. economy. This trend is expected to increase over 2012, showing improvement. |
| | • | | The unemployment rate which hovers around 9 percent is inversely correlated to demand for industry products. When unemployment rises, consumers will likely pinch pennies and generally reduce their spending at department stores. This driver is expected to decrease over 2012. |
| | • | | Population growth is an important component of industry growth. As the population increase, so does the industry’s customer base. Additionally, population growth in specific regions is an important indicator of future establishment growth because the number of stored is generally dependent on geographical area populations. This driver is expected to increase slowly over 2012. |
PRODUCTS, OPERATIONS, & TECHNOLOGY
Major products include apparel, cosmetics, footwear, and appliances. Apparel includes women’s, men’s, and children’s clothing. Cosmetics include makeup, skin care, hair care, and fragrances. Appliances include refrigerators, stoves, washers, dryers, and dishwashers. Companies may also sell kitchenware, bedding, towels, and sheets. Services include gift wrapping, delivery, appliance installation, and personal shopping.
National and regional chains dominate the industry. Store formats and merchandise selection depends on a company’s target market. For example, Neiman Marcus targets affluent shoppers, sells high-end designer apparel, and offers a convenience-based store design. Some companies lease space to independent companies to sell products requiring sales expertise, such as furs, designer handbags, and high-end cosmetics. Effective store layouts and eye-catching merchandise displays can generate complementary sales and impulse purchases. Companies may also have outlets to help sell excess inventory.
Most department stores are anchor tenants in large malls and a store’s presence is used to drive traffic. Companies consider demographics, population density, and lifestyle when selecting business locations. A typical Sears store averages 133,000 square feet, but some companies have flagship stores that can exceed 250,000 square feet. Average sales per square foot can vary: a Dillard’s store averages $110 per square foot while a typical J.C. Penney store averages $149 per square foot.
Because department stores deal with tens of thousands of stock keeping units (SKUs), effective supply chain management is critical to keeping costs low and supporting timely merchandising flow. Companies have extensive networks of warehouses and distribution centers to route products from suppliers to stores. Cross-docking facilities allow companies to unload and reallocate products in a single operation, minimizing storage costs. Dedicated distribution centers and call centers often support internet and catalog sales as well.
Department stores buy inventory from manufacturers, importers, and distributors, and may work with thousands of suppliers. While long-term supplier relationships are common, few companies have long-term contracts. Lead times can be long: buyers may place orders six to nine months in advance for apparel and shoes and three to six months in advance for handbags and jewelry.
Further, a large percentage of department stores merchandise is imported. Over 90 percent of apparel and footwear sold in the U.S. is imported from Mexico and China. Low-cost production has forced the majority of apparel and show manufacturing offshore. Buyers make purchasing decisions based on trends and historical sales, and may take preferences and climate into account. Companies may receive allowances from suppliers for markdowns and advertising.
Technology is very important in the industry. Information systems to manage functional areas, including sales, merchandising, purchasing, inventory control, distribution, finance, and accounting are key elements. Point-of-sale (POS) systems record sales transactions and process credit card orders. Merchandise planning systems help companies forecast demand and allocate merchandise across states. Inventory management systems monitor inventory levels and trigger replenishment orders. Electronic data interchanges (EDI) allows companies to process purchase orders more efficiently. While most department stores use bar codes to identify and track products through the supply chain process, some companies are using radio frequency identification devices (RFIDs) to monitor merchandise movement.
CURRENT SITUATION
Overview
The department stores industry has exhibited mixed performance trends in the five years to 2011; while some department stores have flourished, others have floundered. Operators in this industry are segmented into two distinct types: up-market department stores and their discount variety counterparts. Like most retail stores, traditional department stores have suffered from declining demand and rising competition, which reduced sales and hurt profitability. On the other hand, discount department stores have gained market share and thrived in the midst of the recession because consumer’s focused more on savings and lower-price points from luxury and high-end goods. Overall, the industry is expected to decline at an average annualized rate of 4.2 percent over the five years to 2011, with a 0.8 percent fall from 2010 to 2011 to make up a $187 billion industry.
Products and Services Segmentation
| | • | | Women’s Wear (21.1 percent) |
| | • | | Drugs and Cosmetics (16 percent) |
| | • | | Furniture and Household Appliances (16 percent) |
| | • | | Other Categories (12.6 percent) |
| | • | | Children’s Wear (11.4 percent) |
| | • | | Men’s Wear (10.2 percent) |
| | • | | Toys and Hobbies (8 percent) |
Major Market Segmentation
| | • | | Consumers aged 25-40 (35 percent) |
| | • | | Consumers aged 41-65 (30 percent) |
| | • | | Consumers aged under 25 (20 percent) |
| | • | | Consumers aged over 65 (15 percent) |
Critical Issues and Business Challenges
| | • | | Companies face intense competition from a wide variety of retailers: discount department stores, warehouse clubs, and specialty stores. Discount department stores have driven away sales to traditional department stores over the past five years. Warehouse stores sell basic items at rock-bottom prices, and specialty retailers provide better selections and service within particular categories. Further, private label apparel from all types of retailers has hurt department stores. |
| | • | | Consumer spending drives department stores sales, in which a large percentage of products are discretionary items. During tough economic times, consumers may cut back or shop at less expensive retailers. |
| | • | | Demand continues to be dependent as well on fashion trends, which drive the majority of sales in department stores. Fashion trends and fads can change quickly, leaving companies with inventory problems. Inability to predict trends and react quickly can result in unplanned markdowns or lost sales due to under forecasting. Stocking dated merchandise can also be affective in growing a company’s reputation, since most try to be as fashion-forward as possible. |
| | • | | Companies depend in this industry on economies of scale, particularly in purchasing, distribution, and marketing, to keep costs low and remain profitable. Competitive pricing pressure forces department stores to cut costs to maintain margins. Large companies can benefit from volume purchasing and shared resources among locations. Scale advantages have resulted in industry consolidation and the demise of small and midsized department stores. |
| | • | | Foreign manufacturers produce the majority of the apparel and footwear offered by department stores and thus political, economic instability and transportation delays can affect merchandise availability and devastate seasonal sales. Unfavorable exchange rates and changes in tariffs can |
| | also affect projected margins. A lengthy lead time requires planning to adequately deliver current trends and products to customers. |
| | • | | Highly seasonal trends, in which the fourth quarter generates the most significant sales and profits for the industry due to winter shopping, affects the industry. Most companies must spend extra to build inventory, hire additional staff, and increase advertising prior to peak selling periods. Accurate forecasting is crucial, since most holiday orders are made months in advance. In concert with this seasonality, weak holiday sales can be detrimental to a company’s entire fiscal year. |
| | • | | Lastly, high workforce turnover resulting from those who earn low wages affect the industry, and thus companies must consistently hire and train new workers, which can be time-consuming and costly. A constantly changing sales staff can result in customer service problems and irregularities in client experiences. |
Business Trends
| | • | | Off-mall locations to expand, developing stand-alone stores |
| | • | | Falling retail prices for apparel have forced department stores to rely on discounting and promotion |
| | • | | Industry consolidation leverages marketing and merchandising synergies |
| | • | | Fewer or smaller departments, focusing on apparel and fashion-related merchandise |
| | • | | Lifestyle and psychographic marketing focusing on key markets and demographics |
OUTLOOK
Over the five years to 2016 the industry is expected to recover slightly, driven by a rebound in consumer sentiment and disposable income, which were hit hard by the economic crisis and recession. With rising sales, profit margins are forecast to recover to about 6.1 percent of revenue by 2016, providing a much needed relief for industry participants. However, increased competition from online retailers is expected to place price pressures on industry operators, while even more players will transition to warehouse clubs and supercenters. Department stores depend entirely on consumer spending behavior because households account virtually for all of the industry’s demand. Through 2016, consumer confidence and per capita disposable income is forecast to increase an average 3.3 percent and 1.5 percent per year, respectively. IBISWorld expects traditional department stores to experience moderate revenue growth, whereas discount departments stores such as Wal-Mart and Target will feed off growth experienced from budget sensitive consumers who migrated from luxury, expensive goods during the past few years. Overall, the industry as a whole, as determined by estimates of IBISWorld, is forecast to improve over the five years
to 2016, with revenues growing at an average rate of 0.5 percent per year to $192.1 billion. In 2012 alone, moderate revenue growth of 1.2 percent will lead to industry sales of $189.3 billion.
First Research estimates that the industry, which may be more adequate considering a more specific industry classification, will have a more pessimistic, decline of 1 percent per annum on average between 2011 and 2016. Demand will continue to be driven by consumer spending and fashion trends. Industry participants will remain in need of good, quality merchandising and at risk for economic health changes affecting spending on non-essentials.
In all, look to an industry growth of an average annual rate of about 0.5 percent, with likely negative 1 percent growth, from 2011 to 2016 as the economy recovers and the industry faces its challenges and limited opportunities.
The Key Success Factors of this Industry will be:
| | • | | Ability to control stock on hand for seasonality and changes in preferences |
| | • | | Having an experienced workforce that is friendly, helpful, and provide excellent customer service |
| | • | | Ability to expand and curtail operations rapidly in line with market demand to remain competitive |
| | • | | Having an effective layout and design, good shelf management, friendly and helpful service, and a clean environment to maximize product presentation |
| | • | | Having a wide and expanding product range to better meet the needs of clientele and provide both personal and household goods under one roof |
APPENDIX C – U.S. ECONOMIC OUTLOOK
U.S. ECONOMIC OUTLOOK
In the valuation of any business interest, the valuation analyst should consider the general economic outlook as of the valuation date. This premise is based on the belief that the national economic outlook influences how investors perceive alternative investment opportunities at any given time.
In our analysis, we considered the general economic climate that prevailed at the end of 2011. This section contains an overview of some selected economic factors, followed by a discussion of those factors that are deemed critical over the long term. The topics addressed include general economic conditions, fiscal policy, consumer prices and inflation rates, employment growth and unemployment, interest rates, consumer spending, the stock markets, industrial production, and capital expenditures.
GENERAL ECONOMIC CONDITIONS
In the fourth quarter of 2011, the U.S. economy increased at a faster pace than in the prior quarter. In fact, the U.S. economy increased at its fastest pace in a year and a half. Gross domestic product (GDP) increased at an annual rate of 2.8 percent in the fourth quarter, according to advance estimates released by the Bureau of Economic Analysis. This followed a revised increase of 1.8 percent in the third quarter of 2011 and an increase of 1.3 percent in the second quarter of 2011. The economy has expanded for the past ten quarters.
The fourth quarter increase primarily reflected higher private inventory investment, personal consumption expenditures, residential and nonresidential fixed investments, and exports.
FISCAL POLICY
The federal government budget deficit was $320 billion for the first quarter of the government fiscal year (which ends September 30, 2012). This was $49 billion less than the deficit in the same period a year ago. Revenue was 4.2 percent higher than a year ago, while adjusted spending was 0.1 percent lower than a year ago.
Revenue from individual income and payroll taxes combined increased by 5.9 percent from the first quarter of fiscal 2011. Receipts of corporate income taxes increased by 51.2 percent from the first quarter of the prior fiscal year. Outlays decreased 0.1 percent (adjusted) from the same period in fiscal 2011 to $874 billion. This amount included $25 billion in spending for unemployment benefits. Outlays for
unemployment benefits for the first quarter of this government fiscal year decreased by 25.8 percent from the same period in the prior fiscal year.
The nation’s trade deficit increased in December 2011 to $48.8 billion (a six-month high), up from $47.1 billion in November. Imports increased to $227.6 billion, and exports increased to $178.8 billion. For the three months ended in December 2011, exports of goods and services averaged $178.5 billion, while imports averaged $224.8 billion, resulting in an average deficit of $46.3 billion.
MONETARY POLICY
At its meeting on December 13, 2011, the Federal Open Market Committee (FOMC) of the Federal Reserve Bank voted to maintain a target range for the federal funds rate of 0 to 0.25 percent. The discount rate charged on direct loans to banks remained at 0.75 percent. The FOMC indicated that it anticipates that the federal funds rate will remain at this low level until at least mid-2013. According to their statement, “While indicators point to some improvement in overall labor market conditions, the unemployment rate remains elevated. Household spending has continued to advance, but business fixed investment appears to be increasing less rapidly and the housing sector remains depressed.” The FOMC expects that longer-term inflation will remain stable.
CONSUMER PRICESAND INFLATION RATES
The Consumer Price Index (CPI) was unchanged in December 2011, on a seasonally adjusted basis. It was also unchanged in November. Energy costs decreased 1.3 percent and food costs were 0.2 percent higher. The core CPI, which excludes food and energy costs, increased by 0.1 percent in December and 0.2 percent in November. For the 12 months ended December 31, 2011, the CPI increased by 3.0 percent (not seasonally adjusted). The core CPI has increased 2.2 percent over the past 12 months.
The U.S. Import Price Index decreased by 0.1 percent in December 2011, following a 0.8 percent increase in November. Excluding petroleum, import prices in December 2011 increased 0.1 percent from November 2011. Petroleum prices decreased 0.5 percent in December but were 25.2 percent higher than a year ago. Export prices decreased 0.5 percent in December 2011 after increasing 0.1 percent in November. For the year ended December 31, 2011, import prices were up 8.5 percent, and export prices were up 3.6 percent.
The price index for personal consumption expenditures (PCE) increased 0.1 percent in December 2011, following a decrease of less than 0.1 percent in November. The core PCE price index (excluding food and energy) increased 0.2 percent in December following an increase of 0.1 percent in November.
EMPLOYMENT GROWTHAND UNEMPLOYMENT
Total nonagricultural employment increased by 200,000 in December 2011. Private sector employment increased by 212,000. Almost all sectors of employment added jobs in December.
The unemployment rate decreased in December to 8.5 percent, down from a high of 10 percent in December 2009. The unemployment rate is at its lowest point since February 2009.
Seasonally adjusted average hourly wages increased by $0.04 in December 2011 to $23.24. Average hourly earnings increased 2.1 percent over the year ended December 31, 2011. The average workweek increased by 0.1 hour to 34.4 hours in December 2011.
The Labor Department’s Employment Cost Index (ECI) increased 0.4 percent in the fourth quarter of 2011, on a seasonally adjusted basis. Wages and salaries increased 0.4 percent, and benefits increased 0.6 percent. In the prior quarter, wages and salaries increased 0.3 percent, and benefits increased 0.1 percent. For the year ended December 31, 2011, compensation costs increased 2.0 percent, the same as for the year ended December 31, 2010.
According to the December 2011 personal income and outlays report, personal income increased 0.5 percent and personal spending decreased less than 0.1 percent. In November, personal income increased 0.1 percent, while personal expenditures increased 0.1 percent. Core consumer prices (which exclude food and energy) increased by 0.1 percent in December 2011.
Americans’ personal savings rate (as a percentage of disposable income) was 4.0 percent in December 2011, higher than the 3.5 percent rate in November, and lower than in the third quarter of 2011.
Productivity in the nonfarm business sector—the amount of output per hour of work—increased at an annual rate of 0.7 percent in the fourth quarter of 2011. This followed a revised increase of 1.9 percent reported in the third quarter of 2011. From the fourth quarter of 2010 to the fourth quarter of 2011, productivity in the nonfarm business sector increased 0.5 percent.
Unit labor costs in the nonfarm business sector increased at an annual rate of 1.2 percent in the fourth quarter of 2011, after decreasing a revised 2.1 percent in the third quarter.
INTEREST RATES
On December 13, 2011, the Federal Reserve maintained the target range for the federal funds rate at between 0 and 0.25 percent. As of December 31, 2011, the prime lending rate remained at 3.25 percent. The prime rate is a benchmark for many consumer and business loans.
CONSUMER SPENDING
Consumer spending decreased less than 0.1 percent in December 2011, after a revised 0.1 percent increase in November. For the fourth quarter of 2011, consumers increased spending by an annual rate of 2.8 percent. This figure was lower than the 4.1 percent increase in the third quarter of 2011. Advance retail sales estimates were higher by 0.1 percent in December 2011, following a 0.4 percent increase in November. For the quarter ended December 31, 2011, retail sales increased 7.0 percent, on a seasonally adjusted basis, from the same period a year ago. The largest monthly sales increases were in building materials dealers, automobiles and auto parts, and clothing stores (1.6 percent, 1.5 percent, and 0.7 percent, respectively). Gasoline sales have increased 8.9 percent since December 2010. Sales of automobiles and auto parts have increased 8.8 percent since December 2010. Sales of electronics and appliances decreased 3.9 percent from November and were unchanged from December 2010. Sales, excluding automobiles, were 0.2 percent lower in December 2011 than in November 2011.
Consumer credit outstanding in December 2011 increased at an annual rate of 9.3 percent, or $19.3 billion, to $2.5 trillion, after increasing $20.4 billion in November. Credit card (revolving) debt increased by 4.1 percent, or $2.8 billion. Nonrevolving debt, such as automobile loans, increased by 11.8 percent, or $16.5 billion. Consumer borrowing does not include mortgages or other loans secured by real estate.
The Conference Board said its Consumer Confidence Index increased 9.3 points in December 2011 to 64.5, its highest level in eight months. The index increased moderately in November. A figure between 80.0 and 100.0 suggests slow growth, while a reading below 80.0 indicates a recession.
The University of Michigan Index of Consumer Sentiment increased in December 2011 to 69.9. The Index of Consumer Expectations was 63.6 in December, up from 55.4 in November 2011. “The improvement in the economic outlook was large, but still left the overall prospects for the economy at low levels. . . . While more consumers heard news of employment gains in December, they didn’t expect that
those gains would have much impact on the national unemployment rate in the months ahead,” according to the report.
CONSTRUCTION
Construction spending increased 1.5 percent in December 2011 to a seasonally adjusted annual rate of $816.4 billion. It was the largest increase in four months. Construction spending has increased 4.3 percent since December 2010. Construction spending in December was higher in some sectors of the construction industry (for example, health care, manufacturing, highways and streets, communication, to name a few). In other sectors (recreation, public safety, and lodging) spending was lower.
Private construction spending in December 2011 was at a seasonally adjusted annual rate of $529.7 billion, 2.1 percent above the revised November estimate. Residential construction was at a seasonally adjusted annual rate of $241.2 billion, 0.8 percent above the revised November estimate. Nonresidential construction was at a seasonally adjusted annual rate of $288.5 billion in December, 3.3 percent above the revised November estimate.
Public construction spending in December 2011 was $286.6 billion, 0.5 percent above the revised November estimate. Educational construction spending was 0.6 percent below the revised November figure, and highway construction was 1.8 percent above the revised November estimate.
For the year ended December 31, 2011, spending on residential construction increased 4.9 percent. New home construction starts decreased 4.1 percent in December 2011 to a seasonally adjusted annual rate of 657,000. The December 2011 figure was 24.9 percent higher than the revised December 2010 rate of 526,000. Single-family housing starts increased 4.4 percent from November, but multifamily (5 units or more) housing starts decreased 27.8 percent.
The issuance of building permits decreased 0.1 percent in December 2011, to 679,000 units. The rate was 7.8 percent higher than the revised December 2010 rate.
Sales of new single-family homes decreased 7.3 percent for the year ended December 31, 2011. In December, sales decreased 2.2 percent to an annual rate of 307,000 units. The November figure was 314,000, slightly higher than the October figure.
The median new home price in December decreased 2.6 percent from November to $210,300. This figure was 14.7 percent below the December 2010 figure. The inventory of new homes for sale increased to a 6.1-month supply in December.
In December 2011, sales of existing homes increased by 5.0 percent to a seasonally adjusted annual rate of 4.61 million units. Sales of existing homes in December 2011 were 3.6 percent above December 2010 sales. The median price of an existing home decreased 2.5 percent from a year earlier to $164,500. The inventory of unsold existing homes decreased by 9.2 percent to 2.38 million units in December 2011, a 6.2-month supply.
The total number of foreclosure filings in the fourth quarter of 2011 decreased 4 percent from the third quarter and decreased 27 percent from the same period a year earlier. Foreclosures in December 2011 decreased 9 percent from November to a 49-month low. Foreclosures decreased 20 percent from December 2010.
The nationwide average interest rate for a 30-year fixed rate mortgage for December 2011 was 3.96 percent, compared with 4.71 percent a year earlier, according to Freddie Mac. The nationwide average does not include add-on fees known as “points.”
THE STOCK MARKETS
The U.S. stock market indexes were less volatile in the fourth quarter than in the third quarter of 2011. For the quarter ended December 31, 2011, the Dow Jones Industrial Average (DJIA) increased 11.9 percent. For the year ended December 31, 2011, the DJIA was up 5.5 percent. The S&P 500 increased 11.1 percent for the quarter, but was essentially unchanged for the year ended December 31, 2011. The S&P Industrials finished the fourth quarter of 2011 with a 11.3 percent increase and the year ended December 31, 2011, with a 3.2 percent increase. The Nasdaq Composite Index finished higher by 7.8 percent for the quarter and lower by 1.8 percent for the year ended December 31, 2011.
The table below presents some historical data for the DJIA, S&P Industrials, S&P 500 Composite, and the Nasdaq Composite Indexes.
| | | | | | | | | | | | | | | | | | | | |
| | | 2010 | | | 2011 | |
| Index | | 12/30 | | | 3/25 | | | 6/24 | | | 9/30 | | | 12/30 | |
Dow Jones Industrial Average | | | 11,569.70 | | | | 12,391.25 | | | | 11,934.58 | | | | 10,913.38 | | | | 12,217.56 | |
| | | | | | |
S&P Industrials | | | 1,643.55 | | | | 1,726.35 | | | | 1,681.64 | | | | 1,522.61 | | | | 1,695.48 | |
P/E Multiple | | | 17.02 | | | | 17.06 | | | | 15.60 | | | | 14.26 | | | | 14.70 | |
Dividend Yield | | | 1.93 | | | | 1.94 | | | | 2.06 | | | | 2.27 | | | | 2.19 | |
| | | | | | |
S&P 500 Composite | | | 1,257.88 | | | | 1,313.80 | | | | 1,268.45 | | | | 1,131.42 | | | | 1,257.60 | |
P/E Multiple | | | 17.50 | | | | 17.03 | | | | 15.57 | | | | 13.91 | | | | 14.46 | |
Dividend Yield | | | 1.87 | | | | 1.92 | | | | 2.07 | | | | 2.33 | | | | 2.23 | |
| | | | | | |
Nasdaq Composite | | | 2,662.88 | | | | 2,743.06 | | | | 2,652.89 | | | | 2,415.40 | | | | 2,605.15 | |
Sources:Barron’s [1-3-11, 3-28-11, 6-27-11, 10-3-11, and 1-2-12] | |
INDUSTRIAL PRODUCTION
Industrial output at the nation’s factories, mines, and utilities increased by 0.4 percent in December 2011, after decreasing by 0.3 percent in November. For the fourth quarter of 2011 as a whole, total industrial production increased at an annual rate of 3.1 percent, after increasing 6.3 percent in the third quarter and 0.7 percent in the second quarter of 2011. Manufacturing production increased 0.9 percent in December after a 0.4 percent decrease in November. Utility output decreased 2.7 percent, and mining output was up 0.3 percent.
Capacity utilization at factories, mines, and utilities was at 78.1 percent in December 2011, 1.2 percent above its level a year ago. The utilization rate was 2.3 percentage points below its 1972–2010 average of 80.4 percent.
U.S. factory orders for manufactured goods increased in December 2011 by 1.1 percent, following a 2.2 percent increase in November. Orders in December totaled $466.2 billion.
Demand for durable goods increased 3.0 percent in December 2011, following a 4.2 percent increase in November. Orders for nondurable goods decreased by 0.4 percent in December after increasing by 0.6 percent in November.
The Institute of Supply Management (ISM) reported its Manufacturing Index registered 53.9 in December 2011, a 1.2 percent increase over November. A reading of 50 or more indicates the sector is expanding while a reading below 50 indicates manufacturing activity is contracting.
The ISM Prices Index for manufacturing materials was 47.5 in December 2011, up from 45.0 in November. This indicated that prices were increasing at a faster pace than in November. The ISM Prices Index measures inflationary pressures in the manufacturing sector.
The ISM Nonmanufacturing Index registered 52.6 in December 2011. The reading increased from 52.0 recorded in November. This reading indicates slightly faster growth in the nonmanufacturing sector. A number above 50.0 indicates expansion; less than 50.0 indicates contraction.
The Prices Index for the nonmanufacturing sector decreased to 61.2 in December 2011 from 62.5 in November, which reflected a slower increase in prices.
The U.S. Labor Department’s Producer Price Index (PPI) for finished goods decreased 0.1 percent in December 2011 on a seasonally adjusted basis, following an increase of 0.3 percent in November. The decrease was led by food prices, which decreased 0.8 percent. Excluding food and energy prices, the index increased 0.3 percent in December.
In November 2011 manufacturers’ and trade inventories increased 0.3 percent from October to a level of $1,550.1 billion. The total inventories-to-sales ratio was 1.27 in November 2011, 0.1 lower than a year ago.
CAPITAL EXPENDITURES
Real nonresidential fixed investment increased 1.7 percent in the fourth quarter of 2011, following a revised 15.7 percent increase in the third quarter of 2011.
Businesses increased their spending on equipment and software 5.2 percent in the fourth quarter of 2011, after increasing spending by a revised 16.2 percent in the third quarter of 2011.
Business investment in commercial structures decreased 7.2 percent in the fourth quarter of 2011. This followed a revised 14.4 percent rate of increase in the third quarter of 2011.
OUTLOOK
Most economists are predicting a continued slow economic recovery from the recession. The panelists of the National Association of Business Economics expect a moderate pace of growth through year-end 2012. They expect real GDP to grow at a modest pace of 2.4 percent in 2012, “with GDP in the second
half of 2012 slightly stronger than in the first half.” Factors supporting growth include strong business spending and an increase in housing starts. The panel expects corporate profits and stock prices to continue improving. They are concerned, however, about debt-related issues in Europe.
The participants in the bi-annualLivingston Survey expect sustained growth through the end of 2012. “They see the growth rate of economic output slowing to 2.1 percent (annual rate) in the first half of 2012, and they predict that it will then increase to 2.5 percent (annual rate) in the second half of the year. . . . The forecasters predict that real GDP will grow 2.6 percent annually over the next 10 years.”The Kiplinger Letter expects GDP growth around 2.0 percent in 2012. ValueLine expects growth of about 2.0 percent in 2012. And, the economists at Standard & Poor’s “expect the pace [of GDP growth] to slow to 1.5% in the first quarter of 2012, since government debt resurfaces with a vengeance.” S&P expects overall 2012 GDP growth to be 1.8 percent.
The NABE forecast panel is more confident in the sustainability of the economic recovery than it was in their last survey. The panel expects the unemployment rate to slowly improve, but they are still concerned about “excessive unemployment.” The economists at Standard & Poor’s are still concerned about high unemployment. They state: “Although private sector hiring is starting to pick up, the government is still cutting jobs. While it’s great to see the job numbers improve, the pace of growth is not enough to fill the jobs lost in the Great Recession.”
According to Standard & Poor’s, “It currently appears that global equity markets are likely to be kept in a trading range that is supported by improving economic conditions in the US and the prospects of a soft landing in China. However, restrained by uncertainty and austerity in Europe, history says be prepared for the opposite to be true: expect the 2012 equity market return to be sharply higher—or lower. We believe the odds favor a low double-digit move higher. . . .” ValueLine expects “a prospective profit gain of 11.0% in 2012” for the Dow Jones Industrial Average. They expect the average price of the Dow Jones to be 12,900 in 2012. TheLivingston Survey expects an increase in stock prices over the next two years. They expect the S&P 500 to increase to 1322.5 by the end of June 2012 and to 1395.0 by the end of the year.
The Federal Open Market Committee “continues to expect a moderate pace of economic growth over coming quarters and consequently anticipates that the unemployment rate will decline only gradually. . . . Strains in global financial markets continue to pose significant downside risks to the economic outlook.”
According to the NABE panel, “Housing starts are expected to increase 10 percent in 2012.” The National Association of Home Builders/Wells Fargo index of builder confidence “climbed to 21, the highest level since May 2010.” David Crowe, chief economist at the NAHB said, “This is the first time that builder confidence has improved for three consecutive months since mid-2009, which signifies a legitimate though slowly emerging upward trend.”
Sources: Congressional Budget Office, Monthly Budget Review; U.S. Bureau of Economic Analysis; Federal Reserve statistical releases and Federal Reserve press releases; U.S. Bureau of Labor Statistics; U.S. Census Bureau; Conference Board; Reuters/University of Michigan Surveys of Consumers; National Association of Realtors; RealtyTrac; Freddie Mac;Barron’s; ISM Report on Business; Bloomberg; National Association of Business Economics; Kiplinger Letter; The Livingston Survey; ValueLine; Bloomberg BusinessWeek; and Standard & Poor’sTrends & Projections.
APPENDIX D – DISCOUNTFOR LACKOF MARKETABILITY
DISCOUNTFORLACKOF MARKETABILITY
OVERVIEW
All other things being equal, an equity investment in a company is worth more if it is readily marketable or, conversely, worth less if it is not. It is well known that investors prefer liquidity to lack of liquidity, and interests in closely held companies are illiquid relative to most other investments.
The problem that the appraiser of closely held companies must solve, of course, is to quantify the effect of marketability, or lack of it, in terms of its impact on the value of a company’s stock. In many valuations of closely held company stock, the discount for lack of marketability turns out to be the largest single issue to resolve—and an important issue in almost all such valuations.
The Concept and Importance of Marketability
The concept of marketability deals with the liquidity of an asset—that is, how quickly and certainly it can be converted into cash at the owner’s discretion. The rationale of a discount for lack of marketability was quite clearly articulated in 1983 by Lawrence H. Averill Jr., Dean of the School of Law of the University of Arkansas at Little Rock:
The lack of marketability problem is inherent in the valuation of all business interests that are not actively traded on recognized markets. The poor marketability of non-traded business interests stems from several factors. First, most of these businesses are small, family-owned and run operations. Such businesses run great risk of failure. The greater the risk, the lower the value. Second, these interests lack liquidity. There is no large pool of potential buyers for these interests when they come on the market. The longer it takes to sell an asset, the lower the value will be as compared to more actively tradable assets. Such a business interest must be sold at a substantial discount in order to attract buyers, as recognized by court decisions. The actual amount of the discount, of course, will vary from situation to situation.10
Benchmark for Discounts for Lack of Marketability
For a “discount” to have a precise meaning, there must be a precise definition of the level of value from which the discount is taken. Since minority interests in closely held companies are typically valued by some form of reference to prices of actively traded securities (market multiples, market-derived discount
10 Lawrence H. Averill Jr.,Estate Valuation Handbook (New York: John Wiley & Sons, 1983), p. 177.
rates, etc.), the benchmark for marketability for minority interest securities normally is considered to be the active public securities markets.
In the U.S. public markets, a security holder is able to sell a security over the telephone in seconds, usually at or within a small fraction of a percent of the last price at which a security traded, with a very small commission cost, and receive the cash proceeds within three to five business days.
By contrast, the universe of realistically potential buyers for most closely held minority securities is an infinitesimally small fraction of the universe of potential buyers for publicly traded securities. In any case, it isillegalfor a person or a company to sell closely held securities to the general public without a registration with either the Securities Exchange Commission (SEC) or the state corporation commission, an expensive and time consuming process. Furthermore,a minority stockholder cannot register stock for public trading; only the company can register its stock for public trading.
Besides the problems of actually trying to sell the stock (and because of them), the liquidity of closely held stock is further impaired by banks and other lending institutions’ unwillingness to accept it as loan collateral as they would accept public stock.
Because of these extreme contrasts between the ability to sell or hypothecate closely held minority stock as compared with publicly traded stock, empirical evidence suggests that discounts for lack of marketability for minority interest, closely held stocks tend to cluster in the range of 35 to 60 percent from their publicly traded counterparts. Naturally, each situation must be analyzed on the basis of its individual facts and circumstances, which may in some cases, justify a discount for lack of marketability above or below this typical range.
Empirical Evidence for Quantification of Discounts
There have been two general types of empirical studies designed to quantify the discounts for lack of marketability for minority interests in closely held companies:
| | 1. | discounts on sales of restricted shares of publicly traded companies, and |
| | 2. | discounts on private transactions prior to public offerings. |
As noted earlier, the above sources of empirical data indicate that the base from which to take the discount in each case is the actual or estimated price at which the shares could be sold if registered and freely traded in a public trading market.
The following sections summarize the findings of these two very extensive lines of empirical evidence. As will be explained in detail, the second line of studies provides more relevant evidence of the appropriate discount for lack of marketability for closely held stocks.
Sales of Restricted Shares of Publicly Traded Companies
Studies of sales of the restricted shares of publicly traded companies specifically isolate the value of the factor of marketability from all other factors. Restricted stock is identical in all respects to the freely traded stock of a public company, except that it is restricted from trading on the open market for a certain period. The duration of the restrictions varies from one situation to another. Since marketability is the only difference between the restricted stock and its freely traded counterpart, analysts have attempted to find differences in the price at which restricted stock transactions take place compared with open market transactions in the same stock on the same date. This difference provides evidence on the price spread between a readily marketable security and one that is identical but subject to certain restrictions on its marketability.
Publicly traded companies frequently issue restricted, or “letter,” stock in making acquisitions or raising capital, because the time and cost of registering the new stock with the SEC would make a registration at the time of the transaction impractical. Also, founders or other insiders may own portions of a publicly traded company’s stock that has never been registered for public trading. Even though such stock cannot be sold to the public on the open market, it may be sold in private transactions under certain circumstances. Until 1995, such transactions usually had to be reported to the SEC and thus became a matter of public record. Since then, analysts have collected such transaction data from private sources. Therefore, there is available a body of data on the prices of private transactions in restricted securities that can be used for comparison with prices of the same but unrestricted securities eligible for trading on the open market.
SECAccounting Release No. 113 specifically points out that the discount for lack of marketability frequently is substantial:
Restricted securities are often purchased at a discount, frequently substantial, from the market price of outstanding unrestricted securities of the same class. This reflects the fact that securities which cannot be readily sold in the public market are less valuable than securities which can be sold, and also the fact that by the direct sale of restricted securities, sellers avoid the expense, time and public disclosure which registration entails.11
It is exceedingly important to keep in mind that restrictions on the transfer of restricted stock eventually lapse, usually within 12 months.12 At that point, investors can sell the shares into the existing market, subject to whatever volume and SEC Rule 144 may impose other restrictions.13 Consequently, all other things being equal, shares of closely held stock, which may never have the benefit of a public market, would be expected to require higher discounts for lack of marketability than those applicable to restricted stock of a public company. The market does, indeed, impose a higher discount on closely held stock than on restricted stock of a public company, as will be shown below.
SEC Institutional Investor Study
In a major SEC study of institutional investor actions, one of the topics was the amount of discount at which transactions in restricted stock took place compared to the prices of identical but unrestricted stock on the open market.14
The SEC study found an average discount of 28.8 percent for all transactions of restricted stock compared to their unrestricted counterpart stock. In addition, the study found generally higher discounts for restricted stocks that would trade on the over-the-counter market (OTC) once the restrictions expired, as opposed to stocks that would trade on the New York Stock Exchange (NYSE) or the American Stock Exchange (ASE). The average discount for stocks that would trade on the OTC when their restrictions expired was approximately 32.6 percent.
11 Securities and Exchange Commission,Accounting Series Release No. 113: Statement Regarding Restricted Securities (Chicago: Commerce Clearing House, Federal Securities Law Reports, 1977), pp. 62, 285.
12 On February 18, 1997, the SEC adopted amendments to reduce the holding period requirements under Rule 144 of the Securities Act from two years to one year for the resale of limited amounts of restricted securities. Most of the studies cited in this report, which are the most current studies available, were conducted prior to this amendment.
13 55 Fed. Reg. 20894 (May 21, 1990).
14 “Discounts Involved in Purchases of Common Stock,” in U.S. 92nd Congress, 1st Session, House,Institutional Investor Study Report of the Securities and Exchange Commission, (Washington: Government Printing Office, March 10, 1971, 5:2444–2456, Document No. 92–64, Part 5).
The Internal Revenue Service (the “Service”), in Revenue Ruling 77–287, specifically acknowledges the conclusions of the SECInstitutional Investor Study and the values of restricted securities purchased by investment companies as part of the “relevant facts and circumstances that bear upon the worth of restricted stock.” The Service states the purpose of Revenue Ruling 77–287 as: “to provide information and guidance to taxpayers, [Service], and others concerned with the valuation, for Federal tax purposes, of securities that cannot be immediately resold because they are restricted from resale pursuant to Federal security laws.”15
One of the outgrowths of the SECInstitutional Investor Studywas SECAccounting Series Releases, No. 113, dated October 13, 1969, andNo. 118, dated December 23, 1970, which require investment companies registered under the Investment Company Act of 1940 to disclose their policies for the cost and valuation of their restricted securities. The result was that an ongoing body of data became available on the relationship between restricted stock prices and their freely tradable counterparts, which can provide empirical benchmarks for quantifying marketability discounts.
Gelman Study
In 1972, EFG FLP Gelman published the results of his study of prices paid for restricted securities by four closed-end investment companies specializing in restricted securities investments.16 From 89 transactions between 1968 and 1970, Gelman found that both the arithmetic average and median discounts were 33 percent and that almost 60 percent of the purchases were at discounts of 30 percent and higher.
Trout Study
In a study of restricted stocks purchased by mutual funds from 1968 to 1972, Robert Trout attempted to construct a financial model that would provide an estimate of the discount appropriate for a private company’s stock.17 His multiple regression model included 60 purchases and found an average discount of approximately 33.5 percent for restricted stock compared to its freely traded counterpart stock.
As the SEC study showed, he also found that companies with stocks listed on national exchanges had lower discounts on their restricted stock transactions than did stocks traded over-the-counter.
15 Revenue Ruling 77–287, 1977–2 C.B. 319, Section I.
16 EFG FLP Gelman, “An Economist-Financial Analyst’s Approach to Valuing Stock of a Closely Held Company,”Journal of Taxation, June 1972, pp. 353–4.
17 Robert R. Trout, “Estimation of the Discount Associated with the Transfer of Restricted Securities,”Taxes, June 1977, pp. 381–5.
Moroney Study
In an article published in the March 1973 issue ofTaxes, Robert E. Moroney presented the results of his study of the prices paid for restricted securities by 10 registered investment companies.18 The study reflected 146 purchases. The average discount was approximately 35.6 percent and the median discount was 33.0 percent.
Moroney points out:
It goes without saying that each cash purchase of a block of restricted equity securities fully satisfied the requirement that the purchase price be one, “at which the property would change hands between a willing buyer and a willing seller, neither being under any compulsion to buy or sell and both having reasonable knowledge of relevant facts.” Reg. Sec. 20.2031–1(b)19
Moroney contrasts the evidence of the actual cash transactions with the lower average discounts for lack of marketability adjudicated in most prior court decisions on gift and estate tax matters. He points out, however, that the evidence on the prices of restricted stocks was not available as a benchmark for quantifying lack of marketability discounts at the times of the prior cases, and he suggests that higher discounts for lack of marketability be allowed in the future now that the relevant data are available. As Moroney puts it:
Obviously the courts in the past have overvalued minority interests in closely held companies for federal tax purposes. But most (probably all) of those decisions were handed down without benefit of the facts of life recently made available for all to see.
Some appraisers have for years had a strong gut feeling that they should use far greater discounts for non-marketability than the courts had allowed. From now on those appraisers need not stop at 35 percent merely because it’s perhaps the largest discount clearly approved in a court decision. Appraisers can now cite a number of known arm’s-length transactions in which the discount ranged up to 90 percent.20
18 Robert E. Moroney, “Most Courts Overvalue Closely-Held Stocks,”Taxes, March 1973, pp. 144–56.
19 Ibid.,. p. 151.
20 Ibid.,. p. 154.
Maher Study
Another well-documented study on discounts for lack of marketability for closely held companies was done by J. Michael Maher and published in the September 1976 issue ofTaxes.21 Maher’s approach was similar to Moroney’s in that it compared prices paid for restricted stocks with the market prices of their unrestricted counterparts. He found that mutual funds were not purchasing restricted securities during 1974 and 1975, which were very depressed years for the stock market. Therefore, the data actually used covered the five-year period from 1969 through 1973. The study showed that “the mean discount for lack of marketability for the years 1969–73 amounted to 35.43 percent.”22 He further eliminated the top and bottom 10 percent of purchases in an effort to remove especially high- and low-risk situations. The result was almost identical with the “outliers” removed, with a mean discount of 34.73 percent.
Maher concludes:
The result I have reached is that most appraisers underestimate the proper discount for lack of marketability. The results seem to indicate that this discount should be about 35 percent. Perhaps this makes sense because by committing funds to restricted common stock, the willing buyer (a) would be denied the opportunity to take advantage of other investments, and (b) would continue to have his investment at the risk of the business until the shares could be offered to the public or another buyer is found.
The 35 percent discount would not contain elements of a discount for a minority interest because it is measured against the current fair market value of securities actively traded (other minority interests). Consequently, appraisers should also consider a discount for a minority interest in those closely held corporations where a discount is applicable.23
Standard Research Consultants Study
In 1983, Standard Research Consultants (SRC) analyzed private placements of common stock to test the current applicability of the SEC study.24 SRC studied 28 private placements of restricted common stock from October 1978 through June 1982. Discounts ranged from 7 percent to 91 percent with a median of 45 percent.
21 J. Michael Maher, “Discounts for Lack of Marketability for Closely-Held Business Interests,”Taxes, September 1976, pp. 562–71.
22 Ibid., p. 571.
23 Ibid., p. 571.
24 “Revenue Ruling 77–287 Revisited,”SRC Quarterly Reports, Spring 1983, pp. 1–3.
Willamette Management Associates Study
Willamette Management Associates analyzed private placements of restricted stocks for the period of January 1, 1981, through May 31, 1984. The early part of this unpublished study overlapped the last part of the SRC study, but very few transactions took place during the period of overlap. Most of the transactions in the Willamette Management Associates study occurred in 1983.
Willamette Management Associates identified 33 transactions during that period that could be reasonably be classified as arm’s-length and for which the price of the restricted shares could be compared directly with the price of trades in identical but unrestricted shares of the same company at the same time. The median discount for the 33 restricted stock transactions compared to the prices of their freely tradable counterparts was 31.2 percent.
The slightly lower average percentage discounts for private placements during this time may be attributable to the somewhat depressed prices in the public stock market, which in turn reflected the recessionary economic conditions prevalent during most of the period of the study.
Silber Study
In a 1991 article in theFinancial Analysts Journal, William L. Silber presented the results of analysis of 69 private placements of common stock of publicly traded companies between 1981 and 1988.25 He found that the average discount was 33.75 percent, very consistent with earlier studies.
He also found that the size of the discount tended to be higher for private placements that were larger as a percentage of the shares outstanding. He found a small effect on the discount on the basis of the size of the company as measured by revenues. “Tripling the revenues from the sample mean of $40 million to $120 million increases the relative price of the restricted shares by only 2.9 points (from 71.7 to 74.6).”26
FMV Study
In an effort to update the SECInstitutional Investor Study, FMV Opinions, Inc., examined restricted stock transactions from 1979 through April 1992.27 This analysis of over 100 transactions resulted in a mean discount of approximately 22.3 percent, providing additional support to the SECInstitutional Investor Study.
25 William L. Silber, “Discounts on Restricted Stock: The Impact of Illiquidity on Stock Prices,”Financial Analysts Journal, July–August 1991, pp. 60–64.
26Ibid., p. 64.
27Lance S. Hall and Timothy C. Polacek, “Strategies for Obtaining the Largest Discounts,”Estate Planning, January/February 1994, pp. 38–44.
The FMV study also examined the relationship between the discount and several factors including: the market value of the block of restricted stock, the percentage size of the block, and the total market value of the subject corporation. According to the study, the discount for lack of marketability was higher for smaller capitalization companies, and for larger percentage blocks of stock.
Management Planning Study
Management Planning, Inc., performed a study titled “Analysis of Restricted Stocks of Public Companies: 1980–1996,” which covered a total of 53 transactions after elimination of transactions for various factors. The elimination factors included: (1) companies that suffered a loss in the fiscal year preceding the private transaction; (2) companies defined as “start-up” companies (i.e., companies having revenues of less than $3 million); and (3) transactions that were known to have registration rights. Their study found an average price discount of 27.1 percent.
Columbia Financial Advisors, Inc., Studies
Columbia Financial Advisors, Inc. (CFAI) conducted a study of the sale of restricted securities over the period January 1, 1996, through April 30, 1997. The transactions were pulled from Securities Data Corporation’sU.S. New Issues private placement database. A total of 123 private placements were included in this database for the period of time chosen. A total of 100 transactions were eliminated for various reasons, leaving 23 transactions for the study. The discounts ranged from 0.8 to 67.5 percent for all 23 transactions with an average of approximately 21 percent and a median of 14 percent.
These discounts are generally lower than the discounts recorded in the earlier studies discussed above. One explanation for this is the increase in volume of privately placed stock (Rule 144(a)) in the past several years. Also, it was known at that time that a change in the holding period required by the SEC from two years to one year was scheduled to take place as of April 29, 1997.
Using the same methodology and sources discussed above, CFAI conducted another study in an attempt to identify the impact of the increased liquidity resulting from the change in the holding period required by the SEC. They examined private common equity placements during the period January 1, 1997, through December 31, 1998. There were a total of 270 private placements of common stocks during that time. A total of 255 transactions were eliminated for various reasons, leaving 15 transactions for the study. The discounts ranged from 0 to 30 percent for the 15 transactions, with an average of approximately 13 percent and a median of 9 percent.
These discounts are generally lower than those indicated in the earlier CFAI study. This is most likely due to the change in the holding period required by the SEC from two years to one year.
Summary of Restricted Stock Studies
The 13 independent studies of restricted stock transactions reported above cover several hundred transactions spanning the late 1960s through 1998. The results of these studies are summarized below:
| | | | |
Study | | Years Covered in Study | | Average
Discount |
| | |
SEC Overall Average | | 1966–69 | | 25.8% |
SEC Nonreporting OTC Companies | | 1966–69 | | 32.6% |
EFG FLP Gelman | | 1968–70 | | 33.0% |
Robert R. Trout | | 1968–72 | | 33.5% |
Robert E. Moroney | | 1969–72 | | 35.6% |
J. Michael Maher | | 1968–73 | | 35.4% |
Standard Research Consultants | | 1978–82 | | 45.0% |
Willamette Management Associates | | 1981–84 | | 31.2% |
William L. Silber | | 1981–88 | | 33.8% |
FMV Opinions, Inc. | | 1979–92 | | 23.0% |
Management Planning, Inc. | | 1980–96 | | 27.1% |
Columbia Financial Advisors, Inc. | | 1996–97 | | 21.0% |
Columbia Financial Advisors, Inc. | | 1997–98 | | 13.0% |
In many of the cases of restricted stock transactions as presented above, the purchaser of the stock had the right to register the stock for sale in the existing public market. Sometimes investors get a commitment from the issuer to register the securities at a certain future date. Sometimes investors have “demand” rights, where they can force the issuer to register the securities at a time of their choosing. Sometimes they get “piggyback” rights where there is no obligation other than to include the securities on any future registration that the issuer undertakes. And sometimes the purchaser has to rely on Rule 144, where they can sell after one year (previously two years) if other parts of the rule are followed. In recent years, more transactions have occurred under Rule 144(a), which relaxes some of the restrictions on such transactions, thus making the restricted securities more marketable. In any case, they generally expect to be able to resell the stock in the public market in the foreseeable future. As one would expect, as the holding period has decreased and as activity in the private placement market has increased, the discounts indicated from these studies have decreased.
Private Transactions Prior to Public Offerings
Before the 1980s, virtually all the empirical research directed at quantifying the value of ready marketability, or the discount for lack of it, focused on comparisons between the prices of freely tradable
shares of stock and restricted but otherwise identical shares of stock. Observers agreed that discounts for lack of marketability for shares of closely held companies were greater than those for restricted shares of publicly held companies, since the closely held shares had no established market in which they could eventually sell following the removal of certain trading restrictions. However, data for quantifying how much greater this discount should be had not yet been developed and analyzed.
During the 1980s, an investment banking firm and a business valuation firm independently undertook development of data with which to address this question. The research proceeded along basically parallel lines, although each firm was unaware of the other’s efforts until their respective research was far along and each had enough data to reach some conclusions.
Both firms utilized data from registration statements—forms that companies must file with the SEC prior to offering securities to the public. Each of the series of studies reported in the following sections used data from these forms to analyze prices of private transactions relative to the prices of subsequent public offerings in the stock of the same companies.
Robert W. Baird & Co. Studies
A number of studies were conducted under the direction of John D. Emory, vice president of appraisal services at Robert W. Baird & Company, a large, regional investment-banking firm headquartered in Milwaukee, Wisconsin.28 The studies covered various time periods from 1980 through 2000.29 The basic methodology for the studies was identical. The population of companies in each study consisted entirely of initial public offerings during the respective period in which Baird & Company either participated in or received prospectuses. The prospectuses of these 4,088 offerings were analyzed to determine the relationship between the price at which the stock was initially offered to the public and the
28 Mr. Emory is no longer with Robert W. Baird & Co., but is now president of Emory Business Valuation, LLC.
29 John D. Emory, “The Value of Marketability as Illustrated in Initial Public Offerings of Common Stock—January 1980 through June 1981,”Business Valuation News, September 1985, pp. 21–24, also inASA Valuation, June 1986, pp. 62–66; “The Value of Marketability as Illustrated in Initial Public Offerings of Common Stock, January 1985 through June 1986,”Business Valuation Review, December 1986, pp.12–15; “The Value of Marketability as Illustrated in Initial Public Offerings of Common Stock (August 1987–January 1989),”Business Valuation Review, June 1989, pp. 55–57; “The Value of Marketability as Illustrated in Initial Public Offerings of Common Stock, February 1989–July 1990,”Business Valuation Review, December 1990, pp. 114–16; “The Value of Marketability as Illustrated in Initial Public Offerings of Common Stock, August 1990 through January 1992,” Business Valuation Review, December 1992, pp. 208–212; “The Value of Marketability as Illustrated in Initial Public Offerings of Common Stock, February 1992 through July 1993,”Business Valuation Review, March 1994, pp. 3–5; “The Value of Marketability as Illustrated in Initial Public Offerings of Common Stock, January 1994 through June 1995,”Business Valuation Review, December 1995, pp. 155–160; “The Value of Marketability as Illustrated in Initial Public Offerings of Common Stock, November 1995 through April 1997,”Business Valuation Review, September 1997, pp. 123–131; “The Value of Marketability as Illustrated in Initial Public Offerings of Common Stock, May 1997 through December 2000,”Business Valuation Review, December 2001, pp. 4-20.
price at which the latest private transaction took place up to five months prior to the initial public offering. Emory gives the following explanatory statements regarding the studies:
In all cases, the transactions were to have been at fair market value and ultimately would have had to be able to withstand judicial review, particularly in light of the subsequent public offering. The transactions took one of two forms—either the granting of options to purchase common stock, or the direct sale of common stock.
In order to provide a reasonable comparison between the fair market value of stock prior to an initial public offering and the subsequent offering price, we felt it necessary both for the company to have been financially sound prior to the offering, and for the transaction to have occurred within a period of five months prior to the offering date.
Following the above guidelines, and after eliminating development-stage companies (those with a history of operating losses) and companies with no transactions within five months prior to the initial public offering, 593 qualifying transactions were included in the studies.
The mean price discount for the 593 transactions was 47 percent and the median price discount was 48 percent. The fact that these averages are a little more than 10 to 15 percentage points greater than those indicated by the above-mentioned restricted stock studies is about what one might reasonably expect, since the transactions occurred when there was not yet any established secondary market for the subject stock. A summary of the results of each of the Baird initial public offering studies is presented below.
| | | | | | | | |
| | | Prospectuses | | Qualifying | | Indicated Discount |
| Study | | Reviewed | | Transactions | | Mean | | Median |
| | | | |
1980–1981 | | 97 | | 13 | | 60% | | 66% |
1985–1986 | | 130 | | 21 | | 43% | | 43% |
1987–1989 | | 98 | | 27 | | 45% | | 45% |
1989–1990 | | 157 | | 23 | | 45% | | 40% |
1990–1991 | | 266 | | 35 | | 42% | | 40% |
1992–1993 | | 443 | | 54 | | 45% | | 44% |
1994–1995 | | 318 | | 46 | | 45% | | 45% |
1995-1997 | | 732 | | 91 | | 43% | | 42% |
1997-2000 | | 1,847 | | 283 | | 50% | | 54% |
Overall through 2000 | | 4,088 | | 593 | | 47% | | 48% |
Emory concludes with the following observations:
Since a public offer often takes four or five months from conception to completion, the above transactions mentioned in the prospectuses in our study would almost certainly have reflected the likelihood of marketability in the next half-year. This is not unlike the marketability situation for the blocks of securities being purchased with registration rights by registered investment companies in the 1960s and early 1970s. In both of these situations the companies were promising in nature, and their securities had good potential for becoming readily marketable. . . .
The final question to be answered is that if these kinds of discounts are appropriate for promising situations where marketability is probable, but not a certainty, how much greater should discounts be for the typical company’s stock that has no marketability, little if any chances of ever becoming marketable, and is in a neutral to unpromising situation? The inability to get out of a once promising investment that has turned sour is something to be avoided. . . .
It is apparent that the discount for lack of marketability is one of the more important aspects to value, and the marketplace itself emphasizes this point.30
In September 2000, Mr. Emory and his associates published a similar study that dealt with dot-com companies only.31 This study covered the period from May 1997 through March 2000. They used a total of 53 sales transactions, 42 of which were convertible preferred stock transactions and 11 of which were common stock transactions. For the 53 transactions, they arrived at a mean discount of 54 percent and a median discount of 54 percent. For the 42 convertible preferred stock transactions, they arrived at a 54 percent mean discount and a 53 percent median discount. For the 11 common stock transactions, the mean discount was 54 percent while the median was 59 percent.
Willamette Management Associates Studies
Over several years, Willamette Management Associates has conducted a series of studies of the prices of private stock transactions relative to those of subsequent public offerings of stock of the same companies.
30 Ibid., pp. 13–14.
31 John D. Emory Sr., F.R. Dengel III, and John D. Emory Jr., “The Value of Marketability as Illustrated in Initial Public Offerings of Dot-Com Companies, May 1997 through March 2000,”Business Valuation Review, September 2000, pp. 111–121.
The studies covered the years 1975 through 2002. The results of this series of studies were most recently published in 2003, reporting results through 2000.32
The Willamette Management Associates studies differed from the Baird studies in several respects. One important difference was that the source documents for the Willamette Management Associates studies were complete SEC registration statements primarily on Form S–1 and Form S–18, whereas the source documents for the Baird studies were prospectuses. Although the prospectus constitutes a portion of the registration statement, it is required to disclose only transactions with affiliated parties. Form S–1 and S–18 registration statements require disclosure ofallprivate transactions in the stock within the three years prior to the public offering, in a section of the registration statement separate from the prospectus portion.
The Willamette Management Associates studies attempted to include only transactions that were on an arm’s-length basis. The data analyzed included sales of stock in private placements and repurchases of treasury stock by the companies. Transactions involving the granting of stock options were eliminated unless it was explicitly stated that the options were granted at fair market value. Transactions with corporate insiders or related parties were eliminated unless it was verified (by telephone) that the transactions were bona fide, arm’s-length transactions. Therefore, although there was considerable overlap in the public offerings studied by Baird and those studied by Willamette Management Associates, the actual transactions included in the two sets of studies were quite different.
The Willamette Management Associates study considered all public offerings in the files of theIPO Reporter.33 TheIPO Reporter annually publishes information on all completed initial public offerings excluding closed-end funds. Eliminated from each of these studies were financial institutions, natural resource companies, offerings priced at $1 or less per share, and offerings on units or warrants, since such offerings might be thought to have unique characteristics. The private transactions analyzed took place during the 36 months prior to the initial public offering. If a company had more than one transaction that met the study’s criteria, all such transactions were included.
Each private transaction price was compared with the subsequent public offering price. In addition, for each transaction for which meaningful earnings data were available in the registration statement as of both the private transaction and public offering dates, the price/earnings multiple of each private transaction was compared with the subsequent public offering price/earnings multiple. Because some of
32Insights, Willamette Management Associates, Autumn 2003.
33Going Public: The IPO Reporter (New York: Investment Dealers’ Digest, Inc., annual).
the companies had no meaningful earnings as of the private transaction date and/or the public offering date, the population of transactions compared on a P/E multiple basis was a subset of the population of transaction compared on a price basis.
Also, because the private transactions occurred over a period of up to three years prior to the public offering, Willamette Management Associates made certain adjustments to reflect differences in market conditions for stocks of the respective industries between the time of each private transaction and the time of each subsequent public offering. Prices were adjusted by an industry stock price index. P/E multiples were adjusted for differences in the industry average P/E multiple between the time of the private transaction and that of the public offering.
For the price comparison, the formula used to derive the discount for the private transaction price from the public offering price was as follows:
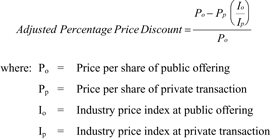
For the price/earnings multiple comparison, the formula used to derive the discount for the private transaction price from the public offering price was as follows:
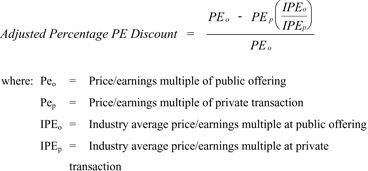
The results of the Willamette Management Associates studies described above are presented in the following table. As shown, the average price discounts varied from period to period, but in all cases, were
higher than the average price discounts shown in the studies for restricted stocks of companies that already had an established public trading market—which is the result one would expect.
Summary of Discounts for Private Transaction P/E Multiples
Compared to Public Offering P/E Multiples
Adjusted for Changes in Industry P/E Multiples
| | | | | | | | | | | | |
| | | Number of | | Number of | | Standard | | Trimmed | | | | |
| Time | | Companies | | Transactions | | Mean | | Mean | | Median | | Standard |
| Period | | Analyzed | | Analyzed | | Discount | | Discount * | | Discount | | Deviation |
| | | | | | |
1975–78 | | 17 | | 31 | | 34.0 | | 43.4% | | 52.5% | | 58.6% |
1979 | | 9 | | 17 | | 55.6 | | 56.8% | | 62.7% | | 30.2% |
1980–82 | | 58 | | 113 | | 48.0 | | 51.9% | | 56.5% | | 29.8% |
1983 | | 85 | | 214 | | 50.1 | | 55.2% | | 60.7% | | 34.7% |
1984 | | 20 | | 33 | | 43.2 | | 52.9% | | 73.1% | | 63.9% |
1985 | | 18 | | 25 | | 41.3 | | 47.3% | | 42.6% | | 43.5% |
1986 | | 47 | | 74 | | 38.5 | | 44.7% | | 47.4% | | 44.2% |
1987 | | 25 | | 40 | | 36.9 | | 44.9% | | 43.8% | | 49.9% |
1988 | | 13 | | 19 | | 41.5 | | 42.5% | | 51.8% | | 29.5% |
1989 | | 9 | | 19 | | 47.3 | | 46.9% | | 50.3% | | 18.6% |
1990 | | 17 | | 23 | | 30.5 | | 33.0% | | 48.5% | | 42.7% |
1991 | | 27 | | 34 | | 24.2 | | 28.9% | | 31.8% | | 37.7% |
1992 | | 36 | | 75 | | 41.9 | | 47.0% | | 51.7% | | 42.6% |
1993 | | 51 | | 110 | | 46.9 | | 49.9% | | 53.3% | | 33.9% |
1994 | | 31 | | 48 | | 31.9 | | 38.4% | | 42.0% | | 49.6% |
1995 | | 42 | | 66 | | 32.2 | | 47.4% | | 58.7% | | 76.4% |
1996 | | 17 | | 22 | | 31.5 | | 34.5% | | 44.3% | | 45.4% |
1997 | | 34 | | 44 | | 28.4 | | 30.5% | | 35.2% | | 46.7% |
1998 | | 14 | | 21 | | 35.0 | | 39.8% | | 49.4% | | 43.3% |
1999 | | 22 | | 28 | | 26.4 | | 27.1% | | 27.7% | | 45.2% |
2000 | | 13 | | 15 | | 18.0 | | 22.9% | | 31.9% | | 58.5% |
* Excludes the highest and lowest deciles of indicated discounts.
Source: Shannon P. Pratt, Robert F. Reilly, and Robert P. Schweihs,Valuing a Business: The Analysis and Appraisal of Closely Held Companies, 4th ed. (New York: McGraw-Hill, 2000), p. 410.Insights, Willamette Management Associates, Autumn 2003.
Valuation Advisors Pre-IPO Study
More recently, Valuation Advisors, LLC, recorded all transactions shown in the prospectuses for the IPO’s up to two years prior to the date of the IPO. These included sales of common stock, sales of
convertible preferred stock, and granting of stock options. They labeled each by transaction type. Collectively, these amounted to several hundred transactions per year. The data extends back through the 1990’s.
They recorded asset size, revenue size, amount of operating profits, operating profit margins, SIC Codes, NAICS Code, company name, description of business, IPO date, transaction date, IPO price, transaction price, and percentage below the IPO price of which the transaction occurred.
They summarized the data annually by transaction that occurred within 90 days of the IPO, 91-180 days before the IPO, 181-270 days before the IPO, 271-365 days before the IPO, and over 1 year before the IPO. Each year, the average discount of the transaction price below the IPO price goes up significantly, the farther removed from the IPO. This would indicate that the holding period is an important determinant of the discount for lack of marketability.
Valuation Advisors published their pre-IPO discount for lack of marketability study for each of the years 1999-2001. The results of the 1999 study indicated an average one-year discount of 51.9 percent. In the 2000 pre-IPO study, the average discount for the year was 47.1 percent. The average discount for the 2001 study was 22.4 percent. However, the average discount for 2001 became 40.8 percent when a narrowed discount range, delimited between 10 and 90 percent, was used. This narrowed range was selected in order to reduce the combined effect of so-called “cheap stock” and the volatile market conditions seen during the tech stock and dot-com “bubble” during this period.
Summary of Private Transaction Studies
The evidence from the Baird, Willamette Management Associates and Valuation Advisors studies taken together seems quite compelling. The studies covered hundreds of transactions during a span of more than 20 years. Average differentials between private transaction prices, and public market prices varied under different market conditions, ranging from about 40 to 63 percent, after eliminating the “outliers.” This is very strong support for the hypothesis that the fair market values of minority interests in privately held companies are greatly discounted from their publicly traded counterparts.
Discount for Lack of Marketability for Belk, Inc.
Exhibit 12 depicts the indicated discount for lack of marketability in respect to Belk. As shown in the Exhibit, the indicated valuation adjustment for the lack of marketability was 20 percent. This is based on empirical data from the restricted stock studies, the pre-IPO studies, the Johnson study, and the empirical
regression of the Silber Model. The preceding paragraphs outlined the various methodologies and conclusions of each study, and the Johnson study and the Silber Model is discussed in further detail in the subsequent paragraphs.
Johnson Study
Background and Findings
Bruce A. Johnson published a study of some 72 restricted stock transactions that occurred between 1991 and 1995 in his article “Quantitative Support for Discounts for Lack of Marketability” in the December 1999 edition of Business Valuation Review (pages 152-155). The average discount of the study was 20.2 percent.
Application of Study Finding to Belk, Inc.
Johnson classified the data into range quartiles and published the average of each quartile. We classified the Subject Interest into the appropriate quartile and compared the resulting array of indicated discounts to arrive at the selected discount suggested by the data. There were four factors compiled for the observations:
We analyzed the aforementioned factors of the Subject Interest in relation to the Johnson study quartiles with indicated discounts. Our analysis resulted in the range of discounts from 10.3 percent to 29.7 percent, as summarized in Exhibit 13 C.
Silber Study
Background and Findings
In a 1991 article in the Financial Analysts Journal, William L. Silber presented the results of analysis of 69 private placements of common stock of publicly traded companies between 1981 and 1988. He concluded that the average discount was 33.75 percent, very consistent with earlier studies.
In 1977, the Internal Revenue Service published Revenue Ruling 77-287 to provide information and guidance to any person or party concerned with the valuation of securities that cannot be immediately
resold because they are restricted. The importance of the Ruling was the Service’s recognition that a discount should be associated with shares that are restricted in some manner from immediate access to an active public market. The Ruling cited four factors to consider in determining the discount from a publicly traded price that should be applied in valuing restricted securities, including:
| | • | | The earnings and sales patterns of the company and the risk associated with those earnings. |
| | • | | The dollar amount of sales of the company’s securities. |
| | • | | The trading market in which freely traded shares of the same class are traded. |
| | • | | The existence of resale agreement provisions or other provisions affecting the holders’ rights. |
We concentrated our analysis on restricted stock studies, and in particular a quantitative model developed by William L. Silber. We believe that this type of placement analysis is applicable whether the illiquidity arises from restrictions, blockage, or both factors.
In Silber’s article in the July-August Financial Analysts Journal the results of what he described as a “cross-sectional model” was used to determine an estimate of the discount attributable to a stock that could not be readily sold on the open market for an extended period of time, such as a large block of stock. The model is shown in Exhibit 13 D. Similar to other restricted stock studies, Silber compared the price of restricted stock, as evidenced by private placement sales to sophisticated investors, with the price of the otherwise identical common stock, as evidenced by trades in an open, liquid market.
The average price discount determined by Silber’s analyses of restricted stock prices compared to freely tradable market prices was 33.75 percent. However, while performing his analyses, Silber was able to recognize variations in discounts dependent upon certain company-specific and issue characteristics. Smaller than average discounts were observed for stocks whose issuing companies enjoyed a larger revenue base and positive earnings. The logic behind smaller discounts for such stocks stems from investors being less likely to attempt to liquidate their restricted stock investments during periods of illiquidity if they are able to benefit from the issuing company’s profitability.
Silber created an equation to assist in explaining discounts to restricted stock, the basic premise of which was an interaction of supply and demand for an issuance. The functions included in the equation are based, in part, on the Revenue Ruling 77-287 characteristics outlined above, and were thought by Silber to be indicative of the magnitude of a discount relative to the stock’s freely tradable market price. In general terms, the functions measured the credit-worthiness of the company, the marketability of the
subject shares, special or favorable relationships (if any) between investors in the restricted stock and the company itself, and the cash flow of the company. Silber showed through his observations of restricted stock transactions that:
| | • | | Discounts on stock should become smaller as the credit-worthiness of the company improves; |
| | • | | Discounts on stock should become smaller as the marketability of the stock improves; |
| | • | | Discounts on stock should become smaller as the cash flow of the company grows larger; and |
| | • | | Discounts on stock should become smaller in the presence of special concessions made to investors in the stock. |
The formulary proxies for each of these functions, as suggested by Silber, included revenue volume and the nature of earnings (positive or negative) as a means to determine the credit-worthiness of a company. As an approximation, companies with higher revenues and earnings, relative to market averages, imply better credit-worthiness. Furthermore, companies with higher revenues and earnings typically generate higher levels of cash flow. Therefore, the normalized level of revenues and whether earnings were in the red or the black provided the proxies for credit-worthiness and cash flow.
The proxy for marketability was derived from evidence, which suggests that blocks of stock sold in secondary distributions cannot be sold at the same price as existing shares due to a lack of elasticity in the demand for shares. In addition, the price of the block declines more as the size of the block grows in relationship to the total number of shares outstanding, as described above. It is expected that the size of the block of stock, depending on how large it is relative to the total number of shares outstanding, will have a negative impact on the value of the stock. The marketability proxy therefore was determined to equal the number of shares of stock, or in this case the subject block, divided by the total number of shares outstanding.
The final proxy used in Silber’s model to measure the impact of special relationships on the price of restricted stock is a dummy variable, which equals one if a supplier relationship exists between the investor and the company issuing the stock, and zero if no such relationship exists.
Application of Study Finding to Belk, Inc.
We input the relevant Company-specific data for Silber’s regression model in Exhibit 13 D. These factors include: size of the block and the level of revenues and the profitability of the Company. The resulting indicated discount was approximately 20 percent.
APPENDIX E – STATEMENTOF ASSUMPTIONSAND LIMITING CONDITIONS
STATEMENTOF ASSUMPTIONSAND LIMITING CONDITIONS
The primary assumptions and limiting conditions pertaining to the conclusion of value stated in this report are summarized below. Other assumptions are cited elsewhere in this report.
| | 1. | The value conclusion arrived at herein is valid only for the stated purpose as of the date of the valuation. |
| | 2. | We have accepted without any verification financial statements and other related information provided by the company or its representatives as fully and correctly reflecting the company’s business conditions and operating results for the respective periods, except as specifically noted herein. We have not audited, reviewed, or compiled the financial information provided to us. Accordingly, we express no audit opinion or any other form of assurance on this information. |
| | 3. | We obtained public information and industry and statistical information from sources we believe to be reliable. However, we make no representation as to the accuracy or completeness of such information and have performed no procedures to corroborate the information. |
| | 4. | We do not provide assurance on the achievability of the results forecasted by the company because events and circumstances frequently do not occur as expected. Differences between actual and expected results may be material; and achievement of the forecasted results is dependent on actions, plans, and assumptions of management. |
| | 5. | We based the value conclusion arrived at herein on the assumption that the current level of management expertise and effectiveness would continue to be maintained and that the character and integrity of the enterprise through any sale, reorganization, exchange, or diminution of the owners’ participation would not be materially or significantly changed. |
| | 6. | This report and the value conclusion arrived at herein are for the exclusive use of our client for the sole and specific purposes as noted herein. They may not be used for any other purpose or by any other party for any purpose. Furthermore, the report and value conclusion are not intended by the authors, and should not be construed by the reader, to be investment advice in any manner whatsoever. The value conclusion represents our considered opinion, based on information furnished by the company and other sources. |
| | 7. | Neither all nor any part of the contents of this report (especially the value conclusion, the identity of any valuation analysts, or the firm with which such valuation analysts are connected or any reference to any of their professional designations) should be disseminated to the public through advertising media, public relations, news media, sales media, mail, direct transmittal, or any other means of communication, including but not limited to the Securities and Exchange Commission or other governmental agency or regulatory body, without our prior written consent and approval. |
| | 8. | We are not environmental consultants or auditors, and we take no responsibility for any actual or potential environmental liabilities. Any person entitled to rely on this report, wishing to know whether such liabilities exist, or the scope and their effect on the value of the property, is encouraged to obtain a professional environmental assessment. We do not conduct or provide environmental assessments and have not performed one for the subject property. |
| | 9. | We have not independently determined whether the company is subject to any present or future liability relating to environmental matters (including, but not limited to CERCLA/Superfund liability) nor the scope of any such liabilities. Our valuation takes no such liabilities into account, except as they have been reported to us by the company or by an environmental consultant working for the company, and then only to the extent that the liability was reported to us in an |
| | actual or estimated dollar amount. Such matters, if any, are noted in the report. To the extent such information has been reported to us, we have relied on it without verification and offer no warranty or representation as to its accuracy or completeness. |
| | 10. | We have not made a specific compliance survey or analysis of the subject property to determine whether it is subject to, or in compliance with, the American Disabilities Act of 1990, and this valuation does not consider the effect, if any, of noncompliance. |
| | 11. | No change of any item in this valuation report will be made by anyone other than us, and we have no responsibility for any such unauthorized change. |
| | 12. | Unless otherwise stated, no effort has been made to determine the possible effect, if any, on the subject business due to future federal, state, or local legislation, including any environmental or ecological matters or interpretations thereof. |
| | 13. | If prospective financial information approved by management has been used in our work, we have not examined or compiled the prospective financial information. Therefore, we do not express an audit opinion or any other form of assurance on the prospective financial information or the related assumptions. Events and circumstances frequently do not occur as expected, and there will usually be differences between prospective financial information and actual results, and those differences may be material. |
| | 14. | Except as noted, we have relied on the representations of the owners, management, and other third parties concerning the value and useful condition of all equipment, real estate, and investments used in the business, and any other assets or liabilities, except as specifically stated to the contrary in this report. We have not attempted to confirm whether or not all assets of the business are free and clear of liens and encumbrances or that the entity has good title to all assets. |
APPENDIX F – APPRAISAL CERTIFICATION
APPRAISAL CERTIFICATION
We hereby certify the following statements regarding this appraisal:
| | 1. | We have inspected the assets, properties, or business interests encompassed by this appraisal to the extent we deemed necessary in order to arrive at a professional appraisal opinion of value. |
| | 2. | We have no present or prospective future interest in the assets, properties, or business interests that are the subject of this appraisal report. |
| | 3. | We have previously appraised these assets, properties, or business interests during the three years prior to this engagement. |
| | 4. | We have no personal interest or bias with respect to the subject matter of this report or the parties involved. |
| | 5. | Our compensation for making the appraisal is in no way contingent upon the value reported or upon any predetermined value. |
| | 6. | To the best of our knowledge and belief, the statements of facts contained in this report, upon which the analyses, conclusions, and opinions expressed herein are based, are true and correct. |
| | 7. | Our analyses, opinions, and conclusions were developed, and this report has been prepared, in conformity with the Uniform Standards of Professional Appraisal Practice, as promulgated by The Appraisal Foundation. |
| | 8. | No persons other than the individuals whose qualifications are included herein have provided significant professional assistance regarding the analyses, opinions, and conclusions set forth in this report. |
| | 9. | The reported analyses, opinions, and conclusions are limited only by the reported assumptions and limiting conditions, and they represent our unbiased professional analyses, opinions, and conclusions. |
| | 10. | The reported analyses, opinions, and conclusions were developed, and this report has been prepared, in conformity with the requirements of the code of professional ethics and the standards of professional appraisal practice of the professional organizations of which we are members. |
| | 11. | Disclosure of the contents of this report is subject to the requirements of the professional organizations of which we are members related to review by their duly authorized representatives. |
| | 12. | The signature of the appraiser responsible for conducting this engagement, Curtis R. Kimball, Managing Director of Willamette Management Associates, is incorporated herein by reference to its location on the transmittal letter of this report. |
APPENDIX G – QUALIFICATIONSOF PRINCIPAL ANALYSTS
CURTIS R. KIMBALL
Curtis Kimball is a managing director of Willamette Management Associates. Curtis is also director of the firm’s Atlanta office.
Curtis supervises engagements related to the valuation of business entities and business interests, the analysis of publicly traded and private securities, and the valuation of intangible assets, options and derivative interests, claims, fractional interests, and intellectual property.
He has performed the following types of valuation assignments: estate and gift planning valuations, estate tax (both date of death and alternate value date) valuations, gift tax valuations, generation-skipping tax valuations, fiduciary compensation and damages claims valuations, buy-sell agreement valuations, income tax (including charitable deduction, transfer pricing, intangible asset basis, and loss deduction) valuations, fair value valuations for financial reporting purposes, merger and acquisition valuations, fairness opinions, solvency analyses, ESOP feasibility and initial transaction valuations, ESOP employer stock valuations and transaction fairness valuations, insurance valuations, divorce and equitable division valuations, various forensic analyses, fair value in dissenting shareholder rights and shareholder oppression proceedings, economic damages and lost profits analyses, bankruptcy and restructuring analysis and valuations, employee compensation and stock option valuations, and financing collateral valuations.
Curtis has presented expert testimony in federal courts (U.S. Tax Court, U.S. District Court, and U.S. Bankruptcy Court) and various state courts and in alternate dispute resolution venues, including binding arbitration and mediation. Curtis is also the firm’s national director for wealth management matters (including estate, gift, charitable, fiduciary, marital planning, family and partner disputes, and tax issues). He has extensive experience with appearances in IRS appellate conferences.
Curtis has decades of experience in the valuation of various types of business entities and interests, including: private family-owned businesses, private multiple-investor businesses, employee-owned businesses, minority interests, fifty-percent interests, restricted stock of publicly-traded companies, large blocks of publicly-traded securities, preferred stock interests, multiple classes of preferred and common stock in complex capital structures, secured notes, subordinated debt interests, options and other derivative interests, warrants and rights offerings, general and limited partnership interests, limited liability company membership interests, professional practices, joint ventures, licensing agreements, franchises, and foreign-domiciled corporations.
In addition, his experience includes the valuation of various types of intangible assets, claims, damages, and intellectual properties. These include: patents, copyrights, trade secrets, master recordings, programming libraries, core deposits, customer contracts, franchises (including professional sports franchises), product licensing, management employment contracts, fiduciary damages and claims, non-compete and non-solicitation agreements, customer lists, cutting and hunting rights, undivided fractional interests in real estate, assembled workforces, trademarks/trade names/trade dress, contract rights, breach of contract damages, going-concern values, goodwill, and transfer price agreements.
PREVIOUS EXPERIENCE
Before joining Willamette Management Associates, Curtis was a vice president and manager of the Business Owners Services Group of the Citizens & Southern Trust Company, the trust subsidiary of the Citizens & Southern Corporation of Atlanta, Georgia (now Bank of America). Curtis provided valuation and appraisal services to the C&S Corporation trust and banking customer base throughout the southeast. In addition, his area acted as the trust department’s analyst and administrator in matters relating to the
management, purchase, and sale of private business interests, intangible assets, and illiquid securities held in estates and trusts. Curtis has managed closely held businesses after the founder’s death, and he has served as a member of the board of directors of a number of family-owned businesses in his capacity as representative of the trustees or executors.
Curtis also acted as part of the C&S Trust ESOP fiduciary services group, with input regarding the retention of independent valuation firms to advise the bank as trustee on ESOP valuations and review of independent valuations. Curtis’s position at C&S included work as part of the team that acted as ESOP trustee for the leveraged buyout of AVIS Rent-a-Car, one of the then-largest employee-owned firms in the nation.
Prior to joining C&S, Curtis was an assistant vice president with the Trust Department of Wachovia Bank & Trust Company, N.A., a major regional bank located in North Carolina. As the assistant manager of the closely held business unit at Wachovia, Curtis managed the trust department’s holdings of private business interests and estate portfolios, and he conducted valuations of closely held businesses and business interests for bank clients in the region. He joined Wachovia as an internal auditor, and he subsequently worked as a loan administration officer with the bank’s corporate lending group.
EDUCATION
Master of Business Administration, Emory University
Bachelor of Arts, economics, Duke University
PROFESSIONAL AFFILIATIONS
Curtis is an accredited senior appraiser (ASA) of the American Society of Appraisers, accredited in business valuation. He has been a member of and served as treasurer of the ASA’s Business Valuation Committee. He is presently a member of the Business Valuation Standards Sub-Committee. He served as a member of the International Board of Examiners and International Ethics Committee of the ASA. He has served as president, secretary, and treasurer of the Atlanta Chapter of the ASA. He has served as chair of the Atlanta Chapter Business Valuation Committee. He has served as treasurer of the Portland Chapter of the ASA.
Curtis also holds the chartered financial analyst (CFA) designation of the CFA Institute. He was a member of the Board of Examiners and was a senior grader for the examinations leading to the CFA designation. He served for six years as a member of the Disciplinary Review Committee and as a member of the Disciplinary Hearing Panel judges’ pool. He was a member of the Portland Society of Financial Analysts for which he served as secretary and a member of the board of directors. He also served as a member of the board of trustees of the CFA Society of Atlanta (CFA-ATL) and is currently the CFA-ATL membership chair.
He is also a member of the Institute of Business Appraisers, The ESOP Association, the American Bankruptcy Institute, the Institute of Management Accountants, the National Association of Corporate Directors, and the National Association of Business Economists, for which he served as past president of the Portland chapter and treasurer of the Atlanta chapter.
CHIP BROWN, CPA
Chip Brown is a principal with Willamette Management Associates. His practice includes valuation consulting, economic analysis, and financial advisory services.
Chip has performed the following types of valuation and economic analyses: merger and acquisition valuations, fairness opinions, ESOP formation and adequate consideration analyses, acquisition purchase price allocations, business and stock valuations, and lost profits/economic damages analyses.
He has prepared these valuation and economic analyses for the following purposes: transaction pricing and structuring (merger, acquisition, liquidation, and divestiture); taxation planning and compliance (federal income, gift, and estate tax; state and local property tax; transfer tax), ESOP transactions and ESOP related litigation, forensic analysis and dispute resolution, and strategic information and planning.
Chip has valued the following types of business entities and securities: close corporation business enterprise, close corporation fractional ownership interests, public corporation subsidiaries/divisions, complex capital structures (various classes of common/preferred stock; options, warrants, grants, rights), general and limited partnership interests, joint ventures, proprietorships, professional service corporations, professional practices, and LLPs and LLCs.
He has performed business valuations in the following industries: advertising, apparel, bottling, brokerage, cable television, chemical, commercial banking, communications, computer services, construction and contracting, consulting, distribution, energy and electric generation, health care, hotel and hospitality, insurance, manufacturing, marine, mining and mineral extraction, money management, natural resources, parking, petroleum, printing, publishing, real estate development, restaurant, retailing, telecommunications, television broadcasting, textiles, tire, transportation and trucking, and wholesaling.
Chip has performed valuation, economic damages, or transfer price/royalty rate analyses related to the following intangible assets: computer software, computer databases, contract rights, copyrights, customer and supplier contracts, customer lists, employment contracts, goodwill, licenses, noncompete covenants, patents, proprietary technology, trained and assembled workforces, trade names, and trademarks.
He has performed financial advisory and economic analyses for various transactional purposes: identification of M&A targets, valuation of target company synergistic/strategic benefits, negotiation of deal price and terms, fairness analysis of proposed transactions, and valuation of debt and equity instruments.
PREVIOUS EXPERIENCE
Prior to joining Willamette Management Associates, Chip was a senior associate at Adams Capital, Inc., a provider of business valuation, asset valuation, and financial advisory services. Prior to joining Adams Capital, he practiced assurance and advisory business services with Ernst & Young LLP.
EDUCATION
Master of Science, accounting, University of Virginia
Bachelor of Science, management, Georgia Institute of Technology (with highest honors)
PROFESSIONAL AFFILIATIONS
Certified Public Accountant (CPA) – Georgia
Chartered Financial Analyst (CFA) – CFA Institute
Accredited in Business Valuation (ABV) – American Institute of Certified Public Accountants
Certified in Financial Forensics (CFF) – American Institute of Certified Public Accountants
Chip is a member of the American Institute of Certified Public Accountants (AICPA) and the Georgia Society of Certified Public Accountants (GSCPA). Chip is also a member of The ESOP Association, the CFA Institute, and the Atlanta Society of Financial Analysts.
MICHELLE MAKHIJA
Michelle Makhija is an associate with Willamette Management Associates.
Michelle performs the following types of valuation and economic analysis assignments: merger and acquisition valuations, business and stock valuations, forensic analyses, transfer pricing analyses, estate tax valuations, intellectual property valuations, marital dissolution valuations, lost profits /economic damages analyses, and appraisal reviews.
She prepares these valuation and economic analyses for the following purposes: taxation planning and compliance (federal income, gift, and estate tax; state and local property tax; transfer tax), forensic analysis and dispute resolution, and strategic information and corporate planning, ESOP transaction and financing, and ESOP-related litigation.
Michelle performs these valuations for the following types of business entities and securities: closely held corporation business enterprises, closely held corporation noncontrolling ownership interests, various classes of common/preferred stock, general and limited partnership interests, professional service corporations, professional practices, and LLCs.
PREVIOUS EXPERIENCE
Before joining Willamette Management Associates, Michelle completed an internship with Morgan Keegan’s Private Wealth Management Group. At Morgan Keegan, Michelle was responsible for financial data analysis and production of forecasts of business, industry and market conditions for use in making investment decisions.
EDUCATION
Bachelor of Business Administration in finance, Georgia State University
PROFESSIONAL AFFILIATIONS
Chartered Financial Analyst (CFA) Level I Candidate