Exhibit (a) (7)
FAIR MARKET VALUEOF
THE COMMON STOCKOF
BELK, INC.
ASOF FEBRUARY 1, 2014
April 16, 2014
Mr. Ralph Pitts
Executive Vice President and General Counsel
Belk, Inc.
2801 West Tyvola Road
Charlotte, North Carolina 28217-4500
Dear Mr. Pitts:
Pursuant to your request, we conducted a valuation analysis of the common stock (the “Subject Interest”) of Belk, Inc. (“Belk” or the “Company”) as of February 1, 2014 (the “valuation date”). The results of our analysis are summarized in this introductory transmittal letter and set forth in additional detail in the attached valuation report.
PURPOSEAND OBJECTIVEOFTHE ANALYSIS
The purpose of our analysis is to provide an independent opinion of the fair market value of Belk common stock for management planning purposes, tax compliance purposes, and a potential board of directors (the “Board”) tender offer. Our analysis was conducted for the purposes specified herein. No other purpose is intended nor should be inferred.
The objective of our analysis is to estimate the fair market value of total equity of Belk on a nonmarketable, noncontrolling ownership interest basis as of the valuation date.
STANDARDOF VALUEAND PREMISEOF VALUE
The standard of value used in this analysis isfair market value,as this term is used in the Internal Revenue Code (IRC) and set forth in the Regulations to the IRC. For purposes of this valuation, fair market value is defined as the price at which the Subject Interest would change hands between a hypothetical willing buyer and willing seller, with both having reasonable knowledge of all relevant facts, and neither party being under any compulsion to buy or sell. Fair market value also assumes that the price is paid all in cash or its economic equivalent at closing. The factors surrounding the determination of fair market value are discussed more fully in Internal Revenue Service (IRS) Revenue Ruling 59-60, as amended and amplified by subsequent Revenue Rulings and interpreted by the courts.
Our analysis was conducted under the premise of value in continued use, as a going concern. The going concern premise assumes that Belk will continue to operate as an income producing entity.
Our opinion of value for the Subject Interest is on a nonmarketable, noncontrolling ownership interest basis. A nonmarketable interest cannot be sold in a liquid public market, nor can it be sold quickly, with price certainty, or without incurring relatively significant transaction risks and costs. A noncontrolling interest lacks the relative ability to control an entity’s operating, investing, and financing decisions.
Mr. Ralph Pitts
April 16, 2014
Page 2
BRIEF DESCRIPTIONOF BELK, INC.
Belk, together with its subsidiaries, is the nation’s largest family owned and operated department store business in the U.S., with 299 stores in 16 states, as of the valuation date. With stores located primarily in the southern U.S. and with a growing eCommerce business on its belk.com website, the Company generated revenue of $4.0 billion for the fiscal year 2014. Together with its predecessors, Belk has been successfully operating department stores since 1888. Belk is committed to providing its customers a compelling shopping experience and merchandise that reflects “Modern.Southern.Style.”
VALUATION PROCEDURESAND ANALYSIS
Our analyses, opinions, and conclusions were developed under, and this report was prepared in conformance with, the Uniform Standards of Professional Appraisal Practice, as promulgated by the Appraisal Foundation and endorsed by the American Society of Appraisers.
In developing this valuation analysis, we researched and analyzed the following factors, among others:
| | • | | Economic information and data |
| | • | | Comparative industry data |
| | • | | Information relating to publicly traded companies considered suitable for comparison to Belk |
| | • | | Empirical market evidence regarding historical long-term rates of return on investment measures as developed from nationally recognized investment information publications and studies |
| | • | | Contemporaneous costs of debt capital in the public and private market as provided by nationally recognized investment information publications and our analysis |
We reviewed and analyzed certain information and data provided by Belk, including, but not limited to, audited and unaudited financial information, Company-specific information, and other internal operational documents. This information was both historical and prospective in nature. We relied on this information as fairly presenting the Company’s results of operations and financial position.
We assumed the accuracy and completeness of the financial, operational, and other internal data provided to us, as well as all other publicly available information and data upon which we relied. Information supplied by the Company has been accepted without further verification, unless otherwise noted in our analysis. We have not audited these data as part of our valuation analysis. Therefore, we express no opinion or other form of assurance regarding these data as such work was beyond the scope of our valuation engagement.
Economic, industry, and financial market data were obtained by us from various public and private sources and databases that we deem, but do not guarantee, to be reliable. Data sources are set forth in the text and exhibits of the attached valuation report.
We reviewed and discussed certain documents and information with Belk management as we formed our opinion of fair market value under standard valuation procedures, as they applied to this specific case.
Mr. Ralph Pitts
April 16, 2014
Page 3
We arrived at indications of value through generally accepted valuation approaches. We specifically relied on (1) the discounted cash flow method (an income approach), (2) the guideline publicly traded company method (a market approach), and (3) the previous transactions method (a market approach).
We reached an opinion after considering the historical and prospective operating characteristics of the Company, the risk/expected return investment relationships reflected for guideline companies having securities traded in the public market, capital market, and related industry macroeconomic evidence available as of February 1, 2014, and longer term market pricing evidence, as well as other relevant factors. There were no restrictions or limitations in the scope of our appraisal work or data made available for our analysis.
VALUATION SYNTHESISAND CONCLUSION
Based upon the procedures and analysis mentioned above, and in our independent professional opinion, the fair market value of the Subject Interest on a nonmarketable, noncontrolling ownership interest basis as of February 1, 2014, was:
$1,973,000,000 or $48.10 Per Share
Based on 40,990,916 Shares Issued and Outstanding.
We are independent of Belk, Inc., and we have no current or future financial interest in the assets, properties, or business interests valued. Our fee for this analysis is in no way contingent upon the value conclusions reached.
A narrative valuation report delineating the scope, analysis, and conclusions of this valuation follows this introductory executive summary. Our individual valuation methods and procedures are summarized in the valuation exhibits that are presented following the narrative valuation report. The accompanying statement of assumptions and limiting conditions, certification and representation, and the professional qualifications of the principal analysts are integral parts of this opinion.
Respectfully submitted,
WILLAMETTE MANAGEMENT ASSOCIATES

Curtis R. Kimball, CFA, ASA
Managing Director
FAIR MARKET VALUEOF
THE COMMON STOCKOF
BELK, INC.
ASOF FEBRUARY 1, 2014
TABLEOF CONTENTS
| | | | |
| | | Page | |
| |
I. INTRODUCTION | | | 7 | |
Description of the Assignment | | | 7 | |
Purpose and Objective of the Analysis | | | 7 | |
Standard of Value and Premise of Value | | | 7 | |
Valuation Procedure and Analysis | | | 7 | |
| |
II. U.S. ECONOMIC OUTLOOK | | | 9 | |
General Economic Conditions | | | 9 | |
Fiscal Policy | | | 9 | |
Monetary Policy | | | 10 | |
Consumer Prices and Inflation Rates | | | 10 | |
Employment Growth and Unemployment | | | 10 | |
Interest Rates | | | 11 | |
Consumer Spending | | | 11 | |
Construction | | | 12 | |
The Stock Markets | | | 13 | |
Industrial Production | | | 13 | |
Capital Expenditures | | | 14 | |
Outlook | | | 15 | |
| |
III. DEPARTMENT STORE INDUSTRY OUTLOOK | | | 17 | |
The Department Store Industry in the U.S. | | | 17 | |
Industry Indicators | | | 18 | |
Key External Drivers | | | 18 | |
Products, Operations, and Technology | | | 19 | |
Current Conditions | | | 20 | |
Products and Services Segmentation | | | 21 | |
Major Market Segmentation | | | 21 | |
Critical Issues and Business Challenges | | | 21 | |
Significant Events Affecting the Competitive Landscape | | | 22 | |
Technology and Omnichannel Developments | | | 23 | |
Outlook | | | 24 | |
| |
IV. BELK, INC., OVERVIEW | | | 26 | |
History and Description of Belk, Inc. | | | 26 | |
Strategic Investments | | | 27 | |
Growth Strategy | | | 27 | |
Merchandising | | | 28 | |
Marketing and Branding | | | 29 | |
Omnichannel | | | 29 | |
eCommerce | | | 30 | |
Belk Proprietary Charge Programs | | | 30 | |
FAIR MARKET VALUEOF
THE COMMON STOCKOF
BELK, INC.
ASOF FEBRUARY 1, 2014
TABLEOF CONTENTS
| | | | |
| | | Page | |
Systems and Technology | | | 30 | |
Inventory Management and Logistics | | | 31 | |
Sustainability and Philanthropy | | | 31 | |
Store Locations and Distribution | | | 32 | |
Associates | | | 32 | |
Industry and Competition | | | 32 | |
Legal Proceedings | | | 33 | |
Management’s Discussion and Analysis of Financial Condition and Results | | | 33 | |
Company Management | | | 34 | |
Board of Directors | | | 35 | |
Capitalization and Equity Ownership | | | 38 | |
Tender Offers | | | 39 | |
Dividends | | | 39 | |
Financial Statement Analysis | | | 40 | |
Balance Sheets | | | 40 | |
Income Statements | | | 41 | |
Financial Statement Adjustments | | | 42 | |
Summary of Positive and Negative Factors | | | 42 | |
Positive Factors | | | 42 | |
Negative Factors and Challenges | | | 44 | |
| |
V. IDENTIFICATION OF GUIDELINE PUBLICLY TRADED COMPANIES | | | 47 | |
Overview | | | 47 | |
Descriptions of Selected Guideline Publicly Traded Companies | | | 47 | |
The Bon-Ton Stores, Inc. | | | 47 | |
Dillard’s, Inc. | | | 47 | |
Kohl’s Corporation | | | 48 | |
Macy’s, Inc. | | | 48 | |
Nordstrom, Inc. | | | 48 | |
Target Corporation | | | 48 | |
Stage Stores, Inc. | | | 49 | |
The Gap, Inc. | | | 49 | |
| |
VI. VALUATION ANALYSIS | | | 50 | |
Income Approach | | | 50 | |
Discounted Cash Flow Method | | | 51 | |
DCF Method Calculations | | | 54 | |
The Market Approach | | | 55 | |
The Guideline Publicly Traded Company Method | | | 56 | |
The Previous Transaction Method | | | 57 | |
The Asset-Based Approach | | | 58 | |
FAIR MARKET VALUEOF
THE COMMON STOCKOF
BELK, INC.
ASOF FEBRUARY 1, 2014
TABLEOF CONTENTS
| | | | |
| | | Page | |
VII. VALUATION SYNTHESIS AND CONCLUSION | | | 59 | |
Indicated Equity Value – DCF and GPTC Methods | | | 59 | |
Indicated Equity Value – Previous Transaction Method | | | 59 | |
Synthesis and Conclusion | | | 60 | |
| |
APPENDIX A – VALUATION EXHIBITS | | | 61 | |
| |
APPENDIX B – DISCOUNT FOR LACK OF MARKETABILITY | | | 103 | |
| |
APPENDIX C – STATEMENT OF ASSUMPTIONS AND LIMITING CONDITIONS | | | 127 | |
| |
APPENDIX D – CERTIFICATION AND REPRESENTATION | | | 130 | |
| |
APPENDIX E – PROFESSIONAL QUALIFICATIONS OF PRINCIPAL ANALYSTS | | | 132 | |
I. INTRODUCTION
DESCRIPTIONOFTHE ASSIGNMENT
Willamette Management Associates was retained by Belk, Inc., to provide an independent professional opinion of the fair market value of the common stock (the “Subject Interest”) of Belk, Inc. (“Belk” or the “Company”) as of February 1, 2014 (the “valuation date”). The results of our analysis are set forth in this valuation report.
PURPOSEAND OBJECTIVEOFTHE ANALYSIS
The purpose of our analysis is to provide an independent opinion of the fair market value of Belk common stock for management planning purposes, tax compliance purposes, and a potential board of directors (the “Board”) tender offer. Our analysis was conducted for the purposes specified herein. No other purpose is intended nor should be inferred.
The objective of our analysis is to estimate the fair market value of total equity of Belk on a nonmarketable, noncontrolling ownership interest basis as of the valuation date.
STANDARDOF VALUEAND PREMISEOF VALUE
The standard of value used in this analysis isfair market value,as this term is used in the Internal Revenue Code (IRC) and set forth in the Regulations to the IRC. For purposes of this valuation, fair market value is defined as the price at which the Subject Interest would change hands between a hypothetical willing buyer and willing seller, with both having reasonable knowledge of all relevant facts, and neither party being under any compulsion to buy or sell. Fair market value also assumes that the price is paid all in cash or its economic equivalent at closing. The factors surrounding the determination of fair market value are discussed more fully in Internal Revenue Service (IRS) Revenue Ruling 59-60, as amended and amplified by subsequent Revenue Rulings and interpreted by the courts.
Our analysis was conducted under the premise of value in continued use, as a going concern. The going concern premise assumes that Belk will continue to operate as an income producing entity.
Our opinion of value for the Subject Interest is on a nonmarketable, noncontrolling ownership interest basis. A nonmarketable interest cannot be sold in a liquid public market, nor can it be sold quickly, with price certainty, or without incurring relatively significant transaction risks and costs. A noncontrolling interest lacks the relative ability to control an entity’s operating, investing, and financing decisions.
VALUATION PROCEDUREAND ANALYSIS
Our analyses, opinions, and conclusions were developed under, and this report was prepared in conformance with, the Uniform Standards of Professional Appraisal Practice, as promulgated by the Appraisal Foundation and endorsed by the American Society of Appraisers.
In developing this valuation analysis, we researched and analyzed the following factors, among others:
| | • | | Economic information and data |
| | • | | Comparative industry data |
| | • | | Information relating to publicly traded companies considered suitable for comparison to Belk |
| | • | | Empirical market evidence regarding historical long-term rates of return on investment measures as developed from nationally recognized investment information publications and studies |
| | • | | Contemporaneous costs of debt capital in the public and private market as provided by nationally recognized investment information publications and our analysis |
We reviewed and analyzed certain information and data provided by Belk, including, but not limited to, audited and unaudited financial information, Company-specific information, and other internal operational documents. This information was both historical and prospective in nature. We relied on this information as fairly presenting the Company’s results of operations and financial position.
We assumed the accuracy and completeness of the financial, operational, and other internal data provided to us, as well as all other publicly available information and data upon which we relied. Information supplied by the Company has been accepted without further verification, unless otherwise noted in our analysis. We have not audited these data as part of our valuation analysis. Therefore, we express no opinion or other form of assurance regarding these data as such work was beyond the scope of our valuation engagement.
Economic, industry, and financial market data were obtained by us from various public and private sources and databases that we deem, but do not guarantee, to be reliable. Data sources are set forth in the text and exhibits of the attached valuation report.
We reviewed and discussed certain documents and information with Belk management as we formed our opinion of fair market value under standard valuation procedures, as they applied to this specific case.
We arrived at indications of value through generally accepted valuation approaches. We specifically relied on (1) the discounted cash flow method (an income approach), (2) the guideline publicly traded company method (a market approach), and (3) the previous transactions method (a market approach).
We reached an opinion after considering the historical and prospective operating characteristics of the Company, the risk/expected return investment relationships reflected for guideline companies having securities traded in the public market, capital market, and related industry macroeconomic evidence available as of February 1, 2014, and longer term market pricing evidence, as well as other relevant factors. There were no restrictions or limitations in the scope of our appraisal work or data made available for our analysis.
II. U.S. ECONOMIC OUTLOOK
In the valuation of any business interest, the valuation analyst should consider the general economic outlook as of the valuation date. This premise is based on the belief that the national economic outlook influences how investors perceive alternative investment opportunities at any given time.
In our analysis, we considered the general economic climate that prevailed at the end of the beginning of the first quarter of 2014. This section contains an overview of some selected economic factors, followed by a discussion of those factors that are deemed critical over the long term. The topics addressed include general economic conditions, fiscal policy, monetary policy, consumer prices and inflation rates, employment growth and unemployment, interest rates, consumer spending, construction, the stock markets, industrial production, and capital expenditures.
GENERAL ECONOMIC CONDITIONS
In the fourth quarter of 2013, real gross domestic product (GDP) increased at an annual rate of 3.2 percent in the fourth quarter, according to advance estimates released by the Bureau of Economic Analysis, despite continued federal spending cutbacks. This followed a revised increase of 4.1 percent in the third quarter and an increase of 2.5 percent in the second quarter.
The fourth quarter increase primarily reflected positive contributions from personal consumption expenditures, which increased at their fastest pace in three years. In addition, private inventory investment, nonresidential fixed investment, and exports contributed to the GDP growth. This was partially offset by lower federal government spending and residential fixed investment.
FISCAL POLICY
The federal government budget deficit was $182 billion for the first quarter of the government fiscal year ending September 30, 2014. This was $111 billion less than the deficit for the same period in the prior government fiscal year. Revenue was 8 percent higher than a year ago, while adjusted spending was about 7 percent lower than a year ago.
In the first quarter of the government fiscal year, revenue from individual income and payroll taxes combined decreased by 1.8 percent from the same period of the prior fiscal year. Receipts of corporate income taxes increased by 10.1 percent from same period of the prior fiscal year. Outlays were 6.8 percent lower (on an adjusted basis) from the same period of the prior fiscal year at $846 billion. This amount included $15 billion in spending for unemployment benefits. Outlays for unemployment benefits for the first quarter of the government fiscal year ending September 30, 2014, decreased by 22.1 percent from the same period of the prior fiscal year.
The nation’s trade deficit increased in December 2013 to $38.7 billion, up from $34.6 billion in November. Imports increased to $230.0 billion, and exports decreased to $191.3 billion. For the three months ended in December 2013, exports of goods and services averaged $193.1 billion, while imports averaged $230.6 billion, resulting in an average deficit of $37.4 billion, lower than the November three-month average of $38.8 billion. For the year 2013, the deficit was $471.5 billion, $63.1 billion less than the 2012 deficit.
MONETARY POLICY
At its meeting on December 18, 2013, the Federal Open Market Committee (FOMC) of the Federal Reserve Bank voted to maintain a target range for the federal funds rate of 0 to 0.25 percent. The discount rate charged on direct loans to banks remained at 0.75 percent. The FOMC “sees the improvement in economic activity and labor market conditions . . . consistent with growing underlying strength in the broader economy.” Therefore, the FOMC “decided to modestly reduce the pace of its asset purchases.” Beginning in January, the Federal Reserve will reduce its pace of purchasing agency mortgage-backed securities to $35 billion per month (instead of $40 billion per month) and will reduce its pace of purchasing longer-term Treasury securities to $40 billion per month (instead of $45 billion per month). According to their statement, “Labor market conditions have shown further improvement; the unemployment rate has declined but remains elevated. Household spending and business fixed investment advanced, while the recovery in the housing sector slowed somewhat in recent months. . . . Inflation has been running below the Committee’s longer-run objective, but longer-term inflation expectations have remained stable.”
CONSUMER PRICESAND INFLATION RATES
The Consumer Price Index (CPI) increased 0.3 percent in December 2013, on a seasonally adjusted basis. The CPI was unchanged in November from October. Energy costs increased 2.1 percent, and food costs increased 0.1 percent. The core CPI, which excludes food and energy costs, increased by 0.1 percent in December and by 0.2 percent in November. For the 12 months ended December 31, 2013, the CPI increased by 1.5 percent (not seasonally adjusted). The core CPI increased 1.7 percent over the past 12 months.
The U.S. Import Price Index was unchanged in December 2013, after decreasing 0.9 percent in November. Excluding petroleum, import prices in December 2013 decreased 0.1 percent from November 2013. Petroleum prices increased 0.4 percent in December, but were 1.7 percent lower than a year ago. Export prices increased 0.4 percent in December 2013 after increasing 0.1 percent in November. For the year ended December 31, 2013, import prices were down 1.3 percent, and export prices were down 1.0 percent.
The price index for personal consumption expenditures (PCE) increased 0.2 percent in December 2013, after increasing less than 0.1 percent in November. The core PCE price index (excluding food and energy) increased 0.1 percent in December, following the same increase in November.
EMPLOYMENT GROWTHAND UNEMPLOYMENT
Total nonagricultural employment increased by 74,000 in December 2013. Private sector employment increased by 87,000. Most sectors added jobs in December, led by retail trade, wholesale trade, and professional services.
The unemployment rate decreased in December to 6.7 percent, down from a high of 10 percent in December 2009. The unemployment rate was 1.2 percentage points lower than in December 2012.
Seasonally adjusted average hourly wages increased by $0.02 in December 2013 to $24.17. Average hourly earnings increased 1.8 percent over the year ended December 31, 2012. The average workweek decreased 0.1 hour in December to 34.4 hours.
The Labor Department’s Employment Cost Index (ECI) increased 0.5 percent in the fourth quarter of 2013, on a seasonally adjusted basis. Wages and salaries increased 0.6 percent, and benefits increased 0.6 percent. In the prior quarter, wages and salaries increased 0.3 percent and benefits increased 0.7 percent. For the year ended December 31, 2013, compensation costs increased 2.0 percent. Compensation costs increased by 1.9 percent in the 12 months ended September 30, 2013.
According to the December 2013 personal income and outlays report, personal income increased less than 0.1 percent, and personal spending increased 0.4 percent. In November, personal income increased 0.2 percent, while personal expenditures increased 0.6 percent. Core consumer prices (which exclude food and energy) increased by 0.1 percent in December 2013.
Americans’ personal savings rate (as a percentage of disposable income) was 3.9 percent in December 2013, 0.4 percent lower than in November and lower than in the third quarter of 2013.
Productivity in the nonfarm business sector—the amount of output per hour of work—increased at an annual rate of 3.2 percent in the fourth quarter of 2013. This followed a revised increase of 3.6 percent reported in the third quarter of 2013. From the fourth quarter of 2012 to the fourth quarter of 2013, productivity in the nonfarm business sector increased 1.7 percent.
Unit labor costs in the nonfarm business sector decreased at an annual rate of 1.6 percent in the fourth quarter of 2013, after decreasing a revised 2.0 percent in the third quarter of 2013.
INTEREST RATES
On December 18, 2013, the Federal Reserve maintained the target range for the federal funds rate at between 0 and 0.25 percent. As of December 31, 2013, the prime lending rate remained at 3.25 percent. The prime rate is a benchmark for many consumer and business loans.
CONSUMER SPENDING
Consumer spending increased 0.4 percent in December 2013, after a revised 0.6 percent increase in November. For the fourth quarter of 2013, consumers increased spending by an annual rate of 4.1 percent. This figure was higher than the 3.9 percent increase in the third quarter of 2013. Advance retail sales estimates were higher by 0.2 percent in December 2013 (seasonally adjusted), following a 0.4 percent increase in November. For the quarter ended December 31, 2013, retail sales increased 4.1 percent, on a seasonally adjusted basis, from the same period a year ago.
The largest monthly sales increases were in grocery stores, clothing stores, and gasoline stations (1.9 percent, 1.8 percent, and 1.6 percent, respectively). Gasoline sales have decreased 0.6 percent since December 2012. Sales of automobiles and auto parts have increased 5.9 percent since December 2012. Sales of electronics and appliances have decreased 1.4 percent since December 2012. Sales, excluding automobiles, increased 0.7 percent in December 2013 from November 2013.
Consumer credit outstanding in December 2013 increased at an annual rate of 7.3 percent, or $18.7 billion, to $3.11 trillion, after increasing $12.4 billion in November. Credit card (revolving) debt increased by 7.0 percent, or $5 billion. Nonrevolving debt, such as automobile loans, increased by 7.4 percent, or $13.7 billion. Consumer borrowing does not include mortgages or other loans secured by real estate.
The Conference Board said its Consumer Confidence Index increased 6.1 points in December 2013 to 78.1. The index had decreased in November. A figure between 80.0 and 100.0 suggests slow growth, while a reading below 80.0 indicates a recession (Consumer Confidence Index figures can range from 0 to 160).
The University of Michigan Index of Consumer Sentiment increased in December 2013 to 82.5. The Index of Consumer Expectations also increased in December—to 72.1 from 66.8 in November. “Personal finances, the most critical factor that shapes consumer spending, did slightly improve in December, although largely . . . in the top third of the income distribution,” according to the report.
CONSTRUCTION
Construction spending increased 0.1 percent in December 2013 to a seasonally adjusted annual rate of $930.5 billion. Construction spending has increased 5.3 percent since December 2012. Construction spending in December was higher in some sectors of the construction industry (for example, lodging, commercial, and transportation, to name a few). In other sectors (communication, power, and education, to name a few) spending was lower.
Private construction spending in December 2013 was at a seasonally adjusted annual rate of $663.9 billion, 1.0 percent above the revised November estimate. Residential construction was at a seasonally adjusted annual rate of $352.6 billion, 2.6 percent higher than the revised November estimate. Nonresidential construction was at a seasonally adjusted annual rate of $311.3 billion in December, 0.7 percent below the revised November estimate.
Public construction spending in December 2013 was $266.6 billion, 2.3 percent below the revised November estimate. Educational construction spending was 7.2 percent below the revised November figure, and highway construction was 1.8 percent above the revised November estimate.
For the year ended December 31, 2013, spending on residential construction increased 17.5 percent. New home construction starts decreased 9.8 percent in December 2013 to a seasonally adjusted annual rate of 999,000. The December 2013 figure was 1.6 percent higher than the revised December 2012 rate of 983,000. Single-family housing starts decreased 7.0 percent from November, and multifamily (5 units or more) housing starts decreased 17.9 percent.
The issuance of building permits decreased 3.0 percent in December 2013, to 986,000 units. The rate was 4.6 percent higher than the revised December 2012 rate.
Sales of new single-family homes increased 4.5 percent for the year ended December 31, 2013. In December, sales decreased 7.0 percent to an annual rate of 414,000 units. The November figure was 445,000, lower than the October figure.
The median new home price in December decreased 7.4 percent from November to $311,400. This figure, however, was 4.1 percent above the December 2012 figure. The inventory of new homes for sale in December increased from November to a 5.0-month supply.
In December 2013, sales of existing homes increased by 1.0 percent to a seasonally adjusted annual rate of 4.87 million units. Sales of existing homes in December 2013 were 0.6 percent below December 2012 sales. Sales for all of 2013 were the highest since 2006, at 5.09 million. The median price of an existing home increased 9.9 percent from a year earlier to $198,000. The inventory of unsold existing homes decreased by 9.3 percent from a year ago to 1.86 million units in December 2013, a 4.6-month supply.
The total number of foreclosure filings in December 2013 decreased 26 percent from December 2012. Foreclosures were 53 percent lower than they were at their peak in 2010. Foreclosure filings were reported on approximately 1.4 million properties in 2013, the lowest annual total since 2007.
The nationwide average interest rate for a 30-year fixed rate mortgage for December 2013 was 4.46 percent, compared with 4.26 in November and 3.35 percent in December 2012, according to Freddie Mac. The nationwide average does not include add-on fees known as “points.”
THE STOCK MARKETS
The U.S. stock market indexes had strong growth in the fourth quarter of 2013 and over the year ended December 31, 2013. In fact, the Dow Jones Industrial Average (DJIA) increased by the largest amount in 18 years. For the quarter ended December 31, 2013, the DJIA increased 9.6 percent. For the year ended December 31, 2013, the DJIA increased 26.5 percent. The S&P 500 Index increased 9.9 percent for the quarter and 29.6 percent for the year ended December 31, 2013. The S&P Industrials Index finished the fourth quarter of 2013 with a 10.2 percent increase. For the year ended December 31, 2013, the index increased 29.6 percent. The Nasdaq Composite Index finished higher by 10.7 percent for the quarter. For the year ended December 31, 2013, the Nasdaq increased 38.3 percent.
According to theWall Street Journal, all 10 stock sectors of the S&P 500 Index increased in 2013. The largest increase was in the consumer discretionary sector (40 percent), followed by health care (39 percent) and industrials (37 percent).
The table below presents some historical data for the DJIA, S&P Industrials, S&P 500 Composite, and the Nasdaq Composite Indexes.
| | | | | | | | | | | | | | | | | | | | |
| | | 2012 | | | 2013 | |
Index | | 12/28 | | | 3/29 | | | 6/28 | | | 9/27 | | | 12/27 | |
Dow Jones Industrial Average | | | 12,938.11 | | | | 14,578.54 | | | | 14,909.60 | | | | 15,258.24 | | | | 16.478.41 | |
S&P Industrials | | | 1,869.85 | | | | 2,087.28 | | | | 2,124.12 | | | | 2,251.50 | | | | 2,455.95 | |
P/E Multiple | | | 16.45 | | | | 18.50 | | | | 18.82 | | | | 19.80 | | | | 20.91 | |
Dividend Yield | | | 2.33 | | | | 2.15 | | | | 2.22 | | | | 2.12 | | | | 2.00 | |
S&P 500 Composite | | | 1,402.58 | | | | 1,569.19 | | | | 1,606.28 | | | | 1,691.75 | | | | 1,841.40 | |
P/E Multiple | | | 15.95 | | | | 18.14 | | | | 18.57 | | | | 19.29 | | | | 20.25 | |
Dividend Yield | | | 2.33 | | | | 2.16 | | | | 2.21 | | | | 2.12 | | | | 2.04 | |
Nasdaq Composite | | | 2,960.31 | | | | 3,267.52 | | | | 3,403.25 | | | | 3,781.59 | | | | 4,156.59 | |
Sources:Barron’s [12-31-12, 4-1-13, 7-1-13, 9-30-13, and 12-30-13]
INDUSTRIAL PRODUCTION
Industrial output at the nation’s factories, mines, and utilities increased by 0.3 percent in December. In November industrial output increased by 1 percent. For the fourth quarter of 2013 as a whole, total industrial production increased at an annual rate of 6.8 percent, after increasing 2.4 percent in the third quarter of 2013 and 1.2 percent in the second quarter. Manufacturing production increased 0.4 percent in December after a 0.6 percent increase in November. Utility output decreased 1.4 percent, but mining output was up 0.8 percent.
Capacity utilization at factories, mines, and utilities was at 79.2 percent in December 2013, 1.8 percent above its level a year ago. The utilization rate was 1 percentage point below its 1972–2012 average of 80.2 percent.
U.S. factory orders for manufactured goods decreased in December 2013 by 1.5 percent to $489.2 billion. The December decrease followed a 1.5 percent increase in November. Demand for durable goods decreased 4.2 percent in December 2013, following a 2.7 percent increase in November. Durable goods orders have decreased in two of the past three months. Orders for nondurable goods increased 1.1 percent in December after increasing by 0.4 percent in November.
The Institute of Supply Management (ISM) reported its Manufacturing Index registered 57 in December 2013, a 0.3 percent decrease over November. A reading of 50 or more indicates the sector is expanding while a reading below 50 indicates manufacturing activity is contracting.
The ISM Prices Index for manufacturing materials was 53.5 in December 2013, up from 52.5 in November. This indicates that prices are increasing at a faster pace. The ISM Prices Index measures inflationary pressures in the manufacturing sector.
The ISM Nonmanufacturing Index registered 53 in December 2013. The reading decreased from 53.9 recorded in November. This reading indicates slower growth in the nonmanufacturing sector. A number above 50.0 indicates expansion; less than 50.0 indicates contraction.
The Prices Index for the nonmanufacturing sector increased to 55.1 in December 2013 from 52.2 in November, which reflects a faster increase in prices.
The U.S. Labor Department’s Producer Price Index (PPI) for finished goods decreased 0.4 percent in December 2013 on a seasonally adjusted basis, following a decrease of 0.1 percent in November. For the year ended December 31, 2013, the PPI increased 1.2 percent, the smallest annual increase since 2008. Food prices decreased 0.6 percent, while energy prices increased 1.6 percent. Excluding food and energy prices, the index increased 0.3 percent in December.
In November 2013 manufacturers’ and trade inventories were 0.4 percent higher than in October, at a level of $1,699.9 billion. The total inventories-to-sales ratio was 1.29 in November 2013, the same as the November 2012 ratio.
CAPITAL EXPENDITURES
Real nonresidential fixed investment increased 3.8 percent in the fourth quarter of 2013, following a revised 4.8 percent increase in the third quarter of 2013.
Businesses increased their spending on equipment by 6.9 percent in the fourth quarter of 2013, after increasing spending by a revised 0.2 percent in the third quarter of 2013. Businesses increased their spending on intellectual property products by 3.2 percent in the fourth quarter of 2013, after increasing spending by 5.8 percent in the third quarter of the year.
Business investment in commercial structures decreased 1.2 percent in the fourth quarter of 2013, following an increase of 4.8 percent in the third quarter of 2013.
OUTLOOK
Most economists are predicting continued moderate economic growth in the near-term. The economists at Standard & Poor’s expect U.S. GDP growth of around 2.6 percent in 2014, mainly coming from the private sector. The private sector is expected to increase by 3.1 percent in 2014. They state that the chances of another recession in 2014 are about 15 to 20 percent, and the chances of a quick recovery are also around 15 to 20 percent.
The Livingston Survey forecasters have lowered their estimates for GDP growth in 2014 to 2.5 percent for the first half of 2014 and 2.8 percent for the second half. They expect the unemployment rate to be 7 percent by June 2014 and 6.7 percent by December 2014. Inflation (measured by the CPI) is expected to be about 1.8 percent in 2014.
The Kiplinger Letter expects GDP growth of 2.6 percent in 2014. It expects the unemployment rate to approach 6.5 percent by the end of the year. Inflation is expected to be about 1.8 percent in 2014.
Value Line expects GDP growth to “edge back toward 3% by the end of 2014 (from 2.0%–2.5% early on in the new year), as inventories are worked off.” They expect growth of more than 3 percent, on average, in 2015.
The Federal Reserve adjusted their central tendency estimate for U.S. GDP growth to a range of 2.8 to 3.2 percent for 2014. They estimate growth of 3.0 to 3.4 percent in 2015. The Federal Reserve expects the unemployment rate to be between 6.3 to 6.6 percent in 2014. In 2015, they expect it to decrease to 5.8 to 6.1 percent.
The National Association for Business Economists (NABE) panelists forecast “the pace of economic growth to accelerate in both 2013 and 2014.” The panel forecasts GDP growth of 2.8 percent in 2014.
According to the National Association of Home Builders (NAHB), “builder confidence in the market for newly built, single-family homes improved four points to a 58 reading on the National Association of Home Builders/Wells Fargo Housing Market Index (HMI).” NAHB chairman Rick Judson stated, “This is definitely an encouraging sign as we move into 2014. . . . We continue to look for a gradual improvement in the housing recovery in the year ahead.”
Standard & Poor’s states, “We also expect another boost from the housing sector in 2014, with existing home sales climbing about 6.4% next year and new home sales jumping a healthy 26.7%. Since each single-family home built adds two to three jobs to the economy, that’s good news.”
Business investment is expected accelerate to a 7.4 percent rate in 2014 (compared to 2.6 percent in 2013), according to Standard & Poor’s. They expect consumer spending to increase by 2.5 percent in 2014.
According to theLivingston Survey, the S&P 500 will reach 1,841.1 by the end of June 2014 and 1,875.0 by the end of the year. The medianValue Line estimate for the DJIA in 2014 is 15,265.
Sources: Congressional Budget Office, “Monthly Budget Review for December 2013,” January 8, 2014; U.S. Bureau of Economic Analysis, “Gross Domestic Product: Fourth Quarter 2013 (Advance Estimate),” January 30, 2014; U.S. Bureau of Economic Analysis, “Personal Income and Outlays: December 2013,” January 31, 2014; U.S. Census Bureau and U.S. Bureau of Economic Analysis, “U.S. International Trade in Goods and Services: December 2013,” February 6, 2014; Bureau of Labor Statistics, “U.S. Import and Export Price Indexes—December 2013,”
January 14, 2014; Bureau of Labor Statistics, “The Employment Situation—December 2013,” January 10, 2014; Bureau of Labor Statistics, “Employment Cost Index—December 2013,” January 31, 2014; Bureau of Labor Statistics, “Consumer Price Index—December 2013,” January 16, 2014; Bureau of Labor Statistics, “Productivity and Costs: Fourth Quarter 2013, Preliminary,” February 6, 2014; Bureau of Labor Statistics, “Producer Price Index—December 2013,” January 15, 2014; U.S. Census Bureau News, “Advance Monthly Sales for Retail and Food Services: December 2013,” January 14, 2014; U.S. Census Bureau News, “December 2013 Construction at $930.5 Billion Annual Rate,” February 3, 2014; U.S. Census Bureau News, “New Residential Construction in December 2013,” January 17, 2014; U.S. Census Bureau News, “New Residential Sales in December 2013,” January 27, 2014; “December Existing-Home Sales Rise, 2013 Strongest in Seven Years,” National Association of Realtors press release, January 23, 2014; Freddie Mac, “30-Year Fixed-Rate Mortgages Since 1971”; “1.4 Million U.S. Properties with Foreclosure Filings in 2013 Down 26 Percent to Lowest Annual Total Since 2007,” RealtyTrac press release, January 13, 2014; U.S. Census Bureau News, “Full Report on Manufacturers’ Shipments, Inventories and Orders: December 2013,” February 4, 2014; U.S. Census Bureau News, “Manufacturing and Trade Inventories and Sales: November 2013,” January 14, 2014; Federal Reserve Statistical Release, “Consumer Credit: December 2013,” February 7, 2014; Federal Reserve Statistical Release, “Industrial Production and Capacity Utilization,” January 17, 2014; Federal Reserve press release, December 18, 2013; “Economic Projections of Federal Reserve Board Members and Federal Reserve Presidents, December 2013,” December 18, 2013; Conference Board press release, December 31, 2013; Reuters/University of Michigan Surveys of Consumers, December 23, 2013;Barron’s, “Market Laboratory,” December 30, 2013; Institute for Supply Management, “December 2013 Manufacturing ISM Report on Business,” January 2, 2014; Institute for Supply Management, “December 2013 Non-Manufacturing ISM Report on Business,” January 6, 2014; Bloomberg; National Association of Home Builders press release, December 17, 2013;The Kiplinger Letter, January 3, 2014;Value Line Investment Survey: Selection & Opinion, December 27, 2013, and January 3, 2014; National Association for Business Economists,NABE Outlook, December 2013; Matt Jarzemsky, “U.S. Stocks Close Year with Broad Gains,Wall Street Journal, December 31, 2013; Dan Strumpf, “All 10 Stock Sectors Post Gains in Big Year,”Wall Street Journal, December 31, 2013; Shobhana Chandra, “Consumer Spending Propelled U.S. Fourth-Quarter Growth: Economy,” Bloomberg, January 30, 2014; Federal Reserve Bank of Philadelphia,The Livingston Survey, December 12, 2013; and Standard & Poor’s,Industry Surveys: Trends & Projections, December 2013.
III. DEPARTMENT STORE INDUSTRY OUTLOOK
In the valuation process, the state of the industry in which Belk operates must be considered. The analyst must have an understanding of the factors that drive the industry. The following is an overview of the department store industry in the United States.
THE DEPARTMENT STORE INDUSTRYINTHE U.S.
Operators in the department store industry are large scale department stores which retail a broad range of general merchandise, such as apparel, jewelry, cosmetics, home furnishings, general household products, toys, appliance, and sporting goods. Discount department stores, which are also included in this industry, retail similar lines of goods and services but at lower prices. Supercenters that offer fresh groceries in their stores, and warehouse clubs that operate under membership programs, are not included in this industry classification. Further, the primary role of this industry is in retailing a general line of merchandise. Major products and services in this industry include children’s wear, drugs and cosmetics, footwear, furniture and household appliances, men’s wear, toys and hobbies, and women’s wear.
IBISWorld estimates that the industry is comprised of 68 businesses within the United States with estimated 2013 revenue of $198.0 billion dollars and profits of around $9.5 billion. Over the past five years from 2008 to 2013, the industry generated an average annualized decline in revenue of 1.2 percent. Market share in the U.S. is dominated by five large companies: Wal-Mart Stores Inc. (25.2 percent market share); Target Corp. (24.0 percent market share); Sears Holdings Corporation (16.7 percent market share); Macy’s, Inc. (14.3 percent market share); and J. C. Penney Company, Inc. (5.1 percent market share). Furthermore, the department stores industry is highly competitive with moderate regulations, low revenue volatility, low industry globalization, medium barriers to entry, and a declining life cycle stage. The largest concentrations of firms in the U.S. reside in California (10.9 percent), Florida (6.4 percent), Texas (6.1 percent), Illinois (5.1 percent), Pennsylvania (5.0 percent), and New York (4.7 percent).
According to IBISWorld, the department store industry has weathered adverse conditions in the five years to 2013, with revenue expected to decline at an average annual rate of 1.2 percent to $198.0 billion by 2013. Weak consumer confidence and low disposable income led households to curtail discretionary purchases during the recession, resulting in a substantial decline in demand at traditional department stores. Furthermore, in recent years, online retailers have emerged as a threat to industry players and poached customers by offering convenience and low prices. Notwithstanding these adverse conditions, industry profit is expected to increase to an estimated 4.8 percent of revenue in 2013 from 2.9 percent of revenue in 2008. Profit margins increased during this five-year time period despite an average annual decline in revenue due to a shift in sales mix to higher margin products and due to conservative expense management. Improved stability of economic conditions in 2013 should, according to IBISWorld, lead to a 2.2 percent increase in industry revenue in 2014.
Over the past five years, the conversion of discount department stores into big-box retailers (i.e., warehouse clubs and supercenters) has been responsible for much of the industry’s changes in market share. Discount giants, such as Walmart and Target, have been retrofitting stores with fresh grocery sections to increase their market share. Due to this competitive pressure, some operators have been forced out of the industry or have consolidated and merged with larger players. According to the U.S. Census Bureau, the number of stores declined to 68 in 2013 from 71 in 2008.
INDUSTRY INDICATORS
| | • | | According to First Research, U.S. consumer spending on nondurable goods, an indicator of department store sales, increased 0.2 percent in December 2013 over December 2012. |
| | • | | According to U.S. Census Bureau News, retail trade sales decreased in January 2014 by 0.4 percent from December 2013, but increased 2.6 percent in January 2014 over January 2013. |
| | • | | IBISWorld, in its November 2013 report “Department Stores in the U.S.,” projects industry revenue to increase 2.2 percent and 0.9 percent in 2013 and 2014, respectively. |
| | • | | S&P Capital IQ, in its December 2013 report “Industry Surveys/Retailing: General,” projects that 2013 total retail sales growth will have increased by approximately 4 percent in 2013. Retail sales had been up about 4.3 percent through October 2013; however, the federal government shutdown in October crimped demand during the remainder of the year. Online retail sales were much higher than total retail sales during this time period, increasing 10.4 percent. Conversely, through October 2013, department store sales were down 5.1 percent over the same period in 2012. |
| | • | | S&P Capital IQ, in its December 2013 report “Industry Surveys/Retailing: General,” observed that consumer spending patterns shifted as the economy improved in 2013. Consumers shifted more discretionary spending toward big-ticket items such as vehicles and away from smaller ticket items such as apparel. |
| | • | | The S&P Department Stores Index for stock prices increased 19.5 percent year-to-date to November 15, 2013, underperforming the S&P 500, which posted a 26.6 percent increase. |
| | • | | Among indicators of retail demand, Standard & Poor’s Economics, as of October 2013, projected real U.S. GDP to increase 1.6 percent in 2013 and 2.5 percent in 2014. Standard & Poor’s Economics projected nominal disposable personal income to increase 1.8 percent in 2013 and 4.7 percent in 2014. |
KEY EXTERNAL DRIVERS
| | • | | Department stores rely heavily on the financial health of its customer base, including per capita disposable income. During the periods of low disposable income growth, consumers cut back on spending by delaying purchases or substituting costlier goods with inferior products. This was the result of the unemployment rate and the general economic environment. Because disposable income tends to be correlated with economy activity, disposable income is expected to increase in 2014, creating a potential opportunity for the industry to recover margins and sales. |
| | • | | Department stores compete with a wide array of other industries due to the range of products and services they provide. Some of the industry’s largest competitors are big-box retail stores and supercenters, which offer similar products and services. Online retailers also pose significant competition to the industry with the increase in eCommerce. eCommerce allows customers to purchase products any time of day with convenience and access to a diversified database of reviews and options. According to IBISWorld, this driver is expected to increase in 2014, representing a potential threat to the industry. |
| | • | | Consumer confidence levels influence the volume and frequency of consumer purchases. Low consumer confidence causes consumers to delay purchases or buy cheaper alternatives. In contrast, purchases increase as consumer confidence rebounds and sentiments change to less uncertain expectations of the future of the U.S. economy (i.e., consumers anticipate lower unemployment, increased wealth, and higher disposable incomes). This trend is expected to increase in 2014, showing improvement. |
| | • | | Population growth is an important component of industry growth. As the population increases, so does the industry’s customer base. Additionally, population growth in specific regions is an important indicator of future establishment growth because the number of stores is generally dependent on geographical area populations. This driver is expected to increase slowly in 2014. |
PRODUCTS, OPERATIONS,AND TECHNOLOGY
Major products of the department store industry include apparel, drugs and cosmetics, furniture and appliances, and toys. Apparel includes women’s, men’s, and children’s clothing. Cosmetics include makeup, skin care, hair care, and fragrances. Appliances include refrigerators, stoves, washers, dryers, and dishwashers. Companies may also sell kitchenware, bedding, towels, and sheets. Services include gift wrapping, delivery, appliance installation, and personal shopping.
National and regional chains dominate the industry. Store formats and merchandise selection depends on a company’s target market. Some companies lease space to independent companies to sell products requiring sales expertise, such as furs, designer handbags, and high-end cosmetics. Effective store layouts and eye-catching merchandise displays can generate complementary sales and impulse purchases. Companies may also have outlets to help sell excess inventory.
Most department stores are anchor tenants in large malls, and a store’s presence is expected to drive traffic to the mall. Companies consider demographics, population density, and lifestyle when selecting business locations. A typical Sears store averages 133,000 square feet, but some companies have flagship stores that can exceed 250,000 square feet.
Because department stores deal with tens of thousands of stock keeping units (SKUs), effective supply chain management is critical to keeping costs low and supporting timely merchandising flow. Companies have extensive networks of warehouses and distribution centers to route products from suppliers to stores. Cross-docking facilities allow companies to unload and reallocate products in a single operation, minimizing storage costs. Dedicated distribution centers and call centers often support internet and catalog sales as well.
Department stores buy inventory from manufacturers, importers, and distributors, and may work with thousands of suppliers. While long-term supplier relationships are common, few companies have long-term contracts. Lead times can be long: buyers may place orders six to nine months in advance for apparel and shoes and three to six months in advance for handbags and jewelry.
Further, a large percentage of department stores merchandise is imported. Over 90 percent of apparel and footwear sold in the U.S. is imported from Mexico and China. Low-cost production has forced the majority of apparel and show manufacturing offshore. Buyers make purchasing decisions based on trends and historical sales, and may take preferences and climate into account. Companies may receive allowances from suppliers for markdowns and advertising.
Technology is very important to the industry. Information systems to manage functional areas, including sales, merchandising, purchasing, inventory control, distribution, finance, and accounting are key elements. Point-of-sale (POS) systems record sales transactions and process credit card orders. Merchandise planning systems help companies forecast demand and allocate merchandise across states. Inventory management systems monitor inventory levels and trigger replenishment orders. Electronic data
interchanges (EDI) allows companies to process purchase orders more efficiently. While most department stores use bar codes to identify and track products through the supply chain process, some companies are using radio frequency identification devices (RFIDs) to monitor merchandise movement.
CURRENT CONDITIONS
The department store industry has exhibited mixed performance trends in the five years to 2014; while some department stores have flourished, others have floundered. Operators in this industry are segmented into two distinct types: up-market department stores and their discount variety counterparts. Like most retail stores, traditional department stores have suffered from declining demand and rising competition, which reduced sales and hurt profitability. On the other hand, discount department stores gained market share and thrived during the recession because consumers focused more on savings and lower-price points than luxury and high-end goods. Overall, industry revenue is expected to have declined at an average annualized rate of 1.2 percent over the five years to 2013. However, according to IBISWorld, industry revenue is expected to increase by 2.2 percent in 2013 as disposable income improves.
The linchpin for improved conditions in 2013 was the recovery of the housing market, which began at the end of 2012. Retail spending may have been higher had there not been a reprise of the debt ceiling impasse at the end of 2012, followed by the sequester and the government shutdown in the fall of 2013 which caused consumer confidence to decrease by nine points. The silver lining for this, and for prior severe declines in consumer confidence due to government policy, is that consumer confidence rebounded quickly once a temporary resolution was meted out.
In the December 2013 S&P Capital IQIndustry Surveys/Retailing: General, while some of the department stores beat same-store sales estimates for the first half of fiscal 2014 (ended January 2014), some fell short of estimates. It was observed that middle-income consumers were cautious with expenditures due to higher taxes and a beleaguered, unpredictable job market. This resulted in a weak performance for middle-income focused department stores like Kohl’s, but a strong performance by discounters such as Dollar Tree, Dollar General, and Family Dollar. Another factor during 2013 was the weather. March 2013 was the coldest March in the prior 17 years in the United States. S&P believes that the unseasonably cold spring crimped demand for spring clothing, and was a factor in Fred’s and Target posting negative year-over-year same-store sales during the first fiscal quarter ending April. In the latter half of the year, record snowfall and wintery weather along the east coast limited an already shorter shopping season as compared to calendar year 2012. In the fourth quarter, for many department store companies, the shopping season was six days fewer and wintery weather along the east coast further eliminated three days, lowering sales opportunities.
As of late November 2013, Standard & Poor’s held a neutral outlook for department stores. Through October 2013, department store sales had declined 5.1 percent over the same period in 2012, according to the U.S. Census Bureau. Headwinds during 2013 included (1) the ending of the payroll tax holiday; (2) difficult year-over-year comparisons due to an unseasonably warm, early spring in 2012; and (3) increased competition from specialty apparel and home retailers. Standard & Poor’s estimates that there is a lag of about a year between a meaningful increase in consumer wealth and increased spending, which is known as the “wealth effect.” According to Cassidy Turley’s2014 Retail Forecast, the economist Matteo Iacoviello found that for every $1.00 increase in housing wealth, the consumer spends an incremental $0.06. Economists at Wells Fargo have found the spending increase to be closer to $0.09. In the past, it was commonly held by economists that the spending increase was typically $0.05. One reason for the increase may be due to consumer retrenchment over many years and the purchasing of items long postponed. Another reason may be the relativity of security. Consumers have been pessimistic for so long that any incremental improvement in economic conditions has a more profound effect on consumer spending than it had during periods of gradual improvement from less severe recessions.
Products and Services Segmentation
The products and services offered by department stores are primarily centered on their target customer: women of the household. Therefore, the products and services are segmented accordingly:
| | • | | Women’s Wear (21.1 percent) |
| | • | | Furniture and Household Appliances (16.5 percent) |
| | • | | Drugs and Cosmetics (15.5 percent) |
| | • | | Other Categories (12.6 percent) |
| | • | | Children’s Wear (11.4 percent) |
| | • | | Men’s Wear (10.2 percent) |
| | • | | Toys and Hobbies (8 percent) |
Major Market Segmentation
The market segmentation of customers at department stores is fairly equal among ages, as follows:
| | • | | Consumers aged 25-40 (35 percent) |
| | • | | Consumers aged 41-65 (30 percent) |
| | • | | Consumers aged under 25 (20 percent) |
| | • | | Consumers aged over 66 (15 percent) |
Critical Issues and Business Challenges
| | • | | Companies face intense competition from a wide variety of retailers: discount department stores, warehouse clubs, and specialty stores. Discount department stores have drawn sales away from traditional department stores over the past five years. Warehouse stores sell basic items at rock-bottom prices, and specialty retailers provide better selections and service within particular categories. Further, private label apparel from all types of retailers has challenged department stores. |
| | • | | Consumer spending drives department stores sales, in which a large percentage of products sold are discretionary items. During adverse economic conditions, consumers may curtail overall spending or shop at less expensive retailers. |
| | • | | Demand continues to hinge partly on fashion trends. Fashion trends and fads can change quickly, leaving companies with inventory overhang. Failure to predict trends and react quickly can result in unplanned markdowns or lost sales due to errors in forecasting. Stocking dated merchandise can undermine a company’s reputation, if it causes shoppers to perceive the company as being anachronistic. |
| | • | | Companies in this industry rely on economies of scale, particularly in purchasing, distribution, and marketing, to keep costs low and remain profitable. Large companies can benefit from volume purchasing and shared resources among locations. Scale advantages have resulted in industry consolidation and the demise of many small and mid-sized department stores. |
| | • | | Foreign manufacturers produce the majority of the apparel and footwear offered by department stores. Political unrest or trade disputes, economic instability, unfavorable exchange rates, and transportation delays can affect merchandise availability and impinge on seasonal sales. These factors present operational challenges in light of the long lead time to delivery. |
| | • | | Highly seasonal trends, in which the fourth quarter generates the most significant sales and profits for the industry due to winter shopping, present a challenge for working capital management. Cash flow ebbs in the quarters leading up to the fourth quarter and peaks during the first quarter when collections are made from the peak fourth quarter. Leading up to the peak selling season in the fourth quarter, companies must build inventory, hire additional staff, and increase advertising. Accurate sales forecasting is crucial, since most holiday purchasing orders are made months in advance. |
| | • | | High workforce turnover is a result of the low wages paid for such service sector jobs. Companies must consistently hire and train new workers, which can be time-consuming and costly. A constantly changing sales staff can result in poor customer service and inconsistencies with the customer experience. |
Significant Events Affecting the Competitive Landscape
| | • | | New Management at J. C. Penney – In fiscal 2013 ended January 2013, new CEO Ron Johnson initiated a multiyear transformational program to improve sale volumes and address fierce competition from Kohl’s and Macy’s. Central to this strategy is presenting a more engaging,brand-centric specialty department store format with a revamped pricing and merchandising strategy. |
The pricing strategy, whose moniker is “fair and square,” includes three types of prices: everyday, month-long, and best. The everyday prices were lowered by 40 percent; however, coupons were eliminated and promotional activity was cut back. The result was that same-store sales fell 20 percent, as customers failed to recognize that the cessation of discount coupons was offset by already reduced prices. In response, on August 1, 2012, the company instituted two types of prices: every day and clearance. In October 2012 the company restored the discount coupon promotion.
The revamped merchandising strategy involves reducing the number of brands sold to 100 by fiscal year end 2016 from over 400 brands in fiscal 2012, and reducing the percentage of private label brands to 25 percent of sales from 55 percent of sales in 2012.
Due to the disappointing same-store sales following the commencement of this new strategy, Ron Johnson was replaced by Mike Ullman, their prior chairman and CEO from 2004-2011. One of his first moves was to restore weekly promotions, couponing, and door-busters. He also restored private label brands which had been popular among regular customers. According to S&P Capital IQ’s industry survey of December 2013, these actions had an immediate, positive effect on apparel sales.
Losing about $500 million in business during fiscal 2013 took its toll on the capital structure. Despite the company restructuring, the 7.125 percent notes due 2023 and concluding the second quarter of 2014 with approximately $1.5 billion in cash and $1.9 billion in total liquidity, the company announced on September 27, 2013, that it was lowering its forecast for year-end liquidity to $1.3 billion, and conducting a public equity offering worth $810 million. On the day of that announcement, the stock price fell 13 percent and approximately an additional 15 percent between September 30 and October 7, 2013.
| | • | | “Fast Fashion” Initiatives – Fast fashion refers to affordable, fast turnover clothing lines that dovetail off high-end fashion trends. The target market for fast fashion is teenage girls and young women who shop at “fast fashion” chains such as H&M, Topshop, Zara, Uniqlo, and Forever 21. In 2011, Macy’s introduced a series of designer capsule collections for its Impulse contemporary departments, and in 2012, the company announced plans to launch 13 new brands and to expand 11 existing brands aimed at the millennial generation. Target has catered to this niche since 2006, offering limited-edition contemporary apparel by international designers for its “Target Designer Collaborations” and “GO International” campaigns. Target launched its 400-item Missoni collection in September 2011 and the Jason Wu collection in 2012. Kohl’s entered the fast fashion market in 2011 with its Jennifer Lopez and Marc Anthony collections, which include premium denim, apparel, shoes, and accessories. In 2012, Kohl’s launched the Princess Vera Wang collection, a line of children’s apparel. Nordstrom partnered with Topshop in 2012, stocking Topshop apparel and accessories in 42 of 127 locations. Topshop is one of the more prominent “fast fashion” chains. |
| | • | | Sears Attempts to Gain Higher ROI from its Real Estate – Sears, ironically acquired for its real estate by way of junior debt purchases and subsequent chapter 11 plan, has been attempting to rectify its square footage under-utilization by offering space for lease to other retailers. In September 2011, Sears offered space in nearly 4,000 Sears and Kmart stores. It has leased space, for example, to “fast fashion” retailer Forever 21, Whole Foods Market, Western Athletic Clubs, and Gonzalez Grocery. |
Technology and Omnichannel Developments
To provide customers more flexibility with how, when, and from where they shop, department stores and discounters are seeking new, innovative ways to engage and serve their customers.
Mobile technology affords retailers an opportunity to tailor marketing messages and shopping experiences for customers. Nordstrom added Wi-Fi functionality to all of its full-line stores in 2010, and in 2011 tested 6,000 mobile POS devices during its Anniversary Sale in July. Nordstrom also introduced a mobile-optimized version of its website in June 2011 so that it can capitalize on the growing trend of customers shopping through their smartphones.
J. C. Penney, Kohl’s, Kmart, Sears, Saks Fifth Avenue, Macy’s, and Target have all developed applications for the iPhone that allow iPhone users to borrow weekly sales circulars, receive coupons, search for and receive directions to nearby stores, create shopping lists, and/or make online purchases.
Macy’s and Target are also supporting the new Shopkick app (developed by Shopkick Inc.) in stores within select metro markets, including Chicago, Los Angeles, and New York. Just by walking into a participating store with their iPhones or Android phones, customers can earn points called “kickbucks” that are redeemable for music downloads; gift cards at Macy’s, Target, and other Shopkick partner stores; magazine subscriptions; iPods; charitable donations; and other rewards. They also receive exclusive offers while in the store.
Macy’s mobile marketing campaign, called Macy’s Backstage Pass, makes use of Quick Response (QR) bar code technology to engage in-store shoppers. Macy’s Backstage Pass delivers 30-second videos of designers and fashion experts (including Tommy Hilfiger, Michael Kors, Martha Stewart, and Rachel Ray) telling stories about their inspiration as well as fashion tips and advice. Shoppers access the videos by scanning any Macy’s Backstage Pass code using a mobile device camera running a QR reader application. Shoppers can also access the videos through MMS by texting a keyword found beside each Backstage Pass to MACYS, as well as online at www.macys.com/findyourmagic.
Nordstrom has been an early adopter of mobile checkout technology. In June 2011, the company purchased 6,000 mobile POS devices for its full-line stores as part of an effort to provide an enhanced shopping experience to its customers. Nordstrom has so far achieved 75 percent of its fixed POS capability on mobile devices in its full-line stores and is trying to achieve 100 percent capability on mobile POS devices by the end of 2013. As of September 2012, the company had on an average 15 mobile POS devices for each of its Rack stores.
Neiman Marcus is also focusing on becoming an “Omnichannel” company, namely one that provides its customers with the “O2O” (Offline to Online) brand experience. To this end, the company is currently testing the iPhone-only NM Service app in four of its stores. This app alerts the customer of in-store events, sales, and new product arrivals, and enables sales associates to make product suggestions based on the customer’s purchase history and wish list.
OUTLOOK
In its2014 Retail Forecast, Cassidy Turley observes that while encouraging signs of vitality are manifest among high-end consumers, the middle class remains frugal but is gradually spending more, and will continue to gain confidence provided that the housing market continues to recover. The frugality of the middle class has negatively impacted sales of mid-priced items. At the other end of the spectrum, discounters and dollar stores continue to expand aggressively. The top five national chains have averaged 2,000 new units for the past three years and have similar growth plans for 2014. Costco plans at least 28 new stores over the next six months. Marshall’s, TJ Maxx, Ross Dress for Less, and Nordstrom Rack plan to continue aggressive expansion if possible in 2014, contingent on the availability of mid-box space, which is becoming harder to find.
While certain retailers, such as the discounters, have been expanding in terms of number of stores, others have striven to fend off the threat of online sales. Kohl’s, which had been expanding at a rate of 60 stores per year, has put new stores on hold and instead endeavored to build out its eCommerce and supply chain platform.
First Research forecasts that U.S. department store revenue will decline by 1.0 percent per year between 2014 and 2018. Conversely, IBISWorld forecasts that the department store industry will generate annual revenue growth of 1.0 percent from 2013 to 2018, driven in part by expected annual increases in consumer confidence and per capital disposable income of 5.2 percent and 2.4 percent, respectively. Profit margins are expected to increase to about 6.2 percent of revenue in 2018 from 4.8 percent of revenue in 2013. However, competition from online retailers is expected to continue to pressure pricing by industry participants. IBISWorld projects that industry consolidation will continue; the number of participants is forecast to decline at an annual rate of 3.5 percent in the five years to 2018, to about 57 operators.
Sources:Department Stores in the US, IBISWorld, November 2013;Industry Profile: Department Stores, First Research, December 16, 2013;Industry Surveys, Retailing: General, S&P Capital IQ, December 2013;Advance Monthly Sales for Retail and Food Services, U.S. Census Bureau News, January 2014; Cassidy Turley,2014 Retail Forecast; Macy’s Form 10-K for fiscal year ended February 2, 2013; Kohl’s Corporation Form 10-K for fiscal year ended February 2, 2013; Dillard’s Inc. Form 10-K for fiscal year end February 2, 2013; Belk management interview commentary; Belk internal documents.
IV. BELK, INC., OVERVIEW
HISTORYAND DESCRIPTIONOF BELK, INC.1
Belk began when 26-year-old William Henry Belk opened a small bargain store in Monroe, North Carolina, on May 29, 1888. The store measured only 22 by 70 feet, totaling about 1,500 square feet. Mr. Belk named the store the New York Racket, as he thought it made the store sound large and would attract more business. Mr. Belk started with $750 in savings, a $500 loan at 10 percent interest rate from a local widow, and approximately $3,000 worth of goods taken on consignment from a bankrupt store. In less than seven months, he had paid off his debts and netted a $3,300 profit.
Mr. Belk introduced some radically new retailing ideas in his time. He bought large quantities of goods for cash and sold for cash at a low mark-up. Further, all merchandise was clearly marked with its retail price and, therefore, no haggling ensued and customers could return any merchandise purchased if they were not completely satisfied. These innovative ideas helped Belk stores succeed and grow.
In 1891, William Henry Belk persuaded his brother, Dr. John Belk, to leave his medical profession and become a partner in the Monroe store, beginning a remarkable 37-year business association. The company became the Belk Brothers Company.
The brothers opened a second store in 1893 in Chester, South Carolina, and a third store in 1894 in Union, South Carolina. In 1895, William Henry Belk left the Monroe store to open the company’s fourth store in Charlotte, North Carolina. Dr. John Belk continued to manage the Monroe store until his death in 1928. William Henry Belk headed the Belk stores until his death at age 89 in 1952.
The second generation of management of the company was led by two sons of William Henry Belk: Thomas M. Belk and John M. Belk. Thomas M. Belk passed away in 1997. John M. Belk retired as chief executive officer in 2004, but remained director emeritus until his death in 2007.
At the present, Belk is privately owned and operated under a third generation of Belk family leadership. Thomas M. (Tim) Belk Jr. as chairman of the board and chief executive officer and John R. (Johnny) Belk as president and chief operating officer. H. W. McKay Belk is a board member.
The descendants of founder William Henry Belk and his brother, Dr. John M. Belk, own the majority of the company’s stock. The remainder of the stock is mostly held by current and former employees of the company and their descendants. Belk had a policy of providing minority ownership interests to key store employees over the decades as the company expanded. Historically, Belk was composed of a number of separately formed operating companies representing a store or a cluster of stores often using a trade name which included the local manager, such as “Hudson-Belk Stores.” In May 1998, Belk, Inc., was formed by merging all of these operating companies into a single corporate entity.
The Company completed an acquisition of 22 Proffitt’s stores and 25 McRae’s stores from Saks Incorporated effective July 3, 2005. The Proffitt’s and McRae’s stores were regional department stores located in 11 of the 14 Southeastern states in which Belk had operations.
| 1 | Information was obtained from www.belk.com, Belk documents, Belk management interviews, and Web searches conducted by Willamette Management Associates staff during 2012 and 2013. |
In the summer of 2006, Belk purchased the assets of Migerobe, Inc. (an independent company which had been operating jewelry counters within Belk stores) and began operating its own fine jewelry departments.
In October 2006, Belk completed a purchase transaction with Saks Incorporated for the acquisition of certain Parisian department stores located throughout nine Southeastern and Midwestern states. Belk paid $285 million in cash for Parisian, which included real and personal property, operating leases, and inventory of 38 Parisian stores. Parisian generated total revenue of approximately $723 million in 2005.
In the third quarter of fiscal year ended on January 29, 2011, Belk launched a re-branding program, adopting a new mission and vision. The mission is “to satisfy the modern Southern lifestyle like no one else, so that our customers get the fashion they desire and the value they deserve.” The vision is “for the modern Southern woman to count on Belk first. For her, for her family, for life.” Belk is committed to providing its customers a compelling shopping experience and merchandise that reflects “Modern.Southern.Style.”
As of the fiscal year ended February 1, 2014, the Company operated 299 retail department stores in 16 states, primarily in the southern United States. The Company generated $4.0 billion in revenue for the fiscal year 2014. Belk stores seek to provide customers the convenience of one-stop shopping, with an appealing merchandise mix and extensive offerings of brands, styles, assortments, and sizes.
The Company’s fiscal year is a 52- or 53-week period ending on the Saturday closest to each January 31. Fiscal years ended (FYE) 2014, 2013, and 2012 ended on February 1, 2014; February 2, 2013; and January 28, 2012, respectively. The Company was incorporated in Delaware in 1997. The Company’s principal executive offices are located at 2801 West Tyvola Road, Charlotte, North Carolina 28217-4500.
STRATEGIC INVESTMENTS
Belk planned investments in key strategic initiatives totaling approximately $600 million over a five-year period that began in fiscal year 2011. The Company is investing in store remodels; eCommerce; information technology; branding, marketing, and advertising; merchandise planning and processes; service improvements and improved sourcing practices.
Belk has planned investments totaling approximately $700 million over a three-year period that began in fiscal year 2014 in key strategic initiatives focused on information technology that delivers new business capabilities; excelling in customer services; creating compelling shopping environments through new stores and remodels and an expanded flagship strategy; supply chain initiatives that align distribution capabilities to maximize sales and service; and a comprehensive Omnichannel initiative.
GROWTH STRATEGY
The Company has focused its growth strategy on new stores, expanding and remodeling existing stores, developing new merchandising concepts in targeted demand centers, and expanding its online capabilities. In addition, in April 2013 the Company announced a strategy to expand the number of Belk flagship locations. Belk currently operates 17 flagship stores that meet certain standards based on size, sales volume, location, premium brand assortments, and Belk brand image. Under this strategy, the Company plans to significantly increase the number of flagship stores over the next five years through expansions and remodels of existing stores, enhancement of premium brand offerings in existing stores, and opening new stores that meet the flagship store criteria.
The Company will continue to explore new store opportunities within its existing 16-state footprint and in contiguous markets where Belk can leverage its name and reputation to distinguish its stores from the competition. The Company will also consider closing stores in markets where more attractive locations become available or where the Company does not believe there is potential for long-term growth and success. In addition, the Company periodically reviews and adjusts its space requirements to create greater operating efficiencies and convenience for the customer.
In fiscal year 2014, the Company completed major remodel projects in nine stores, opened one store in a new market, opened two new stores as replacements for existing stores, and completed expansions of eight stores. In addition, the Company completed 24 shoe and jewelry department remodels.
In fiscal year 2015, the Company plans to open two new stores in new markets, two new stores as replacements of existing stores, two store expansions, and two remodels. Five of the eight projects are new or existing flagships.
MERCHANDISING
Belk stores and belk.com feature quality name brand and private label merchandise in better and moderate price ranges, providing fashion, selection, and value to its customers. The merchandise mix is targeted to upper and middle income customers shopping for their families and homes, and includes a wide selection of fashion apparel, accessories, and shoes for women, men, and children, as well as cosmetics, home furnishings, housewares, gift and guild, jewelry, and other types of department store merchandise. The goal is to position Belk as the leader in providing modern, fashionable assortments with depth in style, selection, and value to its store and online customers.
Belk stores and belk.com offer large assortments of many national brands. The Company has enjoyed excellent long-term relationships with many top apparel and cosmetics suppliers and is often the sole distributor of desirable apparel, accessories, and cosmetic lines in its markets. Belk stores and belk.com also offer exclusive private brands in selected merchandise categories that are designed and manufactured to provide compelling fashion assortments that meet customers’ needs and set Belk apart from competitors through their styling, quality, and price. The Company’s private brands include MADE Cam Newton, CYNTHIA Cynthia Rowley, Crown and Ivy, ND-New Directions, Kim Rogers, J. Khaki, Pro Tour, Saddlebred, Red Camel, Nursery Rhyme, Belk Silverworks, Be Inspired, Biltmore For Your Home, Home Accents, and Cook’s Tools. Larger Belk stores may include hair salons, spas, restaurants, optical centers, and other amenities. In fiscal year 2014, the Company operated 159 fine jewelry shops in its stores under the “Belk and Co. Fine Jewelers” name.
The Company introduced three new private brands during fiscal year 2014—MADE Cam Newton, a modern menswear line; CYNTHIA Cynthia Rowley, a line of apparel, handbags, jewelry, scarves, accessories, and small leather goods; and Chip & Pepper® California, a line by denim experts Chip & Pepper Foster featuring trend-setting, premium denim. The Company’s newest private brand, launched in early fiscal year 2015, is Crown and Ivy, an updated, better sportswear line for women offered in stores and on belk.com.
During fiscal year 2014, the Company conducted its second Southern Designer Showcase competition, selecting 13 winners from nearly 300 entrants. The winning fashion designers, whose merchandise reflects the latest in Modern.Southern.Style., will offer exclusive new looks in women’s apparel, jewelry, handbags, and children’s apparel to Belk customers. Winning designers will be available for sale in select Belk stores and on belk.com beginning in spring 2014.
The Company established its own fine jewelry business in fiscal year 2007, with buying and administrative offices at the corporate office in Charlotte and a state of the art repair and distribution center located in Ridgeland, Mississippi. The shops replaced the Company’s former leased fine jewelry operations and offer expanded assortments of high quality diamond jewelry; rubies, emeralds, and other fine gemstones; and top brands of fine watches and jewelry. During fiscal year 2014, the Company opened 6 new fine jewelry shops and was operating 159 fine jewelry shops in its stores and on belk.com under the “Belk and Co. Fine Jewelers” name as of the fiscal year end.
MARKETINGAND BRANDING
The Company’s marketing and sales promotion strategy seeks to attract customers to shop at Belk by keeping them informed of the latest fashion trends, merchandise offerings, and sales promotions through as combination of advertising and interactive media, circulars, broadcast, Internet, social media (including Facebook, Twitter, and YouTube) and in-store special events. Belk uses its proprietary database to communicate directly to key customer constituencies with special offers designed to appeal to these specific audiences. The sales promotions are designed to promote attractive merchandise brands and styles at compelling price values with adequate inventories planned and allocated to ensure that stores will be in stock on featured merchandise.
The Company employs strategic marketing initiatives to develop and enhance the equity of the Belk brand and to create and strengthen “one-on-one” relationships with customers. The Company’s marketing strategy involves a combination of mass media print and broadcast advertising, direct marketing, Internet marketing, comprehensive store visual merchandising, and signing and in-store special events, such as trunk shows, celebrity and designer appearances, Charity Sale, Educator Appreciation Day, Healthcare Appreciation Day, and Senior Day.
During fiscal year 2012, the Company became the title sponsor of the annual Belk Bowl college football bowl held at Bank of America Stadium in Charlotte, North Carolina. The game is televised nationally on ESPN and provides a vehicle for the Company to market the Belk brand beyond its geographic footprint. In the fourth quarter of fiscal year 2014, Belk announced as agreement with the Southeastern Conference that will bring a Southeastern Conference team to the Belk Bowl to face an Atlantic Coast Conference (ACC) opponent starting in 2014.
Belk has planned a year of Modern.Southern.Music. celebrations and special events for fiscal year 2015, including a Southern musician showcase competition and a concert sweepstakes, that will pay homage to pop country, Americana, blues, jazz, and bluegrass music. Award winning actress Hayden Panettiere will serve as ambassador for the Belk brand during the campaign through ads, special appearances, and promoting Belk via social media. Belk also partnered with Lifetime’s Project Runway show to sponsor its accessory wall and conduct a Modern.Southern.Style. Design challenge that aired in fall 2013 with a Belk executive serving as a guest judge. Belk plans to offer Project Runway merchandise in select stores and online beginning in spring 2014.
OMNICHANNEL
The Company has undertaken a multiyear Omnichannel initiative designed to address customers’ rapidly changing shopping preferences and service expectations by creating a consistent, compelling, and seamless shopping experience in stores and online. In fiscal year 2014, the Company introduced is “Yes, We Have IT!” program consisting of an item locator initiative, which generates incremental demand by helping customers order inventory not available in a particular location, and a store fulfillment initiative,
which allows certain stores to function as supplemental fulfillment centers. Store fulfillment efforts were launched as a pilot in fiscal year 2014 with a network of 17 store locations that filled both item locator and belk.com orders. The Company plans to expand its item locator and store fulfillment efforts in fiscal year 2015. Future Omnichannel programs include a new digital platform solution and store technology enhancements, such as new touch-screen sales register with access to belk.com, wireless scanners, new pin pads, and in-store Wi-Fi. In fiscal year 2014, the new store technology was piloted in one store, and the Company plans to expand the number of trial stores in fiscal year 2015 in preparation for a broader roll-out to all stores over the following two years.
ECOMMERCE
The Company continues to grow its eCommerce business and expand capabilities of its belk.com website, which features a wide assortment of fashion apparel, accessories, shoes and cosmetics, plus home and gift merchandise. Many leading national brands are offered at belk.com along with the Company’s exclusive private brands. The website also provides information about the Company, including its history, career opportunities, community involvement, diversity and sustainability initiatives, a Company media room, its Securities and Exchange Commission (SEC) filings, and more.
In fiscal year 2014, the Company strengthened its eCommerce business and belk.com website with systems improvements, expansion of merchandise assortments, increased multimedia marketing and implementation of social community engagement strategies. Belk shopping apps for mobile smartphone and tablet devices were also introduced, along with a new Belk mobile website. The Company expanded its eCommerce fulfillment center in Pineville, North Carolina in fiscal year 2011. In fiscal year 2013, Belk began operating a 515,000 square foot fulfillment center in Jonesville, South Carolina, expanding its processing and storage capacity in fiscal year 2014.
BELK PROPRIETARY CHARGE PROGRAMS
In fiscal year 2014, Belk extended its program agreement with GE Capital Retail Bank (GECRB), an affiliate of GE Consumer Finance, through December 2017. Together, GECRB and Belk will continue to plan and execute enhanced marketing programs designed to recognize and reward Belk card customers, attract profitable new customers, and increase sales from existing card customers. The Company’s customer loyalty program (known as the Belk Rewards Card Loyalty Program) issues certificates for discounts on future purchases to Belk Rewards Card customers based on their spending levels. The rewards program is cumulative, issuing a $10 certificate for every 400 points earned in a calendar year. Belk Rewards Card customers whose purchases total $600 or more in a calendar year qualify for a Belk Premier Rewards Card that entitles them to unlimited free gift wrapping and basic alterations, an interest-free flex pay plan account, and notifications of special savings and sales events. Customer who spend more than $1,500 annually at Belk qualify for a Belk Elite Rewards Card that offers additional benefits, including a specially designed black Elite credit card, free shipping for belk.com and store purchases, triple points events, a 20 percent off birthday shopping pass, points that never expire, and quarterly “Pick Your Own Sale Days.”
SYSTEMSAND TECHNOLOGY
The Company continued to make substantial investments in technology and information systems during fiscal year 2014 to support sales and merchandising initiatives, reduce costs, improve core business processes, and support its overall business strategy. These investments included people, processes, and technology. Key systems initiatives included the final deployment of Project SMART, the Company’s
strategic merchandising, and retail technology program. The final phase of Project SMART incorporated implementation of a merchandise allocation solution, purchase order management, retail stock ledger software, and other systems and technology solutions. The Company plans additional investments in these solutions to enhance and build upon its technology and business processes in fiscal year 2015.
The Company also made significant investments in fiscal year 2014 for enhancements to the belk.com website and its fulfillment capabilities. In addition to these customer facing technologies, the Company began deployment of a new workforce management system to more effectively align store staffing with customer traffic patterns and implemented talent management tools, and other solutions designed to enhance data security across the Company. Belk expects to continue making significant investments in its information systems and new technology in the following fiscal year.
INVENTORY MANAGEMENTAND LOGISTICS
The Company currently operates five distribution facilities that receive and process merchandise for delivery to Belk stores and belk.com customers. A 410,000 square foot distribution center in Blythewood, South Carolina, services the stores located in the northern and eastern areas of the Company’s footprint; a 174,000 square foot distribution center at the Greater Jackson Industrial Park in Byram, Mississippi, services the central and western areas; an 8,300 square foot distribution center in Ridgeland, Mississippi, services the Company’s fine jewelry operations; and a 259,000 square foot fulfillment center in Pineville, North Carolina, services orders from the belk.com website. In fiscal year 2013, the Company began operating a 515,000 square foot fulfillment center in Jonesville, South Carolina, that also services belk.com orders and expanded the center’s processing and storage capacity in fiscal year 2014. The “store ready” merchandise receiving processes used in the Company’s distribution centers enable stores to receive and process merchandise shipments and move goods to the sales floor quickly and efficiently.
SUSTAINABILITYAND PHILANTHROPY
The Company continued implementation of sustainability initiatives aimed at fulfilling its commitments to be a good steward of the environment by eliminating waste, conserving energy, using resources more reasonably, and embracing and promoting sustainable practices. Current initiatives include expanding the recycling of cardboard, hangers, and plastic; increasing energy efficiency; implementing sustainability in store construction and maintenance; reducing product packaging materials; and using solar energy. During fiscal year 2014, the Company continued to implement energy efficient LED lighting systems, retrofitting stores with other energy efficient lighting, and installed variable frequency derived to reduce energy consumption by mechanical systems. The Company also continued its employee environment giving campaign and partnered with EarthShare and the HERproject, which links multinational companies and their factories to create sustainable workplace programs that increase women’s health awareness.
In fiscal year 2014, the Company and its associates, customers, and vendors contributed over $20.9 million to local communities. Of that amount, the Company funded $7.3 million to over 250 nonprofit organizations with a focus on education, breast cancer research and awareness, and community strengthening. The remainder of the funding included associate, vendor, and customer dollars raised in Belk-led charitable initiatives, including the semi-annual Belk Charity Sale, local United Way campaigns, the American Heart Association’s “Our Heart to Yours” campaign, and the Susan G. Komen for the Cure campaign. During fiscal year 2014, in partnership with Charlotte Radiology and Foundation for the Carolinas, Belk announced an approximate $6 million, multiyear investment in the Belk Gives on the Go Mobile Mammography Center. In 2014, the Center will visit more than 100 Southern cities, delivering breast cancer screenings and spreading awareness across the South. As of the fiscal 2014 year end, the Center had screened more than 4,500 women.
STORE LOCATIONSAND DISTRIBUTION
Belk’s 299 stores in the southern U.S. have approximately 22.6 million selling square feet in following 16 states:
| | | | | | |
| Alabama – 22 | | Kentucky – 6 | | Missouri – 1 | | Tennessee – 23 |
| | | |
| Arkansas – 7 | | Louisiana – 4 | | North Carolina – 69 | | Texas – 14 |
| | | |
| Florida – 26 | | Maryland – 2 | | Oklahoma – 3 | | Virginia – 20 |
| | | |
| Georgia – 45 | | Mississippi – 16 | | South Carolina – 37 | | West Virginia – 4 |
Although the Company operates 94 stores that exceed 100,000 square feet in size, the majority of Belk stores range in size from 60,000 to 100,000 square feet. Most of the Belk stores are anchor tenants in major regional malls or in open-air shopping centers in medium and smaller markets.
Belk stores are located in regional malls (147), strip shopping centers (104), “power” centers (27), and “lifestyle” centers (21). Additionally, there are two freestanding stores. Approximately 80 percent of the gross square footage of the typical Belk store is devoted selling space to ensure maximum operating efficiencies. New and renovated stores feature the latest in retail design, including updated exteriors and interiors. The interiors are designed to create an exciting, comfortable, and convenient shopping environment for customers. They include the latest lighting and merchandise fixtures, as well as quality decorative floor and wall coverings and other special décor. The store layout is designed to ease of shopping, and store signage is used to help customers identify and locate merchandise.
As of the end of fiscal year end 2014, the Company owned 75 store buildings, leased 161 store buildings under operating leases, and owned 77 store buildings under ground leases. The typical operating lease has an initial term of between 15 and 20 years, with four renewal periods of five years each, exercisable at the Company’s option. The typical ground lease has an initial term of 20 years, with a minimum of four renewal periods of five years each, exercisable at the Company’s option.
ASSOCIATES
As of the end of fiscal year 2014, the Company has approximately 24,700 full-time and part-time associates. Because of the seasonal nature of the retail business, the number of associates fluctuates from time to time and is highest during the holiday shopping period in November and December. The Company as a whole considers its relations with associates to be good. None of the associates of the Company are represented by unions or subject to collective bargaining agreements.
INDUSTRYAND COMPETITION
The Company operates department stores in the highly competitive retail industry. Management believes that the principal competitive factors for retail department store operators include merchandise selection, quality, value, customer service, and convenience. The Company believes its stores are strong competitors in all of these areas. The Company’s primary competitors are traditional department stores, mass merchandisers, national apparel chains, individual specialty apparel stores, and direct merchant firms, including Macy’s, Inc.; Dillard’s, Inc.; Nordstrom, Inc.; Kohl’s Corporation; Target Corporation Sears Holding Corporation; TJX Companies, Inc.; Wal-Mart Stores, Inc.; J.C. Penney Company, Inc.; and Amazon.com, Inc.
LEGAL PROCEEDINGS
In the ordinary course of business, the Company is subject to various legal proceedings and claims. The Company believes that the ultimate outcome of these matters will not have a material adverse effect on its consolidated financial position on results of operations.
MANAGEMENT’S DISCUSSIONAND ANALYSISOF FINANCIAL CONDITIONAND RESULTS
As shown on Exhibit 3, the Company’s total revenue increased 2.1 percent in fiscal year 2014 to $4.0 billion. Comparable store revenue increased 2.9 percent as a result of continued strong eCommerce sales and execution of the Company’s key strategic initiatives. Belk eCommerce revenue increased by $57.5 million, or 42.5 percent, and contributed 1.5 percent of the 2.9 percent comparable store revenue for the period. The Company calculates comparable store revenue as sales from stores that have reached the one-year anniversary of their opening as of the beginning of the fiscal year and eCommerce revenue, but excludes closed stores. Stores undergoing remodeling, expansion, or relocation remain in the comparable store revenue calculation. Definitions and calculations of comparable store revenue differ among companies in the retail industry.
Operating income decreased to $288.3 million in fiscal year 2014 compared to $339.9 million in fiscal year 2013. Net income decreased to $158.5 million or $3.82 per basic share and $3.79 per diluted share in fiscal year 2014 compared to $188.4 million or $4.34 per basic share and $4.31 per diluted share in fiscal year 2013. The decrease in net income was due primarily to a lower margin rate and higher expenses associated with the Company’s investments in key strategic initiatives, including the launch of a new information technology (IT) platform that included a new merchandising system and the replacement of much of the Company’s IT infrastructure.
Management believes that consumers will remain focused on value in fiscal year 2015. The Company intends to continue to be flexible in sales and inventory planning and in expense management in order to react to changes in consumer demand. Although the Company expects that operations will be influenced by general economic conditions, including rising food, fuel, and energy prices, management does not believe that inflation has had a material effect on the Company’s results of operations. However, there can be no assurance that the Belk business will not be affected by such factors in the future.
Belk seeks to provide customers with a convenient and enjoyable shopping experience both in stores and online at belk.com, by offering an appealing merchandise mix that includes extensive assortments of brands, styles, and sizes. Belk stores and belk.com sell top national brands of fashion apparel, shoes, and accessories for women, men, and children, as well as cosmetics, home furnishings, housewares, fine jewelry, gifts, and other types of quality merchandise. The Company also sells exclusive private label brands, which offer customers differentiated merchandise selections. Larger Belk stores may include hair salons, spas, restaurants, optical centers, and other amenities.
The Company seeks to be the leading department store in its markets by selling merchandise to customers that meet their needs for fashion, selection, value, quality, and service. To achieve this goal, Belk’s business strategy focuses on quality merchandise assortments, effective marketing and sales promotional strategies, attracting and retaining talented, well-qualified associates to deliver superior customer service, and operating efficiently with investments in IT and process improvements.
The Company continues to grow its eCommerce business and expand the capabilities of its belk.com website, which features a wide assortment of fashion apparel, accessories, shoes and cosmetics, plus home and gift merchandise. Many leading national brands are offered at belk.com along with the Company’s exclusive private brands. The Company generated eCommerce revenue of $192.7 million, $135.2 million, and $72.4 million in fiscal years 2014, 2013, and 2012, respectively. On a 52- versus 53-week basis, eCommerce revenue increased 44.6 percent, 84.0 percent, and 108.1 percent, and contributed 1.5 percent, 1.6 percent, and 1.0 percent to the comparable store revenue increases in fiscal years 2104, 2013, and 2012, respectively.
COMPANY MANAGEMENT
The following individuals are the key management of Belk.
Thomas M. Belk Jr. – chairman, chief executive officer, and member of executive committee
| | • | | Mr. Belk has been the Belk chairman and chief executive officer since May 2004 and is an officer and director of various Belk subsidiaries. He served as president, store divisions and real estate from May 1998 until May 2004. He served as an officer and director of most of the Belk Companies until May 1998 and has been employed in the Belk retail organization in various positions since 1981. He is past chairman of the Charlotte Chamber of Commerce and serves on the boards of The Orvis Company, Inc.; the National Retail Federation; the Mecklenburg County Council of the Boy Scouts of America; the Carolinas Healthcare System; and St. Andrews School. Mr. Belk is the brother of H.W. McKay Belk and John R. Belk. |
John R. Belk – president, chief operating officer, director, member of executive committee, and member of nominating and corporate governance committee
| | • | | Mr. Belk has been the Belk president and chief operating officer since May 2004 and is an officer and director of various Belk subsidiaries. He served as president, finance, systems, and operations from May 1998 until May 2004. He also served as an officer and director of most of the Belk Companies until May 1998 and has been employed in the Belk retail organization in various positions since 1986. Mr. Belk served on the boards of directors of Alltel Corporation from 1996 to 2007; the Bank of America Corporation from 2001 to 2004; and Harris Teeter Supermarkets, Inc., from 1997 to 2013. He currently serves on the board of directors of the YMCA of Greater Charlotte. Mr. Belk is the brother of Thomas M. Belk Jr. and H.W. McKay Belk. |
Kathryn J. Bufano – president and chief merchandising officer
| | • | | Ms. Bufano has served as the Belk president and chief merchandising officer since August 2010 and previously served as the Belk president, merchandising and marketing from January 2008 to August 2010. From 2006 to January 2008, Ms. Bufano was the chief executive officer of Vanity Shops, Inc., in Fargo, North Dakota. From 2003 to 2006, Ms. Bufano pursued higher education. From 2002 to 2003, she was executive vice president, general manager Soft-lines for Sears Roebuck & Company in Hoffman Estates, Illinois. Prior to 2002, Ms. Bufano served as president, chief merchandising officer for Dress Barn, Inc., and in various positions in the Macy’s East and Lord & Taylor divisions of Federated Department Stores. Ms. Bufano currently serves on the board of trustees of the Mint Museum of Art. |
Ralph A. Pitts – executive vice president, general counsel, and secretary
| | • | | Mr. Pitts has served as the Belk executive vice president, general counsel, and secretary since May 1998. Mr. Pitts has been executive vice president and general counsel of Belk Stores Services, Inc. (BSS), a subsidiary of Belk, since 1995. From 1985 to 1995, he was a partner in the law firm of King & Spalding LLP in Atlanta, Georgia. Mr. Pitts is chairman of the board of trustees of Central Piedmont Community College and a member of the executive board of the Mecklenburg County Council of the Boy Scouts of America. |
Adam M. Orvos – executive vice president of human resources and chief financial officer
| | • | | Mr. Orvos has served as the Belk executive vice president and chief financial officer since May 5, 2013. Prior to that time, he served as executive vice president human resources since April 2009 and was the senior vice president of finance and controller from April 2006 to April 2009. Mr. Orvos was previously employed by the Foley’s Division of the May Department Stores Company as senior vice president and chief financial officer from 2004 to 2006 and as vice president and controller from 2000 to 2004. |
Rodney F. Samples – vice president, chief accounting officer, controller
| | • | | Mr. Samples has been the principal accounting officer, controller, and vice president of Belk since April 3, 2009. Mr. Samples joined Belk in June 2007 as vice president of financial reporting and accounting since that time. He served as controller of Belk since April 3, 2009. Prior to joining Belk, Mr. Samples was employed by Saks Incorporated where he served as vice president and corporate controller from 2001 to 2005 and senior vice president and corporate controller from 2005 to 2007. |
BOARDOF DIRECTORS
The following individuals are the directors of the board of directors (the “Board”) of Belk.
Thomas M. Belk Jr. – chairman, chief executive officer, and member of executive committee
| | • | | Mr. Belk has over 30 years of business experience in the retail sector and has a unique insight into the Belk business. His service as a director for other companies and leadership of non-profit organizations provides him with broad experience on governance issues. He has been a director since 1998. |
John R. Belk – president, chief operating officer, director, member of executive committee, and member of nominating and corporate governance committee
| | • | | Mr. Belk has over 25 years of business experience in the retail sector and has a unique insight into the Belk business. His service as a director for other public companies also provides him with broad experience on governance issues. He has been a director since 1998. |
H.W. McKay Belk – director and member of executive committee
| | • | | Mr. Belk is the managing director of HWMB Advisors, LLC, a business consulting firm. Mr. Belk served as the Belk vice chairman from August 2010 until his retirement in January 2012. He served as president and chief merchandising officer from May 2004 until August 2010 and as president, merchandising, marketing, and merchandise planning from May 1998 until May 2004. He served as an officer and director of most of the separate predecessor Belk Companies (the “Belk Companies”) until May 1998 and was employed in the Belk retail organization in various positions from June 1979 until January 2012. Mr. Belk is currently a director, member of the audit, compensation, and executive committees of Coca-Cola Bottling Co. Consolidated and a director, chair of the compensation committee, and member of the audit committee of BeechTree Labs, Inc. He is a past director of the North Carolina Chamber of Commerce, past chairman of the Charlotte Chamber of Commerce, and past member of the board of trustees of Charlotte Latin School. Mr. Belk currently serves on the board of trustees of the Crossnore School. Mr. Belk is the brother of Thomas M. Belk Jr. and John R. Belk. |
| | • | | Mr. Belk has over 30 years of business experience in the retail sector and has a unique insight into the Belk business. His service as a director for other companies and leadership of non-profit organizations provides him with broad experience on governance issues. He has been a director since 1998. |
Thomas C. Nelson – director and chairman of audit committee
| | • | | Mr. Nelson has served as the president and chief executive officer of National Gypsum Company, a building products manufacturer, since 1999 and was elected chairman of the board in January 2005. From 1995 to 1999, Mr. Nelson served as the vice chairman and chief financial officer of National Gypsum Company. He is also a general partner of Wakefield Group, a North Carolina based venture capital firm. Mr. Nelson previously worked for Morgan Stanley and Co. and in the United States Defense Department as assistant to the secretary and White House fellow. He also serves as a director of Yum! Brands, Inc. |
| | • | | Mr. Nelson has significant leadership experience as a chief executive officer and chairman of a company. He also has experience in investment banking and private equity investing. His service as a director for other public and private companies provides him with broad experience on governance issues. He has been a director since 2003. |
Elizabeth Valk Long – director and chairman of compensation committee
| | • | | Ms. Long was an executive vice president of Time Inc., a subsidiary of Time Warner, from May 1995 until her retirement in August 2001. She was the first woman to hold the position of publisher at Time Inc., serving in that capacity forLife,People, andTime magazines. From 2002 until 2006, she served as a director of Jefferson Pilot Corporation, and she currently serves on the boards of directors of Steelcase Corporation and J.M. Smucker Company. She is also a trustee of St. Timothy’s School in Maryland. |
| | • | | Ms. Long brings many years of leadership experience to the Belk board. Her service as a director for other public companies also provides her with broad experience on governance. She has been a director since 2004. |
John L. Townsend III – director, chairman of nominating and corporate governance committee, and member of audit committee
| | • | | Since January 2013, Mr. Townsend has been senior advisor of Tiger Management LLC, an investment management business. From 2010 until January 2013, he was managing partner and chief operating officer of Tiger Management LLC. From 2002 until 2010, he was a private investor. Mr. Townsend was employed by Goldman, Sachs & Co. from 1987 until his retirement as an advisory director in 2002. Prior to his retirement, Mr. Townsend served as a managing director and general partner of Goldman Sachs with responsibility for a variety of businesses within the investment banking division. Mr. Townsend currently serves as a director of International Paper Company and the Heritage Group, chairman of the Townsend Family Foundation, and a member of the Riverstone Group, a private investment fund. He also is a member of the board of directors of the University of North Carolina Investment Fund, Inc., the board of visitors of the Kenan-Flagler Business School of the University of North Carolina, the investment committee of the Smith Richardson Foundation, and the boards of trustees of Greenwich Hospital, the Grand Teton National Park Foundation and the U.S. Ski and Snowboard Team Foundation. |
| | • | | Mr. Townsend has significant experience in investment banking and financial management and broad leadership experience in the public and private sectors. His service as a director for other companies and organizations provides him with broad experience on governance issues. He has been a director since 2005. |
John R. Thompson – director, member of nominating and corporate governance committee, and member of compensation committee
| | • | | Mr. Thompson is a government relations consultant for Best Buy Co., Inc., and retired senior vice president and general manager of BestBuy.com, a subsidiary of Best Buy Co., Inc., a retailer of consumer electronics, home-office equipment, entertainment software, and major appliances. Mr. Thompson joined Best Buy in April 2001 as senior vice president of supply chain and business systems. From February 1995 to March 2001, he was chief information officer and senior vice president for customer service, information systems, distribution, logistics, and, e-business at Liz Claiborne, Inc. From February 1993 to February 1995, Mr. Thompson was chief information officer and executive vice president at Goody’s Family Clothing, Inc. From 2004 to 2008, he served on the board of directors of Wendy’s/Arby’s International, Inc. Mr. Thompson currently serves on the board of directors of Norfolk Southern Corporation, Cristo Rey Jesuit High Schools network, and the Congressional Black Caucus Foundation. |
| | • | | Mr. Thompson has broad leadership experience in several retail businesses, as well as experience in eCommerce, retail distribution, and logistics. His service as a director for other companies and non-profit organizations also provides him with broad experience on governance issues. He has been a director since 2006. |
Jerri L. DeVard – director and member of compensation committee
| | • | | Ms. DeVard has served as senior vice president and chief marketing officer of The ADT Corporation since March 2014. From 2007 to 2010 and from July 2012 to March 2014, Ms. DeVard was principal of DeVard Marketing Group, a firm that specializes in advertising, branding, communications, and traditional/digital/multicultural marketing strategies. From January 2011 until July 2012, Ms. DeVard was executive vice president of marketing for Nokia. Prior to forming DeVard Marketing Group, Ms. DeVard served as the senior vice president of |
| | marketing of Verizon Communications, Inc., a provider of communications services, from 2005 until 2008 and as the senior vice president, marketing communications and brand management from 2003 until 2005. Prior to 2003, she held a variety of positions, including chief marketing officer of the eCommerce business at Citibank N.A.; vice president of marketing for Revlon Inc.’s color cosmetics; vice president of marketing for Harrah’s Entertainment; director of marketing for the NFL’s Minnesota Vikings; and several brand management positions at the Pillsbury Company. Ms. DeVard currently serves as a member of the Spelman College board of trustees. She was formerly a member of the PepsiCo African American advisory board, a director of Gurwitch Products, and a director of Tommy Hilfiger Corporation. |
| | • | | Ms. DeVard brings many years of significant marketing and leadership experience to the Belk board. Her leadership and service as a director for other companies also provides her with broad experience on governance issues. She has been a director since 2010. |
Erskine B. Bowles – director and member of audit committee
| | • | | Mr. Bowles has been president emeritus of the University of North Carolina since January 2011, senior advisor to Carousel Capital since 2002, and senior advisor to BDT Capital since January 2012. He served as co-chair of the National Commission on Fiscal Responsibility and Reform from February 2010 to December 2010. Mr. Bowles was president of the University of North Carolina from 2006 to 2010, and previously served as United Nations Under Secretary General, Special Envoy for Tsunami Recovery from March 2005 to August 2005. From 1999 until 2001, he was managing director of Carousel Capital and partner of Forstmann Little & Co., and from 1996 until 1998, he served as White House Chief of Staff under President Clinton. Mr. Bowles is currently a director of Morgan Stanley, Norfolk Southern Corporation, and Facebook. He was formerly a director the following public companies: General Motors, North Carolina Mutual Life Insurance Company, Merck & Co., Inc., VF Corporation, First Union Corporation, Wachovia Corporation, Krispy Kreme Doughnut Corporation, and Cousins Properties, Inc. |
| | • | | Mr. Bowles has broad leadership experience in the public and private sectors with specific expertise in investment banking and financial management. His extensive service as a public company director provides him with broad experience on a wide range of corporate governance issues. He has been a director since 2011. |
CAPITALIZATIONAND EQUITY OWNERSHIP
In May 1998, Belk completed a merger of 112 individual operating companies (the “Companies”) into a single collective corporate ownership entity. As a direct result, the existing shareholders of the Companies received Class A common stock in the new company (Belk, Inc.) in exchange for the shares of their respective existing corporations. Each Class A common shareholder is entitled to 10 votes per share.
The Class A stock is not restricted, but will automatically convert to Class B common stock if they are transferred to a party that is not a lineal descendant or defined affiliate of the original stockholder. Each Class B common shareholder is entitled to one vote per share. As of the valuation date, only a minor fraction of the shares had undergone such conversion.2
| 2 | As of the valuation date, there were 40,990,916 total Belk shares issued and outstanding. Of these, 40,063,026 shares (or 97.64 percent) were Class A shares and the remaining 927,890 shares (or 2.26 percent) were Class B shares. |
Belk stock did not historically trade on any organized securities market. An informal market developed over the years with the Belk corporate secretary’s office acting as a clearinghouse by keeping a list of shareholders who indicated if they wished either to buy or sell Belk stock. The parties could then contact each other and directly negotiate a sale. Subsequently, sometime after 2000, a local stock broker in Charlotte began to act in a similar capacity, and the Company eventually abandoned its informal activities in introducing potential buyers and sellers.3 In May 2005, Belk stock received National of Securities Dealers (NASD) trading symbols (OTCBB:BLKI.A and OTCBB:BLKI.B for Class A and Class B shares, respectively), reflecting the fact that trades for which a broker acts as intermediary have to be run through the NASD trading system. Trading volume remains very sparse with only one to three brokerage firms indicating an interest in making a market in the shares at any one time.4 Also, the two classes of stock often track one another in tandem, as shown on Exhibit 15 c in Appendix A.
TENDER OFFERS
From time to time, Belk makes a tender offer for a limited number of its shares. The following chart summarizes the history of recent tender offers (the “Offers”).
| | | | | | | | | | | | | | | | |
Date | | Authorized
Tender | | | Price per
Share | | | # of Shares
Tendered | | | Total Value of
Tender Offer | |
May 2006 | | $ | 49,400,000 | | | $ | 19.00 | | | | 2,057,757 | | | $ | 39,097,383 | |
April 2007 | | $ | 49,600,000 | | | $ | 31.00 | | | | 781,484 | | | $ | 24,226,004 | |
May 2008 | | $ | 25,600,000 | | | $ | 25.60 | | | | 872,958 | | | $ | 22,347,725 | |
May 2009 | | $ | 6,000,000 | | | $ | 11.90 | | | | 241,664 | | | $ | 2,875,802 | |
May 2010 | | $ | 74,900,000 | | | $ | 26.00 | | | | 1,977,541 | | | $ | 51,416,066 | |
March 2011 | | $ | 74,200,000 | | | $ | 33.70 | | | | 1,631,942 | | | $ | 54,996,445 | |
May 2012 | | $ | 99,960,000 | | | $ | 40.80 | | | | 2,501,145 | | | $ | 102,046,716 | |
May 2013 | | $ | 100,000,000 | | | $ | 50.00 | | | | 2,038,229 | | | $ | 101,911,450 | |
The purpose of the Offers is part of a plan accepted by the Board to enhance stockholder value and provide occasional liquidity for stockholders. From discussions with management and members of the Board, Belk plans to periodically consider tender offers for shares. We understand such a tender offer will be considered this year at the Belk Board meeting in March. However, Company management has indicated that such offers are not and would never be done regularly or routinely, and the Board has not committed to approve any particular tender offer regularly or to commit to any amount or other terms of any such tender offers if one is recommended by management.
DIVIDENDS
On March 28, 2012, the Company declared a regular dividend of $0.75. On December 11, 2012, the Company declared an accelerated dividend consisting of a regular dividend of $0.75 and a special one-time additional dividend of $0.25 on each share of Class A and Class B common stock outstanding on that date. As a result, management did not recommend, nor did the Board authorize, the payment of any dividends during calendar year 2013. For calendar year 2014, however, management anticipates to recommend the Board authorize an $0.80 dividend (or a 6.67 percent increase from the prior $0.75 dividend).
| 3 | Robert L. Stiles Jr. of RBC Dain Raucher. |
| 4 | Dain Raucher accounts for the lion’s share of these trades. |
The amount of dividends paid out with respect to fiscal year 2014 and each subsequent year will be determined at the sole discretion of the Board based upon the Company’s results of operations, financial condition, cash requirements, and other factors deemed relevant by the Board. As of April 4, 2014, there were approximately 544 holders of record of the Class A common stock and 331 holders of record of the Class B common stock.
FINANCIAL STATEMENT ANALYSIS
An essential step in the valuation of any company is an analysis of its performance over time. Past sales and earnings growth can provide an indication of future growth and can put a company’s earnings in a historical context. Other things being equal, a company with rapidly rising sales and earnings is worth more than one with little or no growth. The following section examines key trends in Belk’s financial statements during the latest five-year period.
Balance Sheets
Belk’s balance sheets as of or near January 31, 2009 through 2014 (February 1, 2014, “FYE 2014” or the “LTM period”) is incorporated in Exhibit 2 of Appendix A.
| | • | | Cash and cash equivalents increased over the period analyzed from $260.1 million as of FYE 2009 (or 10.4 percent of total assets) to $295.3 million as of FYE 2014 (or 11.5 percent of total assets). |
| | • | | Accounts receivable, net increased over the period analyzed from $34.0 million as of FYE 2009 (or 1.4 percent of total assets) to $55.3 million as of FYE 2014 (or 2.2 percent of total assets). |
| | • | | Merchandise inventory, which is accounted for using the retail inventory method (RIM), increased over the period from $828.5 million as of FYE 2009 (or 33.1 percent of total assets) to $987.8 million as of FYE 2014 (or 38.5 percent of total assets). |
| | • | | Prepaid expenses and other receivables decreased over the period from $30.7 million as of FYE 2009 (or 1.2 percent of total assets) to $29.0 million as of FYE 2014 (or 1.1 percent of total assets). |
| | • | | Net fixed assets totaled $1.16 billion as of FYE 2014 (or 45.2 percent of total assets). Net fixed assets had declined from $1.17 billion, or 46.7 percent of total assets, as of FYE 2009. |
| | • | | Other assets decreased over the period analyzed from $170.1 million as of FYE 2009 (or 6.8 percent of total assets) to $39.2 million as of FYE 2014 (or 1.5 percent of total assets). |
| | • | | The Company’s total assets increased from $2.50 billion as of FYE 2009 to $2.56 billion as of FYE 2014. |
| | • | | Current liabilities increased from $356.3 million as of FYE 2009 (or 14.2 percent of total liabilities and shareholders’ equity) to $586.8 million as of FYE 2014 (or 22.9 percent of total liabilities and shareholders’ equity). Accounts payable was the largest portion of current liabilities, which totaled $291.9 million as of FYE 2014 (or 11.4 percent of total liabilities and shareholders’ equity), followed by accrued expenses of $239.7 million as of FYE 2014 (or 9.3 percent of total liabilities and shareholders’ equity). |
| | • | | Long-term liabilities have decreased over the period analyzed, from $1.11 billion as of FYE 2009 (or 44.5 percent of total liabilities and shareholders’ equity) to $619.6 million as of FYE 2014 (or 24.2 percent of total liabilities and shareholders’ equity). Long-term debt and capital leases, less current portions represented the largest long-term liability as of FYE 2014, which totaled $385.7 million (or 15.0 percent of total liabilities and shareholders’ equity) followed by deferred compensation and other long-term liabilities of $217.3 million (or 8.5 percent of total liabilities and shareholders’ equity). |
| | • | | Total shareholders’ equity increased over the period analyzed from $1.03 billion as of FYE 2009 (or 41.2 percent of total liabilities and shareholders’ equity) to $1.36 billion as of FYE 2014 (or 53.0 percent of total liabilities and shareholders’ equity), primarily driven by the Company’s stock redemption policy. |
Income Statements
Belk’s income statements for the fiscal years ended on or near FYE 2008 through FYE 2013 (the “LTM period”) are incorporated in Exhibit 3 of Appendix A.
| | • | | Belk revenue increased from $3.50 billion as of FYE 2009 to $4.04 billion as of FYE 2014, a compound annual growth rate of 2.9 percent. Belk total operating revenue increased 2.1 percent from FYE 2013 to FYE 2014, primarily attributable to (1) a continuation of improved sales trends in both comparable store sales and eCommerce sales from the rebranding effort, (2) sales and discounts in fourth quarter, (3) varied merchandise selections, (4) Belk’s devoted customer base, and (5) the investments in technology. As of fiscal year ended 2014, Belk merchandise revenue was divided accordingly: women’s (32 percent), cosmetics, shoes, and accessories (34 percent), men’s (18 percent), home (18 percent), and children’s (7 percent). |
| | • | | Cost of goods sold improved over the period analyzed as a percentage of revenue from 69.4 percent as of FYE 2009 to 67.4 percent as of FYE 2014. |
| | • | | Gross profit increased over the period analyzed from $1.07 billion as of FYE 2009 (or 30.6 percent of total revenue) to $1.32 billion as of FYE 2014 (or 32.6 percent of total revenue). |
| | • | | Income from operations increased to $288.3 million as of FYE 2014 (or 7.1 percent of total revenue) compared tonegative $232.6 million as of FYE 2009 (ornegative 6.6 percent of total revenue). |
| | • | | Pretax income increased over the period analyzed fromnegative $283.3 million as of FYE 2009 (ornegative 8.1 percent of total revenue) to $243.9 million as of FYE 2014 (or 6.0 percent of total revenue). |
| | • | | Net income increased to $158.5 million as of FYE 2014 (or 3.9 percent of total revenue) compared to a net income ofnegative $213.0 million as of FYE 2009 (ornegative 6.1 percent of total revenue). The increase in net income was due primarily to increased sales and improvement in financial margins. Further FYE 2009 financial performance was affected by the global recession. |
FINANCIAL STATEMENT ADJUSTMENTS
Investment return is determined by future cash flow. Expectations about a company’s business activity, its revenue, and operating returns, as measured by earnings and cash flow, are critical to assessing the value of a company and, hence, its common stock. If Belk’s operations have changed substantially over time in ways that make prior financial data less useful for determining present and prospective earning power, then it becomes necessary to adjust Belk’s income statement to account for these changes.
We made several adjustments to the operating data of Belk because we determined that these expense/income items understate/overstate the normal operations of the Company. These adjustments to normalize earnings are shown in Exhibit 4 and described as follows.
| | • | | Gains/losses on sales or property and equipment throughout the period analyzed were subtracted/added to pretax income. |
| | • | | Pension curtailment expenses were added back to pretax net income in FYE 2010. |
| | • | | Nonrecurring asset impairment and store closing costs were added/subtracted to earnings in the periods analyzed. |
| | • | | Losses on the extinguishment of debt were added back in FYE 2013 and FYE 2012. |
| | • | | Gains were subtracted on the sale of assets in FYE 2009 and 2010. |
Regarding any off-balance sheet arrangement(s), the Company has not provided any financial guarantees as of the valuation date. The Company has not created, and is not party to, any special-purpose or off-balance sheet entities for the purpose of raising capital, incurring debt, or operating the Company’s business. The Company does not have any arrangements or relationships with entities that are not consolidated into the financial statements that are reasonably likely to materially affect the Company’s liquidity or the availability of capital resources.
SUMMARYOF POSITIVEAND NEGATIVE FACTORS
Valuation methodology encompasses the analysis of (1) quantitative fundamental data and empirical capital market evidence and (2) qualitative factors relevant to a subject industry and company. The quantitative fundamental data and empirical capital market evidence will be discussed in later sections of this report. Qualitative factors generally refer to certain aspects specific to an industry or business that are critical in assessing the risk and expected return for such an investment. Perceptions of differences between Belk and comparable alternative investment opportunities provide a basis for identifying risk as well as return potential. The following is a summary of positive and negative qualitative factors pertaining to Belk.
Positive Factors
| | • | | Belk has been in existence since 1888 when William Henry Belk opened a small bargain store in Monroe, North Carolina. Today, there are approximately 299 Belk stores in 16 states (primarily in the Southeast), indicating moderate growth and stability over the years, transitioning from single locations, to malls, to shopping centers, to lifestyle centers, and, now, to eCommerce. |
| | • | | In the summer of 2006, Belk purchased the assets of Migerobe, Inc. (an independent company which had been operating jewelry counters within Belk stores) and began operating its own fine jewelry departments. In October 2006, Belk completed the purchase of Parisian department stores. The transaction netted Belk 38 new stores and the Company indicated that the purchase has strengthened its competitive advantage in key markets and substantially expanded its customer base. Belk managed to retain the key employees of the shoe department, which was |
| | Parisian’s top-performing department. Thus, the Company has shown the ability to acquire outside entities and successfully integrate them into Belk’s overall operations. Belk may look to grow by acquisition over the next five year; however, no immediate and contemplated targets were brought to our attention during our due diligence procedures. We understand Belk management has a goal to reach $6 billion in sales by FYE 2016. |
| | • | | In fiscal year 2014, the Company expanded its online capabilities, increased multimedia marketing, implemented social community engagement strategies, and expanded its fulfillment facilities. |
| | • | | Belk’s net debt (long term debt less cash and equivalents) as of FYE 2014 was approximately $98.4 million, down from $421.7 million as of FYE 2009. Cash (which, in this analysis, includes cash and cash equivalents, short-term investments, and investment securities) totaled $295.3 million and $271.5 million as of FYE 2014 and FYE 2009, respectively, as shown on Exhibit 4. |
| | • | | The Company declared a regular dividend of $0.75 per share for shareholders of record on December 11, 2012, along with a special one-time dividend of $0.20 per share. Company management expects future dividends will be approximately 20 percent of net income, although the decision for any dividend payout is made by the Board. Management is recommending to the Board an increase in the regular dividend of $0.75 per share, last paid in fiscal year 2012, to $0.80 per share. |
| | • | | In 2011, the Company began Project SMART (Strategic Merchandising and Retail Technology) which is part of the Company’s five year strategic plan that will invest $100 million in updating their Point of Sale system to work more closely with their growing eCommerce website and integrate their sales systems. Project SMART is a complete redesign of all merchandise and sales systems, which starts with merchandise planning, assortment, and orders and continues to receiving, distribution, the sales floor, point of sale and back to merchandise planning. It involves all points of the supply chain from planning to the customer sale. Project SMART is expected to improve supply chain management and efficiencies by transforming business processes and technology capabilities to sense and efficiently respond to customer demand. However, as noted below this is also considered a possible negative factor. These solutions drive renovation in technology began implementation in fiscal year 2014, wherein comparable sales are expected increase 80 basis points (bps) , margins by 40bps, and inventory turnover by 6.1bps and subsequent inventory reductions. The role-out has had a number of glitches which have created set-backs in complete implementation, but is anticipated to be fully implemented in the summer of 2014. |
| | • | | Belk launched a company-wide re-branding and corporate marketing initiative in October 2010 that includes a new logo and tag line, “Modern.Southern.Style.” New signs were installed in 60 stores before year-end 2010 with the balance installed in November of 2011. Newly designed charge cards were issued in October 2010 to Belk Elite and Premier customers, to be followed by Belk Rewards cardholders in March 2011. Belk’s new corporate identity is being supported by an extensive branding and advertising campaign that includes market-wide television and print advertising, circulars, direct mail, and social media, all of which incorporate Belk’s new graphic elements and brand messages. Based on discussion with Company management, customers welcomed the re-branding initiative, as based on customer surveys, and have been proven successful due to fiscal year 2012 results. |
| | • | | Belk supports charitable giving in the areas of education, building stronger communities, breast cancer awareness and research, and other charitable causes. In fiscal year 2014, Belk community contributions, including corporate, associates, vendors, and customers, made contributions that totaled approximately $20.9 million. |
| | • | | Belk has begun a multiyear investment into Omnichannel capabilities. Omnichannel is the next stepping stone from the Company’s enhancement projects in its technology infrastructure. These foundational investments are a key component of the Company’s strategy to deliver a seamless Omnichannel experience to customers. Omnichannel is an evolution in multi-channel retailing concentrated on a seamless approach to the consumer experience through all available shopping channels (i.e., mobile internet devices, computers, bricks-and-mortar, television, catalog, etc.). The Omnichannel strategy is reliant upon deploying specialized supply chain strategy software. To this goal, Belk added a new executive vice president for Omnichannel in February 2013—Dorlisa Flur. |
Negative Factors and Challenges
| | • | | In discussions with Company management, the year was not as strong as originally anticipated. In the second quarter of 2013, management began to see the U.S. consumer shift purchases to more durable goods such as automobiles. Going into the fourth quarter with less than stealer growth in H1, the Company was anticipating, yet again, a strong fourth quarter similar to FYE 2013. However, Q4 was disappointing. A shortened holiday shopping season, extreme weather conditions across the Southeast, and credit card thefts at Target Corporation limited the amount shoppers spent at department stores. Outside industry headwinds, the belk.com website crashed over the Black Friday weekend, with limited access and slow service. To counter downward trends in the fourth quarter, Belk increased sales and discounts to maintain competitiveness in the department store sector. The end result for the year was a modest 2.1 percent sales growth butnegative 0.4 percent contraction in gross profit. |
| | • | | Current unsettled economic, political, and business conditions could negatively affect the financial condition of Belk and results of operations. |
| | • | | Belk’s business depends upon the ability to anticipate the demands of customers for a wide variety of merchandise and services. Belk routinely makes predictions about the merchandise mix, quality, style, service, convenience, and credit availability of its customers. If Belk does not accurately anticipate changes in buying, charging, and payment behavior among customers, or consumer tastes, preferences, spending patterns, and other lifestyle decisions, it could result in an inventory imbalance and adversely affect performance and relationships with their customers. |
| | • | | Unseasonable and extreme weather conditions in the market areas Belk operates may adversely affect business results. In early calendar year 2014, Belk’s market territories saw some unusually adverse winter weather that inhibited sales. |
| | • | | The retail industry in which Belk operates is highly competitive. Belk faces competition from a myriad of other retailers such as department, specialty, off-price, and discount stores. Competition is characterized by many factors, including price, merchandise mix, quality, style, service, convenience, credit availability, and advertising. As the Company expands its eCommerce capabilities, Belk faces additional competition from online retailers. A significant shift in consumer buying patterns among these purchase channels could negatively impact revenues. |
| | • | | The investment community in particular sees the department store business as a segment of the retail industry that is in long-term decline unless it reinvents itself. |
| | • | | Although the Company’s stock has a ticker symbol (for both Class A and B shares), it is rarely traded over-the-counter and no public trading market of any significant depth or substance has developed for Belk’s stock. This is clearly evidenced by the scarcity of trades as shown on Exhibits 15 a through 15 c in Appendix A. |
| | • | | The Company’s corporate structure of Class A and Class B shares makes it an undesirable merger or takeover candidate. New outside investors acquiring shares from the founding stockholders who hold Class A shares automatically lose nine votes per share due to the conversion of Class A stock to Class B stock. This makes the assembly of a voting control block from the Belk family and the other founding families very difficult. |
| | • | | Belk is investing $100 million in information technology in Project SMART as part of a three-year rebuilding program. Company management indicated that Belk was trailing their competitors in this field, and has to play “catch-up.” The Company is investing significant resources into this program, and there are risks that their goals will be unachieved and adversely affect the Company’s financial performance. Specifically, these risks include inadequate or poor scoping, lack of executive commitment, insufficient budget allocation, inadequate change in management and training costs, an inexperienced project management and team, and extensive modifications. |
| | • | | Belk uses vendor allowances as a strategic part of its advertising, payroll, and margin maintenance. A decrease in any of these allowances would cause the Company to shift or reduce the funds and resources allotted to the given area. A reduction in the amount of cooperative advertising allowances would cause the Company to consider other methods of advertising and could cause them to adjust the volume and frequency of their product advertising, which could increase/decrease expenditures and/or revenue. |
| | • | | In fiscal year 2006, Belk sold its proprietary credit card business to, and entered into a 10-year strategic alliance with, GE to operate its private label credit card business, which helps facilitate sales. The income received from this alliance and the timing of receipt of payments varies based on changes in customers’ credit card use and GE’s ability to extend credit to Belk’s customers, all of which can vary based on changes in federal and state banking and consumer protection laws and from a variety of economic, legal, social, and other factors that Belk cannot control. Changes in income and cash flow from Belk’s long-term marketing and servicing alliance related to its proprietary credit cards with GE could impact operating results and cash flow. |
| | • | | Belk relies on its distribution centers in South Carolina and Mississippi to service its stores, and eCommerce fulfillment centers in North Carolina and South Carolina that process belk.com customer orders. If logistics or distribution processes do not operate effectively, either from its distribution centers or its fulfillment centers, Belk’s business could be disrupted. |
| | • | | Belk also relies on information systems to effectively manage sales, distribution, merchandise planning, and allocation functions. The Company continues to implement software technology to assist with these functions. If the distribution network is operated ineffectively or information systems fail to perform as expected, Belk’s business could be disrupted. |
| | • | | The Company is currently managing a number of significant change initiatives, such as systems enhancements, changes in merchandising and planning processes, store process improvements, strategic sourcing, store remodels, and others. If Belk management is unable to successfully coordinate and execute these initiatives while managing the other areas of the business, results may be adversely affected. |
| | • | | Capital investments in new stores and remodels may not yield the returns projected. |
| | • | | Belk outsources some business support processes to third parties. The Company makes a diligent effort to ensure that all providers of outsourced services observe proper internal control practices, including secure data transfers between Belk and third-party vendors; however, there are no guarantees that failures will not occur. Failure of third parties to provide adequate services could have an adverse effect on Belk’s operations and financial condition. |
| | • | | A security breach that results in the unauthorized disclosure of Company, employee, or customer information could adversely affect Belk’s business, reputation, and financial condition. Our understanding from discussions with Company management is that Belk has taken adequate precautions against such a threat to operations. |
| | • | | The Company depends on its senior executives to run the business. The loss of any of these officers could materially adversely affect operations. Competition for qualified employees is intense, and the loss of qualified employees or an inability to attract, retain, and motivate additional highly skilled employees required for the operation and expansion of the business could adversely the Company. |
| | • | | Overpaying for or ineffectively integrating and operating acquired businesses could adversely affect Belk’s financial performance. In discussions with Company management, Belk continues to look for strategic company/store acquisitions that fit into their brand and strategic goals. Company management indicated that no such acquisitions were in process or reasonably anticipatable as of the valuation date. |
V. IDENTIFICATIONOF GUIDELINE PUBLICLY TRADED COMPANIES
OVERVIEW
The purpose of compiling guideline company statistics is to develop value measures based on prices at which stocks of similar companies are trading in a public market. The first step in finding such “guideline companies” is to identify the most appropriate Standard Industrial Classification (SIC) code. Belk most closely resembles companies in the following SIC code:
| | • | | SIC Code 5311: Department Stores |
DESCRIPTIONSOF SELECTED GUIDELINE PUBLICLY TRADED COMPANIES5
Our SIC search uncovered several companies. We narrowed this list to companies that were the most applicable based on operational area markets, business strategies, products offered, size, earnings, historical and projected growth rates, reputation, brand recognition, Company management comparison data, and other factors.
We removed Saks Incorporated and J.C. Penney Company, Inc., in our analysis as of FYE 2014 from our analysis as of FYE 2013. Saks Incorporated was removed because it was acquired by Hudson’s Bay Company (TSX:HBC) on November 4, 2013, for an enterprise value (EV) of $2.71 billion (0.8 times EV/revenue and 10.2 times EV/earnings before interest, taxes, depreciation, and amortization [EBITDA]). J.C. Penney Company, Inc. (NYSE:JCP) was replaced due to (1) poor financial performance over the prior three years (comparable store sales for FYE 2012 through 2014 was 0.2 percent,negative 25.2 percent, andnegative 7.4 percent, respectively) combined with an uncertain future outlook and (2) incomparable/not meaningful pricing indications.
The following is a description of the eight selected guideline publicly traded companies used in our analysis as of the valuation date.
The Bon-Ton Stores, Inc.
The Bon-Ton Stores, Inc., through its subsidiaries, operates department stores in the United States. Its stores offer brand-name fashion apparel and accessories for women, men, and children, as well as cosmetics, home furnishings, footwear, and other goods. As of November 13, 2013, the company operated 273 department stores comprising 10 furniture galleries in 25 states in the Northeast, Midwest, and upper Great Plains under the Bon-Ton, Bergner’s, Boston Store, Carson Pirie Scott, Elder-Beerman, Herberger’s, and Younkers names. The Bon-Ton Stores, Inc., was founded in 1898 and is headquartered in York, Pennsylvania.
Dillard’s, Inc.
Dillard’s, Inc., operates as a fashion apparel, cosmetics, and home furnishing retailer in the United States. The company’s stores offer a selection of merchandise, including fashion apparel for women, men, and children; accessories; cosmetics; home furnishings; and other consumer goods. Its merchandise selections
| 5 | Business descriptions from S&P Capital IQ. |
include brand merchandise, such as Antonio Melani, Gianni Bini, Roundtree & Yorke, and Daniel Cremieux. The company also sells its merchandise online through its website, www.dillards.com, which features online gift registries and various other services. In addition, it operates a general contracting construction company that engages in constructing and remodeling stores for the company. As of May 10, 2013, the company operated 283 Dillard’s locations and 18 clearance centers, and an Internet store. Dillard’s, Inc., was founded in 1938 and is based in Little Rock, Arkansas.
Kohl’s Corporation
Kohl’s Corporation operates department stores in the United States. Its stores offer private, exclusive, and national branded apparel, footwear, and accessories for women, men, and children; soft home products, such as sheets and pillows; and housewares targeted to middle-income customers. As of November 2, 2013, it operated 1,158 stores in 49 states. The company also provides on-line shopping through its website Kohls.com. Kohl’s Corporation was founded in 1962 and is headquartered in Menomonee Falls, Wisconsin.
Macy’s, Inc.
Macy’s, Inc., together with its subsidiaries, operates stores and Internet websites in the United States. It operates Macy’s and Bloomingdale’s stores and websites that sell a range of merchandise, including apparel and accessories for men, women, and children; cosmetics; home furnishings; and other consumer goods in 45 states, the District of Columbia, Guam, and Puerto Rico. The company also operates Bloomingdale’s Outlet stores that offer a range of apparel and accessories, including women’s ready-to-wear, fashion accessories, jewelry, handbags, and intimate apparel, as well as men’s, children’s, and women’s shoes. As of December 17, 2013, it operated approximately 840 department stores under the names of Macy’s and Bloomingdale’s in 45 states, the District of Columbia, Guam, and Puerto Rico, as well as the macys.com and bloomingdales.com websites; and 13 Bloomingdale’s Outlet stores. The company was formerly known as Federated Department Stores, Inc., and changed its name to Macy’s, Inc., in June 2007. Macy’s, Inc., was founded in 1830 and is headquartered in Cincinnati, Ohio.
Nordstrom, Inc.
Nordstrom, Inc., a fashion specialty retailer, offers apparel, shoes, cosmetics, and accessories for women, men, and children in the United States. It operates in two segments, retail and credit. The retail segment offers a selection of brand name and private label merchandise. This segment sells its products through various channels, as well as through online private sale subsidiary, HauteLook, Inc. As of February 19, 2014, this segment operated 260 stores in 35 states, including 117 full-line stores, 140 Nordstrom Racks, 2 Jeffrey boutiques, and 1 clearance store. The credit segment operates Nordstrom fsb, a federal savings bank, which provides a private label credit card, two Nordstrom VISA credit cards, and a debit card. Its credit and debit cards feature a shopping-based loyalty program. Nordstrom, Inc., was founded in 1901 and is based in Seattle, Washington.
Target Corporation
Target Corporation operates general merchandise stores in the United States. It offers household essentials, including pharmacy, beauty, personal care, baby care, cleaning, and paper products; hardlines comprising music, movies, books, computer software, sporting goods, and toys, as well as electronics that consist of video game hardware and software; apparel and accessories, such as apparel for women, men,
boys, girls, toddlers, infants, and newborns, as well as intimate apparel, jewelry, accessories, and shoes. The company also provides food and pet supplies, including dry grocery, dairy, frozen food, beverages, candy, snacks, deli, bakery, meat, produce, and pet supplies; and home furnishings and décor, such as furniture, lighting, kitchenware, small appliances, home décor, bed and bath, home improvement, automotive, and seasonal merchandise comprising patio furniture and holiday décor. In addition, it offers in-store amenities. The company distributes its merchandise through a network of distribution centers, as well as third parties and direct shipping from vendors. Further, it provides general merchandise through its website, Target.com; and branded proprietary Target Debit Card. As of January 30, 2014, the company had 1,921 stores, including 1,797 stores in the United States and 124 stores in Canada. Target Corporation was founded in 1902 and is headquartered in Minneapolis, Minnesota.
Stage Stores, Inc.
Stage Stores, Inc., operates department stores and off-price stores in the United States. It operates department stores under the Bealls, Goody’s, Palais Royal, Peebles, and Stage names that offer moderately priced brand name and private label apparel, accessories, cosmetics, and footwear for the entire family. The company operates off-price stores under Steele’s name, which provide brand name family apparel, accessories, shoes, and home décor. It also offers its merchandise direct-to-consumer through its eCommerce website and Send program. As of July 29, 2013, the company operated approximately 860 stores in 40 states. Stage Stores, Inc., was founded in 1988 and is headquartered in Houston, Texas.
The Gap, Inc.
The Gap, Inc., operates as an apparel retail company. It offers apparel, accessories, and personal care products for men, women, children, and babies under the Gap, Old Navy, Banana Republic, Piperlime, Athleta, and Intermix brands worldwide. Its products include maternity apparel; loungewear, sleepwear, intimates, and active apparel for women; and handbags, shoes, jewelry, personal care products, and eyewear for men and women; women’s apparel, footwear, and accessories for sports and fitness activities, including crossover apparel and casualwear; and luxury and contemporary apparel and accessories. The company also has franchise agreements with unaffiliated franchisees to operate stores in Asia, Australia, Eastern Europe, Latin America, the Middle East, and Africa under the Gap and Banana Republic brands. The Gap, Inc., offers its products through company-operated stores, franchise stores, e-commerce sites, and catalogs. As of November 2, 2013, it had 3,515 store locations. The Gap, Inc., was founded in 1969 and is headquartered in San Francisco, California.
VI. VALUATION ANALYSIS
In general, the techniques, rules, and factors outlined in Revenue Ruling 59–60 can be categorized into three distinct and general approaches for valuing the stock of closely held companies. Professional appraisers will use various methods under these three approaches to estimate the value of closely held companies. Of course, the objective of using more than one approach is to develop mutually supporting evidence as to the conclusion of value.
While the specific titles of these three approaches may vary, the generic names are as follows:
| | • | | The asset-based approach |
In approaching the valuation of Belk, a variety of factors were taken into consideration, including (1) the nature and history of the business, its current position, and its outlook; (2) the general and relevant economic conditions prevailing as of the valuation date; and (3) the conditions and outlook for the department store industry as of the valuation date.
After giving consideration to each of the three general valuation approaches, we determined that the most appropriate approaches for our valuation analysis are the market and income approaches.
We considered several methods of the asset-based approach for use in our analysis but did not rely on any of these methods in arriving at our estimate of value. We did not use any asset-based method primarily because the value of Belk is most accurately represented by the economic earnings its assets can generate, and because of the difficulty inherent in discretely valuing all of the Company’s individual assets and liabilities. Therefore, the value of the Company’s assets is best estimated through the selected market and income-based approaches.
INCOME APPROACH
The income approach is based on the premise that the value of a company is equal to the present value of all the future expected economic income to be derived by the company’s shareholders.
All of the different income approach methods may be broadly categorized into the following:
| | 1. | Those that rely on direct capitalization |
| | 2. | Those that rely on yield capitalization |
In a direct capitalization analysis, the analyst estimates the appropriate measure of economic income for one period (i.e., one period future to the valuation date) and divides that measure by an appropriate in-vestment rate of return, or direct capitalization rate.
In a yield capitalization analysis, the analyst projects the appropriate measure of economic income for several discrete time periods into the future. The projection of the prospective economic income is converted into a present value by the use of a present value discount rate, which is the investor’s rate of return or yield rate over the expected term of the economic income projection.
Company management provided us with financial projections for the fiscal years ending on or near January 31, 2015, through January 31, 2017. Accordingly, we used the yield capitalization analysis. Specifically, we used the discounted cash flow (DCF) method, as summarized in the succeeding paragraphs.
Discounted Cash Flow Method
The DCF method is a well-recognized technique used to value companies on a going concern basis. It has intuitive appeal since it incorporates the risk/return perspective, which is critical to the investment decision process.
The DCF method to valuation is based on the premise that the value of a closely held company is equivalent to the present value of the future economic income to be derived by the Company’s shareholders and creditors. This method requires an in-depth analysis of the subject company’s revenue, fixed and variable expenses, capital structure, and growth. The future net free cash flow of the Company is estimated and the present value of this cash flow, along with a residual (or terminal) value, is calculated based upon an appropriate present value discount rate.
Projected Financial Statements
The first step in the DCF method is to develop reasonable financial projections of income for Belk.
The financial projections were provided by Belk’s management and finance department teams. We evaluated these projected financial statements in detail and believe them to be a reasonable estimate of the Company’s future financial performance based on our discussions with Company management, our review and analysis of the current and historical financial performance, and the current expectations for the retail and department store industry. However, we do believe management’s expectations are rather too conservative in light of the performance in fiscal year 2014. We have taken this element into consideration in our discount rate calculation process.
Belk’s projected income statements are presented on Exhibit 8 and projected balance sheets on Exhibit 7. Additionally, we present on Exhibit 9, Belk’s historical management financial projections for a review of management’s historical expectations of projected growth and average margins. This presentation provides the retrospective perspective of management’s ability to exceed or underperform the financial projections we relied upon in prior year valuations. As shown on Exhibit 9, management had become increasingly bullish on top line revenue growth at the beginning of FYE 2012 through 2014, provided that Belk was consistently outperforming management’s prior year expectations. However in FYE 2014, actual results were below estimate. Due to a number of industry-specific and company-specific factors previously noted, but predominately related to extreme wintery weather, a shorter holiday shopping season, credit card theft issues with other retailers, and Belk website crashes. Therefore, it is not abnormal to see a lower outlook by management as of the valuation date. Belk management projections beginning at FYE 2015 are 250bps lower in revenue compound annual growth rate (CAGR) from the previous year. EBITDA is also 400bps lower in EBITDA CAGR and average projected EBITDA margins are 130bps lower than the previous year. In all, we believe management’s projections as of the valuation date are quite conservative, allowing management a better opportunity this coming year to achieve their projections. We have taken this more cautious projection under consideration in this year’s analysis.
Estimation of a Present Value Discount Rate
The second step in the DCF method is to estimate a present value discount rate that is appropriate for the Company’s future cash flow. The appropriate discount rate for this analysis is Belk’s weighted average cost of capital (WACC). The WACC represents the weighted average of the cost of each of the components in the capital structure (i.e., debt and equity capital). These capital costs, expressed as required rates of return, are weighted according to an estimate of Belk’s market-value capital structure. The basic formula for computing a company’s after-tax WACC is as follows:
WACC = (Ke x We) + (Kd [1—t] x Wd), where:
WACC = Weighted average cost of capital
| | Ke | = Company’s cost of equity capital |
| | Kd | = Company’s cost of debt capital |
| | We | = Percentage of equity capital in the capital structure |
| | Wd | = Percentage of debt capital in the capital structure |
| | t | = Company’s effective income tax rate |
We estimated the Company’s cost of equity capital using the build-up model, the modified capital asset pricing model (CAPM) model, and the Duff & Phelps model. These models incorporate various market rates of return and risk premiums, including a risk-free rate of return, a long-term equity risk premium, a size equity risk premium, an industry equity risk premium, and a company-specific equity risk premium. Each of these components is discussed below and is incorporated in Exhibits 6 b, 6 c, and 6 d within Appendix A.
Build-up Model. The DCF method is inherently based upon a long-term investment horizon. Therefore, the appropriate risk-free rate is represented by a long-term government security. The yield to maturity of a U.S Treasury bond maturing on or about 20 years after the valuation date is the most appropriate risk-free rate since it best matches the long-term operating horizon of Belk. The stated yield on Treasury bonds maturing approximately 20 years from the valuation date was 3.35 percent.
The leading authority on equity risk premiums is Morningstar (formerly known as Ibbotson Associates). Morningstar annually publishes a calculation of the long-term equity risk premium. This premium is calculated by subtracting the risk-free rate (20-year Treasury bonds) from the total annual rates of return on common stocks (using the Standard & Poor’s [S&P] 500 Index as a proxy). According to Morningstar, the long-horizon expected equity risk premium (supply side) for the period 1926 through 2012 was approximately 6.11 percent.
Morningstar also calculates the difference between the total returns of all public companies and returns exhibited by smaller, more thinly capitalized companies. Morningstar calculates the premiums and are segmented into deciles based on market capitalization. The fifth decile ranges from $1.912 billion to $2.759 billion. Since Belk’s market value of equity is within this range, it is appropriate to use the fifth decile’s size equity risk premium (mid-cap classification). According to the Morningstar study, the appropriate size equity risk premium to be applied to Belk reflected an arithmetic mean annual return of approximately 1.70 percent above the overall equity risk premium exhibited by the S&P 500 common stock index.
Morningstar also calculates industry risk premiums. According to Morningstar, the industry equity risk premium for SIC code 531, department stores, was approximately 3.76 percent.
An additional company-specific (i.e., unsystematic or idiosyncratic) equity risk premium is often appropriate to reflect risks specific to an investment in a particular closely held company. An investment in Belk is subject to certain unsystematic risk factors (i.e., risks which are specific to Belk relative to the market as a whole). In our opinion a hypothetical willing buyer would incorporate an incremental risk premium of 1 percent based on factors summarized in the risks section of the company section of this report.
Our build-up model results in an estimated cost of equity capital, as of the valuation date, of 15.92 percent. This represents a reasonable estimate of the rate of return that an informed investor would demand in return for an equity investment in the Company.
Modified CAPM Model. In addition to calculating Belk’s cost of equity capital by the build-up model, we used the modified CAPM to estimate an appropriate equity rate of return. Exhibit 6 c presents the calculation of the industry beta as based on the eight selected guideline publicly traded companies used in our analysis. We used Bloomberg adjusted betas based on a five-year horizon on a daily, weekly, and monthly basis, as provided by Bloomberg. We selected data sets on these three varying perspectives to capture a more accurate consensus of current market risks. Additionally, we relevered these beta variables to adjust for the individual capital structures of the selected guideline companies. Based on this analysis, we determined that, as of the valuation date, the average relevered beta is 0.96 and the median relevered beta is 1.05. From our analysis of the re-levered beta indications, we selected the median beta indication as fairly reflecting the market implied beta risk.
The modified CAPM, as presented on Exhibit 6 b, incorporates this indicated beta as an adjustment to the long-term equity risk premium of 6.11 percent. When multiplied, the beta-adjusted equity risk premium is derived to be 6.42 percent. We additional add the previously discussed risk-free rate of return of 3.35 percent, the size equity risk premium of 1.70 percent, and the company-specific equity risk premium of 1 percent. The resulting cost of equity capital based on the modified CAPM, as of the valuation date, was 12.47 percent.
Duff & Phelps Model. We also used the Duff & Phelps model which relies on the (1) current year book value of common equity, (2) five-year average net income, (3) current year total assets, (4) five-year average EBITDA, and (5) current year revenue to estimate the cost of equity using a regression model. As presented in Exhibit 6 d, the Duff & Phelps model estimated a long-term equity risk premium based on Belk financials as regressed in various formulas to indicated risk premiums as compared to publicly traded companies of 8.44 percent. To this long-term equity risk premium, we add the previously discussed risk-free rate of return and company-specific equity risk premium. The resulting cost of equity capital based on the Duff & Phelps model, as of the valuation date, was 12.80 percent.
Cost of Equity Capital Selection. Based on a 15.92 percent cost of equity capital from the build-up model, a 12.47 percent cost of equity capital from the modified CAPM model, and a 12.80 percent cost of equity capital from the Duff & Phelps model, we determined that an appropriate cost of equity capital for Belk was a weighted metric of 20/60/20, respectively, as presented on Exhibit 6 b. Therefore, we concluded a rounded cost of equity capital as of the valuation date to be 13.2 percent.
Cost of Debt Capital Selection. We calculated Belk’s pretax cost of debt capital to be 5.4 percent based on the weighted average cost of debt for Belk as of the valuation date, with a review comparison to the average yield on Moody’s Baa corporate bonds which was 5.07 percent, as shown on Exhibit 6 a. Belk’s weighted cost of debt represents a more accurate yield on debt in the Company’s actual capital structure. After tax-affecting the pretax cost of debt at the Company’s estimated/normalized income tax rate of 35 percent, we arrived at an after-tax cost of debt capital, as of the valuation date, of 3.5 percent. We selected a 35 percent tax rate based on (1) Company management expectations and (2) the Company, as of the valuation date, had net operating loss carryforwards for state income tax purposes of approximately $317.4 million. The state carryforwards expire at various intervals through fiscal year 2034, by primarily in fiscal years 2024 through 2028. The Company also has state job credits of approximately $1.2 million, which are available to offset future taxable income, in the applicable states, if any. These credits expire between fiscal years 2016 and 2029.
WACC Selection. The appropriate weighting to these costs of capital are the respective percentages of debt and equity in Belk’s capital structure (on a market value basis). From industry analysis, analysis of the guideline publicly traded companies, an iterative process based on the projected financial statements, and from discussions with Company management, we determined an actual capital structure of 95 percent equity and 5 percent debt. We understand Belk’s capital structure for capital budgeting analysis is different from our calculation of the Belk’s capital structure for a market value analysis. Belk’s capital budgeting WACC relies on an equity weighting of approximately 55 percent and debt weighting of approximately 45 percent. These differences in WACC are numerous, although each calculation is appropriate for their intended uses. For example, Belk’s capital budgeting WACC is used in analyses such as lease or buy scenarios for real estate assets, wherein (1) the cost of debt incorporates both operating and capital leases and (2) the cost of equity incorporates the book value of shareholders’ equity. In our calculation of the market value WACC, we use historical and projected normalized financial earnings, wherein (1) the cost of debt incorporates only book value of interest-bearing debt (including capital leases and not operating leases which are accounted for in the financial earnings) and (2) the cost of equity incorporates a market value of shareholders’ equity. In our iterative analysis for calculating the appropriate weighting structure, we project the market value of shareholder equity as it compares to the projected debt levels provided by the Company’s financial projections. In a probable scenario analysis, we derived an approximate 95 percent equity structure and a 5 percent debt structure. Using the costs of capital estimated above, we determined Belk’s WACC to be approximately 12.5 percent. Our calculation of Belk’s WACC is presented in Exhibit 6 a.
DCF Method Calculations
The variables essential to our analysis and the calculations of our DCF method analysis are outlined below.
Projections of Cash Flow
An investment horizon should reflect two primary factors: (1) the anticipated number of years over which a reasonable estimate of some form of earnings return can be forecasted from existing operations and (2) the investment objectives of the ownership interest.
The Company’s projected financial statements are presented in Exhibits 7 and 8. We evaluated these projected financial statements in detail and believe them to be a reasonable estimate of the Company’s future financial performance based on its historical financial performance and expectations for the retail and department store industries.
Cash Flow Measure
For purposes of this analysis, the most relevant measure of cash flow is cash available for distribution to shareholders and creditors, above and beyond the Company’s normal cash requirements for operations. This is often referred to as net cash flow (NCF) and is typically calculated as follows:
Earnings before interest and taxes (EBIT)
| | – | Income taxes (normalized at 35 percent) |
| | + | Depreciation and amortization expense |
– Net operating working capital additions
= Net cash flow to invested capital (NCF)
We calculated the Company’s NCF for projected fiscal years ending on or near January 31, 2015, through January 31, 2017, based on the projected income statements provided by Company management. Further, depreciation and amortization expenses, capital expenditures, and net operating working capital additions were provided by Company management or derived from Company management projections. Our calculations of NCF are presented in Exhibit 10.
Calculation of Present Value
As shown in Exhibit 10, we calculated the present value of the Company’s discrete NCF as $446.8 million. However, since the underlying premise of the DCF method is that of a going concern, it is logical to assume that Belk has net cash flow beyond the projected fiscal year ending 2017. Therefore, our DCF analysis also incorporates a terminal value.
Effectively, a terminal value represents the amount for which a company could be sold at the end of the forecast period. Our terminal value calculation incorporates an estimated long-term growth rate of 4 percent, based on industry and macroeconomic analysis and discussions with Company management. The terminal value was calculated based upon a constant growth model (the Gordon growth model). Using the constant growth model we arrived at a present value for the Company’s terminal NCF of approximately $2.37 billion.
By combining the present value of the terminal cash flow with the present value of the discrete cash flow, we arrived at an indication of the Company’s market value of invested capital (MVIC) of approximately $2.21 billion. After subtracting Belk’s net interest-bearing debt of approximately $98.4 million, the indicated value of equity on a marketable, noncontrolling interest basis, as of the valuation date, is approximately $2.12 billion.
THE MARKET APPROACH
In the valuation of Belk, we employed two separate methods under the market approach. They are the guideline publicly traded company (GPTC) method and the previous transactions method. The following section outlines the theory and methodology, the calculations of, and the conclusions of the two methods under the market approach.
The Guideline Publicly Traded Company Method
It is often stated that values are best determined and tested in the marketplace. However, when valuing the shares of a closely held company, there is usually no such marketplace. One of the most fundamentally sound approaches for determining the value of closely held common shares is to look to the public market for evidence of prices investors are willing to pay for companies in thesame-orsimilar-lines of business. Such a comparison to “guideline” publicly traded companies is the basis of the GPTC method.
The key steps to the GPTC method are the following:
| | 1. | The identification of a set of guideline publicly traded companies |
| | 2. | The calculation of market pricing multiples based upon the guideline companies’ quoted trading prices and financial fundamentals |
| | 3. | The selection of appropriate market pricing multiples to be applied to the subject company’s financial fundamentals |
| | 4. | The calculation of one or more indications of value for the subject company based upon the application of the selected market pricing multiples |
| | 5. | The selection of the relative emphasis to be placed on each of the resulting indications of value |
| | 6. | The estimation of an overall indication of value from this method |
Since the market pricing multiples used in this method are based on minority transactions in the public markets, the resulting indications of value are on a noncontrolling (minority) interest basis. Because we are valuing Belk on a noncontrolling interest basis, it was unnecessary to make any adjustments for control using this method.
We used a debt-free method in our GPTC method analysis. Debt-free valuation methods are commonly used in the valuation of closely held companies in order to minimize capital structure differences between a subject company and the guideline companies. The greater the differences between the companies’ capital structures, the more useful it is to use debt-free valuation methods.
Since these methods are based on economic cash flow that accrue to both debt and equity shareholders, they result in indications of value for a subject company’s total capital. For purposes of our analysis, we refer to total capital as the MVIC which is typically defined as follows:
| | | Market value of short-term interest-bearing debt |
| | + | Market value of long-term interest-bearing debt, including capitalized leases |
| | + | Market value of preferred stock outstanding |
| | + | Market value of common stock outstanding |
– Cash and cash equivalents
= Market value of invested capital (MVIC)
Since MVIC, in this case, includes the value of both debt (net of cash and cash equivalents) and equity, the market value of interest-bearing debt must be subtracted from MVIC and cash and cash equivalents must be added to MVIC in order to arrive at the indicated value of stockholders’ equity. Thus interest-bearing debt, net of cash and equivalents is added to the indicated MVIC to derive a value indication of equity, which as of the valuation date interest-bearing debt, net of cash and cash equivalents was approximately $98.4 million.
We considered the following debt-free market pricing multiples in our GPTC method analysis:
| | 1. | MVIC/earnings before interest and taxes (EBIT) |
We considered these market pricing multiples based on (1) two historical time periods: (a) the latest 12 month period ended February 1, 2014, and (b) a three-year historical average; and (2) one prospective time period, an implied one-year projected metric using median analyst estimates, compiled by Reuters, for the selected guideline publicly traded companies.
Exhibit 11 presents a summary of (1) Belk’s financial fundamentals, (2) the range of market pricing multiples calculated for the guideline companies, (3) the guideline public company pricing multiples selected to be applied to Belk’s financial fundamentals, (4) the resulting indications of value, and (5) the overall indication of value resulting from the GPTC method.
Exhibits 13 a through 13 g present the calculation of the selected market pricing multiples for the selected guideline publicly traded companies, which we outlined in a previous section of this report, as well as certain underlying financial information and growth factors. Exhibit 12 a compares the guideline publicly traded companies used in our analysis against Belk’s financials and operating figures.
The selected pricing multiples were based upon consideration of differences in growth, size, risk, and profitability of the guideline companies relative to Belk. Exhibit 11 summarizes the selection of the debt-free market pricing multiples as applied to Belk. In our opinion, a hypothetical willing buyer would weigh the latest 12 months period the most as it best represents the current financial performance of the Company that considers its current market position and provides a basis for the Company’s future financial performance base. We also note an analyst would place some relative weighting on both a three-year historical average and a one-year projected indication based on a consensus of analyst expectations and consideration of the Company’s projected earnings and growth potential. Accordingly, we weighted 50 percent to the latest 12 month period and 25 percent to the three-year historical average and projected one year estimate of financial performance.
As shown in Exhibit 11, the application of the selected debt-free market pricing multiples resulted in an indicated value for Belk’s MVIC of approximately $2.61 billion. In order to arrive at the indicated value of equity, it is necessary to subtract interest-bearing debt, net of cash and cash equivalents. After subtracting the interest-bearing debt, net of cash and equivalents of $98.4 million, the indicated market value of equity on a marketable, noncontrolling interest basis was approximately $2.51 billion.
The Previous Transaction Method
The objective of our analysis is to estimate the fair market value of a noncontrolling ownership interest in Belk. As part of our consideration of this value, we reviewed previous transactions in the Company’s stock to determine if any of the prior transactions would provide a meaningful indication of value.
Historically, there have been two avenues for achieving transaction-based liquidity for Belk shares: (1) privately negotiated sales and (2) repurchase offers by the Company. The history of these activities are outlined in a previous section of this report and in Exhibits 15 a through 15 c (privately negotiated sales) and Exhibit 17 (repurchase offers [i.e., tender offers]).
The historical transactions in the Belk stock show that the tender offers have consistently been the ideal liquidity event for pent-up interest of shareholders looking to sell shares. By the same token, the lack of privately negotiated transactions, discussed below, also indicates that there has been a lack of buyer interest in acquiring Belk shares historically. It appears that shareholders have used the tender offers as a valuation of price and wait until the Company redeems shares to reduce their holdings.
Arm’s length transactions between unrelated parties involving the subject company stock as of a date proximate to the valuation date can provide meaningful evidence of value if the transactions are timely and truly at arm’s length. Although one must consider prior sales of the company’s stock as an indication of value, this is not always a reliable valuation method if (1) the sales are rare or not timely, (2) the number of shares sold differ substantially from the shares to be valued currently, or (3) it is difficult to establish if the selling price to a related party or a family member is an arm’s length price. The details of stock transactions must be investigated to estimate whether they are true indicators of value. Caution should be exercised concerning whether a transaction was between parties who perceived similar benefits of control or lack thereof, relative to the subject block. Based on the thinly traded nature of the Belk stock, one must also consider all of the terms of the transaction whether dependent of market moving factors or as a result of a unique and/or prearranged agreements.
Belk shares do not trade on any organized securities market. Historically, shareholders seeking to sell or buy shares typically contact the Company, which refers interested parties to a local stock broker in Charlotte who, from time to time, is able to match buyers and sellers. Because the trades are arranged by the broker as an intermediary, Belk shares have been assigned NASD trading symbols (for Class A and B shares) on the bulletin boards in the over-the-counter market under the ticker symbol OTCBB:BLKI.A and OTCBB:BLKI.B, for the Class A and B shares, respectively. Inquiries to the brokerage firms listed from time to time as making a market in Belk shares indicated that no significant inventories of shares are held by the brokerage firms and that trades are, essentially, arranged by linking buyers with sellers in very much the same historic manner in which Belk shares have previously traded.
Upon examining the trading data as shown in Exhibit 15 a and 15 b in detail, we note that the Belk share trading volume was trending downward during the period prior to the valuation date, reflecting a general decline in interested parties willing to buy/sell outside of the tender offers. As shown on Exhibit 15 c, trading volume over the past three fiscal years have declined, for example in the Class B shares, volume has changed from $1.1 million in 2011 to $394,436 in 2012 to $396,799 in 2013. Additionally, the stock price, as graphed on Exhibit 15 c, for both the A and B shares have remained relatively consistent with our valuation for the tender offer for calendar year 2013 at $50 per share; therefore, indicating that this methodology although between willing buyers and sellers may be less informative of Belk’s current fair market value and more of a lagging indicator. Based upon the known terms of the transactions, and the timeliness of the most recent trades, we conclude that the evidence suggests a normative value of $50.21 per nonmarketable (or privately marketable) share as the starting point for the analysis of the fair market value of the Subject Interest, based on the sparse number of small block trades prior to the valuation date. As summarized on Exhibit 15 c, based on the 41.0 million shares issued and outstanding and a weighted average price of $50.21 per share, the indicated market value of equity, as of the valuation date, was $2.06 billion. However, we are increasingly skeptical of the significance of these transactions in setting a fair market value for Belk stock.
THE ASSET-BASED APPROACH
We considered the asset-based approach for use in our analysis but did not rely on any of the asset-based approach methods in arriving at our estimate of value. We did not use any asset-based methods primarily because the value of Belk’s assets are best represented by the economic earnings those assets can generate and because of the difficulty inherent in discretely valuing all of Belk’s individual assets and liabilities.
VII. VALUATION SYNTHESISAND CONCLUSION
We arrived at indications of the fair market value of Belk’s equity through three generally accepted valuation methods: (1) the DCF method, (2) the GPTC method, and (3) the previous transaction method. The indications of equity from the DCF and GPTC methods are derived on a marketable, noncontrolling ownership interest basis; whereas the indication of equity from the previous transaction method is on a nonmarketable, noncontrolling ownership interest basis. Therefore, we may compare the DCF method and GPTC method indications and adjust these indications for the relative lack of marketable and then compare such indication to the previous transaction method.
INDICATED EQUITY VALUE – DCFAND GPTC METHODS
The DCF method and GPTC method indicated values are on a marketable, noncontrolling ownership interest basis. These two methods were weighted equally to arrive at a marketable, noncontrolling equity value of approximately $2.32 billion, as shown on Exhibit 1.
As previously noted, the DCF method and GPTC method indicated values are on a marketable, noncontrolling ownership interest basis. It is necessary to apply a discount for the relative lack of marketability inherent to the shares of Belk (see Appendix B for detailed analysis and discussion). The adjusted publicly marketable common equity value of $2.32 billion is discounted by 15 percent to reflect the lack of marketability. The magnitude of the discount is influenced, in part, by the per share nature of the Subject Interest, SEC restrictions, actual trading volume, prevailing macroeconomic conditions as of the valuation date, the proposed tender offer, the relative reliance that investors show in the continuance of the tender offers as a source of liquidity, and the relatively consistent dividend distribution policy of the enterprise.
The indicated equity value for Belk on a nonmarketable, noncontrolling ownership interest basis, as based on the DCF and GPTC methods was approximately $1.97 billion.
INDICATED EQUITY VALUE – PREVIOUS TRANSACTION METHOD
In our valuation, we additionally considered the publicly traded value of Belk as of the valuation date using the previous transaction method. This method relies on prior transaction pricing metrics to value the subject company. In this case, Belk is a publicly listed and publicly traded company. However, the volume of Belk stock transactions are very low and continue to decline year-over-year as the Company has been consistently offering tender offers to shareholders. Accordingly, the stock price as of the valuation date, in our opinion, is based primarily on the tender offer price (which considers our annual valuation advice), and, thus, represents a nonmarketable, noncontrolling ownership interest basis of value. The Belk indicated per share value on a nonmarketable, noncontrolling ownership interest basis, as of the valuation date, was $50.21, based on the weighted average of the most recent transactions of the Class A and Class B Belk shares. As summarized on Exhibit 15 c, based on the 41.0 million shares outstanding and a weighted price of $50.21 per share, the indicated market value of equity was $2.06 billion.
SYNTHESISAND CONCLUSION
We weighted the concluded DCF and GPTC method indications by 95 percent and the previous transaction method by 5 percent. The reasons for weighting the previous transaction method 5 percent are as follows:
| | • | | Not all of the transactions can be clearly identified as arm’s length |
| | • | | The history of the trading indicates that investors tend to follow Willamette Management Associates’ valuations, and, therefore, trading values tend to be a nonindependent, lagging indicator of value |
| | • | | The stock is thinly and scarcely traded, calling into question whether there are an adequate number of participants to create reliable fair market values from trading prices |
| | • | | The volume of trading has been on a declining trend since 2007 |
| | • | | No public securities analysts follow Belk stock |
| | • | | The over-the-counter market values appear to carry no or virtually no inventory of Belk stock; therefore, market makers have little or no incentive to price Belk stock correctly for internal purposes |
Based upon the procedures and analysis mentioned above, and in our independent professional opinion, the fair market value of the Subject Interest on a nonmarketable, noncontrolling ownership interest basis as of February 1, 2014, was:
$1,973,000 or $48.10 Per Share
Based on 40,990,916 Shares Issued and Outstanding.
We are independent of Belk, Inc., and we have no current or future financial interest in the assets, properties, or business interests valued. Our fee for this analysis is in no way contingent upon the value conclusions reached.
Our individual valuation methods and procedures are summarized in the valuation exhibits that are presented in Appendix A. The accompanying statement of assumptions and limiting conditions, certification and representation, and the professional qualifications of the principal analysts are integral parts of this opinion.
APPENDIX A – VALUATION EXHIBITS
EXHIBIT 1
BELK, INC.
FAIR MARKET VALUE
NONMARKETABLE, NONCONTROLLING OWNERSHIP INTEREST BASIS
VALUATION SUMMARY
AS OF FEBRUARY 1, 2014
$ in 000s (except per share data and shares issued and outstanding)
| | | | | | | | | | | | | | |
| | | Level of | | Relative | | | Indicated | | | | |
Valuation Approach and Valuation Method | | Value | | Emphasis | | | Value ($000s) | | | Reference | |
Income Approach – DCF Method | | [a] | | | 50 | % | | | 2,116,400 | | | | Exhibit 10 | |
Market Approach – GPTC Method | | [a] | | | 50 | % | | | 2,514,300 | | | | Exhibit 11 | |
| | | | | | | | | | | | | | |
Indicated Value of Equity (Based on the DCF and GPTC Methods) | | [a] | | | 100 | % | | | 2,315,400 | | | | | |
Less: Discount for Lack of Marketability of 15 Percent | | | | | | | | | (347,310 | ) | | | Exhibit 16 a | |
| | | | | | | | | | | | | | |
Equals: Indicated Value of Equity (Based on the DCF and GPTC Methods) | | [b] | | | 95 | % | | | 1,968,090 | | | | | |
Market Approach – Previous Transactions Method (Weighted Average Price Per Share of $50.21) | | [b] | | | 5 | % | | | 2,058,154 | | | | Exhibit 15 c | |
| | | | | | | | | | | | | | |
Equals: Fair Market Value of Total Equity [Rounded] | | [b] | | | 100 | % | | | 1,973,000 | | | | | |
| | | | | | | | | | | | | | |
Divided by: Number of Shares Issued and Outstanding [c] | | | | | | | | | 40,990,916 | | | | | |
| | | | | | | | | | | | | | |
Equals: Fair Market Value Per Share [Rounded] | | [b] | | | | | | $ | 48.10 | | | | | |
| | | | | | | | | | | | | | |
Implied Valuation Conclusion Pricing Metrics:
| | | | |
MVIC / LTM Revenue | | | 0.60 | |
MVIC / LTM Normalized EBITDA | | | 5.62 | |
Fair Market Value Per Share / Sales Per Share | | | 0.49 | |
Fair Market Value Per Share / Book Value of Equity Per Share | | | 1.45 | |
Normalized LTM Net Income / Number of Shares Issued and Outstanding [EPS] | | $ | 3.93 | |
Fair Market Value Per Share / EPS [P/E] | | | 12.25 | |
Anticipated Annual Dividend [d] | | $ | 0.80 | |
Anticipated Annual Dividend Yield [d] | | | 1.66 | % |
DCF = Discounted cash flow
GPTC = Guideline publicly traded company
LTM = Last twelve months
MVIC = Market value of invested capital
EBITDA = Earnings before interest, taxes, depreciation, and amortization
EPS = Earnings per share
P/E = Price to earnings
Footnotes:
| [a] | On a marketable, noncontrolling interest basis. |
| [b] | On a nonmarketable, noncontrolling interest basis. |
| [c] | Provided by Belk management as of the valuation date. As of the valuation date, Belk has 400 million shares authorized. |
| [d] | Provided by Belk management; based on Belk management financial statement projections and guidiance. |
Sources: Exhibits as cited and Willamette Management Associates calculations.
Willamette Management Associates
EXHIBIT 2
BELK, INC.
HISTORICAL AND COMMON SIZE BALANCE SHEETS
| | | | | | | | | | | | | | | | | | | | | | | | | | | | | | | | | | | | | | | | | | | | | | | | |
| | | As of | | | As of or Near January 31, | | | As of | | | As of or Near January 31, | |
| | | 2/1/14 | | | 2013 | | | 2012 | | | 2011 | | | 2010 | | | 2009 | | | 2/1/14 | | | 2013 | | | 2012 | | | 2011 | | | 2010 | | | 2009 | |
| | | $000 | | | $000 | | | $000 | | | $000 | | | $000 | | | $000 | | | % | | | % | | | % | | | % | | | % | | | % | |
ASSETS | | | | | | | | | | | | | | | | | | | | | | | | | | | | | | | | | | | | | | | | | | | | | | | | |
Current Assets: | | | | | | | | | | | | | | | | | | | | | | | | | | | | | | | | | | | | | | | | | | | | | | | | |
Cash and Cash Equivalents | | | 295,334 | | | | 269,177 | | | | 456,272 | | | | 453,403 | | | | 585,930 | | | | 260,134 | | | | 11.5 | | | | 10.9 | | | | 18.1 | | | | 19.0 | | | | 22.7 | | | | 10.4 | |
Short-Term Investments | | | — | | | | — | | | | — | | | | 6,150 | | | | 2,500 | | | | 10,250 | | | | — | | | | — | | | | — | | | | 0.3 | | | | 0.1 | | | | 0.4 | |
Accounts Receivable – Net | | | 55,340 | | | | 32,004 | | | | 39,431 | | | | 31,119 | | | | 22,427 | | | | 34,043 | | | | 2.2 | | | | 1.3 | | | | 1.6 | | | | 1.3 | | | | 0.9 | | | | 1.4 | |
Merchandise Inventory | | | 987,778 | | | | 1,009,687 | | | | 887,029 | | | | 808,503 | | | | 775,342 | | | | 828,497 | | | | 38.5 | | | | 40.7 | | | | 35.3 | | | | 33.8 | | | | 30.0 | | | | 33.1 | |
Prepaid Expenses & Other Rec. | | | 28,964 | | | | 28,460 | | | | 22,362 | | | | 18,869 | | | | 24,902 | | | | 30,705 | | | | 1.1 | | | | 1.1 | | | | 0.9 | | | | 0.8 | | | | 1.0 | | | | 1.2 | |
Property Held for Sale | | | — | | | | — | | | | — | | | | — | | | | — | | | | 750 | | | | — | | | | — | | | | — | | | | — | | | | — | | | | 0.0 | |
| | | | | | | | | | | | | | | | | | | | | | | | | | | | | | | | | | | | | | | | | | | | | | | | |
Total Current Assets | | | 1,367,416 | | | | 1,339,328 | | | | 1,405,094 | | | | 1,318,044 | | | | 1,411,101 | | | | 1,164,379 | | | | 53.3 | | | | 54.0 | | | | 55.9 | | | | 55.2 | | | | 54.6 | | | | 46.5 | |
Fixed Assets: | | | | | | | | | | | | | | | | | | | | | | | | | | | | | | | | | | | | | | | | | | | | | | | | |
Gross Fixed Assets | | | 2,645,206 | | | | 2,474,821 | | | | 2,461,365 | | | | 2,305,545 | | | | 2,255,066 | | | | 2,278,595 | | | | 103.1 | | | | 99.8 | | | | 97.9 | | | | 96.5 | | | | 87.3 | | | | 91.0 | |
Accumulated Depreciation | | | (1,487,140 | ) | | | (1,418,877 | ) | | | (1,468,243 | ) | | | (1,354,425 | ) | | | (1,245,816 | ) | | | (1,109,445 | ) | | | (58.0 | ) | | | (57.2 | ) | | | (58.4 | ) | | | (56.7 | ) | | | (48.2 | ) | | | (44.3 | ) |
| | | | | | | | | | | | | | | | | | | | | | | | | | | | | | | | | | | | | | | | | | | | | | | | |
Net Fixed Assets | | | 1,158,066 | | | | 1,055,944 | | | | 993,122 | | | | 951,120 | | | | 1,009,250 | | | | 1,169,150 | | | | 45.2 | | | | 42.6 | | | | 39.5 | | | | 39.8 | | | | 39.1 | | | | 46.7 | |
Other Assets: | | | | | | | | | | | | | | | | | | | | | | | | | | | | | | | | | | | | | | | | | | | | | | | | |
Investment Securities | | | — | | | | — | | | | — | | | | — | | | | 6,850 | | | | 1,074 | | | | — | | | | — | | | | — | | | | — | | | | 0.3 | | | | 0.0 | |
Goodwill | | | — | | | | — | | | | — | | | | — | | | | — | | | | — | | | | — | | | | — | | | | — | | | | — | | | | — | | | | — | |
Deferred Income Taxes | | | — | | | | 43,292 | | | | 83,034 | | | | 83,698 | | | | 117,827 | | | | 128,829 | | | | — | | | | 1.7 | | | | 3.3 | | | | 3.5 | | | | 4.6 | | | | 5.1 | |
Other Assets | | | 39,156 | | | | 40,062 | | | | 32,966 | | | | 36,769 | | | | 37,547 | | | | 40,156 | | | | 1.5 | | | | 1.6 | | | | 1.3 | | | | 1.5 | | | | 1.5 | | | | 1.6 | |
| | | | | | | | | | | | | | | | | | | | | | | | | | | | | | | | | | | | | | | | | | | | | | | | |
Total Other Assets | | | 39,156 | | | | 83,354 | | | | 116,000 | | | | 120,467 | | | | 162,224 | | | | 170,059 | | | | 1.5 | | | | 3.4 | | | | 4.6 | | | | 5.0 | | | | 6.3 | | | | 6.8 | |
| | | | | | | | | | | | | | | | | | | | | | | | | | | | | | | | | | | | | | | | | | | | | | | | |
TOTAL ASSETS | | | 2,564,638 | | | | 2,478,626 | | | | 2,514,216 | | | | 2,389,631 | | | | 2,582,575 | | | | 2,503,588 | | | | 100.0 | | | | 100.0 | | | | 100.0 | | | | 100.0 | | | | 100.0 | | | | 100.0 | |
| | | | | | | | | | | | | | | | | | | | | | | | | | | | | | | | | | | | | | | | | | | | | | | | |
LIABILITIES AND SHAREHOLDERS’ EQUITY | | | | | | | | | | | | | | | | | | | | | | | | | | | | | | | | | | | | | | | | | | | | | | | | |
Current Liabilities: | | | | | | | | | | | | | | | | | | | | | | | | | | | | | | | | | | | | | | | | | | | | | | | | |
Accounts Payable | | | 291,948 | | | | 255,763 | | | | 216,438 | | | | 196,622 | | | | 213,946 | | | | 205,227 | | | | 11.4 | | | | 10.3 | | | | 8.6 | | | | 8.2 | | | | 8.3 | | | | 8.2 | |
Accrued Expenses | | | 239,658 | | | | 224,367 | | | | 186,820 | | | | 161,844 | | | | 155,648 | | | | 118,045 | | | | 9.3 | | | | 9.1 | | | | 7.4 | | | | 6.8 | | | | 6.0 | | | | 4.7 | |
Deferred Income Taxes, Current | | | 33,422 | | | | 36,710 | | | | 27,570 | | | | 19,776 | | | | 16,079 | | | | 27,997 | | | | 1.3 | | | | 1.5 | | | | 1.1 | | | | 0.8 | | | | 0.6 | | | | 1.1 | |
Accrued Income Taxes | | | 13,652 | | | | 22,334 | | | | 20,684 | | | | 10,926 | | | | 35,775 | | | | 593 | | | | 0.5 | | | | 0.9 | | | | 0.8 | | | | 0.5 | | | | 1.4 | | | | 0.0 | |
LTD & Capital Leases, Current | | | 8,084 | | | | 9,714 | | | | 108,164 | | | | 4,426 | | | | 3,419 | | | | 4,486 | | | | 0.3 | | | | 0.4 | | | | 4.3 | | | | 0.2 | | | | 0.1 | | | | 0.2 | |
| | | | | | | | | | | | | | | | | | | | | | | | | | | | | | | | | | | | | | | | | | | | | | | | |
Total Current Liabilities | | | 586,764 | | | | 548,888 | | | | 559,676 | | | | 393,594 | | | | 424,868 | | | | 356,348 | | | | 22.9 | | | | 22.1 | | | | 22.3 | | | | 16.5 | | | | 16.5 | | | | 14.2 | |
Long-Term Liabilities: | | | | | | | | | | | | | | | | | | | | | | | | | | | | | | | | | | | | | | | | | | | | | | | | |
LTD & Capital Leases, Less Current | | | 385,673 | | | | 390,110 | | | | 415,515 | | | | 534,813 | | | | 685,437 | | | | 688,704 | | | | 15.0 | | | | 15.7 | | | | 16.5 | | | | 22.4 | | | | 26.5 | | | | 27.5 | |
Interest Rate Swap | | | — | | | | — | | | | — | | | | 5,388 | | | | 7,403 | | | | 8,182 | | | | — | | | | — | | | | — | | | | 0.2 | | | | 0.3 | | | | 0.3 | |
Deferred Income Taxes | | | 16,613 | | | | — | | | | — | | | | — | | | | — | | | | — | | | | 0.6 | | | | — | | | | — | | | | — | | | | — | | | | — | |
Def Comp & Other LT Liabilities | | | 217,343 | | | | 277,007 | | | | 302,795 | | | | 299,564 | | | | 370,573 | | | | 418,327 | | | | 8.5 | | | | 11.2 | | | | 12.0 | | | | 12.5 | | | | 14.3 | | | | 16.7 | |
| | | | | | | | | | | | | | | | | | | | | | | | | | | | | | | | | | | | | | | | | | | | | | | | |
Total Long-Term Liabilities | | | 619,629 | | | | 667,117 | | | | 718,310 | | | | 839,765 | | | | 1,063,413 | | | | 1,115,213 | | | | 24.2 | | | | 26.9 | | | | 28.6 | | | | 35.1 | | | | 41.2 | | | | 44.5 | |
| | | | | | | | | | | | | | | | | | | | | | | | | | | | | | | | | | | | | | | | | | | | | | | | |
Total Liabilities | | | 1,206,393 | | | | 1,216,005 | | | | 1,277,986 | | | | 1,233,359 | | | | 1,488,281 | | | | 1,471,561 | | | | 47.0 | | | | 49.1 | | | | 50.8 | | | | 51.6 | | | | 57.6 | | | | 58.8 | |
Shareholders’ Equity: | | | | | | | | | | | | | | | | | | | | | | | | | | | | | | | | | | | | | | | | | | | | | | | | |
Common Stock | | | 410 | | | | 427 | | | | 449 | | | | 463 | | | | 483 | | | | 488 | | | | 0.0 | | | | 0.0 | | | | 0.0 | | | | 0.0 | | | | 0.0 | | | | 0.0 | |
Additional Paid-In Capital | | | 178,362 | | | | 271,913 | | | | 364,590 | | | | 409,201 | | | | 451,278 | | | | 456,858 | | | | 7.0 | | | | 11.0 | | | | 14.5 | | | | 17.1 | | | | 17.5 | | | | 18.2 | |
Retained Earnings | | | 1,315,796 | | | | 1,157,263 | | | | 1,045,509 | | | | 887,953 | | | | 798,963 | | | | 741,579 | | | | 51.3 | | | | 46.7 | | | | 41.6 | | | | 37.2 | | | | 30.9 | | | | 29.6 | |
Other Comprehensive Equity, Net | | | (136,323 | ) | | | (166,982 | ) | | | (174,318 | ) | | | (141,345 | ) | | | (156,429 | ) | | | (166,898 | ) | | | (5.3 | ) | | | (6.7 | ) | | | (6.9 | ) | | | (5.9 | ) | | | (6.1 | ) | | | (6.7 | ) |
| | | | | | | | | | | | | | | | | | | | | | | | | | | | | | | | | | | | | | | | | | | | | | | | |
Total Shareholders’ Equity | | | 1,358,245 | | | | 1,262,621 | | | | 1,236,230 | | | | 1,156,272 | | | | 1,094,294 | | | | 1,032,027 | | | | 53.0 | | | | 50.9 | | | | 49.2 | | | | 48.4 | | | | 42.4 | | | | 41.2 | |
| | | | | | | | | | | | | | | | | | | | | | | | | | | | | | | | | | | | | | | | | | | | | | | | |
TOTAL LIABILITIES AND SHAREHOLDERS’ EQUITY | | | 2,564,638 | | | | 2,478,626 | | | | 2,514,216 | | | | 2,389,631 | | | | 2,582,575 | | | | 2,503,588 | | | | 100.0 | | | | 100.0 | | | | 100.0 | | | | 100.0 | | | | 100.0 | | | | 100.0 | |
| | | | | | | | | | | | | | | | | | | | | | | | | | | | | | | | | | | | | | | | | | | | | | | | |
LTD = Long-term debt
LT = Long-term
Sources: Internal financial statements for the most recent period and audited financial statements for all previous years by KPMG LLP.
Willamette Management Associates
EXHIBIT 3
BELK, INC.
HISTORICAL AND COMMON SIZE INCOME STATEMENTS
| | | | | | | | | | | | | | | | | | | | | | | | | | | | | | | | | | | | | | | | | | | | | | | | |
| | | LTM | | | | | | | | | | | | | | | | | | LTM | | | | | | | | | | | | | | | | |
| | | Ended | | | Fiscal Years Ended on or Near January 31, | | | Ended | | | Fiscal Years Ended on or Near January 31, | |
| | | 2/1/14 | | | 2013 | | | 2012 | | | 2011 | | | 2010 | | | 2009 | | | 2/1/14 | | | 2013 | | | 2012 | | | 2011 | | | 2010 | | | 2009 | |
| | | $000 | | | $000 | | | $000 | | | $000 | | | $000 | | | $000 | | | % | | | % | | | % | | | % | | | % | | | % | |
Revenue | | | 4,038,118 | | | | 3,956,866 | | | | 3,699,592 | | | | 3,513,275 | | | | 3,346,252 | | | | 3,499,423 | | | | 100.0 | | | | 100.0 | | | | 100.0 | | | | 100.0 | | | | 100.0 | | | | 100.0 | |
Year-Over-Year Change | | | 2.1 | % | | | 7.0 | % | | | 5.3 | % | | | 5.0 | % | | | -4.4 | % | | | | | | | | | | | | | | | | | | | | | | | | | | | | |
Direct Costs: | | | | | | | | | | | | | | | | | | | | | | | | | | | | | | | | | | | | | | | | | | | | | | | | |
Cost of Goods Sold | | | 2,722,766 | | | | 2,636,140 | | | | 2,461,515 | | | | 2,353,536 | | | | 2,271,925 | | | | 2,430,332 | | | | 67.4 | | | | 66.6 | | | | 66.5 | | | | 67.0 | | | | 67.9 | | | | 69.4 | |
| | | | | | | | | | | | | | | | | | | | | | | | | | | | | | | | | | | | | | | | | | | | | | | | |
Total Cost of Sales | | | 2,722,766 | | | | 2,636,140 | | | | 2,461,515 | | | | 2,353,536 | | | | 2,271,925 | | | | 2,430,332 | | | | 67.4 | | | | 66.6 | | | | 66.5 | | | | 67.0 | | | | 67.9 | | | | 69.4 | |
| | | | | | | | | | | | | | | | | | | | | | | | | | | | | | | | | | | | | | | | | | | | | | | | |
Gross Profit | | | 1,315,352 | | | | 1,320,726 | | | | 1,238,077 | | | | 1,159,739 | | | | 1,074,327 | | | | 1,069,091 | | | | 32.6 | | | | 33.4 | | | | 33.5 | | | | 33.0 | | | | 32.1 | | | | 30.6 | |
Year-Over-Year Change | | | -0.4 | % | | | 6.7 | % | | | 6.8 | % | | | 8.0 | % | | | 0.5 | % | | | | | | | | | | | | | | | | | | | | | | | | | | | | |
Operating Expenses: | | | | | | | | | | | | | | | | | | | | | | | | | | | | | | | | | | | | | | | | | | | | | | | | |
Selling, General, and Administrative | | | 886,197 | | | | 862,603 | | | | 815,247 | | | | 773,839 | | | | 727,875 | | | | 782,335 | | | | 21.9 | | | | 21.8 | | | | 22.0 | | | | 22.0 | | | | 21.8 | | | | 22.4 | |
Gain on Sale of Property and Equipment | | | (2,349 | ) | | | (4,168 | ) | | | (3,143 | ) | | | (6,416 | ) | | | (2,011 | ) | | | (4,116 | ) | | | (0.1 | ) | | | (0.1 | ) | | | (0.1 | ) | | | (0.2 | ) | | | (0.1 | ) | | | (0.1 | ) |
Pension Curtailment | | | — | | | | — | | | | — | | | | — | | | | 2,719 | | | | — | | | | — | | | | — | | | | — | | | | — | | | | 0.1 | | | | — | |
Asset Impairment and Store Closings | | | 6,108 | | | | (268 | ) | | | 2,302 | | | | 6,096 | | | | 39,915 | | | | 358,248 | | | | 0.2 | | | | (0.0 | ) | | | 0.1 | | | | 0.2 | | | | 1.2 | | | | 10.2 | |
Depreciation and Amortization Expense | | | 137,069 | | | | 122,622 | | | | 122,761 | | | | 140,239 | | | | 158,388 | | | | 165,267 | | | | 3.4 | | | | 3.1 | | | | 3.3 | | | | 4.0 | | | | 4.7 | | | | 4.7 | |
| | | | | | | | | | | | | | | | | | | | | | | | | | | | | | | | | | | | | | | | | | | | | | | | |
Total Operating Expenses | | | 1,027,025 | | | | 980,789 | | | | 937,167 | | | | 913,758 | | | | 926,886 | | | | 1,301,734 | | | | 25.4 | | | | 24.8 | | | | 25.3 | | | | 26.0 | | | | 27.7 | | | | 37.2 | |
| | | | | | | | | | | | | | | | | | | | | | | | | | | | | | | | | | | | | | | | | | | | | | | | |
Income from Operations | | | 288,327 | | | | 339,937 | | | | 300,910 | | | | 245,981 | | | | 147,441 | | | | (232,643 | ) | | | 7.1 | | | | 8.6 | | | | 8.1 | | | | 7.0 | | | | 4.4 | | | | (6.6 | ) |
Other Income/(Expense): | | | | | | | | | | | | | | | | | | | | | | | | | | | | | | | | | | | | | | | | | | | | | | | | |
Interest Expense, Net | | | (44,450 | ) | | | (49,306 | ) | | | (49,890 | ) | | | (50,110 | ) | | | (50,294 | ) | | | (50,842 | ) | | | (1.1 | ) | | | (1.2 | ) | | | (1.3 | ) | | | (1.4 | ) | | | (1.5 | ) | | | (1.5 | ) |
(Loss) on Extinguishment of Debt | | | — | | | | (127 | ) | | | (922 | ) | | | — | | | | — | | | | — | | | | — | | | | (0.0 | ) | | | (0.0 | ) | | | — | | | | — | | | | — | |
Gain/(Loss) on Sale of Asset | | | — | | | | — | | | | — | | | | — | | | | 43 | | | | 204 | | | | — | | | | — | | | | — | | | | — | | | | 0.0 | | | | 0.0 | |
| | | | | | | | | | | | | | | | | | | | | | | | | | | | | | | | | | | | | | | | | | | | | | | | |
Total Other Income/(Expense) | | | (44,450 | ) | | | (49,433 | ) | | | (50,812 | ) | | | (50,110 | ) | | | (50,251 | ) | | | (50,638 | ) | | | (1.1 | ) | | | (1.2 | ) | | | (1.4 | ) | | | (1.4 | ) | | | (1.5 | ) | | | (1.4 | ) |
| | | | | | | | | | | | | | | | | | | | | | | | | | | | | | | | | | | | | | | | | | | | | | | | |
Pretax Income | | | 243,877 | | | | 290,504 | | | | 250,098 | | | | 195,871 | | | | 97,190 | | | | (283,281 | ) | | | 6.0 | | | | 7.3 | | | | 6.8 | | | | 5.6 | | | | 2.9 | | | | (8.1 | ) |
Income Tax (Expense)/Benefit | | | (85,344 | ) | | | (102,134 | ) | | | (66,950 | ) | | | (68,243 | ) | | | (30,054 | ) | | | 70,316 | | | | (2.1 | ) | | | (2.6 | ) | | | (1.8 | ) | | | (1.9 | ) | | | (0.9 | ) | | | 2.0 | |
| | | | | | | | | | | | | | | | | | | | | | | | | | | | | | | | | | | | | | | | | | | | | | | | |
Income Tax Rate | | | -35.0 | % | | | -35.2 | % | | | -26.8 | % | | | -34.8 | % | | | -30.9 | % | | | -24.8 | % | | | | | | | | | | | | | | | | | | | | | | | | |
Net Income | | | 158,533 | | | | 188,370 | | | | 183,148 | | | | 127,628 | | | | 67,136 | | | | (212,965 | ) | | | 3.9 | | | | 4.8 | | | | 5.0 | | | | 3.6 | | | | 2.0 | | | | (6.1 | ) |
| | | | | | | | | | | | | | | | | | | | | | | | | | | | | | | | | | | | | | | | | | | | | | | | |
Year-Over-Year Change | | | -15.8 | % | | | 2.9 | % | | | 43.5 | % | | | 90.1 | % | | | NA | | | | | | | | | | | | | | | | | | | | | | | | | | | | | |
Supplemental Information: | | | | | | | | | | | | | | | | | | | | | | | | | | | | | | | | | | | | | | | | | | | | | | | | |
Comparable Store Sales Change (%) | | | 2.9 | % | | | 6.3 | % | | | 5.5 | % | | | 5.1 | % | | | -4.6 | % | | | -8.7 | % | | | | | | | | | | | | | | | | | | | | | | | | |
EPS ($) [Basic] | | $ | 3.82 | | | $ | 4.34 | | | $ | 4.04 | | | $ | 2.72 | | | $ | 1.39 | | | $ | (4.35 | ) | | | | | | | | | | | | | | | | | | | | | | | | |
Year-Over-Year Change | | | -12.0 | % | | | 7.3 | % | | | 48.5 | % | | | 95.7 | % | | | NA | | | | | | | | | | | | | | | | | | | | | | | | | | | | | |
LTM = Latest twelve months
EPS = Earnings per share
NA = Not applicable/available
Sources: S&P Capital IQ; Internal financial statements for LTM period and audited financial statements for all previous years by KPMG LLP.
Willamette Management Associates
EXHIBIT 4
BELK, INC.
NORMALIZATION ADJUSTMENTS TO HISTORICAL INCOME STATEMENTS
AND MARKET VALUE OF INVESTED CAPITAL FUNDAMENTALS
| | | | | | | | | | | | | | | | | | | | | | | | | | | | |
| | | LTM | | | | | | | | | | | | | | | | | | | |
| | | Ended | | | Fiscal Years Ended on or Near January 31, | | | Three Year | |
| | | 2/1/14 | | | 2013 | | | 2012 | | | 2011 | | | 2010 | | | 2009 | | | Average [d] | |
| | | $000 | | | $000 | | | $000 | | | $000 | | | $000 | | | $000 | | | $000 | |
Revenue [a] | | | 4,038,118 | | | | 3,956,866 | | | | 3,699,592 | | | | 3,513,275 | | | | 3,346,252 | | | | 3,499,423 | | | | 3,898,192 | |
Reported Pretax Income [a] | | | 243,877 | | | | 290,504 | | | | 250,098 | | | | 195,871 | | | | 97,190 | | | | (283,281 | ) | | | | |
Normalization Adjustments to Pretax Income: | | | | | | | | | | | | | | | | | | | | | | | | | | | | |
+/- (Gains)/Losses on Sale of Property and Equipment [a] | | | (2,349 | ) | | | (4,168 | ) | | | (3,143 | ) | | | (6,416 | ) | | | (2,011 | ) | | | (4,116 | ) | | | | |
+ Pension Curtailment [a] | | | — | | | | — | | | | — | | | | — | | | | 2,719 | | | | — | | | | | |
+ Asset Impairment and Store Closing Costs [a] | | | 6,108 | | | | (268 | ) | | | 2,302 | | | | 6,096 | | | | 39,915 | | | | 358,248 | | | | | |
+/- (Gains)/Losses on Extinguishment of Debt [a] | | | — | | | | 127 | | | | 922 | | | | — | | | | — | | | | — | | | | | |
+/- (Gains)/Losses in the Sale of Assets [a] | | | — | | | | — | | | | — | | | | — | | | | (43 | ) | | | (204 | ) | | | | |
| | | | | | | | | | | | | | | | | | | | | | | | | | | | |
Equals: Normalized Pretax Income | | | 247,636 | | | | 286,195 | | | | 250,179 | | | | 195,551 | | | | 137,770 | | | | 70,647 | | | | 261,337 | |
| | | | | | | | | | | | | | | | | | | | | | | | | | | | |
(1 - income tax rate) [b] | | | 0.65 | | | | 0.65 | | | | 0.65 | | | | 0.65 | | | | 0.65 | | | | 0.65 | | | | | |
| | | | | | | | | | | | | | | | | | | | | | | | | | | | |
Equals: Normalized Net Income | | | 160,988 | | | | 186,055 | | | | 162,641 | | | | 127,128 | | | | 89,564 | | | | 45,928 | | | | 169,895 | |
| | | | | | | | | | | | | | | | | | | | | | | | | | | | |
Normalized Financial Fundamentals: | | | | | | | | | | | | | | | | | | | | | | | | | | | | |
Adjusted Pretax Income | | | 247,636 | | | | 286,195 | | | | 250,179 | | | | 195,551 | | | | 137,770 | | | | 70,647 | | | | | |
Plus: Interest Expense, Net [a] | | | 44,450 | | | | 49,306 | | | | 49,890 | | | | 50,110 | | | | 50,294 | | | | 50,842 | | | | | |
| | | | | | | | | | | | | | | | | | | | | | | | | | | | |
Equals: EBIT | | | 292,086 | | | | 335,501 | | | | 300,069 | | | | 245,661 | | | | 188,064 | | | | 121,489 | | | | 309,219 | |
| | | | | | | | | | | | | | | | | | | | | | | | | | | | |
EBIT | | | 292,086 | | | | 335,501 | | | | 300,069 | | | | 245,661 | | | | 188,064 | | | | 121,489 | | | | | |
Plus: Depreciation and Amortization Expense [a] | | | 137,069 | | | | 122,622 | | | | 122,761 | | | | 140,239 | | | | 158,388 | | | | 165,267 | | | | | |
| | | | | | | | | | | | | | | | | | | | | | | | | | | | |
Equals: EBITDA | | | 429,155 | | | | 458,123 | | | | 422,830 | | | | 385,900 | | | | 346,452 | | | | 286,756 | | | | 436,703 | |
| | | | | | | | | | | | | | | | | | | | | | | | | | | | |
Financial Margins | | | | | | | | | | | | | | | | | | | | | | | | | | | | |
EBIT | | | 7.2 | % | | | 8.5 | % | | | 8.1 | % | | | 7.0 | % | | | 5.6 | % | | | 3.5 | % | | | | |
EBITDA | | | 10.6 | % | | | 11.6 | % | | | 11.4 | % | | | 11.0 | % | | | 10.4 | % | | | 8.2 | % | | | | |
Capital Requirements | | | | | | | | | | | | | | | | | | | | | | | | | | | | |
Capital Expenditures [e] | | | (224,228 | ) | | | (182,773 | ) | | | (143,844 | ) | | | (82,409 | ) | | | (42,326 | ) | | | (129,282 | ) | | | | |
Net Operating Working Capital Decrease/(Increase) | | | 37,575 | | | | (33,667 | ) | | | (27,987 | ) | | | (68,101 | ) | | | 140,911 | | | | NA | | | | | |
Balance Sheet Fundamentals | | | | | | | | | | | | | | | | | | | | | | | | | | | | |
LTD & Capital Leases, Current | | | 8,084 | | | | 9,714 | | | | 108,164 | | | | 4,426 | | | | 3,419 | | | | 4,486 | | | | | |
LTD & Capital Leases, Less Current | | | 385,673 | | | | 390,110 | | | | 415,515 | | | | 534,813 | | | | 685,437 | | | | 688,704 | | | | | |
| | | | | | | | | | | | | | | | | | | | | | | | | | | | |
Total Interest-Bearing Debt [c] | | | 393,757 | | | | 399,824 | | | | 523,679 | | | | 539,239 | | | | 688,856 | | | | 693,190 | | | | | |
Ending Cash Balance [c] | | | 295,334 | | | | 269,177 | | | | 456,272 | | | | 459,553 | | | | 595,280 | | | | 271,458 | | | | | |
| | | | | | | | | | | | | | | | | | | | | | | | | | | | |
Net Interest-Bearing Debt | | | 98,423 | | | | 130,647 | | | | 67,407 | | | | 79,686 | | | | 93,576 | | | | 421,732 | | | | | |
LTM = Latest twelve months
EBIT = Earnings before interest and taxes
EBITDA = Earnings before interest, taxes, depreciation, and amortization
LTD = Long-term debt
NA = Not applicable/available
Footnotes:
| [a] | As presented in Exhibit 3. |
| [b] | Based on the normalized income tax rate per Exhibit 6 a and discussions with Belk management. |
| [c] | As presented in Exhibit 2. |
| [d] | Represents a simple average. |
| [e] | As presented in the Belk internally prepared and audited cash flow statements. |
Sources: Exhibits 2, 3, 5, and 6 a; Belk management; and Willamette Management Associates calculations.
Willamette Management Associates
EXHIBIT 5
BELK, INC.
HISTORICAL FINANCIAL AND OPERATING RATIOS
| | | | | | | | | | | | | | | | | | | | | | | | |
| | | LTM | | | | | | | | | | | | | | | | |
| | | Ended | | | Fiscal Years Ended on or Near January 31, | |
| | | 2/1/14 | | | 2013 | | | 2012 | | | 2011 | | | 2010 | | | 2009 | |
Liquidity | | | | | | | | | | | | | | | | | | | | | | | | |
Current Ratio | | | 2.3 | | | | 2.4 | | | | 2.5 | | | | 3.3 | | | | 3.3 | | | | 3.3 | |
Quick Ratio | | | 0.6 | | | | 0.5 | | | | 0.9 | | | | 1.2 | | | | 1.4 | | | | 0.9 | |
Working Capital ($000s) | | | 780,652 | | | | 790,440 | | | | 845,418 | | | | 924,450 | | | | 986,233 | | | | 808,031 | |
Working Capital as a Percentage of Total Assets | | | 30.4 | | | | 31.9 | | | | 33.6 | | | | 38.7 | | | | 38.2 | | | | 32.3 | |
Book Value of Invested Capital ($000s) | | | 1,752,002 | | | | 1,662,445 | | | | 1,759,909 | | | | 1,695,511 | | | | 1,783,150 | | | | 1,725,217 | |
Activity | | | | | | | | | | | | | | | | | | | | | | | | |
Turnover [a]: | | | | | | | | | | | | | | | | | | | | | | | | |
Working Capital | | | 5.1 | | | | 4.8 | | | | 4.2 | | | | 3.7 | | | | 3.7 | | | | NA | |
Inventory | | | 2.7 | | | | 2.8 | | | | 2.9 | | | | 3.0 | | | | 2.8 | | | | NA | |
Receivables | | | 92.5 | | | | 110.8 | | | | 104.9 | | | | 131.2 | | | | 118.5 | | | | NA | |
Total Asset | | | 1.6 | | | | 1.6 | | | | 1.5 | | | | 1.4 | | | | 1.3 | | | | NA | |
Fixed Asset | | | 3.6 | | | | 3.9 | | | | 3.8 | | | | 3.6 | | | | 3.1 | | | | NA | |
Average Collection Period (Days) | | | 3.9 | | | | 3.3 | | | | 3.5 | | | | 2.8 | | | | 3.1 | | | | NA | |
Days to Sell Inventory | | | 133.9 | | | | 131.3 | | | | 125.7 | | | | 122.8 | | | | 128.8 | | | | NA | |
Operating Cycle (Days) | | | 137.8 | | | | 134.6 | | | | 129.2 | | | | 125.6 | | | | 131.9 | | | | NA | |
Coverage and Leverage | | | | | | | | | | | | | | | | | | | | | | | | |
Interest Expense Coverage [b]: | | | | | | | | | | | | | | | | | | | | | | | | |
EBIT | | | 6.6 | | | | 6.8 | | | | 6.0 | | | | 4.9 | | | | 3.7 | | | | NA | |
EBITDA | | | 9.7 | | | | 9.3 | | | | 8.5 | | | | 7.7 | | | | 6.9 | | | | NA | |
Total Interest-Bearing Debt/Total Assets (%) | | | 15.4 | | | | 16.1 | | | | 20.8 | | | | 22.6 | | | | 26.7 | | | | 27.7 | |
Equity/Invested Capital (%) | | | 77.5 | | | | 75.9 | | | | 70.2 | | | | 68.2 | | | | 61.4 | | | | 59.8 | |
Profitability (%) [c] | | | | | | | | | | | | | | | | | | | | | | | | |
EBITDA Margin | | | 10.6 | | | | 11.6 | | | | 11.4 | | | | 11.0 | | | | 10.4 | | | | 8.2 | |
EBIT Margin | | | 7.2 | | | | 8.5 | | | | 8.1 | | | | 7.0 | | | | 5.6 | | | | 3.5 | |
Pretax Profit Margin | | | 6.1 | | | | 7.2 | | | | 6.8 | | | | 5.6 | | | | 4.1 | | | | 2.0 | |
Net Profit Margin | | | 4.0 | | | | 4.7 | | | | 4.4 | | | | 3.6 | | | | 2.7 | | | | 1.3 | |
Net Return on: | | | | | | | | | | | | | | | | | | | | | | | | |
Ending Assets | | | 6.3 | | | | 7.5 | | | | 6.5 | | | | 5.3 | | | | 3.5 | | | | 1.8 | |
Ending Equity | | | 11.9 | | | | 14.7 | | | | 13.2 | | | | 11.0 | | | | 8.2 | | | | 4.5 | |
Average Assets | | | 6.4 | | | | 7.5 | | | | 6.6 | | | | 5.1 | | | | 3.5 | | | | NA | |
Average Equity | | | 12.3 | | | | 14.9 | | | | 13.6 | | | | 11.3 | | | | 8.4 | | | | NA | |
LTM = Latest twelve months
EBIT = Earnings before interest and taxes
EBITDA = Earnings before interest, taxes, depreciation, and amortization
Invested Capital = Equity plus interest-bearing debt
NA = Not applicable/available
Footnotes:
| [b] | Only includes interest expense associated with interest-bearing debt in the Belk capital structure. |
| [c] | Based on profitability as presented in Exhibit 4. |
Sources: Exhibits 2, 3, and 4; and Willamette Management Associates calculations.
Willamette Management Associates
EXHIBIT 6 a
BELK, INC.
INCOME APPROACH
DISCOUNTED CASH FLOW METHOD
WEIGHTED AVERAGE COST OF CAPITAL
AS OF FEBRUARY 1, 2014
| | | | |
| | | Cost of Capital | |
| | | Component | |
Concluded Cost of Equity Capital [a] | | | 13.2 | % |
Cost of Debt Capital | | | | |
Pretax Cost of Debt [b] | | | 5.4 | % |
Income Tax Rate [c] | | | 35 | % |
| | | | |
Total After-Tax Cost of Debt | | | 3.5 | % |
Capital Structure | | | | |
Equity in Capital Structure [d] | | | 95 | % |
Debt in Capital Structure [d] | | | 5 | % |
| | | | |
| | | 100 | % |
| | | | |
Weighted Average Cost of Capital [Rounded] | | | 12.5 | % |
Less: Anticipated Long-Term Growth Rate [e] | | | 4 | % |
| | | | |
Equals: Direct Capitalization Rate | | | 8.5 | % |
Direct Capitalization Multiple (Inverse of Direct Capitalization Rate) | | | 11.8 | |
Footnotes:
| [a] | As shown on Exhibit 6 b. |
| [b] | The Belk weighted average debt yield to maturity rate as of February 2, 2014. Willamette Management Associates compares the actual Belk debt yield to maturity rate to the Moody’s Baa corporate bond yield to maturity rate as of January 31, 2014, which is 5.07 percent. |
| [c] | Normalized effective corporate income tax rate of 35 percent, based on Belk management financial statement projections. |
| [d] | Based on the Company’s actual and projected capital structure determined by an iterative process. |
| [e] | The anticipated long-term growth rate is based on Belk management financial projections, department store industry research, and U.S. macroeconomic analyses. |
Sources: As cited and Willamette Management Associates calculations.
Willamette Management Associates
EXHIBIT 6 b
BELK, INC.
INCOME APPROACH
DISCOUNTED CASH FLOW METHOD
WEIGHTED AVERAGE COST OF CAPITAL
COST OF EQUITY CAPITAL
AS OF FEBRUARY 1, 2014
| | | | | | | | | | | | |
| | | | | | | | | Cost of Equity Capital | |
| | | Weight | | | | | | Component | |
Cost of Equity | | | | | | | | | | | | |
Build-up Model | | | | | | | | | | | | |
Risk-Free Rate of Return [a] | | | | | | | | | | | 3.35 | % |
Long-Term Equity Risk Premium [b] | | | | | | | | | | | 6.11 | % |
Size Equity Risk Premium [c] | | | | | | | | | | | 1.70 | % |
Industry Equity Risk Premium [d] | | | | | | | | | | | 3.76 | % |
Company-Specific Equity Risk Premium [e] | | | | | | | | | | | 1.00 | % |
| | | | | | | | | | | | |
Equals: Indicated Cost of Equity [Rounded] | | | | | | | | | | | 15.92 | % |
Multiplied by: Relative Weight [f] | | | 20 | % | | | | | | | | |
| | | | | | | | | | | | |
Modified Capital Asset Pricing Model | | | | | | | | | | | | |
Risk-Free Rate of Return [a] | | | | | | | | | | | 3.35 | % |
Long-Term Equity Risk Premium [b] | | | | | | | 6.11 | % | | | | |
Industry Beta [g] | | | | | | | 1.05 | | | | | |
| | | | | | | | | | | | |
Beta-adjusted Equity Risk Premium | | | | | | | | | | | 6.42 | % |
Size Equity Risk Premium [c] | | | | | | | | | | | 1.70 | % |
Company-Specific Equity Risk Premium [e] | | | | | | | | | | | 1.00 | % |
Equals: Indicated Cost of Equity [Rounded] | | | | | | | | | | | 12.47 | % |
Multiplied by: Relative Weight [f] | | | 60 | % | | | | | | | | |
| | | | | | | | | | | | |
Duff & Phelps Model | | | | | | | | | | | | |
Risk-Free Rate of Return [a] | | | | | | | | | | | 3.35 | % |
Long-Term Equity Risk Premium [h] | | | | | | | | | | | 8.44 | % |
Company-Specific Equity Risk Premium [e] | | | | | | | | | | | 1.00 | % |
| | | | | | | | | | | | |
Equals: Indicated Cost of Equity [Rounded] | | | | | | | | | | | 12.80 | % |
Multiplied by: Relative Weight [f] | | | 20 | % | | | | | | | | |
| | | | | | | | | | | | |
Equals: Concluded Cost of Equity [Rounded] | | | 13.2 | % | | | | | | | | |
Footnotes:
| [a] | 20-year Treasury bond yield to maturity rate as of January 31, 2014, theFederal Reserve Statistical Release. |
| [b] | 2013 Ibbotson SBBI Valuation Yearbook(Chicago: Morningstar 2013), long-horizon expected equity risk premium (suplpy side): historical equity risk premium. |
| [c] | 2013 Ibbotson SBBI Valuation Yearbook(Chicago: Morningstar 2013), 5th decile (market capitalization between $1.912 billion and $2.759 billion). |
| [d] | 2013 Ibbotson SBBI Valuation Yearbook(Chicago: Morningstar 2013), standard industrial classification (SIC) number 531: department stores. |
| [e] | Willamette Management Associates estimate based on Belk-specific risk factors. |
| [f] | Willamette Management Associates estimate. |
| [g] | As shown on Exhibit 6 c. |
| [h] | As shown on Exhibit 6 d. |
Sources: As cited and Willamette Management Associates calculations.
Willamette Management Associates
EXHIBIT 6 c
BELK, INC.
INCOME APPROACH
DISCOUNTED CASH FLOW METHOD
WEIGHTED AVERAGE COST OF CAPITAL
COST OF EQUITY CAPITAL
MODIFIED CAPITAL ASSET PRICING MODEL
INDUSTRY BETA CALCULATION
AS OF FEBRUARY 1, 2014
| | | | | | | | | | | | | | | | | | | | | | | | |
| | | Levered Beta | | | | | | | |
| | | | | | | | | | | | Average | | | | | | | |
| | | 5 Year | | | 5 Year | | | 5 Year | | | Levered | | | | | | | |
Selected Guideline Publicly Traded Company | | Daily | | | Weekly | | | Monthly | | | Beta | | | Debt | | | Equity | |
Bon-Ton Stores Inc. | | | 1.38 | | | | 1.89 | | | | 2.69 | | | | 1.99 | | | | 82 | % | | | 18 | % |
Dillard’s Inc. | | | 1.41 | | | | 1.51 | | | | 1.78 | | | | 1.56 | | | | 21 | % | | | 79 | % |
Kohl’s Corp. | | | 0.90 | | | | 0.86 | | | | 0.85 | | | | 0.87 | | | | 32 | % | | | 68 | % |
Macy’s, Inc. | | | 1.28 | | | | 1.28 | | | | 1.19 | | | | 1.25 | | | | 28 | % | | | 72 | % |
Nordstrom Inc. | | | 1.26 | | | | 1.31 | | | | 1.26 | | | | 1.28 | | | | 23 | % | | | 77 | % |
Target Corp. | | | 0.84 | | | | 0.88 | | | | 0.87 | | | | 0.86 | | | | 30 | % | | | 70 | % |
Stage Stores Inc. | | | 1.39 | | | | 1.33 | | | | 1.21 | | | | 1.31 | | | | 20 | % | | | 80 | % |
The Gap, Inc. | | | 1.01 | | | | 1.08 | | | | 1.18 | | | | 1.09 | | | | 7 | % | | | 93 | % |
| | | | | | | | | | | | | | | | | | | | | | | | |
Average | | | 1.18 | | | | 1.27 | | | | 1.38 | | | | 1.28 | | | | 30 | % | | | 70 | % |
Median | | | 1.27 | | | | 1.29 | | | | 1.20 | | | | 1.26 | | | | 26 | % | | | 74 | % |
| | | | | | | | | | | | | | | | | | | | | | | | |
Belk Actual Market-Based Capital Structure [a] | | | | | | | | | | | | | | | | | | | 5 | % | | | 95 | % |
| | | | | | | | | | | | | | | | |
| | | Relevered Beta [b, c] | |
| | | | | | | | | | | | Average | |
| | | 5 Year | | | 5 Year | | | 5 Year | | | Relevered | |
Selected Guideline Publicly Traded Company | | Daily | | | Weekly | | | Monthly | | | Beta | |
Bon-Ton Stores Inc. | | | 0.35 | | | | 0.48 | | | | 0.69 | | | | 0.51 | |
Dillard’s Inc. | | | 1.24 | | | | 1.33 | | | | 1.57 | | | | 1.38 | |
Kohl’s Corp. | | | 0.71 | | | | 0.68 | | | | 0.67 | | | | 0.69 | |
Macy’s, Inc. | | | 1.06 | | | | 1.05 | | | | 0.98 | | | | 1.03 | |
Nordstrom Inc. | | | 1.09 | | | | 1.13 | | | | 1.09 | | | | 1.10 | |
Target Corp. | | | 0.68 | | | | 0.71 | | | | 0.70 | | | | 0.70 | |
Stage Stores Inc. | | | 1.24 | | | | 1.19 | | | | 1.08 | | | | 1.17 | |
The Gap, Inc. | | | 0.99 | | | | 1.06 | | | | 1.16 | | | | 1.07 | |
| | | | | | | | | | | | | | | | |
Average | | | 0.92 | | | | 0.95 | | | | 0.99 | | | | 0.96 | |
Median | | | 1.02 | | | | 1.06 | | | | 1.03 | | | | 1.05 | |
| | | | | | | | | | | | | | | | |
Selected Market-Derived Relevered Beta | | | | | | | | | | | | | | | 1.05 | |
| | | | | | | | | | | | | | | | |
Footnotes:
| [a] | As shown on Exhibit 6 a. |
| [b] | Based on Belk’s normalized income tax rate of 35 percent. |
| [c] | Relevered Beta = Levered beta / (1+(1 - income tax rate) x (debt % of total capital / equity % of total capital)) x (1+(1 - income tax rate) x (debt % of total capital / equity % of total capital)) |
Sources: Exhibits 6 a and 13 a; Bloomberg; S&P Capital IQ; and Willamette Management Associates calculations.
Willamette Management Associates
EXHIBIT 6 d
BELK, INC.
INCOME APPROACH
DISCOUNTED CASH FLOW METHOD
WEIGHTED AVERAGE COST OF CAPITAL
COST OF EQUITY CAPITAL
DUFF & PHELPS MODEL
EQUITY RISK PREMIUM MODEL
AS OF FEBRUARY 1, 2014
| | | | | | | | | | | | | | | | | | | | |
| | | Actual | | | | | | | | | | | | | |
Equity Risk Premium: | | ($MM) | | | Constant [a] | | | Slope [a] | | | Log | | | Premium | |
Current Year’s Book Value of Common Equity | | | 1,358.245 | | | | 17.00 | % | | | -2.67 | % | | | 3.133 | | | | 8.60 | % |
5-Year Average Net Income | | | 144.963 | | | | 14.82 | % | | | -2.80 | % | | | 2.161 | | | | 8.80 | % |
Current Year’s Total Assets | | | 2,564.638 | | | | 18.71 | % | | | -2.84 | % | | | 3.409 | | | | 9.00 | % |
5-Year Average EBITDA | | | 408.492 | | | | 16.35 | % | | | -2.87 | % | | | 2.611 | | | | 8.90 | % |
Current Year’s Sales | | | 4,038.118 | | | | 16.57 | % | | | -2.20 | % | | | 3.606 | | | | 8.60 | % |
| | | | | | | | | | | | | | | Median | | | | 8.80 | % |
| | | | | | | | | | | | | | | | | | | | |
| | | | |
Relevered Equity Risk Premium Analysis: | | | |
Median Levered Market Premium | | | 8.80 | % |
Market Debt/Equity Ratio [a] | | | 9.80 | % |
| | | | |
Unlevered Equity Risk Premium [b] | | | 8.01 | % |
Debt/Equity Ratio [c] | | | 5.26 | % |
| | | | |
Relevered Equity Risk Premium [d] | | | 8.44 | % |
| | | | |
EBITDA = Earnings before interest, taxes, depreciation, and amortization
Footnotes:
| [a] | Duff & Phelps, LLC, Risk Premium Report 2013. |
| [b] | Unlevered Equity Risk Premium = Actual equity risk premium / (1 + debt/equity ratio). |
| [d] | Relevered Equity Risk Premium = Unlevered equity risk premium + (unlevered equity risk premium * debt/equity ratio). |
Sources: As cited and Willamette Management Associates calculations.
Willamette Management Associates
EXHIBIT 7
BELK, INC.
INCOME APPROACH
DISCOUNTED CASH FLOW METHOD
BELK MANAGEMENT PROJECTED AND COMMON SIZE BALANCE SHEETS
AS OF FEBRUARY 1, 2014
| | | | | | | | | | | | | | | | | | | | | | | | | | | | | | | | |
| | | As of | | | As of or Near January 31, | | | As of | | | As of or Near January 31, | |
| | | 2/1/14 | | | 2015 | | | 2016 | | | 2017 | | | 2/1/14 | | | 2015 | | | 2016 | | | 2017 | |
| | | $000 | | | $000 | | | $000 | | | $000 | | | % | | | % | | | % | | | % | |
ASSETS | | | | | | | | | | | | | | | | | | | | | | | | | | | | | | | | |
Current Assets: | | | | | | | | | | | | | | | | | | | | | | | | | | | | | | | | |
Cash and Cash Equivalents | | | 295,334 | | | | 347,446 | | | | 340,804 | | | | 410,887 | | | | 11.5 | | | | 13.1 | | | | 12.5 | | | | 14.5 | |
Accounts Receivable, Net | | | 55,340 | | | | 36,934 | | | | 38,464 | | | | 40,479 | | | | 2.2 | | | | 1.4 | | | | 1.4 | | | | 1.4 | |
Merchandise Inventory | | | 987,778 | | | | 938,130 | | | | 969,323 | | | | 986,726 | | | | 38.5 | | | | 35.5 | | | | 35.5 | | | | 34.7 | |
Prepaids and Other Receivables | | | 28,964 | | | | 30,732 | | | | 31,852 | | | | 33,433 | | | | 1.1 | | | | 1.2 | | | | 1.2 | | | | 1.2 | |
| | | | | | | | | | | | | | | | | | | | | | | | | | | | | | | | |
Total Current Assets | | | 1,367,416 | | | | 1,353,243 | | | | 1,380,443 | | | | 1,471,526 | | | | 53.3 | | | | 51.2 | | | | 50.5 | | | | 51.8 | |
Fixed Assets: | | | | | | | | | | | | | | | | | | | | | | | | | | | | | | | | |
Net Fixed Assets | | | 1,158,066 | | | | 1,251,700 | | | | 1,312,200 | | | | 1,329,200 | | | | 45.2 | | | | 47.3 | | | | 48.0 | | | | 46.8 | |
Other Assets: | | | | | | | | | | | | | | | | | | | | | | | | | | | | | | | | |
Total Other Assets | | | 39,156 | | | | 39,156 | | | | 39,156 | | | | 39,156 | | | | 1.5 | | | | 1.5 | | | | 1.4 | | | | 1.4 | |
| | | | | | | | | | | | | | | | | | | | | | | | | | | | | | | | |
TOTAL ASSETS | | | 2,564,638 | | | | 2,644,099 | | | | 2,731,799 | | | | 2,839,882 | | | | 100.0 | | | | 100.0 | | | | 100.0 | | | | 100.0 | |
| | | | | | | | | | | | | | | | | | | | | | | | | | | | | | | | |
LIABILITIES AND SHAREHOLDERS’ EQUITY | | | | | | | | | | | | | | | | | | | | | | | | | | | | | | | | |
Current Liabilities: | | | | | | | | | | | | | | | | | | | | | | | | | | | | | | | | |
Accounts Payable | | | 291,948 | | | | 300,012 | | | | 316,871 | | | | 337,804 | | | | 11.4 | | | | 11.3 | | | | 11.6 | | | | 11.9 | |
Accrued Expenses | | | 239,658 | | | | 244,228 | | | | 254,876 | | | | 268,410 | | | | 9.3 | | | | 9.1 | | | | 7.4 | | | | 6.8 | |
Deferred Income Taxes, Current Portion | | | 33,422 | | | | 30,132 | | | | 26,842 | | | | 23,551 | | | | 1.3 | | | | 1.5 | | | | 1.1 | | | | 0.8 | |
Accrued Income Taxes | | | 13,652 | | | | 36,718 | | | | 39,349 | | | | 42,600 | | | | 0.5 | | | | 0.9 | | | | 0.8 | | | | 0.5 | |
Current Portion of Long-Term Debt | | | 8,084 | | | | 108,084 | | | | 8,084 | | | | 133,084 | | | | 0.3 | | | | 4.1 | | | | 0.3 | | | | 4.7 | |
| | | | | | | | | | | | | | | | | | | | | | | | | | | | | | | | |
Total Current Liabilities | | | 586,764 | | | | 719,174 | | | | 646,021 | | | | 805,449 | | | | 22.9 | | | | 27.2 | | | | 23.6 | | | | 28.4 | |
Long-Term Liabilities: | | | | | | | | | | | | | | | | | | | | | | | | | | | | | | | | |
Long-Term Debt, Less Current Maturities | | | 385,673 | | | | 285,673 | | | | 385,673 | | | | 260,673 | | | | 15.0 | | | | 10.8 | | | | 14.1 | | | | 9.2 | |
Deferred Income Taxes | | | 16,613 | | | | — | | | | — | | | | — | | | | 0.6 | | | | — | | | | — | | | | — | |
Deferred Compensation and Other LT Liabilities | | | 217,343 | | | | 262,029 | | | | 286,282 | | | | 310,535 | | | | 8.5 | | | | 9.9 | | | | 10.5 | | | | 10.9 | |
| | | | | | | | | | | | | | | | | | | | | | | | | | | | | | | | |
Total Long-Term Liabilities | | | 619,629 | | | | 547,702 | | | | 671,955 | | | | 571,208 | | | | 24.2 | | | | 20.7 | | | | 24.6 | | | | 20.1 | |
| | | | | | | | | | | | | | | | | | | | | | | | | | | | | | | | |
Total Liabilities | | | 1,206,393 | | | | 1,266,876 | | | | 1,317,976 | | | | 1,376,657 | | | | 47.0 | | | | 47.9 | | | | 48.2 | | | | 48.5 | |
Shareholders’ Equity: | | | | | | | | | | | | | | | | | | | | | | | | | | | | | | | | |
Total Shareholders’ Equity | | | 1,358,245 | | | | 1,377,223 | | | | 1,413,823 | | | | 1,463,225 | | | | 53.0 | | | | 52.1 | | | | 51.8 | | | | 51.5 | |
| | | | | | | | | | | | | | | | | | | | | | | | | | | | | | | | |
TOTAL LIABILITIES AND SHAREHOLDERS’ EQUITY | | | 2,564,638 | | | | 2,644,099 | | | | 2,731,799 | | | | 2,839,882 | | | | 100.0 | | | | 100.0 | | | | 100.0 | | | | 100.0 | |
| | | | | | | | | | | | | | | | | | | | | | | | | | | | | | | | |
LT = Long-term
Sources: Exhibit 2 and financial statement projections provided by Belk management.
Willamette Management Associates
EXHIBIT 8
BELK, INC.
INCOME APPROACH
DISCOUNTED CASH FLOW METHOD
BELK MANAGEMENT PROJECTED AND COMMON SIZE INCOME STATEMENTS
AS OF FEBRUARY 1, 2014
| | | | | | | | | | | | | | | | | | | | | | | | | | | | | | | | |
| | | LTM | | | | | | | | | | | | LTM | | | | | | | | | | |
| | | Ended | | | FY Ending on or Near January 31, | | | Ended | | | FY Ending on or Near January 31, | |
| | | 2/1/14 | | | 2015 | | | 2016 | | | 2017 | | | 2/1/14 | | | 2015 | | | 2016 | | | 2017 | |
| | | $000 | | | $000 | | | $000 | | | $000 | | | % | | | % | | | % | | | % | |
Revenue | | | 4,038,118 | | | | 4,135,123 | | | | 4,306,352 | | | | 4,532,038 | | | | 100.0 | | | | 100.0 | | | | 100.0 | | | | 100.0 | |
Year-Over-Year Change | | | 2.1 | % | | | 2.4 | % | | | 4.1 | % | | | 5.2 | % | | | | | | | | | | | | | | | | |
Direct Costs: | | | | | | | | | | | | | | | | | | | | | | | | | | | | | | | | |
Cost of Goods Sold | | | 2,722,766 | | | | 2,487,357 | | | | 2,581,742 | | | | 2,707,981 | | | | 67.4 | | | | 60.2 | | | | 60.0 | | | | 59.8 | |
| | | | | | | | | | | | | | | | | | | | | | | | | | | | | | | | |
Total Cost of Sales | | | 2,722,766 | | | | 2,487,357 | | | | 2,581,742 | | | | 2,707,981 | | | | 67.4 | | | | 60.2 | | | | 60.0 | | | | 59.8 | |
| | | | | | | | | | | | | | | | | | | | | | | | | | | | | | | | |
Gross Profit | | | 1,315,352 | | | | 1,647,766 | | | | 1,724,610 | | | | 1,824,057 | | | | 32.6 | | | | 39.8 | | | | 40.0 | | | | 40.2 | |
Year-Over-Year Change | | | -0.4 | % | | | 25.3 | % | | | 4.7 | % | | | 5.8 | % | | | | | | | | | | | | | | | | |
Operating Expenses: | | | | | | | | | | | | | | | | | | | | | | | | | | | | | | | | |
Selling, General, and Administrative | | | 886,197 | | | | 1,213,525 | | | | 1,246,856 | | | | 1,314,904 | | | | 21.9 | | | | 29.3 | | | | 29.0 | | | | 29.0 | |
Gain on Sale of Property and Equipment | | | (2,349 | ) | | | (3,245 | ) | | | (1,805 | ) | | | — | | | | (0.1 | ) | | | (0.1 | ) | | | (0.0 | ) | | | — | |
Asset Impairment and Store Closing Costs | | | 6,108 | | | | (484 | ) | | | — | | | | — | | | | 0.2 | | | | (0.0 | ) | | | — | | | | — | |
Depreciation and Amortization Expense | | | 137,069 | | | | 159,241 | | | | 175,254 | | | | 177,203 | | | | 3.4 | | | | 3.9 | | | | 4.1 | | | | 3.9 | |
| | | | | | | | | | | | | | | | | | | | | | | | | | | | | | | | |
Total Operating Expenses | | | 1,027,025 | | | | 1,369,037 | | | | 1,420,306 | | | | 1,492,108 | | | | 25.4 | | | | 33.1 | | | | 33.0 | | | | 32.9 | |
| | | | | | | | | | | | | | | | | | | | | | | | | | | | | | | | |
Income from Operations | | | 288,327 | | | | 278,729 | | | | 304,305 | | | | 331,949 | | | | 7.1 | | | | 6.7 | | | | 7.1 | | | | 7.3 | |
Other Income/(Expense): | | | | | | | | | | | | | | | | | | | | | | | | | | | | | | | | |
Interest Expense, Net | | | (44,450 | ) | | | (46,618 | ) | | | (48,396 | ) | | | (49,721 | ) | | | (1.1 | ) | | | (1.1 | ) | | | (1.1 | ) | | | (1.1 | ) |
| | | | | | | | | | | | | | | | | | | | | | | | | | | | | | | | |
Total Other Income/(Expense) | | | (44,450 | ) | | | (46,618 | ) | | | (48,396 | ) | | | (49,721 | ) | | | (1.1 | ) | | | (1.1 | ) | | | (1.1 | ) | | | (1.1 | ) |
| | | | | | | | | | | | | | | | | | | | | | | | | | | | | | | | |
Pretax Income | | | 243,877 | | | | 232,111 | | | | 255,909 | | | | 282,228 | | | | 6.0 | | | | 5.6 | | | | 5.9 | | | | 6.2 | |
Income Tax (Expense)/Benefit | | | (85,344 | ) | | | (80,346 | ) | | | (89,149 | ) | | | (99,487 | ) | | | (2.1 | ) | | | (1.9 | ) | | | (2.1 | ) | | | (2.2 | ) |
| | | | | | | | | | | | | | | | | | | | | | | | | | | | | | | | |
Income Tax Rate | | | -35.0 | % | | | -34.6 | % | | | -34.8 | % | | | -35.3 | % | | | | | | | | | | | | | | | | |
Net Income | | | 158,533 | | | | 151,766 | | | | 166,760 | | | | 182,742 | | | | 3.9 | | | | 3.7 | | | | 3.9 | | | | 4.0 | |
| | | | | | | | | | | | | | | | | | | | | | | | | | | | | | | | |
Year-Over-Year Change | | | -15.8 | % | | | -4.3 | % | | | 9.9 | % | | | 9.6 | % | | | | | | | | | | | | | | | | |
Pretax Income | | | 243,877 | | | | 232,111 | | | | 255,909 | | | | 282,228 | | | | 6.0 | | | | 5.6 | | | | 5.9 | | | | 6.2 | |
Plus: Interest Expense, Net | | | 44,450 | | | | 46,618 | | | | 48,396 | | | | 49,721 | | | | 1.1 | | | | 1.1 | | | | 1.1 | | | | 1.1 | |
Less: Gain on Sale of Property and Equipment | | | (2,349 | ) | | | (3,245 | ) | | | (1,805 | ) | | | — | | | | (0.1 | ) | | | (0.1 | ) | | | (0.0 | ) | | | — | |
Plus: Asset Impairment and Store Closing Costs | | | 6,108 | | | | (484 | ) | | | — | | | | — | | | | 0.2 | | | | (0.0 | ) | | | — | | | | — | |
| | | | | | | | | | | | | | | | | | | | | | | | | | | | | | | | |
Equals: Normalized Operating Income [EBIT] | | | 292,086 | | | | 275,000 | | | | 302,500 | | | | 331,949 | | | | 7.2 | | | | 6.7 | | | | 7.0 | | | | 7.3 | |
Plus: Depreciation and Amortization Expense | | | 137,069 | | | | 159,241 | | | | 175,254 | | | | 177,203 | | | | 3.4 | | | | 3.9 | | | | 4.1 | | | | 3.9 | |
| | | | | | | | | | | | | | | | | | | | | | | | | | | | | | | | |
EBITDA | | | 429,155 | | | | 434,241 | | | | 477,754 | | | | 509,153 | | | | 10.6 | | | | 10.5 | | | | 11.1 | | | | 11.2 | |
| | | | | | | | | | | | | | | | | | | | | | | | | | | | | | | | |
Year-Over-Year Change | | | -6.3 | % | | | 1.2 | % | | | 10.0 | % | | | 6.6 | % | | | | | | | | | | | | | | | | |
Supplemental Information: | | | | | | | | | | | | | | | | | | | | | | | | | | | | | | | | |
Comparable Store Sales Change (%) | | | 2.9 | % | | | 2.8 | % | | | 4.3 | % | | | 4.8 | % | | | | | | | | | | | | | | | | |
EPS ($) [Basic] | | $ | 3.82 | | | $ | 3.77 | | | $ | 4.39 | | | $ | 5.05 | | | | | | | | | | | | | | | | | |
Year-Over-Year Change | | | -12.0 | % | | | -1.2 | % | | | 16.4 | % | | | 15.2 | % | | | | | | | | | | | | | | | | |
LTM = Latest twelve months
EBIT = Earnings before interest and taxes
EBITDA = Earnings before interest, taxes, depreciation, and amortization
EPS = Earnings per share
Sources: Exhibit 3 and financial statement projections provided by Belk management.
Willamette Management Associates
EXHIBIT 9
BELK, INC.
INCOME APPROACH
DISCOUNTED CASH FLOW METHOD
YEAR-OVER-YEAR COMPARISON OF BELK MANAGEMENT PROJECTIONS
| | | | | | | | | | | | | | | | | | | | | | | | | | | | | | | | | | | | | | | | | | | | | | | | |
| | | | | | Fiscal Years Ended/Ending on or Near January 31, | | | | | | Average | |
| Financial | | Valuation | | | 2009 | | | 2010 | | | 2011 | | | 2012 | | | 2013 | | | 2014 | | | 2015 | | | 2016 | | | 2017 | | | CAGR [a] | | | Margins [a] | |
Fundamental | | Date | | | $000 | | | $000 | | | $000 | | | $000 | | | $000 | | | $000 | | | $000 | | | $000 | | | $000 | | | % | | | % | |
Revenue | | | Jan-09 | | | | 3,499,423 | | | | 3,173,000 | | | | 3,110,800 | | | | 3,208,600 | | | | | | | | | | | | | | | | | | | | | | | | -2.9 | | | | | |
| | | Jan-10 | | | | | | | | 3,346,252 | | | | 3,412,864 | | | | 3,465,903 | | | | 3,528,489 | | | | | | | | | | | | | | | | | | | | +1.8 | | | | | |
| | | Jan-11 | | | | | | | | | | | | 3,513,275 | | | | 3,606,700 | | | | 3,771,100 | | | | 3,853,500 | | | | | | | | | | | | | | | | +3.1 | | | | | |
| | | Jan-12 | | | | | | | | | | | | | | | | 3,699,592 | | | | 3,902,200 | | | | 4,021,100 | | | | 4,224,500 | | | | | | | | | | | | +4.5 | | | | | |
| | | Feb-13 | | | | | | | | | | | | | | | | | | | | 3,956,866 | | | | 4,167,100 | | | | 4,448,350 | | | | 4,760,700 | | | | | | | | +6.4 | | | | | |
| | | Feb-14 | | | | | | | | | | | | | | | | | | | | | | | | 4,038,118 | | | | 4,135,123 | | | | 4,306,352 | | | | 4,532,038 | | | | +3.9 | | | | | |
EBIT | | | Jan-09 | | | | 121,489 | | | | 100,000 | | | | 125,000 | | | | 156,300 | | | | | | | | | | | | | | | | | | | | | | | | +8.8 | | | | 4.0 | |
| | | Jan-10 | | | | | | | | 188,064 | | | | 230,400 | | | | 273,515 | | | | 324,602 | | | | | | | | | | | | | | | | | | | | +20.0 | | | | 7.9 | |
| | | Jan-11 | | | | | | | | | | | | 245,661 | | | | 291,000 | | | | 324,099 | | | | 315,400 | | | | | | | | | | | | | | | | +8.7 | | | | 8.3 | |
| | | Jan-12 | | | | | | | | | | | | | | | | 300,069 | | | | 330,000 | | | | 360,100 | | | | 399,300 | | | | | | | | | | | | +10.0 | | | | 9.0 | |
| | | Feb-13 | | | | | | | | | | | | | | | | | | | | 335,501 | | | | 348,200 | | | | 380,200 | | | | 420,300 | | | | | | | | +7.8 | | | | 8.6 | |
| | | Feb-14 | | | | | | | | | | | | | | | | | | | | | | | | 292,086 | | | | 275,000 | | | | 302,500 | | | | 331,949 | | | | +4.4 | | | | 7.0 | |
EBITDA | | | Jan-09 | | | | 286,756 | | | | 264,000 | | | | 277,600 | | | | 298,200 | | | | | | | | | | | | | | | | | | | | | | | | +1.3 | | | | 8.8 | |
| | | Jan-10 | | | | | | | | 346,452 | | | | 370,433 | | | | 397,495 | | | | 438,957 | | | | | | | | | | | | | | | | | | | | +8.2 | | | | 11.6 | |
| | | Jan-11 | | | | | | | | | | | | 385,900 | | | | 416,540 | | | | 452,605 | | | | 455,707 | | | | | | | | | | | | | | | | +5.7 | | | | 11.8 | |
| | | Jan-12 | | | | | | | | | | | | | | | | 422,830 | | | | 456,000 | | | | 497,100 | | | | 554,300 | | | | | | | | | | | | +9.4 | | | | 12.4 | |
| | | Feb-13 | | | | | | | | | | | | | | | | | | | | 458,123 | | | | 488,664 | | | | 539,549 | | | | 608,233 | | | | | | | | +9.9 | | | | 12.2 | |
| | | Feb-14 | | | | | | | | | | | | | | | | | | | | | | | | 429,155 | | | | 434,241 | | | | 477,754 | | | | 509,153 | | | | +5.9 | | | | 10.9 | |
CAGR = Compound annual growth rate
EBIT = Earnings before interest and taxes
EBITDA = Earnings before interest, taxes, depreciation, and amortization
Footnote:
Note: Actual results are highlighted.
Sources: Previous Belk management financial statement projections; Exhibits 3 and 10; and Willamette Management Associates calculations.
Willamette Management Associates
EXHIBIT 10
BELK, INC.
INCOME APPROACH
DISCOUNTED CASH FLOW METHOD
VALUE SUMMARY
AS OF FEBRUARY 1, 2014
| | | | | | | | | | | | | | | | | | | | |
| | | | | | FY Ending on or Near January 31, | | | Terminal | |
| | | | | | 2015 | | | 2016 | | | 2017 | | | Year | |
| | | | | | $000 | | | $000 | | | $000 | | | $000 | |
Present Value of Discrete Net Cash Flow | | | | | | | | | | | | | | | | | | | | |
Projected EBITDA | | | | 434,241 | | | | 477,754 | | | | 509,153 | | | | 509,153 | [a] |
Less: Depreciation and Amortization Expense | | | | (159,241 | ) | | | (175,254 | ) | | | (177,203 | ) | | | (180,000 | )[a] |
| | | | | | | | | | | | | | | | | | | | |
Equals: Projected EBIT | | | | 275,000 | | | | 302,500 | | | | 331,949 | | | | 329,153 | |
Less: Provision for Income Taxes | | | | (96,222 | ) | | | (105,845 | ) | | | (116,149 | ) | | | (115,171 | )[b] |
| | | | | | | | | | | | | | | | | | | | |
Equals: Debt-Free Net Income | | | | 178,777 | | | | 196,655 | | | | 215,800 | | | | 213,982 | |
Plus: Depreciation and Amortization Expense | | | | 159,241 | | | | 175,254 | | | | 177,203 | | | | 180,000 | [a] |
Less: Capital Expenditures | | | | (250,336 | ) | | | (232,865 | ) | | | (191,097 | ) | | | (180,000 | )[c] |
Less: Net Operating Working Capital Additions | | | | 98,695 | | | | (6,995 | ) | | | 13,428 | | | | (20,000 | )[d] |
| | | | | | | | | | | | | | | | | | | | |
Equals: Net Cash Flow to Invested Capital | | | | | | | 186,377 | | | | 132,049 | | | | 215,335 | | | | 193,982 | |
Multiplied by: Partial Period Adjustment | | | | 1.0000 | | | | 1.0000 | | | | 1.0000 | | | | 1.0000 | [e] |
| | | | | | | | | | | | | | | | | | | | |
Equals: Adjusted Net Cash Flow to Invested Capital | | | | | | | 186,377 | | | | 132,049 | | | | 215,335 | | | | 193,982 | |
Multiplied by: Present Value Factor | | | | 0.9428 | | | | 0.8381 | | | | 0.7449 | | | | | [f] |
| | | | | | | | | | | | | | | | | | | | |
Equals: Present Value of Discrete Cash Flow | | | | | | | 175,718 | | | | 110,664 | | | | 160,411 | | | | | |
| | | | | | | | | | | | | | | | | | | | |
Equals: Total Present Value of Discrete Net Cash Flow | | | 446,793 | | | | | | | | | | | | | | | | | |
| | | | | | | | | | | | | | | | | | | | |
Present Value of Terminal Net Cash Flow | | | | | | | | | | | | | | | | | | | | |
Terminal Year Net Cash Flow | | | 193,982 | | | | | | | | | | | | | | | | | |
Multiplied by: Anticipated Long-Term Growth Rate | | | 4 | %[g] | | | | | | | | | | | | | | | | |
Equals: Adjusted Terminal Year Net Cash Flow | | | 201,742 | | | | | | | | | | | | | | | | | |
Multiplied by: Direct Capitalization Multiple | | | 11.8 | [g] | | | | | | | | | | | | | | | | |
| | | | | | | | | | | | | | | | | | | | |
Equals: Terminal Value | | | 2,373,430 | | | | | | | | | | | | | | | | | |
Multiplied by: Present Value Factor | | | 0.7449 | | | | | | | | | | | | | | | | | |
| | | | | | | | | | | | | | | | | | | | |
Equals: Present Value of Terminal Net Cash Flow | | | 1,768,052 | | | | | | | | | | | | | | | | | |
| | | | | | | | | | | | | | | | | | | | |
Value Summary | | | | | | | | | | | | | | | | | | | | |
Total Present Value of Discrete Net Cash Flow | | | 446,793 | | | | | | | | | | | | | | | | | |
Plus: Present Value of Terminal Net Cash Flow | | | 1,768,052 | | | | | | | | | | | | | | | | | |
| | | | | | | | | | | | | | | | | | | | |
Indicated MVIC | | | 2,214,845 | | | | | | | | | | | | | | | | | |
Less: Net Interest-Bearing Debt [h] | | | (98,423 | ) | | | | | | | | | | | | | | | | |
| | | | | | | | | | | | | | | | | | | | |
Equals: Indicated Value of Equity [Rounded] [i] | | $ | 2,116,400 | | | | | | | | | | | | | | | | | |
| | | | | | | | | | | | | | | | | | | | |
FY = Fiscal year
EBIT = Earnings before interest and taxes
EBITDA = Earnings before interest, taxes, depreciation, and amortization
MVIC = Market value of invested capital
| [a] | As shown on Exhibit 8. |
| [b] | Based on a normalized corporate income tax rate of 35 percent. |
| [c] | Based on Belk management financial projections. |
| [d] | Calculated by Willamette Management Associates and based on Belk management financial statement projections, as shown on Exhibit 7, excluding (1) cash and cash equivalents and (2) interest-bearing debt. The terminal year estimate is based on a long-term growth horizon in net operating working capital additions. |
| [e] | Based on a valuation date of February 1, 2014. |
| [f] | Based on a mid-period discounting basis and a present value discount rate of 12.5 percent. |
| [g] | As shown on Exhibit 6 a. |
| [h] | As shown on Exhibit 4. |
| [i] | On a marketable, noncontrolling interest basis. |
Sources: As cited and Willamette Management Associates calculations.
Willamette Management Associates
EXHIBIT 11
BELK, INC.
MARKET APPROACH
GUIDELINE PUBLICLY TRADED COMPANY METHOD
VALUE SUMMARY
AS OF FEBRUARY 1, 2014
| | | | | | | | | | | | | | | | | | | | | | | | | | | | | | | | | | | | | | | | | | | | | | | | |
| | | | | | | | | | | | | | | | | | | | | | | | Selected | | | | | | Emphasis | | | Weighted | |
| | | | | | Selected Guideline Publicly Traded Company Pricing Multiples | | | Pricing | | | Indicated | | | Horizon | | | Multiple | | | Value | |
Value Measure | | Belk, Inc. | | | Low | | | High | | | 1st Qrt. | | | 3rd Qrt. | | | Mean | | | Median | | | Multiple | | | Value | | | % | | | % | | | $000 | |
MVIC / EBIT: | | | | | | | | | | | | | | | | | | | | | | | | | | | | | | | | | | | | | | | | | | | 40 | % | | | 1,051,552 | |
Projected Year 1 | | | 275,000 | | | | 7.6 | | | | 12.1 | | | | 8.3 | | | | 10.2 | | | | 9.3 | | | | 9.0 | | | | 9.0 | | | | 2,475,000 | | | | 25 | % | | | | | | | | |
Latest 12 Months | | | 292,086 | | | | 7.8 | | | | 12.7 | | | | 8.3 | | | | 10.2 | | | | 9.6 | | | | 9.7 | | | | 9.0 | | | | 2,628,774 | | | | 50 | % | | | | | | | | |
3-Year Average | | | 309,219 | | | | 7.7 | | | | 14.4 | | | | 9.2 | | | | 10.5 | | | | 10.2 | | | | 9.7 | | | | 9.0 | | | | 2,782,968 | | | | 25 | % | | | | | | | | |
MVIC / EBITDA: | | | | | | | | | | | | | | | | | | | | | | | | | | | | | | | | | | | | | | | | | | | 40 | % | | | 1,037,552 | |
Projected Year 1 | | | 434,241 | | | | 5.4 | | | | 7.1 | | | | 5.5 | | | | 6.6 | | | | 6.2 | | | | 6.4 | | | | 6.0 | | | | 2,605,444 | | | | 25 | % | | | | | | | | |
Latest 12 Months | | | 429,155 | | | | 5.6 | | | | 7.4 | | | | 5.6 | | | | 6.9 | | | | 6.4 | | | | 6.4 | | | | 6.0 | | | | 2,574,930 | | | | 50 | % | | | | | | | | |
3-Year Average | | | 436,703 | | | | 5.4 | | | | 7.7 | | | | 6.1 | | | | 7.0 | | | | 6.6 | | | | 6.8 | | | | 6.0 | | | | 2,620,216 | | | | 25 | % | | | | | | | | |
MVIC / Revenue: | | | | | | | | | | | | | | | | | | | | | | | | | | | | | | | | | | | | | | | | | | | 20 | % | | | 523,560 | |
Projected Year 1 | | | 4,135,123 | | | | 0.41 | | | | 1.02 | | | | 0.60 | | | | 0.91 | | | | 0.73 | | | | 0.74 | | | | 0.65 | | | | 2,687,830 | | | | 25 | % | | | | | | | | |
Latest 12 Months | | | 4,038,118 | | | | 0.41 | | | | 1.06 | | | | 0.62 | | | | 0.95 | | | | 0.76 | | | | 0.74 | | | | 0.65 | | | | 2,624,777 | | | | 50 | % | | | | | | | | |
3-Year Average | | | 3,898,192 | | | | 0.41 | | | | 1.12 | | | | 0.63 | | | | 0.98 | | | | 0.78 | | | | 0.75 | | | | 0.65 | | | | 2,533,825 | | | | 25 | % | | | | | | | | |
| | | | | | | | | | | | | | | | | | | | | | | | | | | Equals: Indicated MVIC [Rounded] | | | | | | | $ | 2,612,700 | |
| | | | | | | | | | | | | | | | | | | | | | | | | | | Less: Net Interest-Bearing Debt [a] | | | | | | | | (98,423 | ) |
| | | | | | | | | | | | | | | | | | | | | | | | | | | | | | | | | | | | | | | | | | | | | | | | |
| | | | | | | | | | | | | | | | | | | | | | | | | | | Equals: Indicated Value of Equity [Rounded] [b] | | | $ | 2,514,300 | |
| | | | | | | | | | | | | | | | | | | | | | | | | | | | | | | | | | | | | | | | | | | | | | | | |
MVIC = Market value of invested capital
EBIT = Earnings before interest and taxes
EBITDA = Earnings before interest, taxes, depreciation, and amortization
Footnotes:
| [a] | As presented in Exhibit 4. |
| [b] | On a marketable, noncontrolling interest basis. |
Sources: Exhibits 4 and 13 a-g; and Willamette Management Associates calculations.
Willamette Management Associates
EXHIBIT 12 a
BELK, INC.
MARKET APPROACH
GUIDELINE PUBLICLY TRADED COMPANY METHOD
COMPARISON OF OPERATING PERFORMANCE
AS OF FEBRUARY 1, 2014
| | | | |
Size ($000s) | |
(LTM Revenue) | |
Target Corp. | | | 73,807,000 | |
Macy’s, Inc. | | | 28,079,000 | |
Kohl’s Corp. | | | 19,274,000 | |
The Gap, Inc. | | | 16,298,000 | |
Nordstrom Inc. | | | 12,541,000 | |
Dillard’s Inc. | | | 6,767,158 | |
Belk, Inc. | | | 4,038,118 | |
Bon-Ton Stores Inc. | | | 2,933,600 | |
Stage Stores Inc. | | | 1,662,044 | |
|
LTM Profitability (%) | |
(EBIT to Revenue) | |
The Gap, Inc. | | | 13.7 | % |
Nordstrom Inc. | | | 10.7 | % |
Macy’s, Inc. | | | 9.7 | % |
Kohl’s Corp. | | | 9.4 | % |
Dillard’s Inc. | | | 8.5 | % |
Belk, Inc. | | | 7.2 | % |
Target Corp. | | | 6.7 | % |
Stage Stores Inc. | | | 4.2 | % |
Bon-Ton Stores Inc. | | | 3.2 | % |
|
Liquidity | |
(Current Ratio) | |
Belk, Inc. | | | 2.3 | |
Stage Stores Inc. | | | 2.3 | |
Bon-Ton Stores Inc. | | | 1.8 | |
Nordstrom Inc. | | | 1.7 | |
The Gap, Inc. | | | 1.7 | |
Kohl’s Corp. | | | 1.6 | |
Dillard’s Inc. | | | 1.6 | |
Macy’s, Inc. | | | 1.3 | |
Target Corp. | | | 0.9 | |
|
Activity | |
(Working Capital Turnover) | |
Target Corp. | | | 153.9 | |
Macy’s, Inc. | | | 10.9 | |
Dillard’s Inc. | | | 9.2 | |
The Gap, Inc. | | | 9.2 | |
Kohl’s Corp. | | | 8.5 | |
Bon-Ton Stores Inc. | | | 7.5 | |
Stage Stores Inc. | | | 5.5 | |
Belk, Inc. | | | 5.1 | |
Nordstrom Inc. | | | 4.9 | |
|
Growth (%) | |
(Historical 3-Year Revenue Growth) | |
Nordstrom Inc. | | | 5.3 | % |
The Gap, Inc. | | | 4.2 | % |
Stage Stores Inc. | | | 3.5 | % |
Belk, Inc. | | | 3.0 | % |
Macy’s, Inc. | | | 2.3 | % |
Dillard’s Inc. | | | 2.0 | % |
Target Corp. | | | 2.0 | % |
Kohl’s Corp. | | | 0.9 | % |
Bon-Ton Stores Inc. | | | -0.2 | % |
| | | | |
Size ($000s) | |
(LTM Total Assets) | |
Target Corp. | | | 46,373,000 | |
Macy’s, Inc. | | | 22,446,000 | |
Kohl’s Corp. | | | 15,245,000 | |
Nordstrom Inc. | | | 8,585,000 | |
The Gap, Inc. | | | 7,786,000 | |
Dillard’s Inc. | | | 4,459,915 | |
Belk, Inc. | | | 2,564,638 | |
Bon-Ton Stores Inc. | | | 1,808,501 | |
Stage Stores Inc. | | | 956,806 | |
|
LTM Profitability (%) | |
(EBITDA to Revenue) | |
The Gap, Inc. | | | 17.0 | % |
Nordstrom Inc. | | | 14.2 | % |
Kohl’s Corp. | | | 14.0 | % |
Macy’s, Inc. | | | 13.4 | % |
Dillard’s Inc. | | | 12.3 | % |
Belk, Inc. | | | 10.6 | % |
Target Corp. | | | 9.6 | % |
Stage Stores Inc. | | | 7.9 | % |
Bon-Ton Stores Inc. | | | 6.3 | % |
|
Leverage (%) | |
(Equity to Total Capital) | |
Belk, Inc. | | | 78 | % |
Stage Stores Inc. | | | 75 | % |
The Gap, Inc. | | | 70 | % |
Dillard’s Inc. | | | 65 | % |
Kohl’s Corp. | | | 55 | % |
Target Corp. | | | 52 | % |
Macy’s, Inc. | | | 43 | % |
Nordstrom Inc. | | | 39 | % |
Bon-Ton Stores Inc. | | | 5 | % |
|
Activity | |
(Days in Inventory - FIFO) | |
Bon-Ton Stores Inc. | | | 166.5 | |
Stage Stores Inc. | | | 148.3 | |
Macy’s, Inc. | | | 141.4 | |
Dillard’s Inc. | | | 134.6 | |
Belk, Inc. | | | 133.9 | |
Kohl’s Corp. | | | 129.3 | |
The Gap, Inc. | | | 78.6 | |
Nordstrom Inc. | | | 73.1 | |
Target Corp. | | | 63.9 | |
|
Growth (%) | |
(Projected 2-Year EBITDA Growth) | |
Nordstrom Inc. | | | 16.6 | % |
Stage Stores Inc. | | | 14.4 | % |
Belk, Inc. | | | 11.3 | % |
Macy’s, Inc. | | | 10.5 | % |
Target Corp. | | | 8.3 | % |
Bon-Ton Stores Inc. | | | 6.8 | % |
Dillard’s Inc. | | | 6.5 | % |
The Gap, Inc. | | | 6.0 | % |
Kohl’s Corp. | | | 4.0 | % |
LTM = Latest twelve months
EBIT = Earnings before interest and taxes
EBITDA = Earnings before interest, taxes, depreciation, and amortization
FIFO = First-in, first-out
Sources: Exhibits 2, 3, 4, and 13 a-g; and Willamette Management Associates calculations.
Willamette Management Associates
EXHIBIT 12 b
BELK, INC.
MARKET APPROACH
GUIDELINE PUBLICLY TRADED COMPANY METHOD
COMMON SIZE FINANCIAL STATEMENTS
| | | | | | | | | | | | | | | | | | | | | | | | | | | | | | | | | | | | | | | | |
| | | BONT | | | DDS | | | KSS | | | M | | | JWN | | | TGT | | | SSI | | | GPS | | | | | | Belk, Inc. | |
| | | 11/2/13 | | | 11/2/13 | | | 11/2/13 | | | 11/2/13 | | | 11/2/13 | | | 11/2/13 | | | 11/2/13 | | | 11/2/13 | | | Median | | | 2/1/14 | |
Last Twelve Months Ended: | | % | | | % | | | % | | | % | | | % | | | % | | | % | | | % | | | % | | | % | |
SIZE | | | | | | | | | | | | | | | | | | | | | | | | | | | | | | | | | | | | | | | | |
Assets ($ Mill) | | $ | 1,809 | | | $ | 4,460 | | | $ | 15,245 | | | $ | 22,446 | | | $ | 8,585 | | | $ | 46,373 | | | $ | 957 | | | $ | 7,786 | | | $ | 8,186 | | | $ | 2,565 | |
Revenues ($Mill) | | $ | 2,934 | | | $ | 6,767 | | | $ | 19,274 | | | $ | 28,079 | | | $ | 12,541 | | | $ | 73,807 | | | $ | 1,662 | | | $ | 16,298 | | | $ | 14,420 | | | $ | 4,038 | |
MVIC ($ Mill) | | $ | 1,204 | | | $ | 4,716 | | | $ | 15,127 | | | $ | 25,629 | | | $ | 13,279 | | | $ | 49,923 | | | $ | 731 | | | $ | 17,348 | | | $ | 14,203 | | | | NA | |
INCOME STATEMENTS | | | | | | | | | | | | | | | | | | | | | | | | | | | | | | | | | | | | | | | | |
Net Sales | | | 100.0 | | | | 100.0 | | | | 100.0 | | | | 100.0 | | | | 100.0 | | | | 100.0 | | | | 100.0 | | | | 100.0 | | | | 100.0 | | | | 100.0 | |
Cost of Goods Sold | | | 62.5 | | | | 62.6 | | | | 63.8 | | | | 59.9 | | | | 62.8 | | | | 70.7 | | | | 71.5 | | | | 60.3 | | | | 62.7 | | | | 67.4 | |
| | | | | | | | | | | | | | | | | | | | | | | | | | | | | | | | | | | | | | | | |
Gross Margin | | | 37.5 | | | | 37.4 | | | | 36.2 | | | | 40.1 | | | | 37.2 | | | | 29.3 | | | | 28.5 | | | | 39.7 | | | | 37.3 | | | | 32.6 | |
General & Administrative Expenses | | | 31.5 | | | | 24.8 | | | | 22.2 | | | | 27.3 | | | | 23.0 | | | | 20.3 | | | | 22.1 | | | | 22.8 | | | | 22.9 | | | | 22.0 | |
Depreciation Expense | | | 3.1 | | | | 3.8 | | | | 4.6 | | | | 3.7 | | | | 3.6 | | | | 3.0 | | | | 3.6 | | | | 3.3 | | | | 3.6 | | | | 3.4 | |
| | | | | | | | | | | | | | | | | | | | | | | | | | | | | | | | | | | | | | | | |
Operating Profit | | | 2.9 | | | | 8.7 | | | | 9.4 | | | | 9.2 | | | | 10.7 | | | | 6.1 | | | | 2.8 | | | | 13.7 | | | | 9.0 | | | | 7.1 | |
Interest Expense | | | 2.5 | | | | 0.9 | | | | 1.7 | | | | 1.4 | | | | 1.0 | | | | 1.0 | | | | 0.2 | | | | 0.3 | | | | 1.0 | | | | 1.1 | |
Other Income (Expenses), Net | | | 0.4 | | | | (0.3 | ) | | | — | | | | 0.5 | | | | — | | | | 0.6 | | | | 1.4 | | | | 0.0 | | | | 0.2 | | | | (2.2 | ) |
| | | | | | | | | | | | | | | | | | | | | | | | | | | | | | | | | | | | | | | | |
Pretax Income | | | 0.7 | | | | 7.6 | | | | 7.7 | | | | 8.3 | | | | 9.6 | | | | 5.7 | | | | 4.1 | | | | 13.4 | | | | 7.6 | | | | 6.0 | |
Income Taxes | | | (0.2 | ) | | | (2.7 | ) | | | (2.7 | ) | | | (2.9 | ) | | | (3.4 | ) | | | (2.0 | ) | | | (1.4 | ) | | | (4.7 | ) | | | (2.7 | ) | | | (2.1 | ) |
| | | | | | | | | | | | | | | | | | | | | | | | | | | | | | | | | | | | | | | | |
NET INCOME | | | 0.5 | | | | 4.9 | | | | 5.0 | | | | 5.4 | | | | 6.3 | | | | 3.7 | | | | 2.6 | | | | 8.7 | | | | 5.0 | | | | 3.9 | |
| | | | | | | | | | | | | | | | | | | | | | | | | | | | | | | | | | | | | | | | |
BALANCE SHEET | | | | | | | | | | | | | | | | | | | | | | | | | | | | | | | | | | | | | | | | |
ASSETS | | | | | | | | | | | | | | | | | | | | | | | | | | | | | | | | | | | | | | | | |
Cash & Equivalents | | | 0.4 | | | | 2.5 | | | | 3.9 | | | | 5.2 | | | | 11.0 | | | | 1.5 | | | | 2.5 | | | | 12.8 | | | | 3.2 | | | | 11.5 | |
Accounts Receivable | | | — | | | | 0.7 | | | | — | | | | 1.2 | | | | 24.0 | | | | — | | | | — | | | | — | | | | — | | | | 2.2 | |
Inventory | | | 50.6 | | | | 41.0 | | | | 32.5 | | | | 34.4 | | | | 20.9 | | | | 22.4 | | | | 57.6 | | | | 31.7 | | | | 33.5 | | | | 38.5 | |
Other Current Assets | | | 5.0 | | | | 1.5 | | | | 2.8 | | | | 1.8 | | | | 5.2 | | | | 4.5 | | | | 4.8 | | | | 11.9 | | | | 4.6 | | | | 1.1 | |
| | | | | | | | | | | | | | | | | | | | | | | | | | | | | | | | | | | | | | | | |
Total Current Assets | | | 56.1 | | | | 45.7 | | | | 39.3 | | | | 42.6 | | | | 61.2 | | | | 28.4 | | | | 64.9 | | | | 56.4 | | | | 50.9 | | | | 53.3 | |
Fixed Assets (at Cost) | | | 83.9 | | | | 101.3 | | | | — | | | | 64.6 | | | | 84.2 | | | | 98.4 | | | | — | | | | 104.8 | | | | 84.0 | | | | 103.1 | |
Acc. Depreciation | | | (47.9 | ) | | | (52.8 | ) | | | — | | | | (29.2 | ) | | | (50.6 | ) | | | (30.0 | ) | | | — | | | | (70.0 | ) | | | (39.0 | ) | | | (58.0 | ) |
| | | | | | | | | | | | | | | | | | | | | | | | | | | | | | | | | | | | | | | | |
Net Fixed Assets | | | 35.9 | | | | 48.5 | | | | 58.5 | | | | 35.4 | | | | 33.5 | | | | 68.4 | | | | 30.7 | | | | 34.9 | | | | 35.7 | | | | 45.2 | |
Intangible Assets | | | 5.8 | | | | — | | | | — | | | | 19.1 | | | | 2.0 | | | | — | | | | 1.6 | | | | 3.5 | | | | 1.8 | | | | — | |
Other Assets | | | 2.2 | | | | 5.8 | | | | 2.2 | | | | 2.9 | | | | 3.2 | | | | 3.2 | | | | 2.8 | | | | 5.2 | | | | 3.1 | | | | 1.5 | |
| | | | | | | | | | | | | | | | | | | | | | | | | | | | | | | | | | | | | | | | |
TOTAL ASSETS | | | 100.0 | | | | 100.0 | | | | 100.0 | | | | 100.0 | | | | 100.0 | | | | 100.0 | | | | 100.0 | | | | 100.0 | | | | 100.0 | | | | 100.0 | |
| | | | | | | | | | | | | | | | | | | | | | | | | | | | | | | | | | | | | | | | |
LIABILITIES & EQUITY | | | | | | | | | | | | | | | | | | | | | | | | | | | | | | | | | | | | | | | | |
Accounts Payable | | | 19.4 | | | | 23.2 | | | | 14.8 | | | | 27.7 | | | | 16.9 | | | | 19.0 | | | | 21.8 | | | | 19.4 | | | | 19.4 | | | | 11.4 | |
Accrued Expenses | | | 10.3 | | | | — | | | | 7.9 | | | | — | | | | 4.2 | | | | 7.8 | | | | 6.5 | | | | 13.5 | | | | 7.2 | | | | 9.3 | |
Current Portion LTD | | | 0.4 | | | | — | | | | — | | | | 2.1 | | | | 4.7 | | | | 4.6 | | | | — | | | | — | | | | 0.2 | | | | 0.3 | |
Other Interest Bearing Debt | | | 0.2 | | | | 3.8 | | | | 0.9 | | | | — | | | | — | | | | — | | | | — | | | | — | | | | — | | | | — | |
Other Current Liabilities | | | 1.3 | | | | 2.1 | | | | 0.3 | | | | 2.2 | | | | 9.6 | | | | — | | | | 0.1 | | | | 0.8 | | | | 1.0 | | | | 1.8 | |
| | | | | | | | | | | | | | | | | | | | | | | | | | | | | | | | | | | | | | | | |
Total Current Liabilities | | | 31.6 | | | | 29.1 | | | | 23.9 | | | | 32.0 | | | | 35.3 | | | | 31.4 | | | | 28.4 | | | | 33.8 | | | | 31.5 | | | | 22.9 | |
Long-Term Debt | | | 54.3 | | | | 18.4 | | | | 31.1 | | | | 30.0 | | | | 31.6 | | | | 27.4 | | | | 14.9 | | | | 16.0 | | | | 28.7 | | | | 15.0 | |
Deferred Income Tax | | | — | | | | 5.3 | | | | 2.6 | | | | 5.5 | | | | — | | | | 3.2 | | | | — | | | | — | | | | 1.3 | | | | — | |
Other Liabilities | | | 11.4 | | | | 5.2 | | | | 3.6 | | | | 8.3 | | | | 9.9 | | | | 3.2 | | | | 11.7 | | | | 12.2 | | | | 9.1 | | | | 9.1 | |
| | | | | | | | | | | | | | | | | | | | | | | | | | | | | | | | | | | | | | | | |
Total Liabilities | | | 97.3 | | | | 58.0 | | | | 61.1 | | | | 75.8 | | | | 76.8 | | | | 65.2 | | | | 55.0 | | | | 62.0 | | | | 63.6 | | | | 47.0 | |
| | | | | | | | | | | | | | | | | | | | | | | | | | | | | | | | | | | | | | | | |
Stockholders’ Equity | | | 2.7 | | | | 42.0 | | | | 38.9 | | | | 24.2 | | | | 23.2 | | | | 34.8 | | | | 45.0 | | | | 38.0 | | | | 36.4 | | | | 53.0 | |
| | | | | | | | | | | | | | | | | | | | | | | | | | | | | | | | | | | | | | | | |
TOTAL LIABILITIES & EQUITY | | | 100.0 | | | | 100.0 | | | | 100.0 | | | | 100.0 | | | | 100.0 | | | | 100.0 | | | | 100.0 | | | | 100.0 | | | | 100.0 | | | | 100.0 | |
| | | | | | | | | | | | | | | | | | | | | | | | | | | | | | | | | | | | | | | | |
MVIC = Market value of invested capital
NA = Not applicable
LTD = Long-term debt
Sources: Exhibits 2 and 3; S&P Capital IQ; and Willamette Management Associates calculations.
Willamette Management Associates
EXHIBIT 12 c
BELK, INC.
MARKET APPROACH
GUIDELINE PUBLICLY TRADED COMPANY METHOD
FINANCIAL AND OPERATING RATIOS
| | | | | | | | | | | | | | | | | | | | | | | | | | | | | | | | | | | | | | | | |
| | | BONT | | | DDS | | | KSS | | | M | | | JWN | | | TGT | | | SSI | | | GPS | | | Median | | | Belk, Inc. | |
Last Twelve Months Ended: | | 11/2/13 | | | 11/2/13 | | | 11/2/13 | | | 11/2/13 | | | 11/2/13 | | | 11/2/13 | | | 11/2/13 | | | 11/2/13 | | | | | | 2/1/14 | |
LIQUIDITY RATIOS | | | | | | | | | | | | | | | | | | | | | | | | | | | | | | | | | | | | | | | | |
Current Ratio | | | 1.8 | | | | 1.6 | | | | 1.6 | | | | 1.3 | | | | 1.7 | | | | 0.9 | | | | 2.3 | | | | 1.7 | | | | 1.7 | | | | 2.3 | |
Quick Ratio | | | 0.0 | | | | 0.1 | | | | 0.2 | | | | 0.2 | | | | 1.0 | | | | 0.0 | | | | 0.1 | | | | 0.4 | | | | 0.1 | | | | 0.6 | |
Working Capital ($Millions) | | | 441.6 | | | | 739.1 | | | | 2,346.0 | | | | 2,374.0 | | | | 2,219.0 | | | | (1,398.0 | ) | | | 348.9 | | | | 1,759.0 | | | | 1,249.0 | | | | 780.7 | |
ACTIVITY RATIOS | | | | | | | | | | | | | | | | | | | | | | | | | | | | | | | | | | | | | | | | |
Cost of Sales/Inventory (FIFO) | | | 2.2 | | | | 2.7 | | | | 2.8 | | | | 2.6 | | | | 5.0 | | | | 5.7 | | | | 2.5 | | | | 4.6 | | | | 2.8 | | | | 2.7 | |
Days in Inventory | | | 167 | | | | 135 | | | | 129 | | | | 141 | | | | 73 | | | | 64 | | | | 148 | | | | 79 | | | | 131.9 | | | | 134 | |
Working Capital Turnover | | | 7.5 | | | | 9.2 | | | | 8.5 | | | | 10.9 | | | | 4.9 | | | | 153.9 | | | | 5.5 | | | | 9.2 | | | | 8.8 | | | | 5.1 | |
Fixed Asset Turnover | | | 4.5 | | | | 3.0 | | | | 2.2 | | | | 3.5 | | | | 4.6 | | | | 2.4 | | | | 5.7 | | | | 6.1 | | | | 4.0 | | | | 3.6 | |
Asset Turnover | | | 1.7 | | | | 1.6 | | | | 1.3 | | | | 1.3 | | | | 1.5 | | | | 1.6 | | | | 1.9 | | | | 2.1 | | | | 1.6 | | | | 1.6 | |
COVERAGE/LEVERAGE RATIOS | | | | | | | | | | | | | | | | | | | | | | | | | | | | | | | | | | | | | | | | |
Interest Expense Coverage [a]: | | | | | | | | | | | | | | | | | | | | | | | | | | | | | | | | | | | | | | | | |
EBIT | | | 1.3 | | | | 9.3 | | | | 5.4 | | | | 7.0 | | | | 10.4 | | | | 6.8 | | | | 26.3 | | | | 39.9 | | | | 8.1 | | | | 4.7 | |
EBITDA | | | 2.5 | | | | 13.4 | | | | 8.0 | | | | 9.6 | | | | 13.9 | | | | 9.8 | | | | 48.9 | | | | 49.5 | | | | 11.6 | | | | 7.7 | |
Fixed Assets/Equity (%) | | | 1,329.9 | | | | 115.6 | | | | 150.7 | | | | 146.1 | | | | 144.9 | | | | 196.4 | | | | 68.3 | | | | 91.8 | | | | 145.5 | | | | 85.3 | |
Equity/Total Capital (%) | | | 4.7 | | | | 65.4 | | | | 54.8 | | | | 43.1 | | | | 38.9 | | | | 52.1 | | | | 75.1 | | | | 70.3 | | | | 53.5 | | | | 77.5 | |
PROFITABILITY RATIOS (%) [a] | | | | | | | | | | | | | | | | | | | | | | | | | | | | | | | | | | | | | | | | |
Pretax Income/Average Equity | | | 26.1 | | | | 26.7 | | | | 24.8 | | | | 40.6 | | | | 61.9 | | | | 25.6 | | | | 15.1 | | | | 74.6 | | | | 26.4 | | | | 18.6 | |
Pretax Income/Average Assets | | | 1.2 | | | | 12.1 | | | | 10.2 | | | | 10.7 | | | | 14.5 | | | | 8.9 | | | | 7.7 | | | | 28.6 | | | | 10.5 | | | | 9.7 | |
Pretax Income/Sales | | | 0.7 | | | | 7.6 | | | | 7.7 | | | | 8.3 | | | | 9.6 | | | | 5.7 | | | | 4.1 | | | | 13.4 | | | | 7.6 | | | | 6.0 | |
Net Income/Average Equity | | | 17.0 | | | | 17.3 | | | | 16.1 | | | | 26.4 | | | | 40.3 | | | | 16.6 | | | | 9.8 | | | | 48.5 | | | | 17.2 | | | | 12.1 | |
Net Income/Average Assets | | | 0.8 | | | | 7.8 | | | | 6.6 | | | | 7.0 | | | | 9.4 | | | | 5.8 | | | | 5.0 | | | | 18.6 | | | | 6.8 | | | | 6.3 | |
Net Income/Sales | | | 0.5 | | | | 4.9 | | | | 5.0 | | | | 5.4 | | | | 6.3 | | | | 3.7 | | | | 2.6 | | | | 8.7 | | | | 5.0 | | | | 3.9 | |
Cash Flow/Average Equity | | | 131.1 | | | | 30.9 | | | | 30.8 | | | | 44.3 | | | | 63.2 | | | | 30.0 | | | | 23.3 | | | | 66.8 | | | | 37.6 | | | | 22.6 | |
Cash Flow/Average Assets | | | 6.1 | | | | 13.9 | | | | 12.6 | | | | 11.7 | | | | 14.8 | | | | 10.4 | | | | 11.9 | | | | 25.6 | | | | 12.3 | | | | 11.7 | |
Cash Flow/Sales | | | 3.6 | | | | 8.8 | | | | 9.6 | | | | 9.1 | | | | 9.8 | | | | 6.7 | | | | 6.3 | | | | 12.0 | | | | 8.9 | | | | 7.3 | |
EBIT/Avg Invested Capital | | | 9.3 | | | | 20.3 | | | | 17.0 | | | | 21.3 | | | | 26.3 | | | | 15.1 | | | | 13.4 | | | | 53.6 | | | | 18.7 | | | | 16.9 | |
EBITDA/Avg Invested Capital | | | 18.1 | | | | 29.5 | | | | 25.2 | | | | 29.3 | | | | 35.1 | | | | 21.8 | | | | 24.9 | | | | 66.5 | | | | 27.3 | | | | 24.9 | |
Cash Flow = Net income plus depreciation and amortization expense
EBIT = Earnings before interest and taxes
EBITDA = Earnings before interest, taxes, depreciation, and amortization
FIFO = First-in, first-out
Total Capital = Equity plus interest-bearing debt
Footnote:
| [a] | Coverage and profitability ratios are based on pretax and after-tax income normalized for nonrecurring items. |
Sources: Exhibits 2, 3, and 4; S&P Capital IQ; and Willamette Management Associates calculations.
Willamette Management Associates
EXHIBIT 13 a
BELK, INC.
MARKET APPROACH
GUIDELINE PUBLICLY TRADED COMPANY METHOD
INVESTED CAPITAL MULTIPLES
MARKET VALUE OF INVESTED CAPITAL
AS OF FEBRUARY 1, 2014
| | | | | | | | | | | | | | | | | | | | | | | | | | | | | | | | | | | | | | | | | | | | | | | | | | | | | | | | | | | | | | | | |
| | | | | | | | | | | | | Latest Quarter | | | Bid/ Close
Price Per | | | Bid/ Close Price Per | | | | | | | | | | | | | | | | | | | |
Company Name | | Ticker
Symbol | | Stock
Exchange | | FYE | | | As of
or for
Period
Ending | | | Tangible
Book
Value
$000 | | | BV IBD
$000 | | | TBVIC
$000 | | | MV IBD [a]
$000 | | | Cash and
Equivalents
$000 | | | Common
Share
2/2/13
$ | | | Common
Share
2/1/14
$ | | | Annual
Change in
Price
% | | | Common
Shares
Outstg. [b]
000s | | | MV
Common
Equity
$000 | | | MV
Preferred
Equity
$000 | | | Minority
Interest
$000 | | | MVIC
$000 | |
Bon-Ton Stores Inc. | | BONT | | NasdaqGS | | | 2/13 | | | | 11/13 | | | | (56,058 | ) | | | 992,510 | | | | 936,452 | | | | 992,510 | | | | 8,082 | | | | 13.10 | | | | 10.75 | | | | -17.9 | % | | | 20,471 | | | | 220,065 | | | | — | | | | — | | | | 1,204,493 | |
Dillard’s Inc. | | DDS | | NYSE | | | 2/13 | | | | 11/13 | | | | 1,872,570 | | | | 992,512 | | | | 2,865,082 | | | | 992,512 | | | | 110,972 | | | | 85.41 | | | | 87.30 | | | | 2.2 | % | | | 43,926 | | | | 3,834,750 | | | | — | | | | — | | | | 4,716,290 | |
Kohl’s Corp. | | KSS | | NYSE | | | 2/13 | | | | 11/13 | | | | 5,924,000 | | | | 4,883,000 | | | | 10,807,000 | | | | 4,883,000 | | | | 598,000 | | | | 46.01 | | | | 50.63 | | | | 10.0 | % | | | 214,140 | | | | 10,841,908 | | | | — | | | | — | | | | 15,126,908 | |
Macy’s, Inc. | | M | | NYSE | | | 2/13 | | | | 11/13 | | | | 1,164,000 | | | | 7,197,000 | | | | 8,361,000 | | | | 7,197,000 | | | | 1,171,000 | | | | 39.51 | | | | 53.20 | | | | 34.6 | % | | | 368,482 | | | | 19,603,242 | | | | — | | | | — | | | | 25,629,242 | |
Nordstrom Inc. | | JWN | | NYSE | | | 2/13 | | | | 11/13 | | | | 1,813,000 | | | | 3,118,000 | | | | 4,931,000 | | | | 3,118,000 | | | | 947,000 | | | | 55.12 | | | | 57.45 | | | | 4.2 | % | | | 193,357 | | | | 11,108,360 | | | | — | | | | — | | | | 13,279,360 | |
Target Corp. | | TGT | | NYSE | | | 2/13 | | | | 11/13 | | | | 16,156,000 | | | | 14,830,000 | | | | 30,986,000 | | | | 14,830,000 | | | | 708,000 | | | | 61.15 | | | | 56.64 | | | | -7.4 | % | | | 632,088 | | | | 35,801,464 | | | | — | | | | — | | | | 49,923,464 | |
Stage Stores Inc. | | SSI | | NYSE | | | 2/13 | | | | 11/13 | | | | 415,630 | | | | 142,548 | | | | 558,178 | | | | 142,548 | | | | 23,717 | | | | 22.96 | | | | 19.60 | | | | -14.6 | % | | | 31,213 | | | | 611,776 | | | | — | | | | — | | | | 730,607 | |
The Gap, Inc. | | GPS | | NYSE | | | 2/13 | | | | 11/13 | | | | 2,680,000 | | | | 1,247,000 | | | | 3,927,000 | | | | 1,247,000 | | | | 996,000 | | | | 32.97 | | | | 38.08 | | | | 15.5 | % | | | 448,975 | | | | 17,096,960 | | | | — | | | | — | | | | 17,347,960 | |
| | BLKI.A | | | | | | | | | | | | | | | | | | | | | | | | | | | | | | | | | | | | | | | | | | | | | | | | | | | | | | | | | | | | | | |
Belk, Inc. | | BLKI.B | | OTC | | | 2/13 | | | | 2/14 | | | | 1,358,245 | | | | 393,757 | | | | 1,752,002 | | | | 393,757 | | | | 295,334 | | | | NA | | | | NA | | | | NA | | | | 40,991 | | | | NA | | | | NA | | | | NA | | | | NA | |
Definitions, sources, and footnotes are found on Exhibit 13 g.
Willamette Management Associates
EXHIBIT 13 b
BELK, INC.
MARKET APPROACH
GUIDELINE PUBLICLY TRADED COMPANY METHOD
INVESTED CAPITAL MULTIPLES
EARNINGS BEFORE INTEREST AND TAXES
AS OF FEBRUARY 1, 2014
| | | | | | | | | | | | | | | | | | | | | | | | | | | | | | | | | | | | | | | | | | | | | | | | | | | | | | | | | | | | |
| | | EBIT Growth Rate | | | EBIT | | | 3-Yr
Avg. [c] | | | 3-Yr Avg.
Annual
Compound | | | | | | MVIC/EBIT
Pricing Multiples | |
Company Name | | Proj Yr2
% | | | Proj Yr1
% | | | LTM
% | | | Proj. Yr2
$000 | | | Proj. Yr1
$000 | | | LTM
$000 | | | 2013/12
$000 | | | 2012/11
$000 | | | 2011/10
$000 | | | EBIT
$000 | | | Growth [d]
% | | | MVIC
$000 | | | Proj.
Year 1 | | | LTM | | | 3-Yr
Avg. | |
Bon-Ton Stores Inc. | | | 10.4 | | | | 4.3 | | | | 13.8 | | | | 109,550 | | | | 99,200 | | | | 95,122 | | | | 83,617 | | | | 71,956 | | | | 138,006 | | | | 83,565 | | | | 10.7 | | | | 1,204,493 | | | | 12.1 | | | | 12.7 | | | | 14.4 | |
Dillard’s Inc. | | | 4.6 | | | | 5.8 | | | | 7.2 | | | | 636,100 | | | | 608,100 | | | | 574,829 | | | | 536,072 | | | | 423,081 | | | | 331,669 | | | | 511,327 | | | | 11.8 | | | | 4,716,290 | | | | 7.8 | | | | 8.2 | | | | 9.2 | |
Kohl’s Corp. | | | 2.1 | | | | (2.2 | ) | | | (3.7 | ) | | | 1,818,200 | | | | 1,780,450 | | | | 1,820,000 | | | | 1,890,000 | | | | 2,158,000 | | | | 2,092,000 | | | | 1,956,000 | | | | (6.0 | ) | | | 15,126,908 | | | | 8.5 | | | | 8.3 | | | | 7.7 | |
Macy’s, Inc. | | | 5.7 | | | | 6.9 | | | | 2.2 | | | | 3,078,080 | | | | 2,912,540 | | | | 2,725,000 | | | | 2,666,000 | | | | 2,386,000 | | | | 1,919,000 | | | | 2,592,333 | | | | 5.0 | | | | 25,629,242 | | | | 8.8 | | | | 9.4 | | | | 9.9 | |
Nordstrom Inc. | | | 9.0 | | | | 8.1 | | | | 1.3 | | | | 1,574,230 | | | | 1,444,530 | | | | 1,336,000 | | | | 1,319,000 | | | | 1,261,000 | | | | 1,097,000 | | | | 1,305,333 | | | | 2.1 | | | | 13,279,360 | | | | 9.2 | | | | 9.9 | | | | 10.2 | |
Target Corp. | | | 12.3 | | | | (3.2 | ) | | | (8.6 | ) | | | 5,336,680 | | | | 4,754,000 | | | | 4,911,000 | | | | 5,371,000 | | | | 5,322,000 | | | | 5,252,000 | | | | 5,201,333 | | | | (2.9 | ) | | | 49,923,464 | | | | 10.5 | | | | 10.2 | | | | 9.6 | |
Stage Stores Inc. | | | 17.7 | | | | 2.6 | | | | 0.4 | | | | 85,010 | | | | 72,200 | | | | 70,371 | | | | 70,091 | | | | 49,896 | | | | 66,067 | | | | 63,453 | | | | 13.3 | | | | 730,607 | | | | 10.1 | | | | 10.4 | | | | 11.5 | |
The Gap, Inc. | | | 6.5 | | | | 1.7 | | | | 14.7 | | | | 2,423,730 | | | | 2,276,000 | | | | 2,237,000 | | | | 1,950,000 | | | | 1,454,000 | | | | 1,984,000 | | | | 1,880,333 | | | | 17.0 | | | | 17,347,960 | | | | 7.6 | | | | 7.8 | | | | 9.2 | |
| | | | | | | | | | | | | | | | | | | | | | | | | | | | | | | | | | | | | | | | | | | | | | | | | | | | | | | | | | | | |
HIGH | | | 17.7 | | | | 8.1 | | | | 14.7 | | | | | | | | | | | | | | | | | | | | | | | | | | | | | | | | 17.0 | | | | | | | | 12.1 | | | | 12.7 | | | | 14.4 | |
LOW | | | 2.1 | | | | (3.2 | ) | | | (8.6 | ) | | | | | | | | | | | | | | | | | | | | | | | | | | | | | | | (6.0 | ) | | | | | | | 7.6 | | | | 7.8 | | | | 7.7 | |
FIRST QUARTILE | | | 5.4 | | | | 0.8 | | | | (0.6 | ) | | | | | | | | | | | | | | | | | | | | | | | | | | | | | | | 0.9 | | | | | | | | 8.3 | | | | 8.3 | | | | 9.2 | |
THIRD QUARTILE | | | 10.9 | | | | 6.1 | | | | 8.9 | | | | | | | | | | | | | | | | | | | | | | | | | | | | | | | | 12.2 | | | | | | | | 10.2 | | | | 10.2 | | | | 10.5 | |
MEAN | | | 8.5 | | | | 3.0 | | | | 3.4 | | | | | | | | | | | | | | | | | | | | | | | | | | | | | | | | 6.4 | | | | | | | | 9.3 | | | | 9.6 | | | | 10.2 | |
MEDIAN | | | 7.7 | | | | 3.4 | | | | 1.8 | | | | | | | | | | | | | | | | | | | | | | | | | | | | | | | | 7.8 | | | | | | | | 9.0 | | | | 9.7 | | | | 9.7 | |
STD. DEV. | | | 4.9 | | | | 4.1 | | | | 8.1 | | | | | | | | | | | | | | | | | | | | | | | | | | | | | | | | 8.2 | | | | | | | | 1.5 | | | | 1.6 | | | | 2.0 | |
COEFF. VAR. (%) | | | 57.9 | | | | 136.4 | | | | 236.8 | | | | | | | | | | | | | | | | | | | | | | | | | | | | | | | | 128.3 | | | | | | | | 16.4 | | | | 16.5 | | | | 19.5 | |
| | | | | | | | | | | | | | | |
Belk, Inc. | | | 10.0 | | | | (5.8 | ) | | | (12.9 | ) | | | 302,500 | | | | 275,000 | | | | 292,086 | | | | 335,501 | | | | 300,069 | | | | 245,661 | | | | 309,219 | | | | (0.9 | ) | | | NA | | | | NA | | | | NA | | | | NA | |
Definitions, sources, and footnotes are found on Exhibit 13 g.
Willamette Management Associates
EXHIBIT 13 c
BELK, INC.
MARKET APPROACH
GUIDELINE PUBLICLY TRADED COMPANY METHOD
INVESTED CAPITAL MULTIPLES
EARNINGS BEFORE INTEREST, TAXES, DEPRECIATION AND AMORTIZATION
AS OF FEBRUARY 1, 2014
| | | | | | | | | | | | | | | | | | | | | | | | | | | | | | | | | | | | | | | | | | | | | | | | | | | | | | | | | | | | |
| | | EBITDA Growth Rate | | | EBITDA | | | 3-Yr Avg. [c] | | | 3-Yr Avg.
Annual
Compound | | | | | | MVIC/EBITDA
Pricing Multiples | |
Company Name | | Proj Yr2
% | | | Proj Yr1
% | | | LTM
% | | | Proj. Yr2
$000 | | | Proj. Yr1
$000 | | | LTM
$000 | | | 2013/12
$000 | | | 2012/11
$000 | | | 2011/10
$000 | | | EBITDA
$000 | | | Growth [d]
% | | | MVIC
$000 | | | Proj.
Year 1 | | | LTM | | | 3-Yr
Avg. | |
Bon-Ton Stores Inc. | | | 6.6 | | | | 0.2 | | | | 5.4 | | | | 198,850 | | | | 186,500 | | | | 186,108 | | | | 176,589 | | | | 171,736 | | | | 244,763 | | | | 178,144 | | | | 3.0 | | | | 1,204,493 | | | | 6.5 | | | | 6.5 | | | | 6.8 | |
Dillard’s Inc. | | | 1.8 | | | | 4.6 | | | | 4.9 | | | | 889,000 | | | | 873,300 | | | | 834,825 | | | | 795,799 | | | | 680,816 | | | | 593,350 | | | | 770,480 | | | | 7.7 | | | | 4,716,290 | | | | 5.4 | | | | 5.6 | | | | 6.1 | |
Kohl’s Corp. | | | 2.5 | | | | 1.4 | | | | (0.9 | ) | | | 2,805,700 | | | | 2,736,200 | | | | 2,698,000 | | | | 2,723,000 | | | | 2,936,000 | | | | 2,842,000 | | | | 2,785,667 | | | | (3.0 | ) | | | 15,126,908 | | | | 5.5 | | | | 5.6 | | | | 5.4 | |
Macy’s, Inc. | | | 4.9 | | | | 5.4 | | | | 1.0 | | | | 4,148,900 | | | | 3,955,000 | | | | 3,753,000 | | | | 3,715,000 | | | | 3,471,000 | | | | 3,069,000 | | | | 3,646,333 | | | | 2.9 | | | | 25,629,242 | | | | 6.5 | | | | 6.8 | | | | 7.0 | |
Nordstrom Inc. | | | 9.0 | | | | 7.0 | | | | 2.0 | | | | 2,079,390 | | | | 1,907,360 | | | | 1,783,000 | | | | 1,748,000 | | | | 1,632,000 | | | | 1,424,000 | | | | 1,721,000 | | | | 3.3 | | | | 13,279,360 | | | | 7.0 | | | | 7.4 | | | | 7.7 | |
Target Corp. | | | 9.3 | | | | (0.9 | ) | | | (5.5 | ) | | | 7,687,680 | | | | 7,035,000 | | | | 7,098,000 | | | | 7,513,000 | | | | 7,453,000 | | | | 7,336,000 | | | | 7,354,667 | | | | (1.8 | ) | | | 49,923,464 | | | | 7.1 | | | | 7.0 | | | | 6.8 | |
Stage Stores Inc. | | | 11.1 | | | | 3.0 | | | | 1.0 | | | | 149,600 | | | | 134,700 | | | | 130,755 | | | | 129,517 | | | | 111,076 | | | | 124,384 | | | | 123,783 | | | | 6.1 | | | | 730,607 | | | | 5.4 | | | | 5.6 | | | | 5.9 | |
The Gap, Inc. | | | 6.4 | | | | (0.4 | ) | | | 10.5 | | | | 2,938,990 | | | | 2,762,790 | | | | 2,773,000 | | | | 2,509,000 | | | | 2,046,000 | | | | 2,632,000 | | | | 2,442,667 | | | | 11.7 | | | | 17,347,960 | | | | 6.3 | | | | 6.3 | | | | 7.1 | |
| | | | | | | | | | | | | | | | | | | | | | | | | | | | | | | | | | | | | | | | | | | | | | | | | | | | | | | | | | | | |
HIGH | | | 11.1 | | | | 7.0 | | | | 10.5 | | | | | | | | | | | | | | | | | | | | | | | | | | | | | | | | 11.7 | | | | | | | | 7.1 | | | | 7.4 | | | | 7.7 | |
LOW | | | 1.8 | | | | (0.9 | ) | | | (5.5 | ) | | | | | | | | | | | | | | | | | | | | | | | | | | | | | | | (3.0 | ) | | | | | | | 5.4 | | | | 5.6 | | | | 5.4 | |
FIRST QUARTILE | | | 4.3 | | | | 0.1 | | | | 0.5 | | | | | | | | | | | | | | | | | | | | | | | | | | | | | | | | 1.7 | | | | | | | | 5.5 | | | | 5.6 | | | | 6.1 | |
THIRD QUARTILE | | | 9.1 | | | | 4.8 | | | | 5.0 | | | | | | | | | | | | | | | | | | | | | | | | | | | | | | | | 6.5 | | | | | | | | 6.6 | | | | 6.9 | | | | 7.0 | |
MEAN | | | 6.4 | | | | 2.5 | | | | 2.3 | | | | | | | | | | | | | | | | | | | | | | | | | | | | | | | | 3.7 | | | | | | | | 6.2 | | | | 6.4 | | | | 6.6 | |
MEDIAN | | | 6.5 | | | | 2.2 | | | | 1.5 | | | | | | | | | | | | | | | | | | | | | | | | | | | | | | | | 3.1 | | | | | | | | 6.4 | | | | 6.4 | | | | 6.8 | |
STD. DEV. | | | 3.3 | | | | 2.9 | | | | 4.8 | | | | | | | | | | | | | | | | | | | | | | | | | | | | | | | | 4.8 | | | | | | | | 0.7 | | | | 0.7 | | | | 0.7 | |
COEFF. VAR. (%) | | | 50.8 | | | | 114.3 | | | | 207.7 | | | | | | | | | | | | | | | | | | | | | | | | | | | | | | | | 129.1 | | | | | | | | 10.9 | | | | 11.2 | | | | 11.2 | |
| | | | | | | | | | | | | | | |
Belk, Inc. | | | 10.0 | | | | 1.2 | | | | (6.3 | ) | | | 477,754 | | | | 434,241 | | | | 429,155 | | | | 458,123 | | | | 422,830 | | | | 385,900 | | | | 436,703 | | | | 0.5 | | | | NA | | | | NA | | | | NA | | | | NA | |
Definitions, sources, and footnotes are found on Exhibit 13 g.
Willamette Management Associates
EXHIBIT 13 d
BELK, INC.
MARKET APPROACH
GUIDELINE PUBLICLY TRADED COMPANY METHOD
INVESTED CAPITAL MULTIPLES
REVENUE
AS OF FEBRUARY 1, 2014
| | | | | | | | | | | | | | | | | | | | | | | | | | | | | | | | | | | | | | | | | | | | | | | | | | | | | | | | | | | | |
| | | Revenue Growth Rate | | | Revenue | | | 3-Yr Avg. [c] | | | 3-Yr Avg.
Annual
Compound | | | | | | MVIC/Revenue
Pricing
Multiples | |
Company Name | | Proj Yr2
% | | | Proj Yr1
% | | | LTM
% | | | Proj. Yr2
$000 | | | Proj. Yr1
$000 | | | LTM
$000 | | | 2013/12
$000 | | | 2012/11
$000 | | | 2011/10
$000 | | | Revenue
$000 | | | Growth [d]
% | | | MVIC
$000 | | | Proj.
Year 1 | | | LTM | | | 3-Yr
Avg. | |
Bon-Ton Stores Inc. | | | 0.9 | | | | 0.4 | | | | (1.5 | ) | | | 2,971,700 | | | | 2,946,600 | | | | 2,933,600 | | | | 2,978,836 | | | | 2,953,530 | | | | 3,046,485 | | | | 2,955,322 | | | | (0.2 | ) | | | 1,204,493 | | | | 0.41 | | | | 0.41 | | | | 0.41 | |
Dillard’s Inc. | | | 3.0 | | | | 0.4 | | | | 0.2 | | | | 7,002,400 | | | | 6,797,190 | | | | 6,767,158 | | | | 6,751,595 | | | | 6,405,484 | | | | 6,258,345 | | | | 6,641,412 | | | | 2.0 | | | | 4,716,290 | | | | 0.69 | | | | 0.70 | | | | 0.71 | |
Kohl’s Corp. | | | 1.5 | | | | 0.4 | | | | (0.0 | ) | | | 19,641,800 | | | | 19,344,000 | | | | 19,274,000 | | | | 19,279,000 | | | | 18,804,000 | | | | 18,391,000 | | | | 19,119,000 | | | | 0.9 | | | | 15,126,908 | | | | 0.78 | | | | 0.78 | | | | 0.79 | |
Macy’s, Inc. | | | 2.3 | | | | 2.5 | | | | 1.4 | | | | 29,431,000 | | | | 28,775,500 | | | | 28,079,000 | | | | 27,686,000 | | | | 26,405,000 | | | | 25,003,000 | | | | 27,390,000 | | | | 2.3 | | | | 25,629,242 | | | | 0.89 | | | | 0.91 | | | | 0.94 | |
Nordstrom Inc. | | | 9.3 | | | | 8.1 | | | | 3.2 | | | | 14,812,700 | | | | 13,551,000 | | | | 12,541,000 | | | | 12,148,000 | | | | 10,877,000 | | | | 9,700,000 | | | | 11,855,333 | | | | 5.3 | | | | 13,279,360 | | | | 0.98 | | | | 1.06 | | | | 1.12 | |
Target Corp. | | | 4.6 | | | | 3.0 | | | | 0.7 | | | | 79,514,000 | | | | 75,987,500 | | | | 73,807,000 | | | | 73,301,000 | | | | 69,865,000 | | | | 67,390,000 | | | | 72,324,333 | | | | 2.0 | | | | 49,923,464 | | | | 0.66 | | | | 0.68 | | | | 0.69 | |
Stage Stores Inc. | | | 3.6 | | | | 3.2 | | | | 1.0 | | | | 1,776,710 | | | | 1,714,620 | | | | 1,662,044 | | | | 1,645,800 | | | | 1,511,919 | | | | 1,470,590 | | | | 1,606,588 | | | | 3.5 | | | | 730,607 | | | | 0.43 | | | | 0.44 | | | | 0.45 | |
The Gap, Inc. | | | 5.5 | | | | 4.0 | | | | 4.1 | | | | 17,884,000 | | | | 16,950,000 | | | | 16,298,000 | | | | 15,651,000 | | | | 14,549,000 | | | | 14,664,000 | | | | 15,499,333 | | | | 4.2 | | | | 17,347,960 | | | | 1.02 | | | | 1.06 | | | | 1.12 | |
| | | | | | | | | | | | | | | | | | | | | | | | | | | | | | | | | | | | | | | | | | | | | | | | | | | | | | | | | | | | |
HIGH | | | 9.3 | | | | 8.1 | | | | 4.1 | | | | | | | | | | | | | | | | | | | | | | | | | | | | | | | | 5.3 | | | | | | | | 1.02 | | | | 1.06 | | | | 1.12 | |
LOW | | | 0.9 | | | | 0.4 | | | | (1.5 | ) | | | | | | | | | | | | | | | | | | | | | | | | | | | | | | | (0.2 | ) | | | | | | | 0.41 | | | | 0.41 | | | | 0.41 | |
FIRST QUARTILE | | | 2.1 | | | | 0.4 | | | | 0.2 | | | | | | | | | | | | | | | | | | | | | | | | | | | | | | | | 1.7 | | | | | | | | 0.60 | | | | 0.62 | | | | 0.63 | |
THIRD QUARTILE | | | 4.9 | | | | 3.4 | | | | 1.9 | | | | | | | | | | | | | | | | | | | | | | | | | | | | | | | | 3.7 | | | | | | | | 0.91 | | | | 0.95 | | | | 0.98 | |
MEAN | | | 3.8 | | | | 2.7 | | | | 1.1 | | | | | | | | | | | | | | | | | | | | | | | | | | | | | | | | 2.5 | | | | | | | | 0.73 | | | | 0.76 | | | | 0.78 | |
MEDIAN | | | 3.3 | | | | 2.7 | | | | 0.8 | | | | | | | | | | | | | | | | | | | | | | | | | | | | | | | | 2.1 | | | | | | | | 0.74 | | | | 0.74 | | | | 0.75 | |
STD. DEV. | | | 2.7 | | | | 2.6 | | | | 1.8 | | | | | | | | | | | | | | | | | | | | | | | | | | | | | | | | 1.8 | | | | | | | | 0.23 | | | | 0.25 | | | | 0.27 | |
COEFF. VAR. (%) | | | 70.0 | | | | 94.0 | | | | 158.1 | | | | | | | | | | | | | | | | | | | | | | | | | | | | | | | | 71.7 | | | | | | | | 31.8 | | | | 33.2 | | | | 34.8 | |
| | | | | | | | | | | | | | | |
Belk, Inc. | | | 4.1 | | | | 2.4 | | | | 2.1 | | | | 4,306,352 | | | | 4,135,123 | | | | 4,038,118 | | | | 3,956,866 | | | | 3,699,592 | | | | 3,513,275 | | | | 3,898,192 | | | | 3.0 | | | | NA | | | | NA | | | | NA | | | | NA | |
Definitions, sources, and footnotes are found on Exhibit 13 g.
Willamette Management Associates
EXHIBIT 13 e
BELK, INC.
MARKET APPROACH
GUIDELINE PUBLICLY TRADED COMPANY METHOD
INVESTED CAPITAL MULTIPLES
REVENUE PERFORMANCE RATIOS
AS OF FEBRUARY 1, 2014
| | | | | | | | | | | | | | | | | | | | | | | | | | | | | | | | |
| | | EBIT Return
on Revenue | | | EBITDA Return
on Revenue | |
| Company Name | | Proj. Yr2 % | | | Proj. Yr1 % | | | LTM % | | | 3-Yr % | | | Proj. Yr2
% | | | Proj. Yr1
% | | | LTM
% | | | 3-Yr
% | |
Bon-Ton Stores Inc. | | | 3.7 | | | | 3.4 | | | | 3.2 | | | | 2.8 | | | | 6.7 | | | | 6.3 | | | | 6.3 | | | | 6.0 | |
Dillard’s Inc. | | | 9.1 | | | | 8.9 | | | | 8.5 | | | | 7.7 | | | | 12.7 | | | | 12.8 | | | | 12.3 | | | | 11.6 | |
Kohl’s Corp. | | | 9.3 | | | | 9.2 | | | | 9.4 | | | | 10.2 | | | | 14.3 | | | | 14.1 | | | | 14.0 | | | | 14.6 | |
Macy’s, Inc. | | | 10.5 | | | | 10.1 | | | | 9.7 | | | | 9.5 | | | | 14.1 | | | | 13.7 | | | | 13.4 | | | | 13.3 | |
Nordstrom Inc. | | | 10.6 | | | | 10.7 | | | | 10.7 | | | | 11.0 | | | | 14.0 | | | | 14.1 | | | | 14.2 | | | | 14.5 | |
Target Corp. | | | 6.7 | | | | 6.3 | | | | 6.7 | | | | 7.2 | | | | 9.7 | | | | 9.3 | | | | 9.6 | | | | 10.2 | |
Stage Stores Inc. | | | 4.8 | | | | 4.2 | | | | 4.2 | | | | 3.9 | | | | 8.4 | | | | 7.9 | | | | 7.9 | | | | 7.7 | |
The Gap, Inc. | | | 13.6 | | | | 13.4 | | | | 13.7 | | | | 12.1 | | | | 16.4 | | | | 16.3 | | | | 17.0 | | | | 15.8 | |
| | | | | | | | | | | | | | | | | | | | | | | | | | | | | | | | |
HIGH | | | 13.6 | | | | 13.4 | | | | 13.7 | | | | 12.1 | | | | 16.4 | | | | 16.3 | | | | 17.0 | | | | 15.8 | |
LOW | | | 3.7 | | | | 3.4 | | | | 3.2 | | | | 2.8 | | | | 6.7 | | | | 6.3 | | | | 6.3 | | | | 6.0 | |
FIRST QUARTILE | | | 6.2 | | | | 5.7 | | | | 6.0 | | | | 6.4 | | | | 9.4 | | | | 8.9 | | | | 9.2 | | | | 9.6 | |
THIRD QUARTILE | | | 10.5 | | | | 10.3 | | | | 9.9 | | | | 10.4 | | | | 14.1 | | | | 14.1 | | | | 14.1 | | | | 14.5 | |
MEAN | | | 8.5 | | | | 8.3 | | | | 8.3 | | | | 8.1 | | | | 12.0 | | | | 11.8 | | | | 11.8 | | | | 11.7 | |
MEDIAN | | | 9.2 | | | | 9.1 | | | | 9.0 | | | | 8.6 | | | | 13.4 | | | | 13.3 | | | | 12.9 | | | | 12.5 | |
STD. DEV. | | | 3.3 | | | | 3.4 | | | | 3.4 | | | | 3.3 | | | | 3.4 | | | | 3.5 | | | | 3.6 | | | | 3.5 | |
COEFF. VAR. (%) | | | 38.4 | | | | 41.3 | | | | 41.7 | | | | 41.2 | | | | 28.1 | | | | 30.0 | | | | 30.4 | | | | 29.9 | |
| | | | | | | | |
Belk, Inc. | | | 7.0 | | | | 6.7 | | | | 7.2 | | | | 7.9 | | | | 11.1 | | | | 10.5 | | | | 10.6 | | | | 11.2 | |
Definitions, sources, and footnotes are found on Exhibit 13 g.
Willamette Management Associates
EXHIBIT 13 f
BELK, INC.
MARKET APPROACH
GUIDELINE PUBLICLY TRADED COMPANY METHOD
INVESTED CAPITAL MULTIPLES
BOOK VALUE OF INVESTED CAPITAL AND PERFORMANCE RATIOS
AS OF FEBRUARY 1, 2014
| | | | | | | | | | | | | | | | | | | | | | | | | | | | | | | | | | | | |
| | | | | | Projected
EBITDA
Growth -
Next Two | | | MVIC/
Lat. Qtr. | | | IBD/ | | | MV of
IBD/ | | | EBIT Return
On TBVIC | | | EBITDA Return
On TBVIC | |
| Company Name | | MVIC $000 | | | Years [e]
% | | | TBVIC
Ratio | | | TBVIC
% | | | MVIC
% | | | LTM
% | | | 3-Yr % | | | LTM
% | | | 3-Yr % | |
Bon-Ton Stores Inc. | | | 1,204,493 | | | | 6.8 | | | | 1.29 | | | | 106.0 | | | | 82.4 | | | | 10.2 | | | | 8.9 | | | | 19.9 | | | | 19.0 | |
Dillard’s Inc. | | | 4,716,290 | | | | 6.5 | | | | 1.65 | | | | 34.6 | | | | 21.0 | | | | 20.1 | | | | 17.8 | | | | 29.1 | | | | 26.9 | |
Kohl’s Corp. | | | 15,126,908 | | | | 4.0 | | | | 1.40 | | | | 45.2 | | | | 32.3 | | | | 16.8 | | | | 18.1 | | | | 25.0 | | | | 25.8 | |
Macy’s, Inc. | | | 25,629,242 | | | | 10.5 | | | | 3.07 | | | | 86.1 | | | | 28.1 | | | | 32.6 | | | | 31.0 | | | | 44.9 | | | | 43.6 | |
Nordstrom Inc. | | | 13,279,360 | | | | 16.6 | | | | 2.69 | | | | 63.2 | | | | 23.5 | | | | 27.1 | | | | 26.5 | | | | 36.2 | | | | 34.9 | |
Target Corp. | | | 49,923,464 | | | | 8.3 | | | | 1.61 | | | | 47.9 | | | | 29.7 | | | | 15.8 | | | | 16.8 | | | | 22.9 | | | | 23.7 | |
Stage Stores Inc. | | | 730,607 | | | | 14.4 | | | | 1.31 | | | | 25.5 | | | | 19.5 | | | | 12.6 | | | | 11.4 | | | | 23.4 | | | | 22.2 | |
The Gap, Inc. | | | 17,347,960 | | | | 6.0 | | | | 4.42 | | | | 31.8 | | | | 7.2 | | | | 57.0 | | | | 47.9 | | | | 70.6 | | | | 62.2 | |
| | | | | | | | | | | | | | | | | | | | | | | | | | | | | | | | | | | | |
HIGH | | | | | | | 16.6 | | | | 4.4 | | | | 106.0 | | | | 82.4 | | | | 57.0 | | | | 47.9 | | | | 70.6 | | | | 62.2 | |
LOW | | | | | | | 4.0 | | | | 1.3 | | | | 25.5 | | | | 7.2 | | | | 10.2 | | | | 8.9 | | | | 19.9 | | | | 19.0 | |
FIRST QUARTILE | | | | | | | 6.4 | | | | 1.4 | | | | 33.9 | | | | 20.7 | | | | 15.0 | | | | 15.4 | | | | 23.3 | | | | 23.3 | |
THIRD QUARTILE | | | | | | | 11.5 | | | | 2.8 | | | | 68.9 | | | | 30.3 | | | | 28.5 | | | | 27.6 | | | | 38.3 | | | | 37.1 | |
MEAN | | | | | | | 9.2 | | | | 2.2 | | | | 55.0 | | | | 30.5 | | | | 24.0 | | | | 22.3 | | | | 34.0 | | | | 32.3 | |
MEDIAN | | | | | | | 7.6 | | | | 1.6 | | | | 46.5 | | | | 25.8 | | | | 18.5 | | | | 18.0 | | | | 27.1 | | | | 26.3 | |
STD. DEV. | | | | | | | 4.4 | | | | 1.1 | | | | 28.3 | | | | 22.4 | | | | 15.2 | | | | 12.6 | | | | 16.9 | | | | 14.4 | |
COEFF. VAR. (%) | | | | | | | 48.0 | | | | 51.6 | | | | 51.4 | | | | 73.5 | | | | 63.4 | | | | 56.6 | | | | 49.8 | | | | 44.6 | |
| | | | | | | | | |
Belk, Inc. | | | NA | | | | 11.3 | | | | NA | | | | 22.5 | | | | NA | | | | 16.7 | | | | 17.6 | | | | 24.5 | | | | 24.9 | |
Definitions, sources, and footnotes are found on Exhibit 13 g.
Willamette Management Associates
EXHIBIT 13 g
BELK, INC.
MARKET APPROACH
GUIDELINE PUBLICLY TRADED COMPANY METHOD
INVESTED CAPITAL MULTIPLES
DEFINITIONS, FOOTNOTES, AND SOURCES TO EXHIBITS
AS OF FEBRUARY 1, 2014
BV = Book value
IBD = Interest-bearing debt
LTD = Long-term debt
LTM = Latest twelve months
EBIT = Earnings before interest and taxes
EBITDA = Earnings before interest, taxes, depreciation, and amortization
MV = Market value
MVE = MV of preferred + MV of common equity - cash and cash equivalents
MVIC = LTD + ST interest-bearing debt + MV of preferred + MV of common equity + minority interest - cash and cash equivalents
NA = Not available/applicable
TBVIC = Stockholders’ equity - goodwill + LTD + ST interest-bearing debt
Footnotes:
| [a] | Book value if not publicly traded. |
| [b] | Per most recently available data prior to the valuation date. |
| [c] | If the LTM is at least six months beyond the latest fiscal year-end, then the average includ |
| [d] | From earliest year on the table to the latest 12 months. |
| [e] | Data provided by Reuters. |
Note: Financial information for the selected guideline publicly traded companies and Belk, Inc., have been normalized for nonrecurring items.
Sources: S&P Capital IQ, Reuters, Exhibit 4, and Willamette Management Associates calculations.
Willamette Management Associates
EXHIBIT 14 a
BELK, INC.
MARKET APPROACH
GUIDELINE PUBLICLY TRADED COMPANY METHOD
DESCRIPTION OF THE GUIDELINE PUBLICLY TRADED COMPANIES
BON-TON STORES INC.
AS OF FEBRUARY 1, 2014
Business Description
The Bon-Ton Stores, Inc., through its subsidiaries, operates department stores in the United States. Its stores offer brand-name fashion apparel and accessories for women, men, and children, as well as cosmetics, home furnishings, footwear, and other goods. As of November 13, 2013, the company operated 273 department stores comprising 10 furniture galleries in 25 states in the Northeast, Midwest, and upper Great Plains under the Bon-Ton, Bergner’s, Boston Store, Carson Pirie Scott, Elder-Beerman, Herberger’s, and Younkers names. The Bon-Ton Stores, Inc., was founded in 1898 and is headquartered in York, Pennsylvania.
| | | | | | | | | | | | | | | | |
| Financial Information | | | | | | | |
| | | | |
| | | LTM | | | 2013 | | | 2012 | | | 2011 | |
| | | $000 | | | $000 | | | $000 | | | $000 | |
Cash & Equivalents | | | 8,082 | | | | 7,926 | | | | 14,272 | | | | 16,339 | |
Total Assets | | | 1,808,501 | | | | 1,634,209 | | | | 1,618,203 | | | | 1,656,239 | |
Long-Term Debt | | | 981,385 | | | | 821,342 | | | | 870,948 | | | | 917,730 | |
Stockholders’ Equity | | | 48,874 | | | | 110,606 | | | | 131,607 | | | | 183,352 | |
Revenue | | | 2,933,600 | | | | 2,978,836 | | | | 2,953,530 | | | | 3,046,485 | |
Gross Profit | | | 1,100,333 | | | | 1,104,946 | | | | 1,106,161 | | | | 1,186,303 | |
EBITDA | | | 186,108 | | | | 176,589 | | | | 171,736 | | | | 244,763 | |
Net Income | | | 13,529 | | | | 506 | | | | (11,410 | ) | | | 16,711 | |
EBITDA Margin | | | 6.3 | % | | | 5.9 | % | | | 5.8 | % | | | 8.0 | % |
Net Profit Margin | | | 0.5 | % | | | 0.0 | % | | | -0.4 | % | | | 0.5 | % |
Stock Performance
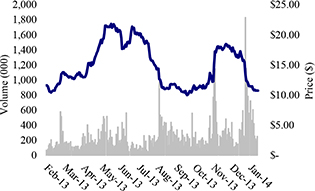
| | | | |
| Valuation Data | | | |
| |
MVE $000 | | | 220,065 | |
MVIC $000 | | | 1,204,493 | |
Projected EBITDA Growth [a] | | | 6.8 | % |
MVIC / LTM Net Income | | | 89.03 | |
MVIC / LTM Sales | | | 0.41 | |
MVIC / LTM EBITDA | | | 6.47 | |
MVIC / Projected Net Income | | | 51.92 | |
MVIC / Projected Sales | | | 0.07 | |
MVIC / Projected EBITDA | | | 6.46 | |
EBITDA = Earnings before interest, taxes, depreciation, and amortization
LTM = Latest twelve months
MVE = Market value of equity
MVIC = Market value of invested capital
Footnote:
| [a] | From Reuters. Represents the mean, forecasted, annual EBITDA growth over the next two years. |
Sources: S&P Capital IQ, Reuters, and Willamette Management Associates calculations.
Willamette Management Associates
EXHIBIT 14 b
BELK, INC.
MARKET APPROACH
GUIDELINE PUBLICLY TRADED COMPANY METHOD
DESCRIPTION OF THE GUIDELINE PUBLICLY TRADED COMPANIES
DILLARD’S INC.
AS OF FEBRUARY 1, 2014
Business Description
Dillard’s, Inc., operates as a fashion apparel, cosmetics, and home furnishing retailer in the United States. The company’s stores offer a selection of merchandise, including fashion apparel for women, men, and children; accessories; cosmetics; home furnishings; and other consumer goods. Its merchandise selections include brand merchandise, such as Antonio Melani, Gianni Bini, Roundtree & Yorke, and Daniel Cremieux. The company also sells its merchandise online through its website, www.dillards.com, which features online gift registries and various other services. In addition, it operates a general contracting construction company that engages in constructing and remodeling stores for the company. As of May 10, 2013, the company operated 283 Dillard’s locations and 18 clearance centers, and an Internet store. Dillard’s, Inc., was founded in 1938 and is based in Little Rock, Arkansas.
| | | | | | | | | | | | | | | | |
| Financial Information | | | | |
| | | | |
| | | LTM | | | 2013 | | | 2012 | | | 2011 | |
| | | $000 | | | $000 | | | $000 | | | $000 | |
Cash & Equivalents | | | 110,972 | | | | 124,060 | | | | 224,272 | | | | 343,291 | |
Total Assets | | | 4,459,915 | | | | 4,048,744 | | | | 4,306,137 | | | | 4,374,166 | |
Long-Term Debt | | | 821,742 | | | | 822,309 | | | | 823,938 | | | | 908,629 | |
Stockholders’ Equity | | | 1,872,570 | | | | 1,970,175 | | | | 2,052,019 | | | | 2,086,720 | |
Revenue | | | 6,767,158 | | | | 6,751,595 | | | | 6,405,484 | | | | 6,258,345 | |
Gross Profit | | | 2,532,374 | | | | 2,504,487 | | | | 2,358,215 | | | | 2,277,472 | |
EBITDA | | | 834,825 | | | | 795,799 | | | | 680,816 | | | | 593,350 | |
Net Income | | | 333,325 | | | | 305,663 | | | | 230,137 | | | | 169,432 | |
EBITDA Margin | | | 12.3 | % | | | 11.8 | % | | | 10.6 | % | | | 9.5 | % |
Net Profit Margin | | | 4.9 | % | | | 4.5 | % | | | 3.6 | % | | | 2.7 | % |
Stock Performance
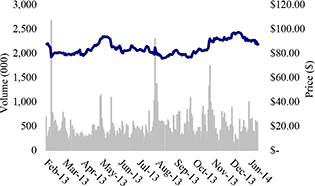
| | | | |
| Valuation Data | | | |
| |
MVE $000 | | | 3,834,750 | |
MVIC $000 | | | 4,716,290 | |
Projected EBITDA Growth [a] | | | 6.5 | % |
MVIC / LTM Net Income | | | 14.15 | |
MVIC / LTM Sales | | | 0.70 | |
MVIC / LTM EBITDA | | | 5.65 | |
MVIC / Projected Net Income | | | 203.29 | |
MVIC / Projected Sales | | | 0.28 | |
MVIC / Projected EBITDA | | | 25.29 | |
EBITDA = Earnings before interest, taxes, depreciation, and amortization
LTM = Latest twelve months
MVE = Market value of equity
MVIC = Market value of invested capital
Footnote:
| [a] | From Reuters. Represents the mean, forecasted, annual EBITDA growth over the next two years. |
Sources: S&P Capital IQ, Reuters, and Willamette Management Associates calculations.
Willamette Management Associates
EXHIBIT 14 c
BELK, INC.
MARKET APPROACH
GUIDELINE PUBLICLY TRADED COMPANY METHOD
DESCRIPTION OF THE GUIDELINE PUBLICLY TRADED COMPANIES
KOHL’S CORP.
AS OF FEBRUARY 1, 2014
Business Description
Kohl’s Corporation operates department stores in the United States. Its stores offer private, exclusive, and national branded apparel, footwear, and accessories for women, men, and children; soft home products, such as sheets and pillows; and housewares targeted to middle-income customers. As of November 2, 2013, it operated 1,158 stores in 49 states. The company also provides on-line shopping through its website Kohls.com. Kohl’s Corporation was founded in 1962 and is headquartered in Menomonee Falls, Wisconsin.
Financial Information
| | | | | | | | | | | | | | | | |
| | | LTM | | | 2013 | | | 2012 | | | 2011 | |
| | | $000 | | | $000 | | | $000 | | | $000 | |
Cash & Equivalents | | | 598,000 | | | | 537,000 | | | | 1,205,000 | | | | 2,277,000 | |
Total Assets | | | 15,245,000 | | | | 13,905,000 | | | | 14,148,000 | | | | 14,849,000 | |
Long-Term Debt | | | 4,742,000 | | | | 4,448,000 | | | | 4,150,000 | | | | 3,512,000 | |
Stockholders’ Equity | | | 5,924,000 | | | | 6,048,000 | | | | 6,508,000 | | | | 7,850,000 | |
Revenue | | | 19,274,000 | | | | 19,279,000 | | | | 18,804,000 | | | | 18,391,000 | |
Gross Profit | | | 6,981,000 | | | | 6,990,000 | | | | 7,179,000 | | | | 7,032,000 | |
EBITDA | | | 2,698,000 | | | | 2,723,000 | | | | 2,936,000 | | | | 2,842,000 | |
Net Income | | | 964,098 | | | | 1,014,806 | | | | 1,208,536 | | | | 1,162,379 | |
EBITDA Margin | | | 14.0 | % | | | 14.1 | % | | | 15.6 | % | | | 15.5 | % |
Net Profit Margin | | | 5.0 | % | | | 5.3 | % | | | 6.4 | % | | | 6.3 | % |
Stock Performance
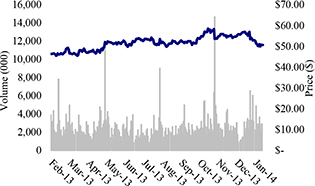
Valuation Data
| | | | |
MVE $000 | | | 10,841,908 | |
MVIC $000 | | | 15,126,908 | |
Projected EBITDA Growth [a] | | | 4.0 | % |
MVIC / LTM Net Income | | | 15.69 | |
MVIC / LTM Sales | | | 0.78 | |
MVIC / LTM EBITDA | | | 5.61 | |
MVIC / Projected Net Income | | | 652.02 | |
MVIC / Projected Sales | | | 0.89 | |
MVIC / Projected EBITDA | | | 81.11 | |
EBITDA = Earnings before interest, taxes, depreciation, and amortization
LTM = Latest twelve months
MVE = Market value of equity
MVIC = Market value of invested capital
Footnote:
| [a] | From Reuters. Represents the mean, forecasted, annual EBITDA growth over the next two years. |
Sources: S&P Capital IQ, Reuters, and Willamette Management Associates calculations.
Willamette Management Associates
EXHIBIT 14 d
BELK, INC.
MARKET APPROACH
GUIDELINE PUBLICLY TRADED COMPANY METHOD
DESCRIPTION OF THE GUIDELINE PUBLICLY TRADED COMPANIES
MACY’S, INC.
AS OF FEBRUARY 1, 2014
Business Description
Macy’s, Inc., together with its subsidiaries, operates stores and Internet Websites in the United States. It operates Macy’s and Bloomingdale’s stores and Websites that sell a range of merchandise, including apparel and accessories for men, women, and children; cosmetics; home furnishings; and other consumer goods in 45 states, the District of Columbia, Guam, and Puerto Rico. The company also operates Bloomingdale’s Outlet stores that offer a range of apparel and accessories, including women’s ready-to-wear, fashion accessories, jewelry, handbags, and intimate apparel, as well as men’s, children’s, and women’s shoes. As of December 17, 2013, it operated approximately 840 department stores under the names of Macy’s and Bloomingdale’s in 45 states, the District of Columbia, Guam, and Puerto Rico, as well as the macys.com and bloomingdales.com Websites; and 13 Bloomingdale’s Outlet stores. The company was formerly known as Federated Department Stores, Inc., and changed its name to Macy’s, Inc., in June 2007. Macy’s, Inc., was founded in 1830 and is headquartered in Cincinnati, Ohio.
Financial Information
| | | | | | | | | | | | | | | | |
| | | LTM | | | 2013 | | | 2012 | | | 2011 | |
| | | $000 | | | $000 | | | $000 | | | $000 | |
Cash & Equivalents | | | 1,171,000 | | | | 1,836,000 | | | | 2,827,000 | | | | 1,464,000 | |
Total Assets | | | 22,446,000 | | | | 20,991,000 | | | | 22,095,000 | | | | 20,631,000 | |
Long-Term Debt | | | 6,732,000 | | | | 6,806,000 | | | | 6,655,000 | | | | 6,971,000 | |
Stockholders’ Equity | | | 5,442,000 | | | | 6,051,000 | | | | 5,933,000 | | | | 5,530,000 | |
Revenue | | | 28,079,000 | | | | 27,686,000 | | | | 26,405,000 | | | | 25,003,000 | |
Gross Profit | | | 11,264,000 | | | | 11,148,000 | | | | 10,667,000 | | | | 10,179,000 | |
EBITDA | | | 3,753,000 | | | | 3,715,000 | | | | 3,471,000 | | | | 3,069,000 | |
Net Income | | | 1,517,333 | | | | 1,458,824 | | | | 1,263,144 | | | | 917,291 | |
EBITDA Margin | | | 13.4 | % | | | 13.4 | % | | | 13.1 | % | | | 12.3 | % |
Net Profit Margin | | | 5.4 | % | | | 5.3 | % | | | 4.8 | % | | | 3.7 | % |
Stock Performance
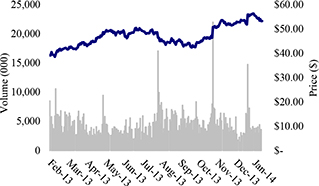
Valuation Data
| | | | |
MVE $000 | | | 19,603,242 | |
MVIC $000 | | | 25,629,242 | |
Projected EBITDA Growth [a] | | | 10.5 | % |
MVIC / LTM Net Income | | | 16.89 | |
MVIC / LTM Sales | | | 0.91 | |
MVIC / LTM EBITDA | | | 6.83 | |
MVIC / Projected Net Income | | | 1,104.71 | |
MVIC / Projected Sales | | | 1.51 | |
MVIC / Projected EBITDA | | | 137.42 | |
EBITDA = Earnings before interest, taxes, depreciation, and amortization
LTM = Latest twelve months
MVE = Market value of equity
MVIC = Market value of invested capital
Footnote:
| [a] | From Reuters. Represents the mean, forecasted, annual EBITDA growth over the next two years. |
Sources: S&P Capital IQ, Reuters, and Willamette Management Associates calculations.
Willamette Management Associates
EXHIBIT 14 e
BELK, INC.
MARKET APPROACH
GUIDELINE PUBLICLY TRADED COMPANY METHOD
DESCRIPTION OF THE GUIDELINE PUBLICLY TRADED COMPANIES
NORDSTROM INC.
AS OF FEBRUARY 1, 2014
Business Description
Nordstrom, Inc., a fashion specialty retailer, offers apparel, shoes, cosmetics, and accessories for women, men, and children in the United States. It operates in two segments, Retail and Credit. The Retail segment offers a selection of brand name and private label merchandise. This segment sells its products through various channels, as well as through online private sale subsidiary, HauteLook, Inc. As of February 19, 2014, this segment operated 260 stores in 35 states, including 117 full-line stores, 140 Nordstrom Racks, 2 Jeffrey boutiques, and 1 clearance store. The Credit segment operates Nordstrom fsb, a federal savings bank, which provides a private label credit card, two Nordstrom VISA credit cards, and a debit card. Its credit and debit cards feature a shopping-based loyalty program. Nordstrom, Inc., was founded in 1901 and is based in Seattle, Washington.
Financial Information
| | | | | | | | | | | | | | | | |
| | | LTM | | | 2013 | | | 2012 | | | 2011 | |
| | | $000 | | | $000 | | | $000 | | | $000 | |
Cash & Equivalents | | | 947,000 | | | | 1,285,000 | | | | 1,877,000 | | | | 1,506,000 | |
Total Assets | | | 8,585,000 | | | | 8,089,000 | | | | 8,491,000 | | | | 7,462,000 | |
Long-Term Debt | | | 2,711,000 | | | | 3,124,000 | | | | 3,141,000 | | | | 2,775,000 | |
Stockholders’ Equity | | | 1,988,000 | | | | 1,913,000 | | | | 1,956,000 | | | | 2,021,000 | |
Revenue | | | 12,541,000 | | | | 12,148,000 | | | | 10,877,000 | | | | 9,700,000 | |
Gross Profit | | | 4,663,000 | | | | 4,544,000 | | | | 4,086,000 | | | | 3,543,000 | |
EBITDA | | | 1,783,000 | | | | 1,748,000 | | | | 1,632,000 | | | | 1,424,000 | |
Net Income | | | 785,321 | | | | 770,369 | | | | 743,714 | | | | 644,249 | |
EBITDA Margin | | | 14.2 | % | | | 14.4 | % | | | 15.0 | % | | | 14.7 | % |
Net Profit Margin | | | 6.3 | % | | | 6.3 | % | | | 6.8 | % | | | 6.6 | % |
Stock Performance
Valuation Data
| | | | |
MVE $000 | | | 11,108,360 | |
MVIC $000 | | | 13,279,360 | |
Projected EBITDA Growth [a] | | | 16.6 | % |
MVIC / LTM Net Income | | | 16.91 | |
MVIC / LTM Sales | | | 1.06 | |
MVIC / LTM EBITDA | | | 7.45 | |
MVIC / Projected Net Income | | | 572.39 | |
MVIC / Projected Sales | | | 0.78 | |
MVIC / Projected EBITDA | | | 71.20 | |
EBITDA = Earnings before interest, taxes, depreciation, and amortization
LTM = Latest twelve months
MVE = Market value of equity
MVIC = Market value of invested capital
Footnote:
| [a] | From Reuters. Represents the mean, forecasted, annual EBITDA growth over the next two years. |
Sources: S&P Capital IQ, Reuters, and Willamette Management Associates calculations.
Willamette Management Associates
EXHIBIT 14 f
BELK, INC.
MARKET APPROACH
GUIDELINE PUBLICLY TRADED COMPANY METHOD
DESCRIPTION OF THE GUIDELINE PUBLICLY TRADED COMPANIES
TARGET CORP.
AS OF FEBRUARY 1, 2014
Business Description
Target Corporation operates general merchandise stores in the United States. It offers household essentials, including pharmacy, beauty, personal care, baby care, cleaning, and paper products; hardlines comprising music, movies, books, computer software, sporting goods, and toys, as well as electronics that consist of video game hardware and software; apparel and accessories, such as apparel for women, men, boys, girls, toddlers, infants, and newborns, as well as intimate apparel, jewelry, accessories, and shoes. The company also provides food and pet supplies, including dry grocery, dairy, frozen food, beverages, candy, snacks, deli, bakery, meat, produce, and pet supplies; and home furnishings and décor, such as furniture, lighting, kitchenware, small appliances, home décor, bed and bath, home improvement, automotive, and seasonal merchandise comprising patio furniture and holiday décor. In addition, it offers in-store amenities. The company distributes its merchandise through a network of distribution centers, as well as third parties and direct shipping from vendors. Further, it provides general merchandise through its website, Target.com; and branded proprietary Target Debit Card. As of January 30, 2014, the company had 1,921 stores, including 1,797 stores in the United States and 124 stores in Canada. Target Corporation was founded in 1902 and is headquartered in Minneapolis, Minnesota.
Financial Information
| | | | | | | | | | | | | | | | |
| | | LTM | | | 2013 | | | 2012 | | | 2011 | |
| | | $000 | | | $000 | | | $000 | | | $000 | |
Cash & Equivalents | | | 708,000 | | | | 788,000 | | | | 814,000 | | | | 1,712,000 | |
Total Assets | | | 46,373,000 | | | | 48,163,000 | | | | 46,630,000 | | | | 43,705,000 | |
Long-Term Debt | | | 12,708,000 | | | | 14,654,000 | | | | 13,697,000 | | | | 15,661,000 | |
Stockholders’ Equity | | | 16,156,000 | | | | 16,558,000 | | | | 15,821,000 | | | | 15,487,000 | |
Revenue | | | 73,807,000 | | | | 73,301,000 | | | | 69,865,000 | | | | 67,390,000 | |
Gross Profit | | | 21,610,000 | | | | 21,571,000 | | | | 20,893,000 | | | | 20,079,000 | |
EBITDA | | | 7,098,000 | | | | 7,513,000 | | | | 7,453,000 | | | | 7,336,000 | |
Net Income | | | 2,721,969 | | | | 2,996,311 | | | | 2,953,404 | | | | 2,922,200 | |
EBITDA Margin | | | 9.6 | % | | | 10.2 | % | | | 10.7 | % | | | 10.9 | % |
Net Profit Margin | | | 3.7 | % | | | 4.1 | % | | | 4.2 | % | | | 4.3 | % |
Stock Performance
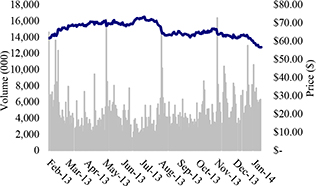
Valuation Data
| | | | |
MVE $000 | | | 35,801,464 | |
MVIC $000 | | | 49,923,464 | |
Projected EBITDA Growth [a] | | | 8.3 | % |
MVIC / LTM Net Income | | | 18.34 | |
MVIC / LTM Sales | | | 0.68 | |
MVIC / LTM EBITDA | | | 7.03 | |
MVIC / Projected Net Income | | | 2,151.87 | |
MVIC / Projected Sales | | | 2.95 | |
MVIC / Projected EBITDA | | | 267.69 | |
EBITDA = Earnings before interest, taxes, depreciation, and amortization
LTM = Latest twelve months
MVE = Market value of equity
MVIC = Market value of invested capital
Footnote:
| [a] | From Reuters. Represents the mean, forecasted, annual EBITDA growth over the next two years. |
Sources: S&P Capital IQ, Reuters, and Willamette Management Associates calculations.
Willamette Management Associates
EXHIBIT 14 g
BELK, INC.
MARKET APPROACH
GUIDELINE PUBLICLY TRADED COMPANY METHOD
DESCRIPTION OF THE GUIDELINE PUBLICLY TRADED COMPANIES
STAGE STORES INC.
AS OF FEBRUARY 1, 2014
Business Description
Stage Stores, Inc., operates department stores and off-price stores in the United States. It operates department stores under the Bealls, Goody’s, Palais Royal, Peebles, and Stage names that offer moderately priced brand name and private label apparel, accessories, cosmetics, and footwear for the entire family. The company operates off-price stores under Steele’s name, which provide brand name family apparel, accessories, shoes, and home décor. It also offers its merchandise direct-to-consumer through its eCommerce Website and Send program. As of July 29, 2013, the company operated approximately 860 stores in 40 states. Stage Stores, Inc., was founded in 1988 and is headquartered in Houston, Texas.
Financial Information
| | | | | | | | | | | | | | | | |
| | | LTM | | | 2013 | | | 2012 | | | 2011 | |
| | | $000 | | | $000 | | | $000 | | | $000 | |
Cash & Equivalents | | | 23,717 | | | | 17,937 | | | | 18,621 | | | | 89,349 | |
Total Assets | | | 956,806 | | | | 794,871 | | | | 735,339 | | | | 796,084 | |
Long-Term Debt | | | 142,548 | | | | 11,585 | | | | 35,721 | | | | 25,002 | |
Stockholders’ Equity | | | 430,540 | | | | 464,870 | | | | 412,706 | | | | 489,509 | |
Revenue | | | 1,662,044 | | | | 1,645,800 | | | | 1,511,919 | | | | 1,470,590 | |
Gross Profit | | | 473,775 | | | | 462,175 | | | | 411,100 | | | | 420,924 | |
EBITDA | | | 130,755 | | | | 129,517 | | | | 111,076 | | | | 124,384 | |
Net Income | | | 44,010 | | | | 43,609 | | | | 29,953 | | | | 40,431 | |
EBITDA Margin | | | 7.9 | % | | | 7.9 | % | | | 7.3 | % | | | 8.5 | % |
Net Profit Margin | | | 2.6 | % | | | 2.6 | % | | | 2.0 | % | | | 2.7 | % |
Stock Performance
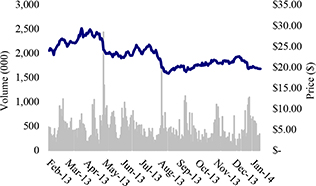
Valuation Data
| | | | |
MVE $000 | | | 611,776 | |
MVIC $000 | | | 730,607 | |
Projected EBITDA Growth [a] | | | 14.4 | % |
MVIC / LTM Net Income | | | 16.60 | |
MVIC / LTM Sales | | | 0.44 | |
MVIC / LTM EBITDA | | | 5.59 | |
MVIC / Projected Net Income | | | 31.49 | |
MVIC / Projected Sales | | | 0.04 | |
MVIC / Projected EBITDA | | | 3.92 | |
EBITDA = Earnings before interest, taxes, depreciation, and amortization
LTM = Latest twelve months
MVE = Market value of equity
MVIC = Market value of invested capital
Footnote:
| [a] | From Reuters. Represents the mean, forecasted, annual EBITDA growth over the next two years. |
Sources: S&P Capital IQ, Reuters, and Willamette Management Associates calculations.
Willamette Management Associates
EXHIBIT 14 h
BELK, INC.
MARKET APPROACH
GUIDELINE PUBLICLY TRADED COMPANY METHOD
DESCRIPTION OF THE GUIDELINE PUBLICLY TRADED COMPANIES
THE GAP, INC.
AS OF FEBRUARY 1, 2014
Business Description
The Gap, Inc., operates as an apparel retail company. It offers apparel, accessories, and personal care products for men, women, children, and babies under the Gap, Old Navy, Banana Republic, Piperlime, Athleta, and Intermix brands worldwide. Its products include maternity apparel; loungewear, sleepwear, intimates, and active apparel for women; and handbags, shoes, jewelry, personal care products, and eyewear for men and women; women’s apparel, footwear, and accessories for sports and fitness activities, including crossover apparel and casualwear; and luxury and contemporary apparel and accessories. The company also has franchise agreements with unaffiliated franchisees to operate stores in Asia, Australia, Eastern Europe, Latin America, the Middle East, and Africa under the Gap and Banana Republic brands. The Gap, Inc., offers its products through company-operated stores, franchise stores, e-commerce sites, and catalogs. As of November 2, 2013, it had 3,515 store locations. The Gap, Inc., was founded in 1969 and is headquartered in San Francisco, California.
Financial Information
| | | | | | | | | | | | | | | | |
| | | LTM | | | 2013 | | | 2012 | | | 2011 | |
| | | $000 | | | $000 | | | $000 | | | $000 | |
Cash & Equivalents | | | 996,000 | | | | 1,510,000 | | | | 1,885,000 | | | | 1,661,000 | |
Total Assets | | | 7,786,000 | | | | 7,470,000 | | | | 7,422,000 | | | | 7,065,000 | |
Long-Term Debt | | | 1,247,000 | | | | 1,246,000 | | | | 1,606,000 | | | | — | |
Stockholders’ Equity | | | 2,956,000 | | | | 2,894,000 | | | | 2,755,000 | | | | 4,080,000 | |
Revenue | | | 16,298,000 | | | | 15,651,000 | | | | 14,549,000 | | | | 14,664,000 | |
Gross Profit | | | 6,476,000 | | | | 6,171,000 | | | | 5,274,000 | | | | 5,889,000 | |
EBITDA | | | 2,773,000 | | | | 2,509,000 | | | | 2,046,000 | | | | 2,632,000 | |
Net Income | | | 1,417,868 | | | | 1,215,037 | | | | 900,389 | | | | 1,293,699 | |
EBITDA Margin | | | 17.0 | % | | | 16.0 | % | | | 14.1 | % | | | 17.9 | % |
Net Profit Margin | | | 8.7 | % | | | 7.8 | % | | | 6.2 | % | | | 8.8 | % |
Stock Performance
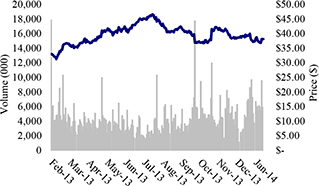
Valuation Data
| | | | |
MVE $000 | | | 17,096,960 | |
MVIC $000 | | | 17,347,960 | |
Projected EBITDA Growth [a] | | | 6.0 | % |
MVIC / LTM Net Income | | | 12.24 | |
MVIC / LTM Sales | | | 1.06 | |
MVIC / LTM EBITDA | | | 6.26 | |
MVIC / Projected Net Income | | | 747.76 | |
MVIC / Projected Sales | | | 1.02 | |
MVIC / Projected EBITDA | | | 93.02 | |
EBITDA = Earnings before interest, taxes, depreciation, and amortization
LTM = Latest twelve months
MVE = Market value of equity
MVIC = Market value of invested capital
Footnote:
| [a] | From Reuters. Represents the mean, forecasted, annual EBITDA growth over the next two years. |
Sources: S&P Capital IQ, Reuters, and Willamette Management Associates calculations.
Willamette Management Associates
EXHIBIT 15 a
BELK, INC.
MARKET APPROACH
PREVIOUS TRANSACTION METHOD
CLASS A SHARES (OTCBB: BLKI.A)
| | | | | | | | | | | | | | | | | | | | | | | | | | | | | | | | |
| Class A Shares | | | | | Class A Shares | |
| Date | | | Price | | | Number of
Shares | | | Transaction
Size | | | | | Date | | | Price | | | Number of
Shares | | | Transaction
Size | |
| | 11-Dec-13 | | | | 50.10 | | | | 100 | | | | 5,010 | | | | | | 29-Apr-11 | | | | 37.00 | | | | 200 | | | | 7,400 | |
| | 28-Jun-13 | | | | 49.00 | | | | 7,200 | | | | 352,800 | | | | | | 29-Apr-11 | | | | 37.00 | | | | 256 | | | | 9,472 | |
| | 6-May-13 | | | | 47.25 | | | | 100 | | | | 4,725 | | | | | | 29-Apr-11 | | | | 34.50 | | | | 200 | | | | 6,900 | |
| | 25-Mar-13 | | | | 41.00 | | | | 100 | | | | 4,100 | | | | | | 31-Mar-11 | | | | 32.00 | | | | 200 | | | | 6,400 | |
| | 6-Mar-13 | | | | 45.00 | | | | 100 | | | | 4,500 | | | | | | 31-Mar-11 | | | | 30.00 | | | | 200 | | | | 6,000 | |
| | 19-Feb-13 | | | | 40.20 | | | | 200 | | | | 8,040 | | | | | | 24-Feb-11 | | | | 24.25 | | | | 150 | | | | 3,638 | |
| | 5-Nov-12 | | | | 40.00 | | | | 1,300 | | | | 52,000 | | | | | | 15-Feb-11 | | | | 23.90 | | | | 100 | | | | 2,390 | |
| | 22-Oct-12 | | | | 36.50 | | | | 600 | | | | 21,900 | | | | | | 4-Feb-11 | | | | 23.60 | | | | 500 | | | | 11,800 | |
| | 6-Aug-12 | | | | 40.00 | | | | 300 | | | | 12,000 | | | | | | 3-Feb-11 | | | | 23.60 | | | | 400 | | | | 9,440 | |
| | 17-May-12 | | | | 40.70 | | | | 100 | | | | 4,070 | | | | | | 3-Feb-11 | | | | 23.60 | | | | 400 | | | | 9,440 | |
| | 11-May-12 | | | | 40.70 | | | | 100 | | | | 4,070 | | | | | | 3-Feb-11 | | | | 23.60 | | | | 200 | | | | 4,720 | |
| | 28-Mar-12 | | | | 35.00 | | | | 200 | | | | 7,000 | | | | | | 3-Feb-11 | | | | 23.60 | | | | 200 | | | | 4,720 | |
| | 9-Jan-12 | | | | 31.00 | | | | 1,150 | | | | 35,650 | | | | | | 3-Feb-11 | | | | 23.60 | | | | 400 | | | | 9,440 | |
| | 3-Jan-12 | | | | 31.00 | | | | 400 | | | | 12,400 | | | | | �� | 2-Feb-11 | | | | 23.59 | | | | 100 | | | | 2,359 | |
| | 3-Jan-12 | | | | 31.00 | | | | 400 | | | | 12,400 | | | | | | 2-Feb-11 | | | | 23.60 | | | | 200 | | | | 4,720 | |
| | 3-Jan-12 | | | | 31.00 | | | | 400 | | | | 12,400 | | | | | | 2-Feb-11 | | | | 23.70 | | | | 100 | | | | 2,370 | |
| | 23-Nov-11 | | | | 30.00 | | | | 200 | | | | 6,000 | | | | | | 2-Feb-11 | | | | 23.70 | | | | 200 | | | | 4,740 | |
| | 21-Sep-11 | | | | 29.00 | | | | 300 | | | | 8,700 | | | | | | 1-Feb-11 | | | | 23.40 | | | | 100 | | | | 2,340 | |
| | 11-Aug-11 | | | | 28.10 | | | | 504 | | | | 14,162 | | | | | | 1-Feb-11 | | | | 23.65 | | | | 200 | | | | 4,730 | |
| | 23-Jun-11 | | | | 27.00 | | | | 296 | | | | 7,992 | | | | | | 1-Feb-11 | | | | 23.70 | | | | 200 | | | | 4,740 | |
| | 24-May-11 | | | | 27.00 | | | | 200 | | | | 5,400 | | | | | | 1-Feb-11 | | | | 23.70 | | | | 200 | | | | 4,740 | |
| | 2-May-11 | | | | 33.50 | | | | 247 | | | | 8,275 | | | | | | 1-Feb-11 | | | | 23.70 | | | | 500 | | | | 11,850 | |
| | 2-May-11 | | | | 33.75 | | | | 200 | | | | 6,750 | | | | | | 19-Jan-11 | | | | 23.50 | | | | 200 | | | | 4,700 | |
| | 2-May-11 | | | | 34.00 | | | | 200 | | | | 6,800 | | | | | | 10-Jan-11 | | | | 23.50 | | | | 200 | | | | 4,700 | |
| | 29-Apr-11 | | | | 39.50 | | | | 200 | | | | 7,900 | | | | | | | | | | | | | | | | | | | |
Stock Performance
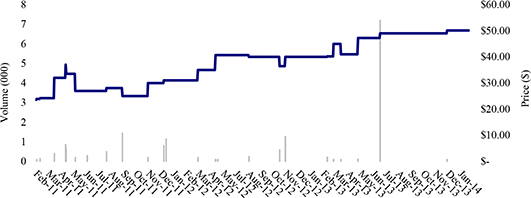
Sources: Data provided by Belk management and Willamette Management Associates calculations.
Willamette Management Associates
EXHIBIT 15 b
BELK, INC.
MARKET APPROACH
PREVIOUS TRANSACTION METHOD
CLASS B SHARES (OTCBB: BLKI.B)
| | | | | | | | | | | | | | | | | | | | | | | | | | | | | | | | | | | | | | | | | | | | | | |
| Class B Shares | | | Class B Shares | | | Class B Shares | |
| Date | | | Price | | | Number of
Shares | | | Transaction
Size | | | Date | | | Price | | | Number of
Shares | | | Transaction
Size | | | Date | | | Price | | | Number of
Shares | | | Transaction
Size | |
| | 7-Jan-14 | | | | 54.98 | | | | 100 | | | | 5,498 | | | | 9-Dec-11 | | | | 30.25 | | | | 700 | | | | 21,175 | | | | 6-May-11 | | | | 33.10 | | | | 200 | | | | 6,620 | |
| | 6-Jan-14 | | | | 51.00 | | | | 200 | | | | 10,200 | | | | 9-Dec-11 | | | | 30.50 | | | | 700 | | | | 21,350 | | | | 6-May-11 | | | | 33.10 | | | | 200 | | | | 6,620 | |
| | 23-Dec-13 | | | | 54.90 | | | | 600 | | | | 32,940 | | | | 9-Dec-11 | | | | 30.40 | | | | 600 | | | | 18,240 | | | | 3-May-11 | | | | 33.40 | | | | 385 | | | | 12,859 | |
| | 19-Dec-13 | | | | 54.98 | | | | 100 | | | | 5,498 | �� | | | 9-Dec-11 | | | | 30.50 | | | | 130 | | | | 3,965 | | | | 3-May-11 | | | | 33.07 | | | | 159 | | | | 5,258 | |
| | 18-Dec-13 | | | | 50.30 | | | | 500 | | | | 25,150 | | | | 8-Dec-11 | | | | 30.10 | | | | 1,500 | | | | 45,150 | | | | 3-May-11 | | | | 33.07 | | | | 293 | | | | 9,690 | |
| | 17-Dec-13 | | | | 55.00 | | | | 200 | | | | 11,000 | | | | 8-Dec-11 | | | | 30.10 | | | | 1,424 | | | | 42,862 | | | | 28-Apr-11 | | | | 35.00 | | | | 602 | | | | 21,070 | |
| | 25-Oct-13 | | | | 50.00 | | | | 500 | | | | 25,000 | | | | 18-Nov-11 | | | | 30.00 | | | | 200 | | | | 6,000 | | | | 28-Apr-11 | | | | 33.89 | | | | 398 | | | | 13,488 | |
| | 22-Oct-13 | | | | 50.00 | | | | 600 | | | | 30,000 | | | | 26-Oct-11 | | | | 30.00 | | | | 838 | | | | 25,140 | | | | 26-Apr-11 | | | | 33.00 | | | | 617 | | | | 20,361 | |
| | 15-Oct-13 | | | | 50.00 | | | | 500 | | | | 25,000 | | | | 26-Oct-11 | | | | 30.00 | | | | 1,000 | | | | 30,000 | | | | 26-Apr-11 | | | | 33.00 | | | | 1,100 | | | | 36,300 | |
| | 25-Sep-13 | | | | 50.00 | | | | 1,100 | | | | 55,000 | | | | 18-Oct-11 | | | | 30.00 | | | | 300 | | | | 9,000 | | | | 26-Apr-11 | | | | 33.00 | | | | 103 | | | | 3,399 | |
| | 23-Sep-13 | | | | 53.00 | | | | 100 | | | | 5,300 | | | | 10-Oct-11 | | | | 30.00 | | | | 400 | | | | 12,000 | | | | 18-Apr-11 | | | | 33.00 | | | | 300 | | | | 9,900 | |
| | 20-Sep-13 | | | | 50.06 | | | | 100 | | | | 5,006 | | | | 22-Sep-11 | | | | 27.50 | | | | 200 | | | | 5,500 | | | | 14-Apr-11 | | | | 33.95 | | | | 200 | | | | 6,790 | |
| | 14-May-13 | | | | 49.55 | | | | 300 | | | | 14,865 | | | | 22-Sep-11 | | | | 27.25 | | | | 300 | | | | 8,175 | | | | 14-Apr-11 | | | | 33.90 | | | | 200 | | | | 6,780 | |
| | 7-May-13 | | | | 49.75 | | | | 800 | | | | 39,800 | | | | 22-Sep-11 | | | | 27.50 | | | | 700 | | | | 19,250 | | | | 4-Apr-11 | | | | 32.32 | | | | 300 | | | | 9,696 | |
| | 26-Apr-13 | | | | 49.00 | | | | 800 | | | | 39,200 | | | | 21-Sep-11 | | | | 26.25 | | | | 550 | | | | 14,438 | | | | 4-Apr-11 | | | | 32.32 | | | | 100 | | | | 3,232 | |
| | 25-Apr-13 | | | | 49.00 | | | | 300 | | | | 14,700 | | | | 21-Sep-11 | | | | 26.25 | | | | 450 | | | | 11,813 | | | | 1-Apr-11 | | | | 32.30 | | | | 100 | | | | 3,230 | |
| | 24-Apr-13 | | | | 49.00 | | | | 400 | | | | 19,600 | | | | 21-Sep-11 | | | | 26.25 | | | | 200 | | | | 5,250 | | | | 1-Apr-11 | | | | 32.26 | | | | 100 | | | | 3,226 | |
| | 28-Feb-13 | | | | 40.50 | | | | 200 | | | | 8,100 | | | | 21-Sep-11 | | | | 29.00 | | | | 500 | | | | 14,500 | | | | 1-Apr-11 | | | | 32.35 | | | | 520 | | | | 16,822 | |
| | 16-Jan-13 | | | | 39.10 | | | | 400 | | | | 15,640 | | | | 31-Aug-11 | | | | 28.50 | | | | 899 | | | | 25,622 | | | | 31-Mar-11 | | | | 32.00 | | | | 260 | | | | 8,320 | |
| | 31-Dec-12 | | | | 40.10 | | | | 300 | | | | 12,030 | | | | 8-Aug-11 | | | | 28.00 | | | | 198 | | | | 5,544 | | | | 31-Mar-11 | | | | 32.00 | | | | 928 | | | | 29,696 | |
| | 4-Dec-12 | | | | 40.00 | | | | 1,000 | | | | 40,000 | | | | 7-Jul-11 | | | | 30.00 | | | | 200 | | | | 6,000 | | | | 31-Mar-11 | | | | 28.00 | | | | 200 | | | | 5,600 | |
| | 1-Oct-12 | | | | 40.00 | | | | 1,200 | | | | 48,000 | | | | 10-Jun-11 | | | | 28.00 | | | | 1,000 | | | | 28,000 | | | | 31-Mar-11 | | | | 27.49 | | | | 175 | | | | 4,811 | |
| | 5-Sep-12 | | | | 40.00 | | | | 300 | | | | 12,000 | | | | 3-Jun-11 | | | | 30.00 | | | | 200 | | | | 6,000 | | | | 31-Mar-11 | | | | 27.49 | | | | 175 | | | | 4,811 | |
| | 31-Aug-12 | | | | 40.00 | | | | 500 | | | | 20,000 | | | | 3-Jun-11 | | | | 29.90 | | | | 150 | | | | 4,485 | | | | 31-Mar-11 | | | | 28.00 | | | | 500 | | | | 14,000 | |
| | 15-Aug-12 | | | | 40.00 | | | | 500 | | | | 20,000 | | | | 3-Jun-11 | | | | 29.50 | | | | 200 | | | | 5,900 | | | | 31-Mar-11 | | | | 28.00 | | | | 100 | | | | 2,800 | |
| | 27-Jul-12 | | | | 40.00 | | | | 700 | | | | 28,000 | | | | 3-Jun-11 | | | | 28.00 | | | | 200 | | | | 5,600 | | | | 31-Mar-11 | | | | 28.00 | | | | 200 | | | | 5,600 | |
| | 11-May-12 | | | | 40.00 | | | | 600 | | | | 24,000 | | | | 27-May-11 | | | | 26.30 | | | | 200 | | | | 5,260 | | | | 30-Mar-11 | | | | 26.00 | | | | 137 | | | | 3,562 | |
| | 10-May-12 | | | | 40.40 | | | | 400 | | | | 16,160 | | | | 27-May-11 | | | | 26.30 | | | | 200 | | | | 5,260 | | | | 30-Mar-11 | | | | 25.99 | | | | 200 | | | | 5,198 | |
| | 9-May-12 | | | | 40.40 | | | | 200 | | | | 8,080 | | | | 27-May-11 | | | | 26.50 | | | | 200 | | | | 5,300 | | | | 30-Mar-11 | | | | 25.98 | | | | 100 | | | | 2,598 | |
| | 27-Apr-12 | | | | 41.70 | | | | 100 | | | | 4,170 | | | | 20-May-11 | | | | 30.00 | | | | 336 | | | | 10,080 | | | | 30-Mar-11 | | | | 25.75 | | | | 100 | | | | 2,575 | |
| | 26-Apr-12 | | | | 41.75 | | | | 1,000 | | | | 41,750 | | | | 13-May-11 | | | | 30.00 | | | | 164 | | | | 4,920 | | | | 25-Mar-11 | | | | 25.50 | | | | 1,000 | | | | 25,500 | |
| | 11-Apr-12 | | | | 41.95 | | | | 300 | | | | 12,585 | | | | 10-May-11 | | | | 33.00 | | | | 1,287 | | | | 42,471 | | | | 25-Mar-11 | | | | 25.25 | | | | 100 | | | | 2,525 | |
| | 27-Mar-12 | | | | 35.31 | | | | 1,100 | | | | 38,841 | | | | 10-May-11 | | | | 32.95 | | | | 396 | | | | 13,048 | | | | 25-Mar-11 | | | | 24.90 | | | | 100 | | | | 2,490 | |
| | 27-Feb-12 | | | | 33.50 | | | | 100 | | | | 3,350 | | | | 10-May-11 | | | | 32.50 | | | | 300 | | | | 9,750 | | | | 23-Mar-11 | | | | 24.85 | | | | 1,000 | | | | 24,850 | |
| | 10-Feb-12 | | | | 31.10 | | | | 800 | | | | 24,880 | | | | 10-May-11 | | | | 32.50 | | | | 400 | | | | 13,000 | | | | 11-Mar-11 | | | | 25.75 | | | | 100 | | | | 2,575 | |
| | 9-Feb-12 | | | | 31.50 | | | | 1,000 | | | | 31,500 | | | | 10-May-11 | | | | 32.60 | | | | 200 | | | | 6,520 | | | | 11-Mar-11 | | | | 25.20 | | | | 100 | | | | 2,520 | |
| | 6-Jan-12 | | | | 30.30 | | | | 300 | | | | 9,090 | | | | 6-May-11 | | | | 32.35 | | | | 100 | | | | 3,235 | | | | 11-Mar-11 | | | | 26.00 | | | | 200 | | | | 5,200 | |
| | 19-Dec-11 | | | | 30.25 | | | | 599 | | | | 18,120 | | | | 6-May-11 | | | | 32.30 | | | | 178 | | | | 5,749 | | | | 24-Feb-11 | | | | 24.45 | | | | 200 | | | | 4,890 | |
| | 19-Dec-11 | | | | 30.20 | | | | 1,000 | | | | 30,200 | | | | 6-May-11 | | | | 32.55 | | | | 200 | | | | 6,510 | | | | 14-Feb-11 | | | | 24.50 | | | | 301 | | | | 7,375 | |
| | 19-Dec-11 | | | | 30.10 | | | | 1,599 | | | | 48,130 | | | | 6-May-11 | | | | 32.55 | | | | 200 | | | | 6,510 | | | | 14-Feb-11 | | | | 24.50 | | | | 600 | | | | 14,700 | |
| | 12-Dec-11 | | | | 30.25 | | | | 201 | | | | 6,080 | | | | 6-May-11 | | | | 33.10 | | | | 200 | | | | 6,620 | | | | 3-Jan-11 | | | | 24.50 | | | | 500 | | | | 12,250 | |
| | 12-Dec-11 | | | | 30.25 | | | | 799 | | | | 24,170 | | | | 6-May-11 | | | | 33.07 | | | | 200 | | | | 6,614 | | | | 3-Jan-11 | | | | 24.50 | | | | 500 | | | | 12,250 | |
| | 12-Dec-11 | | | | 30.25 | | | | 1,000 | | | | 30,250 | | | | | | | | | | | | | | | | | | | | | | | | | | | | | | | | | |
Stock Performance
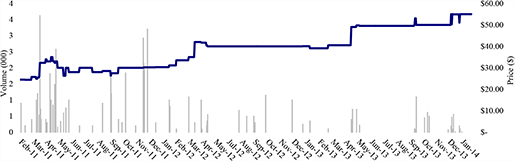
Sources: Data provided by Belk management and Willamette Management Associates calculations.
Willamette Management Associates
EXHIBIT 15 c
BELK, INC.
MARKET APPROACH
PREVIOUS TRANSACTION METHOD
VALUE SUMMARY
AS OF FEBRUARY 1, 2014
| | | | | | | | |
Class A Shares (OTCBB: BLKI.A) [a] | | | | |
High | | $ | 50.10 | | | | | |
Low | | | 23.40 | | | | | |
Average | | | 31.25 | | | | | |
Median | | | 30.00 | | | | | |
Most Recent Trade [c] | | | 50.10 | | | | | |
Number of Shares Issued and Outstanding | | | 40,063,026 | | | | | |
Percentage of Outstanding | | | 97.74 | % | | | | |
Number of Shares Issued and Outstanding | | | | | | | 40,990,916 | |
Multiplied by the Most Recent Price (Weighted Average) | | | | | | $ | 50.21 | |
| | | | | | | | |
Indicated Fair Market Value of Equity [d,e] | | | | | | $ | 2,058,154 | |
| | | | | | | | |
| | | | |
Class B Shares (OTCBB: BLKI.B) [b] | |
High | | $ | 55.00 | |
Low | | | 24.45 | |
Average | | | 33.88 | |
Median | | | 32.00 | |
Most Recent Trade [c] | | | 54.98 | |
Number of Shares Issued and Outstanding | | | 927,890 | |
Percentage of Outstanding | | | 2.26 | % |
Stock Performance
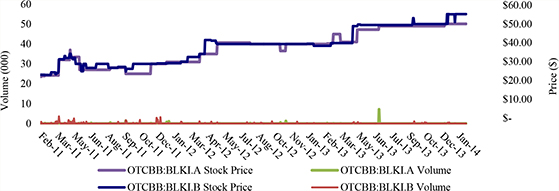
| | | | |
Class A Share Volume [f] | | | |
2014 Total Number of Shares | | | — | |
2014 Total Dollar Volume | | $ | — | |
2013 Total Number of Shares | | | 7,800 | |
2013 Total Dollar Volume | | $ | 379,175 | |
2012 Total Number of Shares | | | 4,950 | |
2012 Total Dollar Volume | | $ | 173,890 | |
2011 Total Number of Shares | | | 7,953 | |
2011 Total Dollar Volume | | $ | 154,298 | |
2010 Total Number of Shares | | | 23,807 | |
2010 Total Dollar Volume | | $ | 520,593 | |
2009 Total Number of Shares | | | 11,011 | |
2009 Total Dollar Volume | | $ | 100,663 | |
| | | | |
Class B Share Volume [f] | | | |
2014 Total Number of Shares | | | 300 | |
2014 Total Dollar Volume | | $ | 15,698 | |
2013 Total Number of Shares | | | 7,500 | |
2013 Total Dollar Volume | | $ | 371,799 | |
2012 Total Number of Shares | | | 10,400 | |
2012 Total Dollar Volume | | $ | 394,436 | |
2011 Total Number of Shares | | | 37,351 | |
2011 Total Dollar Volume | | $ | 1,110,791 | |
2010 Total Number of Shares | | | 46,232 | |
2010 Total Dollar Volume | | $ | 1,009,930 | |
2009 Total Number of Shares | | | 43,685 | |
2009 Total Dollar Volume | | $ | 423,632 | |
Footnotes:
| [a] | Class A shares trading data from 10 January 2011, through 11 December 2013. |
| [b] | Class B shares trading data from 3 January 2011, through 7 January 2014. |
| [c] | Most recent trade prior to the valuation date for each class; as shown on Exhibits 15 a and 15 b. |
| [d] | Based on the number of outstanding shares multiplied by the most recent trading price; yields a minority market value of equity ($s in thousands). |
| [e] | On a nonmarketable, noncontrolling interest basis. |
| [f] | Data based on calendar years. |
Sources: Exhibits as cited, trading data provided by Belk management, and Willamette Management Associates calculations.
Willamette Management Associates
EXHIBIT 16 a
BELK, INC.
DISCOUNT FOR LACK OF MARKETABILITY
SUMMARY
| | | | |
DLOM | | Indicated
DLOM
Adjustment | | References |
Restricted Stock Studies | | -13.0% to -45.0% | | Exhibit 16 b |
Pre-IPO Studies | | -27.7% to -76.2% | | Exhibit 16 c |
Results from the Johnson Study | | -8.3% to -27.7% | | Exhibit 16 d |
Results from an Empirical Regression Formula from the Silber Study | | -15% | | Exhibit 16 e |
Selected DLOM | | -15% | | |
DLOM = Discount for lack of marketability
IPO = Initial public offering
Sources: Exhibits as cited and Willamette Management Associates calculations.
Willamette Management Associates
EXHIBIT 16 b
BELK, INC.
DISCOUNT FOR LACK OF MARKETABILITY
ANALYSIS OF RESTRICTED STOCK TRANSACTION STUDIES
| | | | | | | | |
Studies Based on Restricted Stock (From Pratt) [a] | | Years Covered
In Study | | | Average
Discount | |
SEC Institutional Investor Study (Overall Average) | | | 1966-1969 | | | | -25.80 | % |
SEC Institutional Investor Study (Nonreporting OTC Companies) | | | 1966-1969 | | | | -32.60 | % |
Gelman Study | | | 1968-1970 | | | | -33.00 | % |
Trout Study | | | 1968-1972 | | | | -33.45 | % |
Moroney Study | | | 1969-1972 | | | | -35.60 | % |
Maher Study | | | 1969-1973 | | | | -35.43 | % |
Standard Research Consultants | | | 1978-1982 | | | | -45.00 | % |
Willamette Management Associates | | | 1981-1984 | | | | -31.20 | % |
Hertzel & Smith | | | 1980-1987 | | | | -13.50 | % |
Silber Study | | | 1981-1988 | | | | -33.75 | % |
Management Planning, Inc. | | | 1980-1996 | | | | -27.00 | % |
FMV Opinions, Inc. | | | 1980-2008 | | | | -21.20 | % |
Bajaj, Denis, Ferris, And Sarin | | | 1990-1995 | | | | -22.20 | % |
Bruce Johnson Study | | | 1991-1995 | | | | -20.00 | % |
Columbia Financial Advisors | | | 1996-1997 | | | | -21.00 | % |
Columbia Financial Advisors | | | 1997-1998 | | | | -13.00 | % |
Liquistat Study | | | 2005-2006 | | | | -32.80 | % |
| | | | | | | | |
Indicated Range of Discount for Lack of Market ability | | | | | | | -13.0% to - 45.0 | % |
OTC = Over-the-counter
Footnote:
[a] Shannon P. Pratt and Alina V. Niculita,Valuing a Business, 5th ed. (New York: McGraw Hill, 2008), 431.
Sources: As cited and Willamette Management Associates calculations.
Willamette Management Associates
EXHIBIT 16 c
BELK, INC.
DISCOUNT FOR LACK OF MARKETABILITY
ANALYSIS OF PRE-IPO STUDIES
| | | | | | | | |
Studies of Private Transactions Prior to an Initial Public Offering (IPO) | | | | Years Covered
In Study | | Median
Discount | |
Robert W. Baird & Co. | | [a] | | 1980-1981 | | | -68.00 | % |
Robert W. Baird & Co. | | [a] | | 1985-1986 | | | -43.00 | % |
Robert W. Baird & Co. | | [a] | | 1987-1989 | | | -43.00 | % |
Robert W. Baird & Co. | | [a] | | 1989-1990 | | | -40.00 | % |
Robert W. Baird & Co. | | [a] | | 1990-1992 | | | -33.00 | % |
Robert W. Baird & Co. | | [a] | | 1992-1993 | | | -43.00 | % |
Robert W. Baird & Co. | | [a] | | 1994-1995 | | | -47.00 | % |
Robert W. Baird & Co. | | [a] | | 1995-1997 | | | -41.00 | % |
Robert W. Baird & Co. | | [a] | | 1997-2000 | | | -52.00 | % |
Willamette Management Associates | | [a] | | 1975-1978 | | | -52.50 | % |
Willamette Management Associates | | [a] | | 1979 | | | -62.70 | % |
Willamette Management Associates | | [a] | | 1980-1982 | | | -56.50 | % |
Willamette Management Associates | | [a] | | 1983 | | | -60.70 | % |
Willamette Management Associates | | [a] | | 1984 | | | -73.10 | % |
Willamette Management Associates | | [a] | | 1985 | | | -42.60 | % |
Willamette Management Associates | | [a] | | 1986 | | | -47.40 | % |
Willamette Management Associates | | [a] | | 1987 | | | -43.80 | % |
Willamette Management Associates | | [a] | | 1988 | | | -51.80 | % |
Willamette Management Associates | | [a] | | 1989 | | | -50.30 | % |
Willamette Management Associates | | [a] | | 1990 | | | -48.50 | % |
Willamette Management Associates | | [a] | | 1991 | | | -31.80 | % |
Willamette Management Associates | | [a] | | 1992 | | | -51.70 | % |
Willamette Management Associates | | [a] | | 1993 | | | -53.30 | % |
Willamette Management Associates | | [a] | | 1994 | | | -42.00 | % |
Willamette Management Associates | | [a] | | 1995 | | | -58.70 | % |
Willamette Management Associates | | [a] | | 1996 | | | -44.30 | % |
Willamette Management Associates | | [a] | | 1997 | | | -35.20 | % |
Willamette Management Associates | | [a] | | 1998 | | | -49.40 | % |
Willamette Management Associates | | [a] | | 1999 | | | -27.70 | % |
Willamette Management Associates | | [a] | | 2000 | | | -31.90 | % |
Willamette Management Associates | | [a] | | 2001 | | | NM | [c] |
Willamette Management Associates | | [a] | | 2002 | | | -76.20 | % |
Valuation Advisors | | [b] | | 2003 | | | -61.37 | % |
Valuation Advisors | | [b] | | 2004 | | | -57.86 | % |
Valuation Advisors | | [b] | | 2005 | | | -45.45 | % |
Valuation Advisors | | [b] | | 2006 | | | -56.27 | % |
Valuation Advisors | | [b] | | 2007 | | | -54.17 | % |
Valuation Advisors | | [b] | | 2008 | | | -41.18 | % |
Valuation Advisors | | [b] | | 2009 | | | -34.87 | % |
Valuation Advisors | | [b] | | 2010 | | | -51.88 | % |
Valuation Advisors | | [b] | | 2011 | | | -62.10 | % |
Valuation Advisors | | [b] | | 2012 | | | -44.78 | % |
| | | | | | | | |
Indicated Range of Discount for Lack of Market ability | | | -27.7% to - 76.2 | % |
NM = Not meaningful
Footnotes:
| [a] | Shannon P. Pratt and Alina V. Niculita,Valuing a Business, 5th ed. (New York: McGraw Hill, 2008), 431. |
| [b] | Brian K. Pearson, “Valuation Advisors’ Lack of Marketability Discount Study,” Business Valuation Resources Teleconference, August 23, 2007 (1995-2006); Valuation Advisors database (2007-2012). Median of 1-2 year period data. |
| [c] | The median discount for lack of marketability for 2001 was -195.8% and deemed not meaningful (NM) for purposes of this analysis. |
Sources: As cited and Willamette Management Associates calculations.
Willamette Management Associates
EXHIBIT 16 d
BELK, INC.
DISCOUNT FOR LACK OF MARKETABILITY
RESULTS FROM THE JOHNSON STUDY ANALYSIS
AS OF FEBRUARY 1, 2014
| | | | |
Overall Results of Johnson Study [a] | |
Average Adjustment | | | -20.2 | % |
Range of Adjustments | | | -60.0 to 10.0 | % |
Standard Deviation | | | 16.0 | % |
Number of Transactions | | | 72 | |
| | | | | | | | | | | | |
| | | Belk, Inc. | |
Total Sales | | Average
Discount | | | Parameter
$000 | | | Indicated
Adjustment | |
$0.0 to $10.0 million | | | -23.5 | % | | | | | | | | |
$10.0 to $50.0 million | | | -19.4 | % | | | | | | | | |
$50.0 million to $200.0 million | | | -17.7 | % | | | | | | | | |
$200.0+ million | | | -13.0 | % | | | 4,038,118 | | | | -13.0 | % |
| | | |
Total Net Income | | | | | | | | | |
Negative | | | -22.5 | % | | | | | | | | |
$0.0 to $5.0 million | | | -26.0 | % | | | | | | | | |
$5.0 to $10.0 million | | | -18.1 | % | | | | | | | | |
$10.0+ million | | | -6.3 | % | | | 158,533 | | | | -6.3 | % |
| | | |
Transaction Size | | | | | | | | | |
$0.0 to $5.0 million | | | -26.7 | % | | | | | | | | |
$5.0 to $10.0 million | | | -20.9 | % | | | | | | | | |
$10.0 to $25.0 million | | | -17.0 | % | | | | | | | | |
$25.0+ million | | | -10.8 | % | | | 1,358,245 | | | | -10.8 | % |
| | | |
Net Income Margin | | | | | | | | | |
Negative | | | -22.5 | % | | | | | | | | |
0.0% to 5.0% | | | -23.7 | % | | | 3.9 | % | | | -23.7 | % |
5.0% to 10.0% | | | -15.2 | % | | | | | | | | |
10.0+% | | | -11.6 | % | | | | | | | | |
Indicated Range of DLOM | | | | | | | -6.3% to -23.7 | % | | | | |
DLOM Adjustment for No Liquid Public Market [b] | | | | | | | -2.0% to -4.0 | % | | | | |
Indicated Range of DLOM | | | | | | | -8.3% to -27.7 | % | | | | |
DLOM = Discount for lack of marketability
Footnotes:
| [a] | See source document for overall results from the Johnson Study. |
| [b] | Based on Belk-specific marketability factors, market-based research, and Willamette Management Associates estimate. |
Source: Bruce Johnson, “Quantitative Support for Discounts for Lack of Marketability,”Business Valuation Review (December 1999), 153-154.
Willamette Management Associates
EXHIBIT 16 e
BELK, INC.
DISCOUNT FOR LACK OF MARKETABILITY
EMPIRICAL REGRESSION APPROACH TO MARKETABILITY ADJUSTMENT
| | | | |
| | | SILBER REGRESSION FOR DLOM | |
Subject Firm: | | | BELK, INC. | |
Exchange: | | | OTC | |
Symbol: | | | BLKI.A and BLKI.B | |
Freely Traded Value: ($Millions) [a] | | | 1,973 | |
As of Date: | | | 2/1/2014 | |
Total Ownership Units Outstanding [a] | | | 40,990,916 | |
Total Market Capitalization ($Millions) | | | 1,973 | |
Block Size of Restricted Shares [b] | | | 4,099,092 | |
Silber’s Regression Equation
LN(RPRS) = 4.33 + 0.036 x LN(REV) - 0.142 x Ln(RBRT) + 0.174 x DERN + 0.332 x DCUST
| | | | |
| Inputs to the Model | | | |
| |
LN(REV) | | | 4038.1 | + |
LN(RBRT) | | | 10.0 | % |
DERN | | | 1 | |
DCUST | | | 0 | |
Ln Base | | | 2.7183 | |
LN(RPRS) | | | 5.1299 | |
| | | 85.2 | % |
| |
DLOM - PUBLIC LIQUID MARKET | | | | |
High Range | | | -38.5 | % |
Median | | | -14.8 | % |
Low Range | | | 8.9 | % |
Indicated Discount | | | -12.0 | % |
|
DLOM ADJUSTMENT FOR NO LIQUID PUBLIC MARKET | |
High Range | | | -4.0 | % |
Mid-Range | | | -3.0 | % |
Low Range | | | -2.0 | % |
Indicated DLOM Adjustment | | | -3.0 | % |
Total Indicated DLOM | | | -15.0 | % |
Selected DLOM | | | -15 | % |
Comments
Revenue of the Issuing Firm in Millions
(Lower Boundary - $1 Mill; Upper Boundary - $1 Bill)
Percent of Restricted Block Relative to Total Stock Positive Earnings Factor (1 if Positive) Customer Relationship Factor (1 if Investor is a Customer) Natural Log Base
Natural Log of the Relative Price of the Restricted Stock
Median Percent Value of Restricted Stock to Market Price Quote
Indicated Discount with No Liquid Public Market
Standard Deviation Found in Study
Discount Adjusted for Lack of Marketability Based on Silber Data
| | | | |
| Indicated Adjustment for No Liquid Public Market |
| | | | | | | | |
| |
| Boundary Conditions: | | Range | |
1) Cost to Create Market (Based on Exit Costs) | | | -1 | % | | | -2 | % |
2) Marketing Period Factors | | | -1 | % | | | -2 | % |
3) Other Marketability Restrictions | | | 0 | % | | | 0 | % |
| | | | | | | | |
Total Net DLOM Adjustment | | | -2 | % | | | -4 | % |
DLOM = Discount for lack of marketability
Footnotes:
| [a] | As shown on Exhibit 1. |
| [b] | Assumed block size of 10 percent of the total outstanding shares. |
Source: William L. Silber, “Discounts on Restricted Stock: The Impact of Illiquidity on Stock Prices,”Financial Analysts Journal(July-August 1991), 60-64.
Willamette Management Associates
EXHIBIT 17
BELK, INC.
RECENT HISTORY OF BELK TENDER OFFERS
| | | | | | | | | | | | | | | | | | | | | | | | |
Date | | Authorized
Tender ($) | | | Authorized
Number of
Shares [a] | | | Actual
Tender ($) | | | Price
Per Share | | | Actual Shares
Tendered [a] | | | 5-Year
CAGR
in Price | |
May-06 | | $ | 49,400,000 | | | | 2,600,000 | | | $ | 39,097,383 | | | $ | 19.00 | | | | 2,057,757 | | | | | |
Apr-07 | | | 49,600,000 | | | | 1,600,000 | | | | 24,226,004 | | | | 31.00 | | | | 781,484 | | | | | |
May-08 | | | 25,600,000 | | | | 1,000,000 | | | | 22,347,724 | | | | 25.60 | | | | 872,958 | | | | | |
May-09 | | | 5,950,000 | | | | 500,000 | | | | 2,875,802 | | | | 11.90 | | | | 241,664 | | | | | |
May-10 | | | 74,880,000 | | | | 2,880,000 | | | | 51,416,066 | | | | 26.00 | | | | 1,977,541 | | | | | |
May-11 | | | 74,140,000 | | | | 2,200,000 | | | | 54,996,445 | | | | 33.70 | | | | 1,631,942 | | | | | |
May-12 | | | 99,960,000 | | | | 2,450,000 | | | | 102,046,716 | | | | 40.80 | | | | 2,501,145 | | | | | |
May-13 | | | 100,000,000 | | | | 2,000,000 | | | | 101,911,450 | | | | 50.00 | | | | 2,038,229 | | | | | |
May-14 | | | | | | | | | | | | | | | 48.10 | [b] | | | | | | | 32.2 | % |
CAGR = Compound annual growth rate
SEC = U.S. Securities and Exchange Commission
Footnotes:
| [a] | Both Class A and Class B shares of Belk, Inc., stock. |
| [b] | Anticipated tender offer purchase price based on our valuation of Belk, Inc., common stock as of the valuation date, as shown on Exhibit 1. |
Sources: Data provided by Belk management and SEC filings.
Willamette Management Associates
APPENDIX B – DISCOUNTFOR LACKOF MARKETABILITY
DISCOUNTFOR LACKOF MARKETABILITY
INTRODUCTION
The consensus of valuation analysts, judicial decisions, and empirical studies is that an investment is worth more if it is readily marketable and, conversely, worth less if it is not readily marketable. The difference in price an investor will pay for a liquid asset compared to an otherwise comparable illiquid asset is often substantial. This difference in price is commonly referred to as the “discount for lack of marketability” (DLOM). That is, the DLOM measures the difference in the expected price of (1) a liquid asset (that is, the benchmark price measure) and (2) an otherwise comparable illiquid asset (that is, the valuation subject).
This discussion presents a summary of (1) the concepts of investment liquidity and illiquidity (i.e., the conceptual basis for the DLOM), (2) the various empirical and theoretical models that are commonly used to estimate the DLOM, (3) the application of the DLOM to the valuation of an illiquid business or security, (4) the factors that influence the magnitude of the DLOM, and (5) the current controversies regarding DLOM analyses.
The Concept of Investment Liquidity
The concept of investment marketability relates to the liquidity of an investment—that is, how quickly and certainly the investment can be converted into cash at the owner’s discretion. Investors value liquidity. Rational investors will pay a price premium for liquidity. Conversely, rational investors will demand a price discount for lack of liquidity. Fundamentally, the security of a closely held company is not as liquid as the otherwise comparable security of a publicly traded company. That is, a closely held company security does not have the same degree of marketability as the otherwise comparable publicly traded security.
The termsmarketability andliquidity are sometimes used interchangeably. However, differences exist between the two terms.Barron’s Dictionary of Business Terms defines marketability and liquidity as follows:
Marketability. Speed and ease with which a particular security may be bought and sold. A stock that has a large amount of shares outstanding and is actively traded is highly marketable and also liquid. In common use,marketability is interchangeable withliquidity, butliquidity implies the preservation of value when a security is bought or sold.6
For purposes of this discussion only, the termsmarketability andlack of marketability will apply to a security, a block of securities, or a fractional ownership interest in a business. The termsliquidity andlack of liquidity (orilliquidity) will apply to an overall business enterprise or a controlling ownership interest in a business.
The rationale for a DLOM was discussed in a 1983 valuation text authored by Lawrence H. Averill Jr., Dean of the School of Law of the University of Arkansas at Little Rock:
| 6 | John Downs and Jordan Elliot Goodman, eds.,Barron’s Dictionary of Finance and Investment Terms, 6th ed. (Hauppauge, NY: Barron’s, 2003), 406. |
The lack of marketability problem is inherent in the valuation of all business interests that are not actively traded on recognized markets. The poor marketability of nontraded business interests stems from several factors. First, most of these businesses are small, family-owned and run operations. Such businesses run great risk of failure. The greater the risk, the lower the value. Second, these interests lack liquidity. There is no large pool of potential buyers for these interests when they come on the market. The longer it takes to sell an asset, the lower the value will be as compared to more actively tradable assets. Such a business interest must be sold at a substantial discount in order to attract buyers, as recognized by court decisions. The actual amount of the discount, of course, will vary from situation to situation.7
The investment attribute of marketability is not an either/or proposition. That is, there are varying degrees of investment marketability. In fact, there is a spectrum of investment marketability, ranging from fully marketable to fully nonmarketable. An ownership interest of an actively traded security can typically be converted into cash within three business days of the sell decision. This is the typical investment benchmark for a fully marketable security. At the other end of the investment marketability spectrum is an ownership interest in a privately owned company that pays no dividends or other distributions, requires capital contributions, and limits ownership of the company to certain individuals. Of course, there exists a myriad of positions in between these two extremes in the investment marketability spectrum.
Reasons to Apply a Valuation Adjustment
In the U.S. public capital markets, a security holder can sell an actively traded security over the telephone in seconds, usually at or within a small fraction of a percent of the last price at which the security traded. These public market transactions occur at a very small commission cost. And, the investor will typically receive the transaction proceeds following a federally mandated settlement period of three business days.
By contrast, the population of potential buyers for most closely held investment securities is a small fraction of the population of potential buyers for publicly traded investment securities. In fact, it is illegal for a person or a company to sell closely held securities to the general public without first registering the security offering with either the Securities Exchange Commission (SEC) or the state corporation commission. And, such a security offering registration is an expensive and time-consuming process. Furthermore, a noncontrolling stockholder cannot register closely held corporation shares for public trading. Only the closely held corporation itself can register its shares for public trading.
Besides the problems associated with selling closely held stock, it is also difficult for investors to hypothecate closely held stock. That is, the value of closely held shares is further impaired by the unwillingness of banks and other lending institutions to accept such securities (as they would accept public stock) as loan collateral.
Because of these differences in the ability to sell or hypothecate closely held stock versus publicly traded shares, empirical evidence suggests that the DLOM for closely held corporation securities (compared to comparable publicly traded securities) tends to cluster in the range of 25 to 50 percent. Of course, each nonmarketable security should be analyzed on the basis of its individual facts and circumstances, which may justify a DLOM either above or below this typical range of price adjustments.
| 7 | Lawrence H. Averill Jr.,Estate Valuation Handbook (New York: John Wiley & Sons, 1983), 177. |
Baseline from Which to Apply the DLOM
In the valuation of a privately owned business or security interest, the analyst typically applies some combination of the three generally accepted business valuation approaches: (1) market approach, (2) income approach, and (3) asset-based approach. Depending on the individual valuation variables used, the market approach and income approach conclude value indications on either a controlling ownership interest basis or a noncontrolling ownership interest basis. As it is commonly applied, the asset-based approach concludes a value indication on a controlling ownership interest basis. For all three business valuation approaches, the resulting value indications are typically concluded on a marketable ownership interest basis.
In this closely held security valuation context, the degree of marketability in the value indication is influenced by the individual valuation variables used in each approach or method. Therefore, value indications are only as marketable as the market-derived empirical evidence on which the valuation analyses are based. As discussed above, the sale of actively traded securities can occur within minutes of making the decision to sell; and the sale proceeds (i.e., cash) can be received within three business days from the decision to sell. If the subject security is not as marketable as the guideline pricing evidence considered in the closely held security valuation, then the application of a DLOM may be appropriate.
The magnitude of a subject-specific DLOM will depend on the facts and circumstances related to (1) the subject closely held business and (2) the subject nonmarketable security. This discussion summarizes the most relevant company-specific factors that analysts consider in the selection of a subject-specific DLOM.
Security-specific and company-specific factors are not the only reason to apply a DLOM. Certain engagement-specific factors will also affect the appropriate magnitude of the DLOM. One important engagement-specific factor that the analyst should consider is the particular level of value sought in a subject closely held security valuation. The next two sections discuss the DLOM in the context of two common levels of value: (1) the noncontrolling ownership interest level of value and (2) the controlling ownership interest level of value.
DLOM for a Noncontrolling Ownership Interest
There is a continuous spectrum of value influences with regard to investment marketability. This continuous spectrum of value influences ranges from (1) absolute control/perfect marketability (equal to the marketability of actively traded stock listed on a public stock exchange) to (2) absolute lack of control/completely nonmarketable (e.g., imposed by contractual restrictions that limit the potential buyers and dictate the sale price). It is impossible to describe all of the discrete steps along the ownership control/marketability continuum. However, these two investment attributes represent a continuous spectrum of combined valuation adjustments.
The generally accepted business valuation approaches can conclude a value indication on either (1) a controlling ownership interest basis or (2) a noncontrolling ownership interest basis. For example, the market approach/guideline merged and acquired company method generally concludes a value indication on a controlling ownership interest basis. Alternatively, the market approach/guideline publicly traded company method generally concludes a value indication on a noncontrolling ownership interest basis.
Therefore, when the engagement objective is to estimate value on a nonmarketable, noncontrolling ownership interest basis, the application of a DLOM may be appropriate. In addition, the application of a discount for lack of control (DLOC) may also be appropriate, depending on which valuation methods (and valuation variables) the analysts used.
With the exception of the “cost to obtain liquidity” studies, the empirical studies summarized in this discussion are based on applying a DLOM to a noncontrolling ownership interest. The cost to obtain liquidity studies, alternatively, are appropriately considered when the subject security interest is a controlling ownership interest. It is noteworthy that the average DLOM from each of the empirical studies discussed herein is based on securities trading at different levels on the ownership control/marketability spectrum. Therefore, the analyst should understand and compare the marketability of the subject security to the marketability of the securities analyzed in the various DLOM empirical studies. This concept of comparing relative marketability (and other investment attributes) will be reiterated throughout this discussion.
DLOM EMPIRICAL MODELS
The Restricted Stock Studies
Publicly traded companies may raise capital by completing a private placement of debt or equity securities. In an equity private placement, a company can issue either registered stock or unregistered (i.e., restricted) stock to an accredited investor. Registered stock includes the shares of publicly traded companies that can be freely traded in the open market. Unregistered shares of stock are not registered for trading on a stock exchange. Unregistered shares cannot be freely traded in the open market. When publicly traded companies issue restricted (unregistered) stock, the restricted stock is typically sold at a price discount compared to the price of the (registered) publicly traded stock. Companies are willing to accept a price discount on the sale of their restricted stock. This is because the time and cost of registering the new stock with the SEC would make the stock issuance/capital formation impractical. These observed price discounts (i.e., public stock price compared to same company private stock price) indicate a DLOM. These stock price discount data are the basis for the restricted stock studies discussed below.
SECAccounting Release No. 113 indicates that the DLOM in restricted stock transactions is “frequently substantial”:
Restricted securities are often purchased at a discount, frequently substantial, from the market price of outstanding unrestricted securities of the same class. This reflects the fact that securities which cannot be readily sold in the public market are less valuable than securities which can be sold, and also the fact that by the direct sale of restricted securities, sellers avoid the expense, time and public disclosure which registration entails.8
SEC Rule 1449 governs the purchase and sale of stock issued in unregistered private placements. According to the SEC, “When you acquire restricted securities or hold control securities, you must find an exemption from the SEC’s registration requirements to sell them in the marketplace. Rule 144 allows public resale of restricted and control securities if a number of conditions are met.”10
| 8 | Securities and Exchange Commission,Accounting Series Release No. 113: Statement Regarding Restricted Securities (Chicago: Commerce Clearing House, Federal Securities Law Reports, 1977), 62, 285. |
| 9 | 17 CFR 230.144 (revised April 1, 1990). |
| 10 | SEC Website: http://www.sec.gov/investor/pubs/rule144.htm |
The conditions mentioned in SEC Rule 144 relate to: (1) investment holding period, (2) adequate current information, (3) a trading volume formula, (4) ordinary brokerage transactions, and (5) filing of a notice with the SEC. The investment holding period restrictions on the transfer of restricted stock eventually lapse, usually after 12 months.11 At that point, the trading volume formula is typically the most restrictive sale condition of SEC Rule 144. The trading volume formula allows the subject securities to be “dribbled out” in the marketplace. Depending on the size of the block of the subject securities, the dribble-out formula may require the investor to sell small portions of the subject securities over a multi-year period. Rather than dribble out the sale of the restricted securities, the owner of restricted stock can also sell his or her securities in a privately negotiated transaction, subject to the Securities Act of 1933, Section 4(1) and Section 4(2).
Until 1995, restricted stock sale transactions had to be reported to the SEC. Therefore, such restricted stock sale transactions were a matter of public record. Since 1995, analysts have collected restricted stock sale transaction data from private sources. Therefore, there is available a body of data on the prices of private transactions in restricted securities. These transaction price data can be used for comparison with prices of the same company unrestricted securities eligible for trading on the open market. The analysis of this body of restricted stock empirical pricing evidence is discussed below.
SEC Institutional Investor Study
In an SEC study of institutional investor actions, one of the topics was the amount of the price discount at which restricted stock transactions took place. This price discount was measured by comparing private transaction prices to the prices of identical but unrestricted stock on the open market.12
The SEC study concluded an average price discount of 24 percent for all transactions of restricted stock—that is, a price discount to the corresponding unrestricted stock. In addition, the study concluded generally higher price discounts for restricted stocks that would trade on the over-the-counter market (OTC) once the restrictions expired. These higher price discounts were compared to stocks that would trade on the New York Stock Exchange (NYSE) or the American Stock Exchange (ASE). For stocks that would trade on the OTC when the restrictions expired, the average price discount was approximately 35 percent.
In Revenue Ruling 77–287, the Internal Revenue Service (the “Service”) acknowledged the conclusions of the SECInstitutional Investor Study and the prices of restricted securities purchased by investment companies as part of the “relevant facts and circumstances that bear upon the worth of restricted stock.” The Service described the purpose of Revenue Ruling 77–287 as: “to provide information and guidance to taxpayers, [Service], and others concerned with the valuation, for Federal tax purposes, of securities that cannot be immediately resold because they are restricted from resale pursuant to Federal security laws.”13
One of the outcomes of the SECInstitutional Investor Studywas SECAccounting Series Release (ASR) No. 113, dated October 13, 1969, andNo. 118, dated December 23, 1970. ASR No 113 and No. 118 require investment companies registered under the Investment Company Act of 1940 to disclose their policies for the cost and valuation of their restricted securities. The result of this disclosure requirement was that an ongoing body of empirical pricing data became available. These data included the relationship between restricted stock prices and same company freely traded stock prices. Numerous analysts have analyzed these data to provide empirical benchmarks for estimating the DLOM.
| 11 | On February 18, 1997, the SEC adopted amendments to reduce the holding period requirements under Rule 144 of the Securities Act from two years to one year for the resale of limited amounts of restricted securities (the amendment became effective April 29, 1997). |
| 12 | “Discounts Involved in Purchases of Common Stock,” in U.S. 92nd Congress, 1st Session, House,Institutional Investor Study Report of the Securities and Exchange Commission, (Washington: Government Printing Office, March 10, 1971, 5:2444–2456, Document No. 92–64, Part 5). |
| 13 | Revenue Ruling 77–287, 1977–2 C.B. 319, Section I. |
Gelman Study
In 1972, Milton Gelman published the results of his study of the prices paid for restricted securities by four closed-end investment companies specializing in restricted securities investments.14 Based on an analysis of 89 restricted stock sale transactions between 1968 and 1970, Gelman concluded that both the mean and median price discounts were 33 percent. Gelman also concluded that almost 60 percent of the restricted stock sales were priced at discounts of 30 percent or higher.
Trout Study
In a study of restricted stock purchases by mutual funds from 1968 to 1972, Robert Trout constructed a financial model to estimate the price discount appropriate for a private company’s stock.15 Trout’s multiple regression model was based on pricing data from 60 restricted stock transactions. The Trout multiple regression analysis concluded an average price discount of approximately 33.5 percent for restricted stock (compared to the same company freely traded counterpart stock). As the SEC study had previously concluded, Trout also concluded that companies with stocks listed on national exchanges experienced lower price discounts on their restricted stock transactions than did companies with stocks traded over-the-counter.
Moroney Study
In 1973, Robert E. Moroney published the results of his study of the prices paid for restricted securities by 10 registered investment companies.16 The study analyzed 146 restricted stock purchases. The average price discount was approximately 35.6 percent, and the median price discount was approximately 33.0 percent. Moroney pointed out:
It goes without saying that each cash purchase of a block of restricted equity securities fully satisfied the requirement that the purchase price be one, “at which the property would change hands between a willing buyer and a willing seller, neither being under any compulsion to buy or sell and both having reasonable knowledge of relevant facts.” Reg. Sec. 20.2031–1(b).17
Moroney contrasted the empirical evidence of the actual sale transactions with the lower average DLOM conclusions allowed in most prior court decisions on gift and estate tax matters. He pointed out, however, that the empirical evidence on the prices of restricted stocks was not available as a benchmark for quantifying the DLOM at the time of these prior court cases. Moroney suggested that higher DLOM adjustments be allowed in future judicial decisions now that the relevant empirical pricing data are available. As Moroney put it:
Obviously the courts in the past have overvalued minority interests in closely held companies for federal tax purposes. But most (probably all) of those decisions were handed down without benefit of the facts of life recently made available for all to see.
| 14 | Milton Gelman, “An Economist-Financial Analyst’s Approach to Valuing Stock of a Closely Held Company,”Journal of Taxation (June 1972): 353–4. |
| 15 | Robert R. Trout, “Estimation of the Discount Associated with the Transfer of Restricted Securities,”Taxes (June 1977): 381–5. |
| 16 | Robert E. Moroney, “Most Courts Overvalue Closely-Held Stocks,”Taxes (March 1973): 144–56. |
Some appraisers have for years had a strong gut feeling that they should use far greater discounts for nonmarketability than the courts had allowed. From now on those appraisers need not stop at 35 percent merely because it’s perhaps the largest discount clearly approved in a court decision. Appraisers can now cite a number of known arm’s length transactions in which the discount ranged up to 90 percent.18
Maher Study
J. Michael Maher published the results of another restricted stock study in 1976.19 The Maher study methodology was similar to the Moroney study methodology in that it compared prices paid for restricted stocks with the market prices of the same company unrestricted stock. He concluded that mutual funds were not purchasing restricted securities during 1974 and 1975, which were recessionary years for the stock market. Therefore, the empirical data that Maher actually used covered the five-year period from 1969 through 1973.
The Maher study concluded that “the mean DLOM for the years 1969–73 amounted to 35.43 percent.”20 Maher further eliminated the top and bottom 10 percent of the restricted stock purchases in an effort to remove especially high- and low-risk situations. When the “outlier” data were removed, the result of this study was almost identical with a mean price discount of 34.73 percent.
Maher concluded:
The result I have reached is that most appraisers underestimate the proper DLOM. The results seem to indicate that this discount should be about 35 percent. Perhaps this makes sense because by committing funds to restricted common stock, the willing buyer (a) would be denied the opportunity to take advantage of other investments, and (b) would continue to have his investment at the risk of the business until the shares could be offered to the public or another buyer is found.
The 35 percent discount would not contain elements of a discount for a minority interest because it is measured against the current fair market value of securities actively traded (other minority interests). Consequently, appraisers should also consider a discount for a minority interest in those closely held corporations where a discount is applicable.21
Standard Research Consultants Study
In 1983, Standard Research Consultants (SRC) analyzed private placements of restricted common stock to test the then-current applicability of the above-described SEC study.22 SRC studied 28 private placements of restricted common stock from October 1978 through June 1982. Price discounts concluded in the SRC study ranged from 7 percent to 91 percent, with a median price discount of 45 percent.
| 19 | J. Michael Maher, “Discounts for Lack of Marketability for Closely-Held Business Interests,”Taxes (September 1976): 562–71. |
| 22 | “Revenue Ruling 77–287 Revisited,”SRC Quarterly Reports (Spring 1983): 1–3. |
Willamette Management Associates Study
Willamette Management Associates analyzed private placements of restricted stock for the period of January 1, 1981, through May 31, 1984. The early part of this unpublished study overlapped the last part of the SRC study. However, relatively few restricted stock sale transactions took place during the overlap period. Most of the restricted stock sale transactions in the Willamette Management Associates study occurred in 1983. Willamette Management Associates identified 33 transactions during that period that could reasonably be classified as arm’s-length and for which the price of the restricted shares could be compared directly with the price of trades in identical but unrestricted shares of the same company at the same time. Compared to the prices of their freely tradable counterparts, the median discount for the 33 restricted stock transactions was 31.2 percent.
The slightly lower average percentage discounts for private placements during this time may be attributable to the somewhat depressed prices in the public stock market, which in turn reflected the recessionary economic conditions prevalent during most of the period of the study.
Hertzel and Smith Study
Michael Hertzel and Richard L. Smith conducted a restricted stock study covering 106 private placements occurring between January 1, 1980, and May 31, 1987. The average sale proceeds in the private placement transaction sample equaled $11.4 million, and the average equity market value of the private placement transaction sample equaled $94.7 million.23 Hertzel and Smith conducted their study primarily to test whether private placement price discounts reflect a resolution of asymmetric information about the subject company value. With regard to information effects, Hertzel and Smith found evidence that price discounts reflected the costs incurred by private investors to assess the firm value. In other words, companies that are difficult to analyze (e.g., privately owned companies and companies with significant intangible assets) received a larger DLOM compared to companies that are more easily analyzed (e.g., publicly traded companies that are followed by equity analysts).
The Hertzel and Smith study showed an average price discount for the private placements of 20.14 percent. They noted:
Private placement discounts in our sample vary widely. Thirty-nine of the placements in our sample were made at discounts of more than 25 percent and 8 were at premiums of more than 10 percent. Premiums appear to reflect the value of control, cash infusions by investors who already own much of the outstanding stock, and market price declines between the time the placement price is negotiated and when it is announced to the market. Discounts appear to be related to such factors as resale restrictions, placement size, and type of investor.24
Hertzel and Smith analyzed the difference in the price discount between (1) the private placements of restricted shares and (2) the private placement of unrestricted shares. They concluded, “We find an additional discount of 13.5 percent for placements ofRestricted Shares.”25 Additional discussion of this restricted stock study is presented below in the section Current Controversies Regarding DLOM Analyses.
| 23 | M. Hertzel and R.L. Smith, “Marketability Discounts and Shareholder Gains for Placing Equity Privately,”Journal of Finance (June 1993). |
Silber Study
In 1991, William L. Silber published the results of his analysis of 69 private placements of public corporation common stock between 1981 and 1988.26 Silber concluded that the average price discount was 33.75 percent, a conclusion that is consistent with earlier restricted stock studies.
Silber also concluded that the size of the price discount tended to be higher for private placements that were larger, as measured as a percentage of the shares outstanding. Silber found a small effect on the price discount on the basis of the size of the company, as measured by revenue. “Tripling the revenues from the sample mean of $40 million to $120 million increases the relative price of the restricted shares by only 2.9 points (from 71.7 to 74.6).”27
Bajaj, Denis, Ferris, and Sarin Study
This study (the “Bajaj study”)28 analyzed 88 private placements that occurred between January 1, 1990, and December 31, 1995. The Bajaj study separately analyzed (1) registered private placement issues and (2) unregistered private placement issues. Based on their analysis the authors concluded that (1) the average price discount for unregistered issues was 28.1 percent, (2) the average price discount for registered issues was 14.0 percent, and (3) the overall average price discount was 22.2 percent.
The authors of the Bajaj study hypothesized that the observed private placement price discounts were due to factors other than illiquidity. Specifically, they attributed the observed price discounts to the following four factors: (1) the fraction of total shares offered in the private placement; (2) business risk, as measured by price volatility in the issuer’s publicly traded shares; (3) financial distress, as measured by Altman’s Z-score; and (4) total transaction proceeds from the private placement. According to the Bajaj study, “controlling for all other factors influencing private placement discounts, an issuer would have to concede an additional discount of 7.23 percent simply to compensate the buyer for lack of marketability.”29 An additional analysis of this study is presented in the Current Controversies Regarding DLOM Analyses section below.
Johnson Study
Bruce Johnson conducted a restricted stock study that attempted to provide a link between (1) the wide range of price discounts observed in previous restricted stock studies and (2) subject company characteristics.30 Johnson analyzed 72 restricted stock transactions that occurred between 1991 and 1995. The average price discount reported in the Johnson study was 20 percent, or 22 percent after excluding bank and real estate investment trust companies.
| 26 | William L. Silber, “Discounts on Restricted Stock: The Impact of Illiquidity on Stock Prices,”Financial Analysts Journal (July–August 1991): 60–64. |
| 28 | Mukesh Bajaj, David J. Denis, Stephen P. Ferris and Atulya Sarin, “Firm Value and Marketability Discounts,”The Journal of Corporation Law (Fall 2001). |
| 30 | Bruce Johnson, “Restricted Stock Discounts, 1991–95,”Shannon Pratt’s Business Valuation Update (March 1999). |
The subject company factors considered in the Johnson study were (1) current year net income, (2) previous year net income, (3) current year revenue, and (4) transaction size. According to Johnson, “an appraiser should consider some of the factors that influence the magnitude of the discount which include profitability, size, holding period and transaction amount.”31
Management Planning Study
Management Planning, Inc., performed a study titled “Analysis of Restricted Stocks of Public Companies: 1980–1996.”32 This study analyzed 53 restricted stock sale transactions. In selecting the 53 transaction samples, Management Planning eliminated potential transactions based on the following factors: (1) companies that suffered a loss in the fiscal year preceding the private transaction; (2) companies defined as “start-up” companies (i.e., companies having revenue of less than $3 million); and (3) stock transactions that were known to have registration rights. This study concluded an average price discount of 27 percent.
Daniel McConaughy, David Cary, and Chao Chen expanded the Management Planning study by analyzing factors that contributed to the reported price discounts.33 The underlying data analyzed in the McConaughy, Cary, and Chen study were the same transactions analyzed in the Management Planning study (i.e. the 53 private placements of restricted stock that occurred during 1980 to 1996). According to the McConaughy, Cary, and Chen Study, “This study shows that the discounts required by investors are positively related to business risk, market risk, and degree of illiquidity. The two more important factors are business risk, in the form of size in sales and consistent historical sales growth, which are associated with lower discounts; and market risk, in the form of stock price volatility, which is associated with higher discounts.”34
FMV Study
FMV Opinions, Inc., examined restricted stock transactions from 1980 through 2008.35 This analysis of 566 transactions resulted in a mean price discount36 of 21.25 percent and a median price discount of 20.04 percent. The FMV study also examined the relationship between the observed price discount and several descriptive factors. These descriptive factors included: (1) the industry, (2) the trading market (exchange traded or over-the-counter), (3) the percentage size of the block, (4) the total market value of the subject corporation, and (5) the volatility of the security. According to the FMV study, the DLOM was higher for over-the-counter traded securities than for securities traded on a large national exchange. This relationship is particularly relevant for the shares of closely held companies, which typically are more comparable to shares traded on over-the-counter exchanges.
The FMV study is updated periodically.37 The FMV study concludes that certain company-specific factors affect the magnitude of the DLOM. Analysis of the companies in the FMV DLOM database reveals certain relationships. The table below illustrates these relationships by separating the FMV study companies into quintiles based on the observed price discount.
| 32 | Robert P. Oliver and Roy H. Meyers, “Discounts Seen in Private Placements of Restricted Stock: The Management Planning, Inc. Long-Term Study (1980-1996),” Chapter 5 in Robert F. Reilly and Robert P. Schweihs, eds.,Handbook of Advanced Business Valuation (New York: McGraw-Hill, 2000). |
| 33 | Daniel L. McConaughy, David Cary, and Chao Chen, “Factors Affecting Discounts on Restricted Stock,”Valuation Strategies (November/December 2000). |
| 35 | Lance Hall, “Looking at the New Data in the FMV Restricted Stock Study™ and How to Use it!” Business Valuation Resources Teleconference, November 11, 2009. |
| 36 | Based on the “subsequent month discount,” which is defined as “the percentage difference between the offering price and the high-low average for the month subsequent to the month of the transaction.” (FMV Study FAQs at www.bvmarketdata.com) |
| 37 | The FMV study is available as a searchable database at www.bvmarketdata.com. |
FMV Restricted Stock Study Results: Characteristics of
High Price Discount vs. Low Price Discount Transactions
1980-2008
| | | | | | | | | | | | | | | | | | | | |
Quintile: | | 1 | | | 2 | | | 3 | | | 4 | | | 5 | |
Percentage Price Discount | | | 1.6 | % | | | 10.5 | % | | | 16.7 | % | | | 27.3 | % | | | 43.7 | % |
Market Value ($000) | | | 166,358 | | | | 162,682 | | | | 110,814 | | | | 68,824 | | | | 44,309 | |
Total Assets ($000) | | | 66,025 | | | | 65,752 | | | | 39,844 | | | | 18,245 | | | | 9,434 | |
Book Value ($000) | | | 37,988 | | | | 30,916 | | | | 22,669 | | | | 8,443 | | | | 4,978 | |
Revenues ($000) | | | 23,335 | | | | 29,136 | | | | 28,811 | | | | 14,118 | | | | 7,764 | |
Percentage Block Size | | | 7.9 | % | | | 9.9 | % | | | 10.1 | % | | | 9.4 | % | | | 12.4 | % |
Market to Book Ratio | | | 3.5 | | | | 3.9 | | | | 3.7 | | | | 5.8 | | | | 6.0 | |
Share Price Volatility | | | 68.3 | % | | | 67.5 | % | | | 71.8 | % | | | 80.2 | % | | | 104.2 | % |
Price Per Share ($) | | | 12.49 | | | | 11.07 | | | | 12.02 | | | | 8.15 | | | | 8.17 | |
Source: Lance Hall, “Looking at the New Data in the FMV Restricted Stock Study™ and How to Use It!” Business Valuation Resources Teleconference, November 11, 2009.
The most notable trend that can be observed from the above table is that larger price discounts are present in smaller, more highly volatile companies. This trend is corroborated by the various other restricted stock studies summarized above. Another important finding of the FMV study is that block size is directly correlated with price discount. According to Espen Robak, “the discount should increase with the block size.”38
Columbia Financial Advisors, Inc., Studies
Columbia Financial Advisors, Inc. (CFAI) conducted a study of the sale of restricted securities over the period January 1, 1996, through April 30, 1997. The restricted stock sale transactions were identified from the Securities Data Corporation U.S. New Issues private placement database. A total of 123 private placements were included in this database for the selected time period. A total of 100 transactions were eliminated for various reasons, leaving 23 transactions included in the CFAI study. The observed price discounts ranged from 0.8 to 67.5 percent for all 23 transactions, with an average DLOM of approximately 21 percent and a median DLOM of 14 percent.
These observed price discounts are generally lower than the price discounts recorded in the earlier studies discussed above. One explanation for the price discount decrease is the increase in volume of privately placed stock (Rule 144(a)) in the period studied. Also, during the CFAI study observation period, it was generally known that the SEC-required holding period was scheduled to change from two years to one year in 1997.
Using the same methodology and sources, CFAI conducted a second study. The second study attempted to identify the impact of the increased liquidity resulting from the change in the SEC-required holding period. CFAI examined common equity private placements during the period January 1, 1997, through December 31, 1998. There were a total of 270 common stock private placements during that time. A total of 255 transactions were eliminated for various reasons, leaving 15 transactions for the study. The price discounts ranged from 0 to 30 percent, with an average DLOM of approximately 13 percent and a median DLOM of 9 percent. These price discounts are generally lower than the price discounts observed in the earlier CFAI study. This result is most likely due to the change in the SEC-required holding period from two years to one year.
| 38 | Espen Robak, “Liquidity and Levels of Value: A New Theoretical Framework,”Shannon Pratt’s Business Valuation Update (October 2004). |
LiquiStat Study
The LiquiStat study, conducted by Pluris Valuation Advisors (Pluris), was published in 2007.39 Pluris identified two weaknesses with prior restricted stock studies: (1) the lack of measurable parameters with regard to the price discount (e.g., was the observed price discount the result of company size or information asymmetry between the buyer and the seller?) and (2) the impossibility of establishing two distinct data sets, one completely liquid and one completely illiquid. That is, Pluris reasoned that the observed price discounts from previous restricted stock studies were likely affected by factors unrelated to illiquidity, such as: (1) compensation for control and monitoring, (2) capital scarcity effects, and (3) information asymmetry effects.
To overcome these perceived weaknesses, Pluris analyzed the pricing of restricted stock in investor-to-investor trades—that is, transactions (1) not involving the issuer or an affiliate of the issuer and (2) not raising new capital for the issuer. According to Espen Robak of Pluris, “Clearly, the private placement process has facets, beyond just illiquidity, that affect discounts. The solution, or at least part of the solution, might be to look at the pricing of restricted stock in investor-to-investor trades, not involving the issuer or an affiliate of the issuer and not raising capital for the issuer.”40
The data analyzed was from the LiquiStat database of private sales transactions created by Pluris. As of the date of the Pluris study, the database contained transactions facilitated by Restricted Stock Partners through its Restricted Stock Trading Network. There were 61 transactions analyzed in the LiquiStat study. The 61 transactions analyzed in the LiquiStat study were completed at an average price discount of 32.8 percent, and a median price discount of 34.6 percent. The average number of days remaining before the sold shares became available to trade in the public markets was 144 days.
| 39 | Espen Robak, CFA, “Lemons or Lemonade? Fresh Look at Restricted Stock Discounts,”Valuation Strategies (January/February 2007). |
| 32 | Espen Robak, CFA, “Discounts for Illiquid Shares and Warrants: TheLiquiStat Database of Transactions on theRestricted Securities Trading Network (White Paper), January 22, 2007. |
Restricted Stock Study Conclusions
The 17 restricted stock studies reported above cover several hundred transactions spanning the late 1960s through 2008. The results of these various restricted stock studies are summarized in the table below:
Restricted Stock Studies
Summary of Observed Price Discounts
| | | | | | | | |
Restricted Stock Study | | Observation Period
of Study | | | Observed Average
Price Discount | |
SEC Overall Average | | | 1966–69 | | | | 25.8 | % |
SEC Nonreporting OTC Companies | | | 1966–69 | | | | 32.6 | % |
Milton Gelman | | | 1968–70 | | | | 33.0 | % |
Robert R. Trout | | | 1968–72 | | | | 33.5 | % |
Robert E. Moroney | | | 1969–72 | | | | 35.6 | % |
J. Michael Maher | | | 1968–73 | | | | 35.4 | % |
Standard Research Consultants | | | 1978–82 | | | | 45.0 | % |
Willamette Management Associates | | | 1981–84 | | | | 31.2 | % |
Hertzel & Smith | | | 1980–87 | | | | 13.5 | % |
William L. Silber | | | 1981–88 | | | | 33.8 | % |
Bajaj, Denis, Ferris, and Sarin [a] | | | 1990–95 | | | | 22.2 | % |
Johnson Study | | | 1991–95 | | | | 20.0 | % |
Management Planning, Inc. | | | 1980–96 | | | | 27.0 | % |
FMV Opinions, Inc.[b] | | | 1980–08 | | | | 21.2 | % |
Columbia Financial Advisors, Inc. | | | 1996–97 | | | | 21.0 | % |
Columbia Financial Advisors, Inc. | | | 1997–98 | | | | 13.0 | % |
LiquiStat | | | 2005–06 | | | | 32.8 | % |
| [a] | This study attributes price discount to factors other than marketability (i.e. compensation for the cost of assessing the quality of the firm and for the anticipated costs of monitoring the future decisions of its managers. |
| [b] | Represents results of latest published study. The database is routinely updated and available for purchase at www.bvmarketdata.com. |
These restricted stock studies have generally concluded a decrease in the average DLOM after 1990. The restricted stock transactions analyzed in the studies covering the 1968 to 1988 period (where the average DLOM was approximately 35 percent) were generally less marketable than the restricted stocks analyzed after 1990 (where the average DLOM ranged between 20 percent and 25 percent). Valuation analysts typically attribute this decrease in observed price discounts to (1) the increase in volume of privately placed stock under SEC Rule 144(a) and (2) the change in the minimum SEC-required holding period under Rule 144—from two years to one year—that took place as of April 29, 1997.41 Increased volume was the result of a Rule 144 amendment in 1990 that allowed qualified institutional investors to trade unregistered securities among themselves. By increasing the potential buyers of restricted securities, the marketability of these securities generally increased. Both of these explanations suggest that investors have not changed the way they value marketability. Rather, the marketability of restricted securities has increased. As it became easier to find a buyer for restricted securities after 1990, the average restricted stock price discount decreased. The same trend occurred after the SEC-required holding period decreased from two years to one year in 1997.
On December 17, 2007, the SEC issued revisions to Rules 144 and 145.42 The revisions included shortening the holding period requirement for restricted securities of issuers that are subject to the reporting requirements of the Securities Exchange Act of 1934 (“reporting companies”) from one year to six months. “Under the amended Rules 144, after six months, if the issuer is a reporting company, . . . nonaffiliates may sell restricted securities without further limitations, including manner-of-sale or volume limitations.”43 The holding period remains at one year for nonreporting issuers. This amendment became effective February 15, 2008. Thus far, only the FMV Study includes any transactions subject to the six-month holding period.
| 41 | See, for example, “Restricted Stock Discounts, 1991–95,” Bruce Johnson,Shannon Pratt’s Business Valuation Update (March 1999); Rod Burkert, “Cure for Declining Discounts, Deconstruct the Studies,”Trusts & Estates (March 2004); and Robert Reilly, “Willamette Management Associates’ Discount for Lack of Marketability Study for Marital Dissolution Valuations,”American Journal of Family Law (Spring 2005). |
| 42 | 17 CFR Parts 230 and 239, December 17, 2007. |
| 43 | John A. Menicucci Jr., “SEC Adopts Amendments to Rule 144 & Rule 145,”The Nebraska Lawyer (April 2008). |
As the market for restricted stocks has evolved and become more liquid, it is increasingly important for analysts to consider the facts and circumstances of each restricted stock study. In particular, it is important to compare the market for the subject closely held company with the market for restricted securities. If the expected holding period for the stock in a closely held company is two years or greater, it may be more meaningful to select a DLOM based on the restricted stock studies conducted prior to 1990 (in addition to considering other theoretical and empirical research). Alternatively, if the subject closely held stock is likely to be liquidated within six months or one year, the post-1990 studies may be more meaningful.
Another characteristic of the restricted stock studies is the wide range in observed price discounts within each study. Although the average price discounts calculated in the restricted stock studies are similar, the range of price discounts observed in each of the studies was quite large, ranging from a price premium to price discounts approaching 90 percent.
The wide range of price discounts has two implications. First, a large range could lower the reliability of the data. Second, and more importantly, it suggests that valuation analysts should use professional judgment to select a price discount for a given subject company. The most likely explanation for the wide range in observed price discounts is the myriad of company-specific and security-specific factors that affect the DLOM. Therefore, while a DLOM is clearly indicated from the restricted stock studies, it is up to the analyst to consider how the subject interest relates to the restricted stock average price discount observed in the restricted stock studies.
Restricted shares of public corporation stock may not (temporarily) be traded directly on a stock exchange. However, the investor has certainty that, in a relatively short time period, the trading restrictions will lapse. The shares of stock of a closely held corporation, on the other hand, may never be traded directly on a stock exchange. The prospect of any level of efficient marketability is much lower for closely held companies shares compared to restricted public company shares. Therefore, the appropriate DLOM related to closely held corporation shares (or to similar closely held investments) is generally considered to be greater than the DLOM indicated by restricted stock studies.
The Pre-IPO Studies
The second type of empirical analysis that is used to quantify the appropriate DLOM for closely held stock is the pre-IPO study. A pre-IPO study examines arm’s-length sale transactions in the stock of a closely held company that has subsequently achieved a successful initial public offering of its stock. In a pre-IPO study, the DLOM is quantified by analyzing (with various adjustments) the difference between (1) the public market price at which a stock was issued at the time of the IPO and (2) the private market price at which a stock was sold (in an arm’s-length transaction) prior to the IPO. There are three published pre-IPO studies. These three studies are summarized below.
Emory Studies
A number of studies were conducted under the direction of John D. Emory, currently president of Emory Business Valuation, LLC, in Milwaukee, Wisconsin.44 The pre-IPO studies covered various time periods from 1980 through 2000.45 Each study eliminated from consideration (1) development stage companies; (2) companies with a history of real operating losses; (3) companies whose IPO price was less than $5 per share; (4) foreign companies; and (5) banks, saving and loans, real estate investment trusts, and utilities. With the exception of the 1997 through 2002 study, the basic methodology for the various pre-IPO studies was identical. The 1997 through 2002 study was expanded to focused on sale transactions of common and convertible preferred stock, and did not exclude companies on the basis of their financial strength
The population of companies in each study consisted entirely of initial public offerings during the respective period in which Baird & Company either participated in or received prospectuses. The prospectuses of these 4,088 offerings were analyzed to determine the relationship between (1) the price at which the stock was initially offered to the public and (2) the price at which the latest private transaction took place (up to five months prior to the IPO).
| 44 | Mr. Emory was formerly with Robert W. Baird & Co. where the studies prior to April 1997 were conducted. |
| 45 | John D. Emory, “The Value of Marketability as Illustrated in Initial Public Offerings of Common Stock—January 1980 through June 1981,”Business Valuation News (September 1985): 21–24, also inASA Valuation (June 1986): 62–66; “The Value of Marketability as Illustrated in Initial Public Offerings of Common Stock, January 1985 through June 1986,”Business Valuation Review (December 1986): 12–15; “The Value of Marketability as Illustrated in Initial Public Offerings of Common Stock (August 1987–January 1989),”Business Valuation Review (June 1989): 55–57; “The Value of Marketability as Illustrated in Initial Public Offerings of Common Stock, February 1989–July 1990,”Business Valuation Review (December 1990): 114–16; “The Value of Marketability as Illustrated in Initial Public Offerings of Common Stock, August 1990 through January 1992,”Business Valuation Review (December 1992): 208–212; “The Value of Marketability as Illustrated in Initial Public Offerings of Common Stock, February 1992 through July 1993,”Business Valuation Review (March 1994): 3–5; “The Value of Marketability as Illustrated in Initial Public Offerings of Common Stock, January 1994 through June 1995,”Business Valuation Review (December 1995): 155–160; “The Value of Marketability as Illustrated in Initial Public Offerings of Common Stock, November 1995 through April 1997,”Business Valuation Review (September 1997): 123–131; John D. Emory Sr., F.R. Dengel III, and John D. Emory Jr., “The Value of Marketability as Illustrated in Initial Public Offerings of Common Stock, May 1997 through December 2000,Business Valuation Review (September 2001): 15–19; and “Underlying Data in Excel Spreadsheet for 1980-2000 Pre-IPO Discount Studies, as Adjusted October 10, 2002,” located at http://www.emorybizval.com/valuation-studies.shtml. |
| 46 | See John D. Emory Sr., F.R. Dengel III, and John D. Emory Jr., “Discounts for Lack of Marketability: Emory Pre-IPO Discount Studies 1980–2000, as Adjusted October 10, 2002,” www.emoryco.com/valuation-studies.shtml. |
The mean price discount and median price discount from all of the transactions analyzed in the Emory pre-IPO DLOM studies equal 46 percent and 47 percent, respectively.46 The fact that these average price discounts are a little more than 10 percentage points greater than the average price discounts indicated by the restricted stock studies is predictable. This is because the pre-IPO stock sale transactions occurred when there was not yet any established secondary market for the subject stock. A summary of the results of each of the Emory pre-IPO studies is presented in the table below.
Emory Pre-IPO Studies
Indicated DLOM Results
| | | | | | | | | | | | | | | | |
| | | Number of
Prospectuses
Reviewed | | | Number of
Qualifying
Transactions | | | Indicated Price Discount | |
Pre-IPO Study | | | | Mean | | | Median | |
1980–1981 | | | 97 | | | | 12 | | | | 59 | % | | | 68 | % |
1985–1986 | | | 130 | | | | 19 | | | | 43 | % | | | 43 | % |
1987–1989 | | | 98 | | | | 21 | | | | 38 | % | | | 43 | % |
1989–1990 | | | 157 | | | | 17 | | | | 46 | % | | | 40 | % |
1990–1991 | | | 266 | | | | 30 | | | | 34 | % | | | 33 | % |
1992–1993 | | | 443 | | | | 49 | | | | 45 | % | | | 43 | % |
1994–1995 | | | 318 | | | | 45 | | | | 45 | % | | | 47 | % |
1995–1997 | | | 732 | | | | 84 | | | | 43 | % | | | 41 | % |
1997–2000 [a] | | | 1,847 | | | | 266 | | | | 50 | % | | | 52 | % |
| [a] | This is an expanded study. The expanded study focused on sale transactions of common and convertible preferred stock, and did not exclude companies on the basis of their financial strength. Note: The results above are from “Underlying Data in Excel Spreadsheet for 1980–2000 Pre-IPO Discount Studies, as Adjusted October 10, 2002,” located at www.emoryco.com/valuation-studies.shtml. |
Emory makes the following observations:
Since an initial public offering often takes four or five months from conception to completion, the transactions mentioned in the prospectuses in the study would almost certainly have reflected the likelihood of marketability and any other value adjustment associated with being a public company. . . . The final question to be answered is that if the kinds of discounts found in this study occur where marketability is probable, but not a certainty, how much greater should discounts be for the more typical company’s stock that has no marketability, little if any chance of ever becoming marketable, and is in a neutral to unpromising situation? . . . [I]t is apparent that the lack of marketability is one of the more important components of value, and the public marketplace emphasizes this point.47
In September 2000, Emory and his associates published a similar pre-IPO study that dealt with dot-com companies only.48 This pre-IPO study covered the period from May 1997 through March 2000. This study (as adjusted) analyzed a total of 51 sales transactions, 38 of which were convertible preferred stock transactions and 13 of which were common stock transactions and option transactions. For the 51 transactions, the study calculated an average price discount of 48 percent and a median price discount of 51 percent. For the 38 convertible preferred stock transactions, the study calculated a 47 percent average price discount and a 51 percent median price discount. For the 13 common stock transactions and option transactions, the study concluded an average price discount of 53 percent and a median price discount of 51 percent.
| 48 | John D. Emory Sr., F.R. Dengel III, and John D. Emory Jr., “The Value of Marketability as Illustrated in Initial Public Offerings of Dot-Com Companies, May 1997 through March 2000,”Business Valuation Review (September 2000): 111–121; and “Underlying Data in Excel Spreadsheet for 1980-2000 Pre-IPO Discount Studies, as Adjusted October 10, 2002,” located at www.emoryco.com/valuation-studies.shtml. |
Valuation Advisors Studies
Valuation Advisors, LLC (VA), maintains a database that includes over 3,500 pre-IPO transactions that occurred within two years of an IPO.49 The pre-IPO transactions are arranged into five time periods: four three-month intervals for the 12 months immediately before the IPO, and a single period for the time frame from one to two years before the IPO. The pre-IPO transactions are also arranged by type of security (i.e., stock, convertible preferred stock, or option).
VA performed a pre-IPO DLOM study for each of the years between 1995 and 2012. The table below summarizes the results of the VA pre-IPO studies.
Valuation Advisors Pre-IPO Study
Indicated Median DLOM Results
| | | | | | | | | | | | | | | | | | | | | | | | |
| | | Period Before IPO in Which Transaction Occurred | | | | |
IPO Year | | 0-3 Months | | | 4-6 Months | | | 7-9 Months | | | 10-12 Months | | | 1-2 years | | | Number of
Transactions | |
1995 | | | 37.82 | % | | | 28.62 | % | | | 60.40 | % | | | 50.33 | % | | | 60.64 | % | | | 34 | |
1996 | | | 30.83 | % | | | 52.97 | % | | | 56.37 | % | | | 69.38 | % | | | 71.81 | % | | | 270 | |
1997 | | | 34.18 | % | | | 50.00 | % | | | 67.12 | % | | | 76.01 | % | | | 80.00 | % | | | 212 | |
1998 | | | 23.35 | % | | | 46.67 | % | | | 68.93 | % | | | 71.41 | % | | | 71.91 | % | | | 212 | |
1999 | | | 30.77 | % | | | 53.89 | % | | | 75.00 | % | | | 76.92 | % | | | 82.00 | % | | | 694 | |
2000 | | | 28.70 | % | | | 45.08 | % | | | 61.51 | % | | | 68.92 | % | | | 76.64 | % | | | 653 | |
2001 | | | 14.74 | % | | | 33.17 | % | | | 33.38 | % | | | 52.06 | % | | | 51.61 | % | | | 115 | |
2002 | | | 6.15 | % | | | 17.33 | % | | | 21.88 | % | | | 39.51 | % | | | 55.00 | % | | | 81 | |
2003 | | | 28.77 | % | | | 22.30 | % | | | 38.36 | % | | | 39.71 | % | | | 61.37 | % | | | 123 | |
2004 | | | 16.67 | % | | | 22.68 | % | | | 40.00 | % | | | 56.25 | % | | | 57.86 | % | | | 334 | |
2005 | | | 14.75 | % | | | 26.10 | % | | | 41.68 | % | | | 46.11 | % | | | 45.45 | % | | | 296 | |
2006 | | | 23.47 | % | | | 20.69 | % | | | 40.23 | % | | | 46.51 | % | | | 56.27 | % | | | 264 | |
2007 | | | 12.67 | % | | | 32.55 | % | | | 43.69 | % | | | 56.00 | % | | | 54.17 | % | | | 459 | |
2008 | | | 20.00 | % | | | 24.21 | % | | | 45.85 | % | | | 52.17 | % | | | 41.18 | % | | | 41 | |
2009 | | | 6.16 | % | | | 31.85 | % | | | 26.82 | % | | | 41.00 | % | | | 34.87 | % | | | 108 | |
2010 | | | 15.81 | % | | | 29.89 | % | | | 44.42 | % | | | 47.54 | % | | | 51.88 | % | | | 358 | |
2011 | | | 23.27 | % | | | 34.62 | % | | | 43.26 | % | | | 50.78 | % | | | 62.10 | % | | | 281 | |
2012 | | | 18.86 | % | | | 24.07 | % | | | 28.90 | % | | | 35.48 | % | | | 44.78 | % | | | 292 | |
1995-2012 Average | | | 21.50 | % | | | 33.15 | % | | | 46.54 | % | | | 54.23 | % | | | 58.86 | % | | | | |
2008-2012 Average | | | 16.82 | % | | | 28.93 | % | | | 37.85 | % | | | 45.39 | % | | | 46.96 | % | | | | |
Source: Brian K. Pearson. “Valuation Advisors’ Lack of Marketability Discount Study™.”Business Valuation Resources Teleconference, August 23, 2007 (1995-2006); Valuation Advisors database (2007-2012).
As indicated in the above table, the DLOM observed in 2001 and 2002 was lower than the DLOM observed in the prior years studied. According to VA:
The lower marketability discounts in 2001 reflects favorably on the quality of the companies that went public (that is, riskier companies generally couldn’t do an IPO in 2001). This doesn’t necessarily mean that marketability discounts are now lower. In fact, some might suggest this data means that the discounts are even higher for smaller companies, since they may have an even more remote chance of going public. Also, it’s generally harder to sell companies in a recessionary environment. Whatever your position on this issue, it is clear that even “higher quality” companies’ shares changed hands while still privately owned with significant marketability discounts.50
| 49 | The database is available on a subscription basis from www.bvmarketdata.com. |
| 50 | Brian K. Pearson, “The 2001 Marketability Discount Study.” retrieved February 2, 2007, from http://www.valuationpros.com/ipo.html. |
Willamette Management Associates Studies
Willamette Management Associates completed 18 pre-IPO DLOM studies covering the period of 1975 through 1997. Willamette Management Associates recently completed an additional pre-IPO DLOM study encompassing the five years 1998 through 2002. As in the previous pre-IPO studies, the 1998–2002 pre-IPO study included only private market stock sale transactions that were conducted on an arm’s-length basis. The transactional data analyzed in the 1998–2002 pre-IPO study included (1) sales of closely held corporation stock in private placements and (2) repurchases of treasury stock by the closely held corporation. All transactions involving the granting of employee, executive, or other compensation-related stock options were eliminated from consideration in the 1998–2002 study. All transactions involving stock sales to corporate insiders or other related parties were eliminated from consideration in the 1998–2002 study. These transactions were eliminated from considerations unless Willamette Management Associates could verify (by a telephone interview with at least one principal party) that the stock sale transaction was, in fact, a bona fide, arm’s-length transaction.51
The results of the Willamette Management Associates studies are presented in the following table. The average price discounts varied from period to period. In most cases, the average price discounts concluded in the Willamette Management Associates pre-IPO study were greater than the average price discounts concluded in the restricted stock DLOM studies. The difference is most likely due to the fact that—unlike pre-IPO transactions—restricted stock transactions involve companies that already have an established public trading market.
| 51 | The specific analytical procedures performed in the various Willamette Management Associates pre-IPO DLOM studies are detailed in Shannon P. Pratt, Robert F. Reilly, and Robert P. Schweihs,Valuing a Business, 4th ed. (New York: McGraw-Hill, 2000), 408–411. |
Willamette Management Associates Pre-IPO Studies
Summary of Price Discounts for Private Transaction P/E Multiples
Compared to Initial Public Offering P/E Multiples
Adjusted for Changes in Industry P/E Multiples
| | | | | | | | | | | | | | | | | | | | | | | | |
Time
Period
Analyzed | | Number of
Companies
Analyzed | | | Number of
Transactions
Analyzed | | | Standard
Mean Price
Discount | | | Trimmed
Mean Price
Discount* | | | Median
Price
Discount | | | Price
Discount
Standard
Deviation | |
1975–78 | | | 17 | | | | 31 | | | | 34.0 | % | | | 43.4 | % | | | 52.5 | % | | | 58.6 | % |
1979 | | | 9 | | | | 17 | | | | 55.6 | % | | | 56.8 | % | | | 62.7 | % | | | 30.2 | % |
1980–82 | | | 58 | | | | 113 | | | | 48.0 | % | | | 51.9 | % | | | 56.5 | % | | | 29.8 | % |
1983 | | | 85 | | | | 214 | | | | 50.1 | % | | | 55.2 | % | | | 60.7 | % | | | 34.7 | % |
1984 | | | 20 | | | | 33 | | | | 43.2 | % | | | 52.9 | % | | | 73.1 | % | | | 63.9 | % |
1985 | | | 18 | | | | 25 | | | | 41.3 | % | | | 47.3 | % | | | 42.6 | % | | | 43.5 | % |
1986 | | | 47 | | | | 74 | | | | 38.5 | % | | | 44.7 | % | | | 47.4 | % | | | 44.2 | % |
1987 | | | 25 | | | | 40 | | | | 36.9 | % | | | 44.9 | % | | | 43.8 | % | | | 49.9 | % |
1988 | | | 13 | | | | 19 | | | | 41.5 | % | | | 42.5 | % | | | 51.8 | % | | | 29.5 | % |
1989 | | | 9 | | | | 19 | | | | 47.3 | % | | | 46.9 | % | | | 50.3 | % | | | 18.6 | % |
1990 | | | 17 | | | | 23 | | | | 30.5 | % | | | 33.0 | % | | | 48.5 | % | | | 42.7 | % |
1991 | | | 27 | | | | 34 | | | | 24.2 | % | | | 28.9 | % | | | 31.8 | % | | | 37.7 | % |
1992 | | | 36 | | | | 75 | | | | 41.9 | % | | | 47.0 | % | | | 51.7 | % | | | 42.6 | % |
1993 | | | 51 | | | | 110 | | | | 46.9 | % | | | 49.9 | % | | | 53.3 | % | | | 33.9 | % |
1994 | | | 31 | | | | 48 | | | | 31.9 | % | | | 38.4 | % | | | 42.0 | % | | | 49.6 | % |
1995 | | | 42 | | | | 66 | | | | 32.2 | % | | | 47.4 | % | | | 58.7 | % | | | 76.4 | % |
1996 | | | 17 | | | | 22 | | | | 31.5 | % | | | 34.5 | % | | | 44.3 | % | | | 45.4 | % |
1997 | | | 34 | | | | 44 | | | | 28.4 | % | | | 30.5 | % | | | 35.2 | % | | | 46.7 | % |
1998 | | | 14 | | | | 21 | | | | 35.0 | % | | | 39.8 | % | | | 49.4 | % | | | 43.3 | % |
1999 | | | 22 | | | | 28 | | | | 26.4 | % | | | 27.1 | % | | | 27.7 | % | | | 45.2 | % |
2000 | | | 13 | | | | 15 | | | | 18.0 | % | | | 22.9 | % | | | 31.9 | % | | | 58.5 | % |
2001 | | | 2 | | | | 2 | | | | -195.8 | % | | | NA | | | | -195.8 | % | | | NA | |
2002 | | | 5 | | | | 7 | | | | 55.8 | % | | | NA | | | | 76.2 | % | | | 42.8 | % |
| * | Excludes the highest and lowest deciles of indicated discounts. |
NA = Not applicable
Source: Pamela Garland and Ashley Reilly, “Update on the Willamette Management Associates Pre-IPO Discount for Lack of Marketability Study for the Period 1998 Through 2002,”Insights, Spring 2004.
The DLOM conclusions for 1999 and 2001 are significantly lower than the DLOM conclusions of the previous Willamette Management Associates pre-IPO studies. In addition, the DLOM conclusions for 1999 and 2001 are significantly lower than (1) the DLOM conclusions reported in the VA study for the same years, and (2) the DLOM conclusions reported in the Emory study. There are several capital market reasons why the 1999 and 2000 results of the Willamette Management Associates DLOM study are outside the range of results observed in the 1975 through 1998 period: (1) there were relatively few IPO companies and relatively few private sale transactions that qualified for inclusion in the Willamette Management Associates pre-IPO study in 1999 and 2000, (2) the height of the dot-com “bubble” occurred during this time frame, and (3) the average first-day returns for IPO stocks were extraordinarily high in 1999 and 2000.52
In addition, the Willamette Management Associates DLOM conclusions for 2001 appear to be unreasonable. Certain capital market factors affected the observed price discounts. Also, the DLOM conclusions for these years are based on an extremely small number of transactions. Based on these factors, analysts should either (1) rely on the collective results of the 5-year period between 1998–2002 as a reasonable indication of the DLOM, or (2) ignore the results from the 2001 and 2002 period.
| 52 | An explanation of these uncharacteristic results can be found in: Robert F. Reilly, “Willamette Management Associates’ Discount for Lack of Marketability Study for Marital Dissolution Valuations,”American Journal of Family Law (Spring 2005). |
Pre-IPO Study Conclusions
The pre-IPO studies covered hundreds of transactions during a span of over 30 years. Median price differences between private transaction prices and public market prices varied under different market conditions, ranging from about 40 to 60 percent, after eliminating the “outliers.” This is strong support for the hypothesis that the fair market value of a noncontrolling ownership interest in a privately held company should be discounted from its publicly traded counterparts.
Many analysts agree that pre-IPO DLOM studies provide the most relevant empirical data with regard to the DLOM for a privately owned company. The reason is that companies in the pre-IPO DLOM studies more closely resemble privately held companies to which the DLOM is being applied. The pre-IPO DLOM studies are the only DLOM studies that involve transactions in shares of privately owned companies. John D. Emory and fellow authors illustrate this point by the rhetorical question, “if the kinds of discounts found in this study [the May 1997 through December 2000 Emory Study] occur where marketability is probable, but not a certainty, how much greater should discounts be for more typical company’s stock that has no marketability, little if any chance of ever becoming publicly marketable, and is in a neutral to unpromising situation?”53
Whether a valuation analyst is examining a company, ownership interest, or transaction, it is important that the subject interest be as similar as possible to the data used in the analysis. In this regard, if the subject interest is a privately owned security with an expected holding period exceeding two years, then the pre-IPO DLOM studies may provide a more relevant comparison than the restricted stock DLOM studies. The unique factors of each company and each engagement will affect which specific DLOM studies should be analyzed.
Two common criticisms of the pre-IPO DLOM studies are: (1) selection bias and (2) the fact that IPO prices are inflated due to hype.
The selection bias argument is based on the fact that only successful companies complete an IPO. Pre-IPO DLOM studies eliminate from consideration, by definition, companies that filed for an IPO but were unsuccessful. If there was a bias based on the fact that the pre-IPO DLOM studies include only “successful” companies, it would understate the size of the DLOM. One would expect a “troubled” company to be less liquid than a “successful” company, with fewer options for liquidity resulting in a greater DLOM.
In addition, the impact of selection bias on the indicated average DLOM may be minimal. This is because only about 1 in 5 companies that file for an IPO fail to complete the IPO when scheduled. Willamette Management Associates conducted a failed-IPO study that compared (1) the number of companies that filed an IPO registration with the SEC on Form S-1 to (2) the number of companies that successfully completed their IPO.54 The Willamette Management Associates failed-IPO study found that, among other things, (1) from 1990 through 2002, approximately 8,100 companies filed IPO registration statements
| 53 | John D. Emory Sr., F.R. Dengel III, and John D. Emory Jr., “The Value of Marketability as Illustrated in Initial Public Offerings of Common Stock May 1997 through December 2000.”Business Valuation Review (September 2001): 16-7. |
| 54 | Gregg Gaffen, “The Willamette Management Associates Failed IPO Study: Does a DLOM Apply to Controlling Ownership Interests?,” Willamette Management AssociatesInsights (Autumn 2004): 52–54. |
with the SEC, and (2) approximately 1,800, or 23.3 percent, of those companies did not complete the IPO. The Willamette Management Associates failed-IPO study considered a registration to be “failed” if an IPO was not completed within 18 months of the IPO registration. Some companies may have completed an IPO after this 18-month period, thereby lowering the percentage of failed IPOs. Based on the relatively low percentage of failed IPOs indicated by the Willamette Management Associates failed-IPO study, this factor may have a minimal effect on the reported average DLOM.
The price inflation hype argument is based on the theory that underwriters over-hype new issues. Therefore, underwriters drive IPO stock prices up and increase the indicated DLOM. However, empirical studies generally find first-day stock price appreciation on IPOs is often substantial, indicating that IPOs are systematicallyunderpriced. According to Tim Loughran and Jay Ritter, “In the 1980s, the average first-day return on IPOs was 7%. The average first day return doubled to almost 15% during 1990–1998, before jumping to 65% during the internet bubble years of 1999–2000 and then reverting to 12% during 2001–2003.”55
These two often-cited arguments are easily addressed by looking at evidence cited herein. It is important to consider the fact that the pre-IPO DLOM studies are the only studies based on transactions in shares of private company stock. Therefore, these studies generally provide a meaningful starting point in the measurement of a DLOM for a privately owned ownership interest.
DISCOUNTFOR LACKOF MARKETABILITYFOR BELK, INC.
Exhibit 16 a depicts the indicated discount for lack of marketability in respect to Belk. As shown in the Exhibit, the indicated valuation adjustment for the lack of marketability was 15 percent. This is based on empirical data from the restricted stock studies, the pre-IPO studies, the Johnson study, and the empirical regression of the Silber Model. The preceding paragraphs outlined the various methodologies and conclusions of each study, and the Johnson study and the Silber study is discussed in further detail in the subsequent paragraphs.
Johnson Study
Background and Findings
Bruce A. Johnson published a study of some 72 restricted stock transactions that occurred between 1991 and 1995 in his article “Quantitative Support for Discounts for Lack of Marketability” in the December 1999 edition of Business Valuation Review (pages 152-155). The average discount of the study was 20.2 percent.
Application of Study Finding to Belk, Inc.
Johnson classified the data into range quartiles and published the average of each quartile. We classified the Subject Interest into the appropriate quartile and compared the resulting array of indicated discounts to arrive at the selected discount suggested by the data. There were four factors compiled for the observations:
| 55 | Tim Loughran and Jay Ritter, “Why Has IPO Underpricing Changed Over Time?,”Financial Management (Autumn 2004):
5–37. |
We analyzed the aforementioned factors of the Subject Interest in relation to the Johnson study quartiles with indicated discounts. Our analysis resulted in the range of discounts from 8.3 percent to 27.7 percent, as summarized in Exhibit 16 d.
Silber Study
Background and Findings
In a 1991 article in the Financial Analysts Journal, William L. Silber presented the results of analysis of 69 private placements of common stock of publicly traded companies between 1981 and 1988. He concluded that the average discount was 33.75 percent, very consistent with earlier studies.
In 1977, the Internal Revenue Service published Revenue Ruling 77-287 to provide information and guidance to any person or party concerned with the valuation of securities that cannot be immediately resold because they are restricted. The importance of the Ruling was the Service’s recognition that a discount should be associated with shares that are restricted in some manner from immediate access to an active public market. The Ruling cited four factors to consider in determining the discount from a publicly traded price that should be applied in valuing restricted securities, including:
| | • | | The earnings and sales patterns of the company and the risk associated with those earnings |
| | • | | The dollar amount of sales of the company’s securities |
| | • | | The trading market in which freely traded shares of the same class are traded |
| | • | | The existence of resale agreement provisions or other provisions affecting the holders’ rights |
We concentrated our analysis on restricted stock studies, and in particular a quantitative model developed by William L. Silber. We believe that this type of placement analysis is applicable whether the illiquidity arises from restrictions, blockage, or both factors.
In Silber’s article in the July-August Financial Analysts Journal the results of what he described as a “cross-sectional model” was used to determine an estimate of the discount attributable to a stock that could not be readily sold on the open market for an extended period of time, such as a large block of stock. The model is shown in Exhibit 16 E. Similar to other restricted stock studies, Silber compared the price of restricted stock, as evidenced by private placement sales to sophisticated investors, with the price of the otherwise identical common stock, as evidenced by trades in an open, liquid market.
The average price discount determined by Silber’s analyses of restricted stock prices compared to freely tradable market prices was 33.75 percent. However, while performing his analyses, Silber was able to recognize variations in discounts dependent upon certain company-specific and issue characteristics. Smaller than average discounts were observed for stocks whose issuing companies enjoyed a larger revenue base and positive earnings. The logic behind smaller discounts for such stocks stems from investors being less likely to attempt to liquidate their restricted stock investments during periods of illiquidity if they are able to benefit from the issuing company’s profitability.
Silber created an equation to assist in explaining discounts to restricted stock, the basic premise of which was an interaction of supply and demand for an issuance. The functions included in the equation are based, in part, on the Revenue Ruling 77-287 characteristics outlined above, and were thought by Silber to be indicative of the magnitude of a discount relative to the stock’s freely tradable market price. In general terms, the functions measured the credit-worthiness of the company, the marketability of the subject shares, special or favorable relationships (if any) between investors in the restricted stock and the company itself, and the cash flow of the company. Silber showed through his observations of restricted stock transactions the following:
| | • | | Discounts on stock should become smaller as the credit-worthiness of the company improves |
| | • | | Discounts on stock should become smaller as the marketability of the stock improves |
| | • | | Discounts on stock should become smaller as the cash flow of the company grows larger |
| | • | | Discounts on stock should become smaller in the presence of special concessions made to investors in the stock |
The formulary proxies for each of these functions, as suggested by Silber, included revenue volume and the nature of earnings (positive or negative) as a means to determine the credit-worthiness of a company. As an approximation, companies with higher revenues and earnings, relative to market averages, imply better credit-worthiness. Furthermore, companies with higher revenues and earnings typically generate higher levels of cash flow. Therefore, the normalized level of revenues and whether earnings were in the red or the black provided the proxies for credit-worthiness and cash flow.
The proxy for marketability was derived from evidence, which suggests that blocks of stock sold in secondary distributions cannot be sold at the same price as existing shares due to a lack of elasticity in the demand for shares. In addition, the price of the block declines more as the size of the block grows in relationship to the total number of shares outstanding, as described above. It is expected that the size of the block of stock, depending on how large it is relative to the total number of shares outstanding, will have a negative impact on the value of the stock. The marketability proxy therefore was determined to equal the number of shares of stock, or in this case the subject block, divided by the total number of shares outstanding.
The final proxy used in Silber’s model to measure the impact of special relationships on the price of restricted stock is a dummy variable, which equals one if a supplier relationship exists between the investor and the company issuing the stock, and zero if no such relationship exists.
Application of Study Finding to Belk, Inc.
We input the relevant Company-specific data for Silber’s regression model in Exhibit 16 e. These factors include: size of the block and the level of revenues and the profitability of the Company. The resulting indicated discount was approximately 15 percent.
APPENDIX C – STATEMENTOF ASSUMPTIONSAND LIMITING CONDITIONS
STATEMENTOF ASSUMPTIONSAND LIMITING CONDITIONS
The primary assumptions and limiting conditions pertaining to the conclusion of value stated in this report are summarized below. Other assumptions are cited elsewhere in this report.
| | 1. | The value conclusion arrived at herein is valid only for the stated purpose as of the date of the valuation. |
| | 2. | We have accepted without any verification financial statements and other related information provided by the company or its representatives as fully and correctly reflecting the company’s business conditions and operating results for the respective periods, except as specifically noted herein. We have not audited, reviewed, or compiled the financial information provided to us. Accordingly, we express no audit opinion or any other form of assurance on this information. |
| | 3. | We obtained public information and industry and statistical information from sources we believe to be reliable. However, we make no representation as to the accuracy or completeness of such information and have performed no procedures to corroborate the information. |
| | 4. | We do not provide assurance on the achievability of the results forecasted by the company because events and circumstances frequently do not occur as expected. Differences between actual and expected results may be material; and achievement of the forecasted results is dependent on actions, plans, and assumptions of management. |
| | 5. | We based the value conclusion arrived at herein on the assumption that the current level of management expertise and effectiveness would continue to be maintained and that the character and integrity of the enterprise through any sale, reorganization, exchange, or diminution of the owners’ participation would not be materially or significantly changed. |
| | 6. | This report and the value conclusion arrived at herein are for the exclusive use of our client for the sole and specific purposes as noted herein. They may not be used for any other purpose or by any other party for any purpose. Furthermore, the report and value conclusion are not intended by the authors, and should not be construed by the reader, to be investment advice in any manner whatsoever. The value conclusion represents our considered opinion, based on information furnished by the company and other sources. |
| | 7. | Neither all nor any part of the contents of this report (especially the value conclusion, the identity of any valuation analysts, or the firm with which such valuation analysts are connected or any reference to any of their professional designations) should be disseminated to the public through advertising media, public relations, news media, sales media, mail, direct transmittal, or any other means of communication, including but not limited to the Securities and Exchange Commission or other governmental agency or regulatory body, without our prior written consent and approval. |
| | 8. | We are not environmental consultants or auditors, and we take no responsibility for any actual or potential environmental liabilities. Any person entitled to rely on this report, wishing to know whether such liabilities exist, or the scope and their effect on the value of the property, is encouraged to obtain a professional environmental assessment. We do not conduct or provide environmental assessments and have not performed one for the subject property. |
| | 9. | We have not independently determined whether the company is subject to any present or future liability relating to environmental matters (including, but not limited to CERCLA/Superfund liability) nor the scope of any such liabilities. Our valuation takes no such liabilities into account, except as they have been reported to us by the company or by an environmental consultant working for the company, and then only to the extent that the liability was reported to us in an |
| | actual or estimated dollar amount. Such matters, if any, are noted in the report. To the extent such information has been reported to us, we have relied on it without verification and offer no warranty or representation as to its accuracy or completeness. |
| | 10. | We have not made a specific compliance survey or analysis of the subject property to determine whether it is subject to, or in compliance with, the American Disabilities Act of 1990, and this valuation does not consider the effect, if any, of noncompliance. |
| | 11. | No change of any item in this valuation report will be made by anyone other than us, and we have no responsibility for any such unauthorized change. |
| | 12. | Unless otherwise stated, no effort has been made to determine the possible effect, if any, on the subject business due to future federal, state, or local legislation, including any environmental or ecological matters or interpretations thereof. |
| | 13. | If prospective financial information approved by management has been used in our work, we have not examined or compiled the prospective financial information. Therefore, we do not express an audit opinion or any other form of assurance on the prospective financial information or the related assumptions. Events and circumstances frequently do not occur as expected, and there will usually be differences between prospective financial information and actual results, and those differences may be material. |
| | 14. | Except as noted, we have relied on the representations of the owners, management, and other third parties concerning the value and useful condition of all equipment, real estate, and investments used in the business, and any other assets or liabilities, except as specifically stated to the contrary in this report. We have not attempted to confirm whether or not all assets of the business are free and clear of liens and encumbrances or that the entity has good title to all assets. |
APPENDIX D – CERTIFICATIONAND REPRESENTATION
CERTIFICATIONAND REPRESENTATION
We hereby certify the following statements regarding this valuation:
| | 1. | We have personally inspected the assets, properties, or business interests encompassed by this valuation. |
| | 2. | We have no present or prospective future interest in the assets, properties, or business interests that are the subject of this valuation report. |
| | 3. | We have previously valued these assets, properties, or business interests during the three years prior to this engagement. |
| | 4. | We have no personal interest or bias with respect to the subject matter of this report or the parties involved. |
| | 5. | Our compensation for making the valuation analysis is in no way contingent upon the value reported or upon any predetermined value. |
| | 6. | To the best of our knowledge and belief, the statements of facts contained in this report, upon which the analyses, conclusions, and opinions expressed herein are based, are true and correct. |
| | 7. | Our analyses, opinions, and conclusions were developed, and this report has been prepared, in conformity with the Uniform Standards of Professional Appraisal Practice, as promulgated by the Appraisal Foundation and the American Society of Appraisers. |
| | 8. | No persons other than the individuals whose qualifications are included herein have provided significant professional assistance regarding the analyses, opinions, and conclusions set forth in this report. |
| | 9. | The reported analyses, opinions, and conclusions are limited only by the reported assumptions and limiting conditions, and they represent our unbiased professional analyses, opinions, and conclusions. |
| | 10. | The reported analyses, opinions, and conclusions were developed, and this report has been prepared, in conformity with the requirements of the code of professional ethics and the standards of professional appraisal practice of the professional organizations of which we are members. |
| | 11. | Disclosure of the contents of this report is subject to the requirements of the professional organizations of which we are members related to review by their duly authorized representatives. |
| | 12. | The signature of the analyst responsible for conducting this engagement, Curtis R. Kimball, Managing Director of Willamette Management Associates, is incorporated herein by reference to its location on the transmittal letter of this report. |
APPENDIX E – PROFESSIONAL QUALIFICATIONSOF PRINCIPAL ANALYSTS
CURTIS R. KIMBALL
Curtis Kimball is a managing director and is the national director of wealth management valuations with Willamette Management Associates.
Curtis supervises engagements related to the valuation of business entities and business interests, the analysis of publicly traded and private securities, and the valuation of intangible assets, options and derivative interests, claims, fractional interests, and intellectual property.
He has performed the following types of valuation assignments: estate and gift planning valuations, estate tax (both date of death and alternate valuation date) valuations, gift tax valuations, generation-skipping tax valuations, fiduciary compensation and damages claims valuations, buy-sell agreement valuations, income tax (including charitable deduction, transfer pricing, intangible asset basis, and loss deduction) valuations, expatriation tax valuations, fair value valuations for financial reporting purposes, merger and acquisition valuations, fairness opinions, solvency analyses, ESOP feasibility and initial transaction valuations, ESOP employer stock valuations and transaction fairness valuations, insurance valuations, divorce and equitable division valuations, various forensic analyses, fair value in dissenting shareholder rights and shareholder oppression proceedings, economic damages and lost profits analyses, bankruptcy and restructuring analysis and valuations, employee compensation and stock option valuations, and financing collateral valuations.
Curtis has presented expert testimony in federal courts (U.S. Tax Court, U.S. District Court, and U.S. Bankruptcy Court) and various state courts and in alternate dispute resolution venues, including binding arbitration and mediation. Curtis acts as the firm’s national director for wealth management matters (including estate, gift, charitable, fiduciary, marital planning, family and partner disputes, and tax issues). He has extensive experience with appearances in IRS appellate conferences.
Curtis has decades of experience in the valuation of various types of business entities and interests, including: private family-owned businesses, private multiple-investor businesses, employee-owned businesses, minority interests, fifty-percent interests, restricted stock of publicly-traded companies, large blocks of publicly-traded securities, preferred stock interests, multiple classes of preferred and common stock in complex capital structures, secured notes, subordinated debt interests, options and other derivative interests, warrants and rights offerings, general and limited partnership interests, limited liability company membership interests, professional practices, joint ventures, licensing agreements, franchises, and foreign-domiciled corporations.
In addition, his experience includes the valuation of various types of intangible assets, claims, damages, and intellectual properties. These include: patents, copyrights, trade secrets, master recordings, programming libraries, core deposits, customer contracts, franchises (including professional sports franchises), product licensing, management employment contracts, fiduciary damages and claims, non-compete and non-solicitation agreements, customer lists, cutting and hunting rights, undivided fractional interests in real estate, assembled workforces, trademarks/trade names/trade dress, contract rights, breach of contract damages, going-concern values, goodwill, and transfer price agreements.
PREVIOUS EXPERIENCE
Curtis founded the Atlanta regional office of Willamette Management Associates, having originally joined our firm in the Portland office. Before joining Willamette Management Associates, Curtis was a vice president and manager of the Business Owners Services Group of the Citizens & Southern Trust Company,
the trust subsidiary of the Citizens & Southern Corporation of Atlanta, Georgia (now Bank of America). Curtis provided valuation and appraisal services to the C&S Corporation trust and banking customer base throughout the southeast. In addition, his area acted as the trust department’s analyst and administrator in matters relating to the management, purchase, and sale of private business interests, intangible assets, and illiquid securities held in estates and trusts. Curtis has managed closely held businesses after the founder’s death, and he has served as a member of the board of directors of a number of family-owned businesses in his capacity as representative of the trustees or executors.
Curtis also acted as part of the C&S Trust ESOP fiduciary services group, with input regarding the retention of independent valuation firms to advise the bank as trustee on ESOP valuations and review of independent valuations. Curtis’s position at C&S included work as part of the team that acted as ESOP trustee for the leveraged buyout of AVIS Rent-a-Car, one of the then-largest employee-owned firms in the nation.
Prior to joining C&S, Curtis was an assistant vice president with the Trust Department of Wachovia Bank & Trust Company, N.A., a major regional bank located in North Carolina. As the assistant manager of the closely held business unit at Wachovia, Curtis managed the trust department’s holdings of private business interests and estate portfolios, and he conducted valuations of closely held businesses and business interests for bank clients in the region. He joined Wachovia as an internal auditor, and he subsequently worked as a loan administration officer with the bank’s corporate lending group.
EDUCATION
Master of Business Administration, Emory University
Bachelor of Arts, economics, Duke University
PROFESSIONAL AFFILIATIONS
Curtis is an accredited senior appraiser (ASA) of the American Society of Appraisers, accredited in business valuation. He has been a member of and served as treasurer of the ASA’s Business Valuation Committee. He is presently a member of the Business Valuation Standards Sub-Committee. He served as a member of the International Board of Examiners and International Ethics Committee of the ASA. He presently serves as a member of the ASA’s Investment Policy Committee. He has served as president, secretary, and treasurer of the Atlanta Chapter of the ASA. He has served as chair of the Atlanta Chapter Business Valuation Committee. He has served as treasurer of the Portland Chapter of the ASA.
Curtis also holds the chartered financial analyst (CFA) designation of the CFA Institute. He was a member of the Board of Examiners and was a senior grader for the examinations leading to the CFA designation. He served as a member of the Disciplinary Review Committee and as a member of the Disciplinary Hearing Panel judges’ pool. He was a member of the Portland Society of Financial Analysts for which he served as secretary and a member of the board of directors. He also served as a member of the board of trustees of the CFA Society of Atlanta (CFA-ATL) and is currently the CFA-ATL membership chair.
He is also a member of The ESOP Association, the Institute of Management Accountants, the National Association of Corporate Directors, and the National Association of Business Economists, for which he served as past president of the Portland chapter and treasurer of the Atlanta chapter.
CHIP BROWN, CPA
Chip Brown is a managing director of Willamette Management Associates. His practice includes valuation consulting, economic analysis, and financial advisory services.
Chip has performed the following types of valuation and economic analyses: merger and acquisition valuations, fairness opinions, ESOP formation and adequate consideration analyses, acquisition purchase price allocations, business and stock valuations, and lost profits/economic damages analyses.
He has prepared these valuation and economic analyses for the following purposes: transaction pricing and structuring (merger, acquisition, liquidation, and divestiture); taxation planning and compliance (federal income, gift, and estate tax; state and local property tax; transfer tax), ESOP transactions and ESOP related litigation, forensic analysis and dispute resolution, and strategic information and planning.
Chip has valued the following types of business entities and securities: close corporation business enterprise, close corporation fractional ownership interests, public corporation subsidiaries/divisions, complex capital structures (various classes of common/preferred stock; options, warrants, grants, rights), general and limited partnership interests, joint ventures, proprietorships, professional service corporations, professional practices, and LLPs and LLCs.
He has performed business valuations in the following industries: advertising, apparel, bottling, brokerage, cable television, chemical, commercial banking, communications, computer services, construction and contracting, consulting, distribution, energy and electric generation, health care, hotel and hospitality, insurance, manufacturing, marine, mining and mineral extraction, money management, natural resources, parking, petroleum, printing, publishing, real estate development, restaurant, retailing, telecommunications, television broadcasting, textiles, tire, transportation and trucking, and wholesaling.
Chip has performed valuation, economic damages, or transfer price/royalty rate analyses related to the following intangible assets: computer software, computer databases, contract rights, copyrights, customer and supplier contracts, customer lists, employment contracts, goodwill, licenses, noncompete covenants, patents, proprietary technology, trained and assembled workforces, trade names, and trademarks.
He has performed financial advisory and economic analyses for various transactional purposes: identification of M&A targets, valuation of target company synergistic/strategic benefits, negotiation of deal price and terms, fairness analysis of proposed transactions, and valuation of debt and equity instruments.
PREVIOUS EXPERIENCE
Prior to joining Willamette Management Associates, Chip was a senior associate at Adams Capital, Inc., a provider of business valuation, asset valuation, and financial advisory services. Prior to joining Adams Capital, he practiced assurance and advisory business services with Ernst & Young LLP.
EDUCATION
Master of Science, accounting, University of Virginia
Bachelor of Science, management, Georgia Institute of Technology (with highest honors)
PROFESSIONAL AFFILIATIONS
Certified Public Accountant (CPA) – Georgia
Chartered Financial Analyst (CFA) – CFA Institute
Accredited in Business Valuation (ABV) – American Institute of Certified Public Accountants
Certified in Financial Forensics (CFF) – American Institute of Certified Public Accountants
Certified Valuation Analyst (CVA) – National Association of Certified Valuators and Analysts
Chip is a member of the American Institute of Certified Public Accountants (AICPA) and the Georgia Society of Certified Public Accountants (GSCPA). Chip is also a member of The ESOP Association, the CFA Institute, and the Atlanta Society of Financial Analysts.
WESTON C. KIRK
Weston Kirk is an associate with Willamette Management Associates in the Atlanta office.
Weston has performed various types of valuation and economic analyses, including merger and acquisition valuations, fairness opinions, ESOP formation and adequate consideration analyses, business and stock valuations, litigation disputes and damages analyses, Internal Revenue Service audit rebuttals, undivided interests in real estate valuations, promissory note valuations, and gift and estate tax valuations.
He has prepared these valuation and economic analyses for the following purposes: transaction pricing and structuring; taxation planning and compliance (federal income, gift, and estate tax); ESOP transaction and financing; tender offers; stock option offers; litigation; and strategic information and planning.
Weston has experience in the valuation of various types of business entities and interests, including: private family-owned businesses, private multiple-investor businesses, employee-owned businesses, publicly-traded companies, preferred and common stock in complex capital structures, secured and unsecured notes, options and other derivative interests, conglomerates, general and limited partnership interests, limited liability company membership interests, limited company interests, professional practices, joint ventures, and foreign domiciled corporations.
He has performed business valuations in the following industries: accounting, asset management, biotechnology, commercial banking, construction, defense contracting, department stores, ecommerce, food retail, grocery stores, hedge funds, IT consulting, literary works and publishing, mining and aggregates, NGL production, petroleum, pharmaceuticals, precious metal recycling, real estate, software-as-a-service (SaaS), sports field construction, steel, temporary staffing services, timberland, trucking and transportation, and utilities, among others.
PRIOR EXPERIENCE
Weston was an intern in the Atlanta office of Willamette Management Associates prior to joining the firm as associate.
EDUCATION
Bachelor of Business Administration in finance, Georgia State University, J. Mack Robinson College of Business
Certification in economics, Georgia State University, Andrew Young School of Policy Studies
PROFESSIONAL AFFILIATIONS
Weston is a Level I candidate for the Chartered Financial Analyst designation. Weston is also a non-CPA associate of the AICPA and a member of the AICPA section on Forensic and Valuation Services.