Citizens South Banking Corporation (also referred to as the “Company”, the “Registrant”, “We”, “Us”, or “Our”) is a Delaware corporation that owns all of the outstanding shares of common stock of Citizens South Bank (the “Bank”). The shares of common stock of the Company trade on the Nasdaq Global Market under the ticker symbol “CSBC.” The Company’s principal business activities are overseeing and directing the business of the Bank. The Company’s assets consist primarily of the outstanding capital stock of the Bank, deposits held at the Bank, and investment securities. The Company became the holding company for the Bank on September 30, 2002, in connection with the mutual-to-stock conversion of Citizens South Holdings, MHC, the mutual holding company of Citizens South Banking Corporation, a federal corporation, formerly named Gaston Federal Bancorp, Inc., which was originally formed on March 18, 1998, for the purpose of acting as the holding company for the Bank.
The Company’s executive office is located at 519 South New Hope Road, P.O. Box 2249, North Carolina 28053-2249. Its telephone number at this address is (704) 868-5200. The Company also maintains a website at www.citizenssouth.com that includes important information on our Company, including a list of our products and services, branch locations, current financial information, and links to the Company’s Securities Exchange Act filings with the SEC.
Citizens South Bank, which was chartered in 1904, is a federally chartered savings bank headquartered in Gastonia, North Carolina. The Bank’s principal business activity is offering FDIC-insured deposits to local customers through its 14 branch offices and investing those deposits, together with funds generated from operations and borrowings, in residential and nonresidential real estate loans, construction loans, commercial business loans, consumer loans, investment securities, and mortgage-backed securities. The Bank also acts as a broker in both the origination of loans secured by one-to-four family dwellings and in the sale of uninsured financial products. The Bank’s results of operations are heavily dependent on net interest income, which is the difference between the interest earned on loans and securities and the interest paid on deposits and borrowings. Results of operations are also materially affected by the Bank’s provision for loan losses, gains or losses from the sales of assets, fee income generated from deposit and loan accounts, commissions earned from the sale of uninsured investment products, and noninterest expense. The Bank’s noninterest expense primarily consists of compensation and employee benefits, occupancy expense, professional services, advertising, and other noninterest expenses. Results of operations are also significantly affected by general economic and competitive conditions, changes in interest rates, and actions of regulatory and governmental authorities.
Citizens South Bank has 14 full-service branch offices in the North Carolina Counties of Gaston, Union, Rowan, and Iredell and two loan production offices located in Mecklenburg County, North Carolina, and York County, South Carolina. The Bank’s executive office is located at 519 South New Hope Road, P.O. Box 2249, Gastonia, North Carolina 28053-2249. Its telephone number at this address is (704) 868-5200.
Under the terms of the merger agreement, the Company issued a combination of shares of common stock and cash for the outstanding shares of common stock of Trinity Bank. Trinity shareholders were given the option of receiving 1.3931 shares of Citizens South common stock for each share of Trinity common stock, $18.25 in cash for each share of Trinity common stock, or a mixture of stock and cash for each Trinity share, such that 50% of the shares of Trinity common stock would be exchanged for Citizens South common stock. On October 31, 2005, Trinity shareholders received merger consideration of approximately 1,280,052 shares of common stock of the Company (subject to payment of cash in lieu of fractional shares) and approximately $16.8 million in cash (including cash paid in lieu of fractional shares), resulting in a total transaction value of approximately $37.8 million. The transaction price represented approximately 255% of Trinity’s book value as of September 30, 2005. Additional information regarding this transaction may be obtained by reviewing the Registration Statement that the Company filed with the Securities and Exchange Commission on August 1, 2005, and amended September 14, 2005.
In order to provide financing for the cash portion of the Trinity acquisition, on October 28, 2005, the Company completed a private placement of an aggregate amount of $15.0 million in trust preferred securities, liquidation amount of $1,000 per security (the “Preferred Securities”), through a newly formed Delaware statutory trust subsidiary, CSBC Statutory Trust I (the “Trust”). In connection with the issuance of the Preferred Securities, on October 28, 2005, the Company entered into an Indenture by and between the Company and Wilmington Trust Company, as trustee. The Preferred Securities mature on December 15, 2035, but may be redeemed beginning December 15, 2010, if the Company exercises its rights to redeem the Debentures. The Preferred Securities require quarterly interest payments to the holders of the Preferred Securities, initially at a fixed rate of 6.095% through December 2010, and thereafter at a variable rate of three-month LIBOR plus 1.57%, reset quarterly. Additional information regarding the Preferred Securities may be obtained by reviewing the Current Report on Form 8-K filed with the Securities and Exchange Commission on November 4, 2005.
Market Area and Competition
We consider our primary market area to be the North Carolina Counties of Gaston, Rowan, Iredell, Union, Mecklenburg, Cabarrus, Lincoln, and Cleveland, and the South Carolina County of York. Our market area predominately centers in the suburbs surrounding the metropolitan area of Charlotte, North Carolina. The metropolitan area of Charlotte has a diverse economic base that includes business sectors in banking and finance, insurance, manufacturing, textiles, apparel, fabricated metals, construction, health care, transportation, retail trade, telecommunications, government services, and education. The Bank’s corporate headquarters is located in Gastonia, North Carolina, which is located in the I-85 corridor, approximately 20 miles west of Charlotte.
The Bank’s corporate headquarters and seven of its branch offices are located in Gaston County, North Carolina. These offices are located in the cities of Gastonia (three offices), Dallas, Mount Holly, Belmont, and Stanley. According to data provided by the FDIC as of June 30, 2006, there were 14 banks and thrifts operating in Gaston County with $2.1 billion in deposits. As of June 30, 2006, the Bank had $213.1 million in deposits in Gaston County, or 10.1% of the total County deposits. This represents the third highest market share in Gaston County.
We also have three branch offices in Union County, North Carolina, in the cities of Monroe, Stallings, and Weddington. According to data provided by the FDIC as of June 30, 2006, there were 14 banks and thrifts operating in Union County with $1.5 billion in deposits. As of June 30, 2006, the Bank had $123.5 million in deposits in Union County, or 8.4% of the total County deposits. This represents the seventh highest market share in the County.
The Bank also has two branch offices in Rowan County, North Carolina, in the cities of Salisbury and Rockwell. According to data provided by the FDIC as of June 30, 2006, there were 13 banks and thrifts operating in Rowan County with $1.4 billion in deposits. As of June 30, 2006, the Bank had $116.1 million in deposits in Rowan County, or 8.3% of the total County deposits. This represents the fourth highest market share in the County.
We also have two branch offices in Iredell County, North Carolina, in the cities of Statesville and Mooresville. According to data provided by the FDIC as of June 30, 2006, there were 17 banks and thrifts operating in Iredell County with $1.9 billion in deposits. As of June 30, 2006, the Bank had $86.7 million in deposits in Iredell County, or 4.5% of the total County deposits. This represents the eighth highest market share in the County.
2
Employees
As of December 31, 2006, the Company had 133 full-time and 18 part-time employees, none of whom is represented by a collective bargaining unit. The Company provides employee benefit programs, including an Employee Stock Ownership Plan, matching contributions to a 401(k) retirement/savings plan, group life, disability, heath, and dental insurance, and paid vacation and sick leave. Management believes its relationship with its employees is good.
Supervision and Regulation
Citizens South Banking Corporation is a unitary savings and loan holding company, subject to regulation and supervision by the Office of Thrift Supervision (“OTS”). The OTS has enforcement authority over Citizens South Banking Corporation and its subsidiaries. This authority permits the OTS to restrict or prohibit activities that are determined to be a risk to Citizens South Bank. Federal law prohibits a savings and loan holding company from acquiring control of another savings institution or holding company thereof, without prior written approval of the OTS. It also prohibits the acquisition or retention of, with specified exceptions, more than 5% of the equity securities of a company engaged in activities that are not closely related to banking or financial in nature or acquiring or retaining control of an institution that is not federally insured. In evaluating applications by holding companies to acquire savings institutions, the OTS must consider the financial and managerial resources, future prospects of the savings institution involved, the effect of the acquisition on the risk to the insurance fund, the convenience and needs of the community and competitive factors.
Citizens South Bank is a federal savings bank and derives its lending and investment powers from the Home Owners’ Loan Act, as amended, and the regulations of the OTS. Under these laws and regulations, Citizens South Bank may invest in mortgage loans secured by residential and commercial real estate, commercial business and consumer loans, certain types of debt securities and certain other assets. Citizens South Bank also may establish subsidiaries that may engage in activities not otherwise permissible for Citizens South Bank, including real estate investment and securities and insurance brokerage. Citizens South Bank is a federally chartered stock savings bank, subject to examination, supervision, and regulation by the OTS, as its primary federal regulator, and the Federal Deposit Insurance Corporation (“FDIC”), as the deposit insurer. Citizens South Bank is also a member of and owns stock in the Federal Home Loan Bank of Atlanta, which is a part of the Federal Home Loan Bank System. The Bank must file reports with the OTS and the FDIC concerning its activities and financial condition in addition to obtaining regulatory approvals prior to entering into certain transactions such as mergers or acquisitions. This regulation and supervision establishes a comprehensive framework of activities in which an institution may engage and is intended primarily for the protection of the insurance fund and depositors. Under this system of federal regulation, financial institutions are periodically examined to ensure that they satisfy applicable standards with respect to their capital adequacy, assets, management, earnings, liquidity and sensitivity to market interest rates. Citizens South Bank is also regulated to a lesser extent by the Board of Governors of the Federal Reserve System, governing reserves to be maintained against deposits and other matters. Citizens South Bank’s relationship with its depositors and borrowers also is regulated to a great extent by both federal and state laws, especially in matters concerning the ownership of deposit accounts and the form and content of Citizens South Bank’s loan documents.
The following discussion summarizes certain material elements of the regulatory framework applicable to Citizens South Banking Corporation and its subsidiaries. These summaries of statutes and regulations are not intended to be complete and such summaries are qualified in their entirety by reference to such statutes and regulations. A change in the statutes, regulations, or regulatory policies applicable to the Company, or its subsidiaries, could have a material effect on the business of the Company.
Standards for Safety and Soundness. Federal law requires each federal banking agency to prescribe certain standards for all insured depository institutions. These standards relate to, among other things, internal controls, information systems and audit systems, loan documentation, credit underwriting, interest rate risk exposure, asset growth, compensation, and other operational and managerial standards as the agency deems appropriate. If the appropriate federal banking agency determines that an institution fails to meet any standard prescribed by the guidelines, the agency may require the institution to submit to the agency an acceptable plan to achieve compliance with the standard. If an institution fails to meet these standards, the appropriate federal banking agency may require the institution to submit a compliance plan. The OTS has primary enforcement responsibility over federal savings institutions and has the authority to bring enforcement action against all “institution-affiliated parties,” including certain stockholders, and attorneys, appraisers and accountants who knowingly or recklessly participate in wrongful action likely to have an adverse effect on an insured institution. Formal enforcement action may range from the issuance of a capital directive, a cease and desist order, removal of officers and/or directors of the institution, receivership, conservatorship, civil penalties, or the termination of deposit insurance. The FDIC also has the authority to recommend to the Director of the OTS that enforcement action be taken with respect to a particular savings institution. If action is not taken by the Director, the FDIC has authority to take action under specified circumstances.
3
OTS regulations require savings banks to meet three minimum capital standards: a 1.5% tangible capital ratio, a 4% leverage ratio and an 8% risk-based capital ratio. At December 31, 2006, Citizens South Bank’s capital exceeded all applicable requirements. Under prompt corrective action regulations, the OTS is required and authorized to take supervisory actions against undercapitalized savings banks. For this purpose, a savings bank is placed in one of the following five categories based on the bank’s capital: 1) well-capitalized (at least 5% leverage capital, 6% tier 1 risk-based capital and 10% total risk-based capital); 2) adequately capitalized (at least 4% leverage capital, 4% tier 1 risk-based capital and 8% total risk-based capital); 3) undercapitalized (less than 8% total risk-based capital, 4% tier 1 risk-based capital or 3% leverage capital); 4) significantly undercapitalized (less than 6% total risk-based capital, 3% tier 1 risk-based capital or 3% leverage capital); and 5) critically undercapitalized (less than 2% tangible capital). At December 31, 2006, Citizens South Bank met the criteria for being considered “well-capitalized.”
OTS regulations govern capital distributions by a federal savings bank, which include cash dividends, stock repurchases and other transactions charged to the capital account. A savings bank must file an application for approval of a capital distribution if: (1) the total capital distributions for the applicable calendar year exceed the sum of the savings bank’s net income for that year to date plus the savings bank’s retained net income for the preceding two years; (2) the bank would not be at least adequately capitalized following the distribution; (3) the distribution would violate any applicable statute, regulation, agreement or OTS-imposed condition; or (4) the savings bank is not eligible for expedited treatment of its filings. Even if an application is not otherwise required, every savings bank that is a subsidiary of a holding company must file a notice with the OTS at least 30 days before the board of directors declares a dividend or approves a capital distribution. The OTS may disapprove a notice or application if: (1) the savings bank would be undercapitalized following the distribution; (2) the proposed capital distribution raises safety and soundness concerns; or (3) the capital distribution would violate a prohibition contained in any statute, regulation or agreement.
Community Reinvestment Act and Fair Lending Laws. All savings banks have a responsibility under the Community Reinvestment Act and related regulations of the OTS to help meet the credit needs of their communities, including low- and moderate-income neighborhoods. In connection with its examination of a federal savings bank, the OTS is required to assess the savings bank’s record of compliance with the Community Reinvestment Act. In addition, the Equal Credit Opportunity Act and the Fair Housing Act prohibit lenders from discriminating in their lending practices on the basis of characteristics specified in those statutes. A bank’s failure to comply with the provisions of the Community Reinvestment Act could, at a minimum, result in regulatory restrictions on its activities. The failure to comply with the Equal Credit Opportunity Act and the Fair Housing Act could result in enforcement actions by the OTS, as well as other federal regulatory agencies and the Department of Justice. Citizens South Bank received a “Satisfactory” Community Reinvestment Act rating in its most recent federal examination.
Transactions with Affiliates. A federal savings bank’s authority to engage in transactions with its “affiliates” is limited by OTS regulations and by Sections 23A and 23B of the Federal Reserve Act (the “FRA”) and its implementing regulations. The term “affiliates” for these purposes generally means any company that controls or is under common control with an institution. Citizens South Banking Corporation and its subsidiaries are affiliates of Citizens South Bank. In general, transactions with affiliates must be on terms that are as favorable to the savings bank as comparable transactions with non-affiliates. In addition, certain types of these transactions are restricted to an aggregate percentage of the savings bank’s capital. Collateral in specified amounts must usually be provided by affiliates in order to receive loans from the savings bank. In addition, OTS regulations prohibit a savings bank from lending to any of its affiliates that are engaged in activities that are not permissible for bank holding companies and from purchasing the securities of any affiliate, other than a subsidiary.
Citizens South Bank’s authority to extend credit to its directors, executive officers and 10% shareholders, as well as to entities controlled by such persons, is currently governed by the requirements of Sections 22(g) and 22(h) of the FRA and Regulation O of the Federal Reserve Board. Among other things, these provisions require that extensions of credit to insiders (i) be made on terms that are substantially the same as, and follow credit underwriting procedures that are not less stringent than, those prevailing for comparable transactions with unaffiliated persons and that do not involve more than the normal risk of repayment or present other unfavorable features, and (ii) not exceed certain limitations on the amount of credit extended to such persons, individually and in the aggregate, which limits are based, in part, on the amount of Citizens South Bank’s capital. In addition, extensions of credit in excess of certain limits must be approved by Citizens South Bank’s Board of Directors.
4
Qualified Thrift Lender Test. As a federal savings bank, Citizens South Bank is subject to a qualified thrift lender, or “QTL,” test. Under the QTL test, Citizens South Bank must maintain at least 65% of its portfolio assets in qualified thrift investments in at least nine months of the most recent 12-month period. Portfolio assets generally means total assets of a savings institution, less the sum of specified liquid assets up to 20% of total assets, goodwill and other intangible assets, and the value of property used in the conduct of the savings bank’s business. Qualified thrift investments includes various types of loans made for residential and housing purposes, investments related to such purposes, including certain mortgage-backed and related securities, and loans for personal, family, household and certain other purposes up to a limit of 20% of portfolio assets. Qualified thrift investments also include 100% of an institution’s credit card loans, education loans and small business loans. Citizens South Bank also may satisfy the QTL test by qualifying as a “domestic building and loan association” as defined in the Internal Revenue Code of 1986. A savings bank that fails the qualified thrift lender test must either convert to a bank charter or operate under specified restrictions. At December 31, 2006, Citizens South Bank maintained approximately 77% of its portfolio assets in qualified thrift investments and satisfied the QTL test as of that date.
Insurance of Deposit Accounts. Citizens South Bank’s deposits are subject to assessments by the Federal Deposit Insurance Corporation (“FDIC”). These deposit accounts are insured by the Deposit Insurance Fund of the FDIC, generally up to a maximum of $100,000 per separately insured depositor and up to a maximum of $250,000 for self-directed retirement accounts. Effective March 31, 2006, the FDIC merged the Bank Insurance Fund (“BIF”) and the Savings Association Insurance Fund (“SAIF”) into a single insurance fund called the Deposit Insurance Fund. As a result of the merger, the BIF and SAIF were abolished. The merger of the BIF and SAIF into the Deposit Insurance Fund does not affect the authority of the Financing Corporation (“FICO”) to impose and collect, with approval of the FDIC, assessments and anticipated payments, insurance costs and custodial fees on bonds issued by the FICO in the 1980’s to recapitalize the Federal Savings and Loan Insurance Corporation. The bonds issued by the FICO are due to mature in 2017 through 2019. For the quarter ended December 31, 2006, the FICO assessment was equal to 1.24 basis points for each $100 in domestic deposits maintained at an institution.
On November 2, 2006, the FDIC adopted final regulations establishing a risk-based assessment system that will enable the FDIC to more closely tie each financial institution’s premiums with the risk it poses to the Deposit Insurance Fund. Under the new risk-based assessment system, which becomes effective in the beginning of 2007, the FDIC will evaluate the risk of each financial institution based on three primary sources of information: 1) its supervisory rating, 2) its financial rations, and 3) its long-term debt issuer rating, if the institution has one. The new rates for nearly all of the financial institution industry will vary between five and seven cents for every $100 of domestic deposits. At the same time, the FDIC also adopted final regulations designating the reserve ratio for the Deposit Insurance Fund during 2007 at 1.25% of estimated insured deposits.
Federal Home Loan Bank System. Citizens South Bank is a member of the Federal Home Loan Bank System (“FHLB”), which provides a central credit facility primarily for member institutions. As a member of the FHLB of Atlanta, Citizens South Bank is required to acquire and hold shares of capital stock in the FHLB in an amount at least equal to 1% of the aggregate principal amount of its unpaid residential mortgage loans and similar obligations at the beginning of each year, or 1/20 of its borrowings from the FHLB, whichever is greater. As of December 31, 2006, Citizens South Bank was in compliance with this requirement.
Federal Reserve System. The Federal Reserve Board regulations require savings banks to maintain non-interest-earning reserves against their transaction accounts, such as negotiable order of withdrawal and regular checking accounts. At December 31, 2006, Citizens South Bank was in compliance with these reserve requirements. The balances maintained to meet the reserve requirements imposed by the Federal Reserve Board may be used to satisfy liquidity requirements imposed by the Office of Thrift Supervision.
The USA PATRIOT Act. The USA PATRIOT Act of 2001 gives the federal government new powers to address terrorist threats through enhanced domestic security measures, expanded surveillance powers, increased information sharing and broadened anti-money laundering requirements. The USA PATRIOT Act also requires the federal banking agencies to take into consideration the effectiveness of controls designed to combat money laundering activities in determining whether to approve a merger or other acquisition application of a member institution. Accordingly, if we engage in a merger or other acquisition, our controls designed to combat money laundering would be considered as part of the application process. We have established policies, procedures and systems designed to comply with these regulations.
5
Sarbanes-Oxley Act of 2002. The Sarbanes-Oxley Act of 2002 was enacted in response to public concerns regarding corporate accountability in connection with certain accounting scandals. The stated goals of the Sarbanes-Oxley Act are to increase corporate responsibility, to provide for enhanced penalties for accounting and auditing improprieties at publicly traded companies, and to protect investors by improving the accuracy and reliability of corporate disclosures pursuant to the securities laws. The Sarbanes-Oxley Act generally applies to all companies that file or are required to file periodic reports with the Securities and Exchange Commission, under the Securities Exchange Act of 1934.
The Sarbanes-Oxley Act includes specific additional disclosure requirements and requires the Securities and Exchange Commission and national securities exchanges to adopt extensive additional disclosure, corporate governance and other related rules. The Sarbanes-Oxley Act represents significant federal involvement in matters traditionally left to state regulatory systems, such as the regulation of the accounting profession, and to state corporate law, such as the relationship between a board of directors and management and between a board of directors and its committees.
Federal Securities Laws. Citizens South Banking Corporation common stock is registered with the Securities and Exchange Commission under the Securities Exchange Act of 1934. Citizens South Banking Corporation is subject to the information, proxy solicitation, insider trading restrictions and other requirements under the Securities Exchange Act of 1934. Shares of common stock purchased by persons who are not affiliates of Citizens South Banking Corporation may be resold without registration. Shares purchased by an affiliate of Citizens South Banking Corporation will be subject to the resale restrictions of Rule 144 under the Securities Act of 1933. If Citizens South Banking Corporation meets the current public information requirements of Rule 144 under the Securities Act of 1933, each affiliate of Citizens South Banking Corporation that complies with the other conditions of Rule 144, including those that require the affiliate’s sale to be aggregated with those of other persons, would be able to sell in the public market, without registration, a number of shares not to exceed, in any three-month period, the greater of 1% of the outstanding shares of Citizens South Banking Corporation, or the average weekly volume of trading in the shares during the preceding four calendar weeks. In the future, Citizens South Banking Corporation may permit affiliates to have their shares registered for sale under the Securities Act of 1933.
Taxation
Federal. The Company and the Bank are subject to the provisions of the Internal Revenue Code of 1986, as amended (the “Code”) in the same general manner as other corporations. For federal income tax purposes, the Bank reports its income and expenses on the accrual method of accounting and uses a tax year ending December 31 for filing its federal income tax returns.
The Small Business Protection Act of 1996 (the “1996 Act”) eliminated the use of the reserve method of accounting for bad debt reserves by savings institutions, effective for taxable years beginning after 1995. Prior to the 1996 Act, the Bank was permitted to establish a reserve for bad debts and to make annual additions to the reserve.
State of North Carolina. Under North Carolina law, the corporate income tax is 6.9% of federal taxable income as computed under the Code, subject to certain prescribed adjustments. In addition, an annual state franchise tax is imposed at a rate of 0.15% applied to the greatest of the company’s capital stock, surplus and undivided profits, investment in tangible property in North Carolina or 55% of the appraised valuation of property in North Carolina.
State of Delaware. Delaware franchise taxes are imposed on the Company. Two methods are provided for calculating the tax and the lesser tax is payable. The first method is based on the authorized number of shares. The tax under this method is $90.00 for the first 10,000 authorized number of shares plus $50.00 for each additional 10,000 shares or part thereof. The second method is based on an assumed par value capital. The tax rate under this method is $200 per $1,000,000 or portion thereof of assumed par value capital. Assumed par is computed by dividing total assets by total issued shares (including treasury shares). Assumed par value capital is calculated by multiplying the lesser of assumed par or stated par value by total authorized shares.
6
You should consider carefully the following risk factors in evaluating an investment in the shares of Citizens South Banking Corporation common stock.
Changes in market interest rates could adversely affect the Company’s financial condition and results of operations.
Citizens South Banking Corporation’s results of operations and financial condition are affected by changes in interest rates. The Company’s results of operations depend substantially on net interest income, which is the difference between the interest income earned on interest-earning assets and the interest expense paid on interest-bearing liabilities. Because interest-earning assets generally reprice or mature more quickly than interest-bearing liabilities, a decrease in interest rates generally would result in a decrease in the Company’s net interest income. Based on results generated by its interest rate risk model, an immediate and sustained decrease of 300 basis points throughout the yield curve would decrease its annual net interest income by 4.8% for the period ended December 31, 2007. The assumptions used in the model do not provide for actions that may be taken by management during the period to offset the effects of changes in interest rates on net interest income. We are also subject to reinvestment risk associated with changes in interest rates. Changes in interest rates may affect the average life of loans and mortgage-related securities. Decreases in interest rates can result in increased prepayments of loans and mortgage-related securities, as borrowers refinance to reduce borrowing costs. Under these circumstances, the Company is subject to reinvestment risk to the extent that it is unable to reinvest the cash received from such prepayments at rates that are comparable to the rates on existing loans and securities. Additionally, increases in interest rates may decrease loan demand and make it more difficult for borrowers to repay adjustable rate loans.
Changes in interest rates also affect the value of Citizens South Banking Corporation’s interest-earning assets, and in particular its securities portfolio. Generally, the value of securities fluctuates inversely with changes in interest rates. At December 31, 2006, The Company’s investment and mortgage-backed securities available for sale totaled $126.0 million. Unrealized losses on securities available for sale, net of tax, amounted to $991,000 and are reported as a separate component of stockholders’ equity. Decreases in the fair value of securities available for sale, therefore, could have an adverse effect on stockholders’ equity.
A prolonged period with a flat or inverted yield curve could reduce future earnings.
Since June 30, 2004, the Federal Reserve Board has increased its target for the federal funds rate from 1.0% to 5.25%. While these short-term interest rates have increased, longer-term market interest rates have not increased to the same degree. This “flattening” of the yield curve has had a negative impact on our interest rate spread and net interest margin, as our cost of deposits and borrowings has increased at a faster rate than our yield on loans and investments. A prolonged period of time with a “flat” or “inverted” (short-term interest rates are higher than long-term interest rates) could result in continued margin compression, which would have a negative effect on our profitability.
A slowdown in our local economy could impair the ability of our customers to repay their loans.
We have added a significant number of loans over the past five years from new relationships as we have entered new markets through acquisitions and de novo offices. As a result, our loan portfolio may not be as seasoned as the loan portfolios of our competitors in some of these new markets. Should local real estate markets or economies weaken, we may begin to experience higher default rates resulting in increased levels of non-performing loans, which would likely result in higher loan losses and reduced earnings.
The Company’s commercial real estate loan portfolio exposes the Company to increased lending risks.
At December 31, 2006, Citizens South Banking Corporation’s portfolio of commercial real estate, multifamily, and construction loans totaled $329.5 million, or 63.96% of total gross loans. These types of loans generally expose a lender to greater risk of non-payment and loss than one- to four-family residential mortgage loans because repayment of the loans often depends on the successful operations and the income stream of the borrowers. Such loans typically involve larger loan balances to single borrowers or groups of related borrowers compared to one- to four-family residential mortgage loans. Also, many of the Company’s borrowers have more than one commercial loan outstanding. Consequently, an adverse development with respect to one loan or one credit relationship can expose the Company to a significantly greater risk of loss compared to an adverse development with respect to a one- to four-family residential mortgage loan.
7
Strong competition within our market areas may limit our growth and profitability.
We face numerous competitors in both our community banking and mortgage banking operations in our primary market area which is the Charlotte, North Carolina metropolitan area. We compete for loan and deposit growth with large banks that have either a regional or a national presence, other community banks, de novo financial institutions, thrifts or savings institutions, credit unions, brokerage and insurance firms, and other nonbank businesses, such as retailers that engage in consumer financing activities. Price competition for loans and deposits might result in earning less on our loans and paying more on our deposits, which would reduce our net interest income. Competition also makes it more challenging to grow loans and deposits and to hire and retain experienced employees. Some of the institutions with which we compete have substantially greater resources and lending limits than we do and may offer services that we do not provide. We expect competition to continue to increase in the future as a result of legislative, regulatory, and technological changes and the continuing trend of consolidation in the financial services industry.
The mortgage banking business is also highly competitive, with both large and small bank and nonbank mortgage originators competing in our mortgage banking markets. We conduct our mortgage banking operations in the Charlotte, North Carolina metropolitan area.
If the Company’s allowance for loan losses is not sufficient to cover actual loan losses, then our earnings could decrease.
We make various assumptions and judgments about the collectibility of our loan portfolio, including the creditworthiness of our borrowers and the value of the real estate and other assets serving as collateral for the repayment of many of our loans. In determining the amount of allowance for loan losses, we review our loan loss and delinquency experience, we evaluate current local economic conditions, and we analyze the collateral position of our loan portfolio. If our assumptions are incorrect, our allowance for loan losses may not be sufficient to cover losses inherent in our loan portfolio, resulting in increases to our allowance. Material additions to our allowance would materially decrease our net income.
In addition, federal regulators periodically review our allowance for loan losses and may require us to increase our provision for loan losses or recognize additional loan charge-offs. Any increase in our allowance for loan losses or loan charge-offs as required by these regulatory authorities could have a material adverse effect on our financial condition and results of operations.
The Company operates in a highly regulated environment and may be adversely affected by changes in laws and regulations.
Citizens South Banking Corporation and its subsidiaries are highly regulated. Our holding company is regulated by the Office of Thrift Supervision and the Securities and Exchange Commission. Our community banking subsidiary is also regulated by the Office of Thrift Supervision. Such regulation and supervision govern the activities in which we may engage and are intended primarily for the protection of the deposit insurance fund and depositors. Regulatory authorities have extensive discretion in connection with their supervisory and enforcement activities, including the imposition of restrictions on the operation of an institution, the classification of assets by the institution and the adequacy of an institution’s allowance for loan losses. Any change in such regulation and oversight, whether in the form of regulatory policy, regulations or legislation, may have a material impact on the Company’s operations. In addition to the risks of noncompliance, we are required to dedicate considerable time and monetary resources in our efforts to comply with the numerous laws and regulations that govern the ways in which we conduct our community banking and mortgage banking activities.
8
Various factors may make takeover attempts more difficult to achieve.
Citizens South Banking Corporation’s board of directors has no current intention to sell control of the Company. Provisions of the Company’s certificate of incorporation and bylaws, federal regulations, Delaware law and various other factors may make it more difficult for companies or persons to acquire control of Citizens South Banking Corporation without the consent of its board of directors. As a Citizens South Banking Corporation stockholder, you may want a takeover attempt to succeed because, for example, a potential acquirer could offer a premium over the then-prevailing price of Citizens South Banking Corporation’s common stock. The factors that may discourage takeover attempts or make them more difficult include:
Certificate of incorporation and statutory provisions. Provisions of the certificate of incorporation and bylaws of Citizens South Banking Corporation and Delaware law may make it more difficult and expensive to pursue a takeover attempt that management opposes. These provisions also would make it more difficult to remove Citizens South Banking Corporation’s current board of directors or management, or to elect new directors. These provisions include limitations on voting rights of beneficial owners of more than 10% of its common stock, supermajority voting requirements for certain business combinations and the election of directors to staggered terms of three years. Citizens South Banking Corporation’s bylaws also contain provisions regarding the timing and content of stockholder proposals and nominations and qualification for service on the board of directors.
Required change in control payments and issuance of stock options and recognition plan shares. Citizens South Banking Corporation has entered into employment agreements and change of control agreements with certain executive officers, which will require payments to be made to them in the event their employment is terminated following a change in control of Citizens South Banking Corporation or Citizens South Bank. Citizens South Banking Corporation also has adopted plans to permit additional issuances of stock options and recognition plan shares to key employees and directors that will require payments to them in connection with a change in control of Citizens South Banking Corporation. These payments will have the effect of increasing the costs of acquiring Citizens South Banking Corporation, thereby discouraging future takeover attempts.
Citizens South Banking Corporation’s stock-based benefit plans may dilute your ownership interest.
Citizens South Banking Corporation has adopted stock option plans and recognition and retention plans. These stock-based benefit plans can be funded from the issuance of authorized but unissued shares of common stock or through open market purchases by the Company. The Company currently is purchasing shares of its common stock in a Board-authorized share repurchase program. Stockholders will experience a reduction or dilution in ownership interest in the event newly issued shares, instead of repurchased shares, are used to fund stock option exercises and stock awards.
ITEM 1.B. | Unresolved Staff Comments |
None.
9
The following table sets forth certain information regarding offices currently in operation at December 31, 2006. Management considers the facilities to be well maintained and sufficiently suitable for present operations. The net book value of the properties, including land, building, and leasehold improvements, net of accumulated depreciation was $16.3 million at December 31, 2006.
Location | | Principal Use | | Approximate
Facility Size | | Owned
or Leased |
| |
| |
| |
|
| | | | (square feet) | | |
519 South New Hope Road | | Headquarters and | | 22,400 | | Owned |
Gastonia, North Carolina 28054-4040 | | Banking Office | | | | |
245 West Main Avenue | | Banking Office and | | 12,400 | | Owned |
Gastonia, North Carolina 28052-4140 | | Back Office Processing | | | | |
192 East Woodrow Avenue | | Banking Office | | 3,400 | | Owned |
Belmont, North Carolina 28012-3163 | | | | | | |
233 South Main Street | | Banking Office | | 2,370 | | Owned |
Mount Holly, North Carolina 28120-1620 | | | | | | |
1670 Neal Hawkins Road | | Banking Office and | | 5,320 | | Owned |
Gastonia, North Carolina 28056-6429 | | Mortgage Center | | | | |
3135 Dallas High Shoals Highway | | Banking Office | | 3,225 | | Owned |
Dallas, North Carolina 28034-1307 | | | | | | |
412 South Highway 27 | | Banking Office | | 3,225 | | Owned |
Stanley, North Carolina 28164-2055 | | | | | | |
401 West Innes Street | | Banking Office | | 5,560 | | Owned |
Salisbury, North Carolina 28144-4232 | | | | | | |
106 West Main Street | | Banking Office | | 1,500 | | Owned |
Rockwell, North Carolina 28138-8859 | | | | | | |
307 North Center Street | | Banking Office and | | 8,260 | | Owned |
Statesville, North Carolina 28677-4063 | | Leased Space | | | | |
19410 Jetton Road, Suite 110 | | Loan Production Office | | 1,490 | | Leased |
Cornelius, North Carolina 28031-4403 | | | | | | |
1348 Ebenezer Road, Suite 101 | | Loan Production Office | | 1,590 | | Leased |
Rock Hill, South Carolina 29732-2727 | | | | | | |
310 West Franklin Street | | Banking Office | | 4,692 | | Leased |
Monroe, North Carolina 28112-4704 | | | | | | |
13731 Providence Road | | Banking Office | | 2,520 | | Owned |
Weddington, North Carolina 28104-8615 | | | | | | |
101 Stallings Road | | Banking Office | | 3,560 | | Leased |
Stallings, North Carolina 28104-5065 | | | | | | |
649 Brawley School Road | | Banking Office | | 3,800 | | Owned |
Mooresville, North Carolina 28177-9121 | | | | | | |
10
Periodically, there have been various claims and lawsuits involving the Company or the Bank, such as claims to enforce liens, condemnation proceedings on properties in which we hold security interests, claims involving the making and servicing of real property loans and other issues incident to our business. We are not a party to any pending legal proceedings that we believe would have a material adverse effect on the financial condition, operations, or cash flows of the Company or the Bank.
ITEM 4. | Submission of Matters to a Vote of Security Holders |
No matters were submitted to a vote of the security holders during the fourth quarter of 2006.
PART II
ITEM 5. | Market for Registrant’s Common Stock, Related Stockholder Matters and Issuer Purchases of Equity Securities |
a. The Company’s common stock, $0.01 par value per share, trades on the Nasdaq Global Market under the ticker symbol CSBC. Price and volume information is contained in The Wall Street Journal and other daily newspapers in the Nasdaq section under the Global Market System listings. As of February 1, 2007, the Company had 1,626 stockholders of record (excluding the number of persons or entities holding stock in street name through various brokerage firms), and 8,023,447 shares outstanding. The following brokers made a market in the Company’s stock during 2006:
| Citigroup Global Markets, Inc. | 1-800-223-7743 |
| Fig Partners, LLC | 1-404-601-7200 |
| Friedman, Billings, Ramsey & Co. | 1-800-688-3272 |
| FTN Midwest Securities Corp. | 1-800-880-7264 |
| Howe Barnes Investments, Inc. | 1-800-621-2364 |
| Keefe, Bruyette & Woods, Inc. | 1-800-342-5529 |
| Knight Equity Markets, L.P. | 1-800-222-4910 |
| Merrill Lynch, Pierce, Fenner | 1-800-937-0501 |
| Morgan Keegan & Co., Inc. | 1-800-238-7533 |
| Morgan Stanley & Co., Inc. | 1-800-223-6559 |
| Ryan Beck & Co., Inc. | 1-800-325-7926 |
| Sandler O’Neill & Partners | 1-212-466-8020 |
| Sterne, Agee & Leach | 1-800-239-2408 |
| UBS Capital Markets L.P. | 1-203-719-7400 |
11
The following table sets forth quarterly market sales price ranges, dividend information, and repurchase activity for the Company’s common stock over the past two years.
2006 | | Quarter 1 | | Quarter 2 | | Quarter 3 | | Quarter 4 | |
| |
|
| |
|
| |
|
| |
|
| |
Price Range: | | | | | | | | | | | | | |
High | | $ | 13.35 | | $ | 12.80 | | $ | 13.86 | | $ | 13.28 | |
Low | | | 12.35 | | | 11.94 | | | 12.25 | | | 12.57 | |
Dividend | | | 0.075 | | | 0.075 | | | 0.075 | | | 0.075 | |
Shares Repurchased | | | 18,263 | | | 41,000 | | | 52,825 | | | 95,000 | |
Avg. Price Paid Per Share | | $ | 12.15 | | | 12.43 | | $ | 12.87 | | $ | 12.91 | |
2005 | | Quarter 1 | | Quarter 2 | | Quarter 3 | | Quarter 4 | |
| |
|
| |
|
| |
|
| |
|
| |
Price Range: | | | | | | | | | | | | | |
High | | $ | 14.25 | | $ | 13.90 | | $ | 12.80 | | $ | 12.75 | |
Low | | | 12.91 | | | 11.76 | | | 11.41 | | | 11.70 | |
Dividend | | | 0.07 | | | 0.07 | | | 0.07 | | | 0.07 | |
Shares Repurchased | | | 184,600 | | | 0 | | | 48,300 | | | 211,023 | |
Avg. Price Paid Per Share | | $ | 13.56 | | | NA | | $ | 12.44 | | $ | 12.09 | |
12
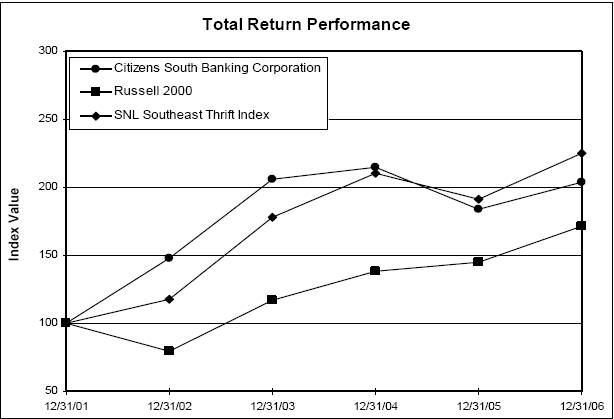
Set forth herein under is a stock performance graph comparing (a) the cumulative total return on the common stock for the period beginning with the last trade of Citizens South Banking Corporation’s stock on December 31, 2001, as reported on the Nasdaq Stock Market, through December 31, 2006, (b) the cumulative total return on stocks included in the Russell 2000 index over such period, and (c) the cumulative total return on stocks included in the SNL Southeast Thrift Index over such period. Cumulative return assumes the reinvestment of dividends, and is expressed in dollars based on an assumed initial investment of $100.
Citizens South Banking Corporation
| | Period Ending | |
| |
| |
Index | | 12/31/01 | | 12/31/02 | | 12/31/03 | | 12/31/04 | | 12/31/05 | | 12/31/06 | |
| |
|
| |
|
| |
|
| |
|
| |
|
| |
|
| |
Citizens South Banking Corporation | | | 100.00 | | | 147.91 | | | 206.12 | | | 214.98 | | | 183.92 | | | 203.89 | |
Russell 2000 | | | 100.00 | | | 79.52 | | | 117.09 | | | 138.55 | | | 144.86 | | | 171.47 | |
SNL Southeast Thrift Index | | | 100.00 | | | 117.30 | | | 177.89 | | | 210.29 | | | 191.37 | | | 224.90 | |
There can be no assurance that the common stock’s performance will continue in the future with the same or similar trend depicted in the graph. Citizens South Banking Corporation will not make or endorse any predictions as to future performance.
13
b. Not applicable.
c. During the three-month period ended December 31, 2006, the Company repurchased the following shares of stock.
2006 | | Total
Number of
Shares
Purchased | | Average
Price Paid
per Share | | Total Number of Shares
Purchased as Part of the
Current Repurchase Plan | | Maximum Number of
Shares that May be
Purchased Under Current
Repurchase Plan | |
| |
|
| |
|
| |
|
| |
|
| |
October | | | 29,000 | | $ | 12.94 | | | 29,000 | | | 73,989 | |
November | | | 44,000 | | $ | 12.88 | | | 44,000 | | | 29,989 | |
December | | | 22,000 | | $ | 12.92 | | | 22,000 | | | 7,989 | |
Total | | | 95,000 | | $ | 12.91 | | | 95,000 | | | 7,989 | |
On January 23, 2006, the Board of Directors of the Company authorized the repurchase of up to 200,000 shares, or approximately 5% of the Company’s then outstanding shares of common stock. These repurchases may be carried out through open market purchases, block trades, and negotiated private transactions. The stock may be repurchased on an ongoing basis and will be subject to the availability of stock, general market conditions, the trading price of the stock, alternative uses for capital, and the Company’s financial performance. As of December 31, 2006, the Company had repurchased a total of 192,011 shares at an average price of $12.78 per share and had 7,989 shares remaining to be repurchased under this plan. The Company will consider repurchasing additional shares of common stock of the Company at prices management considers to be attractive and in the best interests of both the Company and its stockholders. Any repurchased shares will be held as treasury stock and will be available for general corporate purposes.
On February 28, 2005, the Board of Directors of the Company authorized the repurchase of up to 370,000 shares, or approximately 5%, of the Company’s then outstanding shares of common stock. This stock repurchase program was completed in March 2006, with the repurchase of 370,000 shares at an average price of $12.49. In May 2004, the Company authorized the repurchase of up to 815,000 shares, or approximately 10% of the then outstanding shares. This program was completed in March 2005, with the repurchase of 815,000 shares at an average price of $13.09.
14
ITEM 6. | Selected Financial Data |
The following table sets forth certain information concerning the financial position of Citizens South Banking Corporation and its subsidiaries as of and for the dates indicated. The consolidated data is derived from, and should be read in conjunction with the Consolidated Financial Statements of the Company and its subsidiaries and related notes presented in Item 8.
| | At and for the years ended December 31, | |
| |
| |
(Dollars in thousands, except per share data) | | 2006 (1) | | 2005 (1) | | 2004 | | 2003 | | 2002 | |
| |
|
| |
|
| |
|
| |
|
| |
|
| |
Income Statement Data: | | | | | | | | | | | | | | | | |
Interest income | | $ | 42,919 | | $ | 26,948 | | $ | 21,110 | | $ | 21,969 | | $ | 24,716 | |
Interest expense | | | 22,279 | | | 11,469 | | | 7,943 | | | 8,732 | | | 10,195 | |
| |
|
| |
|
| |
|
| |
|
| |
|
| |
Net interest income | | | 20,640 | | | 15,479 | | | 13,167 | | | 13,237 | | | 14,521 | |
Provision for loan losses | | | 1,165 | | | 985 | | | 330 | | | 60 | | | 225 | |
| |
|
| |
|
| |
|
| |
|
| |
|
| |
Net interest income after provision for loan losses | | | 19,475 | | | 14,494 | | | 12,837 | | | 13,177 | | | 14,296 | |
Noninterest income | | | 6,141 | | | 4,441 | | | 4,824 | | | 5,561 | | | 4,121 | |
Noninterest expense | | | 17,544 | | | 14,339 | | | 13,629 | | | 13,891 | | | 11,381 | |
| |
|
| |
|
| |
|
| |
|
| |
|
| |
Income before income taxes | | | 8,072 | | | 4,596 | | | 4,032 | | | 4,847 | | | 7,036 | |
Income tax expense | | | 2,617 | | | 1,323 | | | 1,077 | | | 1,456 | | | 2,528 | |
| |
|
| |
|
| |
|
| |
|
| |
|
| |
Net income | | $ | 5,455 | | $ | 3,273 | | $ | 2,955 | | $ | 3,391 | | $ | 4,508 | |
| |
|
| |
|
| |
|
| |
|
| |
|
| |
Per Share Data: | | | | | | | | | | | | | | | | |
Basic net income | | $ | 0.68 | | $ | 0.45 | | $ | 0.39 | | $ | 0.39 | | $ | 0.51 | |
Diluted net income | | | 0.67 | | | 0.45 | | | 0.38 | | | 0.39 | | | 0.51 | |
Cash dividends declared | | | 0.30 | | | 0.28 | | | 0.26 | | | 0.24 | | | 0.16 | |
Year-end book value | | | 10.61 | | | 10.16 | | | 9.74 | | | 10.11 | | | 10.64 | |
Balance Sheet Data: | | | | | | | | | | | | | | | | |
Total assets | | $ | 743,370 | | $ | 701,094 | | $ | 508,961 | | $ | 495,751 | | $ | 492,873 | |
Loans receivable, net | | | 509,638 | | | 468,232 | | | 314,124 | | | 295,026 | | | 299,906 | |
Mortgage-backed and related securities | | | 60,691 | | | 70,236 | | | 81,169 | | | 89,168 | | | 70,409 | |
Investment securities | | | 65,326 | | | 53,429 | | | 52,407 | | | 56,233 | | | 39,594 | |
Deposits | | | 562,802 | | | 517,544 | | | 374,744 | | | 342,446 | | | 340,862 | |
Borrowings | | | 85,964 | | | 91,342 | | | 55,772 | | | 58,981 | | | 47,575 | |
Stockholders’ equity | | | 85,961 | | | 84,258 | | | 72,394 | | | 87,699 | | | 96,383 | |
Performance Ratios: | | | | | | | | | | | | | | | | |
Return on average assets | | | 0.76 | % | | 0.60 | % | | 0.59 | % | | 0.68 | % | | 0.98 | % |
Return on average equity | | | 6.42 | | | 4.40 | | | 3.78 | | | 3.61 | | | 7.61 | |
Avg. interest-earning assets to avg. interest-bearing liabilities | | | 106.53 | | | 109.40 | | | 110.96 | | | 118.65 | | | 109.19 | |
Noninterest expense to average total assets | | | 2.45 | | | 2.64 | | | 2.73 | | | 2.81 | | | 2.48 | |
Interest rate spread | | | 3.07 | | | 3.00 | | | 2.78 | | | 2.57 | | | 3.26 | |
Net interest margin (2) | | | 3.30 | | | 3.23 | | | 2.98 | | | 2.94 | | | 3.48 | |
Asset Quality Ratios: | | | | | | | | | | | | | | | | |
Allowance for loan losses to total loans | | | 1.12 | % | | 1.08 | % | | 0.95 | % | | 1.00 | % | | 0.99 | % |
Net charge-offs to average loans | | | 0.10 | | | 0.12 | | | 0.09 | | | 0.03 | | | 0.11 | |
Nonperforming loans to total loans | | | 0.58 | | | 0.54 | | | 0.30 | | | 0.18 | | | 0.17 | |
Nonperforming assets to total assets | | | 0.42 | | | 0.53 | | | 0.34 | | | 0.14 | | | 0.37 | |
Capital Ratios: | | | | | | | | | | | | | | | | |
Average equity to average total assets | | | 11.86 | % | | 13.69 | % | | 15.64 | % | | 18.96 | % | | 12.93 | % |
Equity to assets at year end | | | 11.56 | | | 12.02 | | | 14.22 | | | 17.68 | | | 19.56 | |
Dividend payout ratio (3) | | | 44.12 | | | 62.22 | | | 66.67 | | | 61.54 | | | 31.37 | |
|
(1) | Includes operations of Trinity Bank which was acquired on October 31, 2005. |
(2) | Net interest margin is calculated by dividing net interest income by average interest-earning assets for the period. |
(3) | Dividend payout ratio is calculated by dividing cash dividends per share declared for the period by net income per share for the period. Citizens South Holdings, MHC, the former mutual holding company for Citizens South Banking Corporation, began waiving dividends in August 2000 and as of September 30, 2002, had waived dividends totaling approximately $1.8 million. The MHC owned between 53% and 58% of the outstanding common stock of the Company during the periods in which the dividends were waived. |
15
ITEM 7. | Management’s Discussion and Analysis of Financial Condition and Results of Operations |
Overview of Financial Condition and Results of Operations.
Citizens South Banking Corporation (the “Company”) is a Delaware corporation that owns all of the outstanding shares of common stock of Citizens South Bank (the “Bank”), a federally chartered savings bank headquartered in Gastonia, North Carolina. The Company’s principal business activities are overseeing and directing the business of the Bank and investing the net stock offering proceeds retained by the Company. The Company’s assets consist primarily of the outstanding capital stock of the Bank, deposits held at the Bank, and investment securities. The Bank’s principal business activity is offering FDIC-insured deposit accounts to local customers through its 14 branch offices and investing those deposits, together with funds generated from operations and borrowings, in residential and nonresidential real estate loans, construction loans, commercial business loans, consumer loans, investment securities, and mortgage-backed securities. The Bank also acts as a broker in both the origination of loans secured by one-to-four family dwellings and in the sale of uninsured financial products (see Item 1. “Business” of this report).
Our primary business strategy since our initial public stock offering in 1998 has been to transform the Bank from a traditional savings bank to a full-service community bank, offering a complete array of both commercial and retail loan and deposits, wealth management services, mortgage banking activities, brokerage services, and other related financial services. In executing this strategy, the Company has 1) concentrated much of its lending efforts on nonresidential real estate and construction loans, 2) originated substantially all fixed-rate one-to-four family residential loans as a broker for a third party, and 3) focused its deposit gathering efforts on core deposits (demand deposit accounts, money market accounts, and savings accounts). As a result, nonresidential real estate and construction loans comprised approximately 64% of the Company’s loan portfolio at December 31, 2006, compared to approximately 29% at December 31, 2002. Also, during the same period, the Company’s portfolio of one-to-four family residential loans decreased from 46% of the Company’s loan portfolio at December 31, 2002, to 16% of the Company’s loan portfolio at December 31, 2006. Core deposits have increased as a percentage of total deposits from approximately 34% at December 31, 2002 to approximately 40% at December 31, 2006. Management expects to continue to execute this business strategy in 2007.
On October 31, 2005, the Company consummated the merger of Trinity Bank (“Trinity”) into Citizens South Bank. At the time of the acquisition, Trinity had total assets of $165.5 million, net loans of $112.8 million, deposits of $135.6 million, borrowed money of $14.0 million and equity of $13.3 million. Trinity was headquartered in Monroe, North Carolina, which is approximately 50 miles east of the Company’s headquarters. Trinity had three offices located in Union County, North Carolina, which had the fastest population growth of any county in North Carolina. The combined bank had 14 full-service locations and two loan production offices, and ranked 8th in the Charlotte Metropolitan Statistical Area in deposit market share.
Under the terms of the merger agreement, the Company issued a combination of common stock and cash for the outstanding common shares of Trinity Bank. Trinity shareholders were given the option of receiving 1.3931 shares of Citizens South common stock for each share of Trinity common stock, $18.25 in cash for each share of Trinity common stock, or a mixture of stock and cash for each Trinity share, such that 50% of the shares of Trinity common stock will be exchanged for Citizens South common stock. On October 31, 2005, Trinity shareholders received merger consideration of approximately 1,280,052 shares of common stock of the Company (subject to payment of cash in lieu of fractional shares) and approximately $16.8 million in cash (including cash paid in lieu of fractional shares), resulting in a total transaction value of approximately $37.8 million. The transaction price represented approximately 255% of Trinity’s book value. Additional information regarding this transaction may be obtained by reviewing the Registration Statement that the Company filed with the Securities and Exchange Commission on August 1, 2005, and amended September 14, 2005.
In order to provide financing for the cash portion of the Trinity acquisition, on October 28, 2005, the Company completed a private placement of an aggregate amount of $15.0 million in trust preferred securities, liquidation amount of $1,000 per security (the “Preferred Securities”), through a newly formed Delaware statutory trust subsidiary, CSBC Statutory Trust I (the “Trust”). In connection with the issuance of the Preferred Securities, on October 28, 2005, the Company entered into an Indenture by and between the Company and Wilmington Trust Company, as trustee. The Preferred Securities mature on December 15, 2035, but may be redeemed beginning December 15, 2010, if the Company exercises its rights to redeem the Debentures. The Preferred Securities require quarterly interest payments to the holders of the Preferred Securities, initially at a fixed rate of 6.095% through December 2010, and thereafter at a variable rate of three-month LIBOR plus 1.57%, reset quarterly. Additional information regarding the Preferred Securities may be obtained by reviewing the Form 8-K filed with the Securities and Exchange Commission on November 4, 2005.
16
On September 30, 2002, the Company’s mutual holding company completed its mutual-to-stock conversion and related stock offering, resulting in an equity to assets ratio of 19.56% at December 31, 2002. In order to leverage the Company’s capital position, the Company has executed a number of strategies including 1) repurchasing Company stock at prices that are considered attractive, 2) paying dividends on outstanding stock, 3) building new banking offices in areas that the Company believes improve the value of the franchise, and 4) strategically pursuing acquisitions of other financial institutions or related companies. As of December 31, 2006, the Company had repurchased a total of 2,596,446 shares, or 28.7% of the outstanding shares of common stock, at an average price of $13.30. As a result of the execution of these capital management strategies, the Company’s equity to assets ratio was 11.56% at December 31, 2006. Management plans to continue to execute these strategies until it believes the Company’s capital is appropriately leveraged.
The Bank’s results of operations are heavily dependent on net interest income, which is the difference between the interest earned on loans and securities and the interest paid on deposits and borrowings. Results of operations are also materially affected by the Bank’s provision for loan losses, gains or losses from the sales of assets, fee income generated from deposit and loan accounts, commissions earned from the sale of uninsured investment products, and noninterest expenses. The Bank’s noninterest expense primarily consists of compensation and employee benefits, occupancy expense, professional services, advertising, and other noninterest expenses. Results of operations are also significantly affected by general economic and competitive conditions, changes in interest rates, and actions of regulatory and governmental authorities.
Net income was $5.5 million, or $0.67 per diluted share, for the year ended December 31, 2006, compared to $3.3 million, or $0.45 per diluted share, for the year ended December 31, 2005. The earnings resulted in a return on average equity of 6.42% in 2006, compared to 4.40% in 2005, and a return on average assets of 0.76% in 2006, compared to 0.60% in 2005.
Certain actions have been taken that have adversely impacted our results of operations for the years ended December 31, 2005 and 2004. In 2005 we acquired Trinity Bank, resulting in merger and computer conversion related expenses of $384,000. In 2004, we determined that unrealized losses on $2.0 million in perpetual preferred stock issued by Fannie Mae and $2.0 million in perpetual preferred stock issued by Freddie Mac were “other-than-temporary” impairments. As a result, management recorded a noncash, pretax loss of $983,000. All of these securities were sold during 2005 and the Company did not have any other perpetual preferred stock on its books at December 31, 2006.
Management’s Discussion and Analysis is provided to assist in understanding and evaluating the results of operations and financial condition of the Company and its subsidiaries. The following discussion should be read in conjunction with the consolidated financial statements and related notes included in Item 8. of this report.
Forward-Looking Statements
This report contains certain forward-looking statements that represent the Company’s expectations or beliefs concerning future events. Such forward-looking statements are based on our current beliefs and expectations and are inherently subject to significant business, economic, and competitive uncertainties and contingencies, many of which are beyond our control. These forward-looking statements are based on assumptions with respect to future business strategies and decisions that are subject to change based on changes in the economic and competitive environment in which we operate. Forward-looking statements speak only as of the date they are made and the Company is under no duty to update these forward-looking statements or to reflect the occurrence of unanticipated events. A number of factors could cause actual conditions, events, or results to differ significantly from those described in the forward-looking statements. Factors that could cause such a difference include, but are not limited to, the timing and amount of revenues that may be recognized by the Company, changes in local or national economic trends, increased competition among depository and financial institutions, continuation of current revenue and expense trends (including trends affecting chargeoffs and provisions for loan losses), and adverse legal, regulatory or accounting changes. Because of the risks and uncertainties inherent in forward-looking statements, readers are cautioned not to place undue reliance on these statements. Readers should carefully review the risk factors described in other documents the Company files from time to time with the SEC, including annual reports on Form 10-K, quarterly reports on Form 10-Q, and Current Reports on Form 8-K.
17
Critical Accounting Policies
The accounting and financial policies of the Company and its subsidiaries are prepared in accordance with accounting principles generally accepted in the United States and conform to general practices in the banking industry. We consider accounting policies that require significant judgment and assumptions by management that have, or could have, a material impact on the carrying value of certain assets or on income to be critical accounting policies. Changes in underlying factors, assumptions or estimates could have a material impact on our future financial condition and results of operations. Based on the size of the item or significance of the estimate, the following accounting policies are considered critical to our financial results.
Allowance for Loan Losses. The allowance for loan losses is calculated with the objective of maintaining an allowance sufficient to absorb estimated probable loan losses inherent in the Bank’s portfolio at the measurement date. Management’s determination of the adequacy of the allowance is based on quarterly evaluations of the loan portfolio and other relevant factors. However, this evaluation is inherently subjective, as it requires an estimate of the loss for each type of loan and for each impaired loan, an estimate of the amounts and timing of expected future cash flows, and an estimate of the value of the collateral.
Management has established a systematic method for periodically evaluating the credit quality of the loan portfolio in order to establish an allowance for loan losses. The methodology is set forth in a formal policy and includes a review of all loans in the portfolio on which full collectibility may or may not be reasonably assured. The loan review considers among other matters, the estimated fair value of the collateral, economic conditions, historical loan loss experience, our knowledge of inherent losses in the portfolio that are probable and reasonable estimable and other factors that warrant recognition in providing an appropriate loan loss allowance. Specific allowances are established for certain individual loans that management considers impaired under Statement of Financial Accounting Standards (“SFAS”) No. 114, “Accounting by Creditors for Impairment of a Loan.” The remainder of the portfolio is segmented into groups of loans with similar risk characteristics for evaluation and analysis. In originating loans, we recognize that losses will be experienced and that the risk of loss will vary with, among other things, the type of loan being made, the creditworthiness of the borrower, the term of the loan, general economic conditions, and in the case of a secured loan, the quality of the collateral. We increase our allowance for loan losses by charging provisions for loan losses against our current period income. Management’s periodic evaluation of the adequacy of the allowance is consistently applied and is based on our past loan loss experience, particular risks inherent in the different kinds of lending that we engage in, adverse situations that may affect the borrower’s ability to repay, the estimated value of any underlying collateral, current economic conditions, and other relevant internal and external factors that affect loan collectibility. Management believes this is a critical accounting policy because this evaluation involves a high degree of complexity and requires us to make subjective judgments that often require assumptions or estimates about various matters.
Other-Than-Temporary Impairment of Securities. We have historically reviewed investment securities with significant declines in fair value for potential other-than-temporary impairment pursuant to the guidance provided by SFAS No. 115, Accounting for Certain Investments in Debt and Equity Securities. Effective December 31, 2006, management evaluated the Company’s investment portfolio and determined that all unrealized losses were the direct result of temporary changes in interest rates and that such losses may be recovered in the foreseeable future. As a result, management did not consider any unrealized losses as “other-than-temporary” as of December 31, 2006.
Effective December 31, 2004, the Company determined that unrealized losses on $2.0 million in perpetual preferred stock issued by Fannie Mae and $2.0 million in perpetual preferred stock issued by Freddie Mac were “other-than-temporary” impairments. As a result, management recorded a noncash, pretax loss of $983,000. The unrealized losses on these securities were considered to be “other-than-temporary” by management for the following reasons: 1) both Fannie Mae and Freddie Mac had experienced accounting irregularities that have resulted in restated financial results from prior periods; 2) the yield on perpetual preferred stock recently issued by Fannie Mae is much higher than the yield of the preferred stock held by the Company, which decreased the value of the Company’s securities; 3) the preferred stock for Fannie Mae was downgraded and the preferred stock for both companies was on a negative watch list; 4) the Freddie Mac preferred stock repriced in December 2004, yet it continued to have significant unrealized losses at year end; and 5) neither of the preferred stock issues had stated maturity dates, so the recovery of the unrealized losses was not expected to occur in the foreseeable future. The credit issues facing Fannie Mae and Freddie Mac only affected the performance of the Company’s perpetual preferred stock. Management sold the subject securities in 2005 and the Company did not own any other perpetual preferred stock at December 31, 2006.
18
Comparison of Financial Condition for the Years Ended December 31, 2006 and 2005
Total assets increased by $42.3 million, or 6.0%, from $701.1 million at December 31, 2005, to $743.4 million at December 31, 2006. The majority of this growth was due to a $42.1 million, or 8.9%, increase in outstanding loans from $473.3 million at December 31, 2005, to $515.4 million at December 31, 2006. Most of the Company’s loan growth was in loans secured by commercial real estate. During 2006, these loans, which include construction loans, multifamily residential loans, and nonresidential real estate loans, increased by $56.9 million, or 20.9%, to $329.5 million at December 31, 2006. These loans are typically secured by owner-occupied professional office buildings, churches, speculative residential properties, or residential subdivisions located in the Charlotte, North Carolina metropolitan area, which is the Company’s primary lending area. Management does not generally pursue commercial real estate loans that are secured by hotels, motels, golf courses, or resort properties. Management plans to continue to emphasize the origination of commercial real estate loans in the Company’s primary lending area. Also during 2006, the Company’s portfolio of one-to-four family residential loans decreased from $98.6 million to $83.3 million due to normal prepayments and principal amortization. The Company originates and closes substantially all new one-to-four family residential loans as a broker for independent third parties on a servicing-released basis. This generates additional fee income and reduces the potential adverse effects of rising interest rates on the Company’s future earnings that normally result from holding long-term fixed-rate loans. Management expects that in 2007 the Company’s portfolio of one-to-four family mortgage loans will continue to decrease as most new loan originations will be made as a broker for the third party. During 2006, consumer loans decreased by $2.0 million, or 2.8%, to $70.2 million at December 31, 2006. Approximately $56.6 million, or 80.6%, of these consumer loans were revolving home equity lines of credit secured by a second lien on residential properties. These loans typically have a loan-to-value ratio of 90% or less and are secured by owner-occupied residential properties located in the Company’s normal lending area. Management plans to grow its portfolio of consumer loans in 2007 by implementing an incentive plan for its retail branch managers and creating marketing campaigns directed toward growing outstanding home equity lines of credit. Commercial business loans increased by $2.1 million, or 6.9%, to $32.2 million. Management expects similar growth of its commercial business loans in 2007.
In order to facilitate continued loan growth during 2007, the Company plans to add at least two commercial lenders and an additional credit officer. However, the Company’s ability to grow the existing loan portfolio is largely dependent on the continued strong local economy of the Charlotte metropolitan area. Management will also continue to focus on maintaining the current credit quality of the portfolio and will not forsake the credit quality of the loan portfolio for additional growth.
Cash and cash equivalents decreased by $433,000, or 1.6%, from $26.6 million at December 31, 2005, to $26.2 million at December 31, 2006. This decrease was primarily due to loan growth of $42.1 million, a $2.4 million net increase in investment and mortgage-backed securities, a $5.6 million net decrease in borrowed money, stock repurchases of $2.6 million, and the payment of $2.4 million in cash dividends during 2006. These decreases in cash and cash equivalents were partly offset by a $45.3 million increase in deposits, net proceeds of $1.6 million from the sale of real estate acquired through foreclosure and other assets, and net income of $5.5 million during 2006. Management expects that cash and cash equivalents will continue to decrease in 2007 as excess liquidity is invested in new loans and higher-yielding investment securities.
Investment securities increased by $11.9 million, or 22.3%, from $53.4 million at December 31, 2005 to $65.3 million at December 31, 2006. This increase was primarily the result of $25.6 million in investment securities purchased in 2006. Most of the investments purchased were long-term insured bank-qualified municipal securities. These municipal securities were purchased to protect the Company’s net interest margin from decreasing interest rates and to lower the Company’s overall tax rate. Management expects to continue this investment philosophy in 2007. During 2006, the Company sold $98,000 in investment securities and experienced maturities and calls of $13.8 million in investment securities. Mortgage-backed securities decreased by $9.5 million, or 13.6%, from $70.2 million at the end of 2005, to $60.7 million at the end of 2006. This decrease was primarily due to the maturity and principal amortization of $15.0 million of mortgage-backed securities, the sale of $2.2 million of mortgage-backed securities, and the purchase of $6.9 million of mortgage-backed securities during the year. Management expects that in 2007 the principal amortization of its mortgage-backed securities portfolio will be comparable to the principal amortization experienced in 2006 as mortgage loan interest rates are expected to remain relatively flat during the year. Management plans to reinvest the proceeds received from mortgage-backed securities into higher-yielding commercial and consumer loans as cash flows are generated from these investments through maturities and principal and interest payments.
19
Premises and equipment decreased by $1.5 million, or 7.7%, to $18.2 million at December 31, 2006. Normal depreciation during 2006 amounted to $1.3 million. In addition, the Company sold two parcels of land for approximately $500,000 and opened a leased loan production office in York County, South Carolina. Plans are underway to open a full-service office in York County, South Carolina in the fourth quarter 2007. Also in 2007, the Company will be pursuing additional branch sites in its existing market area.
Total liabilities increased by $40.6 million, or 6.6%, from $616.8 million at December 31, 2005, to $657.4 million at December 31, 2006. This increase was primarily due a $45.3 million, or 8.7%, increase in deposits. Total deposits increased from $517.5 million at December 31, 2005, to $562.8 million at December 31, 2006. Core deposits, which management considers checking accounts, money market accounts, and savings accounts, increased by $10.6 million, or 5.0%, during 2006. Management is committed to increasing core deposits and building new and enhancing existing customer relationships through improving technology, expanding its branch network and focused marketing efforts. Management plans to offer its commercial customers the ability to make deposits remotely during the first quarter of 2007. Also during the first quarter of 2007, management plans to aggressively market its new high-yield checking account product to new and existing retail customers. Time deposits increased by $34.6 million, or 11.4%, to $338.6 million at December 31, 2006. Approximately $11.1 million, or 2.1% of total deposits, were brokered time deposits. Management is focused on growing its deposit base from within the Company’s market area. However, brokered time deposits will be used as an additional source of liquidity as needed.
Borrowed money decreased by $5.4 million, or 6.3%, from $91.3 million at the end of 2005 to $86.0 million at the end of 2006. Management will use borrowed money as an additional source of liquidity as needed. In addition, from time to time, management may use borrowed money to engage in various leverage strategies to increase income as opportunities arise.
Total stockholders’ equity increased by $1.7 million, or 2.0%, from $84.3 million at December 31, 2005 to $86.0 million at December 31, 2006. This increase was primarily due to the $5.5 million in net income earned in 2006 and a $576,000 decrease in accumulated net unrealized losses on investments available for sale. These increases were partly offset by the repurchase of 207,088 shares of common stock for $2.6 million at an average price of $12.67 per share. These shares were repurchased as a part of stock repurchase plans announced in February 2005 and January 2006. The February 2005 repurchase plan provided for the repurchase of 370,000 shares, or 5.0% of the outstanding shares. All of the shares authorized under this plan were repurchased by January 2006. The January 2006 repurchase plan provided for the repurchase of 200,000 shares, or 2.5% of the outstanding shares. As of December 31, 2006, the Company had repurchased 192,011 shares under the plan and had 7,989 shares remaining to be repurchased. Management plans to continue to repurchase shares of common stock in the Company at prices that are considered to be attractive and in the best interests of both the Company and its stockholders. The increase in total stockholders’ equity during 2006 was also partly offset by the payment of $2.4 million in cash dividends, or $0.30 per share.
Results of Operations
The following discussion relates to operations for the year ended December 31, 2006, compared to the year ended December 31, 2005, as well as the year ended December 31, 2005, compared to the year ended December 31, 2004. The net income of the Company is heavily dependent upon net interest income. Net interest income is the difference between the interest earned on loans, investment and mortgage-backed securities, and interest-bearing deposits in other banks, offset by the interest paid on deposits and borrowings.
20
Comparison of Results of Operations for the Years Ended December 31, 2006 and 2005
Net income was $5.5 million, or $0.67 per diluted share, for the year ended December 31, 2006, compared to $3.3 million, or $0.45 per diluted share, for the year ended December 31, 2005. The earnings resulted in a return on average equity of 6.42% in 2006, compared to 4.40% in 2005, and a return on average assets of 0.76% in 2006, compared to 0.60% in 2005.
Net interest income increased by $5.2 million, or 33.3%, to $20.6 million during the year ended December 31, 2006, compared to $15.5 million for the year ended December 31, 2005. This increase was largely due to the fact that the Company received the benefit of the Trinity acquisition for only two months in 2005 compared to the full 12 months in 2006. This increase was also due in part to a seven basis point increase in the average net interest rate spread from 3.00% for 2005 to 3.07% for 2006. This increase was largely due to a series of 25 basis point increases in the federal funds rate by the Federal Reserve Board during the first half of 2006 that resulted in a 100 basis point increase in the prime-lending rate during the year to 8.25% at December 31, 2006. Approximately 54% of the Company’s loan portfolio reprices each month, the majority of which is tied to the prime lending rate. This also contributed to a seven basis point increase in the Company’s net interest margin from 3.23% in 2005 to 3.30% in 2006. As interest rates stabilize, the Company’s net interest margin will come under some pressure as its portfolio of time deposits reprices at higher market rates without any offsetting increases in the yield on its prime-based loan portfolio. During 2006, the Company’s ratio of average interest-earning assets to average interest-bearing liabilities decreased from 109.4% in 2005 to 106.5% in 2006. This declining ratio of average interest-earning assets to average interest-bearing liabilities, which partly offset the positive effect of the increased net interest rate spread, was due primarily due to the repurchase of 207,088 shares of common stock for $2.6 million.
Interest income for the year ended December 31, 2006 increased by $16.0 million, or 59.3%, to $42.9 million. This increase was largely due to the fact that the Company received the benefit of the Trinity acquisition for only two months in 2005 compared to the full 12 months in 2006. Partly as a result of the acquisition, average interest-earning assets increased by $145.6 million, or 30.4%, from $479.5 million in 2005 to $625.1 million in 2006. In addition, due to increases in the prime lending rate during 2006, the yield on interest-earnings assets increased by 125 basis points to 6.87% for 2006. Average outstanding loans increased by $145.6 million, or 41.9%, from $347.7 million to $493.3 million, while the average yield on loans increased from 6.36% to 7.59% from 2005 to 2006. These changes were primarily the result of acquiring $112.8 million in loans in the Trinity acquisition in October 2005, organic loan growth of $42.2 million during the year, and a 100 basis point increase in the prime-lending rate during the year. As a result, interest income on loans increased by $15.3 million, or 69.2%, to $37.4 million in 2006.
Interest earned on interest-bearing bank balances increased by $375,000, or 81.0%, to $838,000 in 2006. The average balance of interest-bearing bank balances increased by $3.3 million, or 24.8%, to $16.7 million and the average yield on these deposits increased by 155 basis points to 5.01%. Interest earned on investment securities increased by $394,000, or 24.6%, to $2.0 million in 2006. This increase in interest income was primarily due to a $5.4 million, or 12.0%, increase in the average outstanding balance of investment securities to $50.5 million in 2006. The average yield on investment securities increased by 40 basis points to 3.95% for 2006 due to the increased level of short-term interest rates during 2006. Interest income from mortgage-backed securities decreased by $118,000, or 4.3%, to $2.6 million in 2006. This decrease was largely due to an $8.7 million, or 11.9%, decrease in the average balance of mortgage-backed securities to $64.5 million during 2006. Also, during 2006, the average yield on mortgage-backed securities increased from 3.76% to 4.08%, due in part to slower prepayment levels resulting from higher mortgage interest rates during the year. Management expects the levels of investment and mortgage-backed securities will decline during 2007, with the proceeds of any sales, maturities, and normal amortization, to be used to fund additional loan originations, stock repurchases, and repayments on maturing borrowed money.
Interest expense increased $10.8 million, or 94.3%, to $22.3 million for the year ended December 31, 2006. This increase was largely due to the fact that the Company received the benefit of the Trinity acquisition for only two months in 2005 compared to the full 12 months in 2006. Partly as a result of the acquisition, average interest-bearing liabilities increased by $148.5 million, or 33.9%, from $438.3 million in 2005 to $586.8 million in 2006. In addition, the average cost of funds increased by 118 basis points to 3.80% in 2006. Interest expense on deposits increased $9.1 million, or 101.7%, to $18.1 million in 2006. This increase was primarily due to a $128.5 million, or 34.5%, increase in average deposits in 2006 and a 120 basis point increase in the cost of deposits to 3.62% in 2006. Average deposits increased due to $135.6 million in deposits acquired from Trinity in October 2005 and $45.3 million in organic growth. The cost of funds increased due to the 100 basis point increase in short-term rates during 2006. Interest paid on borrowed money increased by $1.7 million, or 67.6%, to $4.2 million in 2006. Average borrowings increased by $20.0 million, or 30.2%, to $86.1 million at December 31, 2006, while the average rate paid on borrowings increased from 3.76% in 2005 to 4.85% in 2006 due to higher market interest rates in 2006. Management expects that short-term interest rates will decline slightly in 2007, resulting in lower cost of funds for deposits and borrowings.
21
The Company provided $1.2 million and $985,000 in loan loss provisions for the years ended December 31, 2006 and 2005, respectively. The allowance for loan losses as a percentage of loans was 1.12% at December 31, 2006, and 1.08% at December 31, 2005. The provision for loan losses increased due to strong organic growth in the Company’s loan portfolio of $42.1 million, coupled with net charge-offs of $505,000 during the year. The level of nonperforming loans increased by $460,000, to $3.0 million at December 31, 2006. As a result, the ratio of nonperforming loans to net loans increased from 0.54% at December 31, 2005, to 0.58% at December 31, 2006. Also, real estate owned decreased by $1.0 million to $139,000 at December 31, 2006. The properties acquired through foreclosure consist of one one-to-four family residential property and one residential lot. These properties are in various stages of disposition. As a result, the ratio of nonperforming assets to total assets decreased from 0.53% at December 31, 2005, to 0.42% at December 31, 2006. Refer to “Allowance for Loan Losses” within Item 7 for further discussion.
For the year ended December 31, 2006, noninterest income increased by $1.7 million, or 38.3%, from $4.4 million to $6.1 million. The Company experienced increases of $369,000 in fee income on deposit accounts, $709,000 from mortgage banking and lending activities, $66,000 in dividends on FHLB stock, $148,000 from the cash value of bank-owned life insurance, $124,000 increase in the fair value adjustment on deferred compensation assets, and $181,000 in other noninterest income. These increases in noninterest income were largely due to the fact that the Company received the benefit of the Trinity acquisition for only two months in 2005 compared to the full 12 months in 2006. The increase in mortgage-banking and loan fee income was also due to an increased amount of fee income from commercial loans coupled with strong mortgage-banking activity during 2006. Management expects that long-term mortgage lending rates will remain attractive in 2007, resulting in continued strong mortgage lending activity in 2007. Fee income on deposit accounts was higher largely due to the increased number of accounts which resulted in an increase in fees generated from overdrawn checking accounts. Management believes that a continued focus on growing retail and commercial checking accounts will result in a moderate improvement in fee income on deposit accounts in 2006. The increase on dividends on FHLB stock is directly related to the rate paid by the FHLB and the number of outstanding shares (based on outstanding advances). Management expects that the dividend rate paid by the FHLB will increase in 2007 due to recent increases in short-term interest rates. The increase in the fair value adjustment on deferred compensation assets is offset by a corresponding decrease in compensation expense, resulting in no net impact on net income. During 2007, the Company expects loan activity and deposit growth to remain strong resulting in increased noninterest income.
Net gain on sale of assets increased by $7,000, or 11.9%, to $69,000 in 2006. During the year ended December 31, 2006, the Company sold $98,000 in investment securities and $2.2 million in mortgage-backed securities at a net loss of $41,000. In addition, during 2006 the Company sold $648,000 in premises and equipment, and $914,000 in real estate acquired through foreclosure at a net gain of $111,000. The proceeds from these sales were used to generate funds to repurchase shares of stock and originate loans. During the year ended December 31, 2005, the Company sold $9.4 million in investment securities and $30.3 million in mortgage-backed securities at a net gain of $17,000. Most of these sales were from securities acquired from Trinity. These proceeds were primarily used to repurchase additional investments that were more reflective of the Company’s investment philosophy of investing in shorter-term investment securities and mortgage-backed securities that provide a stable level of cash flow to fund future loan growth. The Company also recognized a $45,000 net gain on sale of both $517,000 of other real estate owned and $191,000 of premises and equipment.
Noninterest expense increased by $3.2 million, or 22.3%, from $14.3 million in 2005 to $17.5 million in 2006. This increase was largely due to the acquisition of Trinity, which added approximately 35 employees and three additional full-service offices, and the opening of a new full-service office in Belmont, North Carolina. As a result, compensation expense increased by $2.1 million, or 29.2%, from $7.2 million in 2005 to $9.4 million in 2006. The Company integrated the back-office functions of Trinity during the first quarter of 2006, which resulted in a decrease of eight employees. In addition, the Company opened a loan production office in Rock Hill, South Carolina, during the first quarter of 2006, which is staffed by two additional employees. Occupancy expense increased by $513,000, or 24.4%, primarily due to the addition of four full-service offices from the beginning of 2005 to the end of 2006. The Company plans to open a full-service office in Rock Hill, South Carolina in the fourth quarter of 2007. Advertising expenses increased by $205,000, or 71.3%, from $287,000 in 2005 to $492,000 in 2006. This increase was primarily due to additional marketing expenses associated with entering the Union County market via the acquisition of Trinity Bank. Moderate increases in advertising expense are expected for 2007 as the Company plans to focus advertising efforts on increasing core deposits. The amortization of core deposit premium increased by $325,000, or 79.5%, to $734,000 in 2006. This increase was due to the amortization of the $2.3 million core deposit intangible that resulted from the Trinity Bank acquisition which is being amortized over an eight-year period on an accelerated basis. Estimated amortization expense in 2007 is expected to be $629,000. The Company also experienced moderate increases in telephone expense ($66,000), office supplies ($17,000), professional services ($10,000), deposit insurance ($11,000), and other noninterest expenses ($267,000). These increases were primarily attributable to the acquisition of Trinity Bank.
22
These increases in noninterest expenses were partly offset by a $327,000 decrease in merger related expenses. The Company experienced merger and conversion expenses in 2005 in the amount of $384,000 compared to $57,000 in 2006. No additional merger-related expenses are anticipated for 2007. In addition, data processing expense decreased by $6,000, or 1.6%, due to the consolidation during the first quarter of 2006 of the two data processing systems resulting from the merger.
The Company’s provision for income taxes was $2.6 million and $1.3 million for the years ended December 31, 2006 and 2005, respectively. The change was primarily due to a $3.5 million increase in pretax income. The effective tax rate increased from 28.8% to 32.4% due to a smaller percentage of income being derived from tax-advantaged assets such as municipal securities, U.S. Government Agency securities, and bank-owned life insurance that generate tax-exempt income. Management expects to increase its level of income generated from tax-advantaged sources in 2007, resulting in a decrease in the effective tax rate for 2007.
Comparison of Results of Operations for the Years Ended December 31, 2005 and 2004
Net income was $3.3 million, or $0.45 per diluted share, for the year ended December 31, 2005, compared to $3.0 million, or $0.38 per diluted share, for the year ended December 31, 2004. The earnings provided a return on average equity of 4.40% in 2005, compared to 3.78% in 2004, and a return on average assets of 0.60% in 2005, compared to 0.59% in 2004.
Net interest income increased by $2.3 million, or 17.6%, to $15.5 million during the year ended December 31, 2005, compared to $13.2 million for the year ended December 31, 2004. This increase was due in part to a 22 basis point increase in the average net interest rate spread from 2.78% for 2004 to 3.00% for 2005. This increase was largely due to a series of 25 basis point increases in the federal funds rate by the Federal Reserve Board that resulted in a 2.00% increase in the prime-lending rate during the year to 7.25% at December 31, 2005. Approximately 57% of the Company’s loan portfolio reprices each month, the majority of which are tied to the prime lending rate. This also contributed to a 25 basis point increase in the Company’s net interest margin from 2.98% in 2004 to 3.23% in 2005. During 2005, the Company’s ratio of average interest-bearing assets to average interest-bearing liabilities decreased from 111.0% in 2004 to 109.4% in 2005. This declining ratio of average interest-earning assets to average interest-bearing liabilities, which partly offset the positive effect of the increased net interest rate spread, was due primarily from the repurchase of 443,923 shares of common stock for $5.7 million.
Interest income for the year ended December 31, 2005, increased by $5.8 million, or 27.7%, to $26.9 million. This increase was primarily due to a $37.0 million, or 8.4%, increase in average interest-earning assets from $442.5 million in 2004 to $479.5 million in 2005, coupled with an 85 basis point increase in the average yield on interest-earning assets to 5.62% for 2005. During the year, average outstanding loans increased by $53.1 million, or 18.0%, from $294.6 million to $347.7 million, while the average yield on loans increased from 5.47% to 6.36% from 2004 to 2005. These changes were primarily the result acquiring $112.8 million in loans from the Trinity acquisition in October 2005, organic loan growth of $43.0 million during the year, and a 200 basis point increase in the prime-lending rate during the year. As a result, interest income on loans increased by $6.0 million, or 37.3%, to $22.1 million in 2005.
23
Interest earned on interest-bearing bank balances increased by $321,000, or 226.1%, to $463,000 in 2005. The average balance of interest-bearing bank balances increased by $1.8 million, or 15.5%, to $13.4 million and the average yield on these deposits increased by 224 basis points to 3.46%. Interest earned on investment securities decreased by $303,000, or 15.9%, to $1.6 million in 2005. This increase in interest income was primarily due to a $9.1 million, or 16.8%, decrease in the average outstanding balance of investment securities to $45.1 million in 2005. The average yield on investment securities increased by four basis points to 3.55% for 2005 due to the increased level of short-term interest rates during 2005. Interest income from mortgage-backed securities decreased by $192,000, or 6.5%, to $2.8 million in 2005. This decrease was largely due to an $8.7 million, or 10.7%, decrease in the average balance of mortgage-backed securities to $73.3 million during 2005. Also, during 2005, the average yield on mortgage-backed securities increased from 3.59% to 3.76%, due in part to slower prepayment levels resulting from higher mortgage interest rates during the year.
Interest expense increased $3.5 million, or 44.4%, to $11.5 million for the year ended December 31, 2005. This increase was due to a $39.5 million, or 9.9%, increase in average interest-bearing liabilities from $398.8 million in 2004 to $438.3 million in 2005. In addition, the average cost of funds increased by 63 basis points to 2.62% in 2005. Interest expense on deposits increased $2.8 million, or 46.5%, to $9.0 million in 2005. This increase was primarily due to a $26.3 million, or 7.6%, increase in average deposits in 2005 and a 64 basis point increase in the cost of deposits to 2.41% in 2005. Average deposits increased due to $135.6 million in deposits acquired from Trinity in October 2005 and $6.5 million in organic growth. The cost of funds increased due to the 200 basis point increase in short-term rates during 2005. Interest paid on borrowed money increased by $676,000, or 37.2%, to $2.5 million in 2005. Average borrowings increased by $13.1 million, or 24.8%, to $66.2 million at December 31, 2005, while the average rate paid on borrowings increased from 3.42% in 2004 to 3.76% in 2005 due to higher market interest rates in 2005.
The Company provided $985,000 and $330,000 in loan loss provisions for the years ended December 31, 2005, and 2004, respectively. The allowance for loan losses as a percentage of loans was 1.08% at December 31, 2005, and 0.95% at December 31, 2004. The provision for loan losses increased due to strong organic growth in the Company’s loan portfolio of $43.0 million, coupled with net charge-offs of $400,000 during the year. The level of nonperforming loans increased by $1.6 million to $2.6 million at December 31, 2005. As a result, the ratio of nonperforming loans to net loans increased from 0.30% at December 31, 2004, to 0.54% at December 31, 2005. Also, real estate owned increased by $351,000 to $1.2 million at December 31, 2005. All of the properties acquired through foreclosure are one-to-four family residential properties and residential lots that are in various stages of disposition. As a result, the ratio of nonperforming assets to total assets increased from 0.34% at December 31, 2004, to 0.53% at December 31, 2005. Refer to “Allowance for Loan Losses” within Item 7 for further discussion.
For the year ended December 31, 2005, noninterest income decreased by $383,000, or 7.9%, from $4.8 million to $4.4 million. Excluding the net gain on sale of securities and other assets of $674,000 for the year ended December 31, 2004, and $62,000 for the year ended December 31, 2005, noninterest income increased by $229,000, or 5.5%. The Company experienced increases of $60,000 in fee income on deposit accounts, $27,000 from mortgage banking and lending activities, $39,000 in commissions on sale of financial products, $59,000 in dividends on FHLB stock, $23,000 from the cash value of bank-owned life insurance, and $116,000 in other noninterest income. Part of the reason for these increases was the additional noninterest income generated during the last two months of the year from the Trinity acquisition. The increase in mortgage-banking and loan fee income was primarily due to an increased amount of fee income from commercial and consumer loans. This increase was partly offset by decreased mortgage banking fees of $35,000 in 2005 as compared to 2004. This was largely due to an increase in longer-term mortgage interest rates during 2005 which resulted in fewer mortgage loan originations. Fee income on deposit accounts was higher largely due to the increased number of accounts which resulted in an increase in fees generated from overdrawn checking accounts. The increase on dividends on FHLB stock was directly related to the rate paid by the FHLB and the number of outstanding shares (based on outstanding advances). These increases in noninterest income were partly offset by a $95,000 reduction in the fair value adjustment on deferred compensation assets which was offset by a corresponding decrease in compensation expense, resulting in no net impact on net income.
Gain on sale of securities decreased by $612,000, or 90.8%, from 2004 to 2005. During the year ended December 31, 2004, the Company sold $1.8 million in investment securities and $6.4 million in mortgage-backed securities at a net gain of $454,000. The proceeds from these sales were used to generate funds to repurchase shares of stock and originate loans. During the year ended December 31, 2005, the Company sold $9.4 million in investment securities and $30.3 million in mortgage-backed securities at a net gain of $17,000. Most of these sales were from securities acquired from Trinity. These proceeds were primarily used to repurchase additional investments that were more reflective of the Company’s investment philosophy of investing in shorter-term investment securities and mortgage-backed securities that provide a stable level of cash flow to fund future loan growth. The Company also recognized a $45,000 net gain on sale of both $517,000 of other real estate owned and $191,000 of premises and equipment.
24
Noninterest expense increased by $710,000, or 5.2%, from $13.6 million in 2004 to $14.3 million in 2005. This increase was largely due to the acquisition of Trinity, which added approximately 35 employees and three additional full-service offices, and the opening of a new full-service office in Belmont, North Carolina. As a result, compensation expense increased $692,000, or 10.5% from $6.6 million in 2004 to $7.3 million in 2005. Occupancy expense increased by $322,000, or 18.1%, primarily due to the increase in the number of full-service offices from 11 at the end of 2004 to 15 at the end of 2005. The Company also experienced merger and conversion expenses in 2005 in the amount of $384,000. Data processing increased by $131,000, or 59%, due to the operation of two computer systems resulting from the Trinity acquisition. Other noninterest expense, which includes expenses related to employee travel and training, deposit operations, loan administration, financial reporting, franchise and other taxes, and other miscellaneous items, increased by $300,000, or 16.1%, primarily due to expenses related to operating a much larger organization. In addition, modest increases were experienced in the areas of NOW account expense ($42,000) and professional services ($5,000).
The Company experienced modest decreases in expense related to office supplies ($80,000), advertising ($54,000), telephone ($34,000), and amortization of intangible assets ($16,000).
Effective December 31, 2004, management determined that unrealized losses on $2.0 million in perpetual preferred stock issued by Fannie Mae and $2.0 million in perpetual preferred stock issued by Freddie Mac were “other-than-temporary” impairments. As a result, management recorded a noncash, pretax loss of $983,000.
The Company’s provision for income taxes was $1.3 million and $1.1 million for the years ended December 31, 2005 and 2004, respectively. The change was primarily due to a $563,000 increase in pretax income. The effective tax rate increased from 26.7% to 28.8% due to a smaller percentage of income being derived from tax-advantaged assets such as municipal securities, U.S. Government Agency securities, and bank-owned life insurance that generate tax-exempt income.
25
Net Interest Income
The net income of the Company is heavily dependent upon net interest income. Net interest income represents the difference between income on interest-earning assets and expense on interest-bearing liabilities. Net interest income also depends on the relative amounts of interest-earning assets and interest-bearing liabilities and the interest rate earned or paid on them, respectively. The following table sets forth certain information relating to the Company for the years ended December 31, 2006, 2005 and 2004. For the years indicated, the total dollar amount of interest income from average interest-earning assets and the resultant yields, as well as the interest expense on average interest-bearing liabilities, is expressed both in dollars and rates. No tax equivalent adjustments were made.
Average Balances and Net Interest Income Analysis
| | December 31, 2006 | | December 31, 2005 | | December 31, 2004 | |
| |
| |
| |
| |
(Dollars in Thousands) | | Average
Balance | | Interest
Income/
Expense | | Average
Yield/
Cost | | Average
Balance | | Interest
Income/
Expense | | Average
Yield/
Cost | | Average
Balance | | Interest
Income/
Expense | | Average
Yield/
Cost | |
| |
|
| |
|
| |
|
| |
|
| |
|
| |
|
| |
|
| |
|
| |
|
| |
Assets: | | | | | | | | | | | | | | | | | | | | | | | | | | | | |
Interest-earning assets: | | | | | | | | | | | | | | | | | | | | | | | | | | | | |
Loans receivable (1) | | $ | 493,324 | | $ | 37,448 | | | 7.59 | % | $ | 347,720 | | $ | 22,128 | | | 6.36 | % | $ | 294,647 | | $ | 16,116 | | | 5.47 | % |
Interest-bearing bank deposits | | | 16,715 | | | 838 | | | 5.01 | | | 13,394 | | | 463 | | | 3.46 | | | 11,598 | | | 142 | | | 1.22 | |
Investment securities | | | 50,537 | | | 1,997 | | | 3.95 | | | 45,113 | | | 1,603 | | | 3.55 | | | 54,234 | | | 1,906 | | | 3.51 | |
Mortgage-backed securities | | | 64,549 | | | 2,636 | | | 4.08 | | | 73,283 | | | 2,754 | | | 3.76 | | | 82,025 | | | 2,946 | | | 3.59 | |
| |
|
| |
|
| |
|
| |
|
| |
|
| |
|
| |
|
| |
|
| |
|
| |
Total interest-earning assets | | | 625,125 | | | 42,919 | | | 6.87 | | | 479,510 | | | 26,948 | | | 5.62 | | | 442,504 | | | 21,110 | | | 4.77 | |
Noninterest-earning assets | | | 91,809 | | | | | | | | | 63,801 | | | | | | | | | 57,433 | | | | | | | |
| |
|
| | | | | | | |
|
| | | | | | | |
|
| | | | | | | |
Total assets | | $ | 716,934 | | | | | | | | $ | 543,311 | | | | | | | | $ | 499,937 | | | | | | | |
| |
|
| | | | | | | |
|
| | | | | | | |
|
| | | | | | | |
Liabilities and Stockholders’ Equity: | | | | | | | | | | | | | | | | | | | | | | | | | | | | |
Interest-bearing liabilities: | | | | | | | | | | | | | | | | | | | | | | | | | | | | |
Demand deposit accounts | | $ | 51,495 | | $ | 662 | | | 1.29 | % | $ | 36,798 | | $ | 211 | | | 0.57 | % | $ | 32,964 | | $ | 103 | | | 0.31 | % |
Money market deposit accounts | | | 109,553 | | | 4,187 | | | 3.82 | | | 78,092 | | | 1,791 | | | 2.29 | | | 59,121 | | | 842 | | | 1.42 | |
Savings accounts | | | 19,569 | | | 150 | | | 0.77 | | | 26,219 | | | 159 | | | 0.61 | | | 32,802 | | | 165 | | | 0.50 | |
Certificates of deposit | | | 320,008 | | | 13,104 | | | 4.09 | | | 231,000 | | | 6,816 | | | 2.95 | | | 220,839 | | | 5,017 | | | 2.27 | |
Borrowed funds | | | 86,183 | | | 4,176 | | | 4.85 | | | 66,199 | | | 2,492 | | | 3.76 | | | 53,053 | | | 1,816 | | | 3.42 | |
| |
|
| |
|
| |
|
| |
|
| |
|
| |
|
| |
|
| |
|
| |
|
| |
Total interest-bearing liabilities | | | 586,808 | | | 22,279 | | | 3.80 | | | 438,308 | | | 11,469 | | | 2.62 | | | 398,779 | | | 7,943 | | | 1.99 | |
| | | | |
|
| | | | | | | |
|
| | | | | | | |
|
| | | | |
Noninterest-bearing liabilities | | | 45,091 | | | | | | | | | 30,641 | | | | | | | | | 22,966 | | | | | | | |
| |
|
| | | | | | | |
|
| | | | | | | |
|
| | | | | | | |
Total liabilities | | | 631,899 | | | | | | | | | 468,949 | | | | | | | | | 421,745 | | | | | | | |
Stockholders’ equity | | | 85,035 | | | | | | | | | 74,362 | | | | | | | | | 78,192 | | | | | | | |
| |
|
| | | | | | | |
|
| | | | | | | |
|
| | | | | | | |
Total liabilities and equity | | $ | 716,934 | | | | | | | | $ | 543,311 | | | | | | | | $ | 499,937 | | | | | | | |
| |
|
| | | | | | | |
|
| | | | | | | |
|
| | | | | | | |
Net interest income | | | | | $ | 20,640 | | | | | | | | $ | 15,479 | | | | | | | | $ | 13,167 | | | | |
| | | | |
|
| | | | | | | |
|
| | | | | | | �� |
|
| | | | |
Interest rate spread (2) | | | | | | | | | 3.07 | % | | | | | | | | 3.00 | % | | | | | | | | 2.78 | % |
| | | | | | | |
|
| | | | | | | |
|
| | | | | | | |
|
| |
Net interest margin (3) | | | | | | | | | 3.30 | % | | | | | | | | 3.23 | % | | | | | | | | 2.98 | % |
| | | | | | | |
|
| | | | | | | |
|
| | | | | | | |
|
| |
Ratio of average interest-earning assets to avg. int.-bearing liabilities | | | | | | 106.53 | % | | | | | | | | 109.40 | % | | | | | | | | 110.96 | % | | | |
| | | | |
|
| | | | | | | |
|
| | | | | | | |
|
| | | | |
|
(1) | Average loan balances include nonaccrual loans. |
(2) | Interest rate spread represents the difference between the average yield on interest-earning assets and the average cost of interest-earning liabilities. |
(3) | Net interest margin is calculated by dividing net interest income by average interest-earning assets. |
26
Changes in interest income and expense can result from changes in both volume and rates. The following table sets forth information regarding changes in our interest income and interest expense for the periods indicated. For each category of our interest-earning assets and interest-bearing liabilities, information is provided on changes attributable to (i) changes in volume (changes in volume multiplied by old rate); (ii) changes in rate (changes in rate multiplied by old volume); (iii) the net change. The changes attributable to the combined impact of volume and rate have been allocated proportionately to the changes due to volume and the changes due to rate.
Volume and Rate Variance Analysis
| | For The Year Ended
December 31, 2006 vs December 31, 2005
Increase (Decrease)
Due to | | For the Year Ended
December 31, 2005 vs December 31, 2004
Increase (Decrease)
Due to | |
| |
| |
| |
(In Thousands) | | Volume | | Rate | | Net | | Volume | | Rate | | Net | |
| |
|
| |
|
| |
|
| |
|
| |
|
| |
|
| |
Interest income: | | | | | | | | | | | | | | | | | | | |
Loans receivable | | $ | 10,489 | | $ | 4,831 | | $ | 15,320 | | $ | 3,151 | | $ | 2,861 | | $ | 6,012 | |
Interest-bearing bank deposits | | | 134 | | | 241 | | | 375 | | | 25 | | | 296 | | | 321 | |
Investment securities | | | 204 | | | 190 | | | 394 | | | (324 | ) | | 21 | | | (303 | ) |
Mortgage-backed securities | | | (433 | ) | | 315 | | | (118 | ) | | (340 | ) | | 148 | | | (192 | ) |
| |
|
| |
|
| |
|
| |
|
| |
|
| |
|
| |
Total interest income | | | 10,394 | | | 5,577 | | | 15,971 | | | 2,512 | | | 3,326 | | | 5,838 | |
| |
|
| |
|
| |
|
| |
|
| |
|
| |
|
| |
Interest expense: | | | | | | | | | | | | | | | | | | | |
Deposits | | | 4,109 | | | 5,017 | | | 9,126 | | | 524 | | | 2,326 | | | 2,850 | |
Borrowed funds | | | 863 | | | 821 | | | 1,684 | | | 482 | | | 194 | | | 676 | |
| |
|
| |
|
| |
|
| |
|
| |
|
| |
|
| |
Total interest expense | | | 4,972 | | | 5,838 | | | 10,810 | | | 1,006 | | | 2,520 | | | 3,526 | |
| |
|
| |
|
| |
|
| |
|
| |
|
| |
|
| |
Net interest income | | $ | 5,422 | | $ | (261 | ) | $ | 5,161 | | $ | 1,506 | | $ | 806 | | $ | 2,312 | |
| |
|
| |
|
| |
|
| |
|
| |
|
| |
|
| |
Loans
The Company generally makes commercial real estate loans, commercial business loans, consumer loans, and residential mortgage loans within its market area. In the past, we concentrated our lending activities on conventional first mortgage loans secured by one-to-four family properties. However, since converting to a stock-owned company in 1998, the Company has focused more of its lending activities on construction loans, nonresidential real estate loans, commercial business loans and consumer loans. A substantial portion of our loan portfolio is secured by real estate, either as primary or secondary collateral, located in our primary market area. The Company has a diversified loan portfolio with no material concentrations to any one borrower or industry.
Our lending activities are subject to the written, non-discriminatory, underwriting standards and loan origination procedures established by management and approved by our Board of Directors. Loan originations come from a number of sources including real estate agents, home builders, walk-in customers, referrals and existing customers. Loan officers also call on local businesses soliciting commercial products. We advertise our loan products in various print media including the local newspaper. In our marketing, we emphasize our community ties, personalized customer service, and an efficient underwriting and approval process. All real estate collateral is appraised or evaluated in accordance with regulatory requirements. On new loan originations, we require hazard, title and, to the extent applicable, flood insurance on all security property. The amounts and types of loans outstanding over the past five years are shown on the following table.
27
Loan Portfolio
| | December 31, 2006 | | December 31, 2005 | | December 31, 2004 | |
| |
| |
| |
| |
| | Amount | | Percent | | Amount | | Percent | | Amount | | Percent | |
| |
|
| |
|
| |
|
| |
|
| |
|
| |
|
| |
| | (Dollars in Thousands) |
Real estate loans: | | | | | | | | | | | | | | | | | | | |
One-to-four family residential | | $ | 83,265 | | | 16.16 | % | $ | 98,635 | | | 20.83 | % | $ | 91,714 | | | 28.92 | % |
Multifamily residential | | | 21,726 | | | 4.22 | | | 24,594 | | | 5.19 | | | 10,632 | | | 3.35 | |
Construction | | | 76,505 | | | 14.85 | | | 62,687 | | | 13.24 | | | 25,033 | | | 7.89 | |
Nonresidential | | | 231,265 | | | 44.89 | | | 185,319 | | | 39.13 | | | 114 | | | 36.12 | |
| |
|
| |
|
| |
|
| |
|
| |
|
| |
|
| |
Total real estate loans | | | 412,761 | | | 80.12 | | | 371,235 | | | 78.39 | | | 241,930 | | | 76.28 | |
Commercial business loans | | | 32,202 | | | 6.25 | | | 30,128 | | | 6.36 | | | 14,002 | | | 4.41 | |
Consumer loans | | | 70,209 | | | 13.63 | | | 72,237 | | | 15.25 | | | 61,245 | | | 19.31 | |
| |
|
| |
|
| |
|
| |
|
| |
|
| |
|
| |
Total gross loans | | | 515,172 | | | 100.00 | % | | 473,600 | | | 100.00 | % | | 317,177 | | | 100.00 | % |
| | | | |
|
| | | | |
|
| | | | |
|
| |
Less: | | | | | | | | | | | | | | | | | | | |
Deferred loan fees (costs), net | | | (230 | ) | | | | | 264 | | | | | | 21 | | | | |
Allowance for loan losses | | | 5,764 | | | | | | 5,104 | | | | | | 3,029 | | | | |
| |
|
| | | | |
|
| | | | |
|
| | | | |
Total loans, net | | $ | 509,638 | | | | | $ | 468,232 | | | | | $ | 314,127 | | | | |
| |
|
| | | | |
|
| | | | |
|
| | | | |
| | December 31, 2003 | | December 31, 2002 | |
| |
| |
| |
| | Amount | | Percent | | Amount | | Percent | |
| |
|
| |
|
| |
|
| |
|
| |
| | (Dollars in Thousands) | |
Real estate loans: | | | | | | | | | | | | | |
One-to-four family residential | | $ | 102,751 | | | 34.48 | % | $ | 140,360 | | | 46.32 | % |
Multifamily residential | | | 11,987 | | | 4.02 | | | 8,962 | | | 2.96 | |
Construction | | | 8,913 | | | 2.99 | | | 9,903 | | | 3.27 | |
Nonresidential | | | 94,357 | | | 31.66 | | | 69,313 | | | 22.88 | |
| |
|
| |
|
| |
|
| |
|
| |
Total real estate loans | | | 218,008 | | | 73.15 | | | 228,538 | | | 75.43 | |
Commercial business loans | | | 14,001 | | | 4.70 | | | 12,084 | | | 3.99 | |
Consumer loans | | | 66,020 | | | 22.15 | | | 62,368 | | | 20.58 | |
| |
|
| |
|
| |
|
| |
|
| |
Total gross loans | | | 298,029 | | | 100.00 | % | | 302,990 | | | 100.00 | % |
| | | | |
|
| | | | |
|
| |
Less: | | | | | | | | | | | | | |
Deferred loan fees, net | | | 34 | | | | | | 89 | | | | |
Allowance for loan losses | | | 2,969 | | | | | | 2,995 | | | | |
| |
|
| | | | |
|
| | | | |
Total loans, net | | $ | 295,026 | | | | | $ | 299,906 | | | | |
| |
|
| | | | |
|
| | | | |
Our Board of Directors must approve all loans in excess of $3.5 million or more, or in any amount to borrowers with existing exposure to us in excess of $3.5 million, or in any amount that when added to the borrower’s existing exposure to us causes such total exposure to be in excess of $3.5 million. In addition, all unsecured loans in excess of $500,000, or in any amount when added to a borrower’s existing unsecured exposure to us causes such unsecured exposure to be in excess of $500,000, must be approved by our Board of Directors. Loans of $3.5 million or less, or customers with exposure (including the proposed loan) of $3.5 million or less, or unsecured loans of $500,000 or less, or customers with unsecured exposure (including the proposed loan) of $500,000 or less, as applicable, may be approved individually or jointly by our lending officers within loan approval limits delegated by our Board of Directors. In addition, the Board of Directors has delegated “incremental” loan approval limits to certain lending officers which allows them to approve a new loan to an existing customer in an amount equal to, or less than, their incremental loan limit that would otherwise require approval by the Board of Directors or the additional approval of another lending officer. Any loan approved by a lending officer using their incremental loan limit must be ratified by the Board of Directors or approved by another lending officer, as applicable, after the loan has been made.
28
The following table represents the maturity distribution of the Company’s loans by type, including fixed-rate loans, as of December 31, 2006. Demand loans, loans having no stated schedule of repayments and no stated maturity, and overdrafts are reported as becoming due within one year. Loan balances do not include undisbursed loan proceeds, unearned discounts, unearned income and allowance for loan losses.
Maturity Distribution of Loan Portfolio
| | One year
or Less | | One to
Five Years | | Over Five
Years | | Total | |
| |
|
| |
|
| |
|
| |
|
| |
| | (In thousands) | |
Real Estate: | | | | | | | | | | | | | |
One-to-four family residential | | $ | 2,144 | | $ | 3,913 | | $ | 77,208 | | $ | 83,265 | |
Multifamily residential | | | 429 | | | 12,261 | | | 9,036 | | | 21,726 | |
Construction | | | 42,474 | | | 31,367 | | | 2,664 | | | 76,505 | |
Nonresidential | | | 59,212 | | | 154,024 | | | 18,029 | | | 231,265 | |
Commercial business | | | 18,540 | | | 13,570 | | | 92 | | | 32,202 | |
Consumer | | | 2,388 | | | 10,191 | | | 57,630 | | | 70,209 | |
| |
|
| |
|
| |
|
| |
|
| |
Total loans | | $ | 125,187 | | $ | 225,326 | | $ | 164,659 | | $ | 515,172 | |
| |
|
| |
|
| |
|
| |
|
| |
The following table sets forth the dollar amount of all loans as of December 31, 2006, for which final payment is not due until after December 31, 2007. The table also shows the amount of each type of loan that has a fixed rate of interest and those that have an adjustable rate of interest.
Interest Rate Distribution of Loan Portfolio
| | | Fixed Rates | | | Adjustable Rates | | | Total | |
| |
|
| |
|
| |
|
| |
| | (In thousands) | |
Real Estate Loans: | | | | | | | | | | |
One-to-four family residential | | $ | 25,502 | | $ | 55,619 | | $ | 81,121 | |
Multifamily residential | | | 7,949 | | | 13,348 | | | 21,297 | |
Construction | | | 14,476 | | | 19,555 | | | 34,031 | |
Nonresidential | | | 73,924 | | | 98,129 | | | 172,053 | |
| |
|
| |
|
| |
|
| |
Total real estate loans | | | 121,851 | | | 186,651 | | | 308,502 | |
Commercial business | | | 8,823 | | | 4,839 | | | 13,662 | |
Consumer loans | | | 9,195 | | | 58,626 | | | 67,821 | |
| |
|
| |
|
| |
|
| |
Total loans | | $ | 139,869 | | $ | 250,116 | | $ | 389,985 | |
| |
|
| |
|
| |
|
| |
Scheduled contractual principal repayments of loans do not reflect the actual life of such assets. The average life of a loan is substantially less than its contractual terms because of prepayments. In addition, due-on-sale clauses on loans generally give us the right to declare loans immediately due and payable in the event, among other things, that the borrower sells the real property subject to the mortgage and the loan is not repaid. The average life of mortgage loans tends to increase, however, when current mortgage loan market rates are substantially higher than rates on existing mortgage loans and, conversely, decrease when rates on existing mortgage loans are substantially higher than current mortgage loan market rates.
Nonperforming Assets and Delinquencies. When a borrower fails to make a required payment on a loan, we attempt to cure the deficiency by contacting the borrower and collecting the payment. Computer generated late notices are mailed 15 days after a payment is due. In most cases, deficiencies are cured promptly. If a delinquency continues, additional contact is made either through a notice or other means and we will attempt to work out a payment schedule and actively encourage delinquent residential mortgage borrowers to seek home ownership counseling. While we generally prefer to work with borrowers to resolve such problems, we will institute foreclosure or other proceedings, as necessary, to minimize any potential loss. Loans are placed on nonaccrual status generally if, in the opinion of management, principal or interest payments are not likely in accordance with the terms of the loan agreement, or when principal or interest is past due 90 days or more. Interest accrued but not collected at the date the loan is placed on nonaccrual status is reversed against income in the current period. Loans may be reinstated to accrual status when payments are under 90 days past due and, in the opinion of management, collection of the remaining past due balances can be reasonably expected. Our Board of Directors is informed monthly of the total amount of loans which are more than 30 days delinquent. Loans that are more than 90 days delinquent or in foreclosure are reviewed by the Board on an individual basis each month.
29
The following table sets forth information with respect to our nonperforming assets at the dates indicated. As of such dates, we had no restructured loans within the meaning of SFAS No. 15.
Schedule of Nonperforming Assets
| | December 31, | |
| |
| |
| | 2006 | | 2005 | | 2004 | | 2003 | | 2002 | |
| |
|
| |
|
| |
|
| |
|
| |
|
| |
| | (Dollars in thousands) | |
Loans accounted for on a nonaccrual basis: | | | | | | | | | | | | | | | | |
Real estate loans: | | | | | | | | | | | | | | | | |
One-to-four family residential | | $ | 473 | | $ | 681 | | $ | 627 | | $ | 193 | | $ | 329 | |
Multifamily residential | | | 0 | | | 0 | | | 0 | | | 0 | | | 0 | |
Construction | | | 0 | | | 956 | | | 0 | | | 0 | | | 90 | |
Nonresidential real estate | | | 888 | | | 397 | | | 209 | | | 20 | | | 0 | |
Commercial business | | | 78 | | | 274 | | | 30 | | | 203 | | | 21 | |
Consumer | | | 360 | | | 243 | | | 80 | | | 113 | | | 76 | |
| |
|
| |
|
| |
|
| |
|
| |
|
| |
Total nonaccrual loans | | | 1,799 | | | 2,551 | | | 946 | | | 529 | | | 516 | |
Accruing loans which were contractually past due 90 days or more | | | 1,212 | | | 0 | | | 0 | | | 0 | | | 0 | |
| |
|
| |
|
| |
|
| |
|
| |
|
| |
Total nonperforming loans | | | 3,011 | | | 2,551 | | | 946 | | | 529 | | | 516 | |
Real estate owned | | | 139 | | | 1,157 | | | 806 | | | 145 | | | 1,307 | |
| |
|
| |
|
| |
|
| |
|
| |
|
| |
Total nonperforming assets | | $ | 3,150 | | $ | 3,708 | | $ | 1,752 | | $ | 674 | | $ | 1,823 | |
| |
|
| |
|
| |
|
| |
|
| |
|
| |
Nonperforming loans to total loans | | | 0.58 | % | | 0.54 | % | | 0.30 | % | | 0.18 | % | | 0.17 | % |
Nonperforming assets to total assets | | | 0.42 | % | | 0.53 | % | | 0.34 | % | | 0.14 | % | | 0.37 | % |
Real Estate Acquired in Settlement of Loans. Real estate acquired by us as a result of foreclosure or by deed-in-lieu of foreclosure is classified as real estate acquired in settlement of loans until sold. Generally, foreclosed assets are held for sale and such assets are carried at the lower of cost or market value minus estimated cost to sell the property. After the date of acquisition, all costs incurred in maintaining the property are expensed and costs incurred for the improvement or development of such property are capitalized up to the extent of their net realizable value. At December 31, 2006, we had $139,000 in real estate acquired in settlement of loans. This balance is comprised of one single-family residence and one residential lot located in the Bank’s normal lending area. These properties are in various stages of disposition.
Restructured Loans. Under accounting principles generally accepted in the United States of America (“GAAP”), we are required to account for certain loan modifications or restructuring as a “troubled debt restructuring.” In general, the modification or restructuring of a debt constitutes a troubled debt restructuring if we, for economic or legal reasons related to the borrower’s financial difficulties, grant a concession to the borrowers that we would not otherwise consider. Debt restructurings or loan modifications for a borrower do not necessarily always constitute troubled debt restructurings, however, and troubled debt restructurings do not necessarily result in nonaccrual loans. We had one restructured loan as of December 31, 2006, totaling $1.0 million.
Asset Classification. The OTS has adopted various regulations regarding problem assets of financial institutions. The regulations require that each insured institution review and classify its assets on a regular basis. In addition, in connection with examinations of insured institutions, OTS examiners have the authority to identify problem assets and, if appropriate, require them to be classified. There are three classifications for problem assets: substandard, doubtful and loss. Substandard assets have one or more defined weaknesses and are characterized by the distinct possibility that the insured institution will sustain some loss if the deficiencies are not corrected. Doubtful assets have the weaknesses of substandard assets with the additional characteristic that the weaknesses make collection or liquidation in full on the basis of currently existing facts, conditions and values questionable, and there is a high possibility of loss. An asset classified as loss is considered uncollectible and of such little value that continuance as an asset of the institution is not warranted. If an asset or portion thereof is classified as loss, we establish specific allowances for loan losses for the full amount of the portion of the asset classified as loss. All or a portion of general loan loss allowances established to cover possible losses related to assets classified substandard or doubtful can be included in determining an institution’s regulatory capital, while specific valuation allowances for loan losses generally do not qualify as regulatory capital. Assets that do not currently expose the insured institution to sufficient risk to warrant classification in one of the aforementioned categories but possess weaknesses are designated “special mention” and monitored by us.
30
As of December 31, 2006, we had $6.1 million of assets classified as substandard and no assets classified as either doubtful or loss. The aggregate amount designated special mention as of December 31, 2006, was $9.6 million, or $6.1 million over the amount designated as special mention as of December 31, 2005. This increase is primarily attributable to the addition of three relationships which are primarily secured by commercial real estate and were less than 30 days delinquent at December 31, 2006. These three relationships were designated special mention due cash flow concerns arising from either slower than anticipated lot sales or higher than expected occupancy rates. Pursuant to SFAS No. 114, “Accounting by Creditors for Impairment of a Loan,” management determined that impaired loans were not material as of December 31, 2006.
As of December 31, 2005, we had $4.8 million in assets classified substandard, $508,000 classified doubtful, and no assets classified as loss. The aggregate amount designated special mention as of December 31, 2005, was $3.5 million. Pursuant to SFAS No. 114, management determined that impaired loans were not material as of December 31, 2005.
Allowance for Loan Losses
Management has established a systematic methodology for evaluating the adequacy of the Company’s allowance for loan losses. The methodology is set forth in a formal policy and considers all loans in the portfolio. Specific allowances are established for certain individual loans that management considers impaired under SFAS 114. The remainder of the portfolio is segmented into groups of loans with similar risk characteristics for evaluation and analysis. In originating loans, we recognize that losses will be experienced and that the risk of loss will vary with, among other things, the type of loan being made, the creditworthiness of the borrower, the term of the loan, general economic conditions, and in the case of a secured loan, the quality of the collateral. We increase our allowance for loan losses by charging provisions for loan losses against our current period income. Management’s periodic evaluation of the adequacy of the allowance is consistently applied and is based on our past loan loss experience, particular risks inherent in the different kinds of lending that we engage in, adverse situations that may affect the borrower’s ability to repay, the estimated value of any underlying collateral, current economic conditions, and other relevant internal and external factors that affect loan collectibility.
At December 31, 2006, we had an allowance for loan losses of $5.8 million. Management believes that this amount meets the requirement for losses on loans that management considers to be impaired, for known losses, and for risks inherent in the remaining loan portfolios. Although management believes that it uses the best information available to make such determinations, future adjustments to the allowance for loan losses may be necessary and results of operations could be significantly adversely affected if circumstances differ substantially from the assumptions used in making the determinations. The allowance for loan losses is subject to periodic evaluation by various regulatory authorities and may be subject to adjustment upon their examination. The following table sets forth an analysis of our allowance for loan losses.
31
Allowance of Loan Losses
| | At and For the Twelve Months Ended
December 31, | |
| |
| |
| | 2006 | | 2005 | | 2004 | | 2003 | | 2002 | |
| |
|
| |
|
| |
|
| |
|
| |
|
| |
| | (Dollars in Thousands) | |
Allowance at beginning of period | | $ | 5,104 | | $ | 3,029 | | $ | 2,969 | | $ | 2,995 | | $ | 3,136 | |
Charge-offs: | | | | | | | | | | | | | | | | |
One-to-four family residential | | | 0 | | | 5 | | | 14 | | | 0 | | | 16 | |
Nonresidential mortgage loans | | | (50 | ) | | 182 | | | 174 | | | 0 | | | 175 | |
Commercial business loans | | | 484 | | | 158 | | | 76 | | | 0 | | | 150 | |
Consumer loans | | | 89 | | | 76 | | | 14 | | | 94 | | | 42 | |
| |
|
| |
|
| |
|
| |
|
| |
|
| |
Total charge-offs | | $ | 523 | | $ | 421 | | $ | 278 | | $ | 94 | | $ | 383 | |
Recoveries: | | | | | | | | | | | | | | | | |
One-to-four family residential | | | 0 | | | 0 | | | 0 | | | 0 | | | 0 | |
Nonresidential mortgage loans | | | 0 | | | 5 | | | 1 | | | 0 | | | 0 | |
Commercial business loans | | | 8 | | | 14 | | | 4 | | | 0 | | | 0 | |
Consumer loans | | | 10 | | | 2 | | | 3 | | | 8 | | | 17 | |
| |
|
| |
|
| |
|
| |
|
| |
|
| |
Total recoveries | | $ | 18 | | $ | 21 | | $ | 8 | | $ | 8 | | $ | 17 | |
| |
|
| |
|
| |
|
| |
|
| |
|
| |
Net charge-offs | | $ | 505 | | $ | 400 | | $ | 270 | | $ | 86 | | $ | 366 | |
Provision for loan losses | | | 1,165 | | | 985 | | | 330 | | | 60 | | | 225 | |
Allowance acquired in acquisition | | | 0 | | | 1,490 | | | 0 | | | 0 | | | 0 | |
| |
|
| |
|
| |
|
| |
|
| |
|
| |
Allowance at end of period | | $ | 5,764 | | $ | 5,104 | | $ | 3,029 | | $ | 2,969 | | $ | 2,995 | |
| |
|
| |
|
| |
|
| |
|
| |
|
| |
Allowance for loan losses to total gross loans | | | 1.12 | % | | 1.08 | % | | 0.95 | % | | 1.00 | % | | 0.99 | % |
Net charge-offs to average loans | | | 0.10 | % | | 0.12 | % | | 0.09 | % | | 0.03 | % | | 0.11 | % |
The following table sets forth the breakdown of the allowance for loan losses by loan category at the dates indicated. Management believes that the allowance can be allocated by category only on an approximate basis. The allocation of the allowance to each category is not necessarily indicative of future losses and does not restrict the use of the allowance to absorb losses in any other category.
32
Allocation of Allowance for Loan Losses
| | December 31, 2006 | | December 31, 2005 | | December 31, 2004 | |
| |
| |
| |
| |
| | Amount | | % of
Total Loans | | Amount | | % of
Total Loans | | Amount | | % of
Total Loans | |
| |
|
| |
|
| |
|
| |
|
| |
|
| |
|
| |
| | (Dollars in Thousands) | |
Real estate loans: | | | | | | | | | | | | | | | | | | | |
One-to-four family residential | | $ | 300 | | | 16.16 | % | $ | 300 | | | 20.83 | % | $ | 250 | | | 28.92 | % |
Multifamily residential | | | 250 | | | 4.22 | | | 250 | | | 5.19 | | | 100 | | | 3.35 | |
Construction | | | 750 | | | 14.85 | | | 500 | | | 13.24 | | | 300 | | | 7.89 | |
Nonresidential | | | 2,264 | | | 44.89 | | | 1,854 | | | 39.13 | | | 609 | | | 36.12 | |
| |
|
| |
|
| |
|
| |
|
| |
|
| |
|
| |
Total real estate loans | | | 3,564 | | | 80.12 | | | 2,904 | | | 78.39 | | | 1,259 | | | 76.28 | |
Commercial business | | | 1,000 | | | 6.25 | | | 1,000 | | | 6.36 | | | 600 | | | 4.41 | |
Consumer loans | | | 1,200 | | | 13.63 | | | 1,200 | | | 15.25 | | | 1,170 | | | 19.31 | |
| |
|
| |
|
| |
|
| |
|
| |
|
| |
|
| |
Total allowance for loan losses | | $ | 5,764 | | | 100.00 | % | $ | 5,104 | | | 100.00 | % | $ | 3,029 | | | 100.00 | % |
| |
|
| |
|
| |
|
| |
|
| |
|
| |
|
| |
| | December 31, 2003 | | December 31, 2002 | |
| |
| |
| |
| | Amount | | % of
Total Loans | | Amount | | % of
Total Loans | |
| |
|
| |
|
| |
|
| |
|
| |
| | (Dollars in Thousands) | |
Real estate loans: | | | | | | | | | | | | | |
One-to-four family residential | | $ | 399 | | | 34.48 | % | $ | 475 | | | 46.32 | % |
Multifamily residential | | | 100 | | | 4.02 | | | 100 | | | 2.96 | |
Construction | | | 150 | | | 2.99 | | | 150 | | | 3.27 | |
Nonresidential | | | 550 | | | 31.66 | | | 500 | | | 22.88 | |
| |
|
| |
|
| |
|
| |
|
| |
Total real estate loans | | | 1,199 | | | 73.15 | | | 1,225 | | | 75.43 | |
Commercial business | | | 600 | | | 4.70 | | | 600 | | | 3.99 | |
Consumer loans | | | 1,170 | | | 22.15 | | | 1,170 | | | 20.58 | |
| |
|
| |
|
| |
|
| |
|
| |
Total allowance for loan losses | | $ | 2,969 | | | 100.00 | % | $ | 2,995 | | | 100.00 | % |
| |
|
| |
|
| |
|
| |
|
| |
Deposits
Our deposit products include a broad selection of deposit instruments, including checking accounts, money market deposit accounts, savings accounts, individual retirement accounts, and term certificate accounts. We offer these products to both retail and commercial customers. Deposit account terms vary with the principal difference being the minimum balance deposit, early withdrawal penalties and the interest rate. We review our deposit mix and pricing weekly. We believe that we are competitive in the type of accounts and interest rates we offer on our deposit products. We do not seek to pay the highest deposit rates, but a competitive rate. Management determines the rates paid based on a number of conditions, including rates paid by competitors, rates on U.S. Treasury securities, rates offered on alternative lending programs, and the deposit growth rate we are seeking to achieve. The following table sets forth information concerning our deposit accounts.
33
Deposit Portfolio Composition
| | December 31, 2006 | | December 31, 2005 | | December 31, 2004 | |
| |
| |
| |
| |
Category | | Actual
Balance | | Average
Interest
Rate | | Actual
Balance | | Average
Interest
Rate | | Actual
Balance | | Average
Interest
Rate | |
| |
|
| |
|
| |
|
| |
|
| |
|
| |
|
| |
| | (Dollars in Thousands) | |
Noninterest bearing demand | | $ | 37,762 | | | 0.0 | % | $ | 35,226 | | | 0.0 | % | $ | 19,734 | | | 0.0 | % |
Interest bearing demand | | | 52,778 | | | 1.3 | | | 50,263 | | | 0.6 | | | 32,949 | | | 0.3 | |
Money market deposit | | | 117,633 | | | 3.8 | | | 104,421 | | | 2.3 | | | 77,925 | | | 1.4 | |
Savings accounts | | | 16,027 | | | 0.8 | | | 23,654 | | | 0.6 | | | 29,174 | | | 0.5 | |
Certificates of deposit | | | 338,602 | | | 4.1 | | | 303,980 | | | 3.0 | | | 214,962 | | | 2.3 | |
| |
|
| |
|
| |
|
| |
|
| |
|
| |
|
| |
Total Deposits | | $ | 562,802 | | | 3.4 | % | $ | 517,544 | | | 2.3 | % | $ | 374,744 | | | 1.7 | % |
| |
|
| |
|
| |
|
| |
|
| |
|
| |
|
| |
The following table indicates the amount of our time deposits (also referred to as certificates of deposits) with a principal balance greater than $100,000 by time remaining until maturity as of December 31, 2006.
Maturities of Time Deposits over $100,000
Maturity Period | | Time Deposits | |
| |
|
| |
| | (In Thousands) | |
Within three months | | $ | 27,940 | |
Three to six months | | | 28,850 | |
Six to twelve months | | | 44,471 | |
Over twelve months | | | 22,574 | |
| |
|
| |
Total time deposits over $100,000 | | $ | 123,835 | |
| |
|
| |
The following table sets forth the amount of time deposits in the Bank categorized by rates as of December 31st at the dates indicated.
Time Deposit Interest Rate Composition
| | December 31, | |
| |
| |
Interest Rate | | 2006 | | 2005 | | 2004 | |
| |
|
| |
|
| |
|
| |
| | (In Thousands) | |
| | | | | | | | | | |
Less than 2.00% | | $ | 940 | | $ | 4,712 | | $ | 74,951 | |
2.01-4.00% | | | 69,406 | | | 222,880 | | | 118,275 | |
4.01-6.00% | | | 268,256 | | | 76,388 | | | 21,616 | |
6.01-8.00% | | | 0 | | | 0 | | | 120 | |
| |
|
| |
|
| |
|
| |
| | $ | 338,602 | | $ | 303,980 | | $ | 214,962 | |
| |
|
| |
|
| |
|
| |
34
The following table sets forth the amount of time deposits in the Bank categorized by rates and maturities at December 31, 2006.
Time Deposit Maturity Schedule
| | During the Years Ended December 31, | |
| |
| |
Interest Rate | | 2007 | | 2008 | | 2009 | | 2010
or Later | | Total | |
| |
|
| |
|
| |
|
| |
|
| |
|
| |
| | (In Thousands) | |
Less than 2.0% | | $ | 937 | | $ | 3 | | $ | 0 | | $ | 0 | | $ | 940 | |
2.01-4.0% | | | 57,773 | | | 6,759 | | | 4,601 | | | 273 | | | 69,406 | |
4.01-6.0% | | | 239,880 | | | 13,603 | | | 7,857 | | | 6,916 | | | 268,256 | |
| |
|
| |
|
| |
|
| |
|
| |
|
| |
Total | | $ | 298,590 | | $ | 20,365 | | $ | 12,458 | | $ | 7,189 | | $ | 338,602 | |
| |
|
| |
|
| |
|
| |
|
| |
|
| |
Capital Adequacy and Resources
OTS regulations require savings banks to meet three minimum capital standards: a 1.5% tangible capital ratio, a 4% leverage ratio and an 8% risk-based capital ratio. At December 31, 2006, Citizens South Bank’s capital exceeded all applicable requirements. Under prompt corrective action regulations, the OTS is required and authorized to take supervisory actions against undercapitalized savings banks. For this purpose, a savings bank is placed in one of the following five categories based on the bank’s capital: 1) well-capitalized (at least 5% leverage capital, 6% tier 1 risk-based capital and 10% total risk-based capital); 2) adequately capitalized (at least 4% leverage capital, 4% tier 1 risk-based capital and 8% total risk-based capital); 3) undercapitalized (less than 8% total risk-based capital, 4% tier 1 risk-based capital or 3% leverage capital); 4) significantly undercapitalized (less than 6% total risk-based capital, 3% tier 1 risk-based capital or 3% leverage capital); and 5) critically undercapitalized (less than 2% tangible capital). At December 31, 2006, Citizens South Bank met the criteria for being considered “well-capitalized.”
Funding for future growth is dependent upon the earnings of the Company and its subsidiaries. At December 31, 2006, the Company had a capital to assets ratio of 11.56%. As such, the Company fully expects to be able to meet future capital needs caused by growth and expansion as well as regulatory requirements. The Company plans to continue to repurchase its shares of common stock in the open market from time to time as market conditions warrant. During 2006, the Company repurchased 207,088 shares of common stock for a total purchase price of $2.6 million.
Liquidity
The objectives of the Company’s liquidity management policy include providing adequate funds to meet the cash needs of both borrowers and depositors, to provide for the on-going operations of the Company, and to capitalize on opportunities for expansion. Liquidity management addresses the Company’s ability to meet deposit withdrawals on demand or at contractual maturity, to repay borrowings as they mature, and to fund new loans and investments as opportunities arise. The primary sources of internally generated funds are principal and interest payments on loans receivable, increases in local deposits, cash flows generated from operations, and cash flows generated by investments. If the Company requires funds beyond its internal funding capabilities, it may rely upon external sources of funds such in brokered deposits and Federal Home Loan Bank (“FHLB”) advances. The Company has $136.8 million in additional advances available from its line of credit from the FHLB. The FHLB functions as a central reserve bank providing credit for member financial institutions. As a member of the FHLB, we are required to own capital stock in the FHLB and we are authorized to apply for advances on the security of such stock and certain of our mortgage loans and other assets (principally securities that are obligations of, or guaranteed by, the U.S. Government) provided certain creditworthiness standards have been met. Advances are made pursuant to several different credit programs. Each credit program has its own interest rate and range of maturities. Depending on the program, limitations on the amount of advances are based on the financial condition of the member institution and the adequacy of collateral pledged to secure the credit. The Company may also solicit brokered deposits for providing funds for asset growth.
In the normal course of business, various commitments are outstanding that are not reflected in the consolidated financial statements. Commitments to extend credit and undisbursed advances on customer lines of credit are agreements to lend to a customer as long as there is no violation of any condition established in the contract. The funding of these commitments and previously approved undisbursed lines of credit could effect the Company’s liquidity position. At December 31, 2006, the Company had loan commitments of $46.4 million, $8.5 million in undisbursed construction loan proceeds, and unused lines of credit of $105.3 million. The Company believes that it has adequate resources to fund loan commitments and lines of credit as they arise. The Company does not have any special purpose entities or other similar forms of off-balance sheet financing.
35
Under existing contractual obligations, the Company will be required to make payments in future periods. The following table presents aggregated information about payments due under such contractual obligations at December 31, 2006. The Company expects that a portion of the deposits will not be renewed upon maturity. If there is a higher than normal level of time deposits that are not renewed at maturity, then the Company may experience a decrease in liquidity. This may result in the Company offering higher than market interest rates to maintain deposits, which would increase interest expense. Transaction deposit accounts with indeterminate maturities have been classified as having payments due in one year or less.
Contractual Maturities
| | Payments Due by Period at December 31, 2006 | |
| |
| |
| | One Year
Or Less | | One to
Three Years | | Three to
Five Years | | Over Five
Years | | Total | |
| |
|
| |
|
| |
|
| |
|
| |
|
| |
| | (in thousands) | |
Borrowed Funds | | $ | 25,000 | | $ | 16,000 | | $ | 9,500 | | $ | 35,464 | | $ | 85,964 | |
Deposits | | | 522,790 | | | 32,824 | | | 7,189 | | | 0 | | | 562,802 | |
Lease Obligations | | | 345 | | | 492 | | | 64 | | | 0 | | | 901 | |
| |
|
| |
|
| |
|
| |
|
| |
|
| |
Total | | $ | 548,135 | | $ | 49,316 | | $ | 16,753 | | $ | 35,464 | | $ | 649,667 | |
| |
|
| |
|
| |
|
| |
|
| |
|
| |
Market Risks
Market risk reflects the risk of economic loss resulting from adverse changes in market price and interest risks. The risk of loss can be reflected in diminished market values and/or reduced net interest income in future periods.
The Company’s most significant form of market risk is interest rate risk, as the majority of the Company’s assets and liabilities are sensitive to changes in interest rates. The structure of the Company’s loan and deposit portfolios is such that significant declines in interest rates could adversely impact net market values and net interest income. The Company does not maintain a trading account, nor is it subject to currency exchange risk or commodity price risk. The Company’s Asset/Liability Committee (“ALCO”) is responsible for monitoring and managing exposure to interest rate risk, as discussed below in “Interest Rate Sensitivity”.
Interest Rate Sensitivity
The Company’s ALCO monitors the Company’s level of interest rate sensitivity and ensures that the level of sensitivity of the Company’s net portfolio value is maintained within limits established by the Board of Directors. Through such management, the ALCO seeks to reduce the vulnerability of the Company’s operations to changes in interest rates. During the past year, the ALCO utilized the following strategies to manage interest rate risk: (1) emphasizing the origination and retention of short-term commercial business loans and nonresidential mortgage loans; (2) emphasizing the origination of adjustable-rate home equity lines of credit; (3) emphasizing the origination and retention of adjustable-rate one-to-four family residential mortgage loans; (4) originating all new fixed-rate mortgage loans as a broker for a third party; and (5) investing in shorter-term investment securities.
The Office of Thrift Supervision requires the computation of amounts by which the net present value of the Bank’s cash flow from assets, liabilities, and off balance sheet items (the Bank’s net portfolio value or “NPV”) and the net interest income (“NII”) of the Bank would change in the event of a range of assumed changes in market interest rates. These computations estimate the effect on a bank’s NPV and NII from instantaneous and permanent one hundred- to three hundred-basis point increases and decreases in market interest rates. The following table presents the Bank’s projected change in NPV and NII at December 31, 2006, as calculated by an independent third party, based upon information provided by the Bank. The Bank’s level of sensitivity, given a hypothetical, immediate, and sustained change in interest rates from + 300 basis points to – 300 basis points, is within the range of acceptable sensitivity established by the Board of Directors.
36
Interest Rate Sensitivity
Hypothetical, Immediate, and Sustained Changes in Interest Rates | | Estimated Theoretical
Net Interest Income | | Estimated Theoretical
Net Portfolio Value | |
|
| |
| |
| Amount | | % Change | | Amount | | % Change | |
| |
| |
| |
| |
| |
| | (dollars in thousands) | |
300 basis point rise | | $ | 22,438 | | | 3.8 | % | $ | 92,404 | | | -11.2 | % |
200 basis point rise | | | 22,217 | | | 2.8 | % | | 96,623 | | | -7.2 | % |
100 basis point rise | | | 21,963 | | | 1.6 | % | | 100,484 | | | -3.4 | % |
No change | | | 20,621 | | | 0.0 | % | | 104,071 | | | 0.0 | % |
100 basis point decline | | | 21,838 | | | 1.0 | % | | 106,883 | | | 2.7 | % |
200 basis point decline | | | 21,669 | | | 0.2 | % | | 107,472 | | | 3.3 | % |
300 basis point decline | | | 20,579 | | | -4.8 | % | | 108,154 | | | 3.9 | % |
Certain shortcomings are inherent in the methodology used in the above interest rate risk measurement. Modeling changes in NPV require the making of certain assumptions, which may or may not reflect the manner in which actual yields and costs respond to changes in market interest rates. In this regard, the NPV table presented assumes that the composition of the interest sensitive assets and liabilities existing at the beginning of a period remains constant over the period being measured and also assumes that a particular change in interest rates is reflected uniformly across the yield curve regardless of the duration to maturity or repricing of specific assets and liabilities. Accordingly, although the NPV table provides an indication of the Bank’s interest rate risk exposure at a particular point in time, such measurements are not intended to and do not provide a precise forecast of the effect of changes in market interest rates on the Bank’s net interest income and will differ from actual results.
Impact of Inflation and Changing Prices
The consolidated financial statements and related notes have been prepared in accordance with GAAP, which require the measurement of financial position and operating results in terms of historical dollars, without considering the change in the relative purchasing power of money over time due to inflation. Unlike most industrial companies, nearly all the assets and liabilities of the Company are financial in nature. As a result, interest rates have a more significant impact on the Company’s performance than the effect of inflation. Interest rates do not necessarily change in the same magnitude as the price of goods and services.
37
Quarterly Financial Data (unaudited)
| | First Quarter | | Second Quarter | | Third Quarter | | Fourth Quarter | |
| |
|
| |
|
| |
|
| |
|
| |
| | (in thousands, except per share data) | |
2006 | | | | | | | | | | | | | |
Interest income | | $ | 9,866 | | $ | 10,482 | | $ | 11,125 | | $ | 11,446 | |
Interest expense | | | 4,767 | | | 5,268 | | | 5,923 | | | 6,321 | |
| |
|
| |
|
| �� |
|
| |
|
| |
Net interest income | | | 5,099 | | | 5,214 | | | 5,202 | | | 5,125 | |
Provision for loan losses | | | 285 | | | 280 | | | 300 | | | 300 | |
| |
|
| |
|
| |
|
| |
|
| |
Net int. income after provision for loan losses | | | 4,814 | | | 4,934 | | | 4,902 | | | 4,825 | |
Noninterest income | | | 1,414 | | | 1,369 | | | 1,643 | | | 1,715 | |
Noninterest expense | | | 4,545 | | | 4,282 | | | 4,388 | | | 4,329 | |
| |
|
| |
|
| |
|
| |
|
| |
Income before income taxes | | | 1,683 | | | 2,021 | | | 2,157 | | | 2,211 | |
Income taxes | | | 496 | | | 674 | | | 719 | | | 728 | |
| |
|
| |
|
| |
|
| |
|
| |
Net income | | $ | 1,187 | | $ | 1,347 | | $ | 1,438 | | $ | 1,483 | |
| |
|
| |
|
| |
|
| |
|
| |
Per share data: | | | | | | | | | | | | | |
Net income: | | | | | | | | | | | | | |
Basic | | $ | 0.15 | | $ | 0.17 | | $ | 0.18 | | $ | 0.19 | |
Diluted | | | 0.15 | | | 0.17 | | | 0.18 | | | 0.18 | |
Cash dividends declared | | | 0.075 | | | 0.075 | | | 0.075 | | | 0.075 | |
Common stock price: | | | | | | | | | | | | | |
High | | | 13.35 | | | 12.80 | | | 13.86 | | | 13.28 | |
Low | | | 12.35 | | | 11.94 | | | 12.25 | | | 12.57 | |
2005 | | | | | | | | | | | | | |
Interest income | | $ | 5,801 | | $ | 6,128 | | $ | 6,482 | | $ | 8,537 | |
Interest expense | | | 2,172 | | | 2,463 | | | 2,774 | | | 4,060 | |
| |
|
| |
|
| |
|
| |
|
| |
Net interest income | | | 3,629 | | | 3,665 | | | 3,708 | | | 4,477 | |
Provision for loan losses | | | 150 | | | 120 | | | 140 | | | 575 | |
| |
|
| |
|
| |
|
| |
|
| |
Net int. income after provision for loan losses | | | 3,479 | | | 3,545 | | | 3,568 | | | 3,902 | |
Noninterest income | | | 985 | | | 1,115 | | | 1,095 | | | 1,246 | |
Noninterest expense | | | 3,185 | | | 3,370 | | | 3,281 | | | 4,503 | |
| |
|
| |
|
| |
|
| |
|
| |
Income before income taxes | | | 1,279 | | | 1,290 | | | 1,382 | | | 645 | |
Income taxes | | | 377 | | | 389 | | | 418 | | | 139 | |
| |
|
| |
|
| |
|
| |
|
| |
Net income | | $ | 902 | | $ | 901 | | $ | 964 | | $ | 506 | |
| |
|
| |
|
| |
|
| |
|
| |
Per share data: | | | | | | | | | | | | | |
Net income: | | | | | | | | | | | | | |
Basic | | $ | 0.13 | | $ | 0.13 | | $ | 0.14 | | $ | 0.06 | |
Diluted | | | 0.13 | | | 0.13 | | | 0.14 | | | 0.06 | |
Cash dividends declared | | | 0.07 | | | 0.07 | | | 0.07 | | | 0.07 | |
Common stock price: | | | | | | | | | | | | | |
High | | | 14.25 | | | 13.90 | | | 12.80 | | | 12.75 | |
Low | | | 12.91 | | | 11.76 | | | 11.41 | | | 11.70 | |
38
ITEM 7A. | Quantitative and Qualitative Disclosures About Market Risk |
Information responsive to this item in contained in Item 7. above under the captions “Management of Market Risk” and “Liquidity and Capital Resources”.
39
ITEM 8. | Financial Statements and Supplementary Data |
| 
|
| |
REPORT OF INDEPENDENT REGISTERD PUBLIC ACCOUNTING FIRM |
| |
| |
| The Board of Directors |
| Citizens South Banking Corporation |
| Gastonia, North Carolina |
| |
| We have audited the accompanying consolidated statements of financial condition of Citizens South Banking Corporation and subsidiaries as of December 31, 2006 and 2005 and the related consolidated statements of operations, comprehensive income, changes in stockholders’ equity and cash flows for each of the years in the three-year period ended December 31, 2006. These financial statements are the responsibility of management. Our responsibility is to express an opinion on these financial statements based on our audits. |
| |
| We conducted our audits in accordance with the standards of the Public Company Accounting Oversight Board (United States). Those standards require that we plan and perform the audit to obtain reasonable assurance about whether the financial statements are free of material misstatement. An audit includes examining, on a test basis, evidence supporting the amounts and disclosures in the financial statements. An audit also includes assessing the accounting principles used and significant estimates made by management, as well as evaluating the overall financial statement presentation. We believe that our audits provide a reasonable basis for our opinion. |
| |
| In our opinion, the consolidated financial statements referred to above present fairly, in all material respects, the financial position of Citizens South Banking Corporation and subsidiaries as of December 31, 2006 and 2005 and the results of their operations and their cash flows for each of the years in the three-year period ended December 31, 2006, in conformity with accounting principles generally accepted in the United States of America. |
| |
| We have also audited, in accordance with the standards of the Public Company Accounting Oversight Board (United States), the effectiveness of Citizens South Banking Corporation’s internal control over financial reporting as of December 31, 2006, based on criteria established in Internal Control-Integrated Framework issued by the Committee of Sponsoring Organizations of the Treadway Commission (COSO) and our report dated March 3, 2007 expressed an unqualified opinion thereon. |
| /s/ Cherry, Bekaert & Holland, L.L.P. | |
| | |
| Gastonia, North Carolina | |
| March 3, 2007 | |
40
CITIZENS SOUTH BANKING CORPORATION
Consolidated Statements of Financial Condition
| | December 31, | |
| |
| |
| | 2006 | | 2005 | |
| |
|
| |
|
| |
Assets | | | | | | | |
Cash and due from banks | | $ | 17,581,168 | | $ | 8,863,423 | |
Interest-earning bank balances | | | 8,639,809 | | | 17,790,015 | |
| |
|
| |
|
| |
Cash and cash equivalents | | | 26,220,977 | | | 26,653,438 | |
Investment securities available-for-sale | | | 65,326,045 | | | 53,428,704 | |
Mortgage-backed and related securities available-for-sale | | | 60,691,351 | | | 70,236,442 | |
Loans, net of deferred fees | | | 515,401,738 | | | 473,335,554 | |
Allowance for loan losses | | | (5,763,923 | ) | | (5,103,528 | ) |
| |
|
| |
|
| |
Loans, net | | | 509,637,815 | | | 468,232,026 | |
Other real estate owned | | | 138,785 | | | 1,156,867 | |
Premises and equipment, net | | | 18,286,967 | | | 19,818,978 | |
Accrued interest receivable | | | 3,235,733 | | | 2,538,696 | |
Federal Home Loan Bank stock | | | 3,581,000 | | | 4,083,700 | |
Intangible assets | | | 31,666,233 | | | 32,424,118 | |
Bank owned life insurance | | | 15,526,615 | | | 14,827,784 | |
Other assets | | | 9,058,516 | | | 7,693,218 | |
| |
|
| |
|
| |
Total assets | | $ | 743,370,037 | | $ | 701,093,971 | |
| |
|
| |
|
| |
Liabilities and Stockholders’ Equity | | | | | | | |
Deposits | | $ | 562,801,771 | | $ | 517,543,801 | |
Borrowed money | | | 63,485,000 | | | 72,308,000 | |
Subordinated debt | | | 15,464,000 | | | 15,464,000 | |
Retail repurchase agreements | | | 7,015,488 | | | 3,570,267 | |
Deferred compensation | | | 5,723,439 | | | 5,848,862 | |
Other liabilities | | | 2,919,104 | | | 2,101,393 | |
| |
|
| |
|
| |
Total liabilities | | | 657,408,802 | | | 616,836,323 | |
Commitments and contingencies | | | | | | | |
Stockholders’ Equity | | | | | | | |
Preferred stock, 10,000,000 shares authorized, none issued | | | — | | | — | |
Common stock, $0.01 par value, 20,000,000 shares authorized in 2006 and 2005, 9,062,727 shares issued in 2006 and 2005, and 8,111,659 shares outstanding in 2006 and 8,291,544 shares outstanding in 2005 | | | 90,628 | | | 90,628 | |
Additional paid-in-capital | | | 68,577,852 | | | 68,467,766 | |
Unallocated common stock held by Employee Stock Ownership Plan | | | (1,430,189 | ) | | (1,613,033 | ) |
Unearned compensation related to Recognition and Retention Plan | | | (1,138,792 | ) | | (1,418,608 | ) |
Retained earnings, substantially restricted | | | 33,031,513 | | | 30,310,653 | |
Accumulated unrealized loss on securities available-for-sale, net of tax | | | (991,085 | ) | | (1,567,034 | ) |
Treasury stock of 951,068 shares at December 31, 2006, and 771,183 shares at December 31, 2005, at cost | | | (12,178,692 | ) | | (10,012,724 | ) |
| |
|
| |
|
| |
Total stockholders’ equity | | | 85,961,235 | | | 84,257,648 | |
| |
|
| |
|
| |
Total liabilities and stockholders’ equity | | $ | 743,370,037 | | $ | 701,093,971 | |
| |
|
| |
|
| |
See notes to consolidated financial statements.
41
CITIZENS SOUTH BANKING CORPORATION
Consolidated Statements of Operations
| | Year Ended
December 31,
2006 | | Year Ended
December 31,
2005 | | Year Ended
December 31,
2004 | |
| |
|
| |
|
| |
|
| |
Interest income | | | | | | | | | | |
Loans | | $ | 37,447,545 | | $ | 22,128,174 | | $ | 16,115,649 | |
Investment securities | | | 2,834,838 | | | 2,065,833 | | | 2,048,161 | |
Mortgage-backed and related securities | | | 2,636,696 | | | 2,754,091 | | | 2,946,442 | |
| |
|
| |
|
| |
|
| |
Total interest income | | | 42,919,079 | | | 26,948,098 | | | 21,110,252 | |
Interest expense | | | | | | | | | | |
Deposits | | | 18,103,014 | | | 8,976,879 | | | 6,127,372 | |
Borrowed funds | | | 4,176,204 | | | 2,492,434 | | | 1,815,867 | |
| |
|
| |
|
| |
|
| |
Total interest expense | | | 22,279,218 | | | 11,469,313 | | | 7,943,239 | |
| |
|
| |
|
| |
|
| |
Net interest income | | | 20,639,861 | | | 15,478,785 | | | 13,167,013 | |
Provision for loan losses | | | 1,165,000 | | | 985,000 | | | 330,000 | |
| |
|
| |
|
| |
|
| |
Net interest income after provision for loan losses | | | 19,474,861 | | | 14,493,785 | | | 12,837,013 | |
Noninterest income | | | | | | | | | | |
Fee income on deposit accounts | | | 2,855,419 | | | 2,486,197 | | | 2,426,137 | |
Fee income on mortgage banking and lending activities | | | 1,282,742 | | | 573,358 | | | 545,948 | |
Net gain (loss) on sale of securities | | | (41,350 | ) | | 16,688 | | | 453,725 | |
Gain on sale of other assets | | | 110,523 | | | 45,131 | | | 220,543 | |
Commissions on sales of financial products | | | 253,841 | | | 159,180 | | | 120,035 | |
Dividends on FHLB stock | | | 221,413 | | | 155,310 | | | 96,289 | |
Fair market adjustment on deferred compensation assets | | | 206,987 | | | 83,251 | | | 177,983 | |
Increase in value of bank owned life insurance | | | 762,213 | | | 614,452 | | | 591,862 | |
Other income | | | 489,026 | | | 307,718 | | | 191,755 | |
| |
|
| |
|
| |
|
| |
Total noninterest income | | | 6,140,814 | | | 4,441,285 | | | 4,824,277 | |
Noninterest expense | | | | | | | | | | |
Compensation and benefits | | | 9,393,723 | | | 7,271,073 | | | 6,579,309 | |
Occupancy | | | 2,614,131 | | | 2,100,862 | | | 1,779,070 | |
Office supplies expense | | | 258,434 | | | 241,827 | | | 321,375 | |
Advertising | | | 492,133 | | | 287,288 | | | 340,773 | |
Professional services | | | 550,191 | | | 540,281 | | | 534,723 | |
Telephone | | | 350,023 | | | 284,116 | | | 317,665 | |
Data processing | | | 347,043 | | | 352,709 | | | 221,678 | |
Deposit insurance | | | 65,407 | | | 53,932 | | | 53,916 | |
Amortization of intangible assets | | | 734,000 | | | 408,907 | | | 424,808 | |
Impairment on investment securities | | | — | | | — | | | 982,893 | |
Merger and conversion expense | | | 56,628 | | | 383,809 | | | — | |
Other expense | | | 2,681,965 | | | 2,414,745 | | | 2,072,619 | |
| |
|
| |
|
| |
|
| |
Total noninterest expense | | | 17,543,678 | | | 14,339,549 | | | 13,628,829 | |
| |
|
| |
|
| |
|
| |
Income before income taxes | | | 8,071,997 | | | 4,595,521 | | | 4,032,461 | |
Provision for income taxes | | | 2,617,120 | | | 1,322,812 | | | 1,077,040 | |
| |
|
| |
|
| |
|
| |
Net income | | $ | 5,454,877 | | $ | 3,272,709 | | $ | 2,955,421 | |
| |
|
| |
|
| |
|
| |
Earnings per share | | | | | | | | | | |
Basic earnings per share | | $ | 0.68 | | $ | 0.45 | | $ | 0.39 | |
Diluted earnings per share | | $ | 0.67 | | $ | 0.45 | | $ | 0.38 | |
See notes to consaolidated financial statements.
42
CITIZENS SOUTH BANKING CORPORATION
Consolidated Statements of Comprehensive Income
| | Year Ended
December 31,
2006 | | Year Ended
December 31,
2005 | | Year Ended
December 31,
2004 | |
| |
|
| |
|
| |
|
| |
Net income | | $ | 5,454,877 | | $ | 3,272,709 | | $ | 2,955,421 | |
Other comprehensive income, net of tax: | | | | | | | | | | |
Unrealized losses on securities | | | | | | | | | | |
Unrealized holding gains (losses) arising during period, net of tax of ($338,858), $640,014, and $49,616 respectively | | | 602,413 | | | (1,137,802 | ) | | (88,205 | ) |
Reclassification adjustment for loss included in net income, net of tax effect of $41,350, $6,008, and $163,341, respectively | | | (26,464 | ) | | (10,680 | ) | | (290,384 | ) |
| |
|
| |
|
| |
|
| |
Other comprehensive income (loss) | | | 575,949 | | | (1,148,482 | ) | | (378,589 | ) |
| |
|
| |
|
| |
|
| |
Comprehensive income | | $ | 6,030,826 | | $ | 2,124,227 | | $ | 2,576,832 | |
| |
|
| |
|
| |
|
| |
43
CITIZENS SOUTH BANKING CORPORATION
Consolidated Statements of Changes in Stockholders’ Equity
| | Preferred
Stock | | Common
Stock | | Additional
Paid-In
Capital | | Unallocated
Common Stock
Held by ESOP | | Unearned
Compensation
Related to
RRP | | Retained
Earnings
Substantially
Restricted | | Accumulated Unrealized
Gains(Losses),
net of tax | | Treasury
Stock | | Total
Stockholders’
Equity | |
| |
|
| |
|
| |
|
| |
|
| |
|
| |
|
| |
|
| |
|
| |
|
| |
Balance, January 1, 2004 | | | — | | | 90,628 | | | 68,280,596 | | | (1,978,722 | ) | | (1,979,449 | ) | | 28,823,864 | | | (39,963 | ) | | (5,528,046 | ) | | 87,668,908 | |
Comprehensive results: | | | | | | | | | | | | | | | | | | | | | | | | | | | | |
Net income | | | — | | | — | | | — | | | — | | | — | | | 2,955,421 | | | — | | | — | | | 2,955,421 | |
Other comprehensive results, net of tax | | | — | | | — | | | — | | | — | | | — | | | — | | | (378,589 | ) | | — | | | (378,589 | ) |
Allocation from shares purchased with loan to ESOP | | | — | | | — | | | 100,150 | | | 182,845 | | | — | | | — | | | — | | | — | | | 282,995 | |
Repurchase of common stock | | | — | | | — | | | — | | | — | | | — | | | — | | | — | | | (16,403,258 | ) | | (16,403,258 | ) |
Vesting of Recognition and Retention Plan | | | — | | | — | | | — | | | — | | | 281,025 | | | — | | | — | | | — | | | 281,025 | |
Issuance of treasury stock (100 shares) | | | — | | | — | | | — | | | — | | | — | | | — | | | — | | | 1,315 | | | 1,315 | |
Cash dividends declared on common stock | | | — | | | — | | | — | | | — | | | — | | | (2,013,560 | ) | | — | | | — | | | (2,013,560 | ) |
| |
|
| |
|
| |
|
| |
|
| |
|
| |
|
| |
|
| |
|
| |
|
| |
Balance, December 31, 2004 | | | — | | | 90,628 | | | 68,380,746 | | | (1,795,877 | ) | | (1,698,424 | ) | | 29,765,725 | | | (418,552 | ) | | (21,929,989 | ) | | 72,394,257 | |
Comprehensive results: | | | | | | | | | | | | | | | | | | | | | | | | | | | | |
Net income | | | — | | | — | | | — | | | — | | | — | | | 3,272,709 | | | — | | | — | | | 3,272,709 | |
Other comprehensive results, net of tax | | | — | | | — | | | — | | | — | | | — | | | — | | | (1,148,482 | ) | | — | | | (1,148,482 | ) |
Allocation from shares purchased with loan to ESOP | | | — | | | — | | | 87,020 | | | 182,844 | | | — | | | — | | | — | | | — | | | 269,864 | |
Repurchase of common stock | | | — | | | — | | | — | | | — | | | — | | | — | | | — | | | (5,654,999 | ) | | (5,654,999 | ) |
Vesting of Recognition and Retention Plan | | | — | | | — | | | — | | | — | | | 279,816 | | | — | | | — | | | — | | | 279,816 | |
Exercise of options | | | — | | | — | | | — | | | — | | | — | | | (189,295 | ) | | — | | | 329,964 | | | 140,669 | |
Issuance of treasury stock (1,280,052 shares) | | | — | | | — | | | — | | | — | | | — | | | (470,678 | ) | | — | | | 17,242,300 | | | 16,771,622 | |
Cash dividends declared on common stock | | | — | | | — | | | — | | | — | | | — | | | (2,067,808 | ) | | — | | | — | | | (2,067,808 | ) |
| |
|
| |
|
| |
|
| |
|
| |
|
| |
|
| |
|
| |
|
| |
|
| |
Balance, December 31, 2005 | | | — | | | 90,628 | | | 68,467,766 | | | (1,613,033 | ) | | (1,418,608 | ) | | 30,310,653 | | | (1,567,034 | ) | | (10,012,724 | ) | | 84,257,648 | |
Comprehensive results: | | | | | | | | | | | | | | | | | | | | | | | | | | | | |
Net income | | | — | | | — | | | — | | | — | | | — | | | 5,454,877 | | | — | | | — | | | 5,454,877 | |
Other comprehensive results, net of tax | | | — | | | — | | | — | | | — | | | — | | | — | | | 575,950 | | | — | | | 575,950 | |
Allocation from shares purchased with loan to ESOP | | | — | | | — | | | 84,892 | | | 182,844 | | | — | | | — | | | — | | | — | | | 267,736 | |
Repurchase of common stock | | | — | | | — | | | — | | | — | | | — | | | — | | | — | | | (2,624,719 | ) | | (2,624,719 | ) |
Vesting of Recognition and Retention Plan | | | — | | | — | | | — | | | — | | | 279,816 | | | — | | | — | | | — | | | 279,816 | |
Stock option expense | | | — | | | — | | | 25,194 | | | — | | | — | | | — | | | — | | | — | | | 25,194 | |
Exercise of options | | | — | | | — | | | — | | | — | | | — | | | (322,958 | ) | | — | | | 458,751 | | | 135,793 | |
Cash dividends declared on common stock | | | — | | | — | | | — | | | — | | | — | | | (2,411,060 | ) | | — | | | — | | | (2,411,060 | ) |
| |
|
| |
|
| |
|
| |
|
| |
|
| |
|
| |
|
| |
|
| |
|
| |
Balance, December 31, 2006 | | $ | — | | $ | 90,628 | | $ | 68,577,852 | | $ | (1,430,189 | ) | $ | (1,138,792 | ) | $ | 33,031,512 | | $ | (991,084 | ) | $ | (12,178,692 | ) | $ | 85,961,235 | |
| |
|
| |
|
| |
|
| |
|
| |
|
| |
|
| |
|
| |
|
| |
|
| |
See notes to consolidated financial statements.
44
CITIZENS SOUTH BANKING CORPORATION
Consolidated Statements of Cash Flows
| | Year Ended
December 31,
2006 | | Year Ended
December 31,
2005 | | Year Ended
December 31,
2004 | |
| |
|
| |
|
| |
|
| |
Operating Activities | | | | | | | | | | |
Net Income | | $ | 5,454,877 | | $ | 3,272,709 | | $ | 2,955,421 | |
Adjustments to reconcile net income to net cash provided by operating activities | | | | | | | | | | |
Provision for loan losses | | | 1,165,000 | | | 985,000 | | | 330,000 | |
Depreciation | | | 1,330,879 | | | 1,221,098 | | | 1,036,209 | |
Impairment on investment securities | | | — | | | — | | | 982,893 | |
Deferred income tax (benefit) | | | (408,355 | ) | | 224,212 | | | (40,661 | ) |
(Gain) loss on sale of investments available-for-sale | | | 41,350 | | | (16,688 | ) | | (453,725 | ) |
Gain on sale of other assets | | | (110,524 | ) | | (45,131 | ) | | (220,543 | ) |
Deferred loan origination fees | | | (410,116 | ) | | 243,035 | | | (74,330 | ) |
Amortization of intangible assets | | | 734,000 | | | 408,907 | | | 424,808 | |
Allocation of shares to the ESOP | | | 267,736 | | | 269,864 | | | 282,995 | |
Stock option expense | | | 25,194 | | | — | | | — | |
Vesting of shares issued for the RRP Plan | | | 279,816 | | | 279,816 | | | 281,025 | |
(Increase) decrease in interest receivable | | | (697,037 | ) | | (249,399 | ) | | 280,814 | |
Net (increase) decrease in other operating assets | | | (1,063,582 | ) | | 3,971,815 | | | (1,819,969 | ) |
| |
|
| |
|
| |
|
| |
Net cash provided by operating activities | | | 6,609,238 | | | 10,565,238 | | | 3,964,937 | |
Investing Activities | | | | | | | | | | |
Acquisition of Trinity Bank, net of cash acquired | | | — | | | (16,771,138 | ) | | — | |
Net increase in loans made to customers | | | (42,160,673 | ) | | (43,043,715 | ) | | (19,256,152 | ) |
Proceeds from the sale of premises and equipment | | | 647,813 | | | 191,064 | | | 428,835 | |
Proceeds from the sale of investment securities | | | 98,300 | | | 9,391,794 | | | 1,810,745 | |
Proceeds from the sale of mortgage-backed and related securities | | | 2,236,956 | | | 30,325,830 | | | 6,381,533 | |
Proceeds from sale of REO | | | 914,074 | | | 517,393 | | | 64,909 | |
Maturities and prepayments of investment securities | | | 13,848,457 | | | 5,066,025 | | | 22,363,848 | |
Maturities and prepayments of mortgage-backed and related securities | | | 14,967,504 | | | 20,232,254 | | | 22,733,334 | |
Purchases of investment securities | | | (25,643,486 | ) | | (10,623,066 | ) | | (20,302,959 | ) |
Purchases of mortgage-backed and related securities | | | (6,940,190 | ) | | (8,788,599 | ) | | (21,330,211 | ) |
Purchases (sales) of FHLB stock | | | 502,700 | | | 331,500 | | | (545,700 | ) |
Purchases of premises and equipment | | | (232,149 | ) | | (1,375,950 | ) | | (3,668,508 | ) |
| |
|
| |
|
| |
|
| |
Net cash used in investing activities | | | (41,760,694 | ) | | (14,546,608 | ) | | (11,320,326 | ) |
Financing Activities | | | | | | | | | | |
Net increase in deposits | | | 45,257,970 | | | 6,534,989 | | | 32,298,752 | |
Dividends to stockholders | | | (2,411,059 | ) | | (2,067,808 | ) | | (2,013,560 | ) |
Exercise of options | | | 135,793 | | | 140,669 | | | — | |
Repurchase of common stock | | | (2,624,719 | ) | | (5,654,999 | ) | | (16,403,258 | ) |
Increase (decrease) in borrowed money | | | (9,051,563 | ) | | 18,981,000 | | | (3,300,000 | ) |
Increase in repurchase agreements | | | 3,445,221 | | | 1,171,053 | | | 90,144 | |
Increase (decrease) in advances from borrowers for insurance and taxes | | | (32,648 | ) | | (60,357 | ) | | 59,387 | |
| |
|
| |
|
| |
|
| |
Net cash provided by financing activities | | | 34,718,995 | | | 19,044,547 | | | 10,731,465 | |
Net increase (decrease) in cash and cash equivalents | | | (432,461 | ) | | 15,063,177 | | | 3,376,076 | |
Cash and cash equivalents at the beginning of the year | | | 26,653,438 | | | 11,590,261 | | | 8,214,185 | |
| |
|
| |
|
| |
|
| |
Cash and cash equivalents at the end of the year | | $ | 26,220,977 | | $ | 26,653,438 | | $ | 11,590,261 | |
| |
|
| |
|
| |
|
| |
See notes to consolidated financial statements.
45
CITIZENS SOUTH BANKING CORPORATION
Notes to Consolidated Financial Statements
Note 1 - Organization and Summary of Significant Accounting Policies
Organization - Citizens South Banking Corporation (also referred to as the “Company”, the “Registrant”, “We”, “Us”, or “Our”) is a Delaware corporation that owns all of the outstanding shares of common stock of Citizens South Bank (the “Bank”). The shares of common stock of the Company trade on the Nasdaq Global Market under the ticker symbol “CSBC.” The Company’s principal business activities are overseeing and directing the business of the Bank. The Company’s assets consist primarily of the outstanding capital stock of the Bank, deposits held at the Bank, and investment securities. The Company became the holding company for the Bank on September 30, 2002, in connection with the mutual-to-stock conversion of Citizens South Holdings, MHC, the mutual holding company of Citizens South Banking Corporation, a federal corporation, formerly named Gaston Federal Bancorp, Inc., which was originally formed on March 18, 1998, for the purpose of acting as the holding company for the Bank.
Citizens South Bank, which was chartered in 1904, is a federally chartered savings bank headquartered in Gastonia, North Carolina. The Bank’s principal business activity is offering FDIC-insured deposits to local customers through its 14 branch offices and investing those deposits, together with funds generated from operations and borrowings, in residential and nonresidential real estate loans, construction loans, commercial business loans, consumer loans, investment securities, and mortgage-backed securities. The Bank also acts as a broker in both the origination of loans secured by one-to-four family dwellings and in the sale of uninsured financial products. The Bank’s results of operations are heavily dependent on net interest income, which is the difference between the interest earned on loans and securities and the interest paid on deposits and borrowings. Results of operations are also materially affected by the Bank’s provision for loan losses, gains or losses from the sales of assets, fee income generated from deposit and loan accounts, commissions earned from the sale of uninsured investment products, and noninterest expenses. The Bank’s noninterest expense primarily consists of compensation and employee benefits, occupancy expense, professional services, advertising, and other noninterest expenses. Results of operations are also significantly affected by general economic and competitive conditions, changes in interest rates, and actions of regulatory and governmental authorities. The Bank’s wholly-owned subsidiary, Citizens South Financial Services, Inc. (doing business as Citizens South Investment Services) acts as an independent agent selling various uninsured financial products. Citizens South Bank has 14 full-service branch offices in the North Carolina Counties of Gaston, Union, Rowan, and Iredell and two loan production offices located in Mecklenburg County, North Carolina, and York County, South Carolina.
Basis of Presentation – The consolidated financial statements include the accounts of Citizens South Banking Corporation, its wholly-owned subsidiary, Citizens South Bank, and the Bank’s wholly-owned subsidiary, Citizens South Financial Services, Inc. All significant intercompany accounts and transactions have been eliminated. Certain of the prior year amounts have been reclassified to conform to current year presentation. Such reclassifications are immaterial to the financial statements.
Use of Estimates – The financial statements are prepared in accordance with accounting principles generally accepted in the United States of America which require management to make estimates and assumptions that affect the amounts reported in the financial statements and accompanying notes. Actual results could differ from those estimates.
Cash and Cash Equivalents – Cash and cash equivalents include cash on hand, amounts due from banks, short-term interest-bearing deposits, and federal funds sold. Generally, federal funds are purchased and sold for one-day periods.
Investment securities – Investment securities are generally classified as “available for sale” securities by management at the time of purchase. These securities are used to execute asset/liability management strategies and to manage liquidity. Securities classified as “available-for-sale” are carried at fair value, with unrealized gains and losses excluded from earnings and reported as a separate component of consolidated stockholders’ equity and as an item of other comprehensive income. Purchases and sales of securities are recorded on a trade-date basis. Gains and losses are recognized on a trade-date basis at the time of the sale using the specific identification method. Declines in the fair value of individual securities below their cost that are other than temporary result in write-downs of the individual securities to their fair value. The related write-downs are included in the consolidated earnings of the Company. Amortization of premiums and accretion of discounts are included in interest income over the life of the related security, or in the case of mortgage-backed and related securities, the estimated life of the security. No securities have been classified as either “held to maturity securities” or “trading securities.”
46
Loans - Loans that management has the intent and ability to hold for the foreseeable future are carried at their principal balance adjusted for any deferred loan fees or expenses. Interest income is earned on the level yield method based on the daily outstanding balance. Generally, loans are classified as nonaccrual, and the accrual of interest is discontinued, when the contractual payment of principal and interest has become 90 days past due or when, in management’s judgment, principal or interest is not collectible in accordance with the terms of the obligation. Cash receipts on nonaccrual loans are applied to principal. The accrual of interest resumes when the loan returns to performing status. The Company evaluates impairment of its residential mortgage and consumer loans on a collective basis. Commercial loans are considered to be impaired when, based on current information, it is probable that the Company will not collect all amounts due in accordance with contractual terms. Management monitors internally generated reports, including past due reports, payment histories, criticized asset reports, which include loans with historical payment problems or borrowers in troubled industries as well as other sources of information such as borrower financial statements, the value collateral, etc. to identify impaired loans. Discounted cash flow analyses or the estimated fair value of collateral are used in determining the fair value of impaired loans. When the ultimate collectibility of the principal balance of an impaired loan is in doubt, cash receipts are applied to principal.
Allowance for Loan Losses - The allowance for loan losses is determined by management and maintained at a level based on losses inherent in the portfolio that are probable and reasonably estimated at the balance sheet date. Management’s determination of the adequacy of the allowance is based on an evaluation of the portfolio, historical loan loss experience, availability and quality of collateral, changes in economic conditions, and the quality of the loan portfolio. The provision for loan losses is charged to operations in an amount sufficient to bring the allowance for loan losses to an estimated balance that is considered by management to be sufficient to adsorb potential losses in the loan portfolio. Loans are charged to the allowance at the time they are determined to be losses and subsequent recoveries are credited to the allowance. Unanticipated adverse changes may take place in the future which result in a material adjustment to the allowance for loan losses.
Concentrations of Credit Risk – The Company makes loans to individuals and small businesses primarily in the Company’s normal lending area which includes the North Carolina Counties of Gaston, Rowan, Union, and Iredell Counties, and the surrounding counties, along with York County, South Carolina. The Company has a diversified loan portfolio, and the borrowers’ ability to repay their loans is not dependent upon any specific economic segment.
Other Real Estate Owned – Other real estate owned is comprised of real estate properties acquired in partial or total satisfaction of problem loans. The properties are recorded at the lower of cost or fair value less estimated costs to sell at the date acquired. Losses arising at the time of acquisition of such properties are charged against the allowance for loan losses. Subsequent write-downs that may be required to the carrying value of these properties are charged to current operations. Gains and losses realized from the sale of other real estate owned are included in current operations.
Premises and Equipment – Premises and equipment are stated at cost less accumulated depreciation and amortization. Depreciation and amortization are computed over the estimated useful lives of the assets (from three to 30 years) primarily by the straight-line method. Maintenance and repairs are charged to operations in the period incurred. Leasehold improvements are amortized on a straight-line basis over the shorter of the estimated useful life of the improvement or the lease term. Gains and losses on dispositions of fixed assets are included in current operations.
Goodwill and Other Intangible Assets – Statement of Financial Accounting Standards (“SFAS”)No. 142, Goodwill and Other Intangible Assets, requires that goodwill and intangible assets with indefinite useful lives no longer be amortized, but instead tested for impairment at least annually in accordance with its provisions. In connection with adoption of SFAS No. 142, the Company is required to perform an initial assessment of whether there is an indication that goodwill is impaired. The Company completed its annual impairment tests at December 31, 2006, 2005 and 2004 and determined based on that analysis that goodwill was not impaired. Goodwill is tested for impairment annually, or between annual tests if an event occurs or circumstances change that would more likely than not reduce the fair value of a reporting unit below its carrying amount. The Company had no goodwill related to acquisitions initiated prior to July 1, 2001, or other intangible assets recorded prior to the adoption of the provisions of SFAS No. 142 whose carrying amounts or amortization were changed by the adoptions of the provisions of SFAS No. 142. SFAS No. 142 also requires that intangible assets with definite useful lives be amortized over their respective estimated useful lives to their estimated residual values. In accordance with SFAS No. 142 the Company’s core deposit intangibles, are amortized over their estimated useful life of eight years on an accelerated basis.
47
Income Taxes – Provisions for income taxes are based on amounts reported in the consolidated statements of income, excluding non-taxable income, and include changes in deferred income taxes. Deferred income taxes reflect the net tax effects of temporary differences between the carrying amounts of assets and liabilities for financial reporting purposes and the amounts used for income tax purposes. Amounts provided for deferred income taxes relate primarily to differences between tax and financial reporting for unrealized gains and losses on securities available-for-sale, allowances for loan losses, depreciation, and deferred compensation.
Income and Expenses – The Company uses the accrual method of accounting for all material income and expense items. Loan origination fees received and direct costs incurred are deferred and amortized to interest income over the contractual lives of the loans, using the level yield method. Current period expenses, such as advertising costs, are expensed as incurred.
Stock-Based Compensation – In December 2004, the Financial Accounting Standards Board (“FASB”) issued SFAS No. 123(R), Share-Based Payment. SFAS No. 123(R) establishes standards for the accounting for transactions in which an entity exchanges its equity instruments for goods or services. It also addressed transactions in which an entity incurs liabilities in exchange for goods or services that are based on the fair value of the entity’s equity instruments or that may be settled by the issuance of those equity instruments. The primary focus of this statement is on accounting for transactions in which an entity obtains employee services in exchange for share-based payment transactions. This Statement is effective for the beginning of the first interim or annual reporting period that begins after December 15, 2005. SFAS No. 123(R) was adopted by the Company January 1, 2006.
In October 2005, the Board of Directors vested all outstanding options that were issued prior to December 31, 2003, to minimize the expense recognized on stock options upon adoption of SFAS No. 123(R). As a result, the expected additional compensation that would have been recognized during the year ended December 31, 2006, was reduced from approximately $124,000 to $25,194. Based on the unvested options outstanding at December 31, 2006, the Company expects that the adoption of SFAS 123(R) will not result in any material additional compensation expense during 2007 and 2008.
48
For the years ended December 31, 2005 and 2004, the Company applied the provisions of Accounting Principles Board (“APB”) Opinion No. 25 in accounting for the plans and accordingly, no compensation expense was recognized in connection with the granting of the stock options during those periods. In accordance with SFAS No. 123, Accounting for Stock-Based Compensation, the Company adopted the disclosure–only option and elected to apply the provisions of APB No. 25 for financial statement purposes. The Company recognized compensation expense for fixed awards with pro rata vesting on a straight-line basis. Had the compensation cost for the Company’s stock option plan been determined in accordance with the fair-value accounting provisions of SFAS No. 123, net income, basic earnings per share and diluted earnings per share for 2005 and 2004 would have been as follows:
| | Year Ended
December 31,
2005 | | Year Ended
December 31,
2004 | |
| |
|
| |
|
| |
Net income: | | | | | | | |
As reported | | $ | 3,272,709 | | $ | 2,955,421 | |
Deduct: Stock based compensation | | | (206,991 | ) | | (94,512 | ) |
| |
|
| |
|
| |
Pro forma | | | 3,065,718 | | | 2,860,909 | |
Basic earnings per share: | | | | | | | |
As reported | | $ | 0.45 | | $ | 0.39 | |
Pro forma | | | 0.43 | | | 0.38 | |
Diluted earnings per share: | | | | | | | |
As reported | | $ | 0.45 | | $ | 0.38 | |
Pro forma | | | 0.42 | | | 0.37 | |
The fair value of each option grant is estimated on the date of grant using the Black-Scholes option-pricing model with the following weighted average assumptions used for the years ended December 31, 2005: dividend yield of 2.0%, expected volatility of 30%, a risk-free interest rate of 4.0%, and expected lives of seven years for the options. The following weighted average assumptions used for the years ended December 31, 2004: dividend yield of 2.0%, expected volatility of 31%, a risk-free interest rate of 3.3%, and expected lives of six years for the options.
New Accounting Standards - the FASB issued SFAS No. 156, “Accounting for Servicing of Financial Assets�� (“SFAS No. 156”) during the first quarter of 2006. This new Statement amends FASB Statement No. 140, Accounting for Transfers and Servicing of Financial Assets and Extinguishments of Liabilities, with respect to the accounting for separately recognized servicing assets and servicing liabilities. SFAS No. 156 requires an entity to separately recognize a servicing asset or a servicing liability when a company undertakes an obligation to service a financial asset under a servicing contract in certain situations. Such servicing assets or servicing liabilities are required to be initially measured at fair value, if practicable. SFAS No. 156 also allows an entity to choose one of two methods when subsequently measuring its servicing assets and servicing liabilities: (1) the amortization method or (2) the fair value measurement method. The amortization method existed under Statement 140 and remains unchanged in (1) allowing entities to amortize their servicing assets or servicing liabilities in proportion to and over the period of estimated net servicing income or net servicing loss and (2) requiring the assessment of those servicing assets or servicing liabilities for impairment or increased obligation based on fair value at each reporting date. The fair value measurement method allows entities to measure their servicing assets or servicing liabilities at fair value each reporting date and report changes in fair value in earnings in the period the change occurs. SFAS No. 156 permits a one-time reclassification of available-for- sale securities to trading securities by entities with recognized servicing rights upon initial adoption, provided certain criteria are met. The Company will be required to adopt SFAS No. 156 in the first quarter of 2007, and is currently evaluating the impact of the adoption of SFAS No. 156 on its financial position and results of operations, including the valuation methods and support for the assumptions that underlie the valuation.
In July 2006, FASB issued Interpretation No. 48, “Accounting for Uncertainty in Income Taxes—an interpretation of SFAS No. 109” (“FIN 48”), which clarifies the accounting for uncertainty in tax positions. This Interpretation requires that the Company recognize in its financial statements, the impact of a tax position, if that position is more likely than not of being sustained on audit, based on the technical merits of the position. The provisions of FIN 48 are effective as of the beginning of the Company’s 2007 fiscal year, with the cumulative effect of the change in accounting principle recorded as an adjustment to opening retained earnings. The Company is currently evaluating the impact of adopting FIN 48.
49
In September 2006, FASB issued SFAS No. 157, “Fair Value Measurements” (“SFAS No. 157”), which enhances existing guidance for measuring assets and liabilities using fair value and requires additional disclosure about the use of fair value for measurement. The Statement is effective for financial statements issued for fiscal years beginning after November 15, 2007, and interim periods within those fiscal years. The Company will be required to adopt SFAS No. 157 in the first quarter of 2008, and is currently evaluating the impact of the adoption of SFAS No. 157 on its financial position and results of operations, including the valuation methods and support for the assumptions that underlie the valuation.
In September 2006, the FASB issued SFAS No. 158, “Employers’ Accounting for Defined Benefit Pension and Other Postretirement Plans” (“SFAS No. 158”), which requires a calendar year-end company with publicly traded equity securities that sponsors a post-retirement benefit plan to fully recognize, as an asset or liability, the overfunded or underfunded status of its benefit plan(s) in its 2006 year-end balance sheet. Prospective application of SFAS No. 158 is required for fiscal years ending after December 15, 2006, for entities with publicly traded equity securities. The Company is currently evaluating the impact of adopting FASB No. 158 on its financial statements.
In September 2006, the Emerging Issues Task Force issued EITF Issue 06-4, “Accounting for Deferred Compensation and Postretirement Benefit Aspects of Endorsement Split-Dollar Life Insurance Arrangements” (“EITF Issue 06-4”). EITF Issue 06-4 requires that for endorsement split-dollar insurance arrangements that provide a benefit to an employee that extends to postretirement periods, an employer should recognize a liability for future benefits in accordance with SFAS No. 106 or APB No. 12 based on the substantive agreement of the employee. If the employee has effectively agreed to maintain a life insurance policy during postretirement periods, the costs of the life insurance policy during the postretirement periods should be accrued in accordance with either FASB Statement No. 106 or APB No. 12. If the employer has agreed to provide a death benefit, the employer should recognize a liability for the future death benefit in accordance with either SFAS No. 106 or APB No. 12. EITF Issue 06-4 is effective for fiscal years beginning after December 15, 2007. The Company is currently evaluating the impact of EITF Issue 06-4 on its financial statements.
Note 2 – Business Combination
On October 31, 2005, the Company consummated the merger of Trinity Bank (“Trinity”) into Citizens South Bank. Trinity was headquartered in Monroe, North Carolina, which is approximately 50 miles east of the Company’s headquarters. Accordingly, the results of operations of Trinity are included in the consolidated financial statements for the two-month period ended December 31, 2005. Trinity had three offices located in Union County, North Carolina, which had the fastest population growth of any county in North Carolina. The Company pursued the acquisition of Trinity in order to gain access to this high-growth market which complements the Company’s existing locations and to improve the Company’s efficiency ratio by adding an increased number of customer accounts to the Company’s existing operating structure.
Under the terms of the merger agreement, the Company issued a combination of common stock and cash for the outstanding common shares of Trinity Bank. Trinity shareholders were given the option of receiving 1.3931 shares of Citizens South common stock for each share of Trinity common stock, $18.25 in cash for each share of Trinity common stock, or a mixture of stock and cash for each Trinity share, such that 50% of the shares of Trinity common stock will be exchanged for Citizens South common stock. On October 31, 2005, Trinity shareholders received merger consideration of approximately 1,280,249 shares of common stock of the Company (subject to payment of cash in lieu of fractional shares) and approximately $16.8 million in cash (including cash paid in lieu of fractional shares), resulting in a total transaction value of approximately $37.8 million. The transaction price represented approximately 255% of Trinity’s book value, and resulted in goodwill of $23.0 million and a core deposit intangible of $2.3 million.
In order to provide financing for the cash portion of the Trinity acquisition, on October 28, 2005, the Company completed a private placement of an aggregate amount of $15.0 million in trust preferred securities, liquidation amount of $1,000 per security (the “Preferred Securities”), through a newly formed Delaware statutory trust subsidiary, CSBC Statutory Trust I (the “Trust”). In connection with the issuance of the Preferred Securities, on October 28, 2005, the Company entered into an Indenture by and between the Company and Wilmington Trust Company, as trustee. The Preferred Securities mature on December 15, 2035, but may be redeemed beginning December 15, 2010, if the Company exercises its rights to redeem the Debentures. The Preferred Securities require quarterly interest payments to the holders of the Preferred Securities, initially at a fixed rate of 6.095% through December 2010, and thereafter at a variable rate of three-month LIBOR plus 1.57%, reset quarterly.
50
The following table summarizes the estimated fair values of the assets acquired and liabilities assumed at October 31, 2005, the date of the acquisition.
Cash and cash equivalents | | $ | 4,227,031 | |
Investment securities | | | 37,562,308 | |
Loans, net | | | 112,289,368 | |
Premises and equipment | | | 2,404,414 | |
Intangible assets | | | 2,320,000 | |
Goodwill | | | 22,954,606 | |
Other assets | | | 8,666,551 | |
| |
|
| |
Total assets acquired | | | 190,424,278 | |
Deposits | | | 136,264,384 | |
Other liabilities | | | 16,389,010 | |
| |
|
| |
Total liabilities assumed | | | 152,653,394 | |
| |
|
| |
Net assets acquired | | $ | 37,770,884 | |
| |
|
| |
The $2.3 million of intangible assets was assigned to the core deposit intangible, which is being amortized over an eight-year life on an accelerated basis. Goodwill of $23.0 million represents the excess of the purchase price over the fair value of assets acquired and liabilities assumed, none of which is deductible for income tax purposes.
The following summarizes the unaudited results of operations as though the acquisition of Trinity Bank had occurred at January 1st.
| | 2005 | | 2004 | |
| |
|
| |
|
| |
Interest income | | $ | 33,805,000 | | $ | 28,065,000 | |
Interest expense | | | (14,480,000 | ) | | (11,539,000 | ) |
| |
|
| |
|
| |
Net interest income | | | 19,325,000 | | | 16,526,000 | |
Provision for loan losses | | | (1,000,000 | ) | | (602,000 | ) |
| |
|
| |
|
| |
Net interest income after provision | | | 18,325,000 | | | 15,924,000 | |
Noninterest income | | | 5,175,000 | | | 5,784,000 | |
Noninterest expense | | | (17,830,000 | ) | | (17,964,000 | ) |
| |
|
| |
|
| |
Income before income taxes | | | 5,670,000 | | | 3,744,000 | |
Provision for income taxes | | | (1,718,000 | ) | | 344,000 | |
| |
|
| |
|
| |
Net income | | $ | 3,952,000 | | $ | 4,088,000 | |
| |
|
| |
|
| |
Basic earnings per share | | $ | 0.55 | | $ | 0.54 | |
Diluted earnings per share | | $ | 0.54 | | $ | 0.53 | |
51
Note 3 - Investment Securities
The aggregate book and fair values, as well as gross unrealized gains and losses, of investment securities as of December 31, 2006 and 2005 were as follows:
| | December 31, 2006 | |
| |
| |
| | Book
Value | | Unrealized
Gains | | Unrealized
Losses | | Fair
Value | |
| |
|
| |
|
| |
|
| |
|
| |
Investment securities Available for Sale | | | | | | | | | | | | | |
U.S. government agencies | | $ | 33,319,355 | | $ | 2,590 | | $ | (320,911 | ) | $ | 33,001,034 | |
Municipals | | | 28,298,006 | | | 132,897 | | | (88,381 | ) | | 28,342,522 | |
Corporate bonds | | | 1,500,000 | | | — | | | (27,000 | ) | | 1,473,000 | |
Trust Preferred securities | | | 1,000,000 | | | — | | | — | | | 1,000,000 | |
Other equity securities | | | 1,469,840 | | | 122,967 | | | (83,318 | ) | | 1,509,489 | |
| |
|
| |
|
| |
|
| |
|
| |
Total available-for-sale | | $ | 65,587,201 | | $ | 258,454 | | $ | (519,610 | ) | $ | 65,326,045 | |
| |
|
| |
|
| |
|
| |
|
| |
| | December 31, 2006 | |
| |
| |
| | Book
Value | | Unrealized
Gains | | Unrealized
Losses | | Fair
Value | |
| |
|
| |
|
| |
|
| |
|
| |
Mortgage-backed and related securities Available-for-Sale | | | | | | | | | | | | | |
Fannie Mae | | $ | 38,499,593 | | $ | 5,580 | | $ | (896,713 | ) | $ | 37,608,460 | |
Freddie Mac | | | 14,333,081 | | | 966 | | | (421,660 | ) | | 13,912,387 | |
Ginnie Mae | | | 986,116 | | | 1,130 | | | (4,661 | ) | | 982,585 | |
CMO | | | 8,224,236 | | | — | | | (36,317 | ) | | 8,187,919 | |
| |
|
| |
|
| |
|
| |
|
| |
Total mortgage-backed and related securities | | $ | 62,043,026 | | $ | 7,676 | | $ | (1,359,351 | ) | $ | 60,691,351 | |
| |
|
| |
|
| |
|
| |
|
| |
| | December 31, 2005 | |
| |
| |
| | Book
Value | | Unrealized
Gains | | Unrealized
Losses | | Fair
Value | |
| |
|
| |
|
| |
|
| |
|
| |
Investment securities Available for Sale | | | | | | | | | | | | | |
U.S. government agencies | | $ | 38,307,463 | | $ | — | | $ | (657,823 | ) | $ | 37,649,640 | |
Municipals | | | 12,900,010 | | | 151,716 | | | (102,316 | ) | | 12,949,410 | |
Corporate bonds | | | 1,500,000 | | | — | | | (28,500 | ) | | 1,471,500 | |
Other equity securities | | | 1,224,349 | | | 133,805 | | | — | | | 1,358,154 | |
| |
|
| |
|
| |
|
| |
|
| |
Total available-for-sale | | $ | 53,931,822 | | $ | 285,521 | | $ | (788,639 | ) | $ | 53,428,704 | |
| |
|
| |
|
| |
|
| |
|
| |
52
| | December 31, 2005 | |
| |
| |
| | Book
Value | | Unrealized
Gains | | Unrealized
Losses | | Fair
Value | |
| |
|
| |
|
| |
|
| |
|
| |
Mortgage-backed and related securities Available-for-Sale | | | | | | | | | | | | | |
Fannie Mae | | $ | 47,979,201 | | $ | — | | $ | (1,238,688 | ) | $ | 46,740,513 | |
Freddie Mac | | | 21,246,072 | | | 3,326 | | | (784,665 | ) | | 20,464,733 | |
Ginnie Mae | | | 1,512,239 | | | — | | | (13,432 | ) | | 1,498,807 | |
CMO | | | 1,569,785 | | | — | | | (37,396 | ) | | 1,532,389 | |
| |
|
| |
|
| |
|
| |
|
| |
Total mortgage-backed and related securities | | $ | 72,307,297 | | $ | 3,326 | | $ | (2,074,181 | ) | $ | 70,236,442 | |
| |
|
| |
|
| |
|
| |
|
| |
The book value and estimated fair value of debt securities at December 31, 2006, by contractual maturity, are shown below. Expected maturities will differ from contractual maturities because borrowers may have the right to call or prepay obligations with or without call or prepayment penalties.
| | December 31, 2006 | |
| |
| |
| | Book
Value | | Fair
Value | |
| |
|
| |
|
| |
Available-for-Sale | | | | | | | |
Due in one year or less | | $ | 16,821,187 | | $ | 16,622,167 | |
Due after one year through five years | | | 20,433,331 | | | 20,327,462 | |
Due after five years through ten years | | | 10,016,074 | | | 9,998,704 | |
Due after ten years | | | 16,846,769 | | | 16,868,223 | |
Equities | | | 1,469,840 | | | 1,509,489 | |
| |
|
| |
|
| |
| | $ | 65,587,201 | | $ | 65,326,045 | |
| |
|
| |
|
| |
Mortgage-backed and related securities | | $ | 62,043,026 | | $ | 60,691,351 | |
| |
|
| |
|
| |
Gross realized gains on the sale of securities available for sale were $92,964, $48,589, and $453,725 for the years ended December 31, 2006, December 31, 2005, and December 31, 2004, respectively. Gross realized losses on the sale of securities available for sale were $134,314, $31,901, and $0 for the years ended December 31, 2006, December 31, 2005, and December 31, 2004, respectively. After-tax net gains on the sale of securities were ($28,531), $10,680, and $290,384 for the years ended December 31, 2006, December 31, 2005, and December 31, 2004, respectively.
Investment securities having a carrying amount of approximately $33,899,807 have been pledged as collateral to secure public deposits at December 31, 2006. Investment securities having a carrying amount of $8,000,000 have been pledged as collateral for retail repurchase agreements at December 31, 2006. Investment securities having a carrying value of $10,264,953 have been pledged as collateral for wholesale repurchase agreements at December 31, 2006. Investment securities having a carrying value of $200,000 have been pledged as collateral for Federal Reserve Bank Treasury Tax and Loan deposits at December 31, 2006.
53
Interest earned from municipal securities, which is exempt from income taxes, for the past three years were $516,358, $441,102, and $405,335 for the years ending December 31, 2006, December 31, 2005, and December 31, 2004, respectively.
The unrealized losses and fair value of the investments by investment type segregated between those that have been in a continuous unrealized loss position for less than twelve months and more than twelve months at December 31, 2006 and December 31, 2005 are as follows:
| | December 31, 2006 | |
| |
| |
| | Less than 12 months | | 12 months or more | | Total | |
| |
| |
| |
| |
Description of Securities | | Fair
Value | | Unrealized
Loss | | Fair
Value | | Unrealized
Loss | | Fair
Value | | Unrealized
Loss | |
| |
|
| |
|
| |
|
| |
|
| |
|
| |
|
| |
US government agencies | | $ | 4,493,967 | | $ | (7,511 | ) | $ | 22,504,477 | | $ | (313,400 | ) | $ | 26.998,444 | | $ | (320,911 | ) |
Municipals | | | 1,785,668 | | | (7,403 | ) | | 4,951,650 | | | (80,978 | ) | | 6,737,318 | | | (88,381 | ) |
Federal agency mortgage backed securities | | | 7,499,952 | | | (13,544 | ) | | 44,926,820 | | | (1,345,807 | ) | | 52,426,772 | | | (1,359,351 | ) |
Corporate bonds | | | — | | | — | | | 1,473,000 | | | (27,000 | ) | | 1,473,000 | | | (27,000 | ) |
| |
|
| |
|
| |
|
| |
|
| |
|
| |
|
| |
Subtotal, debt securities | | | 13,779,587 | | | (28,458 | ) | | 73,855,947 | | | (1,767,185 | ) | | 87,635,534 | | | (1,795,643 | ) |
Other equity securities | | | 222,168 | | | (83,318 | ) | | — | | | — | | | 222,168 | | | (83,318 | ) |
| |
|
| |
|
| |
|
| |
|
| |
|
| |
|
| |
Total temporarily impaired securities | | $ | 14,001,755 | | $ | (111,776 | ) | $ | 73,855,947 | | $ | (1,767,185 | ) | $ | 87,857,702 | | $ | (1,878,961 | ) |
| |
|
| |
|
| |
|
| |
|
| |
|
| |
|
| |
| | December 31, 2005 | |
| |
| |
| | Less than 12 months | | 12 months or more | | Total | |
| |
| |
| |
| |
Description of Securities | | Fair
Value | | Unrealized
Loss | | Fair
Value | | Unrealized
Loss | | Fair
Value | | Unrealized
Loss | |
| |
|
| |
|
| |
|
| |
|
| |
|
| |
|
| |
US government agencies | | $ | 7,332,954 | | $ | (162,634 | ) | $ | 22,813,660 | | $ | (495,189 | ) | $ | 30,146,614 | | $ | (657,823 | ) |
Municipals | | | 4,749,820 | | | (93,376 | ) | | 1,263,015 | | | (8,940 | ) | | 6,012,835 | | | (102,316 | ) |
Federal agency mortgage backed securities | | | 26,801,760 | | | (501,032 | ) | | 40,226,036 | | | (1,573,149 | ) | | 67,027,796 | | | (2,074,181 | ) |
Corporate bonds | | | — | | | — | | | 1,471,500 | | | (28,500 | ) | | 1,471,500 | | | (28,500 | ) |
| |
|
| |
|
| |
|
| |
|
| |
|
| |
|
| |
Subtotal, debt securities | | | 38,884,534 | | | (757,042 | ) | | 65,774,211 | | | (2,105,778 | ) | | 104,658,745 | | | (2,862,820 | ) |
| |
|
| |
|
| |
|
| |
|
| |
|
| |
|
| |
Total temporarily impaired securities | | $ | 38,884,534 | | $ | (757,042 | ) | $ | 65,774,211 | | $ | (2,105,778 | ) | $ | 104,658,745 | | $ | (2,862,820 | ) |
| |
|
| |
|
| |
|
| |
|
| |
|
| |
|
| |
Management considers all of the unrealized losses that have been outstanding for 12 or more months to be temporary impairments since these impairments are primarily due to changes in interest rates. Management has the ability and intent to hold these securities until they are no longer considered to be impaired, which may be maturity.
54
Note 4 - Loans and Allowance for Loan Losses
The following is a summary of loans outstanding by category at December 31:
| | 2006 | | 2005 | |
| |
|
| |
|
| |
Real estate: | | | | | | | |
One-to-four family residential | | $ | 83,264,793 | | $ | 98,635,067 | |
Multi-family residential | | | 21,725,953 | | | 24,594,348 | |
Construction | | | 76,505,202 | | | 62,687,466 | |
Nonresidential | | | 231,264,961 | | | 185,319,132 | |
Commercial | | | 32,201,870 | | | 30,127,560 | |
Consumer | | | 70,209,136 | | | 72,236,879 | |
| |
|
| |
|
| |
Gross loans | | | 515,171,915 | | | 473,600,452 | |
Less: | | | | | | | |
Deferred loan fees, net and other items | | | (229,823 | ) | | 264,898 | |
Allowance for loan losses | | | 5,763,923 | | | 5,103,528 | |
| |
|
| |
|
| |
Net loans | | $ | 509,637,815 | | $ | 468,232,026 | |
| |
|
| |
|
| |
The Company evaluates impairment of its residential mortgage and consumer loans on a collective basis. Commercial loans individually evaluated and considered impaired under SFAS No. 114 at December 31, 2006 and 2005 were immaterial.
Changes in the allowance for loan losses for the years ended December 31, 2006, December 31, 2005 and December 31, 2004 were as follows:
| | Year Ended
December 2006 | | Year Ended
December 2005 | | Year Ended
December 2004 | |
| |
|
| |
|
| |
|
| |
Balance at beginning of year | | $ | 5,103,528 | | $ | 3,029,108 | | $ | 2,968,510 | |
Provision for loan losses | | | 1,165,000 | | | 985,000 | | | 330,000 | |
Loans charged off | | | (523,022 | ) | | (421,603 | ) | | (277,818 | ) |
Recoveries on loans previously charged off | | | 18,417 | | | 21,176 | | | 8,416 | |
Allowances acquired in acquisition | | | — | | | 1,489,847 | | | — | |
| |
|
| |
|
| |
|
| |
Balance at end of year | | $ | 5,763,923 | | $ | 5,103,528 | | $ | 3,029,108 | |
| |
|
| |
|
| |
|
| |
Directors, executive officers, and associates of such persons are customers of and had transactions with the Bank in the ordinary course of business. Included in such transactions are outstanding loans and commitments, all of which were made under normal credit terms and did not involve more than normal risk of collection. The aggregate amounts of these loans were $6,142,874 and $12,794,210 at December 31, 2006 and 2005, respectively. During the year ended December 31, 2006, new loans of $1,994,343 were made and payments totaled $7,367,382. During the year ended December 31, 2005, new loans of $4,100,501 were made and payments totaled $2,793,424.
The Bank held no loans for sale at December 31, 2006 and 2005.
55
Note 5 - Premises and Equipment
Premises and equipment at December 31 are summarized as follows:
| | 2006 | | 2005 | |
| |
|
| |
|
| |
Land | | $ | 4,716,895 | | $ | 5,057,767 | |
Buildings | | | 13,709,581 | | | 13,724,317 | |
Leasehold Improvements | | | 268,728 | | | 234,807 | |
Land Improvements | | | 292,518 | | | 286,756 | |
Furniture and equipment | | | 4,505,787 | | | 4,795,834 | |
| |
|
| |
|
| |
| | | 23,493,509 | | | 24,099,481 | |
Less: accumulated depreciation | | | 5,206,542 | | | 4,280,503 | |
| |
|
| |
|
| |
| | $ | 18,286,967 | | $ | 19,818,978 | |
| |
|
| |
|
| |
Note 6 – Bank Owned Life Insurance
The Company owns bank-owned life insurance to fund certain employee benefit plans. No purchases of bank-owned life insurance were made during the years ended December 31, 2006, and December 31, 2005. However, Trinity Bank did own $1,378,877 of bank-owned life insurance at the time they were acquired by the Company. The bank-owned life insurance policies are recorded in other assets at their cash surrender values of $15,526,615 and $14,827,784 at December 31, 2006 and 2005, respectively.
Note 7 - Intangible Assets
Amortized intangible assets at December 31, 2006 and 2005 are summarized as follows:
| | December 31, 2006 | | December 31, 2005 | |
| |
|
| |
|
| |
Core deposit intangible | | $ | 4,767,000 | | $ | 4,767,000 | |
Mortgage servicing rights (“MSRs���) | | | — | | | 673,896 | |
| |
|
| |
|
| |
| | | 4,767,000 | | | 5,440,896 | |
Less: accumulated amortization | | | 2,742,001 | | | 2,641,906 | |
| |
|
| |
|
| |
| | $ | 2,024,999 | | $ | 2,798,990 | |
| |
|
| |
|
| |
The acquisition of Trinity resulted in an increase of $2,320,000 in the unamortized core deposit intangible in 2005 to $4,767,000. This core deposit intangible is being amortized over an eight-year period on an accelerated basis. The amortization of this core deposit intangible is expected to be $449,000 in 2007, $380,000 in 2008, $314,000 in 2009, $244,000 in 2010 and $176,000 in 2011.
The Company sold its portfolio of loans serviced for others in 2006 for approximately the book value of the unamortized MSR at the time of the sale, resulting in no outstanding MSRs as of December 31, 2006. The fair value of MSRs at December 31, 2005, approximated its carrying value. The total amount of loans serviced for others at December 31, 2005, was $9,855,390.
Amortization expense for all intangible assets subject to amortization was $734,000 during the year ended December 31, 2006, $408,907 during the year ended December 31, 2005, and $424,808 during the year ended December 31, 2003. Estimated amortization expense for the next five succeeding years ending December 31 are as follows:
2007 | | $ | 629,000 | |
2008 | | $ | 512,000 | |
2009 | | $ | 314,000 | |
2010 | | $ | 244,000 | |
2011 | | $ | 176,000 | |
56
The balance of goodwill was $29,641,234 at December 31, 2006, and $29,625,128 at December 31, 2005. The acquisition of Trinity resulted in an increase of $22,954,606 of goodwill in 2005.
Note 8 - Deposits
Deposit balances and interest expense and average rates paid for the years ended December 31, 2006, December 31, 2005, and December 31, 2004 are summarized as follows:
| | December 31, 2006 | | December 31, 2005 | |
| |
| |
| |
| | Actual
Balance | | Interest
Expense | | Average
Rate | | Actual
Balance | | Interest
Expense | | Average
Rate | |
| |
|
| |
|
| |
|
| |
|
| |
|
| |
|
| |
Noninterest bearing | | $ | 37,762,084 | | $ | — | | | — | | $ | 35,225,404 | | $ | — | | | — | |
Interest bearing checking | | | 52,778,385 | | | 662,072 | | | 1.29 | % | | 50,262,906 | | | 210,499 | | | 0.57 | % |
Money market deposit | | | 117,632,286 | | | 4,186,931 | | | 3.82 | % | | 104,420,774 | | | 1,791,093 | | | 2.29 | % |
Savings | | | 16,026,580 | | | 149,807 | | | 0.77 | % | | 23,654,258 | | | 158,721 | | | 0.61 | % |
Certificates of deposit | | | 338,602,436 | | | 13,104,204 | | | 4.09 | % | | 303,980,459 | | | 6,816,566 | | | 2.95 | % |
| |
|
| |
|
| |
|
| |
|
| |
|
| |
|
| |
| | $ | 562,801,771 | | $ | 18,103,014 | | | 3.37 | % | $ | 517,543,801 | | $ | 8,976,879 | | | 2.41 | % |
| |
|
| |
|
| |
|
| |
|
| |
|
| |
|
| |
| | December 31, 2004 | |
| |
| |
| | Actual
Balance | | Interest
Expense | | Average
Rate | |
| |
|
| |
|
| |
|
| |
Noninterest bearing | | $ | 19,734,227 | | $ | — | | | — | |
Interest bearing checking | | | 32,949,447 | | | 103,320 | | | 0.31 | % |
Money market deposit | | | 77,924,198 | | | 841,817 | | | 1.42 | % |
Savings | | | 29,174,129 | | | 164,70 | | | 0.50 | % |
Certificates of deposit | | | 214,962,427 | | | 5,017,535 | | | 2.27 | % |
| |
|
| |
|
| |
|
| |
| | $ | 374,744,428 | | $ | 6,127,372 | | | 1.77 | % |
| |
|
| |
|
| |
|
| |
Contractual maturities of certificates of deposit as of December 31, 2006 and 2005 are as follows:
| | 2006 | | 2005 | |
| |
|
| |
|
| |
Under 1 year | | $ | 298,589,731 | | $ | 224,227,624 | |
1 to 2 years | | | 20,364,963 | | | 51,180,555 | |
2 to 3 years | | | 12,458,820 | | | 9,530,957 | |
3 to 4 years | | | 6,709,883 | | | 12,225,554 | |
4 years or greater | | | 479,039 | | | 6,815,769 | |
| |
|
| |
|
| |
| | $ | 338,602,436 | | $ | 303,980,459 | |
| |
|
| |
|
| |
Certificates of deposit in excess of $100,000 totaled $123,835,024 and $104,784,197 at December 31, 2006 and 2005, respectively, and may not be fully insured by the FDIC. Interest paid on deposits and other borrowings was $21,277,860, for the year ended December 31, 2006, $10,576,971 for the year ended December 31, 2005, and $7,566,978 for the year ended December 31, 2004.
Directors, executive officers, and associates of such persons are customers of and had transactions with the Bank in the ordinary course of business. Included in such transactions are deposit accounts, all of which were made under normal terms. The aggregate amount of these deposit accounts was $4,636,009 and $3,448,155 at December 31, 2006 and 2005, respectively.
57
The deposits of the Bank are insured by the Deposit Insurance Fund (DIF), one of two funds administered by the FDIC. The Bank’s annual DIF premium rates were $0.014, $0.014, and $0.015 per $100 of deposits for the years ended December 31, 2006, December 31, 2005 and December 31, 2004, respectively.
Note 9 – Borrowed Money
The Company had $48.5 million in advances from the FHLB of Atlanta that were obtained pursuant to a line of credit. These advances are collateralized by a lien on qualifying first mortgage loans in an amount necessary to satisfy outstanding indebtedness plus accrued interest. The total amount available on the line of credit is 25% of total assets of the Bank, or approximately $185 million. The unused portion of the line of credit available to the Company at December 31, 2006 was approximately $137 million. These advances had interest rates ranging from 1.24% to 6.25% at December 31, 2006 and 2.02% to 6.25% at December 31, 2005. In addition, the Company had a mark-to-market adjustment on advances acquired in the Trinity acquisition which had a debit balance of $102,000 at December 31, 2006, which is considered to be due in less than one year. Interest rates on certain FHLB convertible advances may be reset on certain dates at the option of the FHLB in accordance with the terms of the note. The Bank has the option of repaying the outstanding advance or converting the interest rate from a fixed rate to a floating rate at the time the advance is called by the FHLB. These convertible advances totaled $12.0 million at December 31, 2006 and $11.5 million at December 31, 2005.
The Company also had $11.0 million in repurchase agreements from JP Morgan Chase Bank, NA (“JP Morgan”). These borrowings are collateralized by various US Government agency investment and mortgage-backed securities in an amount equal to at least 105% of the outstanding amount of the repurchase agreement. These repurchase agreements had interest rates ranging from 3.66% to 4.875% at December 31, 2006. Two of these repurchase agreements have a two-year one-time call option with a ten-year maturity date. One of these advances, totaling $5.0 million, has an adjustable interest rate tied to the three month LIBOR minus 50 basis points for a period of two years. After the two-year period, the repurchase agreement may be called at the option of JP Morgan or the repurchase agreement may be converted to a fixed rate at 3.98% for the remaining eight years. The other convertible repurchase agreement, which totals $3.0 million, has a fixed interest rate of 3.66%. After the two-year period, the repurchase agreement may be called by JP Morgan, or it may remain outstanding for the remaining eight-year period at the original interest rate of 3.66%. The remaining repurchase agreement has a balance of $3.0 million and has a fixed rate of 4.48% for five years.
Maturities of borrowed money at December 31 are as follows:
| | 2006 | | 2005 | |
| |
|
| |
|
| |
Borrowed money due: | | | | | | | |
Less than 1 year | | $ | 17,985,000 | | $ | 22,808,000 | |
1 to 2 years | | | 13,000,000 | | | 6,000,000 | |
2 to 3 years | | | 3,000,000 | | | 13,000,000 | |
3 to 4 years | | | 8,000,000 | | | 8,000,000 | |
4 to 5 years | | | 1,500,000 | | | 8,000,000 | |
5 to 10 years | | | 18,000,000 | | | 14,500,000 | |
After 10 years | | | 2,000,000 | | | — | |
| |
|
| |
|
| |
| | $ | 63,485,000 | | $ | 72,308,000 | |
| |
|
| |
|
| |
Note 10 – Subordinated Debt
In order to provide financing for the cash portion of the Trinity acquisition, on October 28, 2005, the Company completed a private placement of an aggregate amount of $15,000,000 in trust preferred securities, liquidation amount $1,000 per security (the “Preferred Securities”), through a newly formed Delaware statutory trust subsidiary, CSBC Statutory Trust I (the “Trust”).
58
In connection with the issuance of the Preferred Securities, on October 28, 2005, the Company entered into an Indenture (the “Indenture”) by and between the Company and Wilmington Trust Company, as trustee, and an Amended and Restated Declaration of Trust (the “Trust Agreement”) among the Company, as Sponsor, Wilmington Trust Company, as Delaware and Institutional Trustee, and the administrative trustees of the Trust.
On October 28, 2005, CSBC Statutory Trust I issued an aggregate of $15,000,000 in trust preferred securities, liquidation amount $1,000 per security. The Preferred Securities mature on December 15, 2035, but may be redeemed beginning December 15, 2010 if the Company exercises its right to redeem the Debentures, as described below. The Preferred Securities require quarterly distributions by the Trust to the holders of the Preferred Securities, initially at a fixed rate of 6.095% per annum through the interest payment date in December 2010, and thereafter at a variable rate of three-month LIBOR plus 1.57% per annum, reset quarterly. Distributions are cumulative and will accrue from the date of original issuance but may be deferred for a period of up to twenty consecutive quarterly interest payment periods if the Company exercises its right under the Indenture to defer the payment of interest on the Debentures, as described below. In accordance with FIN No. 46(R), “Consolidation of Variable Interest Entities”, the trust is not consolidated with the financial statements of the Company.
The proceeds from the sale of the Preferred Securities received by the Trust, combined with the proceeds of $464,000 received by the Trust from the issuance of common securities (the “Common Securities”) by the Trust to the Company, were used to purchase $15,464,000 in principal amount of unsecured junior subordinated deferrable interest debentures (the “Debentures”) of the Company, issued pursuant to the Indenture.
The issuance of the Preferred Securities and the Common Securities are provided for in the Trust Agreement dated October 28, 2005, by and among the Trustee, the Company, and the administrative trustees of the Trust. The administrative trustees are the President and Chief Executive Officer, Executive Vice President and Secretary, and Executive Vice President and Chief Financial Officer.
The Debentures mature on December 15, 2035, but the Company may at its option redeem the Debentures, in whole or in part, beginning on December 15, 2010 in accordance with the provisions of the Indenture. The Debentures bear interest at a fixed rate equal to 6.095% per annum through the interest payment date in December 2010, and thereafter at a variable rate, reset quarterly, of three-month LIBOR plus 1.57% per annum. Interest is cumulative and will accrue from the date of original issuance. However, so long as there is no event of default, interest payments may be deferred by the Company at its option at any time for a period of up to twenty consecutive quarterly interest payment periods, but not beyond December 15, 2035 (each such extended interest payment period, an “Extension Period”). No interest shall be due and payable during an Extension Period, but each installment of interest that would otherwise have been due and payable during such Extension Period shall bear additional interest at an annual rate equal to the interest rate in effect for each Extension Period. Furthermore, during any Extension Period, the Company may not declare or pay any dividends on its capital stock, which includes its Common Stock, nor make any payment or redeem debt securities that rank pari passu with the Debentures.
Early Redemption. The Debentures may be redeemed at par at the option of the Company beginning on December 15, 2010, and may be redeemed earlier than such date following the occurrence of a “Special Event” (as defined in the Indenture) at a price equal to 107.5% of the principal amount together with accrued interest. The Trust will be required to redeem a like amount of Preferred Securities if the Company exercises its right to redeem all or a portion of the Debentures.
Acceleration of Maturity. Either the Trustee or the holders of at least 25% of the aggregate principal amount of the outstanding Debentures may declare the principal amount of, and all accrued interest on, all the Debentures to be due and payable immediately, or if the holders of the Debentures fail to make such declaration, the holders of at least a majority in aggregate liquidation amount of the Preferred Securities outstanding shall have a right to make such declaration, if an Event of Default occurs. An Event of Default generally includes a default in payment of any interest for 30 days, a default in payment upon maturity, a default in performance, or breach of any covenant or representation, bankruptcy or insolvency of the Company or liquidation or dissolution of the Trust. Any holder of the Preferred Securities has the right, upon the occurrence of an Event of Default related to payment of interest of principal, to institute suit directly against the Company for enforcement of payment to such holder of principal of and any premium and interest, including additional interest, on the Debentures having a principal amount equal to the aggregate liquidation amount of the Preferred Securities held by such holder.
59
Note 11 - Income Taxes
The provision for income taxes is summarized below:
| | Year Ended
December
2006 | | Year Ended
December
2005 | |
Year Ended December
2004
| |
| |
|
| |
|
| |
|
| |
Currently payable | | | | | | | | | | |
Federal | | $ | 2,594,290 | | $ | 864,250 | | $ | 971,417 | |
State | | | 431,185 | | | 234,350 | | | 146,284 | |
| |
|
| |
|
| |
|
| |
| | | 3,025,475 | | | 1,098,600 | | | 1,117,701 | |
| | Year Ended
December
2006 | | Year Ended
December
2005 | | Year Ended
December
2004 | |
| |
|
| |
|
| |
|
| |
Deferred | | | | | | | | | | |
Federal | | | (347,236 | ) | | 257,008 | | | (35,339 | ) |
State | | | (61,119 | ) | | (32,796 | ) | | (5,322 | ) |
| |
|
| |
|
| |
|
| |
| | | (408,355 | ) | | 224,212 | | | (40,661 | ) |
| |
|
| |
|
| |
|
| |
Total income taxes | | $ | 2,617,120 | | $ | 1,322,812 | | $ |
1,077,040
| |
| |
|
| |
|
| |
|
| |
The reasons for the difference between consolidated income tax expense and the amount computed by applying the statutory federal income tax rate of 34% to income before income taxes were as follows:
| | Year Ended
December
2006 | | Year Ended
December
2005 | | Year Ended
December
2004 | |
| |
|
| |
|
| |
|
| |
Federal income taxes at statutory rate | | $ | 2,744,479 | | $ | 1,562,477 | | $ | 1,371,000 | |
State income taxes, net of federal benefit | | | 244,244 | | | 133,026 | | | 86,000 | |
Effect of federal tax exempt interest | | | (151,624 | ) | | (135,946 | ) | | (137,000 | ) |
Effect of earnings on life insurance | | | (237,603 | ) | | (202,601 | ) | | (161,000 | ) |
Other | | | 17,624 | | | (34,144 | ) | | (81,960 | ) |
| |
|
| |
|
| |
|
| |
| | $ | 2,617,120 | | $ | 1,322,812 | | $ | 1,077,040 | |
| |
|
| |
|
| |
|
| |
Effective tax rate | | | 32.4 | % | | 28.8 | % | | 26.7 | % |
| |
|
| |
|
| |
|
| |
Income taxes paid for the years ended December 31, 2006, 2005, and 2004 were $3,142,078, $2,773,660, and $1,978,000, respectively.
60
The tax effects of temporary differences that give rise to significant portions of deferred tax assets and liabilities at December 31 are as follows:
| | 2006 | | 2005 | |
| |
|
| |
|
| |
Deferred tax assets | | | | | | | |
Deferred compensation | | $ | 871,763 | | $ | 762,481 | |
Unrealized loss on securities | | | | | | | |
Available-for-sale | | | 640,346 | | | 1,006,938 | |
Allowance for loan losses | | | 2,211,211 | | | 1,955,469 | |
Capital loss carryforward | | | 338,196 | | | 374,099 | |
Other | | | 110,810 | | | 295,269 | |
| |
|
| |
|
| |
Gross deferred tax assets | | | 4,172,326 | | | 4,394,256 | |
Deferred tax liabilities | | | | | | | |
Excess carrying value of assets acquired for financial reporting purposes over tax basis | | | 1,307,587 | | | 1,592,882 | |
Deferred loan fees | | | 144,095 | | | 92,928 | |
Other | | | 98,283 | | | 127,848 | |
| |
|
| |
|
| |
Gross deferred tax liabilities | | | 1,549,965 | | | 1,813,658 | |
| |
|
| |
|
| |
Net deferred tax asset | | $ | 2,622,361 | | $ | 2,580,598 | |
| |
|
| |
|
| |
The Company, in accordance with SFAS No. 109, did not record a deferred tax liability of approximately $3.1 million as of December 31, 2006 related to the cumulative special bad debt deduction for savings and loan associations recognized for income tax reporting prior to September 30, 1988, Citizen South Bank’s base year.
Management believes that the Company will fully realize deferred tax assets based on future taxable temporary differences, refundable income taxes from carryback years, and current levels of operating income.
61
Note 12 - Commitments
Commitments to extend credit are agreements to lend as long as there is no violation of any condition established in the contract. Commitments generally have fixed expiration dates or other termination clauses and may require payment of a fee. Since commitments may expire without being drawn upon, the total commitment amounts do not necessarily represent future cash requirements. These commitments represent no more than normal lending risk that the Bank commits to its borrowers and management believes that these commitments can be funded through normal operations. Commitments to extend credit that include both fixed and variable rates as of December 31 are as follows:
| | 2006 | | 2005 | |
| |
|
| |
|
| |
Residential mortgage loan commitments | | $ | 6,193,000 | | $ | 9,357,000 | |
Non-residential mortgage loan commitments | | | 34,842,000 | | | 13,591,000 | |
Commercial loan commitments | | | 1,535,000 | | | 1,698,000 | |
Consumer loan commitments | | | 3,857,000 | | | 1,624,000 | |
Unused lines of credit | | | | | | | |
Commercial | | | 43,424,000 | | | 28,533,000 | |
Consumer | | | 61,912,000 | | | 54,152,000 | |
The Company also has various leases in place to provide office space for two full-service offices and two loan production offices. The amount paid for this leased office space totaled $337,897 for the year ended December 31, 2006, $122,876 for the year ended December 31, 2005, and $48,300 for the year ended December 31, 2004. Projected lease payments over the next five years are expected to be $345,000 for 2007, $255,000 for 2008, $235,000 for 2009, $65,000 for 2010 and $0 for 2011.
Note 13 - Regulatory Capital Requirements
The Bank is subject to various regulatory capital requirements administered by the federal banking agencies. Under the capital adequacy guidelines and the regulatory framework for prompt corrective action, the Bank must meet specific capital guidelines that involve quantitative measures of assets, liabilities, and certain commitments as calculated under regulatory accounting practices. The capital amounts and classification are also subject to qualitative judgments by the regulators about components, risk weightings and other factors. Failure to meet minimum capital requirements can initiate certain mandatory, and possibly discretionary, actions by regulators that, if undertaken, could have a direct material effect on the Bank’s financial statements.
62
The Bank is required to maintain: tangible capital of at least 1.5% of adjusted total assets; core capital of at least 4.0% of adjusted total assets; and total capital of at least 8.0% of risk weighted assets. At December 31, 2006, the Bank’s tangible capital and core capital were $64,676,000, or 9.11% of tangible assets, and total capital was $70,440,000, or 12.08% of risk-weighted assets. The Company’s primary regulator, the Office of Thrift Supervision, informed the Bank that it was in the well-capitalized category as of the most recent regulatory examination, and management is not aware of any events that have occurred since that would have changed its classification.
| | Actual | | For Capital
Adequacy Purposes | | To Be Well
Capitalized Under
Prompt Corrective
Action Provisions | |
| |
| |
| |
| |
| | Amount | | Ratio | | Amount | | Ratio | | Amount | | Ratio | |
| |
| |
| |
| |
| |
| |
| |
| | (dollars in thousands) | | (dollars in thousands) | | (dollars in thousands) | |
As of December 31, 2006 | | | | | | | | | | | | | | | | | | | |
Total Risk-Based Capital
(to Risk-Weighted Assets) | | $ | 70,440 | | | 11.81 | % | $ | 47,733 | | | 8.00 | % | $ | 59,666 | | | 10.00 | % |
Tier 1 Capital
(to Risk-Weighted Assets) | | | 64,676 | | | 10.81 | % | | 23,866 | | | 4.00 | % | | 35,799 | | | 6.00 | % |
Tier 1 Capital
(to Adjusted Total Assets) | | | 64,676 | | | 9.11 | % | | 28,384 | | | 4.00 | % | | 35,481 | | | 5.00 | % |
Tangible Capital
(to Adjusted Total Assets) | | | 64,676 | | | 9.11 | % | | 10,644 | | | 1.50 | % | | 21,288 | | | 3.00 | % |
As of December 31, 2005 | | | | | | | | | | | | | | | | | | | |
Total Risk-Based Capital
(to Risk-Weighted Assets) | | $ | 68,365 | | | 12.08 | % | $ | 45,288 | | | 8.00 | % | $ | 56,609 | | | 10.00 | % |
Tier 1 Capital
(to Risk-Weighted Assets) | | | 63,262 | | | 11.18 | % | | 22,643 | | | 4.00 | % | | 33,965 | | | 6.00 | % |
Tier 1 Capital
(to Adjusted Total Assets) | | | 63,262 | | | 9.47 | % | | 26,715 | | | 4.00 | % | | 33,394 | | | 5.00 | % |
Tangible Capital
(to Adjusted Total Assets) | | | 63,262 | | | 9.47 | % | | 10,018 | | | 1.50 | % | | 20,036 | | | 3.00 | % |
On May 23, 2002, the MHC approved a Plan of Conversion and Reorganization. As a result of the Conversion, the Bank established a memo liquidation account in an amount equal to its equity at the time of the Conversion of approximately $44 million for the benefit of eligible account holders and supplemental eligible account holders who continue to maintain their accounts at the Bank after the Conversion. In the event of a complete liquidation of the Bank, each eligible account holder and supplemental eligible account holder will be entitled to receive a distribution from the liquidation account in an amount proportionate to the current adjusted qualifying balances for accounts then held. As a result, retained earnings are substantially restricted at December 31, 2006 and 2005.
Note 14 - Employee Benefit Plans
The Bank provides supplemental benefits to substantially all employees through a 401(k) savings plan. Eligible participants may contribute up to 75% of eligible compensation, with the Bank providing matching contributions of 50% of employee contributions up to 6% of eligible compensation. The plan also provides for discretionary employer contributions. During 2006, 2005 and 2004, no discretionary employer contributions were made to the 401(k) plan. Total expense relating to this plan was $165,524 for the year ended December 31, 2006, $131,023 for the year ended December 31, 2005, and $104,591 for the year ended December 31, 2004.
63
The Bank maintains nonqualified deferred compensation and/or supplemental retirement plans for certain of its directors and executive officers. Total expense for the all of these plans was $423,290 for the year ended December 31, 2006, $374,505 for the year ended December 31, 2005, and $327,839 for the year ended December 31, 2004.
The Bank also adopted nonqualified deferred compensation plans for key employees and directors of Citizens Bank, a wholly-owned subsidiary of Innes Street Financial Corporation, which was acquired by the Company on December 31, 2001. The deferred assets related to these plans are maintained in rabbi trusts, which are included in Other Assets of the Company. The assets are accounted for at market value in accordance with SFAS No. 115, Accounting for Certain Investments in Debt and Equity Securities, with the resulting gains or losses in value recorded in income. The corresponding change in fair value of the deferred compensation obligation is recorded as compensation expense. Total expense for this plan was $206,987 for the year ended December 31, 2006, $83,251 for the year ended December 31, 2005, and $177,983 for the year ended December 31, 2004.
2003 Recognition and Retention Plan (“2003 RRP”) – Pursuant to resolutions of the Board of Directors of Citizens South Banking Corporation adopted on August 18, 2003, and the subsequent approval by the stockholders of the Company on October 23, 2003, the Company adopted and implemented the Citizens South Banking Corporation 2003 Recognition and Retention Plan with a total of 210,398 shares. On November 3, 2003, awards of 196,560 shares of restricted stock were made under the 2003 RRP. All shares vest over a seven-year period commencing on the date of the award, at the rate of 30% on November 3, 2003, 10% on January 2, 2004, 10% on November 3, 2005, and 10% per year on November 3 of each year thereafter. The fair market value of the restricted stock at the time of the grant was $15.04 per share. During 2006, 18,405 shares vested, no additional shares were granted, and no shares were forfeited. At December 31, 2006, 15,038 restricted shares remained unissued and available for grants under the 2003 RRP. Total expense for the 2003 RRP amounted to $284,467 in 2006, $279,816 in 2005, and $281,025 in 2004.
1999 Stock Option Plan - On April 12, 1999, the Company’s shareholders approved the Citizens South Bank 1999 Stock Option Plan that provided the issuance of 211,335 options for directors and officers to purchase the Company’s common stock. Pursuant to the mutual holding company conversion and reorganization completed on September 30, 2002, each share of the $1.00 par value common stock of Citizens South Banking Corporation (the former Federal corporation) was exchanged for 2.1408 shares of $0.01 par value common stock of the Citizens South Banking Corporation (the new Delaware Corporation), which preserved the previous stockholders’ interest in Citizens South Banking Corporation. Thus, the options for 211,335 shares of common stock in the 1999 Stock Option Plan were exchanged for options for 452,425 shares, with the exercise prices of previously granted options adjusted according to the same ratio.
During 2006, there were there were no options granted, 894 reload incentive options were issued at the market price of the stock on the date of grant to an employee, 26,203 shares were exercised, and no shares were forfeited under the 1999 Stock Option Plan. Of the 26,203 shares exercised, 24,227 were exercised for cash and 1,976 option shares were exercised by the exchange of stock and reload provisions of the plan. At December 31, 2006, 1,612 options remained unissued and available for grants under the 1999 Stock Option Plan.
2003 Stock Option Plan – Pursuant to resolutions of the Board of Directors of Citizens South Banking Corporation adopted on August 18, 2003, and the subsequent approval by the stockholders of the Company on October 23, 2003, the Company adopted and implemented the Citizens South Banking Corporation 2003 Stock Option Plan with a total of 525,995 options available for award. On November 3, 2003, the following awards of stock options were made under the 2003 Stock Option Plan: Non-statutory options of 157,020 shares at $15.04 to directors and advisory board members, vesting over a five-year period at 20% per year, commencing on the initial date of the optionee’s board service to the Bank or its predecessor, Gaston Federal Bank (excluding service to the former Citizens Bank, Inc.); incentive options of 360,000 shares at $15.04 to employees, vesting over a five-year period at 20% per year, commencing on the initial date of the optionee’s employment with the Bank or its predecessor, Gaston Federal Bank (excluding service to the former Citizens Bank, Inc.). During 2006, there were 5,000 incentive options granted at the market price of the stock on the date of grant to an employee, vesting over a five-year period at 20% per year, commencing on the date of the grant, no reload options were issued, no options were exercised, and 11,500 options were forfeited. At December 31, 2006, 16,475 options remained unissued and available for grants under the 2003 Stock Option Plan.
64
The following is a summary of stock option activity and related information for the years ended December 31, 2006, 2005 and 2004.
| | Year Ended December 31, 2006 | | Year Ended December 31, 2005 | | Year Ended December 31, 2004 | |
| |
| |
| |
| |
| | Options | | Weighted Avg.
Exercise Price | | Options | | Weighted Avg.
Exercise Price | | Options | | Weighted Avg.
Exercise Price | |
| |
|
| |
|
| |
|
| |
|
| |
|
| |
|
| |
Outstanding- | | | | | | | | | | | | | | | | | | | |
Beginning of period | | | 772,680 | | $ | 12.22 | | | 793,151 | | $ | 12.58 | | | 810,953 | | $ | 12.45 | |
Granted | | | 5,894 | | | 12.70 | | | 19,000 | | | 12.96 | | | 12,734 | | | 12.95 | |
Exercised | | | (26,203 | ) | | 5.61 | | | (24,471 | ) | | 5.75 | | | (16,965 | ) | | 5.61 | |
Forfeited | | | (11,500 | ) | | 14.68 | | | (15,000 | ) | | 15.04 | | | (13,571 | ) | | 14.30 | |
| |
|
| |
|
| |
|
| |
|
| |
|
| |
|
| |
Outstanding-end of period | | | 740,871 | | $ | 12.95 | | | 772,680 | | $ | 12.22 | | | 793,151 | | $ | 12.58 | |
| |
|
| |
|
| |
|
| |
|
| |
|
| |
|
| |
Exercisable-end of period | | | 718,971 | | $ | 12.96 | | | 747,680 | | $ | 12.20 | | | 708,495 | | $ | 12.43 | |
| |
|
| |
|
| |
|
| |
|
| |
|
| |
|
| |
Weighted average fair value of options granted during the period | | | | | $ | 4.35 | | | | | $ | 4.60 | | | | | $ | 3.90 | |
| | | | |
|
| | | | |
|
| | | | |
|
| |
Exercise prices for options outstanding as of December 31, 2006 ranged from $5.14 to $15.06. Exercise prices for options outstanding as of December 31, 2005 ranged from $5.14 to $15.06. The weighted average remaining contractual life of those options was approximately five years at December 31, 2006, and six years at December 31, 2005.
Employee Stock Ownership Plan - The Bank established an Employee Stock Ownership Plan (ESOP) in 1998. The ESOP is a tax-qualified retirement plan designed to invest primarily in the Company’s common stock. All full-time employees of the Bank who have completed one year of service with the Bank are eligible to participate in the ESOP. The ESOP utilized funds borrowed from the Company totaling $1,690,680, to purchase approximately 8%, or 169,068 shares of the Company’s common stock issued in the 1998 Conversion. The ESOP utilized funds borrowed from the Company totaling $1,051,980 to purchase 105,198 additional shares of the Company’s common stock issued in the 2002 Conversion. The loans to the ESOP will be primarily repaid with contributions from the Bank to the ESOP over a period not to exceed 15 years for each loan. Under the terms of the ESOP, the Bank makes contributions to the ESOP sufficient to cover all payments of principal and interest as they become due. The 1998 loan had an outstanding balance of $676,271 with an interest rate of 8.25% and $788,983 with an interest rate of 7.25% at December 31, 2006 and 2005, respectively. The interest rate on the loan is based on the Bank’s prime rate. The 2002 loan had an outstanding balance of $701,320 with an interest rate of 8.25% and $771,452 with an interest rate of 7.25% at December 31, 2006 and 2005, respectively. Unallocated shares, totaling 216,575 shares at December 31, 2006, are excluded for the calculation of earnings per share.
Shares purchased with the loan proceeds are held in a suspense account by the trustee of the plan for future allocation among participants as the loan is repaid. Contributions to the ESOP and shares released from the suspense account are allocated among participants on the basis of compensation as described in the plan. The number of shares released to participants will be determined based upon the percentage of principal and interest payments made during the year divided by the total remaining principal and interest payments including the current year’s payment. Participants will vest in the shares allocated to their respective accounts over a period not to exceed five years. Any forfeited shares are allocated to the then-remaining participants in the same proportion as contributions. As of December 31, 2006, 218,102 shares have been allocated to participants and 216,576 shares remain unallocated. The fair value of the unallocated shares was $2.8 million at December 31, 2006. The Company recognizes compensation expense attributable to the ESOP ratably over the fiscal year based upon the estimated number of ESOP shares to be allocated each December 31st. The Company recognized $215,287, $209,419, and $223,231, as compensation expense in the years ended December 31, 2006, December 31, 2005 and December 31, 2004, respectively.
The trustee for the ESOP must vote all allocated shares held in the ESOP trust in accordance with the instructions of the participants. Unallocated shares held by the ESOP trust are voted by the trustee in a manner calculated to most accurately reflect the results of the allocated ESOP shares voted, subject to the requirements of the Employee Retirement Income Security Act of 1974, as amended (ERISA).
65
Note 15 - Fair Value of Financial Instruments
The following methods and assumptions were used by the Company in estimating its fair value disclosures for financial instruments. In cases where quoted market prices are not available, fair values are based on estimates using present value or other valuation techniques. The estimates are significantly affected by the assumptions used, including discount rates and estimates of future cash flows. These estimates may differ substantially from amounts that could be realized in an immediate sale or settlement of the instrument.
Fair value approximates book value for the following financial instruments due to their short-term nature: cash and due from banks, interest-earning bank balances, and advances from customers for taxes and insurance.
Fair value for investment securities and mortgage-backed and related securities are based on quoted market prices. If a quoted market price is not available, fair value is estimated using market prices for similar securities.
Fair value for variable rate loans that reprice frequently is based on the carrying value reduced by an estimate of credit losses inherent in the portfolio. Fair value for all other loans is estimated by discounting their future cash flows using interest rates currently being offered for loans of comparable terms and credit quality.
Fair value for demand deposit accounts and interest-bearing accounts with no fixed maturity is equal to the carrying value. Certificate of deposit fair values are estimated by discounting cash flows from expected maturities using interest rates currently being offered for similar instruments.
The carrying amount of repurchase agreements approximates fair value due to the short-term nature of the agreements.
Fair value for the advances from the Federal Home Loan Bank is based on discounted cash flows using current interest rates.
At December 31, 2006 and 2005, the Company had outstanding unfunded commitments to extend credit offered in the normal course of business. Fair values of these commitments are based on fees currently charged for similar instruments. At December 31, 2006 and 2005, the carrying amounts and fair values of these off-balance sheet financial instruments were immaterial.
66
The Company has used management’s best estimates of fair values of financial instruments based on the above assumptions. This presentation does not include certain financial instruments, nonfinancial instruments or certain intangible assets such as customer relationships, deposit base intangibles, or goodwill. Accordingly, the aggregate fair value amounts presented do not represent the underlying value of the Company. The estimated fair valuesof financial instruments as of December 31 were as follows:
| | 2006 | | 2005 | |
| |
| |
| |
| | Carrying
Amount | | Estimated
Fair Value | | Carrying
Amount | | Estimated
Fair Value | |
| |
|
| |
|
| |
|
| |
|
| |
Financial assets | | | | | | | | | | | | | |
Cash and due from banks | | $ | 17,581,168 | | $ | 17,581,168 | | $ | 8,863,423 | | $ | 8,863,423 | |
Interest-earning bank balances | | | 8,639,809 | | | 8,639,809 | | | 17,790,015 | | | 17,790,015 | |
Investments and mortgage- backed securities | | | 126,017,396 | | | 122,247,335 | | | 123,665,156 | | | 123,665,146 | |
Loans | | | 515,401,738 | | | 506,460,790 | | | 473,335,554 | | | 469,150,047 | |
Financial liabilities | | | | | | | | | | | | | |
Deposits | | | 562,801,771 | | | 549,117,428 | | | 517,543,801 | | | 501,632,157 | |
Repurchase agreements | | | 7,015,488 | | | 7,015,488 | | | 3,570,267 | | | 3,570,267 | |
Borrowed money | | | 78,948,000 | | | 78,660,166 | | | 87,772,000 | | | 87,219,210 | |
Note 16 - Earnings per share
Earnings per share has been determined under the provisions of SFAS No. 128, Earnings Per Share. Basic earnings per share is computed by dividing net income applicable to common stock by the weighted average number of common shares outstanding during the period, without considering any dilutive items. Diluted earnings per share is computed by dividing net income applicable to common stock by the weighted average number of common shares and common stock equivalents for items that are dilutive, net of shares assumed to be repurchased using the treasury stock method. Common stock equivalents arise from the assumed conversion of outstanding stock options.
The only potential stock of the Company as defined in SFAS No. 128, are stock options granted to various directors and officers of the Bank and unvested RRP shares. At December 31, 2006, the Company excluded 579,751 of the 772,680 outstanding options from the calculation of diluted earnings per share since these options had a strike price in excess of the market value of the stock at December 31, 2006. The following is a summary of the computation of basic and diluted earnings per share:
| | Year Ended
December 31,
2006 | | Year Ended
December 31,
2005 | | Year Ended
December 31,
2004 | |
| |
|
| |
|
| |
|
| |
Net income | | $ | 5,454,877 | | $ | 3,272,709 | | $ | 2,955,421 | |
Weighted average outstanding shares | | | 8,017,956 | | | 7,207,368 | | | 7,611,022 | |
Basic earnings per share | | $ | 0.68 | | $ | 0.45 | | $ | 0.39 | |
Weighted average outstanding shares | | | 8,017,956 | | | 7,207,368 | | | 7,611,022 | |
Dilutive effect of stock options | | | 77,320 | | | 90,851 | | | 101,648 | |
| |
|
| |
|
| |
|
| |
Weighted average diluted shares | | | 8,095,276 | | | 7,298,219 | | | 7,712,670 | |
Diluted earnings per share | | $ | 0.67 | | $ | 0.45 | | $ | 0.38 | |
67
The Company had 9,062,727 shares of common stock issued and outstanding as of September 30, 2002. In March 2003, the Company’s Board of Directors announced the authorization to repurchase of up to 343,027 shares of outstanding common stock. The Company repurchased 342,200 shares of stock at an average price of $13.66 under this authority in October 2003. During October 2003 the Company’s Board of Directors announced the authorization to repurchase up to 879,900 shares, or 10% of the outstanding common stock. The Company repurchased 877,235 shares of stock at an average price of $13.80 under this authority by May 2004. During May 2004, the Company’s Board of Directors authorized the repurchase of up to 815,000 shares, or 10% of the outstanding common stock. The Company repurchased 815,000 shares of stock at an average price of $13.09 under this authority in February 2005. During February 2005, the Board of Directors authorized the repurchase of 370,000 shares, or 5% of the outstanding common stock. The Company repurchased 370,000 of stock at an average price of $12.49 under this authority in January 2006. During January 2006, the Board of Directors authorized the repurchase of 200,000 shares, or 2.5% of the outstanding stock. As of December 31, 2006, the Company had repurchased 192,011 shares of stock at an average price of $12.78 under this authorization and had 7,989 shares remaining.
As of December 31, 2006, a total of 2,596,446 shares, or 28.7% of the outstanding shares of common stock, have been repurchased under these plans at an average price of $13.30 per share.
Note 17 - Parent-Only Financial Information
The earnings of the Bank are recognized by Citizens South Banking Corporation using the equity method of accounting. Accordingly, undistributed earnings of the Bank are recorded as increases in the Company’s investment in the Bank. The following are the condensed financial statements of the Company as of December 31, 2006 and 2005 and for the years ended December 31, 2006, 2005 and 2004.
Condensed Statements of Financial Condition
| | December 31,
2006 | | December 31,
2005 | |
| |
|
| |
|
| |
Assets | | | | | | | |
Cash and cash equivalents | | $ | 2,204,208 | | $ | 1,331,266 | |
Investment in securities available-for-sale | | | 2,198,120 | | | 2,311,005 | |
Investment in subsidiary | | | 96,548,690 | | | 95,566,533 | |
Other assets | | | 649,650 | | | 632,567 | |
| |
|
| |
|
| |
Total assets | | $ | 101,600,668 | | $ | 99,841,371 | |
| |
|
| |
|
| |
Liabilities and Stockholders’ Equity | | | | | | | |
Liabilities | | $ | 15,639,433 | | $ | 15,583,723 | |
Stockholders’ equity | | | 85,961,235 | | | 84,257,648 | |
| |
|
| |
|
| |
Total liabilities and stockholders’ equity | | $ | 101,600,668 | | $ | 99,841,371 | |
| |
|
| |
|
| |
68
Condensed Statements of Operations
| | Year Ended
December 31,
2006 | | Year Ended
December 31,
2005 | | Year Ended
December 31,
2004 | |
| |
|
| |
|
| |
|
| |
Interest income | | $ | 151,708 | | $ | 124,703 | | $ | 238,212 | |
Interest expense | | | (942,530 | ) | | (164,943 | ) | | — | |
Other noninterest income | | | 92,964 | | | 7,567 | | | 163,800 | |
Other noninterest expenses | | | (755,776 | ) | | (725,991 | ) | | (631,667 | ) |
| |
|
| |
|
| |
|
| |
Income before income taxes and undistributed earnings from subsidiaries | | | (1,453,634 | ) | | (758,664 | ) | | (229,655 | ) |
Income taxes | | | 563,000 | | | 295,218 | | | 96,000 | |
| |
|
| |
|
| |
|
| |
Income before undistributed earnings from subsidiaries | | | (890,634 | ) | | (463,446 | ) | | (133,655 | ) |
Equity in undistributed earnings of subsidiaries | | | 6,345,511 | | | 3,736,155 | | | 3,089,076 | |
| |
|
| |
|
| |
|
| |
Net income | | $ | 5,454,877 | | $ | 3,272,709 | | $ | 2,955,421 | |
| |
|
| |
|
| |
|
| |
69
Condensed Statements of Cash Flows
| | Year Ended
December 31,
2006 | | Year Ended
December 31,
2005 | | Year Ended
December 31,
2004 | |
| |
|
| |
|
| |
|
| |
Operating activities | | | | | | | | | | |
Net income | | $ | 5,454,877 | | $ | 3,272,709 | | $ | 2,955,421 | |
Adjustments to reconcile net income to net | | | | | | | | | | |
Cash provided by operating activities | | | | | | | | | | |
Gain on sale of investments | | | (92,964 | ) | | (7,500 | ) | | (163,800 | ) |
Equity in undistributed (earnings) of Subsidiaries | | | (6,345,511 | ) | | (3,736,155 | ) | | (3,089,076 | ) |
Allocation of shares to ESOP | | | 267,736 | | | 269,864 | | | 282,995 | |
Stock option expense | | | 25,194 | | | 0 | | | 0 | |
Vesting of shares issued for the RRP | | | 279,816 | | | 279,816 | | | 281,025 | |
Increase in other operating subsidiaries | | | — | | | (623,845 | ) | | (20,199 | ) |
(Decrease) increase in other operating liabilities | | | (7,234 | ) | | — | | | 6,102 | |
| |
|
| |
|
| |
|
| |
Net cash provided by (used in) operating activities | | | (418,086 | ) | | (545,111 | ) | | 252,468 | |
Investing activities | | | | | | | | | | |
Proceeds from the sale of investments | | | 191,014 | | | 507,500 | | | 1,008,000 | |
Purchase of investments available-for-sale | | | — | | | (200,000 | ) | | (347,282 | ) |
| |
|
| |
|
| |
|
| |
Net cash used in investing activities | | | 191,014 | | | 307,500 | | | 660,718 | |
Financing activities | | | | | | | | | | |
Repurchase of common stock | | | (2,624,719 | ) | | (5,654,999 | ) | | (16,403,258 | ) |
Contributed capital to bank subsidiary | | | — | | | (15,000,000 | ) | | — | |
Dividends received from bank subsidiary | | | 6,000,000 | | | 6,000,000 | | | 5,000,000 | |
Increase in borrowed money | | | — | | | 15,464,000 | | | — | |
Exercise of options | | | 135,793 | | | 140,670 | | | — | |
Dividends to stockholders | | | (2,411,060 | ) | | (2,067,808 | ) | | (2,013,560 | ) |
| |
|
| |
|
| |
|
| |
Net cash provided by (used in) financing activities | | | 1,100,014 | | | (1,118,137 | ) | | (13,416,818 | ) |
Net increase (decrease) in cash and cash equivalents | | | 872,942 | | | (1,355,748 | ) | | (12,503,632 | ) |
Cash and cash equivalents, beginning of year | | | 1,331,266 | | | 2,687,014 | | | 15,190,646 | |
| |
|
| |
|
| |
|
| |
Cash and cash equivalents, end of year | | $ | 2,204,208 | | $ | 1,331,266 | | $ | 2,687,014 | |
| |
|
| |
|
| |
|
| |
70
ITEM 9. | Changes in and Disagreements with Accountants on Accounting and Financial Disclosure |
None.
ITEM 9A. | Controls and Procedures |
Under the supervision and with the participation of the Company’s management, including the Company’s Principal Executive Officer and Principal Financial Officer, the Company has evaluated the effectiveness of the design and operation of its disclosure controls and procedures (as defined in Rule 13a-15(e) and 15d-15(e) under the Exchange Act) as of the end of the period covered by this report. Based upon that evaluation, the Principal Executive Officer and Principal Financial Officer concluded that, as of the end of the period covered by this report, the Company’s disclosure controls and procedures were effective to ensure that information required to be disclosed in the reports that the Company files or submits under the Exchange Act is recorded, processed, summarized and reported, within the time periods specified in the SEC’s rules and forms.
There has been no change in the Company’s internal control over financial reporting identified in connection with the quarterly evaluation that occurred during the Company’s last fiscal quarter that has materially affected, or is reasonably likely to materially affect, the Company’s internal control over financial reporting.
Management’s Annual Report on Internal Control over Financial Reporting
Management of Citizens South Banking Corporation (the “Company”) is responsible for establishing and maintaining adequate internal control over financial reporting as defined in Rules 13a-15(f) and 15d-15(f) under the Securities Exchange Act of 1934, as amended. The Company’s internal control over financial reporting is designed to provide reasonable assurance regarding the reliability of financial reporting and the preparation of financial statements for external purposes in accordance with generally accepted accounting principles. There were no material changes to the Company’s internal control over financial reporting during the year.
The Company’s internal control over financial reporting includes those policies and procedures that:
| • | pertain to the maintenance of records that, in reasonable detail, accurately and fairly reflect the transactions and dispositions of the assets of the Company; |
| | |
| • | provide reasonable assurance that transactions are recorded as necessary to permit preparation of financial statements in accordance with generally accepted accounting principles, and that material receipts and expenditures of the Company are being made only in accordance with the authorizations of management and directors of the Company; and |
| | |
| • | provide reasonable assurance regarding prevention or timely detection of unauthorized acquisition, use, or disposition of the Company’s assets that could have a material effect on the financial statements of the Company. |
Because of its inherent limitations, internal control over financial reporting may not prevent or detect misstatements. Also, projections of any evaluation of effectiveness to future periods are subject to the risk that controls may become inadequate because of changes in conditions, or that the degree of compliance with the policies or procedures may deteriorate. Management assessed the effectiveness of the Company’s internal control over financial reporting as of December 31, 2006. In making this assessment, management used the criteria set forth by the Committee of Sponsoring Organizations of the Treadway Commission (COSO) in Internal Control-Integrated Framework.
Based on our assessment and those criteria, management believes that the Company maintained effective internal control over financial reporting as of December 31, 2006.
The Company’s independent registered public accounting firm has issued an attestation report on management’s assessment of the Company’s internal control over financial reporting. That report is presented on the following page of this report.
71
REPORT OF INDEPENDENT REGISTERD PUBLIC ACCOUNTING FIRM
The Board of Directors
Citizens South Banking Corporation
Gastonia, North Carolina
We have audited management’s assessment, included in the accompanying Management’s Annual Report on Internal Control Over Financial Reporting, that Citizens South Banking Corporation and subsidiaries (the “Company”) maintained effective internal control over financial reporting as of December 31, 2006, based on criteria established in Internal Control-Integrated Framework issued by the Committee of Sponsoring Organizations of the Treadway Commission (COSO). The Company’s management is responsible for maintaining effective internal control over financial reporting and for its assessment of the effectiveness of internal control over financial reporting. Our responsibility is to express an opinion on management’s assessment and an opinion on the effectiveness of the company’s internal control over financial reporting based on our audit.
We conducted our audit in accordance with the standards of the Public Company Accounting Oversight Board (United States). Those standards require that we plan and perform the audit to obtain reasonable assurance about whether effective internal control over financial reporting was maintained in all material aspects. Our audit included obtaining an understanding of internal control over financial reporting, evaluating management’s assessment, testing and evaluating the design and operating effectiveness of internal control, and performing such other procedures as we considered necessary in the circumstances. We believe that our audit provides a reasonable basis for our opinion.
A company’s internal control over financial reporting is a process designed to provide reasonable assurance regarding the reliability of financial reporting and the preparation of financial statements for external purposes in accordance with accounting principles generally accepted in the United States of America. A company’s internal control over financial reporting includes those policies and procedures that (1) pertain to the maintenance of records that, in reasonable detail, accurately and fairly reflect the transactions and dispositions of the assets of the company; (2) provide reasonable assurance that transactions are recorded as necessary to permit preparation of financial statements in accordance with accounting principles generally accepted in the United States of America, and that receipts and expenditures of the company are being made only in accordance with authorizations of management and directors of the company; and (3) provide reasonable assurance regarding prevention or timely detection of unauthorized acquisition, use, or disposition of the company’s assets that could have a material effect on the financial statements.
Because of its inherent limitations, internal control over financial reporting may not prevent or detect misstatements. Also, projections of any evaluation of effectiveness to future periods are subject to the risk that controls may become inadequate because of changes in conditions, or that the degree of compliance with the policies or procedures may deteriorate.
In our opinion, management’s assessment that the Company maintained effective internal control over financial reporting as of December 31, 2006, is fairly stated, in all material respects, based on criteria established in Internal Control-Integrated Framework issued by COSO. Also in our opinion, the Company maintained, in all material aspects, effective internal control over financial reporting as of December 31, 2006, based on criteria established in Internal Control-Integrated Framework issued by COSO.
72
We have also audited, in accordance with the standards of the Public Company Accounting Oversight Board (United States), the consolidated statements of condition of the Company as of December 31, 2006 and 2005 and the related consolidated statements of operations, comprehensive income, changes in stockholders’ equity and cash flows for each of the years in the three-year period ended December 31, 2006 and our report dated March 3, 2007 expressed an unqualified opinion on these consolidated financial statements.
/s/ Cherry, Bekaert & Holland, L.L.P.
Gastonia, North Carolina
March 3, 2006
73
ITEM 9B. | Other Information |
None.
PART III
ITEM 10. | Directors, Executive Officers, and Corporate Governance |
The “Proposal I - Election of Directors” section of the Registrant’s Definitive Proxy Statement dated April 10, 2007, (the “Proxy Statement”) to be filed pursuant to Section 14 of the Securities Exchange Act of 1934 in connection with the 2007 Annual Meeting of Shareholders is incorporated herein by reference. In addition, the Item 1. “Executive Officers of the Registrant” section of the Proxy Statement is incorporated herein by reference.
ITEM 11. | Executive Compensation |
The “Proposal I - Election of Directors” section of the Registrant’s Proxy Statement is incorporated herein by reference.
ITEM 12. | Security Ownership of Certain Beneficial Owners and Management and Related Stockholder Matters |
The “Proposal I - Election of Directors” section of the Registrant’s Proxy Statement is incorporated herein by reference.
ITEM 13. | Certain Relationships, Related Transactions and Director Independence |
The “Proposal I - Election of Directors” section of the Registrant’s Proxy Statement is incorporated herein by reference.
ITEM 14. | Principal Accountant Fees and Services |
The “Principal Accountant’s Fees and Services” section of the Registrant’s Proxy Statement is incorporated herein by reference.
74
PART IV
ITEM 15. | Exhibits and Financial Statement Schedules |
| A. | | Index of Exhibits |
| | | |
| 3.1 | | Certificate of Incorporation of Citizens South Banking Corporation (incorporated herein by reference to the Registration Statement on Form S-1 (File No. 333-91498), originally filed with the Commission on June 28, 2002 |
| | | |
| 3.2 | | Bylaws of Citizens South Banking Corporation (incorporated herein by reference to the Registration Statement on Form S-1 (File No. 333-91498), originally filed with the Commission on June 28, 2002 |
| | | |
| 4.1 | | Form of Common Stock Certificate of Citizens South Banking Corporation (incorporated herein by reference to the Registration Statement on Form S-1 (File No. 333-91498), originally filed with the Commission on June 28, 2002 |
| | | |
| 4.2 | | Indenture between Citizens South Banking Corporation and Wilmington Trust Company, as trustee, dated October 28, 2005. (Incorporated by reference to the Current Report on Form 8-K (File No. 0-23971), filed with the Commission on November 3, 2005) |
| | | |
| 10.1 | | Employment Agreement with Kim S. Price dated May 17, 2004 |
| | | |
| 10.2 | | Deferred Compensation and Income Continuation Agreement (incorporated by reference to the Registration Statement on Form SB-2 (File No. 333-42951), originally filed with the Commission on December 22, 1997 |
| | | |
| 10.3 | | Employee Stock Option Plan (incorporated by reference to the Registration Statement on Form SB-2 (File No. 333-42951), originally filed with the Commission on December 22, 1997 |
| | | |
| 10.4 | | Supplemental Executive Retirement Plan (incorporated by reference to the Registration Statement on Form SB-2 (File No. 333-42951), originally filed with the Commission on December 22, 1997 |
| | | |
| 10.5 | | Severance Agreement with Gary F. Hoskins dated May 17, 2004. (Incorporated by reference to the Annual Report on Form 10-K (File No. 0-23971), filed with the Commission on March 16, 2005) |
| | | |
| 10.6 | | Severance Agreement with Paul L. Teem, Jr. dated May 17, 2004. (Incorporated by reference to the Annual Report on Form 10-K (File No. 0-23971), filed with the Commission on March 16, 2005) |
| | | |
| 10.7 | | Severance Agreement with Michael R. Maguire dated May 17, 2004. (Incorporated by reference to the Annual Report on Form 10-K (File No. 0-23971), filed with the Commission on March 16, 2005) |
| | | |
| 10.8 | | Severance Agreement with Daniel M. Boyd, IV dated May 17, 2004. (Incorporated by reference to the Annual Report on Form 10-K (File No. 0-23971), filed with the Commission on March 16, 2005) |
| | | |
| 10.9 | | Severance Agreement with V. Burton Brinson, Jr. dated May 17, 2004. (Incorporated by reference to the Annual Report on Form 10-K (File No. 0-23971), filed with the Commission on March 16, 2005) |
| | | |
| 10.10 | | Salary Continuation Agreement with Kim S. Price dated January 1, 2004. (Incorporated by reference to the Annual Report on Form 10-K (File No. 0-23971), filed with the Commission on March 16, 2005) |
| | | |
| 10.11 | | Salary Continuation Agreement with Gary F. Hoskins dated January 1, 2004. (Incorporated by reference to the Annual Report on Form 10-K (File No. 0-23971), filed with the Commission on March 16, 2005) |
75
| 10.12 | | Salary Continuation Agreement with Paul L. Teem, Jr. dated January 1, 2004. (Incorporated by reference to the Annual Report on Form 10-K (File No. 0-23971), filed with the Commission on March 16, 2005) |
| | | |
| 10.13 | | Salary Continuation Agreement with Michael R. Maguire dated January 1, 2004. (Incorporated by reference to the Annual Report on Form 10-K (File No. 0-23971), filed with the Commission on March 16, 2005) |
| | | |
| 10.14 | | Salary Continuation Agreement with Daniel M. Boyd, IV dated January 1, 2004. (Incorporated by reference to the Annual Report on Form 10-K (File No. 0-23971), filed with the Commission on March 16, 2005) |
| | | |
| 10.15 | | Salary Continuation Agreement with V. Burton Brinson, Jr. dated January 1, 2004. (Incorporated by reference to the Annual Report on Form 10-K (File No. 0-23971), filed with the Commission on March 16, 2005) |
| | | |
| 10.16 | | Endorsement Split Dollar Agreement with Kim S. Price dated January 1, 2004. (Incorporated by reference to the Annual Report on Form 10-K (File No. 0-23971), filed with the Commission on March 16, 2005) |
| | | |
| 10.17 | | Endorsement Split Dollar Agreement with Gary F. Hoskins dated January 1, 2004. (Incorporated by reference to the Annual Report on Form 10-K (File No. 0-23971), filed with the Commission on March 16, 2005) |
| | | |
| 10.18 | | Endorsement Split Dollar Agreement with Paul L. Teem, Jr. dated January 1, 2004. (Incorporated by reference to the Annual Report on Form 10-K (File No. 0-23971), filed with the Commission on March 16, 2005) |
| | | |
| 10.19 | | Endorsement Split Dollar Agreement with Michael R. Maguire dated January 1, 2004. (Incorporated by reference to the Annual Report on Form 10-K (File No. 0-23971), filed with the Commission on March 16, 2005) |
| | | |
| 10.20 | | Endorsement Split Dollar Agreement with Daniel M. Boyd, IV dated January 1, 2004. (Incorporated by reference to the Annual Report on Form 10-K (File No. 0-23971), filed with the Commission on March 16, 2005) |
| | | |
| 10.21 | | Endorsement Split Dollar Agreement with V. Burton Brinson, Jr. dated January 1, 2004. (Incorporated by reference to the Annual Report on Form 10-K (File No. 0-23971), filed with the Commission on March 16, 2005) |
| | | |
| 10.22 | | Amended Deferred Compensation and Income Continuation Agreement with David W. Hoyle, Sr. dated March 15, 2004. (Incorporated by reference to the Annual Report on Form 10-K (File No. 0-23971), filed with the Commission on March 16, 2005) |
| | | |
| 10.23 | | Amended Deferred Compensation and Income Continuation Agreement with Ben R. Rudisill, II dated March 15, 2004. (Incorporated by reference to the Annual Report on Form 10-K (File No. 0-23971), filed with the Commission on March 16, 2005) |
| | | |
| 10.24 | | Amended Deferred Compensation and Income Continuation Agreement with James J. Fuller dated March 15, 2004. (Incorporated by reference to the Annual Report on Form 10-K (File No. 0-23971), filed with the Commission on March 16, 2005) |
76
| 10.25 | | Amended Deferred Compensation and Income Continuation Agreement with Charles D. Massey dated March 15, 2004. (Incorporated by reference to the Annual Report on Form 10-K (File No. 0-23971), filed with the Commission on March 16, 2005) |
| | | |
| 10.26 | | Amended Director Retirement Agreement with David W. Hoyle, Sr. dated March 15, 2004. (Incorporated by reference to the Annual Report on Form 10-K (File No. 0-23971), filed with the Commission on March 16, 2005) |
| | | |
| 10.27 | | Amended Director Retirement Agreement with Ben R. Rudisill, II dated March 15, 2004. (Incorporated by reference to the Annual Report on Form 10-K (File No. 0-23971), filed with the Commission on March 16, 2005) |
| | | |
| 10.28 | | Amended Director Retirement Agreement with James J. Fuller dated March 15, 2004. (Incorporated by reference to the Annual Report on Form 10-K (File No. 0-23971), filed with the Commission on March 16, 2005) |
| | | |
| 10.29 | | Amended Director Retirement Agreement with Charles D. Massey dated March 15, 2004. (Incorporated by reference to the Annual Report on Form 10-K (File No. 0-23971), filed with the Commission on March 16, 2005) |
| | | |
| 10.30 | | Amended Director Retirement Agreement with Eugene R. Matthews, II dated March 15, 2004. (Incorporated by reference to the Annual Report on Form 10-K (File No. 0-23971), filed with the Commission on March 16, 2005) |
| | | |
| 10.31 | | Amended and Restated Declaration of Trust among Citizens South Banking Corporation, Wilmington Trust Company, as Delaware and Institutional Trustee, and the Administrative Trustees named therein, dated October 28, 2005. (Incorporated by reference to the Current Report on Form 8-K (File No. 0-23971), filed with the Commission on November 3, 2005) |
| | | |
| 14 | | Code of Ethics Policy (incorporated herein by reference to the “Proposal I – Election of Directors” section of the Registrant’s Proxy Statement dated April 3, 2006 |
| | | |
| 21 | | Subsidiaries of Registrant (incorporated herein by reference to the Registration Statement on Form S-1 (File No. 333-91498), originally filed with the Commission on June 28, 2002 |
| | | |
| 23 | | Consent of Cherry, Bekaert & Holland, L.L.P. |
| | | |
| 24 | | Power of Attorney (set forth on signature page) |
| | | |
| 31 | | Certification of Principal Executive Officer and Principal Financial Officer pursuant to Section 302 of the Sarbanes-Oxley Act of 2002 |
| | | |
| 32 | | Statement of Chief Executive Officer and Chief Financial Officer furnished pursuant to Section 906 of the Sarbanes-Oxley Act of 2002 |
77
Signatures
Pursuant to the requirements of Section 13 of the Securities Exchange Act of 1934, the Company has duly caused this report to be signed on its behalf by the undersigned, thereunto duly authorized.
| | | Citizens South Banking Corporation |
| | | |
| | | |
Date: March 13, 2007 | | By: | /s/ Kim S. Price |
| | |
|
| | | | Kim S. Price |
| | | | President and Chief Executive Officer |
Pursuant to the requirements of the Securities Exchange of 1934, this report has been signed below by the following persons on behalf of the Registrant and in the capacities and on the dates indicated.
By: | /s/ Kim S. Price | | By: | /s/ Gary F. Hoskins |
|
| | |
|
| Kim S. Price | | | Gary F. Hoskins |
| President, Chief Executive Officer and
Director (Principal Executive Officer) | | | Executive Vice President, Treasurer and
Chief Financial Officer
(Principal Financial and Accounting Officer) |
| | | | |
Date: March 13, 2007 | | Date: March 13, 2007 |
| | | | |
| | | | |
By: | /s/ David W. Hoyle | | By: | /s/ Ben R. Rudisill, II |
|
| | |
|
| David W. Hoyle | | | Ben R. Rudisill, II |
| Chairman | | | Vice Chairman |
| | | | |
| | | | |
Date: March 13, 2007 | | Date: March 13, 2007 |
| | | | |
| | | | |
By: | /s/ Eugene R. Matthews, II | | By: | /s/ Charles D. Massey |
|
| | |
|
| Eugene R. Matthews, II | | | Charles D. Massey |
| Director | | | Director |
| | | | |
| | | | |
Date: March 13, 2007 | | Date: March 13, 2007 |
| | | | |
| | | | |
By: | /s/ James J. Fuller | | By: | /s/ David McGuirt |
|
| | |
|
| James J. Fuller | | | David McGuirt |
| Director | | | Director |
| | | | |
| | | | |
Date: March 13, 2007 | | Date: March 13, 2007 |
78