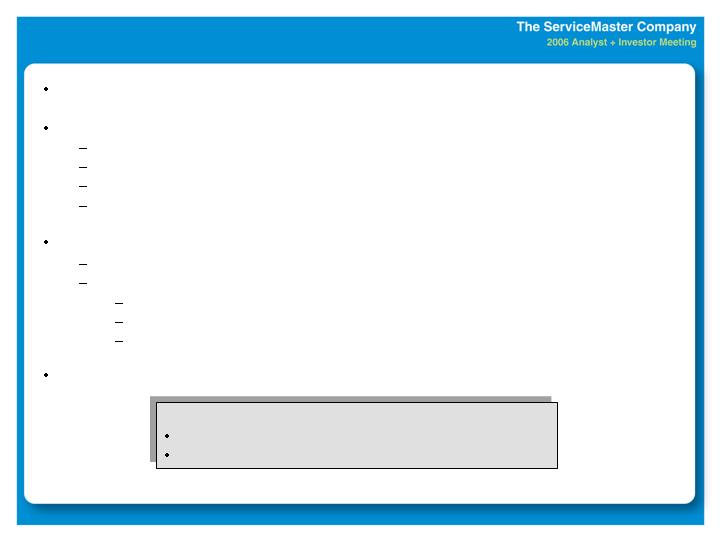
Growth Drivers
(all levered by PEGA, e - capabilities, QA)
Real Estate Sales
Maximize Realogy relationship
Accelerate core business growth
Focus on key segments /
services
Improve sales force productivity
Direct Marketing
Proven acquisition strategy
Consistent and predictable
Add internet lead engine,
and reach deeper into files
Improve telesales efficiency by
30% over 3 years
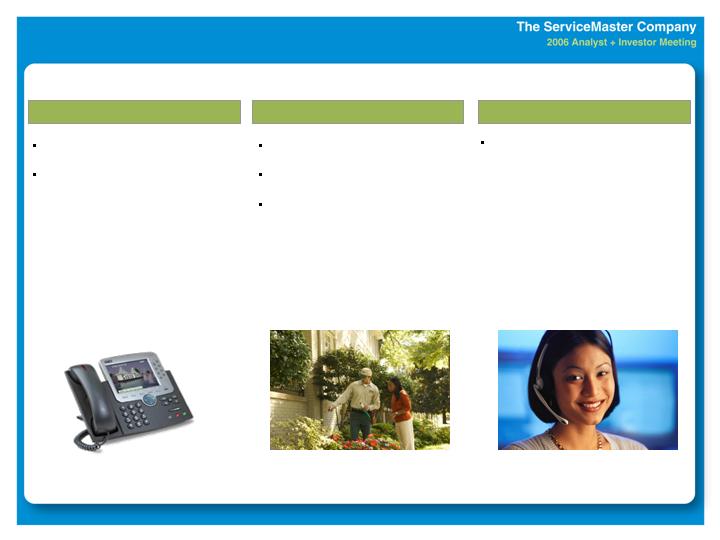
Retention Strategy
Rate continues to increase, slows
due to sales mix
Improve relationship contact and
timeliness
Build the capabilities for
web-driven channel
Continued service improvements
Service / Contractor Improvements
Capacity
Contractor network
Peak season service center
Proactively reach customers
during service experience
Modify compensation to reward
speed, quality and volume
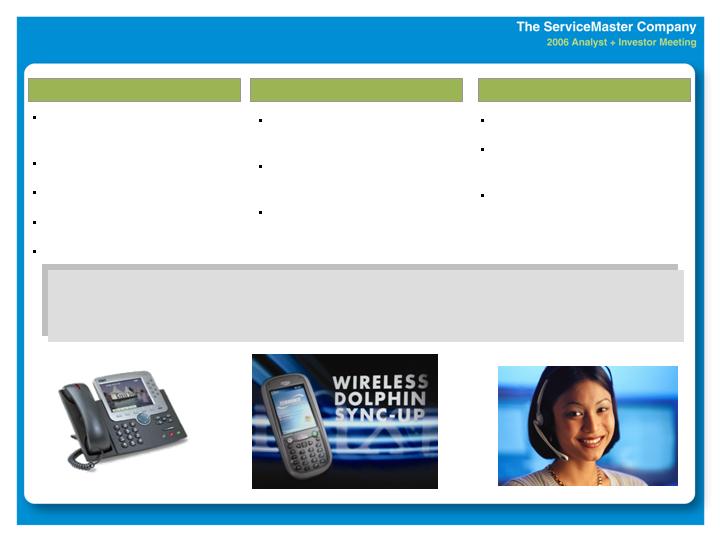
Execute Realogy start up and expansion
Develop and Execute
Expanded Web Capabilities / Interactions
Quality Assurance Program
Roll Out “BPM” Sales
Roll Out “BPM” Service
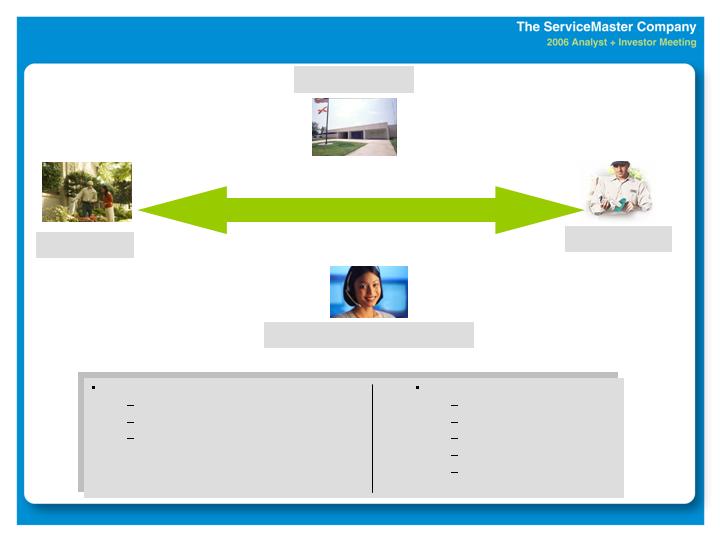
Improve total customer experience -- at all touch points
Pre / post sell contact / communication
During all points of service experience
E dispatch confirmation
E follow up, e customer satisfaction / feedback process
Save process and problem resolution improvements
Reduce the hassles for customers, contractors, third parties and employees
Result:
Low double digit revenue growth
Operating margins improve 50-70 bps in ’07
Summary

David Crawford
President
American Home Shield

Ernie Mrozek
Vice Chairman
ServiceMaster
Compelling Business Model
High recurring revenue
Low volatility
Low risk from technology / offshore competition
Returns exceeding cost of capital
Exceptional cash flows
Strong, reliable dividend
Solid balance sheet - Investment Grade
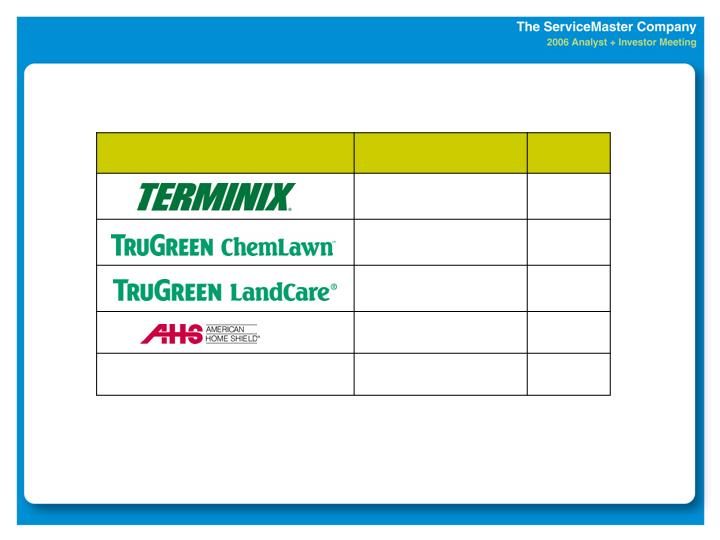
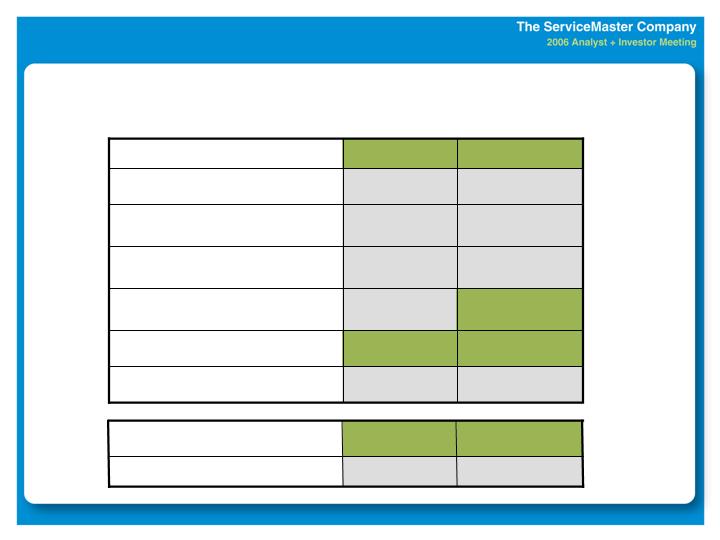
High Recurring Revenue
70%
62%
55%
77%
83%
70%
Total
62%
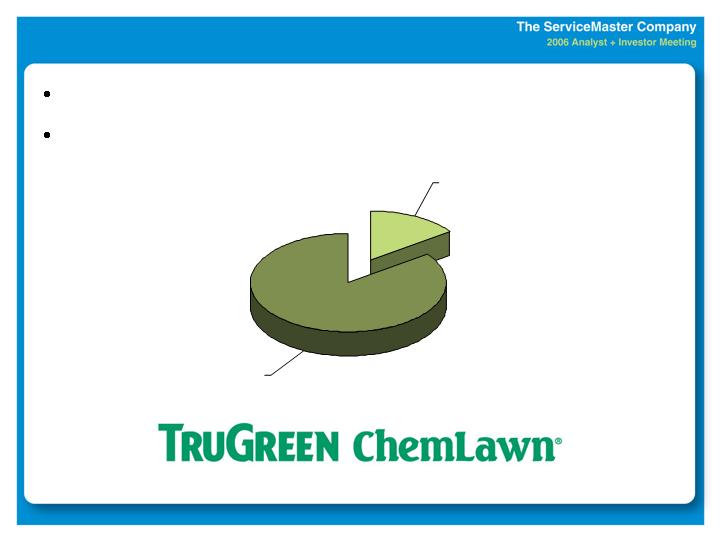
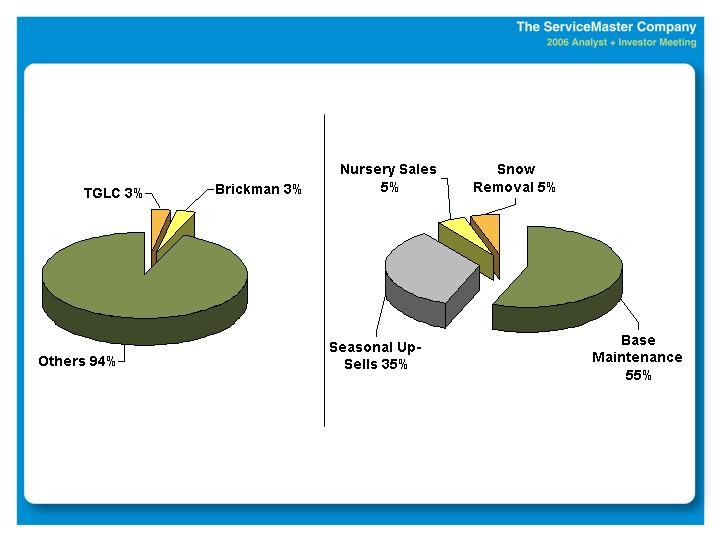
Residential Lawn, Shrub
and Tree Care
55%
77%
83%
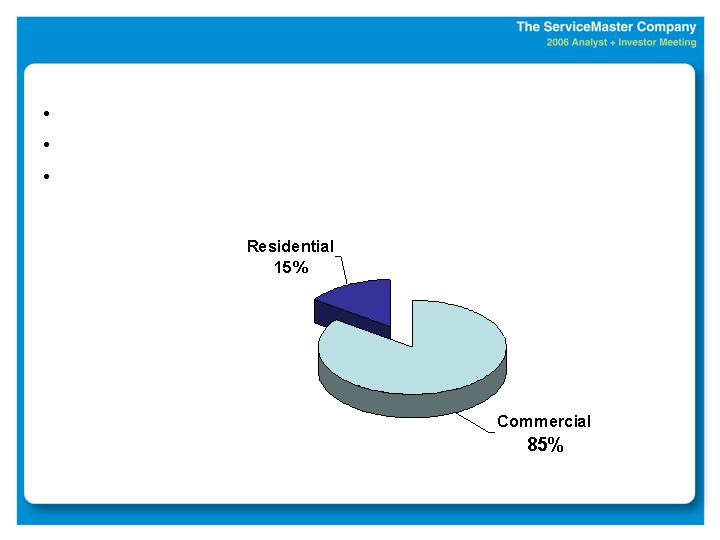
Commercial Landscape
Maintenance
Home Warranty
Pest and Termite Control
Services
Brand
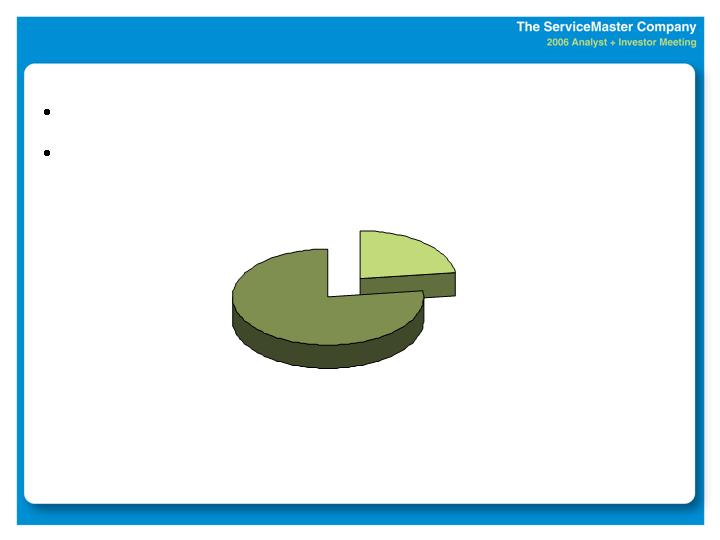
Percent
Recurring

Revenue Growth 2004-2005
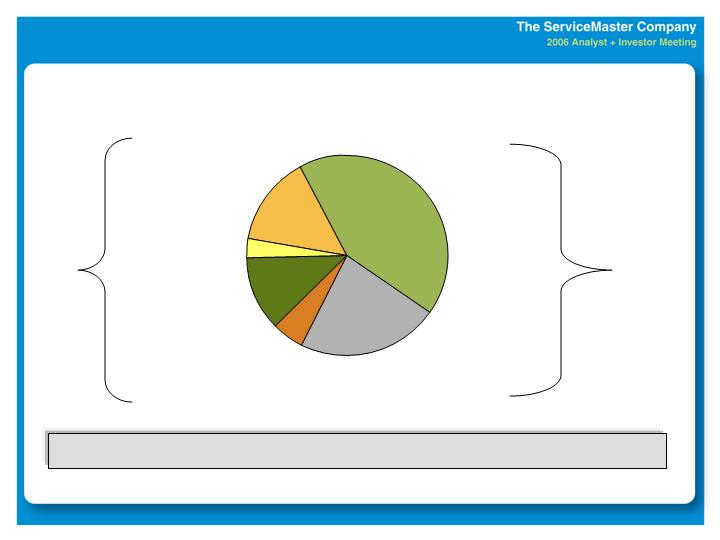
* Returns based on ROI including Goodwill
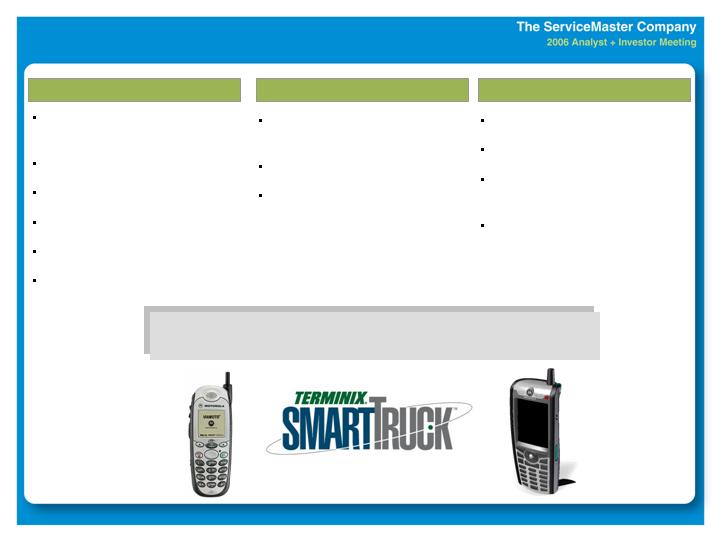
Terminix
LandCare
LawnCare
Franchises
American Home
Shield
Cost of Capital = 9%
0%
Bulk of Portfolio Returns
Exceeding Cost of Capital
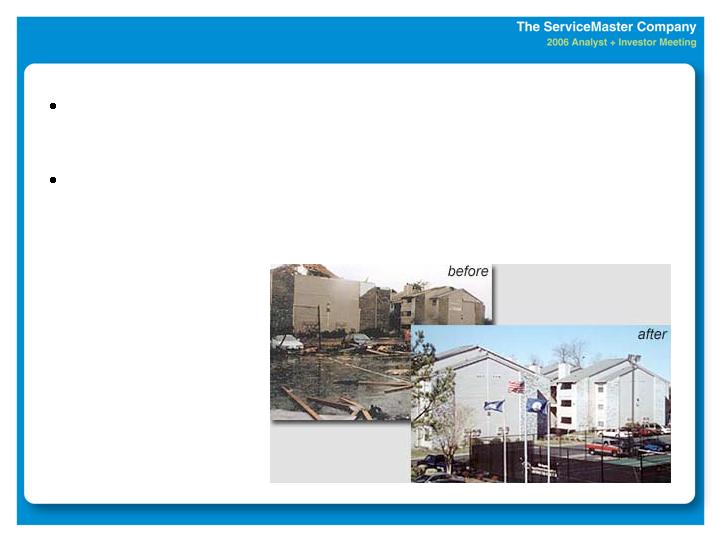
InStar

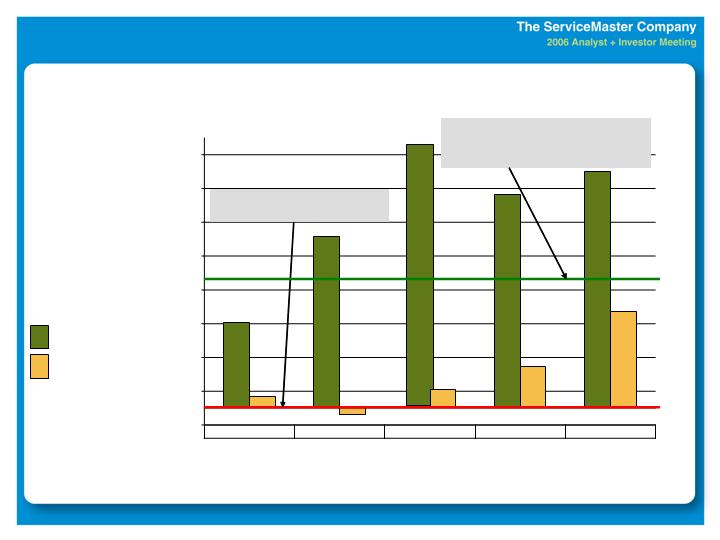
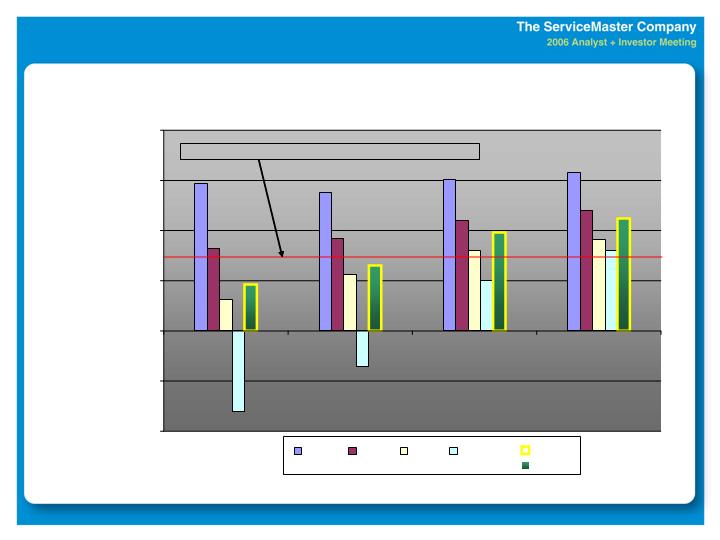
Exceptional Cash Flows
Consistently Exceed Net Income*
* Comparable basis, excluding unusual items
Cash From Operations
Net Income
$ millions
Cash Flow From Operations
Multiple 1.7X 2.1X 1.8X 1.5X 1.8X
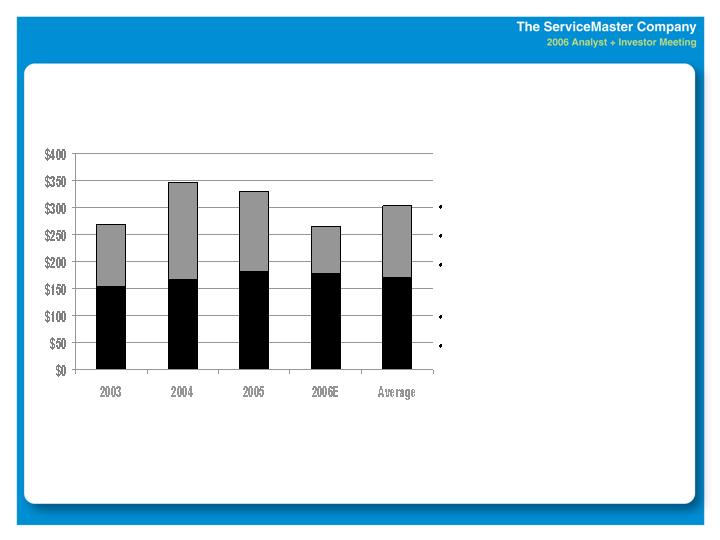
* Comparable basis, excluding unusual items
$ millions
Cash Flow From Operations
Multiple 1.7X 2.1X 1.8X 1.5X 1.8X
Fundamentals
Low fixed asset requirements
Significant prepayments
Quick accounts receivable
turnover
Minimal inventories
Recurring deferred tax benefit
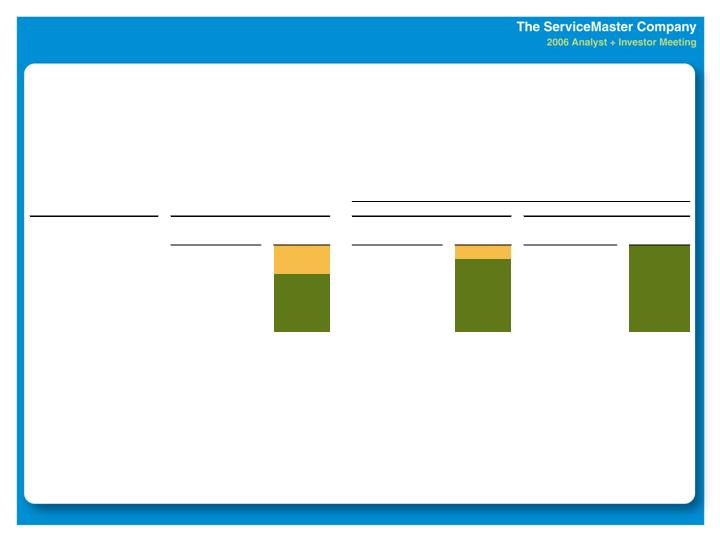
Exceptional Cash Flows
Consistently Exceed Net Income*

* Assumes 2007 – 2012 Estimate of $53 million and 300 million Diluted Shares Outstanding
Annual
Average
$ millions
Significant Annual Cash Tax Benefit of
$.18* per share; Not Included In EPS
Exceptional Cash Flows
Dividend Growth
Recently increased rate of growth based
on strong cash flow profile
Share Repurchase
$86 million completed through
September 30th
2006 combined yield exceeds 6.4%
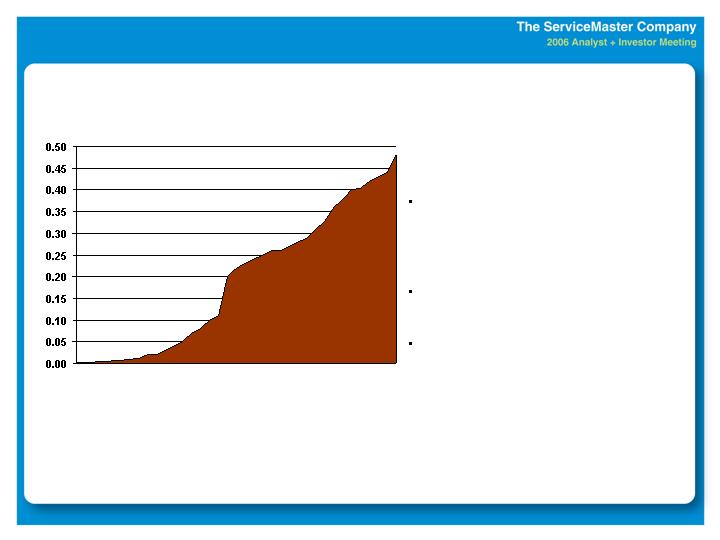
1970 - 2006
4.0% Dividend Yield*
36 consecutive
years of
increase
*Based on $.48 dividend and $12.10 stock price
Strong History of Cash Returns to Shareholders
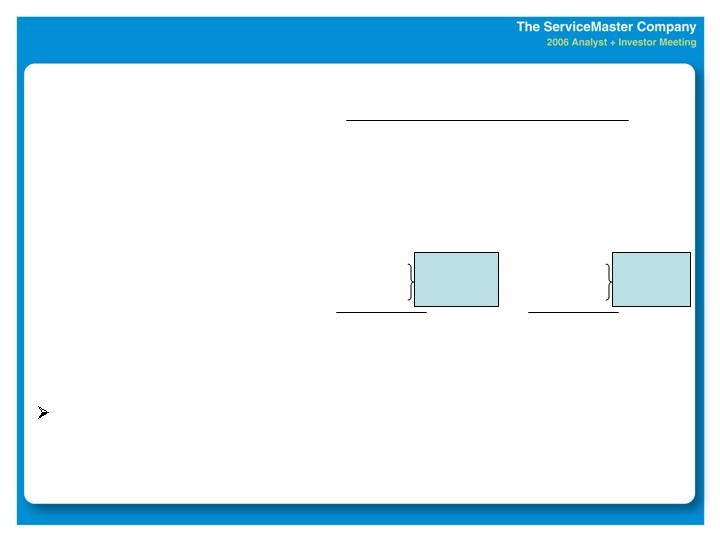
Balanced Approach to
Deployment of Free Cash Flows
2004 – 2006E
$196
$65
Free Cash Flow
(137)
(46)
Capital Expenditures
(72)
(130)
$313
Average
(215)
Share Repurchase
(390)
Dividends
$938
Cash From Operations*
Cumulative
$ millions
Maintain strong balance sheet and investment grade status
* Comparable basis, excluding unusual items
$202
$.67/Share
$605
$2/Share
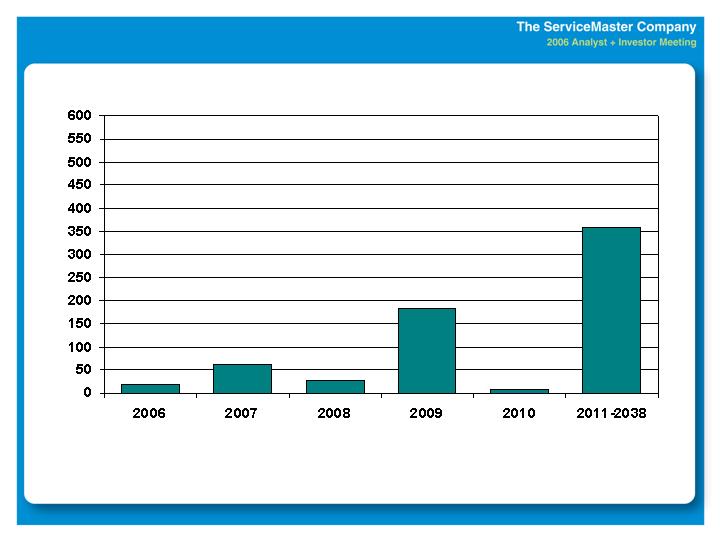
Investment Grade Debt
* Adjusted for $100 million cash proceeds from the ARS sale used to pay down debt on 10/03/06
$ millions
$773 Million in Total Debt (As of 9/30/06)*
Policy of maximum 35% floating rate debt
Mostly Fixed Rate, with Extended Maturities

Note: The income and EPS results on this schedule exclude the following non-comparable items:
2006 excludes restructuring costs of $12 million pretax, $7 million after-tax and $.02 per diluted share.
2004 excludes the resolution of the IRS audit resulting in a $149.7 million reduction in tax expense, $.49 per diluted share.
Historical Financial Summary
9%
8%
6%
% Chg
$0.61 to $0.63
178 to 184
$3,430 to $3,450
2006E
0% to 3%
(1%) to 2%
6%
% Chg
$0.61
10%
$0.56
EPS (see Note)
181
8%
167
Net Income (see Note)
$3,239
6%
$3,068
Revenue
2005
% Chg
2004
$ in millions
Income Statement
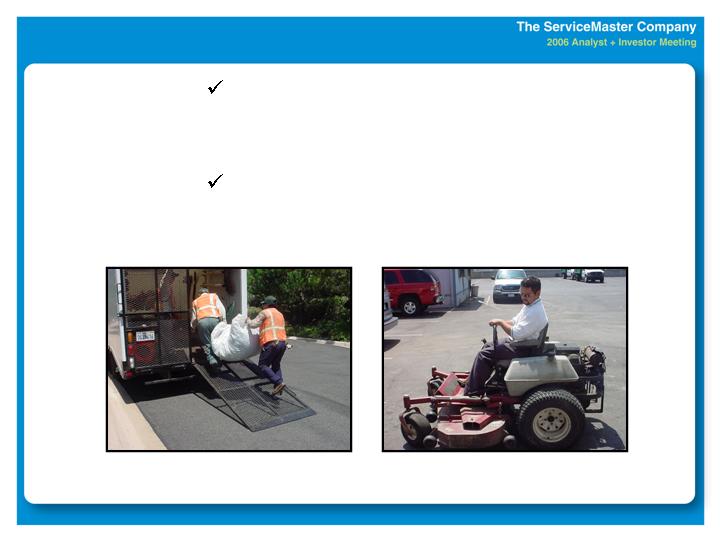
Organic growth weakened by unusual combination of events
TruGreen ChemLawn: Accelerated decline in telemarketing
Terminix: Very weak annual termite swarm
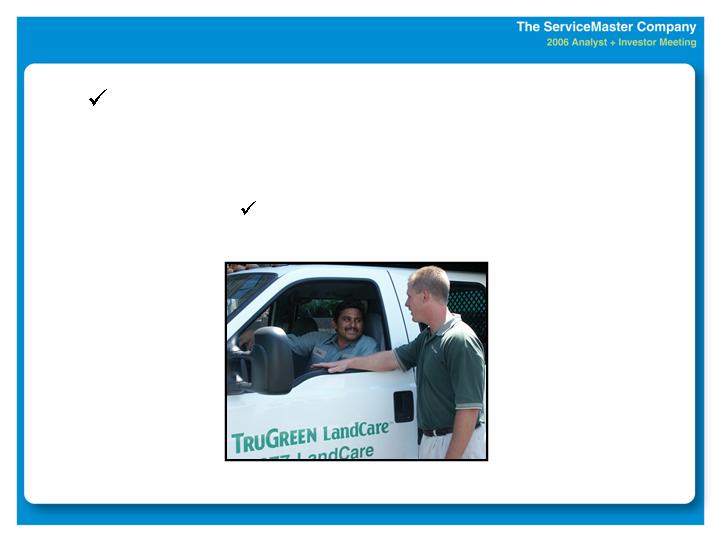
TruGreen LandCare: Timing delays in maintenance sales and less snow removal
AHS: Significant decline in home resale market
Rapid increases in fuel, health care and interest costs
Higher claims costs at AHS, due in part to new legislation
Investments in sales and retention initiatives
Key Factors Impacting 2006 Results
Despite unusually stiff headwinds, projected
earnings still consistent or slightly above 2005
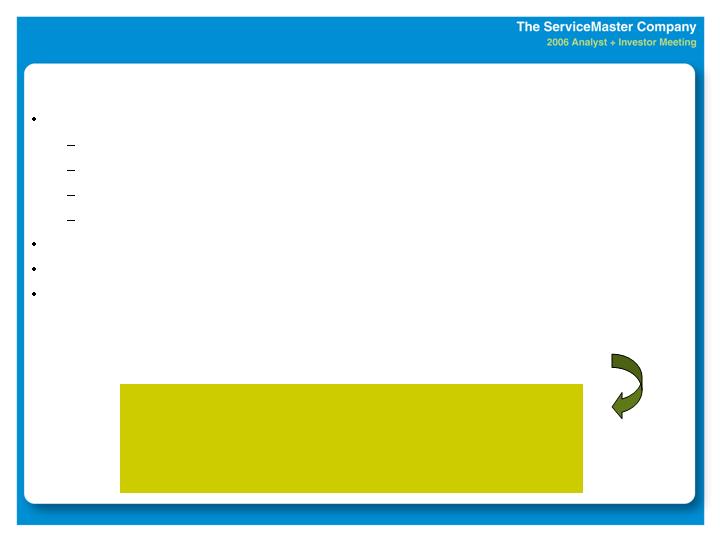
Strong Growth Prospects
SPECIFIC INITIATIVES DRIVE RETURN TO ACCELERATED GROWTH
Accelerating gains in satisfaction and retention
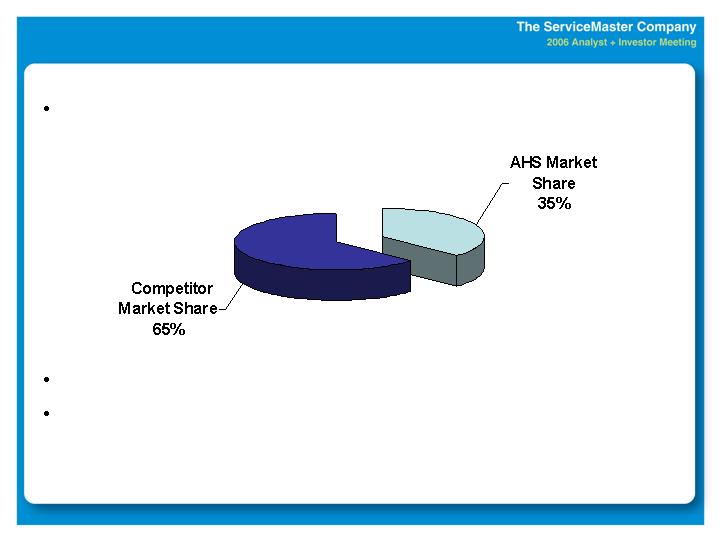
Expanding market share and category penetration
Innovative new offerings
New markets / increasing penetration
Expanding sales methods / channels
Improving employee selection, training and retention
Increasing operating leverage

Accelerating Gains
in Customer
Satisfaction and
Retention
Strategy: Enhance a CUSTOMER FIRST CULTURE by:
Delivering our services as promised, every time
Building loyalty and retention in everything we do
Tactics:
Employee selection and training
Customer communications and expectation setting
Getting it right the first time
LQAs and Progress Assessments
Problem resolution standards / follow up
Compensation plans and promotion qualifiers
Our Strategic Framework for Accelerating Growth
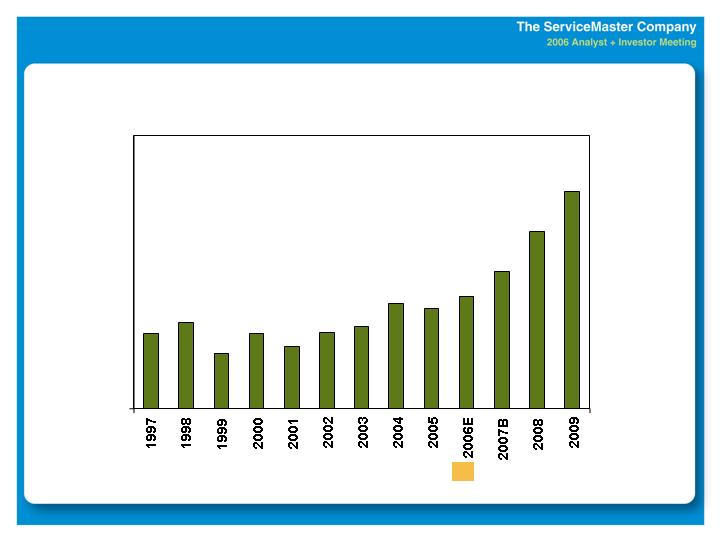
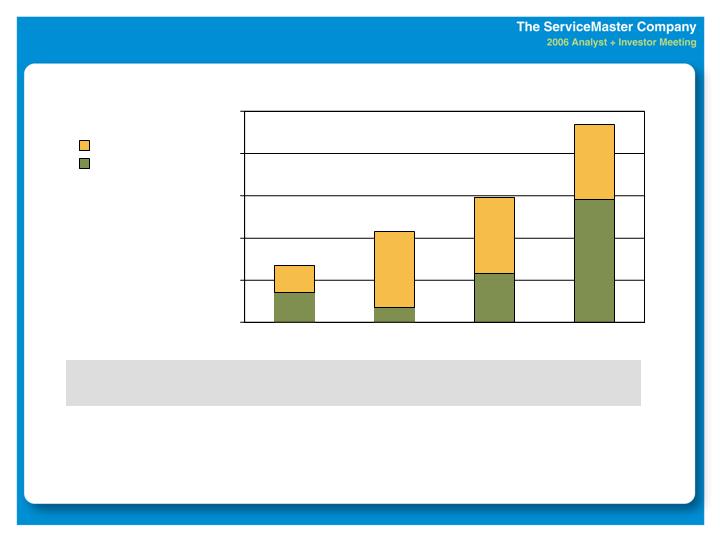
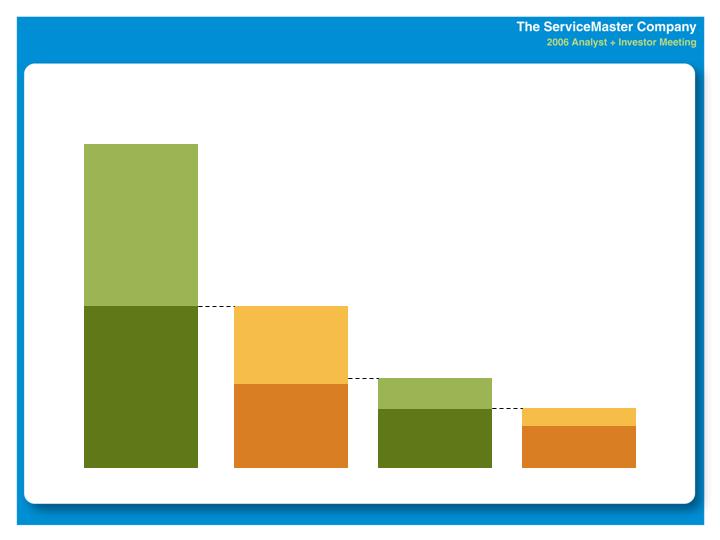
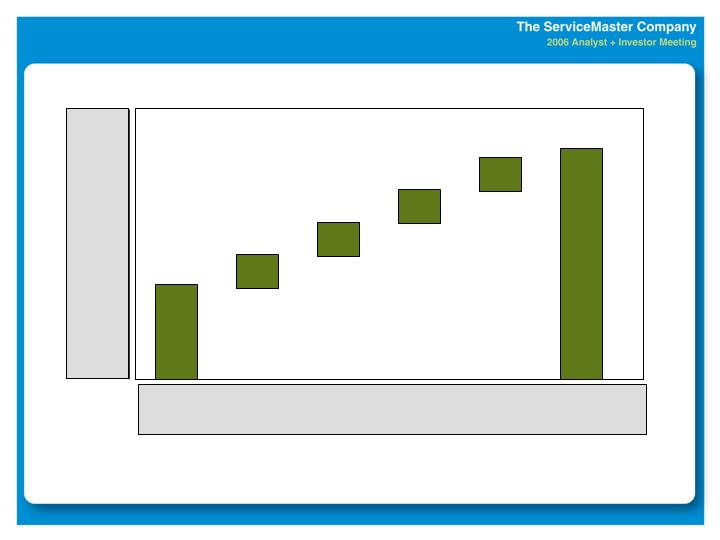
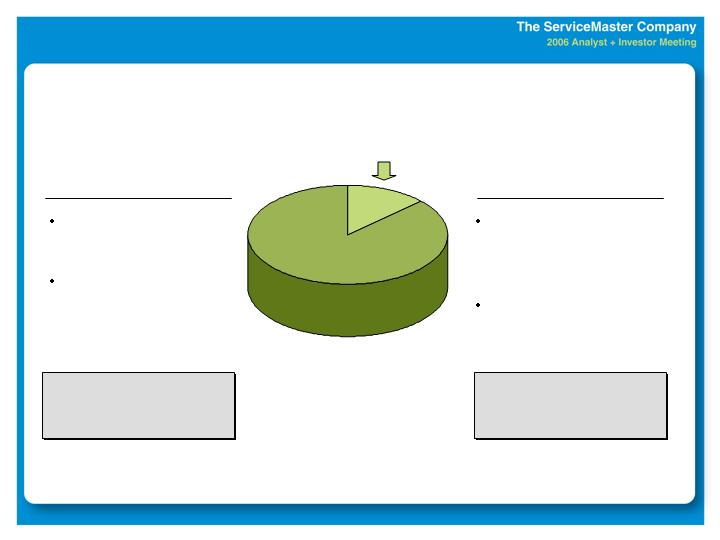
Continuing Gains in Retention
Have Significant Financial Impact
+ Improved Referrals
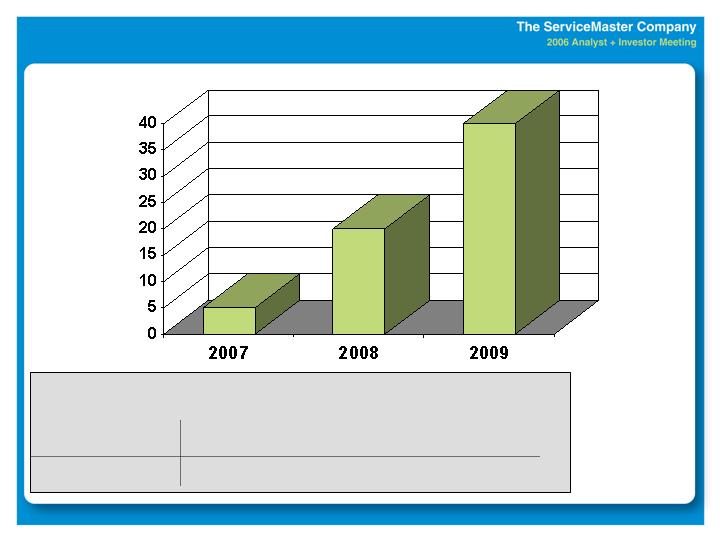
$45
$102
Total
3
7
American Home Shield
2
6
Terminix – Pest
5
10
Terminix – Termite
4
17
TruGreen LandCare
$31
$62
TruGreen ChemLawn
Operating
Income
Revenue
$ in millions
Annualized Impact in 2009
From Retention Gains

Strong Growth Prospects
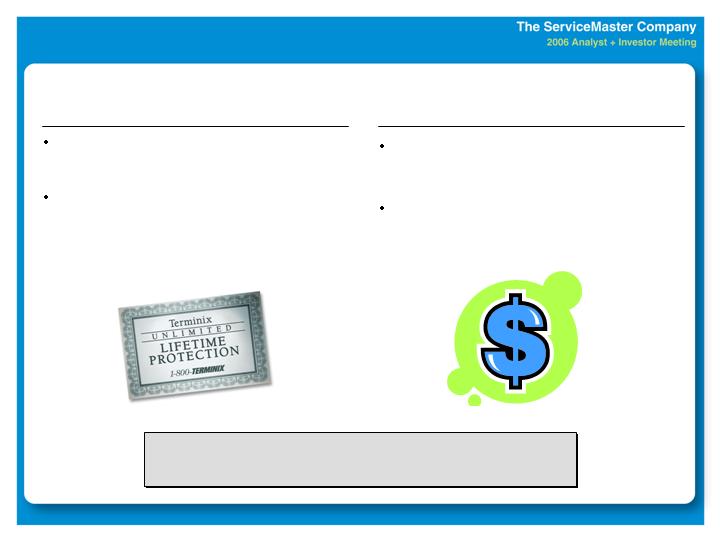
Innovative Offerings
Termite Inspections
LQAs
Green Products
Expanding Market
Share and
Category
Penetration

Strong Growth Prospects
Innovative Offerings
Termite Inspections
LQAs
Green Products
New Markets / Increasing Penetration
InStar: New markets and services
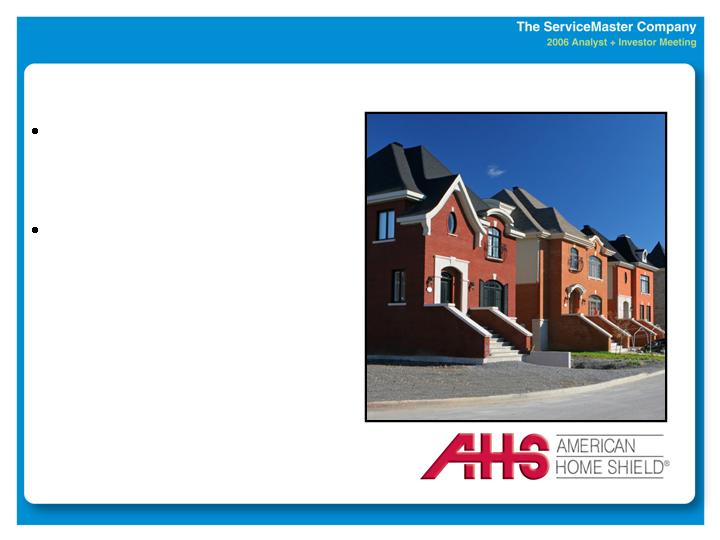
AHS Real Estate: New Realogy partnership
Terminix / TruGreen / Merry Maids:
Tuck-ins and new market acquisitions
Expanding Market
Share and
Category
Penetration
Strong Growth Prospects
Innovative Offerings
Termite Inspections
LQAs
Green Products
New Markets / Increasing Penetration
InStar: New markets and services
AHS Real Estate: new Realogy partnership
Terminix / TruGreen / Merry Maids:
Tuck-ins and new market acquisitions
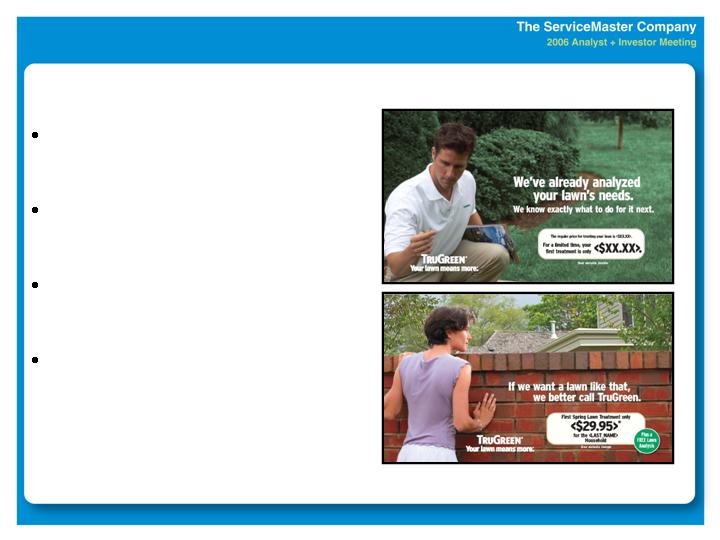
Expanding Sales Methods / Channels
Direct mail
Neighborhood sales
Internet
Retail
Expanding Market
Share and
Category
Penetration

Strategies
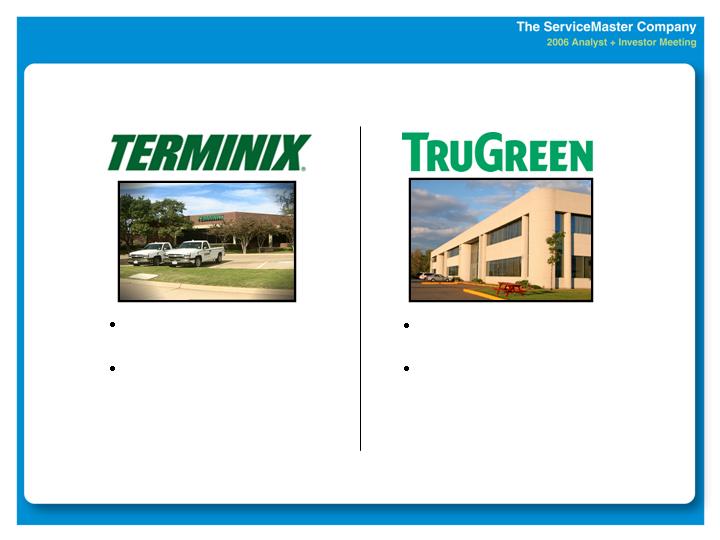
LandCare margin improvement
Lawn / pest integration
Benefits of headquarters consolidation
Simplify service centers and functional processes
Improving
Operating
Leverage
Our Strategic Framework for Accelerating Growth
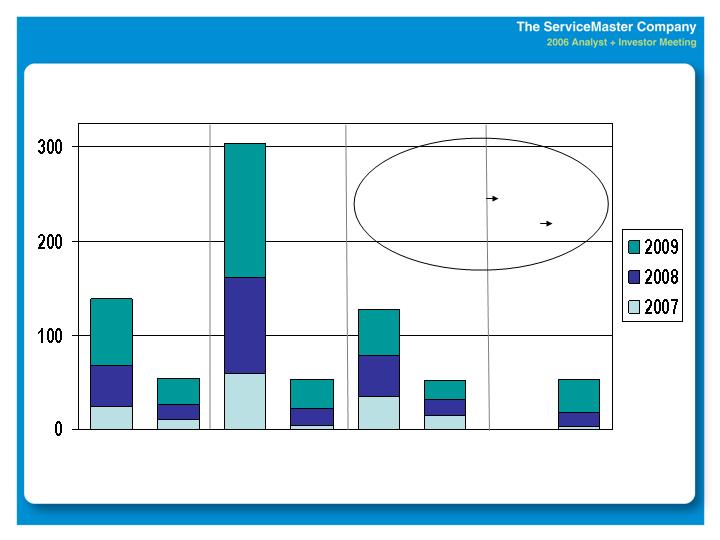
Strong Growth Prospects
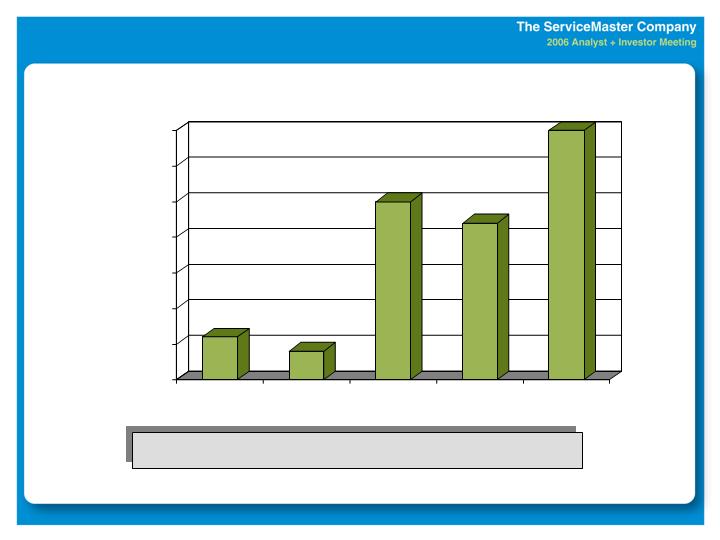
Meaningful Gains From Specific Initiatives
Improving Operating
Leverage
Expanding Sales
Methods / Channels
New Markets/ Innovative
Offerings
Improving
Retention
Rev OI Rev OI Rev OI Rev OI
Rev = Revenue OI = Operating Income
$ millions
Total Impact in 2007 – 2009:
Revenue - $120 $260m
Operating Income - $30 $110m
Cumulative
total in:
Strong Growth Prospects
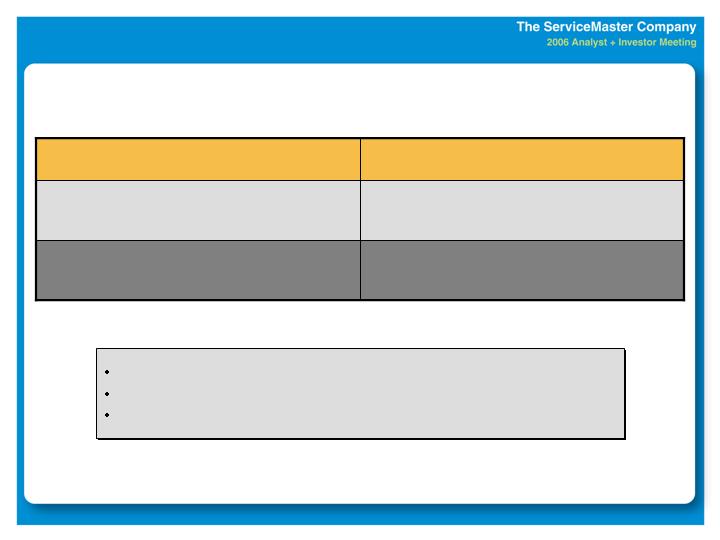
Business Unit Growth Targets: 2007 - 2009
50-100 bps per year
Mid-teen levels
InStar
Flat to 20 bps per year
Mid-single digit
TruGreen ChemLawn
Slightly declining margins due to
acquisitions
Mid-teen levels
ServiceMaster Clean / Merry Maids
50-70 bps in ’07; Maintain at ‘07 levels
Low-double digit
AHS
Flat in ’07; 50-100 bps per year
Mid to High-single digit
Terminix
100-200 bps per year
Low-single digit in ’07; Low-double digit
thereafter
TruGreen LandCare
Change in Operating
Margins
Revenue
(% Growth Rate)
Business
General
General economic growth of 2-3%
Home resale market stabilizes at 2006 levels
(-9% decrease in 2006; 4% increase in 2005)
Weather at multi-year historical averages
Key Factor Costs
Annual wage increases of 3%-3.5%
(3% - 4% in 2006 & 2005)
Growth in fuel costs of 9% in 2007 and 2% in 2008 & 2009
(20% - 25% in 2006 & 2005)
Annual inflationary increases in health care costs of 11%
(14% - 15% in 2006 & 2005)
Annual average LIBOR rate for 2007 that is 80 basis points higher than 2006, then
consistent rates in 2008 and 2009
(increase of 180 bp in 2006)
Key Common Assumptions in Plan

Strong Growth Prospects
*Continuing operations; excludes unusual items.
+13%
+8%
2008P
0%-3%
+6%
2006E
+10%
+7%
2007P
+10%
+6%
2004
+9%
+6%
2005
EPS*
Revenue
+16%
+9%
2009P
Growth Rates
SPECIFIC INITIATIVES SUPPORT ACCELERATING
AND SUSTAINABLE GROWTH

Ernie Mrozek
Vice Chairman
ServiceMaster

Pat Spainhour
Chairman and Chief Executive Officer
ServiceMaster

Question & Answer
Reconciliation of Non-GAAP Financial Measures
(Amounts in thousands, except per share data)
Within this investor presentation, ServiceMaster has provided certain non-GAAP (Generally Accepted Accounting Principles) measures. ServiceMaster does not intend for the information to be considered in isolation or as a substitute for the related GAAP measures. ServiceMaster believes that these non-GAAP measures provide an important perspective on the performance of ServiceMaster’s continuing operations.
A reconciliation of cash from operations on a comparable basis, before unusual items to its most directly comparable financial measure under GAAP for the years ended December 31 is as follows:
| 2006
Estimate
| | 2005
| | 2004
| | 2003
| |
|---|
| Reported cash from operations | | $ 259,200 | | $ 242,708 | | $ 370,057 | | $ 269,031 | |
| Resolution of income tax audits | | 5,000 | | 86,356 | | (25,000 | ) | — | |
|
| |
| |
| |
| |
| Cash from operations on a | |
| comparable basis, before | |
| unusual items | | $ 264,200 | | $ 329,064 | | $ 345,057 | | $ 269,031 | |
A reconciliation of income from continuing operations on a comparable basis, before unusual items to its most directly comparable financial measure under GAAP for the years ended December 31 is as follows:
| Range of 2006 Estimate
| |
|---|
| Low end
| | High end
| |
|---|
| Reported income from | | | | | | | | | |
| continuing operations | | $ 171,000 | | $ 0.59 | | $ 177,000 | | $ 0.61 | |
| Restructuring charges, net of tax | | 7,000 | | 0.02 | | 7,000 | | 0.02 | |
|
| |
| |
| |
| |
| Income from continuing | |
| operations on a comparable | |
| basis, before unusual items | | $ 178,000 | | $ 0.61 | | $ 184,000 | | $ 0.63 | |
| 2005
| | 2004
| |
|---|
| Reported income from | | | | | | | | | |
| continuing operations | | $ 180,561 | | $ 0.61 | | $ 316,623 | | $ 1.06 | |
| IRS tax agreement | | — | | — | | (149,722 | ) | (0.49 | ) |
|
| |
| |
| |
| |
| Income from continuing | |
| operations on a comparable | |
| basis, before unusual items | | $ 180,561 | | $ 0.61 | | $ 166,901 | | $ 0.56 | |
| 2003
| |
|---|
| Reported income from | | | | | |
| continuing operations | | $ (2,455 | ) | $ (0.01 | ) |
| Impairment charge, net of tax | | 156,200 | | 0.53 | |
|
| |
| |
| Income from continuing | |
| operations on a comparable | |
| basis, before unusual items | | $ 153,745 | | $ 0.51 | |
A reconciliation of total long-term debt adjusted for cash proceeds from the sale of ARS to its most directly comparable financial measure under GAAP is as follows:
| |
|---|
| Reported total long-term debt at September 30, 2006 | | $ 873,365 | |
| Cash proceeds from sale of ARS used to pay down | |
| debt on October 3, 2006 | | (100,000 | ) |
|
| |
| Adjusted total long-term debt | | $ 773,365 | |