UNITED STATES
SECURITIES AND EXCHANGE COMMISSION
Washington, D.C. 20549
FORM N-CSR
CERTIFIED SHAREHOLDER REPORT OF REGISTERED
MANAGEMENT INVESTMENT COMPANIES
Investment Company Act file number: 811-08587
Jennison 20/20 Focus Fund
(Exact name of registrant as specified in charter)
| | |
Gateway Center 3, 100 Mulberry Street, Newark, New Jersey | | 07102 |
| |
| (Address of principal executive offices) | | (Zip code) |
Marguerite E. H. Morrison
Gateway Center 3,
100 Mulberry Street,
Newark, New Jersey 07102
(Name and address of agent for service)
Registrant’s telephone number, including area code: 973-367-7525
Date of fiscal year end: 1/31/2004
Date of reporting period: 1/31/2004
Item 1 – Reports to Stockholders – [INSERT REPORT]
Jennison 20/20 Focus Fund
Formerly known as Prudential 20/20 Focus Fund
| | |
|
| JANUARY 31, 2004 | | ANNUAL REPORT |

FUND TYPE
Large-capitalization stock
OBJECTIVE
Long-term growth of capital
This report is not authorized for distribution to prospective investors unless preceded or accompanied by a current prospectus.
The views expressed in this report and information about the Fund’s portfolio holdings are for the period covered by this report and are subject to change thereafter.
JennisonDryden is a service mark of The Prudential Insurance Company of America.

Dear Shareholder,
March 22, 2004
The stock market slowed in the first quarter of 2004 following its particularly strong performance in 2003, and though the economy appeared sound, some investors still seemed to be watching developments from the sidelines. Given the unsettled global political climate and sluggish job growth in the United States, we can understand that some investors may want to remain cautious. For those with long-term goals, however, keeping assets in short-term savings and money market accounts may be a losing proposition as meager yields will be eroded by taxes, and even low annual inflation will reduce purchasing power. A broadly diversified asset allocation can help protect you against inflation and increase your chances of participating in economic growth.
We recommend that you develop a diversified asset allocation strategy in consultation with a financial professional who knows you and who understands your reasons for investing, the time you have to reach your goals, and the amount of risk you are comfortable assuming. JennisonDryden mutual funds offer a wide range of investment choices, and your financial professional can help you choose the appropriate funds to implement your strategy.
Whether you are investing for your retirement, your children’s education, or some other purpose, JennisonDryden mutual funds offer the experience, resources, and professional discipline of three leading asset management firms that can make a difference for you. JennisonDryden funds are managed by Prudential Investment Management’s public equity and fixed income asset management businesses. The equity funds are managed by Jennison Associates and Quantitative Management. Prudential Fixed Income manages the JennisonDryden fixed income and money market funds.
Thank you for your confidence in JennisonDryden mutual funds.
Sincerely,

Judy A. Rice, President
Jennison 20/20 Focus Fund
| | |
| Jennison 20/20 Focus Fund | | 1 |
Your Fund’s Performance
Fund objective
The investment objective of the Jennison 20/20 Focus Fund (the Fund) is long-term growth of capital. There can be no assurance that the Fund will achieve its investment objective.
| | | | | | | | | |
| | | |
| Cumulative Total Returns1 as of 1/31/04 | | | | | | | | | |
| | | One Year | | | Five Years | | | Since Inception2 | |
Class A | | 35.78 | % | | 14.49 | % | | 31.88 | % |
| |
Class B | | 34.75 | | | 10.28 | | | 26.39 | |
| |
Class C | | 34.75 | | | 10.28 | | | 26.39 | |
| |
Class Z | | 36.16 | | | 15.89 | | | 33.64 | |
| |
S&P 500 Index3 | | 34.55 | | | –5.00 | | | 8.11 | |
| |
Russell 1000 Index4 | | 35.65 | | | –2.26 | | | 10.65 | |
| |
Lipper Multi-Cap Core Funds Avg.5 | | 35.75 | | | 15.90 | | | 23.27 | |
| |
| | | | | | | | | | |
| | | |
| Average Annual Total Returns1 as of 12/31/03 | | | | | | | | | |
| | | One Year | | | Five Years | | | Since Inception2 | |
Class A | | 22.29 | % | | 2.32 | % | | 3.80 | % |
| |
Class B | | 22.77 | | | 2.43 | | | 3.81 | |
| |
Class C | | 25.50 | | | 2.40 | | | 3.77 | |
| |
Class Z | | 29.05 | | | 3.63 | | | 5.01 | |
| |
S&P 500 Index3 | | 28.67 | | | –0.57 | | | 1.09 | |
| |
Russell 1000 Index4 | | 29.89 | | | –0.13 | | | 1.51 | |
| |
Lipper Multi-Cap Core Funds Avg.5 | | 29.89 | | | 2.49 | | | 2.87 | |
| |
Past performance is not indicative of future results. Principal value and investment return will fluctuate so that an investor’s shares, when redeemed, may be worth more or less than their original cost. 1Source: Prudential Investments LLC and Lipper Inc. The cumulative total returns do not take into account applicable sales charges. If reflected, the applicable sales charges would reduce the cumulative total return performance quoted. The average annual total returns do take into account applicable sales charges. Without the distribution and service (12b-1) fee waiver of 0.05% for Class A shares, the returns would have been lower. During the period ended January 31, 2004, the Fund charged a maximum front-end sales charge of 5% for Class A shares and a 12b-1 fee of up to 0.30% annually. Effective March 15, 2004, Class A shares are subject to a maximum front-end sales charge of 5.50%, a 12b-1 fee of up to 0.30% annually, and all investors who purchase Class A shares in an amount of $1 million or more and sell these shares within 12 months of purchase are subject to a contingent deferred sales charge (CDSC) of 1%. Class B shares are subject to a declining CDSC of 5%, 4%, 3%, 2%, 1%, and 1% respectively for the first six years after purchase and a 12b-1 fee of 1% annually. Approximately seven years after purchase, Class B shares will automatically convert to Class A shares on a quarterly basis. During the period ended January 31, 2004, Class C shares were subject to a front-end sales charge of 1%, a CDSC of 1% for shares redeemed within 18 months of purchase, and a 12b-1 fee of 1% annually. Class C shares purchased on or after February 2, 2004 are not subject to a front-end sales charge, the CDSC of 1% for Class C shares purchased on or after that date will apply for 12 months from the date of purchase, and the annual 12b-1 fee will remain 1%. Class Z shares are not subject to a sales charge or 12b-1 fee. The returns in the tables do not reflect the
| | |
| 2 | | Visit our website at www.jennisondryden.com |
deduction of taxes that a shareholder would pay on Fund distributions or following the redemption of Fund shares. 2Inception date: 7/1/98. 3 The Standard & Poor’s 500 Composite Stock Price Index (S&P 500 Index) is an unmanaged index of 500 stocks of large U.S. public companies. It gives a broad look at how stock prices in the United States have performed. 4The Russell 1000 Index is an unmanaged index that consists of the 1,000 largest securities in the Russell 3000 Index. 5The Lipper Multi-Cap Core Funds Average (Lipper Average) represents returns based on the average return of all funds in the Lipper Multi-Cap Core Funds category. Funds in the Lipper Multi-Cap Core Funds category invest in a variety of market capitalization ranges without concentrating 75% of their equity assets in any one market-capitalization range over an extended period of time. Multi-cap funds typically have between 25% and 75% of their assets invested in companies with market capitalizations (on a three-year weighted basis) above 300% of the dollar-weighted median market capitalization of the middle 1,000 securities of the S&P SuperComposite 1500 Index. Multi-cap core funds have more latitude in the companies in which they invest. These funds typically have an average price-to-earnings ratio, price-to-book ratio, and three-year sales-per-share growth value compared to the S&P SuperComposite 1500 Index. Investors cannot invest directly in an index. The returns for the S&P 500 Index and the Russell 1000 Index would be lower if they included the effects of sales charges, operating expenses of a mutual fund, or taxes. Returns for the Lipper Average reflect the deduction of operating expenses, but not sales charges or taxes.
| | | |
| |
| Five Largest Growth Holdings expressed as a percentage of net assets as of 1/31/04 | | | |
Agilent Technologies, Inc., Electronic Equipment & Instruments | | 2.9 | % |
| |
American Express Co., Consumer Finance | | 2.8 | |
| |
BJ Services Co., Energy Equipment & Services | | 2.8 | |
| |
General Electric Co., Industrial Conglomerates | | 2.6 | |
| |
Starbucks Corp., Hotels, Restaurants & Leisure | | 2.6 | |
| |
Holdings are subject to change.
| | | |
| |
| Five Largest Value Holdings expressed as a percentage of net assets as of 1/31/04 | | | |
Xerox Corp., Office Electronics | | 4.6 | % |
| |
Schlumberger Ltd., Energy Equipment & Services | | 4.6 | |
| |
Altria Group, Inc., Tobacco | | 3.9 | |
| |
Tyco International Ltd., Industrial Conglomerates | | 3.0 | |
| |
WellPoint Health Networks, Inc., Healthcare Providers & Services | | 2.9 | |
| |
Holdings are subject to change
| | | |
| |
| Five Largest Industries expressed as a percentage of net assets as of 1/31/04 | | | |
Energy Equipment & Services | | 12.7 | % |
| |
Media | | 9.1 | |
| |
Capital Markets | | 9.0 | |
| |
Semiconductors & Semiconductor Equipment | | 6.1 | |
| |
Industrial Conglomerates | | 5.5 | |
| |
Industry weightings are subject to change.
| | |
| Jennison 20/20 Focus Fund | | 3 |
Investment Adviser’s Report
Jennison Associates LLC
Basic strategy and performance overview
The underlying strategy of the Jennison 20/20 Focus Fund is to combine two concentrated portfolios, each managed in a consistent style-specific manner. Our goal is to reduce the volatility that would normally result when a single style is followed through shifting markets. Growth and value stocks in both the Russell 1000 and the S&P 500 Indexes rose substantially over the 12-month period. The Fund produced strong gains over the fiscal year, performing closely in line with the Russell 1000 Index and the Lipper Multi-Cap Core Funds Average. Its growth portfolio outperformed the Russell 1000 Growth Index, while the value portfolio trailed the Russell 1000 Value Index.
Performance review
Growth portfolio. Information technology stocks contributed significantly to the growth portfolio’s return. The largest contribution came from our emphasis in semiconductor and semiconductor equipment stocks, including Intel, Texas Instruments, and KLA-Tencor. Among our other technology holdings, Cisco was a notable contributor. During this reporting period, earnings growth for many of our holdings in this area was primarily a result of cost cutting. We believe that as revenue growth accelerates, these companies should demonstrate impressive operating leverage, leading to upward revisions in analysts’ earnings estimates and earnings that come in above forecasts.
Healthcare stocks were also significant contributors to the portfolio’s returns. Biotechnology holdings such as Amgen and Genentech advanced after a stream of encouraging product developments. Genentech has an impressive pipeline of potential drugs, some of which have passed important regulatory milestones. We expect the company’s exceptional cancer franchise and the continued success of its current product line to generate earnings and revenue growth acceleration. Within pharmaceuticals, AstraZeneca also increased the portfolio’s returns.
The portfolio’s financial holdings performed well, led by capital markets stocks such as Merrill Lynch. American Express’s shares also moved higher alongside an improving outlook for corporate spending and travel as well as favorable developments in the U.S. government’s Visa/Mastercard antitrust case.
Within the consumer-related areas of the portfolio, Starbucks and Tiffany & Co. advanced. These gains, however, were offset by a decline in Kohl’s. We have been disappointed with Kohl’s erratic sales growth, poor inventory control, and store-level execution. We also anticipate difficult targets for same-store sales comparisons over the next several quarters. These concerns led us to eliminate the entire position.
| | |
| 4 | | Visit our website at www.jennisondryden.com |
Value portfolio. The value portfolio’s gains were broad-based; all sectors contributed to performance with the exception of healthcare.
Altria Group, formerly known as Philip Morris, was the portfolio’s top performer as the Illinois State Supreme Court reinstated a reduced bond for the verdict won against Philip Morris by a “light” cigarette smoker class action lawsuit. This bond reduction effectively eliminated the bankruptcy threat emanating from the current legal proceedings and was welcomed by investors.
Xerox, a turnaround story in progress, also performed well as management’s cost cutting has continued to produce positive financial results. Xerox announced increased profit targets for next year (which was warmly greeted by the markets), making further progress in restoring investor confidence following the company’s financial scandals of a few years ago.
On the other hand, among the disappointments was HCA, an international hospital management company that pre-announced unexpectedly negative earnings. Subsequently, the company reported that its earnings were short of expectations due to slow admissions caused by a mild flu season, the loss of two large contracts, and falling outpatient business due to competitive pressures. We took advantage of a rebound in the stock price following the announcement of a large share repurchase (funded by borrowings that we perceived as a negative) to eliminate our position in the company.
Merck, another healthcare holding, was a drag on performance as it had the highly unusual circumstance of having two Phase III clinical trial drugs fail within two weeks of each other. Merck has never had any drugs make it all the way to Phase III without also making it to the market place; this caused many investors to sell the stock.
Looking ahead
Growth perspective. The Fund’s gains for the 12-month period were supported by accelerating profits alongside surging economic activity in the second half of the year. While we believe that the rapid pace of growth in the past two quarters will not likely be repeated, the fundamental drivers for healthy economic activity should remain in place, reinforcing our positive economic outlook and optimistic perspective for equities in 2004. We believe that acceleration in cash flow, revenue, and earnings growth is under way. Just as the market underestimated the impact of declining revenues on profitability two years ago, we believe that we are entering a period when profit estimates will be revised upward to reflect stronger revenue growth.
| | |
| Jennison 20/20 Focus Fund | | 5 |
Value perspective. We believe continued economic growth, albeit at a slower pace than in 2003, will highlight the value of the stocks in our portfolio. Select energy stocks, benefiting from the well-publicized difficulties of the majors, such as Royal Dutch Shell, who are attempting to increase world oil supply, should enter a period of strong pricing not seen in decades. A recovery in business spending and continued restructuring of the old economy have also provided wonderful opportunities in the industrial and basic materials sectors.
The Portfolio of Investments following this report shows the size of the Fund’s positions at period-end.
| | |
| 6 | | Visit our website at www.jennisondryden.com |
Comments on Largest Holdings
| | |
|
| January 31, 2004 | | ANNUAL REPORT |
Jennison 20/20 Focus Fund
Comments on Largest Holdings—Growth Portfolio
Holdings expressed as a percentage of the Fund’s net assets as of 1/31/04.
| 2.9% | Agilent Technologies Inc./Electronic Equipment & Instruments |
Agilent Technologies provides solutions to markets within the communications, electronics, and life sciences industries. It designs and manufactures test, measurement, and monitoring instruments; semiconductor and optical components; and chemical analysis instruments, systems, and services.
| 2.8% | American Express Co./Consumer Finance |
American Express, through its subsidiaries, provides travel-related, financial advisory, and international banking services around the world. Its products include the American Express Card, the Optima Card, and the American Express Travelers Cheque.
| 2.8% | BJ Services Co./Energy Equipment & Services |
BJ Services provides pressure pumping and other oilfield services for the petroleum industry. Its pressure pumping services consist of cementing and stimulation services used in the completion of new oil and natural gas wells, and in remedial work on existing wells, both onshore and offshore. Other services include product and equipment sales and inspection.
| 2.6% | General Electric Co./Industrial Conglomerates |
General Electric develops, manufactures, and markets products for the generation, distribution, and utilization of electricity. Through General Electric Capital Services, Inc., it offers a variety of financial services, including mutual fund management, financing, asset management, and insurance. General Electric also owns the National Broadcasting Company.
| 2.6% | Starbucks Corp./Hotels, Restaurants & Leisure |
Starbucks retails, roasts, and provides its own brand of specialty coffee. It operates retail locations worldwide and sells whole bean coffees through its sales group, direct response business, supermarkets, and on the World Wide Web. Starbucks also produces and sells bottled Frappuccino coffee drinks and a line of ice creams.
Holdings are subject to change.
| | |
| 8 | | Visit our website at www.jennisondryden.com |
Comments on Largest Holdings—Value Portfolio
Holdings expressed as a percentage of the Fund’s net assets as of 1/31/04.
| 4.6% | Xerox Corp./Office Electronics |
Xerox Corporation develops, manufactures, markets, services, and finances a range of document processing products and services for use in offices around the world. It also, through subsidiaries, provides network management, consulting, design, and integration services for medium and large companies.
| 4.6% | Schlumberger Ltd./Energy Equipment & Services |
Schlumberger is an oil services company consisting of two business segments. Schlumberger Oilfield Services provides technology, project management, and information solutions to the international petroleum industry. WesternGeco, which is jointly owned by Baker Hughes, is a seismic company that provides advanced acquisition and data processing surveys.
| 3.9% | Altria Group, Inc./Tobacco |
Altria Group is the parent company of Kraft Foods, Philip Morris International, Philip Morris USA, and Philip Morris Capital Corporation. It is also a shareholder in the brewer, SABMiller plc. Altria’s brands include Marlboro cigarettes, Oreo cookies, Kraft cheeses, Maxwell House coffee, Nabisco crackers, and Philadelphia cream cheese.
| 3.0% | Tyco International Ltd./Industrial Conglomerates |
Tyco International is a diversified manufacturing and service company with operations around the world. It manufactures, services, and installs electrical and electronic components, undersea telecommunications systems, fire protection and security systems, flow control valves, healthcare products, and specialty products.
| 2.9% | WellPoint Health Networks, Inc./Healthcare Providers & Services |
WellPoint Health Networks is a managed care company that serves members through Blue Cross of California, Blue Cross and Blue Shield of Georgia, Blue Cross and Blue Shield of Missouri, and UNICARE. It offers products such as health maintenance organizations, preferred provider organizations, and point of service plans, as well as specialty managed care products.
Holdings are subject to change.
| | |
| Jennison 20/20 Focus Fund | | 9 |
This Page Intentionally Left Blank
Portfolio of Investments
as of January 31, 2004
| | | | | |
| Shares | | Description | | Value (Note 1) |
| | | | | | |
LONG-TERM INVESTMENTS 98.8% | | | |
| |
COMMON STOCKS 96.0% | | | |
| |
Aerospace & Defense 2.7% | | | |
|
| 174,900 | | Northrop Grumman Corp. | | $ | 16,914,579 |
| |
Biotechnology 3.8% | | | |
|
| 13,900 | | Eyetech Pharmaceuticals, Inc.(a) | | | 450,360 |
| 143,800 | | Genentech, Inc.(a) | | | 13,732,900 |
| 185,900 | | Gilead Sciences, Inc.(a) | | | 10,200,333 |
| | | | |
|
|
| | | | | | 24,383,593 |
| |
Capital Markets 9.0% | | | |
|
| 415,400 | | J. P. Morgan Chase & Co. | | | 16,154,906 |
| 172,200 | | Lehman Brothers Holdings, Inc. | | | 14,137,620 |
| 256,700 | | Merrill Lynch & Co., Inc. | | | 15,091,393 |
| 220,700 | | State Street Corp. | | | 11,884,695 |
| | | | |
|
|
| | | | | | 57,268,614 |
| |
Communications Equipment 2.4% | | | |
|
| 606,000 | | Cisco Systems, Inc.(a) | | | 15,537,840 |
| |
Computers & Peripherals 2.4% | | | |
|
| 652,300 | | Hewlett-Packard Co. | | | 15,518,217 |
| |
Consumer Finance 2.8% | | | |
|
| 348,700 | | American Express Co. | | | 18,076,608 |
| |
Diversified Financial Services 4.0% | | | |
|
| 315,500 | | Citigroup, Inc. | | | 15,610,940 |
| 289,400 | | Principal Financial Group, Inc. | | | 10,042,180 |
| | | | |
|
|
| | | | | | 25,653,120 |
| |
Diversified Telecommunication 1.7% | | | |
|
| 421,400 | | SBC Communications, Inc. | | | 10,745,700 |
| |
Electronic Equipment & Instruments 2.9% | | | |
|
| 492,000 | | Agilent Technologies, Inc.(a) | | | 18,135,120 |
| |
Energy Equipment & Services 12.7% | | | |
|
| 446,400 | | BJ Services Co.(a) | | | 17,472,096 |
| 560,700 | | ENSCO International, Inc. | | | 15,979,950 |
| 476,100 | | Schlumberger, Ltd. | | | 29,127,798 |
| 368,400 | | Smith International, Inc.(a) | | | 17,852,664 |
| | | | |
|
|
| | | | | | 80,432,508 |
See Notes to Financial Statements.
| | |
| Jennison 20/20 Focus Fund | | 11 |
Portfolio of Investments
as of January 31, 2004 Cont’d.
| | | | | |
| Shares | | Description | | Value (Note 1) |
| | | | | | |
Food & Staples Retailing 2.7% | | | |
|
| 920,500 | | The Kroger Co.(a) | | $ | 17,056,865 |
| |
Healthcare Providers & Services 2.9% | | | |
|
| 172,700 | | WellPoint Health Networks, Inc.(a) | | | 18,133,500 |
| |
Hotels, Restaurants & Leisure 2.6% | | | |
|
| 441,800 | | Starbucks Corp.(a) | | | 16,240,568 |
| |
Industrial Conglomerates 5.5% | | | |
|
| 483,700 | | General Electric Co. | | | 16,266,831 |
| 707,500 | | Tyco International Ltd. (Bermuda) | | | 18,925,625 |
| | | | |
|
|
| | | | | | 35,192,456 |
| |
Insurance 4.6% | | | |
|
| 250,900 | | Allstate Corp. | | | 11,405,914 |
| 219,600 | | XL Capital Ltd. (Cayman Islands) (Class A) | | | 17,458,200 |
| | | | |
|
|
| | | | | | 28,864,114 |
| |
Media 6.3% | | | |
|
| 1,407,200 | | Liberty Media Corp. (Class A)(a) | | | 16,379,808 |
| 327,300 | | Univision Communications, Inc. (Class A)(a) | | | 11,576,601 |
| 292,000 | | Viacom, Inc. (Class B) | | | 11,767,600 |
| | | | |
|
|
| | | | | | 39,724,009 |
| |
Office Electronics 4.6% | | | |
|
| 1,989,900 | | Xerox Corp.(a) | | | 29,132,136 |
| |
Paper & Forest Products 4.2% | | | |
|
| 397,700 | | Boise Cascade Corp. | | | 12,905,365 |
| 494,900 | | Georgia-Pacific Corp. | | | 13,906,690 |
| | | | |
|
|
| | | | | | 26,812,055 |
| |
Pharmaceuticals 4.1% | | | |
|
| 241,500 | | Novartis AG (Switzerland) (ADR)(a) | | | 10,903,725 |
| 415,600 | | Pfizer, Inc. | | | 15,223,428 |
| | | | |
|
|
| | | | | | 26,127,153 |
| |
Semiconductors & Semiconductor Equipment 6.1% | | | |
|
| 476,900 | | Intel Corp. | | | 14,593,140 |
| 174,100 | | International Rectifier Corp.(a) | | | 8,809,460 |
| 480,800 | | Texas Instruments, Inc. | | | 15,073,080 |
| | | | |
|
|
| | | | | | 38,475,680 |
See Notes to Financial Statements.
| | |
| 12 | | Visit our website at www.jennisondryden.com |
| | | | | | |
| Shares | | Description | | Value (Note 1) | |
| | | | | | | |
Software 2.0% | | | | |
| |
| 277,000 | | Electronic Arts, Inc.(a) | | $ | 12,980,220 | |
| |
Specialty Retail 2.1% | | | | |
| |
| 332,100 | | Tiffany & Co. | | | 13,164,444 | |
| |
Tobacco 3.9% | | | | |
| |
| 447,400 | | Altria Group, Inc. | | | 24,870,966 | |
| | | | |
|
|
|
| | | Total common stocks
(cost $508,775,838) | | | 609,440,065 | |
| | | | |
|
|
|
PREFERRED STOCK 2.8% | | | | |
| |
Media | | | | |
| |
| | | News Corp. Ltd. (Australia) (ADR)(a) | | | | |
| 550,400 | | (cost $11,268,516) | | | 17,645,824 | |
| | | | |
|
|
|
| | | Total long-term investments
(cost $520,044,354) | | | 627,085,889 | |
| | | | |
|
|
|
SHORT-TERM INVESTMENT 2.4% | | | | |
| |
Mutual Fund | | | | |
| |
| | | Dryden Core Investment Fund - Taxable Money Market Series | | | | |
| 14,931,216 | | (cost $14,931,216; Note 3) | | | 14,931,216 | |
| | | | |
|
|
|
| | | Total Investments 101.2%
(cost $534,975,570; Note 5) | | | 642,017,105 | |
| | | Liabilities in excess of other assets (1.2%) | | | (7,604,823 | ) |
| | | | |
|
|
|
| | | Net Assets 100% | | $ | 634,412,282 | |
| | | | |
|
|
|
| (a) | Non-income producing security. |
ADR—American Depositary Receipt.
See Notes to Financial Statements.
| | |
| Jennison 20/20 Focus Fund | | 13 |
Statement of Assets and Liabilities
as of January 31, 2004
| | | | |
Assets | | | | |
| |
Investments, at value (cost $534,975,570) | | $ | 642,017,105 | |
Cash | | | 91,754 | |
Receivable for investments sold | | | 8,354,867 | |
Receivable for Fund shares sold | | | 394,150 | |
Dividends receivable | | | 316,330 | |
Prepaid expenses | | | 5,573 | |
| | |
|
|
|
Total assets | | | 651,179,779 | |
| | |
|
|
|
| |
Liabilities | | | | |
| |
Payable for investments purchased | | | 14,282,706 | |
Payable for Fund shares reacquired | | | 1,403,178 | |
Distribution fee payable | | | 408,785 | |
Management fee payable | | | 407,202 | |
Accrued expenses | | | 265,626 | |
| | |
|
|
|
Total liabilities | | | 16,767,497 | |
| | |
|
|
|
| |
Net Assets | | $ | 634,412,282 | |
| | |
|
|
|
| | | | | |
| |
Net assets were comprised of: | | | | |
Shares of beneficial interest, at par | | $ | 59,766 | |
Paid-in capital in excess of par | | | 669,015,699 | |
| | |
|
|
|
| | | | 669,075,465 | |
Accumulated net realized loss on investments | | | (141,704,718 | ) |
Net unrealized appreciation on investments | | | 107,041,535 | |
| | |
|
|
|
Net assets, January 31, 2004 | | $ | 634,412,282 | |
| | |
|
|
|
See Notes to Financial Statements.
| | |
| 14 | | Visit our website at www.jennisondryden.com |
| | | |
Class A | | | |
|
Net asset value and redemption price per share
($186,860,724 ÷ 17,089,012 shares of beneficial interest issued and outstanding) | | $ | 10.93 |
Maximum sales charge (5% of offering price) | | | 0.58 |
| | |
|
|
Maximum offering price to public | | $ | 11.51 |
| | |
|
|
| |
Class B | | | |
|
Net asset value, offering price and redemption price per share
($360,188,831 ÷ 34,406,953 shares of beneficial interest issued and outstanding) | | $ | 10.47 |
| | |
|
|
| |
Class C | | | |
|
Net asset value and redemption price per share
($72,779,007 ÷ 6,952,198 shares of beneficial interest issued and outstanding) | | $ | 10.47 |
Sales charge (1% of offering price) | | | 0.11 |
| | |
|
|
Offering price to public | | $ | 10.58 |
| | |
|
|
| |
Class Z | | | |
|
Net asset value, offering price and redemption price per share
($14,583,720 ÷ 1,317,449 shares of beneficial interest issued and outstanding) | | $ | 11.07 |
| | |
|
|
See Notes to Financial Statements.
| | |
| Jennison 20/20 Focus Fund | | 15 |
Statement of Operations
Year Ended January 31, 2004
| | | | |
Net Investment Loss | | | | |
| |
Income | | | | |
Dividends (net of foreign withholding taxes of $22,217) | | $ | 6,983,770 | |
| | |
|
|
|
| |
Expenses | | | | |
Management fee | | | 4,399,132 | |
Distribution fee—Class A | | | 406,882 | |
Distribution fee—Class B | | | 3,297,345 | |
Distribution fee—Class C | | | 674,878 | |
Transfer agent’s fees and expenses | | | 1,250,000 | |
Custodian’s fees and expenses | | | 173,000 | |
Reports to shareholders | | | 52,000 | |
Registration fees | | | 22,000 | |
Audit fee | | | 17,000 | |
Trustees’ fees | | | 17,000 | |
Legal fees and expenses | | | 12,000 | |
Miscellaneous | | | 19,745 | |
| | |
|
|
|
Total expenses | | | 10,340,982 | |
| | |
|
|
|
Net investment loss | | | (3,357,212 | ) |
| | |
|
|
|
| |
Realized And Unrealized Gain On Investments | | | | |
| |
Net realized gain on investment transactions | | | 34,723,532 | |
Net change in unrealized appreciation on investments | | | 145,890,125 | |
| | |
|
|
|
Net gain on investments | | | 180,613,657 | |
| | |
|
|
|
Net Increase In Net Assets Resulting From Operations | | $ | 177,256,445 | |
| | |
|
|
|
See Notes to Financial Statements.
| | |
| 16 | | Visit our website at www.jennisondryden.com |
Statement of Changes in Net Assets
| | | | | | | | |
| |
| | | Year Ended January 31,
| |
| | | 2004 | | | 2003 | |
Increase (Decrease) In Net Assets | | | | | | | | |
| |
Operations | | | | | | | | |
Net investment loss | | $ | (3,357,212 | ) | | $ | (5,143,143 | ) |
Net realized gain (loss) on investments | | | 34,723,532 | | | | (91,413,260 | ) |
Net change in unrealized appreciation (depreciation) on investments | | | 145,890,125 | | | | (98,810,332 | ) |
| | |
|
|
| |
|
|
|
Net increase (decrease) in net assets resulting from operations | | | 177,256,445 | | | | (195,366,735 | ) |
| | |
|
|
| |
|
|
|
| | |
Fund share transactions (net of share conversions) (Note 6) | | | | | | | | |
Proceeds from shares sold | | | 54,030,421 | | | | 84,658,401 | |
Cost of shares reacquired | | | (149,266,685 | ) | | | (197,058,497 | ) |
| | |
|
|
| |
|
|
|
Net decrease in net assets from Fund share transactions | | | (95,236,264 | ) | | | (112,400,096 | ) |
| | |
|
|
| |
|
|
|
Total increase (decrease) | | | 82,020,181 | | | | (307,766,831 | ) |
| | |
Net Assets | | | | | | | | |
| |
Beginning of year | | | 552,392,101 | | | | 860,158,932 | |
| | |
|
|
| |
|
|
|
End of year | | $ | 634,412,282 | | | $ | 552,392,101 | |
| | |
|
|
| |
|
|
|
See Notes to Financial Statements.
| | |
| Jennison 20/20 Focus Fund | | 17 |
Notes to Financial Statements
Jennison 20/20 Focus Fund (the “Fund”), formerly known as the Prudential 20/20 Focus Fund, is registered under the Investment Company Act of 1940 as a non-diversified, open-end management investment company. The investment objective of the Fund is long-term growth of capital. The Fund normally invests at least 80% of its total assets in up to 40 equity-related securities of U.S. companies that are selected by the Fund’s two portfolio managers (up to 20 by each) as having strong capital appreciation potential.
Note 1. Accounting Policies
The following is a summary of significant accounting policies followed by the Fund in the preparation of its financial statements.
Securities Valuation: Securities listed on a securities exchange are valued at the last sale price on such exchange on the day of valuation or, if there was no sale on such day, at the mean between the last reported bid and asked prices, or at the last bid price on such day in the absence of an asked price. Securities that are actively traded via Nasdaq are valued at the official closing price as provided by Nasdaq. Securities traded in the over-the-counter market, including listed securities for which the primary market is believed by Prudential Investments LLC (“PI” or “Manager”) in consultation with the subadviser, to be over-the-counter, are valued at market value using prices provided by an independent pricing agent or principal market maker. Securities for which market quotations are not readily available, or whose values have been affected by events occurring after the close of the security’s foreign market and before the Fund’s normal pricing time, are valued at fair value in accordance with the Board of Trustees’ approved fair valuation procedures.
Investments in mutual funds are valued at their net asset value as of the close of the New York Stock Exchange on the date of valuation.
Short-term securities which mature in sixty days or less are valued at amortized cost, which approximates market value. The amortized cost method involves valuing a security at its cost on the date of purchase and thereafter assuming a constant amortization to maturity of the difference between the principal amount due at maturity and cost. Short-term securities which mature in more than sixty days are valued at current market quotations.
Securities Transactions and Net Investment Income: Securities transactions are recorded on the trade date. Realized and unrealized gains and losses from security and currency transactions are calculated on the identified cost basis. Dividend
| | |
| 18 | | Visit our website at www.jennisondryden.com |
income is recorded on the ex-dividend date. Interest income, including amortization of premium and accretion of discount on debt securities, as required, is recorded on the accrual basis.
Net investment income or loss (other than distribution fees which are charged directly to the respective class) and unrealized and realized gains or losses are allocated daily to each class of shares based upon the relative proportion of net assets of each class at the beginning of the day.
Dividends and Distributions: The Fund expects to pay dividends of net investment income semi-annually and distributions of net realized capital gains, if any, annually. Dividends and distributions to shareholders, which are determined in accordance with federal income tax regulations which may differ from generally accepted accounting principles, are recorded on the ex-dividend date. Permanent book/tax differences relating to income and gains are reclassified amongst undistributed net investment income, accumulated net realized gain or loss and paid-in capital in excess of par as appropriate.
Taxes: It is the Fund’s policy to continue to meet the requirements of the Internal Revenue Code applicable to regulated investment companies and to distribute all of its taxable net investment income and capital gains, if any, to its shareholders. Therefore, no federal income tax provision is required.
Withholding taxes on foreign dividends are recorded net of receivable amounts, at the time the related income is earned.
Estimates: The preparation of the financial statements requires management to make estimates and assumptions that affect the reported amounts and disclosures in the financial statements. Actual results could differ from those estimates.
Note 2. Agreements
The Fund has a management agreement with PI. Pursuant to this agreement, PI has responsibility for all investment advisory services and supervises the subadviser’s performance of such services. PI has entered into a subadvisory agreement with Jennison Associates LLC (“Jennison”). The subadvisory agreement provides that Jennison furnishes investment advisory services in connection with the management of the Fund. In connection therewith, Jennison is obligated to keep certain books and records of the Fund. PI pays for the services of Jennison, the cost of compensation of
| | |
| Jennison 20/20 Focus Fund | | 19 |
Notes to Financial Statements
Cont’d
officers, occupancy and certain clerical and bookkeeping costs of the Fund. The Fund bears all other costs and expenses.
The management fee paid to PI is accrued daily and payable monthly, at an annual rate of .75 of 1% of the Fund’s average daily net assets up to and including $1 billion and .70 of 1% of such average daily net assets in excess of $1 billion.
Each of the two Jennison portfolio managers manages approximately 50% of the Fund’s assets. In general, in order to maintain an approximately equal division of assets between the two portfolio managers, all daily cash inflows (i.e. subscriptions and reinvested distributions) and outflows (i.e. redemptions and expense items) are divided between the two portfolio managers as PI deems appropriate. In addition, periodic rebalancing of the portfolio’s assets may occur to account for market fluctuations in order to maintain an approximately equal allocation between the two portfolio managers.
The Fund has a distribution agreement with Prudential Investment Management Services LLC (“PIMS”), which acts as the distributor of the Class A, Class B, Class C and Class Z shares of the Fund. The Fund compensates PIMS for distributing and servicing the Fund’s Class A, Class B and Class C shares, pursuant to plans of distribution (the “Class A, B and C Plans”), regardless of expenses actually incurred by PIMS. The distribution fees are accrued daily and payable monthly. No distribution or service fees are paid to PIMS as distributor of the Class Z shares of the Fund.
Pursuant to the Class A, B and C Plans, the Fund compensates PIMS for distribution-related activities at an annual rate of up to .30 of 1%, 1% and 1% of the average daily net assets of the Class A, B and C shares, respectively. For the year ended January 31, 2004, PIMS has contractually agreed to limit such expenses to .25 of 1% of the average daily net assets of the Class A shares.
PIMS has advised the Fund that it has received approximately $120,600 and $36,100 in front-end sales charges resulting from sales of Class A and Class C shares, respectively, during the year ended January 31, 2004. From these fees, PIMS paid such sales charges to broker-dealers, which in turn paid commissions to salespersons and incurred other distribution costs.
| | |
| 20 | | Visit our website at www.jennisondryden.com |
PIMS has advised the Fund that it has received approximately $596,100 and $15,600 in contingent deferred sales charges imposed upon certain redemptions by Class B and Class C shareholders, respectively, during the year ended January 31, 2004.
PI, PIMS and Jennison are indirect, wholly-owned subsidiaries of Prudential Financial, Inc. (“Prudential”).
The Fund, along with other affiliated registered investment companies (the “Funds”), is a party to a syndicated credit agreement (“SCA”) with a group of banks. The SCA provides for a commitment of $800 million and allows the Funds to increase the commitment to $1 billion, if necessary. Interest on any borrowings will be incurred at market rates. The Funds pay a commitment fee of .08 of 1% of the unused portion of the SCA. The commitment fee is accrued daily and paid quarterly and is allocated to the Funds pro rata based on net assets. The purpose of the SCA is to serve as an alternative source of funding for capital share redemptions. The expiration date of the SCA was May 2, 2003. On May 2, 2003, the SCA was renewed under the same terms and conditions (“May 2003 renewal”). The expiration date of the May 2003 renewal is April 30, 2004. The Fund did not borrow any amounts pursuant to the SCA during the year ended January 31, 2004.
Note 3. Other Transactions With Affiliates
Prudential Mutual Fund Services LLC (“PMFS”), an affiliate of PI and an indirect, wholly-owned subsidiary of Prudential, serves as the Fund’s transfer agent. During the year ended January 31, 2004, the Fund incurred fees of approximately $957,000 for the services of PMFS. As of January 31, 2004, approximately $75,900 of such fees were due to PMFS. Transfer agent’s fees and expenses in the Statement of Operations include certain out-of-pocket expenses paid to non-affiliates, where applicable.
The Fund pays networking fees to affiliated and unaffiliated broker/dealers. These networking fees are payments made to broker/dealers that clear mutual fund transactions through a national clearing system. The Fund incurred approximately $149,100 in total networking fees, of which the amount relating to the services of Wachovia Securities, LLC (“Wachovia”) and Prudential Securities, Inc. (“PSI”), affiliates of PI, was approximately $138,700 for the year ended January 31, 2004. Effective July 1, 2003 Prudential and Wachovia Corp. formed a joint venture (“Wachovia Securities, LLC”) whereby Prudential and Wachovia Corp. combined their brokerage businesses with Prudential holding a minority interest. Prior to July 1, 2003, PSI was an indirect, wholly-owned subsidiary of Prudential. As of January 31,
| | |
| Jennison 20/20 Focus Fund | | 21 |
Notes to Financial Statements
Cont’d
2004, approximately $11,600 of such fees were due to Wachovia. These amounts are included in transfer agent’s fees and expenses in the Statement of Operations.
The Fund invests in the Taxable Money Market Series (the “Series”), a portfolio of Dryden Core Investment Fund, formerly Prudential Core Investment Fund, pursuant to an exemptive order received from the Securities and Exchange Commission. The Series is a money market mutual fund registered under the Investment Company Act of 1940, as amended, and managed by PI. During the year ended January 31, 2004, the Fund earned dividend income of approximately $194,900 from the Series by investing its excess cash.
Note 4. Portfolio Securities
Purchases and sales of investment securities, other than short-term investments, for the year ended January 31, 2004 aggregated $598,766,157 and $688,682,727, respectively.
Note 5. Distributions and Tax Information
In order to present undistributed net investment income or loss and accumulated net realized gain or loss on the Statement of Assets and Liabilities that more closely represent their tax character, certain adjustments have been made to paid-in capital in excess of par, undistributed net investment income or loss and accumulated net realized gain or loss on investments. For the year ended January 31, 2004, the adjustments were to increase undistributed net investment income and decrease paid-in-capital in excess of par by $3,357,212 due to a net operating loss. Net investment income, net realized losses and net assets were not affected by this change.
The United States federal income tax basis of the Fund’s investments and the unrealized appreciation as of January 31, 2004 were as follows:
| | | | | | |
Tax Basis of Investments
| | Appreciation
| | Depreciation
| | Net Unrealized
Appreciation
|
| $545,689,523 | | $106,192,518 | | $9,864,936 | | $96,327,582 |
The difference between book basis and tax basis is attributable to deferred losses on wash sales.
| | |
| 22 | | Visit our website at www.jennisondryden.com |
As of January 31, 2004, the Fund had no undistributed ordinary income or long-term capital gains on a tax basis.
For federal income tax purposes, the Fund had a capital loss carryforward at January 31, 2004, of approximately $130,991,000 of which $61,683,000 expires in 2010 and $69,308,000 expires in 2011. During the year ended January 31, 2004, the Fund utilized approximately $9,758,000 of its prior year capital loss carryforward. Accordingly, no capital gains distributions are expected to be paid to shareholders until net gains have been realized in excess of such carryforward.
Note 6. Capital
The Fund offers Class A, Class B, Class C and Class Z shares. For the year ended January 31, 2004, Class A shares were sold with a front-end sales charge of up to 5%. Class A shares purchased on or after March 15, 2004 are subject to a maximum front-end sales charge of up to 5.50%. Effective on March 15, 2004, all investors who purchase Class A shares in an amount of $1 million or more and sell these shares within 12 months of purchase are subject to a contingent deferred sales charge (CDSC) of 1%, including investors who purchase their shares through broker-dealers affiliated with Prudential. Class B shares are sold with a CDSC which declines from 5% to zero depending on the period of time the shares are held. For the year ended January 31, 2004, Class C shares were sold with a front-end sales charge of 1% and a CDSC of 1% during the first 18 months. Class C shares purchased on or after February 2, 2004 are not subject to a front-end sales charge and have a CDSC of 1% during the first 12 months. Class B shares automatically convert to Class A shares on a quarterly basis approximately seven years after purchase. Class Z shares are not subject to any sales or redemption charge and are offered exclusively for sale to a limited group of investors.
There is an unlimited number of shares of beneficial interest, $.001 par value per share, divided into four classes, designated Class A, Class B, Class C and Class Z.
| | |
| Jennison 20/20 Focus Fund | | 23 |
Notes to Financial Statements
Cont’d
Transactions in shares of beneficial interest were as follows:
| | | | | | | |
Class A
| | Shares
| | | Amount
| |
Year ended January 31, 2004: | | | | | | | |
Shares sold | | 2,481,505 | | | $ | 23,429,700 | |
Shares reacquired | | (4,480,643 | ) | | | (41,125,394 | ) |
| | |
|
| |
|
|
|
Net increase (decrease) in shares outstanding before conversion | | (1,999,138 | ) | | | (17,695,694 | ) |
Shares issued upon conversion from Class B | | 739,270 | | | | 6,715,937 | |
| | |
|
| |
|
|
|
Net increase (decrease) in shares outstanding | | (1,259,868 | ) | | $ | (10,979,757 | ) |
| | |
|
| |
|
|
|
Year ended January 31, 2003: | | | | | | | |
Shares sold | | 3,384,999 | | | $ | 31,181,882 | |
Shares reacquired | | (6,394,169 | ) | | | (58,526,093 | ) |
| | |
|
| |
|
|
|
Net increase (decrease) in shares outstanding before conversion | | (3,009,170 | ) | | | (27,344,211 | ) |
Shares issued upon conversion from Class B | | 767,710 | | | | 7,154,645 | |
| | |
|
| |
|
|
|
Net increase (decrease) in shares outstanding | | (2,241,460 | ) | | $ | (20,189,566 | ) |
| | |
|
| |
|
|
|
Class B
| | | | | | |
Year ended January 31, 2004: | | | | | | | |
Shares sold | | 1,927,731 | | | $ | 17,145,906 | |
Shares reacquired | | (7,025,884 | ) | | | (61,821,879 | ) |
| | |
|
| |
|
|
|
Net increase (decrease) in shares outstanding before conversion | | (5,098,153 | ) | | | (44,675,973 | ) |
Shares reacquired upon conversion into Class A | | (768,747 | ) | | | (6,715,937 | ) |
| | |
|
| |
|
|
|
Net increase (decrease) in shares outstanding | | (5,866,900 | ) | | $ | (51,391,910 | ) |
| | |
|
| |
|
|
|
Year ended January 31, 2003: | | | | | | | |
Shares sold | | 3,296,891 | | | $ | 30,063,435 | |
Shares reacquired | | (10,974,511 | ) | | | (95,853,507 | ) |
| | |
|
| |
|
|
|
Net increase (decrease) in shares outstanding before conversion | | (7,677,620 | ) | | | (65,790,072 | ) |
Shares reacquired upon conversion into Class A | | (792,584 | ) | | | (7,154,645 | ) |
| | |
|
| |
|
|
|
Net increase (decrease) in shares outstanding | | (8,470,204 | ) | | $ | (72,944,717 | ) |
| | |
|
| |
|
|
|
Class C
| | | | | | |
Year ended January 31, 2004: | | | | | | | |
Shares sold | | 666,631 | | | $ | 5,932,162 | |
Shares reacquired | | (2,012,964 | ) | | | (17,790,915 | ) |
| | |
|
| |
|
|
|
Net increase (decrease) in shares outstanding | | (1,346,333 | ) | | $ | (11,858,753 | ) |
| | |
|
| |
|
|
|
Year ended January 31, 2003: | | | | | | | |
Shares sold | | 1,220,231 | | | $ | 11,053,913 | |
Shares reacquired | | (2,735,098 | ) | | | (23,792,906 | ) |
| | |
|
| |
|
|
|
Net increase (decrease) in shares outstanding | | (1,514,867 | ) | | $ | (12,738,993 | ) |
| | |
|
| |
|
|
|
| | |
| 24 | | Visit our website at www.jennisondryden.com |
| | | | | | | |
Class Z
| | Shares
| | | Amount
| |
Year ended January 31, 2004: | | | | | | | |
Shares sold | | 809,876 | | | $ | 7,522,653 | |
Shares reacquired | | (2,841,068 | ) | | | (28,528,497 | ) |
| | |
|
| |
|
|
|
Net increase (decrease) in shares outstanding | | (2,031,192 | ) | | $ | (21,005,844 | ) |
| | |
|
| |
|
|
|
Year ended January 31, 2003: | | | | | | | |
Shares sold | | 1,311,040 | | | $ | 12,359,171 | |
Shares reacquired | | (2,039,447 | ) | | | (18,885,991 | ) |
| | |
|
| |
|
|
|
Net increase (decrease) in shares outstanding | | (728,407 | ) | | $ | (6,526,820 | ) |
| | |
|
| |
|
|
|
Note 7. Change in Independent Auditors
PricewaterhouseCoopers LLP was previously the independent auditors for the Fund. The decision to change the independent auditors was approved by the Audit Committee and by the Board of Trustees in a meeting held on September 2, 2003, resulting in KPMG LLP’s appointment as independent auditors of the Fund.
The reports on the financial statements of the Fund audited by PricewaterhouseCoopers LLP through the year ended January 31, 2003 did not contain an adverse opinion or disclaimer of opinion, and were not qualified or modified as to uncertainty, audit scope or accounting principles. There were no disagreements between the Fund and PricewaterhouseCoopers LLP on any matter of accounting principles or practices, financial statement disclosure, or auditing scope or procedures.
| | |
| Jennison 20/20 Focus Fund | | 25 |
Financial Highlights
| | | | |
| |
| | | Class A
| |
| | | Year Ended January 31, 2004(b) | |
| |
Per Share Operating Performance: | | | | |
Net Asset Value, Beginning Of Year | | $ | 8.05 | |
| | |
|
|
|
Income (loss) from investment operations: | | | | |
Net investment income (loss) | | | (.01 | ) |
Net realized and unrealized gain (loss) on investments and foreign currencies | | | 2.89 | |
| | |
|
|
|
Total from investment operations | | | 2.88 | |
| | |
|
|
|
Less distributions | | | | |
Distributions from net realized gains | | | — | |
| | |
|
|
|
Net asset value, end of year | | $ | 10.93 | |
| | |
|
|
|
Total Return(a): | | | 35.78 | % |
Ratios/Supplemental Data: | | | | |
Net assets, end of year (000) | | $ | 186,861 | |
Average net assets (000) | | $ | 162,753 | |
Ratios to average net assets: | | | | |
Expenses, including distribution fee and service (12b-1) fees(c) | | | 1.27 | % |
Expenses, excluding distribution fee and service (12b-1) fees | | | 1.02 | % |
Net investment income (loss) | | | (.08 | )% |
For Class A, B, C and Z shares: | | | | |
Portfolio turnover rate | | | 105 | % |
| (a) | Total return does not consider the effects of sales loads. Total return is calculated assuming a purchase of shares on the first day and a sale on the last day of each year reported and includes reinvestment of dividends and distributions. |
| (b) | Calculations are based on average shares outstanding during the year. |
| (c) | During each year, the Distributor of the Fund contractually agreed to limit its distribution and service (12b-1) fees to .25 of 1% of the average daily net assets of the Class A shares. |
See Notes to Financial Statements.
| | |
| 26 | | Visit our website at www.jennisondryden.com |
| | | | | | | | | | | | | | |
|
| Class A | |
|
| Year Ended January 31, | |
|
| 2003(b) | | | 2002(b) | | | 2001 | | | 2000(b) | |
| |
| | | | | | | | | | | | | | | |
| $ | 10.54 | | | $ | 12.06 | | | $ | 13.18 | | | $ | 11.49 | |
|
|
| |
|
|
| |
|
|
| |
|
|
|
| | | | | | | | | | | | | | | |
| | (.02 | ) | | | .02 | | | | (.02 | ) | | | (.01 | ) |
| | (2.47 | ) | | | (1.25 | ) | | | .24 | | | | 2.30 | |
|
|
| |
|
|
| |
|
|
| |
|
|
|
| | (2.49 | ) | | | (1.23 | ) | | | .22 | | | | 2.29 | |
|
|
| |
|
|
| |
|
|
| |
|
|
|
| | | | | | | | | | | | | | | |
| | — | | | | (.29 | ) | | | (1.34 | ) | | | (.60 | ) |
|
|
| |
|
|
| |
|
|
| |
|
|
|
| $ | 8.05 | | | $ | 10.54 | | | $ | 12.06 | | | $ | 13.18 | |
|
|
| |
|
|
| |
|
|
| |
|
|
|
| | (23.62 | )% | | | (10.43 | )% | | | 2.66 | % | | | 20.07 | % |
| | | | | | | | | | | | | | | |
| $ | 147,783 | | | $ | 217,075 | | | $ | 254,767 | | | $ | 270,027 | |
| $ | 179,093 | | | $ | 225,662 | | | $ | 265,240 | | | $ | 205,515 | |
| | | | | | | | | | | | | | | |
| | 1.31 | % | | | 1.27 | % | | | 1.18 | % | | | 1.20 | % |
| | 1.06 | % | | | 1.02 | % | | | .93 | % | | | .95 | % |
| | (.23 | )% | | | .15 | % | | | (.12 | )% | | | (.10 | )% |
| | | | | | | | | | | | | | | |
| | 62 | % | | | 119 | % | | | 157 | % | | | 105 | % |
See Notes to Financial Statements.
| | |
| Jennison 20/20 Focus Fund | | 27 |
Financial Highlights
Cont’d
| | | | |
| |
| | | Class B
| |
| | | Year Ended January 31, 2004(b) | |
| |
Per Share Operating Performance: | | | | |
Net Asset Value, Beginning Of Year | | $ | 7.77 | |
| | |
|
|
|
Income (loss) from investment operations: | | | | |
Net investment loss | | | (.07 | ) |
Net realized and unrealized gain (loss) on investments and foreign currencies | | | 2.77 | |
| | |
|
|
|
Total from investment operations | | | 2.70 | |
| | |
|
|
|
Less distributions | | | | |
Distributions from net realized gains | | | — | |
| | |
|
|
|
Net asset value, end of year | | $ | 10.47 | |
| | |
|
|
|
Total Return(a): | | | 34.75 | % |
Ratios/Supplemental Data: | | | | |
Net assets, end of year (000) | | $ | 360,189 | |
Average net assets (000) | | $ | 329,735 | |
Ratios to average net assets: | | | | |
Expenses, including distribution and service (12b-1) fees | | | 2.02 | % |
Expenses, excluding distribution and service (12b-1) fees | | | 1.02 | % |
Net investment loss | | | (.83 | )% |
| (a) | Total return does not consider the effects of sales loads. Total return is calculated assuming a purchase of shares on the first day and a sale on the last day of each year reported and includes reinvestment of dividends and distributions. |
| (b) | Calculations are based on average shares outstanding during the year. |
See Notes to Financial Statements.
| | |
| 28 | | Visit our website at www.jennisondryden.com |
| | | | | | | | | | | | | | |
| Class B | |
|
| Year Ended January 31, | |
|
| 2003(b) | | | 2002(b) | | | 2001 | | | 2000(b) | |
| |
| | | | | | | | | | | | | | | |
| $ | 10.24 | | | $ | 11.81 | | | $ | 13.04 | | | $ | 11.46 | |
|
|
| |
|
|
| |
|
|
| |
|
|
|
| | | | | | | | | | | | | | | |
| | (.09 | ) | | | (.06 | ) | | | (.11 | ) | | | (.10 | ) |
| | (2.38 | ) | | | (1.22 | ) | | | .22 | | | | 2.28 | |
|
|
| |
|
|
| |
|
|
| |
|
|
|
| | (2.47 | ) | | | (1.28 | ) | | | .11 | | | | 2.18 | |
|
|
| |
|
|
| |
|
|
| |
|
|
|
| | | | | | | | | | | | | | | |
| | — | | | | (.29 | ) | | | (1.34 | ) | | | (.60 | ) |
|
|
| |
|
|
| |
|
|
| |
|
|
|
| $ | 7.77 | | | $ | 10.24 | | | $ | 11.81 | | | $ | 13.04 | |
|
|
| |
|
|
| |
|
|
| |
|
|
|
| | (24.12 | )% | | | (11.09 | )% | | | 1.80 | % | | | 19.16 | % |
| | | | | | | | | | | | | | | |
| $ | 312,898 | | | $ | 499,275 | | | $ | 631,268 | | | $ | 729,339 | |
| $ | 401,217 | | | $ | 537,746 | | | $ | 677,578 | | | $ | 581,150 | |
| | | | | | | | | | | | | | | |
| | 2.06 | % | | | 2.02 | % | | | 1.93 | % | | | 1.95 | % |
| | 1.06 | % | | | 1.02 | % | | | .93 | % | | | .95 | % |
| | (.98 | )% | | | (.60 | )% | | | (.87 | )% | | | (.85 | )% |
See Notes to Financial Statements.
| | |
| Jennison 20/20 Focus Fund | | 29 |
Financial Highlights
Cont’d
| | | | |
| |
| | | Class C
| |
| | | Year Ended January 31, 2004(b) | |
| |
Per Share Operating Performance: | | | | |
Net Asset Value, Beginning Of Year | | $ | 7.77 | |
| | |
|
|
|
Income (loss) from investment operations: | | | | |
Net investment loss | | | (.07 | ) |
Net realized and unrealized gain (loss) on investments and foreign currencies | | | 2.77 | |
| | |
|
|
|
Total from investment operations | | | 2.70 | |
| | |
|
|
|
Less distributions | | | | |
Distributions from net realized gains | | | — | |
| | |
|
|
|
Net asset value, end of year | | $ | 10.47 | |
| | |
|
|
|
Total Return(a): | | | 34.75 | % |
Ratios/Supplemental Data: | | | | |
Net assets, end of year (000) | | $ | 72,779 | |
Average net assets (000) | | $ | 67,488 | |
Ratios to average net assets: | | | | |
Expenses, including distribution and service (12b-1) fees | | | 2.02 | % |
Expenses, excluding distribution and service (12b-1) fees | | | 1.02 | % |
Net investment loss | | | (.83 | )% |
| (a) | Total return does not consider the effects of sales loads. Total return is calculated assuming a purchase of shares on the first day and a sale on the last day of each year reported and includes reinvestment of dividends and distributions. |
| (b) | Calculations are based on average shares outstanding during the year. |
See Notes to Financial Statements.
| | |
| 30 | | Visit our website at www.jennisondryden.com |
| | | | | | | | | | | | | | |
|
| Class C | |
|
| Year Ended January 31, | |
|
| 2003(b) | | | 2002(b) | | | 2001 | | | 2000(b) | |
| |
| | | | | | | | | | | | | | | |
| $ | 10.24 | | | $ | 11.81 | | | $ | 13.04 | | | $ | 11.46 | |
|
|
| |
|
|
| |
|
|
| |
|
|
|
| | | | | | | | | | | | | | | |
| | (.09 | ) | | | (.06 | ) | | | (.11 | ) | | | (.10 | ) |
| | (2.38 | ) | | | (1.22 | ) | | | .22 | | | | 2.28 | |
|
|
| |
|
|
| |
|
|
| |
|
|
|
| | (2.47 | ) | | | (1.28 | ) | | | .11 | | | | 2.18 | |
|
|
| |
|
|
| |
|
|
| |
|
|
|
| | | | | | | | | | | | | | | |
| | — | | | | (.29 | ) | | | (1.34 | ) | | | (.60 | ) |
|
|
| |
|
|
| |
|
|
| |
|
|
|
| $ | 7.77 | | | $ | 10.24 | | | $ | 11.81 | | | $ | 13.04 | |
|
|
| |
|
|
| |
|
|
| |
|
|
|
| | (24.12 | )% | | | (11.09 | )% | | | 1.80 | % | | | 19.16 | % |
| | | | | | | | | | | | | | | |
| $ | 64,473 | | | $ | 100,519 | | | $ | 123,533 | | | $ | 145,733 | |
| $ | 82,289 | | | $ | 106,235 | | | $ | 137,168 | | | $ | 111,039 | |
| | | | | | | | | | | | | | | |
| | 2.06 | % | | | 2.02 | % | | | 1.93 | % | | | 1.95 | % |
| | 1.06 | % | | | 1.02 | % | | | .93 | % | | | .95 | % |
| | (.98 | )% | | | (.60 | )% | | | (.87 | )% | | | (.84 | )% |
See Notes to Financial Statements.
| | |
| Jennison 20/20 Focus Fund | | 31 |
Financial Highlights
Cont’d
| | | | |
| |
| | | Class Z
| |
| | | Year Ended January 31, 2004(b) | |
| |
Per Share Operating Performance: | | | | |
Net Asset Value, Beginning Of Year | | $ | 8.13 | |
| | |
|
|
|
Income (loss) from investment operations: | | | | |
Net investment income | | | .02 | |
Net realized and unrealized gain (loss) on investments and foreign currencies | | | 2.92 | |
| | |
|
|
|
Total from investment operations | | | 2.94 | |
| | |
|
|
|
Less distributions | | | | |
Distributions from net realized gains | | | — | |
| | |
|
|
|
Net asset value, end of year | | $ | 11.07 | |
| | |
|
|
|
Total Return(a): | | | 36.16 | % |
Ratios/Supplemental Data: | | | | |
Net assets, end of year (000) | | $ | 14,584 | |
Average net assets (000) | | $ | 26,576 | |
Ratios to average net assets: | | | | |
Expenses, including distribution and service (12b-1) fees | | | 1.02 | % |
Expenses, excluding distribution and service (12b-1) fees | | | 1.02 | % |
Net investment income | | | .18 | % |
| (a) | Total return is calculated assuming a purchase of shares on the first day and a sale on the last day of each year reported and includes reinvestment of dividends and distributions. |
| (b) | Calculations are based on average shares outstanding during the year. |
| (c) | Less than $.005 per share. |
See Notes to Financial Statements.
| | |
| 32 | | Visit our website at www.jennisondryden.com |
| | | | | | | | | | | | | | |
|
| Class Z | |
|
| Year Ended January 31, | |
|
| 2003(b) | | | 2002(b) | | | 2001 | | | 2000(b) | |
| |
| | | | | | | | | | | | | | | |
| $ | 10.62 | | | $ | 12.11 | | | $ | 13.20 | | | $ | 11.49 | |
|
|
| |
|
|
| |
|
|
| |
|
|
|
| | | | | | | | | | | | | | | |
| | — | (c) | | | .04 | | | | .02 | | | | .02 | |
| | (2.49 | ) | | | (1.24 | ) | | | .23 | | | | 2.29 | |
|
|
| |
|
|
| |
|
|
| |
|
|
|
| | (2.49 | ) | | | (1.20 | ) | | | .25 | | | | 2.31 | |
|
|
| |
|
|
| |
|
|
| |
|
|
|
| | | | | | | | | | | | | | | |
| | — | | | | (.29 | ) | | | (1.34 | ) | | | (.60 | ) |
|
|
| |
|
|
| |
|
|
| |
|
|
|
| $ | 8.13 | | | $ | 10.62 | | | $ | 12.11 | | | $ | 13.20 | |
|
|
| |
|
|
| |
|
|
| |
|
|
|
| | (23.45 | )% | | | (10.21 | )% | | | 2.98 | % | | | 20.25 | % |
| | | | | | | | | | | | | | | |
| $ | 27,238 | | | $ | 43,290 | | | $ | 48,638 | | | $ | 68,352 | |
| $ | 35,371 | | | $ | 42,718 | | | $ | 61,451 | | | $ | 45,183 | |
| | | | | | | | | | | | | | | |
| | 1.06 | % | | | 1.02 | % | | | .93 | % | | | .95 | % |
| | 1.06 | % | | | 1.02 | % | | | .93 | % | | | .95 | % |
| | .02 | % | | | .40 | % | | | .13 | % | | | .16 | % |
See Notes to Financial Statements.
| | |
| Jennison 20/20 Focus Fund | | 33 |
Independent Auditors’ Report
The Board of Trustees and Shareholders of
Jennison 20/20 Focus Fund:
We have audited the accompanying statement of assets and liabilities of the Jennison 20/20 Focus Fund, formerly known as the Prudential 20/20 Focus Fund, (the “Fund”), including the portfolio of investments, as of January 31, 2004, and the related statement of operations, the statement of changes in net assets, and the financial highlights for the year then ended. These financial statements and financial highlights are the responsibility of the Fund’s management. Our responsibility is to express an opinion on these financial statements and financial highlights based on our audit. The statement of changes in net assets and the financial highlights for the periods presented through January 31, 2003, were audited by other auditors, whose report dated, March 18, 2003, expressed an unqualified opinion thereon.
We conducted our audit in accordance with auditing standards generally accepted in the United States of America. Those standards require that we plan and perform the audit to obtain reasonable assurance about whether the financial statements and financial highlights are free of material misstatement. An audit includes examining, on a test basis, evidence supporting the amounts and disclosures in the financial statements. Our procedures included confirmation of securities owned as of January 31, 2004, by correspondence with the custodian. An audit also includes assessing the accounting principles used and significant estimates made by management, as well as evaluating the overall financial statement presentation. We believe that our audit provides a reasonable basis for our opinion.
In our opinion, the financial statements and financial highlights referred to above present fairly, in all material respects, the financial position of the Jennison 20/20 Focus Fund as of January 31, 2004 and the results of its operations, the changes in its net assets, and the financial highlights for the year then ended, in conformity with accounting principles generally accepted in the United States of America.

New York, New York
March 18, 2004
| | |
| 34 | | Visit our website at www.jennisondryden.com |
Supplemental Proxy Information
(Unaudited)
Meetings of the Fund’s shareholders were held on July 17, 2003 and August 21, 2003. The meetings were held for the following purposes:
| (1) | To approve the election of ten (10) trustees to the Board of Trustees, as follows: |
| (2) | To approve amendments to the Charter. |
The results of the proxy solicitation on the preceding matters were:
| | | | | | | | | | |
| | | Matter
| | Votes
For
| | Votes
Against
| | Votes
Withheld
| | Abstentions
|
| (1)* | | David E.A. Carson | | 48,195,937 | | — | | 662,832 | | — |
| | | Robert E. La Blanc | | 48,202,640 | | — | | 656,129 | | — |
| | | Robert F. Gunia | | 48,227,536 | | — | | 631,233 | | — |
| | | Douglas H. McCorkindale | | 48,224,588 | | — | | 634,181 | | — |
| | | Stephen P. Munn | | 48,224,688 | | — | | 634,081 | | — |
| | | Richard A. Redeker | | 48,230,758 | | — | | 628,011 | | — |
| | | Judy A. Rice | | 48,227,527 | | — | | 631,242 | | — |
| | | Robin B. Smith | | 48,216,600 | | — | | 642,169 | | — |
| | | Stephen Stoneburn | | 48,219,317 | | — | | 639,452 | | — |
| | | Clay T. Whitehead | | 48,222,763 | | — | | 636,006 | | — |
| | | | | |
| (2)** | | Charter Amendments | | 17,262,619 | | 868,951 | | — | | 676,904 |
| † | Mr. Munn ceased being a trustee effective November 30, 2003. |
| * | Approved at the July 17, 2003 meeting. |
| ** | Approved at the August 21, 2003 meeting. |
| | |
| Jennison 20/20 Focus Fund | | 35 |
Management of the Fund
(Unaudited)
Information pertaining to the Trustees of the Fund is set forth below. Trustees who are not deemed to be “interested persons” of the Fund, as defined in the 1940 Act are referred to as “Independent Trustees.” Trustees who are deemed to be “interested persons” of the Fund are referred to as “Interested Trustees.” “Fund Complex”† consists of the Fund and any other investment companies managed by PI.
Independent Trustees(2)
David E.A. Carson (69), Trustee since 2003(3) Oversees 90 portfolios in Fund complex
Principal occupations (last 5 years): Director (January 2000 to May 2000), Chairman (January 1999 to December 1999), Chairman and Chief Executive Officer (January 1998 to December 1998) and President, Chairman and Chief Executive Officer (1983-1997) of People’s Bank.
Other Directorships held:(4) Director of United Illuminating and UIL Holdings (utility company), since 1993.
Robert E. La Blanc (69), Trustee since 2003(3) Oversees 98 portfolios in Fund complex
Principal occupations (last 5 years): President (since 1981) of Robert E. La Blanc Associates, Inc. (telecommunications); formerly General Partner at Salomon Brothers and Vice-Chairman of Continental Telecom; Trustee of Manhattan College.
Other Directorships held:(4) Director of Storage Technology Corporation (technology) (since 1979), Chartered Semiconductor Manufacturing, Ltd. (since 1998); Titan Corporation (electronics) (since 1995), Computer Associates International, Inc. (software company) (since 2002); FiberNet Telecom Group, Inc. (telecom company) (since 2003); Director (since April 1999) of the High Yield Plus Fund, Inc.
Douglas H. McCorkindale (64), Trustee since 1998(3) Oversees 91 portfolios in Fund complex
Principal occupations (last 5 years): Chairman (since February 2001), Chief Executive Officer (since June 2000) and President (since September 1997) of Gannett Co. Inc. (publishing and media); formerly Vice Chairman (March 1984-May 2000) of Gannett Co., Inc.
Other Directorships held:(4) Director of Gannett Co. Inc., Director of Continental Airlines, Inc. (since May 1993); Director of Lockheed Martin Corp. (aerospace and defense) (since May 2001); Director of The High Yield Plus Fund, Inc. (since 1996).
Richard A. Redeker (60), Trustee since 1998(3) Oversees 92 portfolios in Fund complex
Principal occupations (last 5 years): Management Consultant; formerly employee of Prudential Investments (October 1996-December 1998); Director of Invesmart, Inc. (since 2001) and Director of Penn Tank Lines, Inc. (since 1999).
Other Directorships held:(4) None.
| | |
| 36 | | Visit our website at www. jennisondryden.com |
Robin B. Smith (64), Trustee since 1998(3) Oversees 97 portfolios in Fund complex
Principal occupations (last 5 years): Chairman of the Board (since January 2003) of Publishers Clearing House (direct marketing); formerly Chairman and Chief Executive Officer (August 1996-January 2003) of Publishers Clearing House.
Other Directorships held:(4) Director of BellSouth Corporation (since 1992).
Stephen Stoneburn (60), Trustee since 2003(3) Oversees 95 portfolios in Fund complex
Principal occupations (last 5 years): President and Chief Executive Officer (since June 1996) of Quadrant Media Corp. (a publishing company); formerly President (June 1995-June 1996) of Argus Integrated Media, Inc.; Senior Vice President and Managing Director (January 1993-1995) of Cowles Business Media and Senior Vice President of Fairchild Publications, Inc. (1975-1989).
Other Directorships held:(4) None
Clay T. Whitehead (65), Trustee since 1998(3) Oversees 96 portfolios in Fund complex
Principal occupations (last 5 years): President (since 1983) of National Exchange Inc. (new business development firm).
Other Directorships held:(4) Director (since 2000) of the High Yield Plus Fund, Inc.
Interested Trustees(1)
Judy A. Rice (56), President since 2003 and Trustee since 2000(3) Oversees 95 portfolios in Fund complex
Principal occupations (last 5 years): President, Chief Executive Officer, Chief Operating Officer and Officer-in-Charge (since 2003) of PI; Director, Officer-in-Charge, President, Chief Executive Officer and Chief Operating Officer (since May 2003) of American Skandia Advisory Services, Inc. and American Skandia Investment Services, Inc.; Director, Officer-in-Charge, President, Chief Executive Officer (since May 2003) of American Skandia Fund Services, Inc.; Vice President (since February 1999) of Prudential Investment Management Services LLC; President, Chief Executive Officer and Officer-in-Charge (since April 2003) of Prudential Mutual Fund Services LLC; formerly various positions to Senior Vice President (1992-1999) of Prudential Securities; and various positions to Managing Director (1975-1992) of Salomon Smith Barney; Member of Board of Governors of the Money Management Institute.
Other Directorships held:(4) None
Robert F. Gunia (57), Vice President since 1998(3) and Trustee since 1997(3) Oversees 179 portfolios in Fund complex
Principal occupations (last 5 years): Chief Administrative Officer (since June 1999) of PI; Executive Vice President and Treasurer (since January 1996) of PI; President (since April 1999) of Prudential Investment Management Services LLC (PIMS); Corporate Vice President (since September 1997) of The Prudential Insurance Company of America (Prudential); Director, Executive Vice President and Chief Administrative Officer (since May 2003) of American Skandia Investment Services, Inc., American Skandia Advisory Services, Inc. and American Skandia Fund Services, Inc.; President (since April 1999) of Prudential Investment Management Services LLC; Executive Vice President (since March 1999) and Treasurer (since May 2000) of Prudential Mutual Fund Services LLC; formerly Senior Vice President (March 1987-May 1999) of Prudential Securities.
Other Directorships held:(4) Vice President and Director (since May 1989) and Treasurer (since 1999) of The Asia Pacific Fund, Inc.
| | | | |
| | | Jennison 20/20 Focus Fund | | 37 |
Information pertaining to the Officers of the Fund who are not also Trustees is set forth below.
Officers(2)
Marguerite E.H. Morrison (48), Chief Legal Officer since 2003 and Assistant Secretary since 2002(3)
Principal occupations (last 5 years): Vice President and Chief Legal Officer—Mutual Funds and Unit Investment Trust (since August 2000) of Prudential; Senior Vice President and Secretary (since April 2003) of PI; Senior Vice President and Secretary (since May 2003) of American Skandia Investment Services, Inc., American Skandia Advisory Services, Inc. and American Skandia Fund Services, Inc.; Vice President and Assistant Secretary of PIMS (since October 2001), previously Senior Vice President and Assistant Secretary (February 2001-April 2003) of PI, Vice President and Associate General Counsel (December 1996-February 2001) of PI.
Maryanne Ryan (39), Anti-Money Laundering Compliance Officer since 2002(3)
Principal occupations (last 5 years): Vice President, Prudential (since November 1998); First Vice President, Prudential Securities (March 1997-May 1998); Anti-Money Laundering Compliance Officer (since 2003) of American Skandia Investment Services, Inc., American Skandia Advisory Services, Inc. and American Skandia Marketing, Inc.
Grace C. Torres (44), Treasurer and Principal Financial and Accounting Officer since 1997(3)
Principal occupations (last 5 years): Senior Vice President (since January 2000) of PI; Senior Vice President and Assistant Treasurer (since May 2003) of American Skandia Investment Services, Inc. and American Skandia Advisory Services, Inc.; formerly First Vice President (December 1996-January 2000) of PI and First Vice President (March 1993-1999) of Prudential Securities.
| (1) | “Interested” Trustee, as defined in the 1940 Act, by reason of employment with the Manager (Prudential Investments LLC or PI), the Subadviser (Jennison Associates LLC or Jennison) or the Distributor (Prudential Investment Management Services LLC or PIMS). |
| (2) | Unless otherwise noted, the address of the Trustees and Officers is c/o: Prudential Investments LLC, Gateway Center Three, 100 Mulberry Street, Newark, NJ 07102. |
| (3) | There is no set term of office for Trustees and Officers. The Independent Trustees have adopted a retirement policy, which calls for the retirement of Trustees on December 31 of the year in which they reach the age of 75. The table shows the individuals length of service as Trustee and/or Officer. |
| (4) | This includes only directorships of companies requested to register, or file reports with the SEC under the Securities and Exchange Act of 1934 (that is, “public companies”) or other investment companies registered under the 1940 Act. |
| † | The Fund Complex consists of all investment companies managed by PI. The Funds for which PI serves as manager include JennisonDryden Mutual Funds, Strategic Partners Mutual Funds, American Skandia Advisor Funds, Inc., The Prudential Variable Contract Accounts 2, 10, 11, The Target Portfolio Trust, The Prudential Series Fund, Inc., American Skandia Trust, and Prudential’s Gibraltar Fund. |
Additional information about the Fund’s Trustees is included in the Fund’s Statement of Additional Information which is available without charge, upon request, by calling (800) 521-7466 or (732) 482-7555 (Calling from outside the U.S.)
| | |
| 38 | | Visit our website at www. jennisondryden.com |
Growth of a $10,000 Investment
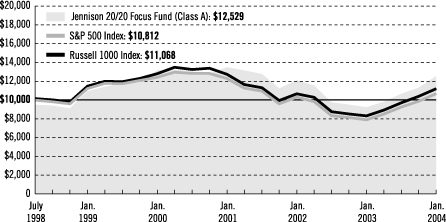
| | | | | | | | | |
|
| Average Annual Total Returns (With Sales Charges) as of 1/31/04 | |
| | | One Year | | | Five Years | | | Since Inception | |
Class A | | 28.99 | % | | 1.69 | % | | 4.12 | % |
| |
Class B | | 29.75 | | | 1.81 | | | 4.13 | |
| |
Class C | | 32.41 | | | 1.77 | | | 4.09 | |
| |
Class Z | | 36.16 | | | 2.99 | | | 5.33 | |
| |
| | | | | | | | | | |
|
| Average Annual Total Returns (Without Sales Charges) as of 1/31/04 | |
| | | One Year | | | Five Years | | | Since Inception | |
Class A | | 35.78 | % | | 2.74 | % | | 5.08 | % |
| |
Class B | | 34.75 | | | 1.98 | | | 4.28 | |
| |
Class C | | 34.75 | | | 1.98 | | | 4.28 | |
| |
Class Z | | 36.16 | | | 2.99 | | | 5.33 | |
| |
Past performance is not indicative of future results. Principal value and investment return will fluctuate so that an investor’s shares, when redeemed, may be worth more or less than their original cost. Source: Prudential Investments LLC and Lipper Inc. Inception date: 7/1/98.
The graph compares a $10,000 investment in the Jennison 20/20 Focus Fund (Class A shares) with a similar investment in the S&P 500 Index and the Russell 1000 Index by portraying the initial account values at the commencement of operations of Class A shares (July 1, 1998) and the account values at the end of the current fiscal year (January 31, 2004) as measured on a quarterly basis. For purposes of the graph, and unless otherwise indicated, it has been assumed that (a) the maximum applicable front-end sales charge was deducted from the initial $10,000 investment in Class A shares; (b) all recurring fees (including management fees) were deducted; and (c) all dividends and distributions were reinvested. The line graph provides information for Class A shares only. As indicated in the tables provided earlier, performance for Class B, C, and Z shares will vary due to the differing charges and expenses applicable to each share class (as indicated in the following paragraphs).
| | |
| | | Visit our website www.jennisondryden.com |
Without a distribution and service (12b-1) fee waiver of 0.05% for Class A shares annually through January 31, 2004, the returns shown in the graph and for Class A shares in the tables would have been lower.
The S&P 500 Index is an unmanaged index of 500 stocks of large U.S. public companies. It gives a broad look at how stock prices in the United States have performed. The Russell 1000 Index is an unmanaged index that consists of the 1,000 largest securities in the Russell 3000 Index. The Indexes’ total returns include the reinvestment of all dividends, but do not include the effects of sales charges, operating expenses of a mutual fund, or taxes. The returns for the Indexes would be lower if they included the effects of sales charges, operating expenses, or taxes. The securities that comprise these indexes may differ substantially from the securities in the Fund. These are not the only indexes that may be used to characterize performance of mid- to large-capitalization stock funds. Other indexes may portray different comparative performance. Investors cannot invest directly in an index.
During the period ended January 31, 2004, the Fund charged a maximum front-end sales charge of 5% for Class A shares and a 12b-1 fee of up to 0.30% annually. Effective March 15, 2004, Class A shares are subject to a maximum front-end sales charge of 5.50%, a 12b-1 fee of up to 0.30% annually, and all investors who purchase Class A shares in an amount of $1 million or more and sell these shares within 12 months of purchase are subject to a contingent deferred sales charge (CDSC) of 1%. Class B shares are subject to a declining CDSC of 5%, 4%, 3%, 2%, 1%, and 1% respectively for the first six years after purchase and a 12b-1 fee of 1% annually. Approximately seven years after purchase, Class B shares will automatically convert to Class A shares on a quarterly basis. During the period ended January 31, 2004, Class C shares were subject to a front-end sales charge of 1%, a CDSC of 1% for shares redeemed within 18 months of purchase, and a 12b-1 fee of 1% annually. Class C shares purchased on or after February 2, 2004 are not subject to a front-end sales charge, the CDSC of 1% for Class C shares purchased on or after that date will apply for 12 months from the date of purchase, and the annual 12b-1 fee will remain 1%. The returns in the graph and the tables do not reflect the deduction of taxes that a shareholder would pay on Fund distributions or following the redemption of Fund shares.
| | |
| Jennison 20/20 Focus Fund | | |
| | | | |
| | |
| n MAIL | | n TELEPHONE | | n WEBSITE |
Gateway Center Three 100 Mulberry Street Newark, NJ 07102 | | (800) 225-1852 | | www.jennisondryden.com |
|
| PROXY VOTING |
| The Board of Trustees of the Fund has delegated to the Fund’s investment manager the responsibility for voting any proxies and maintaining proxy recordkeeping with respect to the Fund. A description of these proxy voting policies and procedures is available without charge, upon request, by calling (800) 225-1852 or by visiting the SEC’s website at http://www.sec.gov. |
|
| TRUSTEES |
| David E.A. Carson • Robert F. Gunia • Robert E. La Blanc • Douglas H. McCorkindale • Richard A. Redeker • Judy A. Rice • Robin B. Smith • Stephen D. Stoneburn • Clay T. Whitehead |
|
| OFFICERS |
Judy A. Rice, President • Robert F. Gunia, Vice President • Grace C. Torres, Treasurer and Principal
Financial and Accounting Officer • Marguerite E.H. Morrison, Chief Legal Officer and Assistant Secretary•
Maryanne Ryan, Anti-Money Laundering Compliance Officer |
| | | | |
| MANAGER | | Prudential Investments LLC | | Gateway Center Three
100 Mulberry Street
Newark, NJ 07102 |
|
| INVESTMENT ADVISER | | Jennison Associates LLC | | 466 Lexington Avenue
New York, NY 10017 |
|
| DISTRIBUTOR | | Prudential Investment
Management Services LLC | | Gateway Center Three
14th Floor
100 Mulberry Street
Newark, NJ 07102 |
|
| CUSTODIAN | | State Street Bank
and Trust Company | | One Heritage Drive
North Quincy, MA 02171 |
|
| TRANSFER AGENT | | Prudential Mutual Fund
Services LLC | | PO Box 8098
Philadelphia, PA 19101 |
|
| INDEPENDENT AUDITORS | | KPMG LLP | | 757 Third Avenue
New York, NY 10017 |
|
| FUND COUNSEL | | Sullivan & Cromwell LLP | | 125 Broad Street
New York, NY 10004 |
| | | | | | | | | | | | |
| | | |
| Jennison 20/20 Focus Fund | | | | | | |
| | | Share Class | | A | | B | | C | | Z | | |
| | | | | | |
| | | NASDAQ | | PTWAX | | PTWBX | | PTWCX | | PTWZX | | |
| | | CUSIP | | 476295100 | | 476295209 | | 476295308 | | 476295407 | | |
| | | | | | | | | | | | | |
Mutual Funds:
| | | | |
| ARE NOT INSURED BY THE FDIC OR ANY FEDERAL GOVERNMENT AGENCY | | MAY LOSE VALUE | | ARE NOT A DEPOSIT OF OR GUARANTEED BY ANY BANK OR ANY BANK AFFILIATE |
| | | | | | | | | | | | |
| | | |
| Jennison 20/20 Focus Fund | | | | | | |
| | | Share Class | | A | | B | | C | | Z | | |
| | | | | | |
| | | NASDAQ | | PTWAX | | PTWBX | | PTWCX | | PTWZX | | |
| | | CUSIP | | 476295100 | | 476295209 | | 476295308 | | 476295407 | | |
| | | | | | | | | | | | | |
MF183E IFS-A088975 Ed. 03/2004
Item 2 – Code of Ethics – – See Exhibit (a)
As of the end of the period covered by this report, the registrant has adopted a code of ethics (the “Section 406 Standards for Investment Companies – Ethical Standards for Principal Executive and Financial Officers”) that applies to the registrant’s Principal Executive Officer and Principal Financial Officer; the registrant’s Principal Financial Officer also serves as the Principal Accounting Officer.
The registrant hereby undertakes to provide any person, without charge, upon request, a copy of the code of ethics. To request a copy of the code of ethics, contact the registrant 973-367-7525, and ask for a copy of the Section 406 Standards for Investment Companies – Ethical Standards for Principal Executive and Financial Officers.
Item 3 – Audit Committee Financial Expert –
The registrant’s Board has determined that Mr. David Carson, member of the Board’s Audit Committee is an “audit committee financial expert,” and that he is “independent,” for purposes of this Item.
Item 4 – Principal Accountant Fees and Services –
(a) Audit Fees
For the fiscal year ended January 31, 2004 KPMG LLP, the Registrant’s principal accountant, billed the Registrant $16,700 (for professional services rendered for the audit of the Registrant’s annual financial statements or services that are normally provided in connection with statutory and regulatory filings. KPMG did not serve as the Registrant’s principal accountant during fiscal year 2003, so no information is provided for FY2003.
(b) Audit-Related Fees
None.
( c) Tax Fees
None.
(d) All Other Fees
None.
(e) (1) Audit Committee Pre-Approval Policies and Procedures
THE PRUDENTIAL MUTUAL FUNDS
AUDIT COMMITTEE POLICY
on
Pre-Approval of Services Provided by the Independent Accountants
The Audit Committee of each Prudential Mutual Fund is charged with the responsibility to monitor the independence of the Fund’s independent accountants. As part of this responsibility, the Audit Committee must pre-approve any independent accounting firm’s engagement to render audit and/or permissible non-audit services, as required by law. In evaluating a proposed engagement of the independent accountants, the Audit Committee will assess the effect that the engagement might reasonably be expected to have on the accountant’s independence. The Committee’s evaluation will be based on:
| · | a review of the nature of the professional services expected to be provided, |
| · | a review of the safeguards put into place by the accounting firm to safeguard independence, and |
| · | periodic meetings with the accounting firm. |
Policy for Audit and Non-Audit Services Provided to the Funds
On an annual basis, the scope of audits for each Fund, audit fees and expenses, and audit-related and non-audit services (and fees proposed in respect thereof) proposed to be performed by the Fund’s independent accountants will be presented by the Treasurer and the independent accountants to the Audit Committee for review and, as appropriate, approval prior to the initiation of such services. Such presentation shall be accompanied by confirmation by both the Treasurer and the independent accountants that the proposed services will not adversely affect the independence of the independent accountants. Proposed services shall be described in sufficient detail to enable the Audit Committee to assess the appropriateness of such services and fees, and the compatibility of the provision of such services with the auditor’s independence. The Committee shall receive periodic reports on the progress of the audit and other services which are approved by the Committee or by the Committee Chair pursuant to authority delegated in this Policy.
The categories of services enumerated under “Audit Services”, “Audit-related Services”, and “Tax Services” are intended to provide guidance to the Treasurer and the independent accountants as to those categories of services which the Committee believes are generally consistent with the independence of the independent accountants and which the Committee (or the Committee Chair) would expect upon the presentation of specific proposals to pre-approve. The enumerated categories are not intended as an exclusive list of audit, audit-related or tax services which the Committee (or the Committee Chair) would consider for pre-approval.
Audit Services
The following categories of audit services are considered to be consistent with the role of the Fund’s independent accountants:
| | Ø | Annual Fund financial statement audits |
| | Ø | Seed audits (related to new product filings, as required) |
| | Ø | SEC and regulatory filings and consents |
Audit-related Services
The following categories of audit-related services are considered to be consistent with the role of the Fund’s independent accountants:
| | Ø | Accounting consultations |
| | Ø | Fund merger support services |
| | Ø | Agreed Upon Procedure Reports |
| | Ø | Other Internal Control Reports |
Individual audit-related services that fall within one of these categories and are not presented to the Audit Committee as part of the annual pre-approval process will be subject to pre-approval by the Committee Chair (or any other Committee member on whom this responsibility has been delegated) so long as the estimated fee for those services does not exceed $50,000.
Tax Services
The following categories of tax services are considered to be consistent with the role of the Fund’s independent accountants:
| | Ø | Tax compliance services related to the filing or amendment of the following: |
| | n | Federal, state and local income tax compliance; and, |
| | n | Sales and use tax compliance |
| | Ø | Timely RIC qualification reviews |
| | Ø | Tax distribution analysis and planning |
| | Ø | Tax authority examination services |
| | Ø | Tax appeals support services |
| | Ø | Accounting methods studies |
| | Ø | Fund merger support services |
| | Ø | Tax consulting services and related projects |
Individual tax services that fall within one of these categories and are not presented to the Audit Committee as part of the annual pre-approval process will be subject to pre-approval by the Committee Chair (or any other Committee member on whom this responsibility has been delegated) so long as the estimated fee for those services does not exceed $50,000.
Other Non-audit Services
Certain non-audit services that the independent accountants are legally permitted to render will be subject to pre-approval by the Committee or by one or more Committee members to whom the Committee has delegated this authority and who will report to the full Committee any pre
approval decisions made pursuant to this Policy. Non-audit services presented for pre-approval pursuant to this paragraph will be accompanied by a confirmation from both the Treasurer and the independent accountants that the proposed services will not adversely affect the independence of the independent accountants.
Proscribed Services
The Fund’s independent accountants will not render services in the following categories of non-audit services:
| | Ø | Bookkeeping or other services related to the accounting records or financial statements of the Fund |
| | Ø | Financial information systems design and implementation |
| | Ø | Appraisal or valuation services, fairness opinions, or contribution-in-kind reports |
| | Ø | Internal audit outsourcing services |
| | Ø | Management functions or human resources |
| | Ø | Broker or dealer, investment adviser, or investment banking services |
| | Ø | Legal services and expert services unrelated to the audit |
| | Ø | Any other service that the Public Company Accounting Oversight Board determines, by regulation, is impermissible. |
Pre-approval of Non-Audit Services Provided to Other Entities Within the Prudential Fund Complex
Certain non-audit services provided to Prudential Investments LLC or any of its affiliates that also provide ongoing services to the Prudential Mutual Funds will be subject to pre-approval by the Audit Committee. The only non-audit services provided to these entities that will require pre-approval are those related directly to the operations and financial reporting of the Funds. Individual projects that are not presented to the Audit Committee as part of the annual pre-approval process, will be subject to pre-approval by the Committee Chair (or any other Committee member on whom this responsibility has been delegated) so long as the estimated fee for those services does not exceed $50,000. Services presented for pre-approval pursuant to this paragraph will be accompanied by a confirmation from both the Treasurer and the independent accountants that the proposed services will not adversely affect the independence of the independent accountants.
Although the Audit Committee will not pre-approve all services provided to Prudential Investments LLC and its affiliates, the Committee will receive an annual report from the Fund’s independent accounting firm showing the aggregate fees for all services provided to Prudential Investments and its affiliates.
(e)-(2) Percentage of services referred to in 4(b)- (4)(d) that were approved by the audit committee –Not applicable.
(f) Percentage of hours expended attributable to work performed by other than full time employees of principal accountant if greater than 50%.
Not applicable.
(g) Non-Audit Fees
N/A to Registrant and to the registrant’s investment adviser and any entity controlling, controlled by, or under common control with the investment adviser that provides ongoing services to the registrant.
(h) Principal Accountants Independence
Not applicable as KPMG has not provided non-audit services to the registrant’s investment adviser and any entity controlling, controlled by, or under common control with the investment adviser that provides ongoing services to the registrant that were not pre-approved pursuant to Rule 2-01(c)(7)(ii) of Regulation S-X.
Item 5 – Audit Committee of Listed Registrants – Not applicable.
Item 6 – Reserved
Item 7 – Disclosure of Proxy Voting Policies and Procedures for Closed-End Management Investment Companies – Not required in this filing
Item 8 – Reserved
Item 9 – Submission of matters to a vote of security holders: None.
Item 10 – Controls and Procedures
| | (a) | It is the conclusion of the registrant’s principal executive officer and principal financial officer that the effectiveness of the registrant’s current disclosure controls and procedures (such disclosure controls and procedures having been evaluated within 90 days of the date of this filing) provide reasonable assurance that the information required to be disclosed by the registrant has been recorded, processed, summarized and reported within the time period specified in the Commission’s rules and forms and that the information required to be disclosed by the registrant has been accumulated and communicated to the registrant’s principal executive officer and principal financial officer in order to allow timely decisions regarding required disclosure. |
| | (b) | There have been no significant changes in the registrant’s internal controls or in other factors that could significantly affect these controls subsequent to the date of their evaluation, including any corrective actions with regard to significant deficiencies and material weaknesses. |
Item 11 – Exhibits
| | (a) | Code of Ethics – attached hereto |
| | (b) | Certifications pursuant to Section 302 and 906 of the Sarbanes-Oxley Act – Attached hereto |
SIGNATURES
Pursuant to the requirements of the Securities Exchange Act of 1934 and the Investment Company Act of 1940, the registrant has duly caused this report to be signed on its behalf by the undersigned, thereunto duly authorized.
| | |
(Registrant) | | Jennison 20/20 Focus Fund |
| | |
|
| |
| By (Signature and Title)* | | /s/ Marguerite E. H. Morrison |
| | |
|
| | | Marguerite E. H. Morrison Assistant Secretary |
Date March 26, 2004
Pursuant to the requirements of the Securities Exchange Act of 1934 and the Investment Company Act of 1940, this report has been signed below by the following persons on behalf of the registrant and in the capacities and on the dates indicated.
| | |
| |
| By (Signature and Title)* | | /s/ Judy A. Rice |
| | |
|
| | | Judy A. Rice President and Principal Executive Officer |
Date March 26, 2004
| | |
| |
| By (Signature and Title)* | | /s/ Grace C. Torres |
| | |
|
| | | Grace C. Torres Treasurer and Principal Financial Officer |
Date March 26, 2004
| * | Print the name and title of each signing officer under his or her signature. |