UNITED STATES
SECURITIES AND EXCHANGE COMMISSION
Washington, D.C. 20549
FORM N-CSR
CERTIFIED SHAREHOLDER REPORT OF REGISTERED MANAGEMENT INVESTMENT COMPANIES
| | |
| Investment Company Act file number: | | 811-08587 |
| |
| Exact name of registrant as specified in charter: | | Prudential Investment Portfolios 18 |
| |
| Address of principal executive offices: | | 655 Broad Street, 17th Floor |
| | Newark, New Jersey 07102 |
| |
| Name and address of agent for service: | | Andrew R. French |
| | 655 Broad Street, 17th Floor |
| | Newark, New Jersey 07102 |
| |
| Registrant’s telephone number, including area code: | | 800-225-1852 |
| |
| Date of fiscal year end: | | 11/30/2021 |
| |
| Date of reporting period: | | 11/30/2021 |
Item 1 – Reports to Stockholders

PGIM JENNISON 20/20 FOCUS FUND
ANNUAL REPORT
NOVEMBER 30, 2021

To enroll in e-delivery, go to pgim.com/investments/resource/edelivery
Table of Contents
This report is not authorized for distribution to prospective investors unless preceded or accompanied by a current prospectus.
The views expressed in this report and information about the Fund’s portfolio holdings are for the period covered by this report and are subject to change thereafter.
Mutual funds are distributed by Prudential Investment Management Services LLC, member SIPC. Jennison Associates LLC is a registered investment adviser. Both are Prudential Financial companies. © 2022 Prudential Financial, Inc. and its related entities. Jennison Associates, Jennison, PGIM, and the PGIM logo are service marks of Prudential Financial, Inc. and its related entities, registered in many jurisdictions worldwide.
| | |
| 2 | | Visit our website at pgim.com/investments |
Letter from the President
| | |

| | Dear Shareholder: We hope you find the annual report for the PGIM Jennison 20/20 Focus Fund informative and useful. The report covers performance for the 12-month period that ended November 30, 2021. The global economy and markets continued to recover throughout the period from the ongoing impact of the COVID-19 pandemic. The Federal Reserve (the Fed) slashed interest rates and kept them near zero to encourage borrowing. Congress passed stimulus bills worth several trillion dollars to help consumers and businesses. And |
several effective COVID-19 vaccines received regulatory approval. Those measures were enough to offset the fear of rising inflation and supply chain challenges that threatened to disrupt growth.
At the start of the period, stocks had recovered most of the steep losses they had suffered at the onset of the pandemic. Equities rallied as states reopened their economies but became more volatile as investors worried that a surge in COVID-19 infections would stall the recovery. However, rising corporate profits and economic growth, the resolution of the US presidential election, and the global rollout of approved vaccines lifted equity markets to record levels, helping stocks around the globe post gains for the full period.
While investors sought safety in fixed income early in the period, they turned cautious later due to concerns about higher inflation and the Fed reducing its bond-buying programs. During the period, investment-grade bonds in the US and the overall global bond market, along with emerging market debt, posted negative returns. US high yield corporate bonds posted gains.
Regarding your investments with PGIM, we believe it is important to maintain a diversified portfolio of funds consistent with your tolerance for risk, time horizon, and financial goals. Your financial advisor can help you create a diversified investment plan that may include funds covering all the basic asset classes and that reflects your personal investor profile and risk tolerance. However, diversification and asset allocation strategies do not assure a profit or protect against loss in declining markets.
At PGIM Investments, we consider it a great privilege and responsibility to help investors participate in opportunities across global markets while meeting their toughest investment challenges. PGIM is a top-10 global investment manager with more than $1.5 trillion in assets under management. This scale and investment expertise allow us to deliver actively managed funds and strategies to meet the needs of investors around the globe.
Thank you for choosing our family of funds.
Sincerely,

Stuart S. Parker, President
PGIM Jennison 20/20 Focus Fund
January 14, 2022
| | | | |
PGIM Jennison 20/20 Focus Fund | | | 3 | |
Your Fund’s Performance (unaudited)
Performance data quoted represent past performance. Past performance does not guarantee future results. The investment return and principal value of an investment will fluctuate so that an investor’s shares, when redeemed, may be worth more or less than their original cost. Current performance may be lower or higher than the past performance data quoted.
| | | | | | |
| |
| | | Average Annual Total Returns as of 11/30/21 |
| | | One Year (%) | | Five Years (%) | | Ten Years (%) |
| | | |
| Class A | | | | | | |
| | | |
| (with sales charges) | | 16.97 | | 17.98 | | 13.86 |
| | | |
(without sales charges) | | 23.78 | | 19.32 | | 14.51 |
| | | |
| Class C | | | | | | |
| | | |
| (with sales charges) | | 21.79 | | 18.46 | | 13.71 |
| | | |
(without sales charges) | | 22.79 | | 18.46 | | 13.71 |
| | | |
| Class R | | | | | | |
| | | |
(without sales charges) | | 23.44 | | 19.02 | | 14.25 |
| | | |
| Class Z | | | | | | |
| | | |
(without sales charges) | | 24.11 | | 19.70 | | 14.86 |
| | | |
| Class R6 | | | | | | |
| | | |
(without sales charges) | | 24.19 | | 19.77 | | 14.97 |
| | | |
| S&P 500 Index | | | | | | |
| | | |
| | 27.92 | | 17.89 | | 16.15 |
| | | |
| Russell 1000 Index | | | | | | |
| | | |
| | | 26.67 | | 17.93 | | 16.18 |
Since Inception returns are provided for any share class with less than 10 fiscal years of returns. Since Inception returns for the Indexes are measured from the closest month-end to the class’ inception date.
| | |
| 4 | | Visit our website at pgim.com/investments |
Growth of a $10,000 Investment (unaudited)
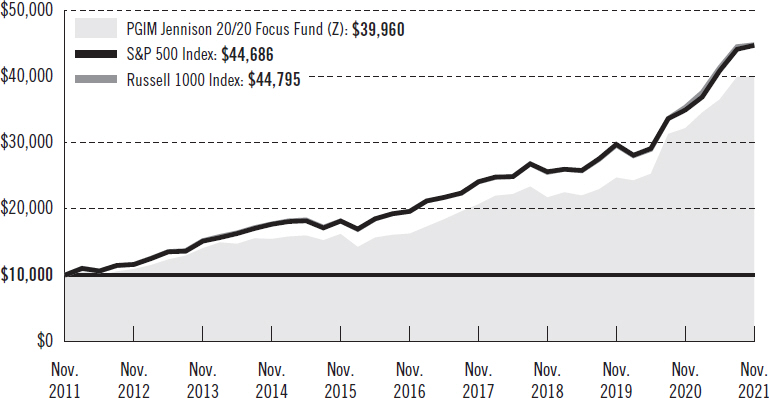
The graph compares a $10,000 investment in the Fund’s Class Z shares with a similar investment in the S&P 500 Index and the Russell 1000 Index by portraying the initial account values at the beginning of the 10-year period for Class Z shares (November 30, 2011) and the account values at the end of the current fiscal year (November 30, 2021), as measured on a quarterly basis. For purposes of the graph, and unless otherwise indicated, it has been assumed that (a) all recurring fees (including management fees) were deducted and (b) all dividends and distributions were reinvested. The line graph provides information for Class Z shares only. As indicated in the tables provided earlier, performance for other share classes will vary due to the differing fees and expenses applicable to each share class (as indicated in the following paragraphs). Without waiver of fees and/or expense reimbursements, if any, the returns would have been lower.
Past performance does not predict future performance. Total returns and the ending account values in the graph include changes in share price and reinvestment of dividends and capital gains distributions in a hypothetical investment for the periods shown. The Fund’s total returns do not reflect the deduction of income taxes on an individual’s investment. Taxes may reduce your actual investment returns on income or gains paid by the Fund or any gains you may realize if you sell your shares.
| | | | |
PGIM Jennison 20/20 Focus Fund | | | 5 | |
Your Fund’s Performance (continued)
The returns in the tables do not reflect the deduction of taxes that a shareholder would pay on Fund distributions or following the redemption of Fund shares. The average annual total returns take into account applicable sales charges, which are described for each share class in the table below.
| | | | | | | | | | |
| | | | | | |
| | | Class A | | Class C | | Class R | | Class Z | | Class R6 |
| | | | | | |
| Maximum initial sales charge | | 5.50% of the public offering price | | None | | None | | None | | None |
| Contingent deferred sales charge (CDSC) (as a percentage of the lower of the original purchase price or the net asset value at redemption) | | 1.00% on sales of $1 million or more made within 12 months of purchase | | 1.00% on sales made within 12 months of purchase | | None | | None | | None |
| Annual distribution and service (12b-1) fees (shown as a percentage of average daily net assets) | | 0.30% | | 1.00% | | 0.75% (0.50% currently) | | None | | None |
Benchmark Definitions
S&P 500 Index*—The S&P 500 Index is an unmanaged index of over 500 stocks of large US public companies. It gives a broad look at how stock prices in the United States have performed.
*The S&P 500 Index (“Index”) is a product of S&P Dow Jones Indices LLC and/or its affiliates and has been licensed for use by PGIM, Inc. and/or its affiliates. Copyright © 2022 S&P Dow Jones Indices LLC, a division of S&P Global, Inc., and/or its affiliates. All rights reserved. Redistribution or reproduction in whole or in part are prohibited without written permission of S&P Dow Jones Indices LLC. For more information on any of S&P Dow Jones Indices LLC’s indices please visit www.spdji.com. S&P® is a registered trademark of S&P Global and Dow Jones® is a registered trademark of Dow Jones Trademark Holdings LLC.
Russell 1000 Index—The Russell 1000 Index is an unmanaged index that consists of the 1,000 largest securities in the Russell 3000® Index, an index that represents approximately 98% of the US market.
| | |
| 6 | | Visit our website at pgim.com/investments |
Investors cannot invest directly in an index. The returns for the Indexes would be lower if they included the effects of sales charges, operating expenses of a mutual fund, or taxes that may be paid by an investor.
Presentation of Fund Holdings as of 11/30/21
| | | | |
| | |
| Ten Largest Holdings | | Line of Business | | % of Net Assets |
| Tesla, Inc. | | Automobiles | | 8.8% |
| Amazon.com, Inc. | | Internet & Direct Marketing Retail | | 8.0% |
| NVIDIA Corp. | | Semiconductors & Semiconductor Equipment | | 6.6% |
| Microsoft Corp. | | Software | | 6.6% |
| Shopify, Inc. (Canada) (Class A Stock) | | IT Services | | 6.1% |
| Adobe, Inc. | | Software | | 3.8% |
| LVMH Moet Hennessy Louis Vuitton SE (France) | | Textiles, Apparel & Luxury Goods | | 3.5% |
| Airbnb, Inc. (Class A Stock) | | Hotels, Restaurants & Leisure | | 3.4% |
| Alphabet, Inc. (Class C Stock) | | Interactive Media & Services | | 3.2% |
| Netflix, Inc. | | Entertainment | | 3.2% |
Holdings reflect only long-term investments.
| | | | |
PGIM Jennison 20/20 Focus Fund | | | 7 | |
Strategy and Performance Overview (unaudited)
How did the Fund perform?1
The PGIM Jennison 20/20 Focus Fund’s Class Z shares returned 24.11% in the 12-month reporting period that ended November 30, 2021, underperforming the 27.92% return of the S&P 500 Index (the Index).
What were the market conditions?
| ● | The US economy and employment levels continued to recover from their pandemic lows during the reporting period. Corporate profit growth proved extremely strong despite supply-chain issues and the persistence of COVID-19 challenges. Inflation became a concern, with interest rates responding to elevated wages and goods prices that were exacerbated by supply-chain bottlenecks and shortages of critical components, leading to growing expectations of policy tightening in 2022. While the direct disbursement of fiscal stimulus began to wind down during the period, liquidity remained abundant, sustaining high levels of demand and contributing to inflationary pressures. |
| ● | The cyclical companies hit hardest by the pandemic-related shutdowns of 2020 appeared poised for a significant recovery in operating performance as the economy reopened in early 2021. However, the emergence of the Delta and Omicron variants of the COVID-19 virus, supply-chain issues, and labor shortages resulted in an uneven recovery in their financial performance, clouding the outlook for further revenue and margin improvements. |
What worked?
Relative to the Index, the Fund’s stock selection in healthcare and underweight exposure to consumer staples enhanced performance during the reporting period.
Top absolute contributors:
| ● | Tesla Inc.’s share price continued to surge on a host of impressive financial results made possible by solid production, increased capacity, and strong execution. Jennison believes the company’s technology, scale, and low-cost advantage make it not only the breakaway leader in the electric-vehicle market but also position it to disrupt the overall automotive industry. |
| ● | Nvidia Corp. focuses on key high-growth markets where it can leverage its graphics semiconductor expertise to offer high-value-added solutions. These long-term, growth-driving markets include gaming (where the company maintains dominant market share and where user and user-engagement metrics continue to exceed forecasts), automotive, high-performance computing, artificial intelligence/deep learning applications, and enterprise. |
| ● | Microsoft Corp. continues to generate robust growth in its cloud business, Azure, while Microsoft Teams has emerged as an important vehicle for corporate communications in an increasingly prevalent work-from-home environment. The company has also |
| 1 | Shareholder approval was received on September 14, 2021, to merge the PGIM Jennison 20/20 Focus Fund into the PGIM Jennison Focused Growth Fund. The merger was completed on December 10, 2021. |
| | |
| 8 | | Visit our website at pgim.com/investments |
| | benefited from the increasing market penetration of its subscription-based Office software, with over 300 million commercial Office 365 paid seats accounting for approximately 25% of the company’s total revenue. |
| ● | Eli Lilly and Co.’s core franchises include diabetes, immunology, neurodegeneration, and oncology. In June 2021, the company’s pipeline treatment for Alzheimer’s disease, donanemab, received Breakthrough Therapy designation from the Food and Drug Administration. In addition, the company is one of the top two global providers of diabetes treatments, offering blockbuster products such as Trulicity. Jennison sees opportunities for continued success, driven by the strong, near-term growth outlook for the commercial franchises, as well as the potential for pipeline assets such as investigational diabetes drug tirzepatide to boost longer-term growth. The company remains relatively protected compared to its larger-cap peers from meaningful patent expirations for the rest of the decade. |
What didn’t work?
The Fund’s overweight allocation to communication services and its underperformance in the strong-performing information technology sector detracted from relative returns during the reporting period.
Top absolute detractors:
| ● | RingCentral, Inc. is a leader in unified communications as a service (UCaaS), a cloud-based communication system that replaces traditional, on-premises phone systems with an application that can work from any location and device at a lower total cost of ownership. RingCentral shares, one of the Fund’s strongest performers in 2020, detracted from performance during the period as investors focused on the company’s elevated valuation, along with that of other high-growth software-as-a-service (SAAS) companies. The Fund exited its position to redeploy the assets into more attractive growth opportunities. |
| ● | Farfetch Ltd. provides a global online marketplace for luxury goods. The company’s platform connects more than 3,500 brands and 430,000 stocking units from more than 50 countries with more than 2.7 million customers around the world. It also provides comprehensive back-end logistics, such as fulfillment, distribution, and customer service. In addition, the company creates digital solutions for retailers, operates Browns fashion and luxury goods stores, and owns New Guard Group, a contemporary luxury fashion production and distribution holding company. Recent economic and top-down societal changes in China (a major source of future growth for the company, according to Jennison’s thesis) have resulted in a fundamental change in the company’s business model. In light of increased market uncertainty, the Fund exited its position to redeploy the assets into more attractive growth opportunities. |
| ● | Shares of cruise-operator Royal Caribbean Group struggled amid the COVID-19 pandemic that temporarily halted leisure cruise travel. The company restarted US cruises during the summer of 2021, following some initial success in Europe and |
| | | | |
PGIM Jennison 20/20 Focus Fund | | | 9 | |
Strategy and Performance Overview (continued)
| | Asia. Jennison originally believed a potential uplift in Royal Caribbean’s shares could occur as leisure travel picked up from pre-pandemic lows. However, new COVID-19 strains manifested throughout the year, resulting in an uneven reopening of cruise travel and negatively affecting Jennison’s investment thesis. The Fund exited its position to redeploy the assets into more attractive opportunities. |
Current outlook
| ● | Investors are facing a complex landscape heading into year-end as gross domestic product growth expectations have moderated in recognition of supply-chain constraints and component shortages. |
| ● | Many companies that reported strong operating results during the pandemic, due to the shift to online shopping and work-from-home business models, are currently facing challenging year-over-year financial comparisons. While this may be a headwind to share prices in the short term, Jennison believes the developments of the past 18 months have accelerated trends in consumer and enterprise behavior that were already in place prior to the arrival of COVID-19, and that the step-up in growth in these areas will persist for some time. Consensus estimates for the equities market in 2022 reflect an expected slowdown in activity, with market gain forecasts settling in the 8% to 9% range. |
| ● | While COVID-19 infections trended lower during the closing months of the reporting period, the appearance of the Omicron variant in November introduced new risks to the recovery story in the short term and ushered in a wave of volatility. |
| | |
| 10 | | Visit our website at pgim.com/investments |
Fees and Expenses (unaudited)
As a shareholder of the Fund, you incur two types of costs: (1) transaction costs, including sales charges (loads) on purchase payments and redemptions, as applicable, and (2) ongoing costs, including management fees, distribution and/or service (12b-1) fees, and other Fund expenses, as applicable. This example is intended to help you understand your ongoing costs (in dollars) of investing in the Fund and to compare these costs with the ongoing costs of investing in other mutual funds.
The example is based on an investment of $1,000 held through the six-month period ended November 30, 2021. The example is for illustrative purposes only; you should consult the Prospectus for information on initial and subsequent minimum investment requirements.
Actual Expenses
The first line for each share class in the table on the following page provides information about actual account values and actual expenses. You may use the information on this line, together with the amount you invested, to estimate the expenses that you paid over the period. Simply divide your account value by $1,000 (for example, an $8,600 account value ÷ $1,000 = 8.6), then multiply the result by the number on the first line under the heading “Expenses Paid During the Six-Month Period” to estimate the expenses you paid on your account during this period.
Hypothetical Example for Comparison Purposes
The second line for each share class in the table on the following page provides information about hypothetical account values and hypothetical expenses based on the Fund’s actual expense ratio and an assumed rate of return of 5% per year before expenses, which is not the Fund’s actual return. The hypothetical account values and expenses may not be used to estimate the actual ending account balance or expenses you paid for the period. You may use this information to compare the ongoing costs of investing in the Fund and other funds. To do so, compare this 5% hypothetical example with the 5% hypothetical examples that appear in the shareholder reports of the other funds.
The Fund’s transfer agent may charge additional fees to holders of certain accounts that are not included in the expenses shown in the table on the following page. These fees apply to individual retirement accounts (IRAs) and Section 403(b) accounts. As of the close of the six-month period covered by the table, IRA fees included an annual maintenance fee of $15 per account (subject to a maximum annual maintenance fee of $25 for all accounts held by the same shareholder). Section 403(b) accounts are charged an annual $25 fiduciary maintenance fee. Some of the fees may vary in amount, or may be waived, based on your total account balance or the number of PGIM funds, including the Fund, that you own. You should consider the additional fees that were charged to your Fund account over the six-month period when you estimate the total ongoing expenses paid over the period and the impact of these fees on your ending account value, as these additional expenses are not reflected in the information
| | | | |
PGIM Jennison 20/20 Focus Fund | | | 11 | |
Fees and Expenses (continued)
provided in the expense table. Additional fees have the effect of reducing investment returns.
Please note that the expenses shown in the table are meant to highlight your ongoing costs only and do not reflect any transactional costs such as sales charges (loads). Therefore, the second line for each share class in the table is useful in comparing ongoing costs only and will not help you determine the relative total costs of owning different funds. In addition, if these transactional costs were included, your costs would have been higher.
| | | | | | | | | | | | | | | | | | |
| | | | | | | | |
PGIM Jennison 20/20 Focus Fund | | Beginning
Account Value June 1, 2021 | | | | Ending
Account Value
November 30, 2021 | | | | Annualized
Expense
Ratio Based on
the
Six-Month Period | | | | Expenses Paid
During the
Six-Month
Period* | | |
| Class A | | Actual | | $1,000.00 | | | | $1,092.50 | | | | 1.28% | | | | $ 6.71 | | |
| | Hypothetical | | $1,000.00 | | | | $1,018.65 | | | | 1.28% | | | | $ 6.48 | | |
| Class C | | Actual | | $1,000.00 | | | | $1,088.40 | | | | 2.02% | | | | $10.58 | | |
| | Hypothetical | | $1,000.00 | | | | $1,014.94 | | | | 2.02% | | | | $10.20 | | |
| Class R | | Actual | | $1,000.00 | | | | $1,091.00 | | | | 1.53% | | | | $ 8.02 | | |
| | Hypothetical | | $1,000.00 | | | | $1,017.40 | | | | 1.53% | | | | $ 7.74 | | |
| Class Z | | Actual | | $1,000.00 | | | | $1,093.90 | | | | 0.98% | | | | $ 5.14 | | |
| | Hypothetical | | $1,000.00 | | | | $1,020.16 | | | | 0.98% | | | | $ 4.96 | | |
| Class R6 | | Actual | | $1,000.00 | | | | $1,094.70 | | | | 0.87% | | | | $ 4.57 | | |
| | | Hypothetical | | $1,000.00 | | | | $1,020.71 | | | | 0.87% | | | | $ 4.41 | | |
*Fund expenses (net of fee waivers or subsidies, if any) for each share class are equal to the annualized expense ratio for each share class (provided in the table), multiplied by the average account value over the period, multiplied by the 183 days in the six-month period ended November 30, 2021, and divided by the 365 days in the Fund’s fiscal year ended November 30, 2021 (to reflect the six-month period). Expenses presented in the table include the expenses of any underlying portfolios in which the Fund may invest.
| | |
| 12 | | Visit our website at pgim.com/investments |
Schedule of Investments
as of November 30, 2021
| | | | | | | | |
| | |
| Description | | Shares | | | Value | |
| | |
| LONG-TERM INVESTMENTS 100.0% | | | | | | |
| | |
| COMMON STOCKS | | | | | | |
| | |
| Automobiles 8.8% | | | | | | |
| Tesla, Inc.* | | | 89,694 | | | $ | 102,678,103 | |
| | |
| Entertainment 7.0% | | | | | | |
| Netflix, Inc.* | | | 57,769 | | | | 37,081,921 | |
| ROBLOX Corp. (Class A Stock)* | | | 149,878 | | | | 18,899,616 | |
| Sea Ltd. (Taiwan), ADR* | | | 90,996 | | | | 26,213,218 | |
| | | | | | | | |
| | |
| | | | | | | 82,194,755 | |
| | |
| Health Care Equipment & Supplies 2.1% | | | | | | |
| Align Technology, Inc.* | | | 39,070 | | | | 23,892,477 | |
| | |
| Hotels, Restaurants & Leisure 3.4% | | | | | | |
| Airbnb, Inc. (Class A Stock)* | | | 227,905 | | | | 39,322,729 | |
| | |
| Interactive Media & Services 12.0% | | | | | | |
| Alphabet, Inc. (Class A Stock)* | | | 13,014 | | | | 36,933,081 | |
| Alphabet, Inc. (Class C Stock)* | | | 13,029 | | | | 37,120,142 | |
| Match Group, Inc.* | | | 184,673 | | | | 24,005,643 | |
| Snap, Inc. (Class A Stock)* | | | 458,758 | | | | 21,841,469 | |
| ZoomInfo Technologies, Inc. (Class A Stock)* | | | 335,215 | | | | 20,682,766 | |
| | | | | | | | |
| | |
| | | | | | | 140,583,101 | |
| | |
| Internet & Direct Marketing Retail 9.7% | | | | | | |
| Amazon.com, Inc.* | | | 26,423 | | | | 92,667,310 | |
| MercadoLibre, Inc. (Argentina)* | | | 16,897 | | | | 20,080,564 | |
| | | | | | | | |
| | |
| | | | | | | 112,747,874 | |
| | |
| IT Services 17.0% | | | | | | |
| Adyen NV (Netherlands), 144A* | | | 12,376 | | | | 34,489,788 | |
| Mastercard, Inc. (Class A Stock) | | | 50,767 | | | | 15,987,544 | |
| Okta, Inc.* | | | 101,787 | | | | 21,907,616 | |
| Shopify, Inc. (Canada) (Class A Stock)* | | | 46,691 | | | | 71,053,897 | |
| Snowflake, Inc. (Class A Stock)* | | | 56,317 | | | | 19,156,227 | |
| Square, Inc. (Class A Stock)* | | | 171,317 | | | | 35,690,470 | |
| | | | | | | | |
| | |
| | | | | | | 198,285,542 | |
| | |
| Personal Products 3.1% | | | | | | |
| Estee Lauder Cos., Inc. (The) (Class A Stock) | | | 109,566 | | | | 36,383,582 | |
See Notes to Financial Statements.
| | | | |
PGIM Jennison 20/20 Focus Fund | | | 13 | |
Schedule of Investments (continued)
as of November 30, 2021
| | | | | | | | |
| | |
| Description | | Shares | | | Value | |
| | |
| COMMON STOCKS (Continued) | | | | | | |
| | |
| Pharmaceuticals 3.0% | | | | | | |
| Eli Lilly & Co. | | | 142,356 | | | $ | 35,309,982 | |
| | |
| Road & Rail 0.9% | | | | | | |
| Uber Technologies, Inc.* | | | 284,284 | | | | 10,802,792 | |
| | |
| Semiconductors & Semiconductor Equipment 6.6% | | | | | | |
| NVIDIA Corp. | | | 235,806 | | | | 77,051,968 | |
| | |
| Software 18.6% | | | | | | |
| Adobe, Inc.* | | | 66,389 | | | | 44,470,672 | |
| Atlassian Corp. PLC (Class A Stock)* | | | 47,755 | | | | 17,971,162 | |
| DocuSign, Inc.* | | | 80,965 | | | | 19,946,537 | |
| HubSpot, Inc.* | | | 34,176 | | | | 27,576,956 | |
| Microsoft Corp. | | | 232,061 | | | | 76,717,046 | |
| salesforce.com, Inc.* | | | 106,649 | | | | 30,390,699 | |
| | | | | | | | |
| | |
| | | | | | | 217,073,072 | |
| | |
| Textiles, Apparel & Luxury Goods 7.8% | | | | | | |
| Lululemon Athletica, Inc.* | | | 63,133 | | | | 28,688,267 | |
| LVMH Moet Hennessy Louis Vuitton SE (France) | | | 53,086 | | | | 41,320,631 | |
| NIKE, Inc. (Class B Stock) | | | 124,588 | | | | 21,085,273 | |
| | | | | | | | |
| | |
| | | | | | | 91,094,171 | |
| | | | | | | | |
| | |
TOTAL LONG-TERM INVESTMENTS
(cost $898,435,491) | | | | | | | 1,167,420,148 | |
| | | | | | | | |
| | |
| SHORT-TERM INVESTMENT 0.5% | | | | | | |
| | |
| AFFILIATED MUTUAL FUND | | | | | | |
PGIM Core Ultra Short Bond Fund
(cost $5,705,898)(wa) | | | 5,705,898 | | | | 5,705,898 | |
| | | | | | | | |
| | |
TOTAL INVESTMENTS 100.5%
(cost $904,141,389) | | | | | | | 1,173,126,046 | |
| Liabilities in excess of other assets (0.5)% | | | | | | | (5,502,265 | ) |
| | | | | | | | |
| | |
| NET ASSETS 100.0% | | | | | | $ | 1,167,623,781 | |
| | | | | | | | |
Below is a list of the abbreviation(s) used in the annual report:
144A—Security was purchased pursuant to Rule 144A under the Securities Act of 1933 and, pursuant to the requirements of Rule 144A, may not be resold except to qualified institutional buyers.
ADR—American Depositary Receipt
LIBOR—London Interbank Offered Rate
See Notes to Financial Statements.
| * | Non-income producing security. |
| (wa) | PGIM Investments LLC, the manager of the Fund, also serves as manager of the PGIM Core Ultra Short Bond Fund and PGIM Institutional Money Market Fund, if applicable. |
Fair Value Measurements:
Various inputs are used in determining the value of the Fund’s investments. These inputs are summarized in the three broad levels listed below.
Level 1—unadjusted quoted prices generally in active markets for identical securities.
Level 2—quoted prices for similar securities, interest rates and yield curves, prepayment speeds, foreign currency exchange rates and other observable inputs.
Level 3—unobservable inputs for securities valued in accordance with Board approved fair valuation procedures.
The following is a summary of the inputs used as of November 30, 2021 in valuing such portfolio securities:
| | | | | | | | | | | | |
| | | Level 1 | | | Level 2 | | | Level 3 | |
Investments in Securities | | | | | | | | | | | | |
Assets | | | | | | | | | | | | |
Long-Term Investments | | | | | | | | | | | | |
| Common Stocks | | | | | | | | | |
Automobiles | | $ | 102,678,103 | | | $ | — | | | | $— | |
Entertainment | | | 82,194,755 | | | | — | | | | — | |
Health Care Equipment & Supplies | | | 23,892,477 | | | | — | | | | — | |
Hotels, Restaurants & Leisure | | | 39,322,729 | | | | — | | | | — | |
Interactive Media & Services | | | 140,583,101 | | | | — | | | | — | |
Internet & Direct Marketing Retail | | | 112,747,874 | | | | — | | | | — | |
IT Services | | | 163,795,754 | | | | 34,489,788 | | | | — | |
Personal Products | | | 36,383,582 | | | | — | | | | — | |
Pharmaceuticals | | | 35,309,982 | | | | — | | | | — | |
Road & Rail | | | 10,802,792 | | | | — | | | | — | |
Semiconductors & Semiconductor Equipment | | | 77,051,968 | | | | — | | | | — | |
Software | | | 217,073,072 | | | | — | | | | — | |
Textiles, Apparel & Luxury Goods | | | 49,773,540 | | | | 41,320,631 | | | | — | |
| Short-Term Investment | | | | | | | | | |
Affiliated Mutual Fund | | | 5,705,898 | | | | — | | | | — | |
| | | | | | | | | | | | |
Total | | $ | 1,097,315,627 | | | $ | 75,810,419 | | | | $— | |
| | | | | | | | | | | | |
Industry Classification:
The industry classification of investments and liabilities in excess of other assets shown as a percentage of net assets as of November 30, 2021 were as follows (unaudited):
| | | | |
Software | | | 18.6 | % |
IT Services | | | 17.0 | |
Interactive Media & Services | | | 12.0 | |
Internet & Direct Marketing Retail | | | 9.7 | |
Automobiles | | | 8.8 | |
| | | | |
Textiles, Apparel & Luxury Goods | | | 7.8 | % |
Entertainment | | | 7.0 | |
Semiconductors & Semiconductor Equipment | | | 6.6 | |
Hotels, Restaurants & Leisure | | | 3.4 | |
Personal Products | | | 3.1 | |
See Notes to Financial Statements.
| | | | |
PGIM Jennison 20/20 Focus Fund | | | 15 | |
Schedule of Investments (continued)
as of November 30, 2021
Industry Classification (continued):
| | | | |
Pharmaceuticals | | | 3.0 | % |
Health Care Equipment & Supplies | | | 2.1 | |
Road & Rail | | | 0.9 | |
Affiliated Mutual Fund | | | 0.5 | |
| | | | |
| | | 100.5 | |
Liabilities in excess of other assets | | | (0.5 | ) |
| | | | |
| |
| | | 100.0 | % |
| | | | |
See Notes to Financial Statements.
Statement of Assets and Liabilities
as of November 30, 2021
| | | | |
Assets | |
Investments at value: | |
Unaffiliated investments (cost $898,435,491) | | $ | 1,167,420,148 | |
Affiliated investments (cost $5,705,898) | | | 5,705,898 | |
Receivable for investments sold | | | 513,163,466 | |
Dividends receivable | | | 922,111 | |
Receivable for Fund shares sold | | | 327,471 | |
Tax reclaim receivable | | | 78,397 | |
Prepaid expenses | | | 7,503 | |
| | | | |
Total Assets | | | 1,687,624,994 | |
| | | | |
|
Liabilities | |
Payable for investments purchased | | | 516,836,294 | |
Payable for Fund shares purchased | | | 1,808,858 | |
Management fee payable | | | 746,234 | |
Accrued expenses and other liabilities | | | 277,365 | |
Distribution fee payable | | | 271,710 | |
Affiliated transfer agent fee payable | | | 50,868 | |
Trustees’ fees payable | | | 5,744 | |
Payable to custodian | | | 4,140 | |
| | | | |
Total Liabilities | | | 520,001,213 | |
| | | | |
| |
Net Assets | | $ | 1,167,623,781 | |
| | | | |
| |
| | | | | |
Net assets were comprised of: | |
Shares of beneficial interest, at par | | $ | 55,943 | |
Paid-in capital in excess of par | | | 483,639,471 | |
Total distributable earnings (loss) | | | 683,928,367 | |
| | | | |
Net assets, November 30, 2021 | | $ | 1,167,623,781 | |
| | | | |
See Notes to Financial Statements.
| | | | |
PGIM Jennison 20/20 Focus Fund | | | 17 | |
Statement of Assets and Liabilities
as of November 30, 2021
| | | | |
Class A | | | | |
| |
Net asset value and redemption price per share,
($874,339,039 ÷ 42,071,526 outstanding shares of beneficial interest) | | $ | 20.78 | |
Maximum sales charge (5.50% of offering price) | | | 1.21 | |
| | | | |
Maximum offering price to public | | $ | 21.99 | |
| | | | |
| |
Class C | | | | |
| |
Net asset value, offering price and redemption price per share,
($27,823,758 ÷ 2,238,762 outstanding shares of beneficial interest) | | $ | 12.43 | |
| | | | |
| |
Class R | | | | |
| |
Net asset value, offering price and redemption price per share,
($52,668,148 ÷ 2,729,401 outstanding shares of beneficial interest) | | $ | 19.30 | |
| | | | |
| |
Class Z | | | | |
| |
Net asset value, offering price and redemption price per share,
($200,823,381 ÷ 8,408,183 outstanding shares of beneficial interest) | | $ | 23.88 | |
| | | | |
| |
Class R6 | | | | |
| |
Net asset value, offering price and redemption price per share,
($11,969,455 ÷ 495,340 outstanding shares of beneficial interest) | | $ | 24.16 | |
| | | | |
See Notes to Financial Statements.
Statement of Operations
Year Ended November 30, 2021
| | | | | |
Net Investment Income (Loss) | | | | | |
Income | | | | | |
Unaffiliated dividend income | | | $ | 10,250,598 | |
Interest income | | | | 175,478 | |
Income from securities lending, net (including affiliated income of $26,542) | | | | 43,472 | |
Affiliated dividend income | | | | 19,662 | |
| | | | | |
Total income | | | | 10,489,210 | |
| | | | | |
| |
Expenses | | | | | |
Management fee | | | | 8,432,044 | |
Distribution fee(a) | | | | 3,261,496 | |
Transfer agent’s fees and expenses (including affiliated expense of $377,152)(a) | | | | 1,087,475 | |
Shareholders’ reports | | | | 669,526 | |
Custodian and accounting fees | | | | 134,911 | |
Legal fees and expenses | | | | 124,646 | |
Registration fees(a) | | | | 65,316 | |
Audit fee | | | | 43,800 | |
Trustees’ fees | | | | 22,320 | |
Miscellaneous | | | | 64,107 | |
| | | | | |
Total expenses | | | | 13,905,641 | |
Less: Fee waiver and/or expense reimbursement(a) | | | | (10,444 | ) |
Distribution fee waiver(a) | | | | (131,251 | ) |
| | | | | |
Net expenses | | | | 13,763,946 | |
| | | | | |
Net investment income (loss) | | | | (3,274,736 | ) |
| | | | | |
| |
Realized And Unrealized Gain (Loss) On Investment And Foreign Currency Transactions | | | | | |
| |
Net realized gain (loss) on: | | | | | |
Investment transactions (including affiliated of $(4,102)) | | | | 420,314,001 | |
Foreign currency transactions | | | | (64,864 | ) |
| | | | | |
| | | | 420,249,137 | |
| | | | | |
Net change in unrealized appreciation (depreciation) on: | | | | | |
Investments | | | | (178,845,986 | ) |
Foreign currencies | | | | (103,771 | ) |
| | | | | |
| | | | (178,949,757 | ) |
| | | | | |
Net gain (loss) on investment and foreign currency transactions | | | | 241,299,380 | |
| | | | | |
Net Increase (Decrease) In Net Assets Resulting From Operations | | | $ | 238,024,644 | |
| | | | | |
| (a) | Class specific expenses and waivers were as follows: |
| | | | | | | | | | | | | | | | | | | | |
| | | Class A | | | Class C | | | Class R | | | Class Z | | | Class R6 | |
Distribution fee | | | 2,548,052 | | | | 319,692 | | | | 393,752 | | | | — | | | | — | |
Transfer agent’s fees and expenses | | | 812,349 | | | | 35,637 | | | | 74,681 | | | | 164,481 | | | | 327 | |
Registration fees | | | 20,400 | | | | 13,488 | | | | 6,568 | | | | 14,743 | | | | 10,117 | |
Fee waiver and/or expense reimbursement | | | — | | | | — | | | | — | | | | — | | | | (10,444 | ) |
Distribution fee waiver | | | — | | | | — | | | | (131,251 | ) | | | — | | | | — | |
See Notes to Financial Statements.
| | | | |
PGIM Jennison 20/20 Focus Fund | | | 19 | |
Statements of Changes in Net Assets
| | | | | | | | |
| |
| | | Year Ended November 30, | |
| | |
| | | 2021 | | | 2020 | |
| | |
Increase (Decrease) in Net Assets | | | | | | | | |
| | |
Operations | | | | | | | | |
Net investment income (loss) | | $ | (3,274,736 | ) | | $ | 914,544 | |
Net realized gain (loss) on investment and foreign currency transactions | | | 420,249,137 | | | | 115,666,923 | |
Net change in unrealized appreciation (depreciation) on investments and foreign currencies | | | (178,949,757 | ) | | | 134,384,150 | |
| | | | | | | | |
Net increase (decrease) in net assets resulting from operations | | | 238,024,644 | | | | 250,965,617 | |
| | | | | | | | |
Dividends and Distributions | | | | | | | | |
Distributions from distributable earnings | | | | | | | | |
Class A | | | (85,250,971 | ) | | | (48,911,734 | ) |
Class B | | | — | | | | (690,759 | ) |
Class C | | | (6,667,904 | ) | | | (5,430,237 | ) |
Class R | | | (5,802,850 | ) | | | (3,546,361 | ) |
Class Z | | | (18,298,435 | ) | | | (11,546,216 | ) |
Class R6 | | | (278,719 | ) | | | (109,205 | ) |
| | | | | | | | |
| | | (116,298,879 | ) | | | (70,234,512 | ) |
| | | | | | | | |
| | |
Fund share transactions (Net of share conversions) | | | | | | | | |
Net proceeds from shares sold | | | 46,420,388 | | | | 36,304,637 | |
Net asset value of shares issued in reinvestment of dividends and distributions | | | 111,729,682 | | | | 66,835,067 | |
Cost of shares purchased | | | (164,285,932 | ) | | | (199,988,335 | ) |
| | | | | | | | |
Net increase (decrease) in net assets from Fund share transactions | | | (6,135,862 | ) | | | (96,848,631 | ) |
| | | | | | | | |
Total increase (decrease) | | | 115,589,903 | | | | 83,882,474 | |
| | |
Net Assets: | | | | | | | | |
| | |
Beginning of year | | | 1,052,033,878 | | | | 968,151,404 | |
| | | | | | | | |
End of year | | $ | 1,167,623,781 | | | $ | 1,052,033,878 | |
| | | | | | | | |
See Notes to Financial Statements.
Financial Highlights
| | | | | | | | | | | | | | | | | | | | |
| |
| Class A Shares | |
| | | | | | Year Ended November 30, | | | | |
| | | 2021 | | | 2020 | | | 2019 | | | 2018 | | | 2017 | |
| Per Share Operating Performance(a): | | | | | | | | | | | | | | | | | | | | |
| Net Asset Value, Beginning of Year | | | $18.79 | | | | $15.56 | | | | $15.13 | | | | $17.47 | | | | $15.08 | |
| Income (loss) from investment operations: | | | | | | | | | | | | | | | | | | | | |
| Net investment income (loss) | | | (0.06 | ) | | | 0.01 | | | | 0.04 | | | | 0.05 | | | | - | (b) |
| Net realized and unrealized gain (loss) on investment and foreign currency transactions | | | 4.12 | | | | 4.35 | | | | 1.64 | | | | 0.66 | | | | 3.72 | |
| Total from investment operations | | | 4.06 | | | | 4.36 | | | | 1.68 | | | | 0.71 | | | | 3.72 | |
| Less Dividends and Distributions: | | | | | | | | | | | | | | | | | | | | |
| Dividends from net investment income | | | (0.01 | ) | | | (0.04 | ) | | | (0.05 | ) | | | - | | | | - | |
| Distributions from net realized gains | | | (2.06 | ) | | | (1.09 | ) | | | (1.20 | ) | | | (3.05 | ) | | | (1.33 | ) |
| Total dividends and distributions | | | (2.07 | ) | | | (1.13 | ) | | | (1.25 | ) | | | (3.05 | ) | | | (1.33 | ) |
| Net asset value, end of year | | | $20.78 | | | | $18.79 | | | | $15.56 | | | | $15.13 | | | | $17.47 | |
| Total Return(c): | | | 23.78 | % | | | 29.84 | % | | | 13.32 | % | | | 4.67 | % | | | 26.80 | % |
| | | | | | | | | | | | | | | | | | | | | |
| Ratios/Supplemental Data: | |
| Net assets, end of year (000) | | | $874,339 | | | | $774,846 | | | | $679,905 | | | | $625,305 | | | | $669,346 | |
| Average net assets (000) | | | $849,351 | | | | $687,253 | | | | $640,722 | | | | $669,459 | | | | $635,030 | |
| Ratios to average net assets(d)(e): | | | | | | | | | | | | | | | | | | | | |
| Expenses after waivers and/or expense reimbursement | | | 1.24 | % | | | 1.20 | % | | | 1.22 | % | | | 1.19 | % | | | 1.21 | % |
| Expenses before waivers and/or expense reimbursement | | | 1.24 | % | | | 1.20 | % | | | 1.22 | % | | | 1.19 | % | | | 1.21 | % |
| Net investment income (loss) | | | (0.31 | )% | | | 0.09 | % | | | 0.28 | % | | | 0.35 | % | | | (0.03 | )% |
| Portfolio turnover rate(f) | | | 106 | % | | | 74 | % | | | 58 | % | | | 43 | % | | | 74 | % |
| (a) | Calculated based on average shares outstanding during the year. |
| (b) | Amount rounds to zero. |
| (c) | Total return does not consider the effects of sales loads. Total return is calculated assuming a purchase of a share on the first day and a sale on the last day of each year reported and includes reinvestment of dividends and distributions, if any. Total returns may reflect adjustments to conform to GAAP. |
| (d) | Does not include expenses of the underlying funds in which the Fund invests. |
| (e) | Effective December 1, 2017, class specific expenses include transfer agent fees and expenses and registration fees, which are charged to their respective share class. |
| (f) | The Fund’s portfolio turnover rate is calculated in accordance with regulatory requirements, without regard to transactions involving short-term investments, certain derivatives and in-kind transactions (if any). If such transactions were included, the Fund’s portfolio turnover rate may be higher. |
See Notes to Financial Statements.
| | | | |
PGIM Jennison 20/20 Focus Fund | | | 21 | |
Financial Highlights (continued)
| | | | | | | | | | | | | | | | | | | | |
| |
| Class C Shares | |
| | | | | | Year Ended November 30, | | | | |
| | | 2021 | | | 2020 | | | 2019 | | | 2018 | | | 2017 | |
| Per Share Operating Performance(a): | | | | | | | | | | | | | | | | | | | | |
| Net Asset Value, Beginning of Year | | | $12.11 | | | | $10.45 | | | | $10.62 | | | | $13.24 | | | | $11.81 | |
| Income (loss) from investment operations: | | | | | | | | | | | | | | | | | | | | |
| Net investment income (loss) | | | (0.12 | ) | | | (0.06 | )(b) | | | (0.04 | ) | | | (0.04 | ) | | | (0.09 | ) |
| Net realized and unrealized gain (loss) on investment and foreign currency transactions | | | 2.50 | | | | 2.81 | | | | 1.07 | | | | 0.47 | | | | 2.85 | |
| Total from investment operations | | | 2.38 | | | | 2.75 | | | | 1.03 | | | | 0.43 | | | | 2.76 | |
| Less Dividends and Distributions: | | | | | | | | | | | | | | | | | | | | |
| Distributions from net realized gains | | | (2.06 | ) | | | (1.09 | ) | | | (1.20 | ) | | | (3.05 | ) | | | (1.33 | ) |
| Net asset value, end of year | | | $12.43 | | | | $12.11 | | | | $10.45 | | | | $10.62 | | | | $13.24 | |
| Total Return(c): | | | 22.79 | % | | | 28.86 | % | | | 12.63 | % | | | 3.90 | % | | | 26.00 | % |
| | | | | | | | | | | | | | | | | | | | | |
| Ratios/Supplemental Data: | |
| Net assets, end of year (000) | | | $27,824 | | | | $39,446 | | | | $53,995 | | | | $135,532 | | | | $168,242 | |
| Average net assets (000) | | | $31,969 | | | | $42,312 | | | | $87,750 | | | | $156,720 | | | | $174,421 | |
| Ratios to average net assets(d)(e): | | | | | | | | | | | | | | | | | | | | |
| Expenses after waivers and/or expense reimbursement | | | 1.98 | % | | | 1.93 | % | | | 1.91 | % | | | 1.87 | % | | | 1.91 | % |
| Expenses before waivers and/or expense reimbursement | | | 1.98 | % | | | 1.93 | % | | | 1.91 | % | | | 1.87 | % | | | 1.91 | % |
| Net investment income (loss) | | | (1.06 | )% | | | (0.62 | )% | | | (0.42 | )% | | | (0.34 | )% | | | (0.74 | )% |
| Portfolio turnover rate(f) | | | 106 | % | | | 74 | % | | | 58 | % | | | 43 | % | | | 74 | % |
| (a) | Calculated based on average shares outstanding during the year. |
| (b) | The per share amount of net investment income (loss) does not directly correlate to the amounts reported in the Statement of Operations due to class specific expenses. |
| (c) | Total return does not consider the effects of sales loads. Total return is calculated assuming a purchase of a share on the first day and a sale on the last day of each year reported and includes reinvestment of dividends and distributions, if any. Total returns may reflect adjustments to conform to GAAP. |
| (d) | Does not include expenses of the underlying funds in which the Fund invests. |
| (e) | Effective December 1, 2017, class specific expenses include transfer agent fees and expenses and registration fees, which are charged to their respective share class. |
| (f) | The Fund’s portfolio turnover rate is calculated in accordance with regulatory requirements, without regard to transactions involving short-term investments, certain derivatives and in-kind transactions (if any). If such transactions were included, the Fund’s portfolio turnover rate may be higher. |
See Notes to Financial Statements.
| | | | | | | | | | | | | | | | | | | | |
| |
| Class R Shares | |
| | | | | | Year Ended November 30, | | | | |
| | | 2021 | | | 2020 | | | 2019 | | | 2018 | | | 2017 | |
| Per Share Operating Performance(a): | | | | | | | | | | | | | | | | | | | | |
| Net Asset Value, Beginning of Year | | | $17.62 | | | | $14.67 | | | | $14.34 | | | | $16.75 | | | | $14.53 | |
| Income (loss) from investment operations: | | | | | | | | | | | | | | | | | | | | |
| Net investment income (loss) | | | (0.10 | ) | | | (0.02 | )(b) | | | 0.01 | | | | 0.01 | | | | (0.04 | ) |
| Net realized and unrealized gain (loss) on investment and foreign currency transactions | | | 3.84 | | | | 4.07 | | | | 1.54 | | | | 0.63 | | | | 3.59 | |
| Total from investment operations | | | 3.74 | | | | 4.05 | | | | 1.55 | | | | 0.64 | | | | 3.55 | |
| Less Dividends and Distributions: | | | | | | | | | | | | | | | | | | | | |
| Dividends from net investment income | | | - | | | | (0.01 | ) | | | (0.02 | ) | | | - | | | | - | |
| Distributions from net realized gains | | | (2.06 | ) | | | (1.09 | ) | | | (1.20 | ) | | | (3.05 | ) | | | (1.33 | ) |
| Total dividends and distributions | | | (2.06 | ) | | | (1.10 | ) | | | (1.22 | ) | | | (3.05 | ) | | | (1.33 | ) |
| Net asset value, end of year | | | $19.30 | | | | $17.62 | | | | $14.67 | | | | $14.34 | | | | $16.75 | |
| Total Return(c): | | | 23.44 | % | | | 29.46 | % | | | 13.04 | % | | | 4.43 | % | | | 26.62 | % |
| | | | | | | | | | | | | | | | | | | | | |
| Ratios/Supplemental Data: | |
| Net assets, end of year (000) | | | $52,668 | | | | $49,991 | | | | $49,859 | | | | $53,740 | | | | $61,400 | |
| Average net assets (000) | | | $52,500 | | | | $45,653 | | | | $50,419 | | | | $59,521 | | | | $61,905 | |
| Ratios to average net assets(d)(e): | | | | | | | | | | | | | | | | | | | | |
| Expenses after waivers and/or expense reimbursement | | | 1.49 | % | | | 1.46 | % | | | 1.46 | % | | | 1.45 | % | | | 1.41 | % |
| Expenses before waivers and/or expense reimbursement | | | 1.74 | % | | | 1.71 | % | | | 1.71 | % | | | 1.70 | % | | | 1.66 | % |
| Net investment income (loss) | | | (0.57 | )% | | | (0.16 | )% | | | 0.04 | % | | | 0.10 | % | | | (0.24 | )% |
| Portfolio turnover rate(f) | | | 106 | % | | | 74 | % | | | 58 | % | | | 43 | % | | | 74 | % |
| (a) | Calculated based on average shares outstanding during the year. |
| (b) | The per share amount of net investment income (loss) does not directly correlate to the amounts reported in the Statement of Operations due to class specific expenses. |
| (c) | Total return is calculated assuming a purchase of a share on the first day and a sale on the last day of each year reported and includes reinvestment of dividends and distributions, if any. Total returns may reflect adjustments to conform to GAAP. |
| (d) | Does not include expenses of the underlying funds in which the Fund invests. |
| (e) | Effective December 1, 2017, class specific expenses include transfer agent fees and expenses and registration fees, which are charged to their respective share class. |
| (f) | The Fund’s portfolio turnover rate is calculated in accordance with regulatory requirements, without regard to transactions involving short-term investments, certain derivatives and in-kind transactions (if any). If such transactions were included, the Fund’s portfolio turnover rate may be higher. |
See Notes to Financial Statements.
| | | | |
PGIM Jennison 20/20 Focus Fund | | | 23 | |
Financial Highlights (continued)
| | | | | | | | | | | | | | | | | | | | |
| |
| Class Z Shares | |
| | | | | | Year Ended November 30, | | | | |
| | | 2021 | | | 2020 | | | 2019 | | | 2018 | | | 2017 | |
| Per Share Operating Performance(a): | | | | | | | | | | | | | | | | | | | | |
| Net Asset Value, Beginning of Year | | | $21.29 | | | | $17.48 | | | | $16.82 | | | | $19.04 | | | | $16.28 | |
| Income (loss) from investment operations: | | | | | | | | | | | | | | | | | | | | |
| Net investment income (loss) | | | - | (b) | | | 0.07 | | | | 0.10 | | | | 0.12 | | | | 0.05 | |
| Net realized and unrealized gain (loss) on investment and foreign currency transactions | | | 4.71 | | | | 4.91 | | | | 1.86 | | | | 0.71 | | | | 4.05 | |
| Total from investment operations | | | 4.71 | | | | 4.98 | | | | 1.96 | | | | 0.83 | | | | 4.10 | |
| Less Dividends and Distributions: | | | | | | | | | | | | | | | | | | | | |
| Dividends from net investment income | | | (0.06 | ) | | | (0.08 | ) | | | (0.10 | ) | | | - | | | | (0.01 | ) |
| Distributions from net realized gains | | | (2.06 | ) | | | (1.09 | ) | | | (1.20 | ) | | | (3.05 | ) | | | (1.33 | ) |
| Total dividends and distributions | | | (2.12 | ) | | | (1.17 | ) | | | (1.30 | ) | | | (3.05 | ) | | | (1.34 | ) |
| Net asset value, end of year | | | $23.88 | | | | $21.29 | | | | $17.48 | | | | $16.82 | | | | $19.04 | |
| Total Return(c): | | | 24.11 | % | | | 30.24 | % | | | 13.74 | % | | | 4.97 | % | | | 27.24 | % |
| | | | | | | | | | | | | | | | | | | | | |
| Ratios/Supplemental Data: | |
| Net assets, end of year (000) | | | $200,823 | | | | $184,958 | | | | $175,890 | | | | $204,828 | | | | $245,992 | |
| Average net assets (000) | | | $191,517 | | | | $165,790 | | | | $177,194 | | | | $230,237 | | | | $241,318 | |
| Ratios to average net assets(d)(e): | | | | | | | | | | | | | | | | | | | | |
| Expenses after waivers and/or expense reimbursement | | | 0.93 | % | | | 0.89 | % | | | 0.89 | % | | | 0.87 | % | | | 0.91 | % |
| Expenses before waivers and/or expense reimbursement | | | 0.93 | % | | | 0.89 | % | | | 0.89 | % | | | 0.87 | % | | | 0.91 | % |
| Net investment income (loss) | | | - | %(b) | | | 0.41 | % | | | 0.61 | % | | | 0.68 | % | | | 0.27 | % |
| Portfolio turnover rate(f) | | | 106 | % | | | 74 | % | | | 58 | % | | | 43 | % | | | 74 | % |
| (a) | Calculated based on average shares outstanding during the year. |
| (b) | Amount rounds to zero. |
| (c) | Total return is calculated assuming a purchase of a share on the first day and a sale on the last day of each year reported and includes reinvestment of dividends and distributions, if any. Total returns may reflect adjustments to conform to GAAP. |
| (d) | Does not include expenses of the underlying funds in which the Fund invests. |
| (e) | Effective December 1, 2017, class specific expenses include transfer agent fees and expenses and registration fees, which are charged to their respective share class. |
| (f) | The Fund’s portfolio turnover rate is calculated in accordance with regulatory requirements, without regard to transactions involving short-term investments, certain derivatives and in-kind transactions (if any). If such transactions were included, the Fund’s portfolio turnover rate may be higher. |
See Notes to Financial Statements.
| | | | | | | | | | | | | | | | | | | | |
| |
| Class R6 Shares | |
| | | Year Ended November 30, | |
| | | 2021 | | | 2020 | | | 2019 | | | 2018 | | | 2017 | |
| Per Share Operating Performance(a): | | | | | | | | | | | | | | | | | | | | |
| Net Asset Value, Beginning of Year | | $ | 21.51 | | | $ | 17.65 | | | $ | 16.97 | | | $ | 19.17 | | | $ | 16.38 | |
| Income (loss) from investment operations: | | | | | | | | | | | | | | | | | | | | |
| Net investment income (loss) | | | 0.01 | (b) | | | 0.08 | | | | 0.11 | | | | 0.12 | | | | 0.07 | |
| Net realized and unrealized gain (loss) on investment and foreign currency transactions | | | 4.77 | | | | 4.96 | | | | 1.88 | | | | 0.73 | | | | 4.08 | |
| Total from investment operations | | | 4.78 | | | | 5.04 | | | | 1.99 | | | | 0.85 | | | | 4.15 | |
| Less Dividends and Distributions: | | | | | | | | | | | | | | | | | | | | |
| Dividends from net investment income | | | (0.07 | ) | | | (0.09 | ) | | | (0.11 | ) | | | - | | | | (0.03 | ) |
| Distributions from net realized gains | | | (2.06 | ) | | | (1.09 | ) | | | (1.20 | ) | | | (3.05 | ) | | | (1.33 | ) |
| Total dividends and distributions | | | (2.13 | ) | | | (1.18 | ) | | | (1.31 | ) | | | (3.05 | ) | | | (1.36 | ) |
| Net asset value, end of year | | $ | 24.16 | | | $ | 21.51 | | | $ | 17.65 | | | $ | 16.97 | | | $ | 19.17 | |
| Total Return(c): | | | 24.19 | % | | | 30.36 | % | | | 13.71 | % | | | 5.06 | % | | | 27.42 | % |
| | | | | | | | | | | | | | | | | | | | | |
| Ratios/Supplemental Data: | |
| Net assets, end of year (000) | | $ | 11,969 | | | $ | 2,792 | | | $ | 1,634 | | | $ | 9,090 | | | $ | 8,496 | |
| Average net assets (000) | | $ | 7,812 | | | $ | 2,063 | | | $ | 5,438 | | | $ | 8,972 | | | $ | 7,957 | |
| Ratios to average net assets(d)(e): | | | | | | | | | | | | | | | | | | | | |
| Expenses after waivers and/or expense reimbursement | | | 0.86 | % | | | 0.84 | % | | | 0.84 | % | | | 0.84 | % | | | 0.78 | % |
| Expenses before waivers and/or expense reimbursement | | | 0.99 | % | | | 1.54 | % | | | 1.08 | % | | | 0.95 | % | | | 0.78 | % |
| Net investment income (loss) | | | 0.04 | % | | | 0.43 | % | | | 0.70 | % | | | 0.71 | % | | | 0.39 | % |
| Portfolio turnover rate(f) | | | 106 | % | | | 74 | % | | | 58 | % | | | 43 | % | | | 74 | % |
| (a) | Calculated based on average shares outstanding during the year. |
| (b) | The per share amount of net investment income (loss) does not directly correlate to the amounts reported in the Statement of Operations due to class specific expenses. |
| (c) | Total return is calculated assuming a purchase of a share on the first day and a sale on the last day of each year reported and includes reinvestment of dividends and distributions, if any. Total returns may reflect adjustments to conform to GAAP. |
| (d) | Does not include expenses of the underlying funds in which the Fund invests. |
| (e) | Effective December 1, 2017, class specific expenses include transfer agent fees and expenses and registration fees, which are charged to their respective share class. |
| (f) | The Fund’s portfolio turnover rate is calculated in accordance with regulatory requirements, without regard to transactions involving short-term investments, certain derivatives and in-kind transactions (if any). If such transactions were included, the Fund’s portfolio turnover rate may be higher. |
See Notes to Financial Statements.
| | | | |
PGIM Jennison 20/20 Focus Fund | | | 25 | |
Notes to Financial Statements
1. Organization
Prudential Investment Portfolios 18 (the “Registered Investment Company” or “RIC”) is registered under the Investment Company Act of 1940, as amended (“1940 Act”), as an open-end management investment company. The RIC is organized as a Delaware Statutory Trust. These financial statements relate only to the PGIM Jennison 20/20 Focus Fund (the “Fund”), a series of the RIC. The Fund is classified as a non-diversified fund for purposes of the 1940 Act.
The investment objective of the Fund is long-term growth of capital.
2. Accounting Policies
The Fund follows the investment company accounting and reporting guidance of the Financial Accounting Standards Board (“FASB”) Accounting Standard Codification (“ASC”) Topic 946 Financial Services — Investment Companies. The following is a summary of significant accounting policies followed by the Fund in the preparation of its financial statements. The policies conform to U.S. generally accepted accounting principles (“GAAP”). The Fund consistently follows such policies in the preparation of its financial statements.
Securities Valuation: The Fund holds securities and other assets and liabilities that are fair valued as of the close of each day (generally, 4:00 PM Eastern time) the New York Stock Exchange (“NYSE”) is open for trading. As described in further detail below, the Fund’s investments are valued daily based on a number of factors, including the type of investment and whether market quotations are readily available. The RIC’s Board of Trustees (the “Board”) has adopted valuation procedures for security valuation under which fair valuation responsibilities have been delegated to PGIM Investments LLC (“PGIM Investments” or the “Manager”). Pursuant to the Board’s delegation, the Manager has established a Valuation Committee responsible for supervising the fair valuation of portfolio securities and other assets and liabilities. The valuation procedures permit the Fund to utilize independent pricing vendor services, quotations from market makers, and alternative valuation methods when market quotations are either not readily available or not deemed representative of fair value. Fair value is the price that would be received to sell an asset or paid to transfer a liability in an orderly transaction between market participants on the measurement date. A record of the Valuation Committee’s actions is subject to the Board’s review at its first quarterly meeting following the quarter in which such actions take place.
For the fiscal reporting year-end, securities and other assets and liabilities were fair valued at the close of the last U.S. business day. Trading in certain foreign securities may occur when the NYSE is closed (including weekends and holidays). Because such foreign securities
trade in markets that are open on weekends and U.S. holidays, the values of some of the Fund’s foreign investments may change on days when investors cannot purchase or redeem Fund shares.
Various inputs determine how the Fund’s investments are valued, all of which are categorized according to the three broad levels (Level 1, 2, or 3) detailed in the Schedule of Investments and referred to herein as the “fair value hierarchy” in accordance with FASB ASC Topic 820 - Fair Value Measurement.
Common or preferred stocks, exchange-traded funds and derivative instruments, if applicable, that are traded on a national securities exchange are valued at the last sale price as of the close of trading on the applicable exchange where the security principally trades. Securities traded via NASDAQ are valued at the NASDAQ official closing price. To the extent these securities are valued at the last sale price or NASDAQ official closing price, they are classified as Level 1 in the fair value hierarchy. In the event that no sale or official closing price on valuation date exists, these securities are generally valued at the mean between the last reported bid and ask prices, or at the last bid price in the absence of an ask price. These securities are classified as Level 2 in the fair value hierarchy.
Foreign equities traded on foreign securities exchanges are generally valued using pricing vendor services that provide model prices derived using adjustment factors based on information such as local closing price, relevant general and sector indices, currency fluctuations, depositary receipts, and futures, as applicable. Securities valued using such model prices are classified as Level 2 in the fair value hierarchy. The models generate an evaluated adjustment factor for each security, which is applied to the local closing price to adjust it for post closing market movements up to the time the Fund is valued. Utilizing that evaluated adjustment factor, the vendor provides an evaluated price for each security. If the vendor does not provide an evaluated price, securities are valued in accordance with exchange-traded common and preferred stock valuation policies discussed above.
Investments in open-end funds (other than exchange-traded funds) are valued at their net asset values as of the close of the NYSE on the date of valuation. These securities are classified as Level 1 in the fair value hierarchy since they may be purchased or sold at their net asset values on the date of valuation.
Securities and other assets that cannot be priced according to the methods described above are valued based on pricing methodologies approved by the Board. In the event that unobservable inputs are used when determining such valuations, the securities will be classified as Level 3 in the fair value hierarchy. Altering one or more unobservable inputs may result in a significant change to a Level 3 security’s fair value measurement.
When determining the fair value of securities, some of the factors influencing the valuation include: the nature of any restrictions on disposition of the securities; assessment of the general liquidity of the securities; the issuer’s financial condition and the markets in which it does business; the cost of the investment; the size of the holding and the capitalization of
| | | | |
PGIM Jennison 20/20 Focus Fund | | | 27 | |
Notes to Financial Statements (continued)
the issuer; the prices of any recent transactions or bids/offers for such securities or any comparable securities; any available analyst media or other reports or information deemed reliable by the Manager regarding the issuer or the markets or industry in which it operates. Using fair value to price securities may result in a value that is different from a security’s most recent closing price and from the price used by other unaffiliated mutual funds to calculate their net asset values.
Foreign Currency Translation: The books and records of the Fund are maintained in U.S. dollars. Foreign currency amounts are translated into U.S. dollars on the following basis:
(i) market value of investment securities, other assets and liabilities — at the exchange rate as of the valuation date;
(ii) purchases and sales of investment securities, income and expenses — at the rates of exchange prevailing on the respective dates of such transactions.
Although the net assets of the Fund are presented at the foreign exchange rates and market values at the close of the period, the Fund does not generally isolate that portion of the results of operations arising as a result of changes in the foreign exchange rates from the fluctuations arising from changes in the market prices of long-term portfolio securities held at the end of the period. Similarly, the Fund does not isolate the effect of changes in foreign exchange rates from the fluctuations arising from changes in the market prices of long-term portfolio securities sold during the period. Accordingly, holding period unrealized and realized foreign currency gains (losses) are included in the reported Net change in unrealized appreciation (depreciation) on investments and Net realized gains (losses) on investment transactions on the Statements of Operations.
Net realized gains (losses) on foreign currency transactions represent net foreign exchange gains (losses) from the disposition of holdings of foreign currencies, currency gains (losses) realized between the trade and settlement dates on investment transactions, and the difference between the amounts of interest, dividends and foreign withholding taxes recorded on the Fund’s books and the U.S. dollar equivalent amounts actually received or paid. Net unrealized currency gains (losses) arise from valuing foreign currency denominated assets and liabilities (other than investments) at period end exchange rates.
Master Netting Arrangements: The RIC, on behalf of the Fund, is subject to various Master Agreements, or netting arrangements, with select counterparties. These are agreements which a subadviser may have negotiated and entered into on behalf of all or a portion of the Fund. A master netting arrangement between the Fund and the counterparty permits the Fund to offset amounts payable by the Fund to the same counterparty against amounts to be received; and by the receipt of collateral from the counterparty by the Fund to cover the
Fund’s exposure to the counterparty. However, there is no assurance that such mitigating factors are easily enforceable. In addition to master netting arrangements, the right to set-off exists when all the conditions are met such that each of the parties owes the other determinable amounts, the reporting party has the right to set-off the amount owed with the amount owed by the other party, the reporting party intends to set-off and the right of set-off is enforceable by law.
Securities Lending: The Fund lends its portfolio securities to banks and broker-dealers. The loans are secured by collateral at least equal to the market value of the securities loaned. Collateral pledged by each borrower is invested in an affiliated money market fund and is marked to market daily, based on the previous day’s market value, such that the value of the collateral exceeds the value of the loaned securities. In the event of significant appreciation in value of securities on loan on the last business day of the reporting period, the financial statements may reflect a collateral value that is less than the market value of the loaned securities. Such shortfall is remedied as described above. Loans are subject to termination at the option of the borrower or the Fund. Upon termination of the loan, the borrower will return to the Fund securities identical to the loaned securities. The remaining maturities of the securities lending transactions are considered overnight and continuous. Should the borrower of the securities fail financially, the Fund has the right to repurchase the securities in the open market using the collateral.
The Fund recognizes income, net of any rebate and securities lending agent fees, for lending its securities in the form of fees or interest on the investment of any cash received as collateral. The borrower receives all interest and dividends from the securities loaned and such payments are passed back to the lender in amounts equivalent thereto, which are reflected in interest income or unaffiliated dividend income based on the nature of the payment on the Statement of Operations. The Fund also continues to recognize any unrealized gain (loss) in the market price of the securities loaned and on the change in the value of the collateral invested that may occur during the term of the loan. In addition, realized gain (loss) is recognized on changes in the value of the collateral invested upon liquidation of the collateral. Net earnings from securities lending are disclosed in the Statement of Operations.
Securities Transactions and Net Investment Income: Securities transactions are recorded on the trade date. Realized gains (losses) from investment and currency transactions are calculated on the specific identification method. Dividend income is recorded on the ex-date, or for certain foreign securities, when the Fund becomes aware of such dividends. Expenses are recorded on an accrual basis, which may require the use of certain estimates by management that may differ from actual. Net investment income or loss (other than class specific expenses and waivers, which are allocated as noted below) and unrealized and realized gains (losses) are allocated daily to each class of shares based upon the relative proportion of adjusted net assets of each class at the beginning of the day. Class specific expenses and waivers, where applicable, are charged to the respective share classes. Such class specific expenses and waivers include distribution fees and distribution fee waivers,
| | | | |
PGIM Jennison 20/20 Focus Fund | | | 29 | |
Notes to Financial Statements (continued)
shareholder servicing fees, transfer agent’s fees and expenses, registration fees and fee waivers and/or expense reimbursements, as applicable.
Taxes: It is the Fund’s policy to continue to meet the requirements of the Internal Revenue Code applicable to regulated investment companies and to distribute all of its taxable net investment income and capital gains, if any, to its shareholders. Therefore, no federal income tax provision is required. Withholding taxes on foreign dividends, interest and capital gains, if any, are recorded, net of reclaimable amounts, at the time the related income is earned.
Dividends and Distributions: The Fund expects to pay dividends from net investment income and distributions from net realized capital gains, if any, annually. Dividends and distributions to shareholders, which are determined in accordance with federal income tax regulations and which may differ from GAAP, are recorded on the ex-date. Permanent book/tax differences relating to income and gain (loss) are reclassified between total distributable earnings (loss) and paid-in capital in excess of par, as appropriate.
Estimates: The preparation of financial statements requires management to make estimates and assumptions that affect the reported amounts and disclosures in the financial statements. Actual results could differ from those estimates.
3. Agreements
The RIC, on behalf of the Fund, has a management agreement with the Manager. Pursuant to this agreement, the Manager has responsibility for all investment advisory services and supervises the subadviser’s performance of such services.
The Manager has entered into a subadvisory agreement with Jennison Associates LLC (“Jennison” or the “subadviser”). The Manager pays for the services of Jennison.
The management fee paid to the Manager is accrued daily and payable monthly at an annual rate of 0.75% of the Fund’s average daily net assets up to and including $1 billion and 0.70% of such assets in excess of $1 billion. The effective management fee rate before any waivers and/or expense reimbursements was 0.74% for the year ended November 30, 2021.
The Manager has contractually agreed, through March 31, 2022, to limit transfer agency, shareholder servicing, sub-transfer agency, and blue sky fees, as applicable, to the extent that such fees cause the total annual operating expenses to exceed 0.84% of average daily net assets for Class R6 shares. This contractual expense limitation excludes interest, brokerage, taxes (such as income and foreign withholding taxes, stamp duty and deferred
tax expenses), acquired fund fees and expenses, extraordinary expenses, and certain other Fund expenses such as dividend and interest expense and broker charges on short sales.
Where applicable, the Manager agrees to waive management fees or shared operating expenses on any share class to the same extent that it waives such expenses on any other share class. In addition, total annual operating expenses for Class R6 shares will not exceed total annual operating expenses for Class Z shares. Fees and/or expenses waived and/or reimbursed by the Manager may be recouped by the Manager within the same fiscal year during which such waiver and/or reimbursement is made if such recoupment can be realized without exceeding the expense limit in effect at the time of the recoupment for the fiscal year.
The RIC, on behalf of the Fund, has a distribution agreement with Prudential Investment Management Services LLC (“PIMS”), which acts as the distributor of the Class A, Class C, Class R, Class Z and Class R6 shares of the Fund. The Fund compensates PIMS for distributing and servicing the Fund’s Class A, Class C and Class R shares, pursuant to the plans of distribution (the “Distribution Plans”), regardless of expenses actually incurred by PIMS.
Pursuant to the Distribution Plans, the Fund compensates PIMS for distribution related activities at an annual rate of up to 0.30%,1% and 0.75% of the average daily net assets of the Class A, Class C and Class R shares, respectively. PIMS has contractually agreed through March 31, 2022 to limit such fees to 0.50% of the average daily net assets of the Class R shares. The distribution fees are accrued daily and payable monthly. No distribution or service fees are paid to PIMS as distributor of the Class Z and Class R6 shares of the Fund.
For the year ended November 30, 2021, PIMS received $290,679 in front-end sales charges resulting from sales of Class A shares. Additionally, for the year ended November 30, 2021, PIMS received $108 and $2,419 in contingent deferred sales charges imposed upon redemptions by certain Class A and Class C shareholders, respectively. From these fees, PIMS paid such sales charges to broker-dealers, who in turn paid commissions to salespersons and incurred other distribution costs.
PGIM Investments, PIMS and Jennison are indirect, wholly-owned subsidiaries of Prudential Financial, Inc. (“Prudential”).
4. Other Transactions with Affiliates
Prudential Mutual Fund Services LLC (“PMFS”), an affiliate of PGIM Investments and an indirect, wholly-owned subsidiary of Prudential, serves as the Fund’s transfer agent. Transfer agent’s fees and expenses in the Statement of Operations include certain out-of-pocket expenses paid to non-affiliates, where applicable.
| | | | |
PGIM Jennison 20/20 Focus Fund | | | 31 | |
Notes to Financial Statements (continued)
The Fund may invest its overnight sweep cash in the PGIM Core Ultra Short Bond Fund (the “Core Fund”), and its securities lending cash collateral in the PGIM Institutional Money Market Fund (the “Money Market Fund”), each a fund of Prudential Investment Portfolios 2, registered under the 1940 Act and managed by PGIM Investments. PGIM Investments and/or its affiliates are paid fees or reimbursed for providing their services to the Core Fund and the Money Market Fund. In addition to the realized and unrealized gains on investments in the Core Fund and Money Market Fund, earnings from such investments are disclosed on the Statement of Operations as “Affiliated dividend income” and “Income from securities lending, net”, respectively.
The Fund may enter into certain securities purchase or sale transactions under Board approved Rule 17a-7 procedures. Rule 17a-7 is an exemptive rule under the 1940 Act, that subject to certain conditions, permits purchase and sale transactions among affiliated investment companies, or between an investment company and a person that is affiliated solely by reason of having a common (or affiliated) investment adviser, common directors/trustees, and/or common officers. For the year ended November 30, 2021, no 17a-7 transactions were entered into by the Fund.
5. Portfolio Securities
The aggregate cost of purchases and proceeds from sales of portfolio securities (excluding short-term investments and U.S. Government securities) for the year ended November 30, 2021, were $1,182,006,413 and $1,289,183,766, respectively.
A summary of the cost of purchases and proceeds from sales of shares of affiliated mutual funds for the year ended November 30, 2021, is presented as follows:
| | | | | | | | | | | | | | | | | | | | | | | | | | | | | | |
Value,
Beginning
of Year | | | Cost of
Purchases | | | Proceeds
from Sales | | | Change in
Unrealized
Gain
(Loss) | | | Realized
Gain
(Loss) | | | Value,
End of Year | | | Shares,
End
of Year | | | Income | |
|
| | Short-Term Investments - Affiliated Mutual Funds: | |
|
| | PGIM Core Ultra Short Bond Fund (1)(wa) | |
| $ | 9,226,843 | | | $ | 321,315,474 | | | $ | 324,836,419 | | | $ | — | | | $ | — | | | $ | 5,705,898 | | | | 5,705,898 | | | $ | 19,662 | |
|
| | PGIM Institutional Money Market Fund (1)(b)(wa) | |
| | 1,393 | | | | 306,273,532 | | | | 306,270,823 | | | | — | | | | (4,102 | ) | | | — | | | | — | | | | 26,542 | (2) |
| | | | | | | | | | | | | | | | | | | | | | | | | | | | | | |
| $ | 9,228,236 | | | $ | 627,589,006 | | | $ | 631,107,242 | | | $ | — | | | $ | (4,102 | ) | | $ | 5,705,898 | | | | | | | $ | 46,204 | |
| | | | | | | | | | | | | | | | | | | | | | | | | | | | | | |
| (1) | The Fund did not have any capital gain distributions during the reporting period. |
| (2) | The amount, or a portion thereof, represents the affiliated securities lending income shown on the Statement of Operations. |
| (b) | Represents security, or portion thereof, purchased with cash collateral received for securities on loan and includes dividend reinvestment. |
| (wa) | PGIM Investments LLC, the manager of the Fund, also serves as manager of the PGIM Core Ultra Short Bond Fund and PGIM Institutional Money Market Fund, if applicable. |
6. Distributions and Tax Information
Distributions to shareholders, which are determined in accordance with federal income tax regulations and which may differ from GAAP, are recorded on the ex-date. In order to present total distributable earnings (loss) and paid-in capital in excess of par on the Statement of Assets and Liabilities that more closely represent their tax character, certain adjustments have been made to total distributable earnings (loss) and paid-in capital in excess of par. For the tax year ended November 30, 2021, the adjustments were to decrease total distributable earnings and increase paid-in capital in excess of par by $59,694 due to the tax treatment of fund redemptions. Net investment income (loss), net realized gain (loss) on investments and foreign currency transactions and net assets were not affected by this change.
For the year ended November 30, 2021, the tax character of dividends paid by the Fund were $2,346,002 of ordinary income and $113,952,877 of long-term capital gains. For the year ended November 30, 2020, the tax character of dividends paid by the Fund were $2,490,235 of ordinary income and $67,744,277 of long-term capital gains.
As of November 30, 2021, the accumulated undistributed earnings on a tax basis were $6,624,232 of ordinary income and $411,201,771 of long-term capital gains.
The United States federal income tax basis of the Fund’s investments and the net unrealized appreciation as of November 30, 2021 were as follows:
| | | | | | |
| Tax Basis | | Gross
Unrealized
Appreciation | | Gross
Unrealized
Depreciation | | Net Unrealized
Appreciation |
$907,023,682 | | $296,140,981 | | $(30,038,617) | | $266,102,364 |
The difference between GAAP and tax basis was primarily attributable to deferred losses on wash sales.
The Manager has analyzed the Fund’s tax positions taken on federal, state and local income tax returns for all open tax years and has concluded that no provision for income tax is required in the Fund’s financial statements for the current reporting period. Since tax authorities can examine previously filed tax returns, the Fund’s U.S. federal and state tax returns for each of the four fiscal years up to the most recent fiscal year ended November 30, 2021 are subject to such review.
7. Capital and Ownership
The Fund offers Class A, Class C, Class R, Class Z and Class R6 shares. Class A shares are sold with a maximum front-end sales charge of 5.50%. Investors who purchase $1 million or
| | | | |
PGIM Jennison 20/20 Focus Fund | | | 33 | |
Notes to Financial Statements (continued)
more of Class A shares and sell these shares within 12 months of purchase are subject to a contingent deferred sales charge (“CDSC”) of 1%, although they are not subject to an initial sales charge. The Class A CDSC is waived for certain retirement and/or benefit plans. A special exchange privilege is also available for shareholders who qualified to purchase Class A shares at net asset value. Class C shares are sold with a CDSC of 1% on sales made within 12 months of purchase. Class C shares will automatically convert to Class A shares on a monthly basis approximately eight years (ten years prior to January 22, 2021) after purchase. Class R, Class Z and Class R6 shares are not subject to any sales or redemption charges and are available exclusively for sale to a limited group of investors.
Under certain circumstances, an exchange may be made from specified share classes of the Fund to one or more other share classes of the Fund as presented in the table of transactions in shares of beneficial interest, below.
The RIC has authorized an unlimited number of shares of beneficial interest of the Fund at $0.001 par value per share currently divided into five classes, designated Class A, Class C, Class R, Class Z and Class R6.
As of November 30, 2021, Prudential, through its affiliated entities, including affiliated funds (if applicable), owned shares of the Fund as follows:
| | | | |
| | | |
| | | Number of Shares | | Percentage of
Outstanding Shares |
| | | |
Class A | | 37,821 | | 0.1% |
| | | |
Class R | | 1,588,677 | | 58.2% |
At the reporting period end, the number of shareholders holding greater than 5% of the Fund are as follows:
| | | | | | |
| | |
| Affiliated | | Unaffiliated |
| | | | |
Number of
Shareholders | | Percentage of
Outstanding Shares | | Number of
Shareholders | | Percentage of
Outstanding Shares |
| | | | |
| — | | —% | | 2 | | 38.3% |
Transactions in shares of beneficial interest were as follows:
| | | | | | | | |
Class A | | Shares | | | Amount | |
Year ended November 30, 2021: | | | | | | | | |
Shares sold | | | 927,605 | | | $ | 17,628,497 | |
Shares issued in reinvestment of dividends and distributions | | | 4,761,877 | | | | 83,189,986 | |
Shares purchased | | | (5,326,066 | ) | | | (102,311,119 | ) |
| | | | | | | | |
Net increase (decrease) in shares outstanding before conversion | | | 363,416 | | | | (1,492,636 | ) |
Shares issued upon conversion from other share class(es) | | | 827,596 | | | | 15,898,993 | |
Shares purchased upon conversion into other share class(es) | | | (354,118 | ) | | | (6,824,627 | ) |
| | | | | | | | |
Net increase (decrease) in shares outstanding | | | 836,894 | | | $ | 7,581,730 | |
| | | | | | | | |
Year ended November 30, 2020: | | | | | | | | |
Shares sold | | | 1,057,349 | | | $ | 16,471,048 | |
Shares issued in reinvestment of dividends and distributions | | | 3,177,701 | | | | 47,697,297 | |
Shares purchased | | | (7,742,650 | ) | | | (120,739,254 | ) |
| | | | | | | | |
Net increase (decrease) in shares outstanding before conversion | | | (3,507,600 | ) | | | (56,570,909 | ) |
Shares issued upon conversion from other share class(es) | | | 1,498,274 | | | | 22,643,010 | |
Shares purchased upon conversion into other share class(es) | | | (442,667 | ) | | | (6,966,585 | ) |
| | | | | | | | |
Net increase (decrease) in shares outstanding | | | (2,451,993 | ) | | $ | (40,894,484 | ) |
| | | | | | | | |
| | |
Class B | | | | | | |
Period ended June 26, 2020*: | | | | | | | | |
Shares sold | | | 5,450 | | | $ | 52,039 | |
Shares issued in reinvestment of dividends and distributions | | | 71,222 | | | | 684,442 | |
Shares purchased | | | (52,952 | ) | | | (494,505 | ) |
| | | | | | | | |
Net increase (decrease) in shares outstanding before conversion | | | 23,720 | | | | 241,976 | |
Shares purchased upon conversion into other share class(es) | | | (688,533 | ) | | | (6,511,962 | ) |
| | | | | | | | |
Net increase (decrease) in shares outstanding | | | (664,813 | ) | | $ | (6,269,986 | ) |
| | | | | | | | |
| | |
Class C | | | | | | |
Year ended November 30, 2021: | | | | | | | | |
Shares sold | | | 211,009 | | | $ | 2,363,998 | |
Shares issued in reinvestment of dividends and distributions | | | 616,635 | | | | 6,486,997 | |
Shares purchased | | | (529,270 | ) | | | (6,109,641 | ) |
| | | | | | | | |
Net increase (decrease) in shares outstanding before conversion | | | 298,374 | | | | 2,741,354 | |
Shares purchased upon conversion into other share class(es) | | | (1,317,650 | ) | | | (15,179,645 | ) |
| | | | | | | | |
Net increase (decrease) in shares outstanding | | | (1,019,276 | ) | | $ | (12,438,291 | ) |
| | | | | | | | |
Year ended November 30, 2020: | | | | | | | | |
Shares sold | | | 295,434 | | | $ | 2,882,096 | |
Shares issued in reinvestment of dividends and distributions | | | 520,212 | | | | 5,066,864 | |
Shares purchased | | | (1,035,106 | ) | | | (10,075,240 | ) |
| | | | | | | | |
Net increase (decrease) in shares outstanding before conversion | | | (219,460 | ) | | | (2,126,280 | ) |
Shares purchased upon conversion into other share class(es) | | | (1,690,970 | ) | | | (16,628,545 | ) |
| | | | | | | | |
Net increase (decrease) in shares outstanding | | | (1,910,430 | ) | | $ | (18,754,825 | ) |
| | | | | | | | |
| | | | |
PGIM Jennison 20/20 Focus Fund | | | 35 | |
Notes to Financial Statements (continued)
| | | | | | | | |
Class R | | Shares | | | Amount | |
Year ended November 30, 2021: | | | | | | | | |
Shares sold | | | 173,244 | | | $ | 3,107,885 | |
Shares issued in reinvestment of dividends and distributions | | | 354,301 | | | | 5,760,932 | |
Shares purchased | | | (634,992 | ) | | | (11,280,260 | ) |
| | | | | | | | |
Net increase (decrease) in shares outstanding | | | (107,447 | ) | | $ | (2,411,443 | ) |
| | | | | | | | |
Year ended November 30, 2020: | | | | | | | | |
Shares sold | | | 254,002 | | | $ | 3,667,113 | |
Shares issued in reinvestment of dividends and distributions | | | 246,511 | | | | 3,478,274 | |
Shares purchased | | | (1,062,399 | ) | | | (15,233,345 | ) |
| | | | | | | | |
Net increase (decrease) in shares outstanding | | | (561,886 | ) | | $ | (8,087,958 | ) |
| | | | | | | | |
| | |
Class Z | | | | | | |
Year ended November 30, 2021: | | | | | | | | |
Shares sold | | | 886,008 | | | $ | 20,329,305 | |
Shares issued in reinvestment of dividends and distributions | | | 801,793 | | | | 16,051,902 | |
Shares purchased | | | (1,906,137 | ) | | | (41,869,903 | ) |
| | | | | | | | |
Net increase (decrease) in shares outstanding before conversion | | | (218,336 | ) | | | (5,488,696 | ) |
Shares issued upon conversion from other share class(es) | | | 322,469 | | | | 7,119,266 | |
Shares purchased upon conversion into other share class(es) | | | (385,218 | ) | | | (8,416,715 | ) |
| | | | | | | | |
Net increase (decrease) in shares outstanding | | | (281,085 | ) | | $ | (6,786,145 | ) |
| | | | | | | | |
Year ended November 30, 2020: | | | | | | | | |
Shares sold | | | 736,964 | | | $ | 11,832,682 | |
Shares issued in reinvestment of dividends and distributions | | | 578,117 | | | | 9,799,078 | |
Shares purchased | | | (3,103,337 | ) | | | (52,406,783 | ) |
| | | | | | | | |
Net increase (decrease) in shares outstanding before conversion | | | (1,788,256 | ) | | | (30,775,023 | ) |
Shares issued upon conversion from other share class(es) | | | 455,127 | | | | 8,013,917 | |
Shares purchased upon conversion into other share class(es) | | | (41,386 | ) | | | (750,110 | ) |
| | | | | | | | |
Net increase (decrease) in shares outstanding | | | (1,374,515 | ) | | $ | (23,511,216 | ) |
| | | | | | | | |
| | |
Class R6 | | | | | | |
Year ended November 30, 2021: | | | | | | | | |
Shares sold | | | 133,784 | | | $ | 2,990,703 | |
Shares issued in reinvestment of dividends and distributions | | | 11,851 | | | | 239,865 | |
Shares purchased | | | (117,921 | ) | | | (2,715,009 | ) |
| | | | | | | | |
Net increase (decrease) in shares outstanding before conversion | | | 27,714 | | | | 515,559 | |
Shares issued upon conversion from other share class(es) | | | 337,787 | | | | 7,402,728 | |
| | | | | | | | |
Net increase (decrease) in shares outstanding | | | 365,501 | | | $ | 7,918,287 | |
| | | | | | | | |
Year ended November 30, 2020: | | | | | | | | |
Shares sold | | | 78,213 | | | $ | 1,399,659 | |
Shares issued in reinvestment of dividends and distributions | | | 6,373 | | | | 109,112 | |
Shares purchased | | | (58,213 | ) | | | (1,039,208 | ) |
| | | | | | | | |
Net increase (decrease) in shares outstanding before conversion | | | 26,373 | | | | 469,563 | |
Shares issued upon conversion from other share class(es) | | | 10,848 | | | | 200,275 | |
| | | | | | | | |
Net increase (decrease) in shares outstanding | | | 37,221 | | | $ | 669,838 | |
| | | | | | | | |
| * | Effective June 26, 2020, all of the issued and outstanding Class B shares of the Fund converted into Class A shares. |
8. Borrowings
The RIC, on behalf of the Fund, along with other affiliated registered investment companies (the “Participating Funds”), is a party to a Syndicated Credit Agreement (“SCA”) with a group of banks. The purpose of the SCA is to provide an alternative source of temporary funding for capital share redemptions. The table below provides details of the current SCA in effect at the reporting period-end as well as the prior SCA.
| | | | |
| | | |
| | | Current SCA | | Prior SCA |
| | | |
| Term of Commitment | | 10/1/2021 – 9/29/2022 | | 10/2/2020 – 9/30/2021 |
| | | |
| Total Commitment | | $ 1,200,000,000 | | $ 1,200,000,000 |
| | | |
| Annualized Commitment Fee on the Unused Portion of the SCA | | 0.15% | | 0.15% |
| | | |
| Annualized Interest Rate on Borrowings | | 1.20% plus the higher of (1) the effective federal funds rate, (2) the one-month LIBOR rate or (3) zero percent | | 1.30% plus the higher of (1) the effective federal funds rate, (2) the one-month LIBOR rate or (3) zero percent |
Certain affiliated registered investment companies that are parties to the SCA include portfolios that are subject to a predetermined mathematical formula used to manage certain benefit guarantees offered under variable annuity contracts. The formula may result in large scale asset flows into and out of these portfolios. Consequently, these portfolios may be more likely to utilize the SCA for purposes of funding redemptions. It may be possible for those portfolios to fully exhaust the committed amount of the SCA, thereby requiring the Manager to allocate available funding per a Board-approved methodology designed to treat the Participating Funds in the SCA equitably.
The Fund utilized the SCA during the year ended November 30, 2021. The average daily balance for the 47 days that the Fund had loans outstanding during the period was approximately $861,660, borrowed at a weighted average interest rate of 1.42%. The maximum loan outstanding amount during the period was $2,125,000. At November 30, 2021, the Fund did not have an outstanding loan amount.
9. Risks of Investing in the Fund
The Fund’s risks include, but are not limited to, some or all of the risks discussed below. For further information on the Fund’s risks, please refer to the Fund’s Prospectus and Statement of Additional Information.
Economic and Market Events Risk: Events in the U.S. and global financial markets, including actions taken by the U.S. Federal Reserve or foreign central banks to stimulate or stabilize economic growth or the functioning of the securities markets, may at times result in unusually high market volatility, which could negatively impact performance. Relatively reduced liquidity in credit and fixed income markets could adversely affect issuers worldwide.
| | | | |
PGIM Jennison 20/20 Focus Fund | | | 37 | |
Notes to Financial Statements (continued)
Emerging Markets Risk: The risks of foreign investments are greater for investments in or exposed to emerging markets. Emerging market countries typically have economic and political systems that are less fully developed, and can be expected to be less stable, than those of more developed countries. For example, the economies of such countries can be subject to rapid and unpredictable rates of inflation or deflation. Low trading volumes may result in a lack of liquidity and price volatility. Emerging market countries may have policies that restrict investment by non-U.S. investors, or that prevent non-U.S. investors from withdrawing their money at will.
The Fund may invest in some emerging markets that subject it to risks such as those associated with illiquidity, custody of assets, different settlement and clearance procedures and asserting legal title under a developing legal and regulatory regime to a greater degree than in developed markets or even in other emerging markets.
Equity and Equity-Related Securities Risk: Equity and equity-related securities may be subject to changes in value, and their values may be more volatile than those of other asset classes. In addition to an individual security losing value, the value of the equity markets or a sector in which the Fund invests could go down. Different parts of a market can react differently to adverse issuer, market, regulatory, political and economic developments.
Foreign Securities Risk: Investments in securities of non-U.S. issuers (including those denominated in U.S. dollars) may involve more risk than investing in securities of U.S. issuers. Foreign political, economic and legal systems, especially those in developing and emerging market countries, may be less stable and more volatile than in the United States. Foreign legal systems generally have fewer regulatory requirements than the U.S. legal system, particularly those of emerging markets. In general, less information is publicly available with respect to non-U.S. companies than U.S. companies. Non-U.S. companies generally are not subject to the same accounting, auditing, and financial reporting standards as are U.S. companies. Additionally, the changing value of foreign currencies and changes in exchange rates could also affect the value of the assets the Fund holds and the Fund’s performance. Certain foreign countries may impose restrictions on the ability of issuers of foreign securities to make payment of principal and interest or dividends to investors located outside the country, due to blockage of foreign currency exchanges or otherwise. Investments in emerging markets are subject to greater volatility and price declines.
In addition, the Fund’s investments in non-U.S. securities may be subject to the risks of nationalization or expropriation of assets, imposition of currency exchange controls or restrictions on the repatriation of non-U.S. currency, confiscatory taxation and adverse diplomatic developments. Special U.S. tax considerations may apply.
Growth and Value Style Risks: The portion of the Fund’s portfolio that makes investments pursuant to a growth strategy may be subject to above-average fluctuations as a result of seeking higher than average capital growth. The portion of the Fund’s portfolio that makes investments pursuant to a value strategy may be subject to the risk that the market may not recognize a security’s intrinsic value for a long time or at all, or that a stock judged to be undervalued may actually be appropriately priced or overvalued. Historically, growth stocks have performed best during later stages of economic expansion and value stocks have performed best during periods of economic recovery. Therefore, both styles may over time go in and out of favor with the markets. At times when a style is out of favor, that portion of the portfolio may lag the other portion of the portfolio, which may cause the Fund to underperform the market in general, its benchmark and other mutual funds. If the Fund’s assessment of market conditions or a company’s value is inaccurate, the Fund could suffer losses or produce poor performance relative to other funds.
Increase in Expenses Risk: Your actual cost of investing in the Fund may be higher than the expenses shown in the expense table in the Fund’s prospectus for a variety of reasons. For example, expense ratios may be higher than those shown if average net assets decrease. Net assets are more likely to decrease and Fund expense ratios are more likely to increase when markets are volatile. Active and frequent trading of Fund securities can increase expenses.
Initial Public Offerings Risk: The volume of IPOs and the levels at which the newly issued stocks trade in the secondary market are affected by the performance of the stock market overall. If IPOs are brought to the market, availability may be limited and if the Fund desires to acquire shares in such an offering, it may not be able to buy any shares at the offering price, or if it is able to buy shares, it may not be able to buy as many shares at the offering price as it would like. The prices of securities involved in IPOs are often subject to greater and more unpredictable price changes than more established stocks. Such unpredictability can have a dramatic impact on the Fund’s performance (higher or lower) and any assumptions by investors based on the affected performance may be unwarranted. In addition, as Fund assets grow, the impact of IPO investments on performance will decline, which could reduce total returns.
Large Shareholder and Large Scale Redemption Risk: Certain individuals, accounts, funds (including funds affiliated with the Manager) or institutions, including the Manager and its affiliates, may from time to time own or control a substantial amount of the Fund’s shares. There is no requirement that these entities maintain their investment in the Fund. There is a risk that such large shareholders or that the Fund’s shareholders generally may redeem all or a substantial portion of their investments in the Fund in a short period of time, which could have a significant negative impact on the Fund’s NAV, liquidity, and brokerage costs. Large redemptions could also result in tax consequences to shareholders and impact the Fund’s ability to implement its investment strategy. The Fund’s ability to pursue its investment objective after one or more large scale redemptions may be impaired and, as a result, the Fund may invest a larger portion of its assets in cash or cash equivalents.
| | | | |
PGIM Jennison 20/20 Focus Fund | | | 39 | |
Notes to Financial Statements (continued)
Management Risk: The value of your investment may decrease if judgments by the subadviser about the attractiveness, value or market trends affecting a particular security, industry or sector or about market movements are incorrect.
Market Capitalization Risk. Although the Fund intends to invest primarily in large capitalization companies, the Fund may invest in companies of any market capitalization. Generally, the stock prices of small- and medium-sized companies are less stable than the prices of large company stocks and may present greater risks. In exchange for the potentially lower risks of investing in large capitalization companies, the Fund’s value may not rise as much as the value of funds that emphasize small capitalization companies. Large capitalization companies as a group could fall out of favor with the market, causing the Fund to underperform investments that focus on smaller capitalized companies.
Market Disruption and Geopolitical Risks: International wars or conflicts and geopolitical developments in foreign countries, along with instability in regions such as Asia, Eastern Europe, and the Middle East, possible terrorist attacks in the United States or around the world, public health epidemics such as the outbreak of infectious diseases like the outbreak of COVID-19 globally in 2020 or the 2014–2016 outbreak in West Africa of the Ebola virus, and other similar events could adversely affect the U.S. and foreign financial markets, including increases in market volatility, reduced liquidity in the securities markets and government intervention, and may cause further long-term economic uncertainties in the United States and worldwide generally. The coronavirus pandemic and the related governmental and public responses have had and may continue to have an impact on the Fund’s investments and net asset value and have led and may continue to lead to increased market volatility and the potential for illiquidity in certain classes of securities and sectors of the market. Preventative or protective actions that governments may take in respect of pandemic or epidemic diseases may result in periods of business disruption, business closures, inability to obtain raw materials, supplies and component parts, and reduced or disrupted operations for the issuers in which the Fund invests. Government intervention in markets may impact interest rates, market volatility and security pricing. The occurrence, reoccurrence and pendency of such diseases could adversely affect the economies (including through changes in business activity and increased unemployment) and financial markets either in specific countries or worldwide.
Market Risk: Securities markets may be volatile and the market prices of the Fund’s securities may decline. Securities fluctuate in price based on changes in an issuer’s financial condition and overall market and economic conditions. If the market prices of the securities owned by the Fund fall, the value of your investment in the Fund will decline.
Non-Diversified Investment Company Risk: The Fund is non-diversified for purposes of the 1940 Act. This means that the Fund may invest a greater percentage of its assets in the
securities of a single company or other issuer than a diversified fund. Investing in a non-diversified fund involves greater risk than investing in a diversified fund because a loss resulting from the decline in value of any one security may represent a greater portion of the total assets of a non-diversified fund.
10. Reorganization
On December 9, 2020, the Board approved an Agreement and Plan of Reorganization (the “Plan”) which provided for the transfer of all the assets of PGIM Jennison 20/20 Focus Fund (“Merged Fund”) for shares of PGIM Jennison Focused Growth Fund, a series of Prudential Investment Portfolios 3, (the “Acquiring Fund”) and the assumption of the liabilities of the Merged Fund by the Acquiring Fund. Shareholders approved the Plan at a meeting on September 14, 2021 and the reorganization took place at the close of business on December 10, 2021.
On the reorganization date, the Merged Fund had the following total investment cost and value, representing the principal assets acquired by the Acquiring Fund:
| | | | |
Merged Fund | | Total Investment
Value | | Total Investment
Cost |
PGIM Jennison 20/20 Focus Fund | | $1,086,288,723 | | $847,993,281 |
The purpose of the transaction was to combine two funds with substantially similar investment objectives, policies and strategies.
The acquisition was accomplished by a tax-free exchange of the following shares on December 10, 2021:
| | | | | | | | | | | | | | |
| Merged Fund | | | Acquiring Fund | |
PGIM Jennison
20/20 Focus Fund | | | PGIM Jennison
Focused Growth Fund | |
Class | | Shares | | | Class | | Shares | | | Value | |
| A | | | 64,068,249 | | | A | | | 38,251,389 | | | | $875,956,816 | |
| C | | | 5,488,730 | | | C | | | 1,616,680 | | | | 26,141,722 | |
| R* | | | 4,459,680 | | | | | | | | | | | |
| Z | | | 11,134,124 | | | Z | | | 6,914,600 | | | | 176,944,604 | |
| R6 | | | 692,500 | | | R6 | | | 437,113 | | | | 11,194,476 | |
* Class R shares were converted to Class A shares in the reorganization.
For financial reporting purposes, assets received and shares issued by the Acquiring Fund were recorded at fair value; however, the cost basis of the investments received from the Merged Fund was carried forward to reflect the tax-free status of the acquisition.
| | | | |
PGIM Jennison 20/20 Focus Fund | | | 41 | |
Notes to Financial Statements (continued)
The net assets and net unrealized appreciation immediately before the acquisition were as follows:
| | | | | | | | | | | | |
| Merged Fund | | | | | Acquiring Fund | |
PGIM Jennison
20/20 Focus Fund | | | | | PGIM Jennison
Focused Growth Fund | |
Class | | Net assets | | | Unrealized Appreciation
on Investments | | Class | | Net assets | |
| A | | $ | 824,968,399 | | | $180,113,683 | | A | | $ | 512,695,115 | |
| C | | | 26,141,722 | | | 5,702,782 | | C | | | 56,736,976 | |
| R | | | 50,988,417 | | | 11,122,958 | | | | | | |
| Z | | | 176,944,604 | | | 38,883,573 | | Z | | | 552,998,607 | |
| R6 | | | 11,194,476 | | | 2,472,446 | | R6 | | | 200,023,881 | |
11. Recent Regulatory Developments
On December 3, 2020, the SEC announced that it voted to adopt a new rule that establishes an updated regulatory framework for fund valuation practices (the “Rule”). The Rule, in part, provides (i) a framework for determining fair value in good faith and (ii) provides for a fund Board’s assignment of its responsibility for the execution of valuation-related activities to a fund’s investment adviser. Further, the SEC is rescinding previously issued guidance on related issues. The Rule took effect on March 8, 2021, with a compliance date of September 8, 2022. Management is currently evaluating the Rule and its impact to the Fund.
Report of Independent Registered Public Accounting Firm
To the Board of Trustees of Prudential Investment Portfolios 3 and Shareholders of PGIM Jennison Focused Growth Fund
Opinion on the Financial Statements
We have audited the accompanying statement of assets and liabilities, including the schedule of investments, of PGIM Jennison 20/20 Focus Fund (one of the funds constituting Prudential Investment Portfolios 18, referred to hereafter as the “Fund”) as of November 30, 2021, the related statement of operations for the year ended November 30, 2021, the statement of changes in net assets for each of the two years in the period ended November 30, 2021, including the related notes, and the financial highlights for each of the two years in the period ended November 30, 2021 (collectively referred to as the “financial statements”). In our opinion, the financial statements present fairly, in all material respects, the financial position of the Fund as of November 30, 2021, the results of its operations for the year then ended, the changes in its net assets and the financial highlights for each of the two years in the period ended November 30, 2021 in conformity with accounting principles generally accepted in the United States of America.
The financial statements of the Fund as of and for the year ended November 30, 2019 and the financial highlights for each of the periods ended on or prior to November 30, 2019 (not presented herein, other than the financial highlights) were audited by other auditors whose report dated January 15, 2020 expressed an unqualified opinion on those financial statements and financial highlights.
Basis for Opinion
These financial statements are the responsibility of the Fund’s management. Our responsibility is to express an opinion on the Fund’s financial statements based on our audits. We are a public accounting firm registered with the Public Company Accounting Oversight Board (United States) (PCAOB) and are required to be independent with respect to the Fund in accordance with the U.S. federal securities laws and the applicable rules and regulations of the Securities and Exchange Commission and the PCAOB.
We conducted our audits of these financial statements in accordance with the standards of the PCAOB. Those standards require that we plan and perform the audit to obtain reasonable assurance about whether the financial statements are free of material misstatement, whether due to error or fraud.
Our audits included performing procedures to assess the risks of material misstatement of the financial statements, whether due to error or fraud, and performing procedures that respond to those risks. Such procedures included examining, on a test basis, evidence regarding the amounts and disclosures in the financial statements. Our audits also included evaluating the accounting principles used and significant estimates made by management, as well as evaluating the overall presentation of the financial statements. Our procedures included confirmation of securities owned as of November 30, 2021 by correspondence with the custodian, transfer agent and brokers; when replies were not received from brokers, we performed other auditing procedures. We believe that our audits provide a reasonable basis for our opinion.
/s/ PricewaterhouseCoopers LLP
New York, New York
January 14, 2022
We have served as the auditor of one or more investment companies in the PGIM Retail Funds complex since 2020.
| | | | |
PGIM Jennison 20/20 Focus Fund | | | 43 | |
Tax Information (unaudited)
We are advising you that during the year ended November 30, 2021, the Fund reports the maximum amount allowed per share but not less than $2.04 for Class A, C, R, Z and R6 shares as a capital gain distribution in accordance with Section 852(b)(3)(C) of the Internal Revenue Code.
For the year ended November 30, 2021, the Fund reports, in accordance under Section 854 of the Internal Revenue Code, the following percentages of the ordinary income dividends paid as 1) qualified dividend income (QDI); and 2) eligible for corporate dividends received deduction (DRD):
| | | | | | | | |
| | | QDI | | | DRD | |
PGIM Jennison 20/20 Focus Fund | | | 100.00% | | | | 100.00% | |
In January 2022, you will be advised on IRS Form 1099-DIV as to the federal tax status of dividends and distributions received by you in calendar year 2021.
INFORMATION ABOUT BOARD MEMBERS AND OFFICERS (unaudited)
Information about Board Members and Officers of the Fund is set forth below. Board Members who are not deemed to be “interested persons” of the Fund, as defined in the 1940 Act, are referred to as “Independent Board Members.” Board Members who are deemed to be “interested persons” of the Fund are referred to as “Interested Board Members.” The Board Members are responsible for the overall supervision of the operations of the Fund and perform the various duties imposed on the directors of investment companies by the 1940 Act. The Board in turn elects the Officers, who are responsible for administering the day-to-day operations of the Fund.
| | | | | | |
| Independent Board Members | | | | |
| | | | |
Name Year of Birth Position(s) Portfolios Overseen | | Principal Occupation(s) During Past Five Years | | Other Directorships Held During Past Five Years | | Length of
Board Service |
| | | | |
Ellen S. Alberding 1958 Board Member Portfolios Overseen: 95 | | President and Board Member, The Joyce Foundation (charitable foundation) (since 2002); formerly Vice Chair, City Colleges of Chicago (community college system) (2011-2015); Trustee, National Park Foundation (charitable foundation for national park system) (2009-2018); Trustee, Economic Club of Chicago (2009-2016); Trustee, Loyola University (since 2018). | | None. | | Since September 2013 |
| | | | |
Kevin J. Bannon 1952 Board Member Portfolios Overseen: 95 | | Retired; formerly Managing Director (April 2008-May 2015) and Chief Investment Officer (October 2008-November 2013) of Highmount Capital LLC (registered investment adviser); formerly Executive Vice President and Chief Investment Officer (April 1993-August 2007) of Bank of New York Company; President (May 2003-May 2007) of BNY Hamilton Family of Mutual Funds. | | Director of Urstadt Biddle Properties (equity real estate investment trust) (since September 2008). | | Since July 2008 |
PGIM Jennison 20/20 Focus Fund
| | | | | | |
Independent Board Members | | | | |
| | | | |
Name Year of Birth Position(s) Portfolios Overseen | | Principal Occupation(s) During Past Five Years | | Other Directorships Held During Past Five Years | | Length of
Board Service |
| | | | |
Linda W. Bynoe 1952 Board Member Portfolios Overseen: 92 | | President and Chief Executive Officer (since March 1995) and formerly Chief Operating Officer (December 1989-February 1995) of Telemat Limited LLC (formerly Telemat Ltd) (management consulting); formerly Vice President (January 1985-June 1989) at Morgan Stanley & Co. (broker-dealer). | | Trustee of Equity Residential (residential real estate) (since December 2009); Director of Northern Trust Corporation (financial services) (since April 2006); formerly Director of Anixter International, Inc. (communication products distributor) (January 2006-June 2020). | | Since March 2005 |
| | | | |
Barry H. Evans 1960 Board Member Portfolios Overseen: 94 | | Retired; formerly President (2005-2016), Global Chief Operating Officer (2014-2016), Chief Investment Officer - Global Head of Fixed Income (1998-2014), and various portfolio manager roles (1986-2006), Manulife Asset Management (asset management). | | Formerly Director, Manulife Trust Company (2011-2018); formerly Director, Manulife Asset Management Limited (2015-2017); formerly Chairman of the Board of Directors of Manulife Asset Management U.S. (2005-2016); formerly Chairman of the Board, Declaration Investment Management and Research (2008-2016). | | Since September 2017 |
| | | | |
Keith F. Hartstein 1956 Board Member & Independent Chair Portfolios Overseen: 95 | | Retired; Executive Committee of the Independent Directors Council (IDC) Board of Governors (since October 2019); Member (since November 2014) of the Governing Council of the IDC (organization of independent mutual fund directors); formerly President and Chief Executive Officer (2005-2012), Senior Vice President (2004-2005), Senior Vice President of Sales and Marketing (1997-2004), and various executive management positions (1990-1997), John Hancock Funds, LLC (asset management); Chairman, Investment Company Institute’s Sales Force Marketing Committee (2003-2008). | | None. | | Since September 2013 |
Visit our website at pgim.com/investments
| | | | | | |
Independent Board Members | | | | |
| | | | |
Name Year of Birth Position(s) Portfolios Overseen | | Principal Occupation(s) During Past Five Years | | Other Directorships Held During Past Five Years | | Length of Board Service |
| | | | |
Laurie Simon Hodrick 1962 Board Member Portfolios Overseen: 91 | | A. Barton Hepburn Professor Emerita of Economics in the Faculty of Business, Columbia Business School (since 2018); Visiting Fellow at the Hoover Institution, Stanford University (since 2015); Sole Member, ReidCourt LLC (since 2008) (a consulting firm); formerly Visiting Professor of Law, Stanford Law School (2015-2021); formerly A. Barton Hepburn Professor of Economics in the Faculty of Business, Columbia Business School (1996-2017); formerly Managing Director, Global Head of Alternative Investment Strategies, Deutsche Bank (2006-2008). | | Independent Director, Roku (since December 2020) (communication services); formerly Independent Director, Synnex Corporation (2019-2021) (information technology); formerly Independent Director, Kabbage, Inc. (2018-2020) (financial services); formerly Independent Director, Corporate Capital Trust (2017-2018) (a business development company). | | Since September 2017 |
| | | | |
Brian K. Reid 1961 Board Member Portfolios Overseen: 94 | | Retired; formerly Chief Economist for the Investment Company Institute (ICI) (2005-2017); formerly Senior Economist and Director of Industry and Financial Analysis at the ICI (1998-2004); formerly Senior Economist, Industry and Financial Analysis at the ICI (1996-1998); formerly Staff Economist at the Federal Reserve Board (1989-1996); Director, ICI Mutual Insurance Company (2012-2017). | | None. | | Since March 2018 |
PGIM Jennison 20/20 Focus Fund
| | | | | | |
| Independent Board Members | | | | |
| | | | |
Name Year of Birth Position(s) Portfolios Overseen | | Principal Occupation(s) During Past Five Years | | Other Directorships Held During Past Five Years | | Length of Board Service |
| | | | |
Grace C. Torres 1959 Board Member Portfolios Overseen: 94 | | Retired; formerly Treasurer and Principal Financial and Accounting Officer of the PGIM Funds, Target Funds, Advanced Series Trust, Prudential Variable Contract Accounts and The Prudential Series Fund (1998-June 2014); Assistant Treasurer (March 1999-June 2014) and Senior Vice President (September 1999-June 2014) of PGIM Investments LLC; Assistant Treasurer (May 2003-June 2014) and Vice President (June 2005-June 2014) of AST Investment Services, Inc.; Senior Vice President and Assistant Treasurer (May 2003-June 2014) of Prudential Annuities Advisory Services, Inc. | | Director (since January 2018) of OceanFirst Financial Corp. and OceanFirst Bank; formerly Director (July 2015-January 2018) of Sun Bancorp, Inc. N.A. and Sun National Bank. | | Since November 2014 |
| | | |
| | | | | | |
| Interested Board Members | | | | |
| | | | |
Name Year of Birth Position(s) Portfolios Overseen | | Principal Occupation(s) During Past Five Years | | Other Directorships Held During Past Five Years | | Length of Board Service |
| | | | |
Stuart S. Parker 1962 Board Member & President Portfolios Overseen: 94 | | President, Chief Executive Officer, Chief Operating Officer and Officer in Charge of PGIM Investments LLC (formerly known as Prudential Investments LLC) (since January 2012); formerly Executive Vice President of Jennison Associates LLC and Head of Retail Distribution of PGIM Investments LLC (June 2005-December 2011); Investment Company Institute - Board of Governors (since May 2012). | | None. | | Since January 2012 |
Visit our website at pgim.com/investments
| | | | | | |
| Interested Board Members | | | | |
| | | | |
Name Year of Birth Position(s) Portfolios Overseen | | Principal Occupation(s) During Past Five Years | | Other Directorships Held During Past Five Years | | Length of Board Service |
| | | | |
Scott E. Benjamin 1973 Board Member & Vice President Portfolios Overseen: 95 | | Executive Vice President (since May 2009) of PGIM Investments LLC; Vice President (since June 2012) of Prudential Investment Management Services LLC; Executive Vice President (since September 2009) of AST Investment Services, Inc.; Senior Vice President of Product Development and Marketing, PGIM Investments (since February 2006); formerly Vice President of Product Development and Product Management, PGIM Investments LLC (2003-2006). | | None. | | Since March 2010 |
| (1) | The year that each Board Member joined the Board is as follows: |
Ellen S. Alberding, 2013; Kevin J. Bannon, 2008; Linda W. Bynoe, 2005; Barry H. Evans, 2017; Keith F. Hartstein, 2013; Laurie Simon Hodrick, 2017; Michael S. Hyland, 2008; Richard A. Redeker, 1993; Stephen G. Stoneburn, 2003; Stuart S. Parker, Board Member since 2012 and President since 2012; Scott E. Benjamin, Board Member since 2010 and Vice President since 2009; Grace C. Torres, 2014.
| | | | |
| Fund Officers(a) | | | | |
| | | |
Name Year of Birth Fund Position | | Principal Occupation(s) During Past Five Years | | Length of Service as Fund Officer |
| | | |
Claudia DiGiacomo 1974 Chief Legal Officer | | Chief Legal Officer, Executive Vice President and Secretary of PGIM Investments LLC (since August 2020); Chief Legal Officer of Prudential Mutual Fund Services LLC (since August 2020); Chief Legal Officer of PIFM Holdco, LLC (since August 2020); Vice President and Corporate Counsel (since January 2005) of Prudential; and Corporate Counsel of AST Investment Services, Inc. (since August 2020); formerly Vice President and Assistant Secretary of PGIM Investments LLC (2005-2020); formerly Associate at Sidley Austin Brown & Wood LLP (1999-2004). | | Since December 2005 |
PGIM Jennison 20/20 Focus Fund
| | | | |
| Fund Officers(a) | | | | |
| | | |
Name Year of Birth Fund Position | | Principal Occupation(s) During Past Five Years | | Length of
Service as Fund
Officer |
| | | |
Dino Capasso 1974 Chief Compliance Officer | | Chief Compliance Officer (since July 2019) of PGIM Investments LLC; Chief Compliance Officer (since July 2019) of the PGIM Funds, Target Funds, Advanced Series Trust, The Prudential Series Fund, Prudential’s Gibraltar Fund, Inc., PGIM Global High Yield Fund, Inc., PGIM High Yield Bond Fund, Inc., and PGIM Short Duration High Yield Opportunities Fund; Vice President and Deputy Chief Compliance Officer (June 2017-2019) of PGIM Investments LLC; formerly Senior Vice President and Senior Counsel (January 2016-June 2017), and Vice President and Counsel (February 2012-December 2015) of Pacific Investment Management Company LLC. | | Since March 2018 |
| | | |
Andrew R. French 1962 Secretary | | Vice President (since December 2018) of PGIM Investments LLC; formerly Vice President and Corporate Counsel (2010-2018) of Prudential; formerly Director and Corporate Counsel (2006-2010) of Prudential; Vice President and Assistant Secretary (since January 2007) of PGIM Investments LLC; Vice President and Assistant Secretary (since January 2007) of Prudential Mutual Fund Services LLC. | | Since October 2006 |
| | | |
Diana N. Huffman 1982 Assistant Secretary | | Vice President and Corporate Counsel (since September 2015) of Prudential; Vice President and Assistant Secretary (since August 2020) of PGIM Investments LLC; formerly Associate at Willkie Farr & Gallagher LLP (2009-2015). | | Since March 2019 |
| | | |
Melissa Gonzalez 1980 Assistant Secretary | | Vice President and Corporate Counsel (since September 2018) of Prudential; Vice President and Assistant Secretary (since August 2020) of PGIM Investments LLC; formerly Director and Corporate Counsel (March 2014-September 2018) of Prudential. | | Since March 2020 |
| | | |
Patrick E. McGuinness 1986 Assistant Secretary | | Vice President and Assistant Secretary (since August 2020) of PGIM Investments LLC; Director and Corporate Counsel (since February 2017) of Prudential; and Corporate Counsel (2012-2017) of IIL, Inc. | | Since June 2020 |
| | | |
Debra Rubano 1975 Assistant Secretary | | Vice President and Corporate Counsel (since November 2020) of Prudential; formerly Director and Senior Counsel of Allianz Global Investors U.S. Holdings LLC (2010-2020) and Assistant Secretary of numerous funds in the Allianz fund complex (2015-2020). | | Since December 2020 |
| | | |
Kelly A. Coyne 1968 Assistant Secretary | | Director, Investment Operations of Prudential Mutual Fund Services LLC (since 2010). | | Since March 2015 |
Visit our website at pgim.com/investments
| | | | |
| Fund Officers(a) | | | | |
| | | |
Name Year of Birth Fund Position | | Principal Occupation(s) During Past Five Years | | Length of
Service as Fund
Officer |
| | | |
Christian J. Kelly 1975 Treasurer and Principal Financial and Accounting Officer | | Vice President, Head of Fund Administration of PGIM Investments LLC (since November 2018); formerly Director of Fund Administration of Lord Abbett & Co. LLC (2009-2018), Treasurer and Principal Accounting Officer of the Lord Abbett Family of Funds (2017-2018); Director of Accounting, Avenue Capital Group (2008-2009); Senior Manager, Investment Management Practice of Deloitte & Touche LLP (1998-2007). | | Since January 2019 |
| | | |
Lana Lomuti 1967 Assistant Treasurer | | Vice President (since 2007) and Director (2005-2007), within PGIM Investments Fund Administration; formerly Assistant Treasurer (December 2007-February 2014) of The Greater China Fund, Inc. | | Since April 2014 |
| | | |
Russ Shupak 1973 Assistant Treasurer | | Vice President (since 2017) and Director (2013-2017), within PGIM Investments Fund Administration. | | Since October 2019 |
| | | |
Deborah Conway 1969 Assistant Treasurer | | Vice President (since 2017) and Director (2007-2017), within PGIM Investments Fund Administration. | | Since October 2019 |
| | | |
Elyse M. McLaughlin 1974 Assistant Treasurer | | Vice President (since 2017) and Director (2011-2017), within PGIM Investments Fund Administration. | | Since October 2019 |
| | | |
Jonathan Corbett 1983 Anti-Money Laundering Compliance Officer | | Vice President, Corporate Compliance, Global Compliance Programs and Compliance Risk Management (since August 2019) of Prudential; formerly Vice President and Head of Key Risk Areas Compliance (March 2016 to July 2019), Chief Privacy Officer (March 2016 to July 2019) and Head of Global Financial Crimes Unit (April 2014 to March 2016) at MetLife. | | Since October 2021 |
(a) Excludes Mr. Parker and Mr. Benjamin, interested Board Members who also serve as President and Vice President, respectively.
Explanatory Notes to Tables:
| ∎ | | Board Members are deemed to be “Interested,” as defined in the 1940 Act, by reason of their affiliation with PGIM Investments LLC and/or an affiliate of PGIM Investments LLC. |
| ∎ | | Unless otherwise noted, the address of all Board Members and Officers is c/o PGIM Investments LLC, 655 Broad Street, Newark, New Jersey 07102-4410. |
| ∎ | | There is no set term of office for Board Members or Officers. The Board Members have adopted a retirement policy, which calls for the retirement of Board Members on December 31 of the year in which they reach the age of 75. |
| ∎ | | “Other Directorships Held” includes all directorships of companies required to register or file reports with the SEC under the 1934 Act (that is, “public companies”) or other investment companies registered under the 1940 Act. |
| ∎ | | “Portfolios Overseen” includes all investment companies managed by PGIM Investments LLC. The investment companies for which PGIM Investments LLC serves as manager include the PGIM Funds, Target Funds, The Prudential Variable Contract Accounts, PGIM ETF Trust, PGIM High Yield Bond Fund, Inc., PGIM Global High Yield Fund, Inc., PGIM Short Duration High Yield Opportunities Fund, The Prudential Series Fund, Prudential’s Gibraltar Fund, Inc. and the Advanced Series Trust. |
| ∎ | | As used in the Fund Officers table “Prudential” means The Prudential Insurance Company of America. |
PGIM Jennison 20/20 Focus Fund
Approval of Advisory Agreements (unaudited)
The Fund’s Board of Trustees
The Board of Trustees (the “Board”) of PGIM Jennison 20/20 Focus Fund (the “Fund”)1 consists of ten individuals, eight of whom are not “interested persons” of the Fund, as defined in the Investment Company Act of 1940, as amended (the “1940 Act”) (the “Independent Trustees”). The Board is responsible for the oversight of the Fund and its operations, and performs the various duties imposed on the directors of investment companies by the 1940 Act. The Independent Trustees have retained independent legal counsel to assist them in connection with their duties. The Chair of the Board is an Independent Trustee. The Board has established four standing committees: the Audit Committee, the Nominating and Governance Committee, and two Investment Committees. Each committee is chaired by, and composed of, Independent Trustees.
Annual Approval of the Fund’s Advisory Agreements
As required under the 1940 Act, the Board determines annually whether to renew the Fund’s management agreement with PGIM Investments LLC (“PGIM Investments”) and the Fund’s subadvisory agreement with Jennison Associates LLC (“Jennison”). In considering the renewal of the agreements, the Board, including all of the Independent Trustees, met on June 7-10, 2021 and approved the renewal of the agreements through July 31, 2022, after concluding that the renewal of the agreements was in the best interests of the Fund and its shareholders.
In advance of the meetings, the Board requested and received materials relating to the agreements, and had the opportunity to ask questions and request further information in connection with its consideration. Among other things, the Board considered comparative fee information from PGIM Investments and Jennison. Also, the Board considered comparisons with other mutual funds in relevant Peer Universes and Peer Groups, as is further discussed below.
In approving the agreements, the Board, including the Independent Trustees advised by independent legal counsel, considered the factors it deemed relevant, including the nature, quality and extent of services provided by PGIM Investments and the subadviser, the performance of the Fund, the profitability of PGIM Investments and its affiliates, expenses and fees, and the potential for economies of scale that may be shared with the Fund and its shareholders as the Fund’s assets grow. In their deliberations, the Trustees did not identify any single factor which alone was responsible for the Board’s decision to approve the agreements with respect to the Fund. In connection with its deliberations, the Board considered information provided by PGIM Investments throughout the year at regular Board meetings, presentations from portfolio managers and other information, as well as information furnished at or in advance of the meetings on June 7-10, 2021.
The Trustees determined that the overall arrangements between the Fund and PGIM Investments, which serves as the Fund’s investment manager pursuant to a management agreement, and between PGIM Investments and Jennison, which serves
| 1 | PGIM Jennison 20/20 Focus Fund is a series of Prudential Investment Portfolios 18. |
PGIM Jennison 20/20 Focus Fund
Approval of Advisory Agreements (continued)
as the Fund’s subadviser pursuant to the terms of a subadvisory agreement with PGIM Investments, are in the best interests of the Fund and its shareholders in light of the services performed, fees charged and such other matters as the Trustees considered relevant in the exercise of their business judgment.
The material factors and conclusions that formed the basis for the Trustees’ reaching their determinations to approve the renewal of the agreements are discussed separately below.
Nature, Quality and Extent of Services
The Board received and considered information regarding the nature, quality and extent of services provided to the Fund by PGIM Investments and Jennison. The Board noted that Jennison is affiliated with PGIM Investments. The Board considered the services provided by PGIM Investments, including but not limited to the oversight of the subadviser for the Fund, as well as the provision of fund recordkeeping, compliance and other services to the Fund, and PGIM Investments’ role as administrator for the Fund’s liquidity risk management program. With respect to PGIM Investments’ oversight of the subadviser, the Board noted that PGIM Investments’ Strategic Investment Research Group (“SIRG”), which is a business unit of PGIM Investments, is responsible for monitoring and reporting to PGIM Investments’ senior management on the performance and operations of the subadviser. The Board also considered that PGIM Investments pays the salaries of all of the officers and interested Trustees of the Fund who are part of Fund management. The Board also considered the investment subadvisory services provided by Jennison, including investment research and security selection, as well as compliance with the Fund’s investment restrictions, policies and procedures. The Board considered PGIM Investments’ evaluation of Jennison, as well as PGIM Investments’ recommendation, based on its review of Jennison, to renew the subadvisory agreement.
The Board considered the qualifications, backgrounds and responsibilities of PGIM Investments’ senior management responsible for the oversight of the Fund and Jennison, and also considered the qualifications, backgrounds and responsibilities of Jennison’s portfolio managers who are responsible for the day-to-day management of the Fund’s portfolio. The Board was provided with information pertaining to PGIM Investments’ and Jennison’s organizational structure, senior management, investment operations, and other relevant information pertaining to both PGIM Investments and Jennison. The Board also noted that it received favorable compliance reports from the Fund’s Chief Compliance Officer (“CCO”) as to both PGIM Investments and Jennison.
The Board concluded that it was satisfied with the nature, extent and quality of the investment management services provided by PGIM Investments and the subadvisory services provided to the Fund by Jennison, and that there was a reasonable basis on which to conclude that the Fund benefits from the services provided by PGIM Investments and Jennison under the management and subadvisory agreements.
Visit our website at pgim.com/investments
Costs of Services and Profits Realized by PGIM Investments
The Board was provided with information on the profitability of PGIM Investments and its affiliates in serving as the Fund’s investment manager. The Board discussed with PGIM Investments the methodology utilized in assembling the information regarding profitability and considered its reasonableness. The Board recognized that it is difficult to make comparisons of profitability from fund management contracts because comparative information is not generally publicly available and is affected by numerous factors, including the structure of the particular adviser, the types of funds it manages, its business mix, numerous assumptions regarding allocations and the adviser’s capital structure and cost of capital. Taking these factors into account, the Board concluded that the profitability of PGIM Investments and its affiliates in relation to the services rendered was not unreasonable.
Economies of Scale
The Board received and discussed information concerning economies of scale that PGIM Investments may realize as the Fund’s assets grow beyond current levels. The Board noted that the management fee schedule for the Fund includes breakpoints, which have the effect of decreasing the fee rate as assets increase. During the course of time, the Board has considered information regarding the launch date of the Fund, the management fees of the Fund compared to those of similarly managed funds and PGIM Investments’ investment in the Fund over time. The Board noted that economies of scale can be shared with the Fund in other ways, including low management fees from inception, additional technological and personnel investments to enhance shareholder services, and maintaining existing expense structures in the face of a rising cost environment. The Board also considered PGIM Investments’ assertion that it continually evaluates the management fee schedule of the Fund and the potential to share economies of scale through breakpoints or fee waivers as asset levels increase.
The Board recognized the inherent limitations of any analysis of economies of scale, stemming largely from the Board’s understanding that most of PGIM Investments’ costs are not specific to individual funds, but rather are incurred across a variety of products and services.
Other Benefits to PGIM Investments and Jennison
The Board considered potential ancillary benefits that might be received by PGIM Investments, Jennison and their affiliates as a result of their relationship with the Fund. The Board concluded that potential benefits to be derived by PGIM Investments included transfer agency fees received by the Fund’s transfer agent (which is affiliated with PGIM Investments), as well as benefits to its reputation or other intangible benefits resulting from PGIM Investments’ association with the Fund. The Board concluded that the potential benefits to be derived by Jennison included its ability to use soft dollar credits, as well as the potential benefits consistent with those generally resulting from an increase in assets under management, specifically, potential access to additional research resources and benefits to its reputation. The Board concluded that the benefits
PGIM Jennison 20/20 Focus Fund
Approval of Advisory Agreements (continued)
derived by PGIM Investments and Jennison were consistent with the types of benefits generally derived by investment managers and subadvisers to mutual funds.
Performance of the Fund / Fees and Expenses
The Board considered certain additional factors and made related conclusions relating to the historical performance of the Fund for the one-, three-, five- and ten-year periods ended December 31, 2020.
The Board also considered the Fund’s actual management fee, as well as the Fund’s net total expense ratio, for the fiscal year ended November 30, 2020. The Board considered the management fee for the Fund as compared to the management fee charged by PGIM Investments to other funds and the fee charged by other advisers to comparable mutual funds in a Peer Group. The actual management fee represents the fee rate actually paid by Fund shareholders and includes any fee waivers or reimbursements. The net total expense ratio for the Fund represents the actual expense ratio incurred by Fund shareholders.
The mutual funds included in the Peer Universe, which was used to consider performance, and the Peer Group, which was used to consider fees and expenses, were objectively determined by Broadridge, an independent provider of mutual fund data. In certain circumstances, PGIM Investments also provided supplemental Peer Universe or Peer Group information, for reasons addressed with the Board. The comparisons placed the Fund in various quartiles over various periods, with the first quartile being the best 25% of the mutual funds (for performance, the best performing mutual funds and, for expenses, the lowest cost mutual funds).
The section below summarizes key factors considered by the Board and the Board’s conclusions regarding the Fund’s performance, fees and overall expenses. The table sets forth net performance comparisons (which reflect the impact on performance of fund expenses, or any subsidies, expense caps or waivers that may be applicable) with the Peer Universe, actual management fees with the Peer Group (which reflect the impact of any subsidies or fee waivers), and net total expenses with the Peer Group, each of which were key factors considered by the Board.
| | | | | | | | |
| Net Performance | | 1 Year | | 3 Years | | 5 Years | | 10 Years |
| | | 1st Quartile | | 1st Quartile | | 1st Quartile | | 2nd Quartile |
| Actual Management Fees: 3rd Quartile |
| Net Total Expenses: 4th Quartile |
| ● | The Board noted that the Fund outperformed its benchmark index over the one-, three- and five-year periods and underperformed over the ten-year period. |
| ● | The Board and PGIM Investments agreed to retain the existing contractual expense cap, which (exclusive of certain fees and expenses) limits transfer agency, |
Visit our website at pgim.com/investments
| | shareholder servicing, sub-transfer agency and blue sky fees to the extent that such fees cause the total annual operating expenses to exceed 0.84% for Class R6 shares through March 31, 2022. |
| ● | In addition, PGIM Investments will waive management fees or shared operating expenses on any share class to the same extent that it waives such expenses on any other share class, and has agreed that total annual fund operating expenses for Class R6 shares will not exceed total annual fund operating expenses for Class Z shares. |
| ● | The Board approved the proposed merger of the PGIM Jennison 20/20 Focus Fund into the PGIM Jennison Focused Growth Fund in December 2020. A proxy statement/prospectus relating to the reorganization transaction was mailed to the shareholders in January 2021 and is pending shareholder approval. The Board noted PGIM Investments’ recommendation that Jennison be retained pending completion of the merger. |
| ● | The Board concluded that, in light of the above, it would be in the best interests of the Fund and its shareholders to renew the agreements. |
| ● | The Board concluded that the management fees (including subadvisory fees) and total expenses were reasonable in light of the services provided. |
* * *
After full consideration of these factors, the Board concluded that the approval of the agreements was in the best interests of the Fund and its shareholders.
PGIM Jennison 20/20 Focus Fund
| | | | |
| | | |
| ∎ MAIL | | ∎ TELEPHONE | | ∎ WEBSITE |
655 Broad Street Newark, NJ 07102 | | (800) 225-1852 | | pgim.com/investments |
|
| PROXY VOTING |
The Board of Trustees of the Fund has delegated to the Fund’s subadviser the responsibility for voting any proxies and maintaining proxy recordkeeping with respect to the Fund. A description of these proxy voting policies and procedures is available without charge, upon request, by calling (800) 225-1852 or by visiting the Securities and Exchange Commission’s website at sec.gov. Information regarding how the Fund voted proxies relating to portfolio securities during the most recent 12-month period ended June 30 is available on the Fund’s website and on the Securities and Exchange Commission’s website. |
|
| TRUSTEES |
Ellen S. Alberding ● Kevin J. Bannon ● Scott E. Benjamin ● Linda W. Bynoe ● Barry H. Evans ● Keith F. Hartstein ● Laurie Simon Hodrick ● Stuart S. Parker ● Brian K. Reid ● Grace C. Torres |
|
| OFFICERS |
Stuart S. Parker, President ● Scott E. Benjamin, Vice President ● Christian J. Kelly, Treasurer and Principal Financial and Accounting Officer ● Claudia DiGiacomo, Chief Legal Officer ● Dino Capasso, Chief Compliance Officer ● Jonathan Corbett, Anti-Money Laundering Compliance Officer ● Andrew R. French, Secretary ● Melissa Gonzalez, Assistant Secretary ● Diana N. Huffman, Assistant Secretary ● Kelly A. Coyne, Assistant Secretary ● Patrick E. McGuinness, Assistant Secretary ● Debra Rubano, Assistant Secretary ● Lana Lomuti, Assistant Treasurer ● Russ Shupak, Assistant Treasurer ● Elyse M. McLaughlin, Assistant Treasurer ● Deborah Conway, Assistant Treasurer |
| | | | |
| MANAGER | | PGIM Investments LLC | | 655 Broad Street Newark, NJ 07102 |
|
| SUBADVISER | | Jennison Associates LLC | | 466 Lexington Avenue New York, NY 10017 |
|
| DISTRIBUTOR | | Prudential Investment Management Services LLC | | 655 Broad Street Newark, NJ 07102 |
|
| CUSTODIAN | | The Bank of New York Mellon | | 240 Greenwich Street New York, NY 10286 |
|
| TRANSFER AGENT | | Prudential Mutual Fund Services LLC | | PO Box 9658 Providence, RI 02940 |
|
| INDEPENDENT REGISTERED PUBLIC ACCOUNTING FIRM | | PricewaterhouseCoopers LLP | | 300 Madison Avenue New York, NY 10017 |
|
| FUND COUNSEL | | Willkie Farr & Gallagher LLP | | 787 Seventh Avenue New York, NY 10019 |
|
|
| An investor should consider the investment objectives, risks, charges, and expenses of the Fund carefully before investing. The prospectus and summary prospectus contain this and other information about the Fund. An investor may obtain the prospectus and summary prospectus by visiting our website at pgim.com/investments or by calling (800) 225-1852. The prospectus and summary prospectus should be read carefully before investing. |
|
| E-DELIVERY |
To receive your mutual fund documents online, go to pgim.com/investments/resource/edelivery and enroll. Instead of receiving printed documents by mail, you will receive notification via email when new materials are available. You can cancel your enrollment or change your email address at any time by visiting the website address above. |
|
| SHAREHOLDER COMMUNICATIONS WITH TRUSTEES |
Shareholders can communicate directly with the Board of Trustees by writing to the Chair of the Board, PGIM Jennison 20/20 Focus Fund, PGIM Investments, Attn: Board of Trustees, 655 Broad Street, Newark, NJ 07102. Shareholders can communicate directly with an individual Trustee by writing to that Trustee at the same address. Communications are not screened before being delivered to the addressee. |
|
| AVAILABILITY OF PORTFOLIO HOLDINGS |
The Fund files its complete schedule of portfolio holdings with the Securities and Exchange Commission for the first and third quarters of each fiscal year as an exhibit to its reports on Form N-PORT. The Fund’s Form N-PORT filings are available on the Commission’s website at sec.gov. |
|
| The Fund’s Statement of Additional Information contains additional information about the Fund’s Trustees and is available without charge, upon request, by calling (800) 225-1852. |
Mutual Funds:
| | | | |
ARE NOT INSURED BY THE FDIC OR ANY
FEDERAL GOVERNMENT AGENCY | | MAY LOSE VALUE | | ARE NOT A DEPOSIT OF OR GUARANTEED BY ANY BANK OR ANY BANK AFFILIATE |

PGIM JENNISON 20/20 FOCUS FUND
| | | | | | | | | | |
| | | | | |
SHARE CLASS | | A | | C | | R | | Z | | R6 |
| | | | | |
NASDAQ | | PTWAX | | PTWCX | | JTWRX | | PTWZX | | PJTQX |
| | | | | |
CUSIP | | 74440G107 | | 74440G305 | | 74440G503 | | 74440G404 | | 74440G602 |
MF183E

PGIM JENNISON MLP FUND
ANNUAL REPORT
NOVEMBER 30, 2021

To enroll in e-delivery, go to pgim.com/investments/resource/edelivery
Table of Contents
This report is not authorized for distribution to prospective investors unless preceded or accompanied by a current prospectus.
The views expressed in this report and information about the Fund’s portfolio holdings are for the period covered by this report and are subject to change thereafter.
Mutual funds are distributed by Prudential Investment Management Services LLC, member SIPC. Jennison Associates LLC is a registered investment adviser. Both are Prudential Financial companies. © 2022 Prudential Financial, Inc. and its related entities. Jennison Associates, Jennison, PGIM, and the PGIM logo are service marks of Prudential Financial, Inc. and its related entities, registered in many jurisdictions worldwide.
| | |
| 2 | | Visit our website at pgim.com/investments |
Letter from the President
| | |

| | Dear Shareholder: We hope you find the annual report for the PGIM Jennison MLP Fund informative and useful. The report covers performance for the 12-month period that ended November 30, 2021. The global economy and markets continued to recover throughout the period from the ongoing impact of the COVID-19 pandemic. The Federal Reserve (the Fed) slashed interest rates and kept them near zero to encourage borrowing. Congress passed stimulus bills worth several trillion dollars to help consumers and businesses. And several effective COVID-19 vaccines received regulatory approval. Those measures were enough to offset the fear of rising inflation and supply chain challenges that threatened to disrupt growth. |
At the start of the period, stocks had recovered most of the steep losses they had suffered at the onset of the pandemic. Equities rallied as states reopened their economies but became more volatile as investors worried that a surge in COVID-19 infections would stall the recovery. However, rising corporate profits and economic growth, the resolution of the US presidential election, and the global rollout of approved vaccines lifted equity markets to record levels, helping stocks around the globe post gains for the full period.
While investors sought safety in fixed income early in the period, they turned cautious later due to concerns about higher inflation and the Fed reducing its bond-buying programs. During the period, investment-grade bonds in the US and the overall global bond market, along with emerging market debt, posted negative returns. US high yield corporate bonds posted gains.
Regarding your investments with PGIM, we believe it is important to maintain a diversified portfolio of funds consistent with your tolerance for risk, time horizon, and financial goals. Your financial advisor can help you create a diversified investment plan that may include funds covering all the basic asset classes and that reflects your personal investor profile and risk tolerance. However, diversification and asset allocation strategies do not assure a profit or protect against loss in declining markets.
At PGIM Investments, we consider it a great privilege and responsibility to help investors participate in opportunities across global markets while meeting their toughest investment challenges. PGIM is a top-10 global investment manager with more than $1.5 trillion in assets under management. This scale and investment expertise allow us to deliver actively managed funds and strategies to meet the needs of investors around the globe.
Thank you for choosing our family of funds.
Sincerely,

|
Stuart S. Parker, President |
PGIM Jennison MLP Fund January 14, 2022 |
Your Fund’s Performance (unaudited)
Performance data quoted represent past performance. Past performance does not guarantee future results. The investment return and principal value of an investment will fluctuate so that an investor’s shares, when redeemed, may be worth more or less than their original cost. Current performance may be lower or higher than the past performance data quoted. An investor may obtain performance data as of the most recent month-end by visiting our website at pgim.com/investments or by calling (800) 225-1852.
| | | | | | |
| |
| | | Average Annual Total Returns as of 11/30/21 |
| | | One Year (%) | | Five Years (%) | | Since Inception (%) |
| | | |
| Class A | | | | | | |
| | | |
| (with sales charges) | | 30.32 | | -1.19 | | -1.70 (12/18/2013) |
| | | |
| (without sales charges) | | 37.90 | | -0.07 | | -1.00 (12/18/2013) |
| | | |
| Class C | | | | | | |
| | | |
| (with sales charges) | | 35.83 | | -0.80 | | -1.73 (12/18/2013) |
| | | |
| (without sales charges) | | 36.83 | | -0.80 | | -1.73 (12/18/2013) |
| | | |
| Class Z | | | | | | |
| | | |
| (without sales charges) | | 38.32 | | 0.23 | | -0.72 (12/18/2013) |
| | | |
| Class R6 | | | | | | |
| | | |
| (without sales charges) | | 38.32 | | N/A | | -0.75 (01/26/2018) |
| | | |
| Alerian MLP Index | | | | | | |
| | | |
| | | 38.75 | | -2.55 | | — |
| | | |
| S&P 500 Index | | | | | | |
| | | |
| | | 27.92 | | 17.89 | | — |
| | | | |
|
| Average Annual Total Returns as of 11/30/21 Since Inception (%) |
| | | Class A, Class C, Class Z | | Class R6 |
| | | (12/18/2013) | | (01/26/2018) |
| Alerian MLP Index | | -4.34 | | -4.10 |
| S&P 500 Index | | 14.30 | | 15.44 |
Since Inception returns are provided for any share class with less than 10 fiscal years of returns. Since Inception returns for the Indexes are measured from the closest month-end to the class’ inception date.
| | |
| 4 | | Visit our website at pgim.com/investments |
Growth of a $10,000 Investment (unaudited)
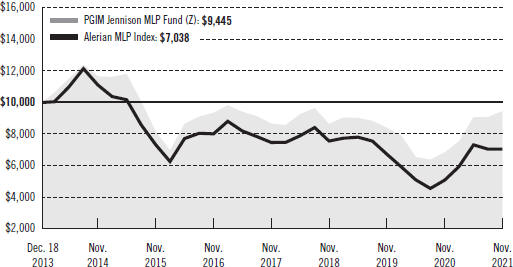
The graph compares a $10,000 investment in the Fund’s Class Z shares with a similar investment in the Alerian MLP Index, by portraying the initial account values at the commencement of operations for Class Z shares (December 18, 2013) and the account values at the end of the current fiscal year (November 30, 2021), as measured on a quarterly basis. For purposes of the graph, and unless otherwise indicated, it has been assumed that (a) all recurring fees (including management fees) were deducted and (b) all dividends and distributions were reinvested. The line graph provides information for Class Z shares only. As indicated in the tables provided earlier, performance for other share classes will vary due to the differing fees and expenses applicable to each share class (as explained in the following paragraphs). Without waiver of fees and/or expense reimbursements, if any, the returns would have been lower.
Past performance does not predict future performance. Total returns and the ending account values in the graph include changes in share price and reinvestment of dividends and capital gains distributions in a hypothetical investment for the periods shown. The Fund’s total returns do not reflect the deduction of income taxes on an individual’s investment. Taxes may reduce your actual investment returns on income or gains paid by the Fund or any gains you may realize if you sell your shares.
Your Fund’s Performance (continued)
The returns in the tables do not reflect the deduction of taxes that a shareholder would pay on Fund distributions or following the redemption of Fund shares. The average annual total returns take into account applicable sales charges, which are described for each share class in the table below.
| | | | | | | | |
| | | | | |
| | | Class A | | Class C | | Class Z | | Class R6 |
| | | | | |
| Maximum initial sales charge | | 5.50% of the public offering price | | None | | None | | None |
| Contingent deferred sales charge (CDSC) (as a percentage of the lower of the original purchase price or the net asset value at redemption) | | 1.00% on sales of $1 million or more made within 12 months of purchase | | 1.00% on sales made within 12 months of purchase | | None | | None |
| Annual distribution and service (12b-1) fees (shown as a percentage of average daily net assets) | | 0.30% (0.25% currently) | | 1.00% | | None | | None |
Benchmark Definitions
Alerian MLP Index—The Alerian MLP Index is an unmanaged index and the leading gauge of energy Master Limited Partnerships (MLPs). The capped, float-adjusted, capitalization-weighted index constituents represent approximately 85% of total float-adjusted market capitalization.
S&P 500 Index*—The S&P 500 Index is an unmanaged index of over 500 stocks of large US public companies. It gives a broad look at how stock prices in the United States have performed.
*The S&P 500 Index (“Index”) is a product of S&P Dow Jones Indices LLC and/or its affiliates and has been licensed for use by PGIM, Inc. and/or its affiliates. Copyright © 2022 S&P Dow Jones Indices LLC, a division of S&P Global, Inc., and/or its affiliates. All rights reserved. Redistribution or reproduction in whole or in part are prohibited without written permission of S&P Dow Jones Indices LLC. For more information on any of S&P Dow Jones Indices LLC’s indices please visit www.spdji.com. S&P® is a registered trademark of S&P Global and Dow Jones® is a registered trademark of Dow Jones Trademark Holdings LLC.
| | |
| 6 | | Visit our website at pgim.com/investments |
Investors cannot invest directly in an index. The returns for the Indexes would be lower if they included the effects of sales charges, operating expenses of a mutual fund, or taxes that may be paid by an investor.
Presentation of Fund Holdings as of 11/30/21
| | | | |
| | |
Ten Largest Holdings | | Line of Business | | % of Net Assets |
| | |
Targa Resources Corp. | | Oil & Gas Storage & Transportation | | 10.5% |
| | |
Energy Transfer LP | | Oil & Gas Storage & Transportation | | 8.3% |
| | |
Cheniere Energy, Inc. | | Oil & Gas Storage & Transportation | | 7.7% |
| | |
ONEOK, Inc. | | Oil & Gas Storage & Transportation | | 6.8% |
| | |
MPLX LP | | Oil & Gas Storage & Transportation | | 6.6% |
| | |
Williams Cos., Inc. (The) | | Oil & Gas Storage & Transportation | | 6.0% |
| | |
Western Midstream Partners LP | | Oil & Gas Storage & Transportation | | 5.9% |
| | |
DCP Midstream LP | | Oil & Gas Storage & Transportation | | 5.7% |
| | |
DT Midstream, Inc. | | Oil & Gas Storage & Transportation | | 5.3% |
| | |
Enterprise Products Partners LP | | Oil & Gas Storage & Transportation | | 5.0% |
Holdings reflect only long-term investments.
Strategy and Performance Overview (unaudited)
How did the Fund perform?
The PGIM Jennison MLP Fund’s Class Z shares returned 38.32% in the 12-month reporting period that ended November 30, 2021, performing in line with the 38.75% return of the Alerian MLP Index (the Index).
What were the market conditions?
| • | Following the tumultuous performance of early 2020 due to the impact of COVID-19, equity markets recovered in late 2020 and continued their recovery through much of 2021. |
| • | Markets were initially led higher by sectors and industries that benefited most from a cyclical economic recovery. |
| • | By the middle of 2021, growth-oriented companies began to drive equity markets even higher at the same time that the Federal Reserve’s comments began to reflect concerns about labor shortages and rising prices. |
| • | Despite concerns regarding another wave of global shutdowns due to new variants of the COVID-19 virus, markets held on to much of their earlier performance gains through the end of the reporting period. |
| • | The energy sector generated particularly strong returns over the period as a recovery in demand, combined with supply constraints, boosted oil and natural gas prices through much of 2021, driving energy stocks higher. |
| • | Sentiment in the midstream energy sector also turned favorable during the period as a combination of strong macro-economic factors, along with company-specific improvements, propelled those stocks higher. |
What worked?
Most areas in midstream energy produced positive performance during the reporting period. Relative to the Index, the Fund’s allocation to the strong-performing natural gas pipeline and storage sector, as well as favorable stock selections within the sector, bolstered overall performance.
Top absolute contributors
| • | Targa Resources Corp. owns a portfolio of integrated midstream energy assets across the natural gas and natural gas liquids (NGLs) value chain. The company’s diverse platform connects low-cost natural gas and NGL supply to demand markets in the US and internationally through facilities in the Gulf Coast. Targa has benefited from its integrated, Permian/Gulf Coast-centric asset footprint and, as its primary business is gathering and processing natural gas, from the highest commodity price environment in years. Targa continues to lead the sector from a free cash flow standpoint, while maintaining capital discipline in an effort to reduce leverage that should ultimately drive improved shareholder value, in Jennison’s view. With its attractive EBITDA (earnings before interest, taxes, depreciation, and amortization) growth profile, higher fee-based margins, lower leverage, and significant free cash flow after dividends and capital expenditures, Jennison continues to favor Targa. |
| | |
| 8 | | Visit our website at pgim.com/investments |
| • | Cheniere Energy, Inc. is an integrated, full-service liquefied natural gas (LNG) company, that owns and operates LNG receiving terminals and pipelines in Louisiana and Texas. Cheniere benefited from tight global LNG markets and historically high natural gas prices. Jennison continues to favor Cheniere in light of the company’s first-mover advantage and attractive fixed-fee “take-or-pay” contract revenues, with roughly 80% of its capacity under long-term contracts. Given the industry’s material decline in annual capacity additions, coupled with increases in global demand, Jennison expects a future gap in supply and demand that should provide tailwinds for Cheniere over the next several years. |
| • | MPLX LP, a diversified midstream company and one of the largest refiners in the US, focuses on liquids logistics and storage, largely in service of parent company Marathon Petroleum’s refining network, along with its gathering and processing and its fractionation businesses across the US. In addition to strong earnings results during the period, MPLX began executing on its capital allocation plans by pursuing a share repurchase program while also lowering its capital spending budget-moves that were well-received by the market. |
What didn’t work?
The Fund’s modest allocation to renewable energy (not represented in the Index), which was a strong performer in 2020, detracted from performance during the reporting period. The Fund’s slight underweight allocation to the gathering and processing sector, a top-performing sector in the Index, also hampered relative returns.
Top absolute detractors:
| • | New Fortress Energy Inc. develops, finances, constructs, and operates energy infrastructure assets, most notably LNG infrastructure and logistics, bringing energy to underserved areas. Shares benefited early in the period from the company’s exposure to momentum-driving renewables and growth, but they suffered as that trade lost steam later despite the long-term potential of New Fortress’s hydrogen business. Concerns over LNG procurement costs also pressured shares, as did the company’s acquisition of Golar LNG Partners early in 2021, which surprised the market. Jennison maintained its position in New Fortress given the company’s LNG exposure, as well as the long-term growth potential of its hydrogen business. |
| • | Brookfield Renewable Partners LP develops long-dated renewable power assets and is one of the largest, publicly traded, pure-play renewable power companies in the world. It owns a growing portfolio of renewable power assets, including wind and solar generation facilities, primarily in North America, Colombia, Brazil, Europe, India, and China. Jennison believes the company is competitively positioned to take advantage of the shift toward a greener economy on the path toward decarbonization. After robust performance in 2020, market-wide weakness in renewables pressured Brookfield’s shares in 2021. Jennison reduced its overall renewables exposure in favor of companies more exposed to an economic recovery, and it subsequently liquidated its position in Brookfield during the period. |
Strategy and Performance Overview (continued)
| • | Cheniere Energy Partners LP owns 100% of the Sabine Pass LNG terminal in Cameron Parish, Louisiana, where it operates natural gas liquefaction facilities that include an existing infrastructure of LNG storage tanks, marine berths, and vaporizers. The company also owns a 94-mile pipeline that connects the Sabine Pass LNG terminal with a number of large interstate pipelines. Parent company Cheniere Energy, Inc., along with the Cheniere family of companies, has a first-mover advantage and the ability to sign up new customers via attractive fixed-fee “take-or-pay” contracts, which have historically produced stable and substantial cash flows. While Jennison continues to favor the broad Cheniere story, growth at Cheniere Energy Partners is slowing, leading Jennison to exit the position in favor of more attractive opportunities. |
Current outlook
| • | In many ways, the pandemic has accelerated a shift in behavior that was already underway in the midstream energy sector. Over the last several years, companies had increasingly focused on improving corporate governance, reducing indiscriminate project spending, and relying on internally generated cash flow to fund necessary growth projects. Forced reductions in general and administrative expenses to preserve balance sheets after the COVID-19 pandemic struck led to the vast majority of midstream companies adopting a sharply sustained focus on capital returns and capital discipline. Correspondingly, the risks of management teams chasing lower project returns, over-leveraging, and raising dividends at any cost have diminished significantly. These behavioral reforms and austerity measures have resulted in increased cash flow generation, more debt reduction, and higher dividend coverage. |
| • | In fact, cash flows have been allocated toward measures other than raising distributions for some time. The midstream sector reached a significant inflection point in 2021, when many of the larger companies became free cash flow positive for the first time. Some companies used the increased cash flow to further decrease leverage and strengthen balance sheets while also establishing or increasing stock buybacks. In Jennison’s view, these positive developments are finally enabling the midstream group to show that their reform efforts are real and lasting and have begun to benefit shareholders. |
| • | After experiencing a robust growth stage over the last decade and evolving into a stronger, more sustainable sector in the last few years, the midstream industry appears to be entering a “transition” phase. Each company’s growth opportunities depend on its ability to adapt its business model to the future. Jennison believes some of the winners will be natural gas plays with a more visible long-term demand, a North American focus, and a relative lack of geopolitical oil risks. Other winners may include companies with integrated asset systems and multiple touchpoints across the entire energy value chain, as well as management teams focused on selling underutilized assets. |
| • | The adoption of ESG (environmental, social, and corporate governance) criteria is further reshaping the industry. In Jennison’s view, companies that acknowledge the need for more ESG-related transparency with a focus on reducing carbon footprints |
| | |
| 10 | | Visit our website at pgim.com/investments |
| | are also likely to emerge as winners. Jennison believes that the adaptability of midstream assets to handle energy sources other than hydrocarbons is greatly underappreciated. Several midstream companies have announced new ESG-related initiatives and investments in carbon capture, hydrogen, and other renewable fuels. The willingness and foresight to invest in renewable projects better positions companies to participate in the critical role that the midstream industry will play in the world’s energy future. |
| | • | | While renewable sources of energy are needed to help combat climate change, Jennison believes that demand for natural gas and the midstream infrastructure supporting it will persist as the world moves toward a less carbon-intensive future. The path to decarbonization will likely be a very long transition involving multiple solutions, including cleaner-burning natural gas. In 2019, renewables generated more electricity in the US than coal for the first time, a significant milestone. Yet many investors continue to doubt the need for natural gas, despite its role in producing approximately 38% of net electricity generation in the US, its growing use around the world, and its displacement of coal and oil. The realization that these nondiscretionary assets are still critical to a functioning economy could serve as a potential catalyst for the group, in Jennison’s view. |
| | • | | As Jennison has stated in the past, the visible, long-term demand for cleaner fuels such as natural gas highlights the sustainability of integrated midstream assets during the pandemic and beyond, as these infrastructure systems will be needed to power the US economy in the decades to come. Furthermore, the rise of electric vehicles and the need to power them will likely increase electricity demand. At the same time, the further decommissioning of coal and nuclear plants will lower overall installed capacity, reducing supply. While renewables will certainly take up a portion of the shortfall, Jennison sees natural gas continuing to help fill that supply gap. The market has largely ignored the long-term, sustainable value of some of these essential networks. As a result, the intrinsic and terminal asset values of these companies are substantially underappreciated, in Jennison’s view. Certain midstream assets feature high barriers to entry, are nondiscretionary in that they are necessary to transport energy, and are essential to a functioning US and global economy. |
| | | | |
PGIM Jennison MLP Fund | | | 11 | |
Fees and Expenses (unaudited)
As a shareholder of the Fund, you incur two types of costs: (1) transaction costs, including sales charges (loads) on purchase payments and redemptions, as applicable, and (2) ongoing costs, including management fees, distribution and/or service (12b-1) fees, and other Fund expenses, as applicable. This example is intended to help you understand your ongoing costs (in dollars) of investing in the Fund and to compare these costs with the ongoing costs of investing in other mutual funds.
The example is based on an investment of $1,000 held through the six-month period ended November 30, 2021. The example is for illustrative purposes only; you should consult the Prospectus for information on initial and subsequent minimum investment requirements.
Actual Expenses
The first line for each share class in the table on the following page provides information about actual account values and actual expenses. You may use the information on this line, together with the amount you invested, to estimate the expenses that you paid over the period. Simply divide your account value by $1,000 (for example, an $8,600 account value ÷ $1,000 = 8.6), then multiply the result by the number on the first line under the heading “Expenses Paid During the Six-Month Period” to estimate the expenses you paid on your account during this period.
Hypothetical Example for Comparison Purposes
The second line for each share class in the table on the following page provides information about hypothetical account values and hypothetical expenses based on the Fund’s actual expense ratio and an assumed rate of return of 5% per year before expenses, which is not the Fund’s actual return. The hypothetical account values and expenses may not be used to estimate the actual ending account balance or expenses you paid for the period. You may use this information to compare the ongoing costs of investing in the Fund and other funds. To do so, compare this 5% hypothetical example with the 5% hypothetical examples that appear in the shareholder reports of the other funds.
The Fund’s transfer agent may charge additional fees to holders of certain accounts that are not included in the expenses shown in the table on the following page. These fees apply to individual retirement accounts (IRAs) and Section 403(b) accounts. As of the close of the six-month period covered by the table, IRA fees included an annual maintenance fee of $15 per account (subject to a maximum annual maintenance fee of $25 for all accounts held by the same shareholder). Section 403(b) accounts are charged an annual $25 fiduciary maintenance fee. Some of the fees may vary in amount, or may be waived, based on your total account balance or the number of PGIM funds, including the Fund, that you own. You should consider the additional fees that were charged to your Fund account over the six-month period when you estimate the total ongoing expenses paid over the period and the impact of these fees on your ending account value, as these additional expenses are not reflected in the information
| | |
| 12 | | Visit our website at pgim.com/investments |
provided in the expense table. Additional fees have the effect of reducing investment returns.
Please note that the expenses shown in the table are meant to highlight your ongoing costs only and do not reflect any transactional costs such as sales charges (loads). The expenses in the table do not reflect current/deferred tax benefits or expenses. Therefore, the second line for each share class in the table is useful in comparing ongoing costs only and will not help you determine the relative total costs of owning different funds. In addition, if these transactional costs were included, your costs would have been higher.
| | | | | | | | | | |
| | | | |
| PGIM Jennison MLP Fund | | Beginning Account Value
June 1, 2021 | | Ending Account Value November 30, 2021 | | Annualized
Expense Ratio Based on the
Six-Month Period | | Expenses Paid
During the
Six-Month Period* |
| Class A | | Actual | | $1,000.00 | | $1,039.50 | | 1.50% | | $ 7.67 |
| | Hypothetical | | $1,000.00 | | $1,017.55 | | 1.50% | | $ 7.59 |
| Class C | | Actual | | $1,000.00 | | $1,036.80 | | 2.23% | | $11.39 |
| | Hypothetical | | $1,000.00 | | $1,013.89 | | 2.23% | | $11.26 |
| Class Z | | Actual | | $1,000.00 | | $1,041.90 | | 1.20% | | $ 6.14 |
| | Hypothetical | | $1,000.00 | | $1,019.05 | | 1.20% | | $ 6.07 |
| Class R6 | | Actual | | $1,000.00 | | $1,041.90 | | 1.10% | | $ 5.63 |
| | | Hypothetical | | $1,000.00 | | $1,019.55 | | 1.10% | | $ 5.57 |
*Fund expenses (net of fee waivers or subsidies, if any) for each share class are equal to the annualized expense ratio for each share class (provided in the table), multiplied by the average account value over the period, multiplied by the 183 days in the six-month period ended November 30, 2021, and divided by the 365 days in the Fund’s fiscal year ended November 30, 2021 (to reflect the six-month period). Expenses presented in the table include the expenses of any underlying portfolios in which the Fund may invest.
| | | | |
PGIM Jennison MLP Fund | | | 13 | |
Schedule of Investments
as of November 30, 2021
| | | | | | | | |
| | |
| Description | | Shares | | | Value | |
| | |
LONG-TERM INVESTMENTS 100.3% | | | | | | | | |
| | |
COMMON STOCKS 52.7% | | | | | | | | |
| | |
Oil & Gas Refining & Marketing 0.8% | | | | | | | | |
New Fortress Energy, Inc. | | | 138,244 | | | $ | 3,440,893 | |
| | |
Oil & Gas Storage & Transportation 51.9% | | | | | | | | |
Antero Midstream Corp. | | | 396,805 | | | | 3,852,977 | |
Cheniere Energy, Inc. | | | 310,220 | | | | 32,514,158 | |
DT Midstream, Inc. | | | 486,833 | | | | 22,331,030 | |
Enbridge, Inc. (Canada) | | | 355,334 | | | | 13,332,153 | |
Equitrans Midstream Corp. | | | 1,304,436 | | | | 12,548,674 | |
Keyera Corp. (Canada) | | | 237,485 | | | | 5,216,509 | |
Kinder Morgan, Inc. | | | 486,870 | | | | 7,527,010 | |
ONEOK, Inc. | | | 479,042 | | | | 28,665,873 | |
Pembina Pipeline Corp. (Canada) | | | 581,164 | | | | 17,231,513 | |
Targa Resources Corp. | | | 855,805 | | | | 44,185,212 | |
TC Energy Corp. (Canada) | | | 131,255 | | | | 6,156,640 | |
Williams Cos., Inc. (The) | | | 951,242 | | | | 25,483,773 | |
| | | | | | | | |
| | |
| | | | | | | 219,045,522 | |
| | | | | | | | |
| | |
TOTAL COMMON STOCKS | | | | | | | | |
(cost $182,661,933) | | | | | | | 222,486,415 | |
| | | | | | | | |
| | |
MASTER LIMITED PARTNERSHIPS 46.8% | | | | | | | | |
| | |
Coal & Consumable Fuels 1.6% | | | | | | | | |
Enviva Partners LP | | | 99,527 | | | | 6,969,876 | |
| | |
Oil & Gas Storage & Transportation 43.4% | | | | | | | | |
Crestwood Equity Partners LP | | | 126,515 | | | | 3,233,723 | |
DCP Midstream LP | | | 916,579 | | | | 24,133,525 | |
Energy Transfer LP | | | 4,175,635 | | | | 35,158,847 | |
Enterprise Products Partners LP | | | 976,093 | | | | 20,878,629 | |
Genesis Energy LP | | | 393,493 | | | | 3,970,344 | |
Hess Midstream LP (Class A Stock) | | | 158,174 | | | | 3,916,388 | |
Magellan Midstream Partners LP | | | 328,642 | | | | 15,242,416 | |
MPLX LP | | | 950,793 | | | | 27,867,743 | |
NuStar Energy LP | | | 306,689 | | | | 4,293,646 | |
Plains All American Pipeline LP | | | 400,808 | | | | 3,727,515 | |
Plains GP Holdings LP (Class A Stock)* | | | 1,613,504 | | | | 16,135,040 | |
Western Midstream Partners LP | | | 1,284,991 | | | | 24,710,377 | |
| | | | | | | | |
| | |
| | | | | | | 183,268,193 | |
See Notes to Financial Statements.
| | | | |
PGIM Jennison MLP Fund | | | 15 | |
Schedule of Investments (continued)
as of November 30, 2021
| | | | | | | | |
| | |
| Description | | Shares | | | Value | |
| | |
MASTER LIMITED PARTNERSHIPS (Continued) | | | | | | | | |
| | |
Renewable Electricity 1.8% | | | | | | | | |
NextEra Energy Partners LP | | | 87,674 | | | $ | 7,456,674 | |
| | | | | | | | |
| | |
TOTAL MASTER LIMITED PARTNERSHIPS | | | | | | | | |
(cost $167,848,539) | | | | | | | 197,694,743 | |
| | | | | | | | |
| | |
PREFERRED STOCK 0.8% | | | | | | | | |
| | |
Electric Utilities | | | | | | | | |
NextEra Energy, Inc., CVT, 6.219%, Maturing 09/01/23 | | | | | | | | |
(cost $3,232,630) | | | 64,330 | | | | 3,473,820 | |
| | | | | | | | |
| | |
TOTAL LONG-TERM INVESTMENTS | | | | | | | | |
(cost $353,743,102) | | | | | | | 423,654,978 | |
| | | | | | | | |
| | |
SHORT-TERM INVESTMENT 0.3% | | | | | | | | |
| | |
AFFILIATED MUTUAL FUND | | | | | | | | |
PGIM Core Ultra Short Bond Fund | | | | | | | | |
(cost $1,495,953)(wb) | | | 1,495,953 | | | | 1,495,953 | |
| | | | | | | | |
| | |
TOTAL INVESTMENTS 100.6% | | | | | | | | |
(cost $355,239,055) | | | | | | | 425,150,931 | |
Liabilities in excess of other assets (0.6)% | | | | | | | (2,639,491 | ) |
| | | | | | | | |
| | |
NET ASSETS 100.0% | | | | | | $ | 422,511,440 | |
| | | | | | | | |
Below is a list of the abbreviation(s) used in the annual report:
CVT — Convertible Security
LIBOR — London Interbank Offered Rate
LP — Limited Partnership
| * | Non-income producing security. |
| (wb) | PGIM Investments LLC, the manager of the Fund, also serves as manager of the PGIM Core Ultra Short Bond Fund. |
Fair Value Measurements:
Various inputs are used in determining the value of the Fund’s investments. These inputs are summarized in the three broad levels listed below.
Level 1—unadjusted quoted prices generally in active markets for identical securities.
Level 2—quoted prices for similar securities, interest rates and yield curves, prepayment speeds, foreign currency exchange rates and other observable inputs.
Level 3—unobservable inputs for securities valued in accordance with Board approved fair valuation procedures.
See Notes to Financial Statements.
The following is a summary of the inputs used as of November 30, 2021 in valuing such portfolio securities:
| | | | | | | | | | | | | | | |
| | | Level 1 | | Level 2 | | Level 3 |
Investments in Securities | | | | | | | | | | | | | | | |
Assets | | | | | | | | | | | | | | | |
Long-Term Investments | | | | | | | | | | | | | | | |
Common Stocks | | | | | | | | | | | | | | | |
Oil & Gas Refining & Marketing | | | $ | 3,440,893 | | | | | $— | | | | | $— | |
Oil & Gas Storage & Transportation | | | | 219,045,522 | | | | | — | | | | | — | |
Master Limited Partnerships | | | | | | | | | | | | | | | |
Coal & Consumable Fuels | | | | 6,969,876 | | | | | — | | | | | — | |
Oil & Gas Storage & Transportation | | | | 183,268,193 | | | | | — | | | | | — | |
Renewable Electricity | | | | 7,456,674 | | | | | — | | | | | — | |
Preferred Stock | | | | | | | | | | | | | | | |
Electric Utilities | | | | 3,473,820 | | | | | — | | | | | — | |
Short-Term Investment | | | | | | | | | | | | | | | |
Affiliated Mutual Fund | | | | 1,495,953 | | | | | — | | | | | — | |
| | | | | | | | | | | | | | | |
Total | | | $ | 425,150,931 | | | | | $— | | | | | $— | |
| | | | | | | | | | | | | | | |
| | | | | | | | | | | | | | | |
Industry Classification:
The industry classification of investments and liabilities in excess of other assets shown as a percentage of net assets as of November 30, 2021 were as follows (unaudited):
| | | | |
Oil & Gas Storage & Transportation | | | 95.3 | % |
Renewable Electricity | | | 1.8 | |
Coal & Consumable Fuels | | | 1.6 | |
Oil & Gas Refining & Marketing | | | 0.8 | |
Electric Utilities | | | 0.8 | |
Affiliated Mutual Fund | | | 0.3 | |
| | | | |
| | | 100.6 | |
Liabilities in excess of other assets | | | (0.6 | ) |
| | | | |
| |
| | | 100.0 | % |
| | | | |
| | | | |
See Notes to Financial Statements.
| | | | |
PGIM Jennison MLP Fund | | | 17 | |
Statement of Assets and Liabilities
as of November 30, 2021
| | | | | |
Assets | | | | | |
Investments at value: | | | | | |
Unaffiliated investments (cost $353,743,102) | | | $ | 423,654,978 | |
Affiliated investments (cost $1,495,953) | | | | 1,495,953 | |
Receivable for Fund shares sold | | | | 1,046,311 | |
Dividends receivable | | | | 355,958 | |
Prepaid expenses | | | | 2,919 | |
| | | | | |
Total Assets | | | | 426,556,119 | |
| | | | | |
| |
Liabilities | | | | | |
Deferred tax liability | | | | 2,691,431 | |
Payable for Fund shares purchased | | | | 719,046 | |
Management fee payable | | | | 374,072 | |
Accrued expenses and other liabilities | | | | 210,665 | |
Distribution fee payable | | | | 31,059 | |
Franchise tax payable | | | | 13,219 | |
Trustees’ fees payable | | | | 2,940 | |
Affiliated transfer agent fee payable | | | | 2,247 | |
| | | | | |
Total Liabilities | | | | 4,044,679 | |
| | | | | |
| |
Net Assets | | | $ | 422,511,440 | |
| | | | | |
| |
| | | | | |
Net assets were comprised of: | | | | | |
Shares of beneficial interest, at par | | | $ | 71,923 | |
Paid-in capital in excess of par | | | | 456,764,375 | |
Total distributable earnings (loss) | | | | (34,324,858 | ) |
| | | | | |
Net assets, November 30, 2021 | | | $ | 422,511,440 | |
| | | | | |
See Notes to Financial Statements.
| | | | | |
Class A | | | | | |
Net asset value, offering price and redemption price per share, ($28,139,496 ÷ 4,881,935 shares of beneficial interest issued and outstanding) | | | $ | 5.76 | |
Maximum sales charge (5.50% of offering price) | | | | 0.34 | |
| | | | | |
Maximum offering price to public | | | $ | 6.10 | |
| | | | | |
| |
Class C | | | | | |
Net asset value, offering price and redemption price per share, ($27,871,362 ÷ 5,229,147 shares of beneficial interest issued and outstanding) | | | $ | 5.33 | |
| | | | | |
| |
Class Z | | | | | |
Net asset value, offering price and redemption price per share, ($323,885,575 ÷ 54,630,670 shares of beneficial interest issued and outstanding) | | | $ | 5.93 | |
| | | | | |
| |
Class R6 | | | | | |
Net asset value, offering price and redemption price per share, ($42,615,007 ÷ 7,181,732 shares of beneficial interest issued and outstanding) | | | $ | 5.93 | |
| | | | | |
See Notes to Financial Statements.
| | | | |
PGIM Jennison MLP Fund | | | 19 | |
Statement of Operations
Year Ended November 30, 2021
| | | | | |
Net Investment Income (Loss) | | | | | |
Income | | | | | |
Unaffiliated distributions and dividend income (net of $570,488 foreign withholding tax) | | | $ | 24,925,969 | |
Less: Return of capital on distributions | | | | (18,825,008 | ) |
Affiliated dividend income | | | | 7,972 | |
| | | | | |
Total income | | | | 6,108,933 | |
| | | | | |
| |
Expenses | | | | | |
Management fee | | | | 4,041,945 | |
Distribution fee(a) | | | | 353,099 | |
Transfer agent’s fees and expenses (including affiliated expense of $14,804)(a) | | | | 335,486 | |
Tax service fees | | | | 96,250 | |
Shareholders’ reports | | | | 63,396 | |
Custodian and accounting fees | | | | 63,071 | |
Registration fees(a) | | | | 60,864 | |
Audit fee | | | | 59,500 | |
Legal fees and expenses | | | | 22,325 | |
Trustees’ fees | | | | 14,657 | |
Franchise tax expense | | | | 13,219 | |
Miscellaneous | | | | 39,928 | |
| | | | | |
Total expenses | | | | 5,163,740 | |
Less: Fee waiver and/or expense reimbursement(a) | | | | (601 | ) |
Distribution fee waiver(a) | | | | (12,867 | ) |
| | | | | |
Net expenses | | | | 5,150,272 | |
| | | | | |
Net Investment income (loss), before deferred taxes | | | | 958,661 | |
Deferred tax benefit | | | | 15,440 | |
| | | | | |
Net investment income (loss), net of taxes | | | | 974,101 | |
| | | | | |
| |
Realized And Unrealized Gain (Loss) On Investment And Foreign Currency Transactions | | | | | |
Net realized gain (loss) on: | | | | | |
Investment transactions | | | | 6,423,491 | |
Deferred tax benefit | | | | 103,424 | |
Foreign currency transactions | | | | (1,833 | ) |
| | | | | |
| | | | 6,525,082 | |
| | | | | |
Net change in unrealized appreciation (depreciation) on: | | | | | |
Investments | | | | 113,298,609 | |
Deferred tax benefit | | | | 1,824,618 | |
Foreign currencies | | | | (7,039 | ) |
| | | | | |
| | | | 115,116,188 | |
| | | | | |
Net gain (loss) on investment and foreign currency transactions, net of deferred taxes | | | | 121,641,270 | |
| | | | | |
Net Increase (Decrease) In Net Assets Resulting From Operations | | | $ | 122,615,371 | |
| | | | | |
See Notes to Financial Statements.
| (a) | Class specific expenses and waivers were as follows: |
| | | | | | | | | | | | | | | | |
| | | Class A | | | Class C | | | Class Z | | | Class R6 | |
Distribution fee | | | 77,200 | | | | 275,899 | | | | — | | | | — | |
Transfer agent’s fees and expenses | | | 28,182 | | | | 25,631 | | | | 281,406 | | | | 267 | |
Registration fees | | | 13,897 | | | | 13,154 | | | | 26,116 | | | | 7,697 | |
Fee waiver and/or expense reimbursement | | | (601 | ) | | | — | | | | — | | | | — | |
Distribution fee waiver | | | (12,867 | ) | | | — | | | | — | | | | — | |
See Notes to Financial Statements.
| | | | |
PGIM Jennison MLP Fund | | | 21 | |
Statements of Changes in Net Assets
| | | | | | | | | | |
| | | Year Ended November 30, | | | |
| | | 2021 | | | 2020 | | | |
| | | |
Increase (Decrease) in Net Assets | | | | | | | | | | |
Operations | | | | | | | | | | |
Net investment income (loss), net of taxes | | $ | 974,101 | | | $ | 1,737,300 | | | |
Net realized gain (loss) on investment and foreign currency transactions, net of deferred taxes | | | 6,525,082 | | | | (63,889,205 | ) | | |
Net change in unrealized appreciation (depreciation) on investments and foreign currencies, net of deferred taxes | | | 115,116,188 | | | | (30,289,739 | ) | | |
| | | | | | | | | | |
Net increase (decrease) in net assets resulting from operations | | | 122,615,371 | | | | (92,441,644 | ) | | |
| | | | | | | | | | |
Dividends and Distributions | | | | | | | | | | |
Distributions from distributable earnings | | | | | | | | | | |
Class A | | | (519,745 | ) | | | — | | | |
Class C | | | (590,161 | ) | | | — | | | |
Class Z | | | (6,150,858 | ) | | | — | | | |
Class R6 | | | (725,863 | ) | | | — | | | |
| | | | | | | | | | |
| | | (7,986,627 | ) | | | — | | | |
| | | | | | | | | | |
Tax return of capital distributions | | | | | | | | | | |
Class A | | | (967,094 | ) | | | (1,946,004 | ) | | |
Class C | | | (1,098,119 | ) | | | (2,133,468 | ) | | |
Class Z | | | (11,444,955 | ) | | | (19,420,246 | ) | | |
Class R6 | | | (1,350,620 | ) | | | (404,213 | ) | | |
| | | | | | | | | | |
| | | (14,860,788 | ) | | | (23,903,931 | ) | | |
| | | | | | | | | | |
Fund share transactions (Net of share conversions) | | | | | | | | | | |
Net proceeds from shares sold | | | 118,099,379 | | | | 213,307,652 | | | |
Net asset value of shares issued in reinvestment of dividends and distributions | | | 22,724,717 | | | | 23,773,353 | | | |
Cost of shares purchased | | | (130,841,241 | ) | | | (247,588,752 | ) | | |
| | | | | | | | | | |
Net increase (decrease) in net assets from Fund share transactions | | | 9,982,855 | | | | (10,507,747 | ) | | |
| | | | | | | | | | |
Total increase (decrease) | | | 109,750,811 | | | | (126,853,322 | ) | | |
| | | |
Net Assets: | | | | | | | | | | |
Beginning of year | | | 312,760,629 | | | | 439,613,951 | | | |
| | | | | | | | | | |
End of year | | $ | 422,511,440 | | | $ | 312,760,629 | | | |
| | | | | | | | | | |
See Notes to Financial Statements.
Financial Highlights
| | | | | | | | | | | | | | | | | | | | |
| Class A Shares | |
| | | Year Ended November 30, | |
| | | 2021 | | | 2020 | | | 2019 | | | 2018 | | | 2017 | |
| Per Share Operating Performance(a): | | | | | | | | | | | | | | | | | | | | |
| Net Asset Value, Beginning of Year | | | $4.42 | | | | $5.87 | | | | $6.50 | | | | $6.95 | | | | $7.99 | |
| Income (loss) from investment operations: | | | | | | | | | | | | | | | | | | | | |
| Net investment income (loss) | | | - | (b)(c) | | | 0.02 | | | | - | (c) | | | (0.01 | ) | | | (0.05 | ) |
| Net realized and unrealized gain (loss) on investment and foreign currency transactions | | | 1.66 | | | | (1.12 | ) | | | (0.18 | ) | | | 0.01 | | | | (0.53 | ) |
| Total from investment operations | | | 1.66 | | | | (1.10 | ) | | | (0.18 | ) | | | - | | | | (0.58 | ) |
| Less Dividends and Distributions: | | | | | | | | | | | | | | | | | | | | |
| Dividends from net investment income | | | (0.11 | ) | | | - | | | | - | | | | - | | | | (0.09 | ) |
| Tax return of capital distributions | | | (0.21 | ) | | | (0.35 | ) | | | (0.45 | ) | | | (0.45 | ) | | | (0.37 | ) |
| Total dividends and distributions | | | (0.32 | ) | | | (0.35 | ) | | | (0.45 | ) | | | (0.45 | ) | | | (0.46 | ) |
| Net asset value, end of year | | | $5.76 | | | | $4.42 | | | | $5.87 | | | | $6.50 | | | | $6.95 | |
| Total Return(d): | | | 37.90 | % | | | (18.96 | )% | | | (3.24 | )% | | | (0.31 | )% | | | (7.55 | )% |
| | | | | | | | | | | | | | | | | | | | | |
| Ratios/Supplemental Data: | | | | | | | | | | | | | | | |
| Net assets, end of year (000) | | | $28,139 | | | | $20,308 | | | | $45,620 | | | | $55,342 | | | | $60,440 | |
| Average net assets (000) | | | $25,733 | | | | $28,294 | | | | $51,347 | | | | $64,395 | | | | $67,422 | |
| Ratios to average net assets(e)(f): | | | | | | | | | | | | | | | | | | | | |
| Expenses after waivers and/or expense reimbursement, before taxes | | | 1.50 | % | | | 1.50 | % | | | 1.47 | % | | | 1.47 | % | | | 1.47 | % |
| Expenses after waivers and/or expense reimbursement, net of taxes(g) | | | 1.02 | % | | | 1.97 | % | | | 1.43 | % | | | 2.02 | % | | | 0.56 | % |
| Expenses before waivers and/or expense reimbursement, before taxes | | | 1.55 | % | | | 1.57 | % | | | 1.52 | % | | | 1.52 | % | | | 1.52 | % |
| Net investment income (loss) | | | (0.03 | )% | | | 0.44 | % | | | 0.05 | % | | | (0.20 | )% | | | (0.46 | )% |
| Net investment income (loss), net of taxes(h) | | | (0.03 | )% | | | 0.45 | % | | | 0.05 | % | | | (0.27 | )% | | | (0.63 | )% |
| Portfolio turnover rate(i) | | | 42 | % | | | 45 | % | | | 23 | % | | | 41 | % | | | 25 | % |
| (a) | Calculated based on average shares outstanding during the year. |
| (b) | The per share amount of net investment income (loss) does not directly correlate to the amounts reported in the Statement of Operations due to class specific expenses. |
| (c) | Amount rounds to zero. |
| (d) | Total return does not consider the effects of sales loads. Total return is calculated assuming a purchase of a share on the first day and a sale on the last day of each year reported and includes reinvestment of dividends and distributions, if any. Total returns may reflect adjustments to conform to GAAP. |
| (e) | Does not include expenses of the underlying funds in which the Fund invests. |
| (f) | Effective December 1, 2017, class specific expenses include transfer agent fees and expenses and registration fees, which are charged to their respective share class. |
| (g) | Tax estimate for the ratio calculation is derived from the net investment income (loss), realized and unrealized gains (losses). |
| (h) | Tax estimate for the ratio calculation is derived from the net investment income (loss) only. |
| (i) | The Fund’s portfolio turnover rate is calculated in accordance with regulatory requirements, without regard to transactions involving short-term investments, certain derivatives and in-kind transactions (if any). If such transactions were included, the Fund’s portfolio turnover rate may be higher. |
See Notes to Financial Statements.
| | | | |
PGIM Jennison MLP Fund | | | 23 | |
Financial Highlights (continued)
| | | | | | | | | | | | | | | | | | | | |
| Class C Shares | |
| | | Year Ended November 30, | |
| | | 2021 | | | 2020 | | | 2019 | | | 2018 | | | 2017 | |
| Per Share Operating Performance(a): | | | | | | | | | | | | | | | | | | | | |
| Net Asset Value, Beginning of Year | | | $4.14 | | | | $5.56 | | | | $6.22 | | | | $6.72 | | | | $7.80 | |
| Income (loss) from investment operations: | | | | | | | | | | | | | | | | | | | | |
| Net investment income (loss) | | | (0.03 | )(b) | | | (0.02 | )(b) | | | (0.03 | ) | | | (0.07 | ) | | | (0.10 | ) |
| Net realized and unrealized gain (loss) on investment and foreign currency transactions | | | 1.54 | | | | (1.05 | ) | | | (0.18 | ) | | | 0.02 | | | | (0.52 | ) |
| Total from investment operations | | | 1.51 | | | | (1.07 | ) | | | (0.21 | ) | | | (0.05 | ) | | | (0.62 | ) |
| Less Dividends and Distributions: | | | | | | | | | | | | | | | | | | | | |
| Dividends from net investment income | | | (0.11 | ) | | | - | | | | - | | | | - | | | | (0.09 | ) |
| Tax return of capital distributions | | | (0.21 | ) | | | (0.35 | ) | | | (0.45 | ) | | | (0.45 | ) | | | (0.37 | ) |
| Total dividends and distributions | | | (0.32 | ) | | | (0.35 | ) | | | (0.45 | ) | | | (0.45 | ) | | | (0.46 | ) |
| Net asset value, end of year | | | $5.33 | | | | $4.14 | | | | $5.56 | | | | $6.22 | | | | $6.72 | |
| Total Return(c): | | | 36.83 | % | | | (19.49 | )% | | | (3.89 | )% | | | (1.08 | )% | | | (8.27 | )% |
| | | | | | | | | | | | | | | | | | | | | |
| Ratios/Supplemental Data: | | | | | | | | | | | | | | | |
| Net assets, end of year (000) | | | $27,871 | | | | $22,823 | | | | $38,772 | | | | $54,739 | | | | $50,863 | |
| Average net assets (000) | | | $27,590 | | | | $27,522 | | | | $47,560 | | | | $58,523 | | | | $48,552 | |
| Ratios to average net assets(d)(e): | | | | | | | | | | | | | | | | | | | | |
| Expenses after waivers and/or expense reimbursement, before taxes | | | 2.23 | % | | | 2.25 | % | | | 2.21 | % | | | 2.20 | % | | | 2.22 | % |
| Expenses after waivers and/or expense reimbursement, net of taxes(f) | | | 1.75 | % | | | 2.72 | % | | | 2.17 | % | | | 2.73 | % | | | 1.31 | % |
| Expenses before waivers and/or expense reimbursement, before taxes | | | 2.23 | % | | | 2.25 | % | | | 2.21 | % | | | 2.20 | % | | | 2.22 | % |
| Net investment income (loss) | | | (0.68 | )% | | | (0.38 | )% | | | (0.56 | )% | | | (0.95 | )% | | | (1.20 | )% |
| Net investment income (loss), net of taxes(g) | | | (0.68 | )% | | | (0.37 | )% | | | (0.56 | )% | | | (1.01 | )% | | | (1.37 | )% |
| Portfolio turnover rate(h) | | | 42 | % | | | 45 | % | | | 23 | % | | | 41 | % | | | 25 | % |
| (a) | Calculated based on average shares outstanding during the year. |
| (b) | The per share amount of net investment income (loss) does not directly correlate to the amounts reported in the Statement of Operations due to class specific expenses. |
| (c) | Total return does not consider the effects of sales loads. Total return is calculated assuming a purchase of a share on the first day and a sale on the last day of each year reported and includes reinvestment of dividends and distributions, if any. Total returns may reflect adjustments to conform to GAAP. |
| (d) | Does not include expenses of the underlying funds in which the Fund invests. |
| (e) | Effective December 1, 2017, class specific expenses include transfer agent fees and expenses and registration fees, which are charged to their respective share class. |
| (f) | Tax estimate for the ratio calculation is derived from the net investment income (loss), realized and unrealized gains (losses). |
| (g) | Tax estimate for the ratio calculation is derived from the net investment income (loss) only. |
| (h) | The Fund’s portfolio turnover rate is calculated in accordance with regulatory requirements, without regard to transactions involving short-term investments, certain derivatives and in-kind transactions (if any). If such transactions were included, the Fund’s portfolio turnover rate may be higher. |
See Notes to Financial Statements.
| | | | | | | | | | | | | | | | | | | | |
| Class Z Shares | |
| | | Year Ended November 30, | |
| | | 2021 | | | 2020 | | | 2019 | | | 2018 | | | 2017 | |
| Per Share Operating Performance(a): | | | | | | | | | | | | | | | | | | | | |
| Net Asset Value, Beginning of Year | | | $4.53 | | | | $5.98 | | | | $6.60 | | | | $7.03 | | | | $8.06 | |
| Income (loss) from investment operations: | | | | | | | | | | | | | | | | | | | | |
| Net investment income (loss) | | | 0.02 | | | | 0.03 | | | | 0.02 | | | | - | (b) | | | (0.03 | ) |
| Net realized and unrealized gain (loss) on investment and foreign currency transactions | | | 1.70 | | | | (1.13 | ) | | | (0.19 | ) | | | 0.02 | | | | (0.54 | ) |
| Total from investment operations | | | 1.72 | | | | (1.10 | ) | | | (0.17 | ) | | | 0.02 | | | | (0.57 | ) |
| Less Dividends and Distributions: | | | | | | | | | | | | | | | | | | | | |
| Dividends from net investment income | | | (0.11 | ) | | | - | | | | - | | | | - | | | | (0.09 | ) |
| Tax return of capital distributions | | | (0.21 | ) | | | (0.35 | ) | | | (0.45 | ) | | | (0.45 | ) | | | (0.37 | ) |
| Total dividends and distributions | | | (0.32 | ) | | | (0.35 | ) | | | (0.45 | ) | | | (0.45 | ) | | | (0.46 | ) |
| Net asset value, end of year | | | $5.93 | | | | $4.53 | | | | $5.98 | | | | $6.60 | | | | $7.03 | |
| Total Return(c): | | | 38.32 | % | | | (18.60 | )% | | | (2.89 | )% | | | (0.01 | )% | | | (7.36 | )% |
| | | | | | | | | | | | | | | | | | | | | |
| Ratios/Supplemental Data: | | | | | | | | | | | | | | | |
| Net assets, end of year (000) | | | $323,886 | | | | $252,513 | | | | $352,610 | | | | $387,972 | | | | $320,895 | |
| Average net assets (000) | | | $315,208 | | | | $267,715 | | | | $388,262 | | | | $381,251 | | | | $300,038 | |
| Ratios to average net assets(d)(e): | | | | | | | | | | | | | | | | | | | | |
| Expenses after waivers and/or expense reimbursement, before taxes | | | 1.19 | % | | | 1.20 | % | | | 1.17 | % | | | 1.17 | % | | | 1.23 | % |
| Expenses after waivers and/or expense reimbursement, net of taxes(f) | | | 0.71 | % | | | 1.67 | % | | | 1.13 | % | | | 1.73 | % | | | 0.32 | % |
| Expenses before waivers and/or expense reimbursement, before taxes | | | 1.19 | % | | | 1.20 | % | | | 1.17 | % | | | 1.17 | % | | | 1.23 | % |
| Net investment income (loss) | | | 0.34 | % | | | 0.62 | % | | | 0.37 | % | | | 0.04 | % | | | (0.19 | )% |
| Net investment income (loss), net of taxes(g) | | | 0.35 | % | | | 0.63 | % | | | 0.37 | % | | | (0.02 | )% | | | (0.36 | )% |
| Portfolio turnover rate(h) | | | 42 | % | | | 45 | % | | | 23 | % | | | 41 | % | | | 25 | % |
| (a) | Calculated based on average shares outstanding during the year. |
| (b) | Amount rounds to zero. |
| (c) | Total return is calculated assuming a purchase of a share on the first day and a sale on the last day of each year reported and includes reinvestment of dividends and distributions, if any. Total returns may reflect adjustments to conform to GAAP. |
| (d) | Does not include expenses of the underlying funds in which the Fund invests. |
| (e) | Effective December 1, 2017, class specific expenses include transfer agent fees and expenses and registration fees, which are charged to their respective share class. |
| (f) | Tax estimate for the ratio calculation is derived from the net investment income (loss), realized and unrealized gains (losses). |
| (g) | Tax estimate for the ratio calculation is derived from the net investment income (loss) only. |
| (h) | The Fund’s portfolio turnover rate is calculated in accordance with regulatory requirements, without regard to transactions involving short-term investments, certain derivatives and in-kind transactions (if any). If such transactions were included, the Fund’s portfolio turnover rate may be higher. |
See Notes to Financial Statements.
| | | | |
PGIM Jennison MLP Fund | | | 25 | |
Financial Highlights (continued)
| | | | | | | | | | | | | | | | | | | | | | | | |
| Class R6 Shares | |
| | | Year Ended November 30, | | | | | | January 26, 2018(a) through November 30, 2018 | | | | |
| | | 2021 | | | 2020 | | | 2019 | | | | | | | |
| Per Share Operating Performance(b): | | | | | | | | | | | | | | | | | | | | | | | | |
| Net Asset Value, Beginning of Period | | | $4.53 | | | | $5.98 | | | | $6.59 | | | | | | | | $7.90 | | | | | |
| Income (loss) from investment operations: | | | | | | | | | | | | | | | | | | | | | | | | |
| Net investment income (loss) | | | 0.01 | | | | 0.02 | | | | 0.07 | | | | | | | | - | (c) | | | | |
| Net realized and unrealized gain (loss) on investment and foreign currency transactions | | | 1.71 | | | | (1.12 | ) | | | (0.23 | ) | | | | | | | (0.86 | ) | | | | |
| Total from investment operations | | | 1.72 | | | | (1.10 | ) | | | (0.16 | ) | | | | | | | (0.86 | ) | | | | |
| Less Dividends and Distributions: | | | | | | | | | | | | | | | | | | | | | | | | |
| Dividends from net investment income | | | (0.11 | ) | | | - | | | | - | | | | | | | | - | | | | | |
| Tax return of capital distributions | | | (0.21 | ) | | | (0.35 | ) | | | (0.45 | ) | | | | | | | (0.45 | ) | | | | |
| Total dividends and distributions | | | (0.32 | ) | | | (0.35 | ) | | | (0.45 | ) | | | | | | | (0.45 | ) | | | | |
| Net asset value, end of period | | | $5.93 | | | | $4.53 | | | | $5.98 | | | | | | | | $6.59 | | | | | |
| Total Return(d): | | | 38.32 | % | | | (18.60 | )% | | | (2.89 | )% | | | | | | | (11.15 | )% | | | | |
| | | | | | | | | | | | | | | | | | | | | | | | | |
| Ratios/Supplemental Data: | | | | | | | | | | | | | | | | | | |
| Net assets, end of period (000) | | | $42,615 | | | | $17,116 | | | | $2,611 | | | | | | | | $10,722 | | | | | |
| Average net assets (000) | | | $35,663 | | | | $3,836 | | | | $7,303 | | | | | | | | $10,102 | | | | | |
| Ratios to average net assets(e): | | | | | | | | | | | | | | | | | | | | | | | | |
| Expenses after waivers and/or expense reimbursement, before taxes | | | 1.11 | % | | | 1.20 | % | | | 1.17 | % | | | | | | | 1.17 | %(f) | | | | |
| Expenses after waivers and/or expense reimbursement, net of taxes(g) | | | 0.63 | % | | | 1.67 | % | | | 1.13 | % | | | | | | | 0.34 | %(f) | | | | |
| Expenses before waivers and/or expense reimbursement, before taxes | | | 1.11 | % | | | 1.33 | % | | | 1.41 | % | | | | | | | 1.33 | %(f) | | | | |
| Net investment income (loss) | | | 0.21 | % | | | 0.53 | % | | | 1.06 | % | | | | | | | (0.07 | )%(f) | | | | |
| Net investment income (loss), net of taxes(h) | | | 0.22 | % | | | 0.54 | % | | | 1.06 | % | | | | | | | 0.03 | %(f) | | | | |
| Portfolio turnover rate(i) | | | 42 | % | | | 45 | % | | | 23 | % | | | | | | | 41 | % | | | | |
| (a) | Commencement of offering. |
| (b) | Calculated based on average shares outstanding during the period. |
| (c) | Amount rounds to zero. |
| (d) | Total return is calculated assuming a purchase of a share on the first day and a sale on the last day of each period reported and includes reinvestment of dividends and distributions, if any. Total returns may reflect adjustments to conform to GAAP. Total returns for periods less than one full year are not annualized. |
| (e) | Does not include expenses of the underlying funds in which the Fund invests. |
| (g) | Tax estimate for the ratio calculation is derived from the net investment income (loss), realized and unrealized gains (losses), which is not annualized. |
| (h) | Tax estimate for the ratio calculation is derived from the net investment income (loss) only, which is not annualized. |
| (i) | The Fund’s portfolio turnover rate is calculated in accordance with regulatory requirements, without regard to transactions involving short-term investments, certain derivatives and in-kind transactions (if any). If such transactions were included, the Fund’s portfolio turnover rate may be higher. |
See Notes to Financial Statements.
Notes to Financial Statements
1. Organization
Prudential Investment Portfolios 18 (the “Registered Investment Company” or “RIC”) is registered under the Investment Company Act of 1940, as amended (“1940 Act”), as an open-end management investment company. The RIC is organized as a Delaware Statutory Trust. These financial statements relate only to the PGIM Jennison MLP Fund (the “Fund”), a series of the RIC. The Fund is classified as a non-diversified fund for purposes of the 1940 Act.
The investment objective of the Fund is to seek total return.
2. Accounting Policies
The Fund follows the investment company accounting and reporting guidance of the Financial Accounting Standards Board (“FASB”) Accounting Standard Codification (“ASC”) Topic 946 Financial Services — Investment Companies. The following is a summary of significant accounting policies followed by the Fund in the preparation of its financial statements. The policies conform to U.S. generally accepted accounting principles (“GAAP”). The Fund consistently follows such policies in the preparation of its financial statements.
Securities Valuation: The Fund holds securities and other assets and liabilities that are fair valued as of the close of each day (generally, 4:00 PM Eastern time) the New York Stock Exchange (“NYSE”) is open for trading. As described in further detail below, the Fund’s investments are valued daily based on a number of factors, including the type of investment and whether market quotations are readily available. The RIC’s Board of Trustees (the “Board”) has adopted valuation procedures for security valuation under which fair valuation responsibilities have been delegated to PGIM Investments LLC (“PGIM Investments” or the “Manager”). Pursuant to the Board’s delegation, the Manager has established a Valuation Committee responsible for supervising the fair valuation of portfolio securities and other assets and liabilities. The valuation procedures permit the Fund to utilize independent pricing vendor services, quotations from market makers, and alternative valuation methods when market quotations are either not readily available or not deemed representative of fair value. Fair value is the price that would be received to sell an asset or paid to transfer a liability in an orderly transaction between market participants on the measurement date. A record of the Valuation Committee’s actions is subject to the Board’s review at its first quarterly meeting following the quarter in which such actions take place.
For the fiscal reporting year-end, securities and other assets and liabilities were fair valued at the close of the last U.S. business day. Trading in certain foreign securities may occur when the NYSE is closed (including weekends and holidays). Because such foreign securities
| | | | |
PGIM Jennison MLP Fund | | | 27 | |
Notes to Financial Statements (continued)
trade in markets that are open on weekends and U.S. holidays, the values of some of the Fund’s foreign investments may change on days when investors cannot purchase or redeem Fund shares.
Various inputs determine how the Fund’s investments are valued, all of which are categorized according to the three broad levels (Level 1, 2, or 3) detailed in the Schedule of Investments and referred to herein as the “fair value hierarchy” in accordance with FASB ASC Topic 820 - Fair Value Measurement.
Common or preferred stocks, MLPs, exchange-traded funds and derivative instruments, if applicable, that are traded on a national securities exchange are valued at the last sale price as of the close of trading on the applicable exchange where the security principally trades. Securities traded via NASDAQ are valued at the NASDAQ official closing price. To the extent these securities are valued at the last sale price or NASDAQ official closing price, they are classified as Level 1 in the fair value hierarchy. In the event that no sale or official closing price on valuation date exists, these securities are generally valued at the mean between the last reported bid and ask prices, or at the last bid price in the absence of an ask price. These securities are classified as Level 2 in the fair value hierarchy.
Foreign equities traded on foreign securities exchanges are generally valued using pricing vendor services that provide model prices derived using adjustment factors based on information such as local closing price, relevant general and sector indices, currency fluctuations, depositary receipts, and futures, as applicable. Securities valued using such model prices are classified as Level 2 in the fair value hierarchy. The models generate an evaluated adjustment factor for each security, which is applied to the local closing price to adjust it for post closing market movements up to the time the Fund is valued. Utilizing that evaluated adjustment factor, the vendor provides an evaluated price for each security. If the vendor does not provide an evaluated price, securities are valued in accordance with exchange-traded common and preferred stock valuation policies discussed above.
Investments in open-end funds (other than exchange-traded funds) are valued at their net asset values as of the close of the NYSE on the date of valuation. These securities are classified as Level 1 in the fair value hierarchy since they may be purchased or sold at their net asset values on the date of valuation.
Securities and other assets that cannot be priced according to the methods described above are valued based on pricing methodologies approved by the Board. In the event that unobservable inputs are used when determining such valuations, the securities will be classified as Level 3 in the fair value hierarchy. Altering one or more unobservable inputs may result in a significant change to a Level 3 security’s fair value measurement.
When determining the fair value of securities, some of the factors influencing the valuation include: the nature of any restrictions on disposition of the securities; assessment of the general liquidity of the securities; the issuer’s financial condition and the markets in which it does business; the cost of the investment; the size of the holding and the capitalization of the issuer; the prices of any recent transactions or bids/offers for such securities or any comparable securities; any available analyst media or other reports or information deemed reliable by the Manager regarding the issuer or the markets or industry in which it operates. Using fair value to price securities may result in a value that is different from a security’s most recent closing price and from the price used by other unaffiliated mutual funds to calculate their net asset values.
Foreign Currency Translation: The books and records of the Fund are maintained in U.S. dollars. Foreign currency amounts are translated into U.S. dollars on the following basis:
(i) market value of investment securities, other assets and liabilities — at the exchange rate as of the valuation date;
(ii) purchases and sales of investment securities, income and expenses — at the rates of exchange prevailing on the respective dates of such transactions.
Although the net assets of the Fund are presented at the foreign exchange rates and market values at the close of the period, the Fund does not generally isolate that portion of the results of operations arising as a result of changes in the foreign exchange rates from the fluctuations arising from changes in the market prices of long-term portfolio securities held at the end of the period. Similarly, the Fund does not isolate the effect of changes in foreign exchange rates from the fluctuations arising from changes in the market prices of long-term portfolio securities sold during the period. Accordingly, holding period unrealized and realized foreign currency gains (losses) are included in the reported Net change in unrealized appreciation (depreciation) on investments and Net realized gains (losses) on investment transactions on the Statements of Operations.
Net realized gains (losses) on foreign currency transactions represent net foreign exchange gains (losses) from the disposition of holdings of foreign currencies, currency gains (losses) realized between the trade and settlement dates on investment transactions, and the difference between the amounts of interest, dividends and foreign withholding taxes recorded on the Fund’s books and the U.S. dollar equivalent amounts actually received or paid. Net unrealized currency gains (losses) arise from valuing foreign currency denominated assets and liabilities (other than investments) at period end exchange rates.
Securities Transactions and Net Investment Income: Securities transactions are recorded on the trade date. Realized gains (losses) from investment and currency transactions are calculated on the specific identification method. Dividend income is recorded on the ex-date, or for certain foreign securities, when the Fund becomes aware of such dividends. Expenses are recorded on an accrual basis, which may require the use of certain estimates by management that may differ from actual. Net investment income or loss (other than class
| | | | |
PGIM Jennison MLP Fund | | | 29 | |
Notes to Financial Statements (continued)
specific expenses and waivers, which are allocated as noted below) and unrealized and realized gains (losses) are allocated daily to each class of shares based upon the relative proportion of adjusted net assets of each class at the beginning of the day. Class specific expenses and waivers, where applicable, are charged to the respective share classes. Such class specific expenses and waivers include distribution fees and distribution fee waivers, shareholder servicing fees, transfer agent’s fees and expenses, registration fees and fee waivers and/or expense reimbursements, as applicable.
Distributions from MLPs: Distributions received from the Fund’s investments in MLPs generally are comprised of income and return of capital. The Fund records investment income and return of capital based on estimates made at the time such distributions are received. Such estimates are based on historical information available from each MLP and other industry sources. These estimates may subsequently be revised based on information received from MLPs after their respective tax reporting periods have concluded. For the year ended November 30, 2021, the Fund estimates that 100% of the MLP distributions received from investments taxed as partnerships would be treated as return of capital while the nature of distributions received from MLP investments taxed as corporations will typically be considered dividend income.
Income Taxes: The Fund does not intend to qualify as a regulated investment company pursuant to Subchapter M of the Internal Revenue Code (the “Code”). This differs from most investment companies, which elect to be treated as “regulated investment companies” under the Code in order to avoid paying entity level income taxes. Under current law, the Fund is not eligible to elect treatment as a regulated investment company due to its investments primarily in MLPs invested in energy assets. As a result, the Fund is treated as a regular C-corporation for federal, state and local income tax purposes and will be required to pay federal, state and local income tax on its taxable income.
The Fund intends to invest primarily in MLPs, which generally are treated as partnerships for federal income tax purposes. As a limited partner in the MLPs, the Fund reports its allocable share of the MLP’s taxable income or loss in computing its own taxable income or loss. The Fund’s tax expense or benefit will be included in the Statement of Operations based on the component of income or gains (losses) to which such expense or benefit relates. Deferred income taxes reflect the net tax effects of temporary differences between the carrying amounts of assets and liabilities for financial reporting purposes and the amounts used for income tax purposes. Such temporary differences are principally: (i) taxes on unrealized gains (losses), which are attributable to the temporary difference between fair market value and tax basis, (ii) the net tax effects of temporary differences between the carrying amounts of assets and liabilities for financial reporting and income tax purposes and (iii) the net tax benefit of accumulated net operating losses and capital loss carryforwards.
The Fund will accrue a deferred income tax liability balance, at the effective statutory United States federal income tax rate of 21% plus an estimated state and local income tax rate for its future tax liability associated with the capital appreciation of its investments, the distributions received by the Fund on interests of MLPs considered to be return of capital, and for any net operating gains. The Fund may also record a deferred tax asset balance, which reflects an estimate of the Fund’s future tax benefit associated with net operating losses and/or unrealized losses.
To the extent the Fund has a deferred tax asset, consideration is given to whether or not a valuation allowance is required. A valuation allowance is required if based on the evaluation criterion provided by ASC 740, Income Taxes (ASC 740) it is more-likely-than-not that some portion or the entire deferred tax asset will not be realized. Among the factors considered in assessing the Fund’s valuation allowance are the nature, frequency and severity of current and cumulative losses, forecasts of future profitability, the duration of the statutory carryforward periods and the associated risks that operating and capital loss carryforwards may expire unutilized.
Unexpected significant decreases in cash distributions from the Fund’s MLP investments or significant declines in the fair value of its investments may change the Fund’s assessment regarding the recoverability of their deferred tax assets and may result in a valuation allowance. If a valuation allowance is required to reduce any deferred tax asset in the future, it could have a material impact on the Fund’s net asset value and results of operations in the period it is recorded.
The Fund may rely, to some extent, on information provided by the MLPs, which may not be available on a timely basis, to estimate taxable income allocable to MLP units held in its portfolio, and to estimate its associated deferred tax benefit/(liability). Such estimates are made in good faith. From time to time, as new information becomes available, the Fund may modify its estimates or assumptions regarding its tax benefit/(liability).
The Fund’s policy is to classify interest and penalties associated with underpayment of federal, state, and local income taxes, if any, as income tax expense on its Statement of Operations. For the year ended November 30, 2021, the Fund does not have any interest or penalties associated with the underpayment of any income taxes. The Fund anticipates filing income tax returns in the U.S. federal jurisdiction and various states. The Fund has reviewed all major jurisdictions and concluded that there is no significant impact on the Fund’s net assets and no tax liability resulting from unrecognized tax benefits or expenses relating to uncertain tax positions expected to be taken on its tax returns.
State franchise taxes are separate and distinct from state income taxes. State franchise taxes are imposed on a corporation for the right to conduct business in the state and typically are based off the net worth or capital apportioned to a state. Due to the nature of the Fund’s investments, the Fund may be required to file franchise state returns in several states.
| | | | |
PGIM Jennison MLP Fund | | | 31 | |
Notes to Financial Statements (continued)
Dividends and Distributions: The Fund expects to pay distributions from its gross income to its shareholders quarterly. The estimated tax character of the distributions will be either qualified dividend income or a return of capital. The estimated characterization of the distributions paid will be based on the operating results during the period, and their actual tax character will not be determined until after the end of the fiscal year. Due to the tax characterization of distributions made by the underlying MLP securities held by the Fund, the Fund may have a significant portion of its distributions consist of return of capital for U.S. federal income tax purposes. Dividends and distributions to shareholders are recorded on the ex-date.
Estimates: The preparation of financial statements requires management to make estimates and assumptions that affect the reported amounts and disclosures in the financial statements. Actual results could differ from those estimates.
3. Agreements
The RIC, on behalf of the Fund, has a management agreement with the Manager. Pursuant to this agreement, the Manager has responsibility for all investment advisory services and supervises the subadviser’s performance of such services.
The Manager has entered into a subadvisory agreement with Jennison Associates LLC (“Jennison” or the “subadviser”). The Manager pays for the services of Jennison.
The management fee paid to the Manager is accrued daily and payable monthly at an annual rate of 1.00% of average daily net assets up to $1 billion, 0.98% of average daily net assets from $1 billion to $3 billion, 0.96% of average daily net assets from $3 billion to $5 billion, 0.95% of average daily net assets from $5 billion to $10 billion, and 0.94% of average daily net assets over $10 billion. The effective management fee rate before any waivers and/or expense reimbursements was 1.00% for the year ended November 30, 2021.
The Manager has contractually agreed, through March 31, 2023, to limit total annual operating expenses after fee waivers and/or expense reimbursements to 1.50% of average daily net assets for Class A shares, 2.25% of average daily net assets for Class C shares, 1.25% of average daily net assets for Class Z shares and 1.20% of average daily net assets for Class R6 shares. This contractual waiver excludes interest, brokerage, taxes (such as income and foreign withholding taxes, stamp duty and deferred tax expenses), acquired fund fees and expenses, extraordinary expenses, and certain other Fund expenses such as dividend and interest expense and broker charges on short sales.
Where applicable, the Manager agrees to waive management fees or shared operating expenses on any share class to the same extent that it waives such expenses on any other share class and, in addition, total annual operating expenses for Class R6 shares will not exceed total annual operating expenses for Class Z shares. Fees and/or expenses waived and/or reimbursed by the Manager may be recouped by the Manager within the same fiscal year during which such waiver/reimbursement is made if such recoupment can be realized without exceeding the expense limit in effect at the time of the recoupment for that fiscal year.
The RIC, on behalf of the Fund, has a distribution agreement with Prudential Investment Management Services LLC (“PIMS”), which acts as the distributor of the Class A, Class C, Class Z and Class R6 shares of the Fund. The Fund compensates PIMS for distributing and servicing the Fund’s Class A and Class C shares, pursuant to the plans of distribution (the “Distribution Plans”), regardless of expenses actually incurred by PIMS.
Pursuant to the Distribution Plans, the Fund compensates PIMS for distribution related activities at an annual rate of up to 0.30%, and 1% of the average daily net assets of the Class A and Class C shares, respectively. PIMS has contractually agreed through March 31, 2023 to limit such fees to 0.25% of the average daily net assets of the Class A shares. The distribution fees are accrued daily and payable monthly. No distribution or service fees are paid to PIMS as distributor of the Class Z or Class R6 shares of the Fund.
For the year ended November 30, 2021, PIMS received $43,862 in front-end sales charges resulting from sales of Class A shares. Additionally, for the year ended November 30, 2021, PIMS received $981 in contingent deferred sales charges imposed upon redemptions by certain Class C shareholders. From these fees, PIMS paid such sales charges to broker-dealers, who in turn paid commissions to salespersons and incurred other distribution costs.
PGIM Investments, PIMS and Jennison are indirect, wholly-owned subsidiaries of Prudential Financial, Inc. (“Prudential”).
4. Other Transactions with Affiliates
Prudential Mutual Fund Services LLC (“PMFS”), an affiliate of PGIM Investments and an indirect, wholly-owned subsidiary of Prudential, serves as the Fund’s transfer agent. Transfer agent’s fees and expenses in the Statement of Operations include certain out-of-pocket expenses paid to non-affiliates, where applicable.
The Fund may invest its overnight sweep cash in the PGIM Core Ultra Short Bond Fund (the “Core Fund”), a fund of Prudential Investment Portfolios 2, registered under the 1940 Act and managed by PGIM Investments. PGIM Investments and/or its affiliates are paid fees or reimbursed for providing their services to the Core Fund. In addition to the realized and unrealized gains on investments in the Core Fund, earnings from such investments are disclosed on the Statement of Operations as “Affiliated dividend income”.
| | | | |
PGIM Jennison MLP Fund | | | 33 | |
Notes to Financial Statements (continued)
The Fund may enter into certain securities purchase or sale transactions under Board approved Rule 17a-7 procedures. Rule 17a-7 is an exemptive rule under the 1940 Act, that subject to certain conditions, permits purchase and sale transactions among affiliated investment companies, or between an investment company and a person that is affiliated solely by reason of having a common (or affiliated) investment adviser, common directors/trustees, and/or common officers. For the year ended November 30, 2021, no 17a-7 transactions were entered into by the Fund.
5. Portfolio Securities
The aggregate cost of purchases and proceeds from sales of portfolio securities (excluding short-term investments and U.S. Government securities) for the year ended November 30, 2021, were $173,074,555 and $164,069,737, respectively.
A summary of the cost of purchases and proceeds from sales of shares of an affiliated mutual fund for the year ended November 30, 2021, is presented as follows:
| | | | | | | | | | | | | | | | | | | | | | | | | | | | | | |
Value,
Beginning
of Year | | | Cost of Purchases | | | Proceeds from Sales | | | Change in
Unrealized
Gain
(Loss) | | | Realized
Gain
(Loss) | | | Value, End of Year | | | Shares, End of Year | | | Income | |
| | | | | | | | | | | | | | | | | | | | | | | | | | | | | | |
|
| | Short-Term Investments - Affiliated Mutual Fund: | |
|
| | PGIM Core Ultra Short Bond Fund (1)(wb) | |
| $ | 3,495,408 | | | $ | 138,321,966 | | | $ | 140,321,421 | | | $ | — | | | $ | — | | | $ | 1,495,953 | | | | 1,495,953 | | | $ | 7,972 | |
| | | | | | | | | | | | | | | | | | | | | | | | | | | | | | |
| (1) | The Fund did not have any capital gain distributions during the reporting period. |
| (wb) | PGIM Investments LLC, the manager of the Fund, also serves as manager of the PGIM Core Ultra Short Bond Fund. |
6. Distributions and Tax Information
Currently, the federal income tax rate for a corporation is 21%. The Fund is currently using an estimated rate of 1.85% for state and local tax, net of federal tax benefit.
The Fund’s income tax expense/(benefit) consists of the following:
| | | | | | | | | | | | | | | |
November 30, 2021 | | Current | | Deferred | | Total |
Federal | | | $ | — | | | | $ | 27,167,756 | | | | $ | 27,167,756 | |
State | | | | — | | | | | 2,237,950 | | | | | 2,237,950 | |
Valuation Allowance | | | | — | | | | | (31,349,188 | ) | | | | (31,349,188 | ) |
| | | | | | | | | | | | | | | |
| | | |
Total tax expense/(benefit) | | | $ | — | | | | $ | (1,943,482 | ) | | | $ | (1,943,482 | ) |
| | | | | | | | | | | | | | | |
The reconciliation between the federal statutory income tax rate of 21% and the effective tax rate on net investment income/loss and realized and unrealized gain/loss is as follows:
| | | | | | | | |
Description | | Amount | | | Rate | |
Application of statutory income tax rate | | $ | 25,341,097 | | | | 21.00 | % |
State income taxes, net of Federal benefit | | | 2,232,430 | | | | 1.85 | % |
Change in estimated tax rate | | | (155,222 | ) | | | (0.13 | )% |
Effect of permanent difference | | | 1,987,401 | | | | 1.65 | % |
Change in valuation allowance | | | (31,349,188 | ) | | | (25.98 | )% |
| | | | | | | | |
Total income tax expense/(benefit) | | $ | (1,943,482 | ) | | | (1.61 | )% |
| | | | | | | | |
As of November 30, 2021, components of the Fund’s deferred tax assets and liabilities are as follows:
| | | | |
Deferred tax assets: | | | | |
Net operating loss carryforward | | $ | 4,062,966 | |
Capital loss carryforward | | | 18,901,661 | |
Other adjustments | | | 7,356 | |
Valuation allowance | | | (5,411,130 | ) |
| |
Deferred tax liabilities: | | | | |
Net unrealized gain on investment securities (tax basis) | | | (13,836,739 | ) |
GAAP vs tax deferred income from MLP Investments | | | (6,415,545 | ) |
| | | | |
| |
Net deferred tax liability | | $ | (2,691,431 | ) |
| | | | |
Net operating loss carryforwards are available to offset future taxable income. The Tax Cuts and Jobs Act (TCJA) of 2017 eliminated the NOL carryback ability and replaced the 20 year carryforward period with an indefinite carryforward period for any NOLs arising in tax years beginning after December 31, 2017. The TCJA also established a limitation on the utilization of any NOLs generated in tax years beginning after December 31, 2017 to the lesser of the aggregate of available NOLs or 80% of taxable income before any NOL utilization. The 80% limitation established by the TCJA was effective for the NOLs generated in the fiscal period ending in November 30, 2019. The Coronavirus Aid, Relief, and Economic Stability Act (CARES Act) was signed into law on March 27, 2020. The CARES Act delays the application of the 80% net operating loss limitation, established under the TCJA, to tax years ending November 30, 2022 and beyond. The Fund has net operating loss carryforwards for federal income tax purposes as follows:
| | | | | | | | |
Year-Ended | | Amount | | | Expiration | |
November 30, 2016 | | $ | 2,271,854 | | | | November 30, 2036 | |
November 30, 2017 | | | 5,888,033 | | | | November 30, 2037 | |
November 30, 2018 | | | 9,542,499 | | | | November 30, 2038 | |
November 30, 2019 | | | 78,648 | | | | Indefinite | |
Net capital loss carryforwards are available to offset future capital gains. Capital loss carryforwards can be carried forward for 5 years and, accordingly, would begin to expire as
| | | | |
PGIM Jennison MLP Fund | | | 35 | |
Notes to Financial Statements (continued)
of November 30, 2021. The Fund has capital loss carryforwards for federal income tax purposes as follows:
| | | | | | | | |
Year-Ended | | Amount | | | Expiration | |
November 30, 2018 | | $ | 6,727,087 | | | | November 30, 2023 | |
November 30, 2019 | | | 15,377,804 | | | | November 30, 2024 | |
November 30, 2020 | | | 60,615,727 | | | | November 30, 2025 | |
For the year ended November 30, 2021, the tax character of dividends paid by the Fund were $7,986,627 of ordinary income and $14,860,788 of tax return of capital. For the year ended November 30, 2020, the tax character of dividends paid by the Fund was $23,903,931 of tax return of capital.
The United States federal income tax basis of the Fund’s investments and the net unrealized appreciation as of November 30, 2021 were as follows:
| | | | | | | | | | | | | | | |
| Tax Basis | | Gross
Unrealized
Appreciation | | Gross
Unrealized
Depreciation | | Net Unrealized
Appreciation |
$336,478,931 | | | $ | 99,984,201 | | | | $ | (11,353,376 | ) | | $88,630,825 | |
GAAP basis may differ from tax basis due to certain tax-related adjustments.
7. Capital and Ownership
The Fund offers Class A, Class C, Class Z and Class R6 shares. Class A shares are sold with a maximum front-end sales charge of 5.50%. Investors who purchase $1 million or more of Class A shares and sell these shares within 12 months of purchase are subject to a contingent deferred sales charge (“CDSC”) of 1%, although they are not subject to an initial sales charge. The Class A CDSC is waived for certain retirement and/or benefit plans. A special exchange privilege is also available for shareholders who qualified to purchase Class A shares at net asset value. Class C shares are sold with a CDSC of 1% on sales made within 12 months of purchase. Class C shares will automatically convert to Class A shares on a monthly basis approximately eight years (ten years prior to January 22, 2021) after purchase. Class Z and Class R6 shares are not subject to any sales or redemption charges and are available exclusively for sale to a limited group of investors.
Under certain circumstances, an exchange may be made from specified share classes of the Fund to one or more other share classes of the Fund as presented in the table of transactions in shares of beneficial interest, below.
The RIC has authorized an unlimited number of shares of beneficial interest of the Fund at $0.001 par value per share, currently divided into four classes, designated Class A, Class C, Class Z and Class R6.
As of November 30, 2021, Prudential, through its affiliated entities, including affiliated funds (if applicable), owned shares of the Fund as follows:
| | | | |
| | | Number of Shares | | Percentage of Outstanding Shares |
Class R6 | | 5,865,203 | | 81.7% |
At the reporting period end, the number of shareholders holding greater than 5% of the Fund are as follows:
| | | | | | |
| Affiliated | | Unaffiliated |
Number of
Shareholders | | Percentage of
Outstanding Shares | | Number of
Shareholders | | Percentage of
Outstanding Shares |
1 | | 5.6% | | 7 | | 80.5% |
Transactions in shares of beneficial interest were as follows:
| | | | | | | | |
Class A | | Shares | | | Amount | |
Year ended November 30, 2021: | | | | | | | | |
Shares sold | | | 1,476,911 | | | $ | 7,873,521 | |
Shares issued in reinvestment of dividends and distributions | | | 264,658 | | | | 1,472,818 | |
Shares purchased | | | (1,747,823 | ) | | | (9,312,023 | ) |
| | | | | | | | |
Net increase (decrease) in shares outstanding before conversion | | | (6,254 | ) | | | 34,316 | |
Shares issued upon conversion from other share class(es) | | | 484,492 | | | | 2,552,317 | |
Shares purchased upon conversion into other share class(es) | | | (189,803 | ) | | | (1,021,063 | ) |
| | | | | | | | |
Net increase (decrease) in shares outstanding | | | 288,435 | | | $ | 1,565,570 | |
| | | | | | | | |
Year ended November 30, 2020: | | | | | | | | |
Shares sold | | | 1,578,594 | | | $ | 8,257,028 | |
Shares issued in reinvestment of dividends and distributions | | | 399,356 | | | | 1,892,304 | |
Shares purchased | | | (4,092,207 | ) | | | (19,473,999 | ) |
| | | | | | | | |
Net increase (decrease) in shares outstanding before conversion | | | (2,114,257 | ) | | | (9,324,667 | ) |
Shares issued upon conversion from other share class(es) | | | 358,306 | | | | 1,584,658 | |
Shares purchased upon conversion into other share class(es) | | | (1,421,316 | ) | | | (8,002,993 | ) |
| | | | | | | | |
Net increase (decrease) in shares outstanding | | | (3,177,267 | ) | | $ | (15,743,002 | ) |
| | | | | | | | |
| | | | |
PGIM Jennison MLP Fund | | | 37 | |
Notes to Financial Statements (continued)
| | | | | | | | |
Class C | | Shares | | | Amount | |
Year ended November 30, 2021: | | | | | | | | |
Shares sold | | | 1,243,694 | | | $ | 6,034,204 | |
Shares issued in reinvestment of dividends and distributions | | | 325,324 | | | | 1,676,421 | |
Shares purchased | | | (1,370,226 | ) | | | (6,765,585 | ) |
| | | | | | | | |
Net increase (decrease) in shares outstanding before conversion | | | 198,792 | | | | 945,040 | |
Shares purchased upon conversion into other share class(es) | | | (488,267 | ) | | | (2,500,949 | ) |
| | | | | | | | |
Net increase (decrease) in shares outstanding | | | (289,475 | ) | | $ | (1,555,909 | ) |
| | | | | | | | |
Year ended November 30, 2020: | | | | | | | | |
Shares sold | | | 1,354,631 | | | $ | 6,559,332 | |
Shares issued in reinvestment of dividends and distributions | | | 476,239 | | | | 2,116,780 | |
Shares purchased | | | (3,000,858 | ) | | | (12,880,773 | ) |
| | | | | | | | |
Net increase (decrease) in shares outstanding before conversion | | | (1,169,988 | ) | | | (4,204,661 | ) |
Shares purchased upon conversion into other share class(es) | | | (285,930 | ) | | | (1,280,754 | ) |
| | | | | | | | |
Net increase (decrease) in shares outstanding | | | (1,455,918 | ) | | $ | (5,485,415 | ) |
| | | | | | | | |
| | |
Class Z | | | | | | |
Year ended November 30, 2021: | | | | | | | | |
Shares sold | | | 16,288,763 | | | $ | 89,307,107 | |
Shares issued in reinvestment of dividends and distributions | | | 3,067,575 | | | | 17,498,995 | |
Shares purchased | | | (19,595,080 | ) | | | (109,425,600 | ) |
| | | | | | | | |
Net increase (decrease) in shares outstanding before conversion | | | (238,742 | ) | | | (2,619,498 | ) |
Shares issued upon conversion from other share class(es) | | | 444,271 | | | | 2,477,030 | |
Shares purchased upon conversion into other share class(es) | | | (1,367,892 | ) | | | (8,088,350 | ) |
| | | | | | | | |
Net increase (decrease) in shares outstanding | | | (1,162,363 | ) | | $ | (8,230,818 | ) |
| | | | | | | | |
Year ended November 30, 2020: | | | | | | | | |
Shares sold | | | 38,631,634 | | | $ | 182,084,995 | |
Shares issued in reinvestment of dividends and distributions | | | 4,024,702 | | | | 19,360,056 | |
Shares purchased | | | (47,093,155 | ) | | | (212,867,856 | ) |
| | | | | | | | |
Net increase (decrease) in shares outstanding before conversion | | | (4,436,819 | ) | | | (11,422,805 | ) |
Shares issued upon conversion from other share class(es) | | | 1,626,425 | | | | 9,139,063 | |
Shares purchased upon conversion into other share class(es) | | | (323,467 | ) | | | (1,449,723 | ) |
| | | | | | | | |
Net increase (decrease) in shares outstanding | | | (3,133,861 | ) | | $ | (3,733,465 | ) |
| | | | | | | | |
| | | | | | | | |
Class R6 | | Shares | | | Amount | |
Year ended November 30, 2021: | | | | | | | | |
Shares sold | | | 2,853,303 | | | $ | 14,884,547 | |
Shares issued in reinvestment of dividends and distributions | | | 360,937 | | | | 2,076,483 | |
Shares purchased | | | (893,316 | ) | | | (5,338,033 | ) |
| | | | | | | | |
Net increase (decrease) in shares outstanding before conversion | | | 2,320,924 | | | | 11,622,997 | |
Shares issued upon conversion from other share class(es) | | | 1,079,406 | | | | 6,581,015 | |
| | | | | | | | |
Net increase (decrease) in shares outstanding | | | 3,400,330 | | | $ | 18,204,012 | |
| | | | | | | | |
Year ended November 30, 2020: | | | | | | | | |
Shares sold | | | 3,784,114 | | | $ | 16,406,297 | |
Shares issued in reinvestment of dividends and distributions | | | 87,769 | | | | 404,213 | |
Shares purchased | | | (528,986 | ) | | | (2,366,124 | ) |
| | | | | | | | |
Net increase (decrease) in shares outstanding before conversion | | | 3,342,897 | | | | 14,444,386 | |
Shares issued upon conversion from other share class(es) | | | 2,231 | | | | 9,749 | |
| | | | | | | | |
Net increase (decrease) in shares outstanding | | | 3,345,128 | | | $ | 14,454,135 | |
| | | | | | | | |
8. Borrowings
The RIC, on behalf of the Fund, along with other affiliated registered investment companies (the “Participating Funds”), is a party to a Syndicated Credit Agreement (“SCA”) with a group of banks. The purpose of the SCA is to provide an alternative source of temporary funding for capital share redemptions. The table below provides details of the current SCA in effect at the reporting period-end as well as the prior SCA.
| | | | |
| | | |
| | | Current SCA | | Prior SCA |
Term of Commitment | | 10/1/2021 – 9/29/2022 | | 10/2/2020 – 9/30/2021 |
| | | |
Total Commitment | | $ 1,200,000,000 | | $ 1,200,000,000 |
| | | |
Annualized Commitment Fee on the
Unused Portion of the SCA | | 0.15% | | 0.15% |
| | | |
Annualized Interest Rate on
Borrowings | | 1.20% plus the higher of (1) the
effective federal funds rate, (2) the
one-month LIBOR rate or (3) zero
percent | | 1.30% plus the higher of (1) the effective federal funds rate, (2) the one-month LIBOR rate or (3) zero percent |
Certain affiliated registered investment companies that are parties to the SCA include portfolios that are subject to a predetermined mathematical formula used to manage certain benefit guarantees offered under variable annuity contracts. The formula may result in large scale asset flows into and out of these portfolios. Consequently, these portfolios may be more likely to utilize the SCA for purposes of funding redemptions. It may be possible for those portfolios to fully exhaust the committed amount of the SCA, thereby requiring the Manager to allocate available funding per a Board-approved methodology designed to treat the Participating Funds in the SCA equitably.
The Fund utilized the SCA during the year ended November 30, 2021. The average daily balance for the 12 days that the Fund had loans outstanding during the period was approximately $1,388,583, borrowed at a weighted average interest rate of 1.39%. The maximum loan outstanding amount during the period was $2,407,000. At November 30, 2021, the Fund did not have an outstanding loan amount.
| | | | |
PGIM Jennison MLP Fund | | | 39 | |
Notes to Financial Statements (continued)
| 9. | Risks of Investing in the Fund |
The Fund’s risks include, but are not limited to, some or all of the risks discussed below. For further information on the Fund’s risks, please refer to the Fund’s Prospectus and Statement of Additional Information.
Economic and Market Events Risk: Events in the U.S. and global financial markets, including actions taken by the U.S. Federal Reserve or foreign central banks to stimulate or stabilize economic growth or the functioning of the securities markets, may at times result in unusually high market volatility, which could negatively impact performance. Relatively reduced liquidity in credit and fixed income markets could adversely affect issuers worldwide.
Energy Sector Risk: The Fund concentrates its investments in the energy sector, and will therefore be susceptible to adverse economic, environmental, business, regulatory or other occurrences affecting that sector. The energy sector has historically experienced substantial price volatility. Energy companies may have relatively high levels of debt and may be more likely than other companies to restructure their businesses if there are downturns in energy markets or in the global economy. A downturn in the energy sector could have a larger impact on the Fund than on funds that are broadly diversified across many sectors and industries. At times, the performance of securities of companies in the energy sector may lag behind the performance of other sectors or industries or the broader market as a whole. MLPs and other companies operating in the energy sector are subject to specific risks, including, among others, fluctuations in commodity prices which may result from changes in general economic conditions or political circumstances (especially of key energy producing and consuming countries), market conditions, weather patterns, domestic production levels, volume of imports, energy conservation, domestic and foreign governmental regulation, international politics, policies of the Organization of Petroleum Exporting Countries (OPEC), taxation, tariffs, and the availability and costs of local, intrastate and interstate transportation methods; reduced consumer demand for commodities such as oil, natural gas or petroleum products; reduced availability of natural gas or other commodities for transporting, processing, storing or delivering; slowdowns in new construction; extreme weather or other natural disasters; and threats of attack by terrorists on energy assets. The energy sector is highly regulated. Changes in the regulatory environment for energy companies may adversely impact their profitability. There is an inherent risk that MLPs and other companies operating in the energy sector may incur environmental costs and liabilities due to the nature of their businesses and the substances they handle. Hydraulic fracturing, or “fracking,” is a relatively new technique for releasing and extracting natural gas trapped in underground shale formations. The fracking sector is facing allegations from environmentalists and some landowners that the technique may cause serious difficulties, which has led to uncertainty about the nature, extent, and cost of the environmental regulation to which it may ultimately be subject.
Equity and Equity-Related Securities Risk: Equity and equity-related securities may be subject to changes in value, and their values may be more volatile than those of other asset classes. In addition to an individual security losing value, the value of the equity markets or a sector in which the Fund invests could go down. Different parts of a market can react differently to adverse issuer, market, regulatory, political and economic developments.
Foreign Securities Risk: Investments in securities of non-U.S. issuers (including those denominated in U.S. dollars) may involve more risk than investing in securities of U.S. issuers. Foreign political, economic and legal systems, especially those in developing and emerging market countries, may be less stable and more volatile than in the United States. Foreign legal systems generally have fewer regulatory requirements than the U.S. legal system, particularly those of emerging markets. In general, less information is publicly available with respect to non-U.S. companies than U.S. companies. Non-U.S. companies generally are not subject to the same accounting, auditing, and financial reporting standards as are U.S. companies. Additionally, the changing value of foreign currencies and changes in exchange rates could also affect the value of the assets the Fund holds and the Fund’s performance. Certain foreign countries may impose restrictions on the ability of issuers of foreign securities to make payment of principal and interest or dividends to investors located outside the country, due to blockage of foreign currency exchanges or otherwise. Investments in emerging markets are subject to greater volatility and price declines.
In addition, the Fund’s investments in non-U.S. securities may be subject to the risks of nationalization or expropriation of assets, imposition of currency exchange controls or restrictions on the repatriation of non-U.S. currency, confiscatory taxation and adverse diplomatic developments. Special U.S. tax considerations may apply.
Increase in Expenses Risk: Your actual cost of investing in the Fund may be higher than the expenses shown in the expense table in the Fund’s prospectus for a variety of reasons. For example, expense ratios may be higher than those shown if average net assets decrease. Net assets are more likely to decrease and Fund expense ratios are more likely to increase when markets are volatile. Active and frequent trading of Fund securities can increase expenses.
Large Shareholder and Large Scale Redemption Risk: Certain individuals, accounts, funds (including funds affiliated with the Manager) or institutions, including the Manager and its affiliates, may from time to time own or control a substantial amount of the Fund’s shares. There is no requirement that these entities maintain their investment in the Fund. There is a risk that such large shareholders or that the Fund’s shareholders generally may redeem all or a substantial portion of their investments in the Fund in a short period of time, which could have a significant negative impact on the Fund’s NAV, liquidity, and brokerage costs. Large redemptions could also result in tax consequences to shareholders and impact the Fund’s ability to implement its investment strategy. The Fund’s ability to pursue its investment objective after one or more large scale redemptions may be impaired and, as a result, the Fund may invest a larger portion of its assets in cash or cash equivalents.
| | | | |
PGIM Jennison MLP Fund | | | 41 | |
Notes to Financial Statements (continued)
Liquidity Risk: Liquidity risk is the risk that the Fund could not meet requests to redeem shares issued by the Fund without significant dilution of remaining investors’ interests in the Fund. The Fund may invest in instruments that trade in lower volumes and are more illiquid than other investments. If the Fund is forced to sell these investments to pay redemption proceeds or for other reasons, the Fund may lose money. In addition, when there is no willing buyer and investments cannot be readily sold at the desired time or price, the Fund may have to accept a lower price or may not be able to sell the instrument at all. An inability to sell a portfolio position can adversely affect the Fund’s value or prevent the Fund from being able to take advantage of other investment opportunities.
Management Risk: The value of your investment may decrease if judgments by the subadviser about the attractiveness, value or market trends affecting a particular security, industry or sector or about market movements are incorrect.
Market Disruption and Geopolitical Risks: International wars or conflicts and geopolitical developments in foreign countries, along with instability in regions such as Asia, Eastern Europe, and the Middle East, possible terrorist attacks in the United States or around the world, public health epidemics such as the outbreak of infectious diseases like the outbreak of COVID-19 globally in 2020 or the 2014–2016 outbreak in West Africa of the Ebola virus, and other similar events could adversely affect the U.S. and foreign financial markets, including increases in market volatility, reduced liquidity in the securities markets and government intervention, and may cause further long-term economic uncertainties in the United States and worldwide generally. The coronavirus pandemic and the related governmental and public responses have had and may continue to have an impact on the Fund’s investments and net asset value and have led and may continue to lead to increased market volatility and the potential for illiquidity in certain classes of securities and sectors of the market. Preventative or protective actions that governments may take in respect of pandemic or epidemic diseases may result in periods of business disruption, business closures, inability to obtain raw materials, supplies and component parts, and reduced or disrupted operations for the issuers in which the Fund invests. Government intervention in markets may impact interest rates, market volatility and security pricing. The occurrence, reoccurrence and pendency of such diseases could adversely affect the economies (including through changes in business activity and increased unemployment) and financial markets either in specific countries or worldwide.
Market Risk: Securities markets may be volatile and the market prices of the Fund’s securities may decline. Securities fluctuate in price based on changes in an issuer’s financial condition and overall market and economic conditions. If the market prices of the securities owned by the Fund fall, the value of your investment in the Fund will decline.
Master Limited Partnerships Risk: The risks of investing in an MLP are generally those involved in investing in a partnership as opposed to a corporation. For example, state law governing partnerships is often less restrictive than state law governing corporations. Accordingly, there may be fewer protections afforded investors in an MLP than investors in a corporation. Investments held by MLPs may be relatively illiquid, limiting the MLPs’ ability to vary their portfolios promptly in response to changes in economic or other conditions. MLPs may have limited financial resources, their securities may trade infrequently and in limited volume, and they may be subject to more abrupt or erratic price movements than securities of larger or more broadly-based companies. The Fund’s investment in MLPs also subjects the Fund to the risks associated with the specific industry or industries in which the MLPs invest, risks related to limited control and limited rights to vote on matters affecting the MLP, risks related to potential conflicts of interest between the MLP and the MLP’s general partner, cash flow risks, dilution risks and risks related to the general partner’s right to require unit-holders to sell their common units at an undesirable time or price. MLPs are generally considered interest-rate sensitive investments. During periods of interest rate volatility, these investments may not provide attractive returns. Since MLPs generally conduct business in multiple states, the Fund may be subject to income or franchise tax in each of the states in which the partnership does business. The additional cost of preparing and filing the tax returns and paying the related taxes may adversely impact the Fund’s return on its investment in MLPs.
Non-Diversified Investment Company Risk: The Fund is non-diversified for purposes of the 1940 Act. This means that the Fund may invest a greater percentage of its assets in the securities of a single company or other issuer than a diversified fund. Investing in a non-diversified fund involves greater risk than investing in a diversified fund because a loss resulting from the decline in value of any one security may represent a greater portion of the total assets of a non-diversified fund.
Small and Medium Sized Companies Risk: Small and medium sized companies usually offer a smaller range of products and services than larger companies. Smaller companies may also have limited financial resources and may lack management depth. As a result, their prices may fluctuate more than the stocks of larger, more established companies.
Historically, small and medium sized companies have sometimes gone through extended periods when they did not perform as well as larger companies. Small and medium sized companies generally are more illiquid than larger companies, which may make such investments more difficult to sell at the time and price that the Fund would like.
Tax Risk: The Fund’s investment policies involve complicated and in some cases unsettled accounting, tax and valuation issues that may result in unexpected and potentially significant consequences for the Fund and its shareholders. Tax risks associated with investments in the Fund include but are not limited to the following:
MLP Tax Risk: A change in current tax law or a change in the underlying business mix of a given MLP could result in the MLP being treated as a corporation rather than a partnership for U.S. federal income tax purposes, which would result in the MLP being required to pay
| | | | |
PGIM Jennison MLP Fund | | | 43 | |
Notes to Financial Statements (continued)
U.S. federal income tax (as well as state and local income taxes) on its taxable income. This would have the effect of reducing the amount of cash available for distribution by the MLP and could result in a reduction in the value of the Fund’s investment in the MLP and lower income to the Fund.
Fund Structure Risk: Unlike traditional mutual funds that are structured as regulated investment companies for U.S. federal income tax purposes, the Fund will be taxable as a regular corporation, or “C” corporation, for U.S. federal income tax purposes. This means the Fund generally will be subject to U.S. federal income tax on its taxable income at the rates applicable to corporations (currently a flat rate of 21%), and will also be subject to state and local income taxes. The 20% deduction for “qualified business income” and certain other items of income will not be available to Fund shareholders, but might be available to an individual investing directly in an MLP.
Tax Estimation/NAV Risk: In calculating the Fund’s daily net asset value (NAV), the Fund will, among other things, account for its current taxes and deferred tax liability and/or asset balances. Any deferred tax liability balance will reduce the Fund’s NAV, and any deferred tax asset balance (reduced by any valuation allowance) will increase the Fund’s NAV. To estimate these amounts, the Fund will rely to some extent on information provided by MLPs, which may not be provided on a timely basis. The daily estimate of these amounts could vary dramatically from the Fund’s actual tax liability or benefit, and, as a result, the determination of the Fund’s actual tax liability or benefit may have a material impact on the Fund’s NAV. From time to time, the Fund may modify its estimates or assumptions regarding its current taxes and deferred tax liability and/or asset balances as new information becomes available, which modifications in estimates or assumptions may have a material impact on the Fund’s NAV.
Distribution Risk: Due to the tax characterization of distributions made by MLPs, the Fund expects that a significant portion of its distributions will consist of return of capital for U.S. federal tax purposes. Additionally, to the extent that the Fund’s distributions to shareholders approximately equal the distribution rate that the Fund receives from the Fund’s MLP investments and the other securities in which the Fund invests, including any income (without any deduction for Fund expenses), a larger portion of the Fund’s distribution to shareholders will consist of return of capital for U.S. federal tax purposes than the distributions the Fund receives from the MLPs. Generally, a fund distribution will constitute return of capital, rather than a qualified or other taxable dividend, to the extent that it exceeds the Fund’s current and accumulated earnings and profits. Return of capital reduces a shareholder’s adjusted cost basis in the Fund’s shares, impacting the amount of any capital gains or loss realized by the shareholder upon selling the Fund’s shares. Once a shareholder’s adjusted cost basis has been reduced to zero (due to return of capital), any further distributions will be treated as capital gains.
10. Recent Regulatory Developments
On December 3, 2020, the SEC announced that it voted to adopt a new rule that establishes an updated regulatory framework for fund valuation practices (the “Rule”). The Rule, in part, provides (i) a framework for determining fair value in good faith and (ii) provides for a fund Board’s assignment of its responsibility for the execution of valuation-related activities to a fund’s investment adviser. Further, the SEC is rescinding previously issued guidance on related issues. The Rule took effect on March 8, 2021, with a compliance date of September 8, 2022. Management is currently evaluating the Rule and its impact to the Fund.
| | | | |
PGIM Jennison MLP Fund | | | 45 | |
Report of Independent Registered Public Accounting Firm
To the Board of Trustees of Prudential Investment Portfolios 18 and Shareholders of PGIM Jennison MLP Fund
Opinion on the Financial Statements
We have audited the accompanying statement of assets and liabilities, including the schedule of investments, of PGIM Jennison MLP Fund (one of the funds constituting Prudential Investment Portfolios 18, referred to hereafter as the “Fund”) as of November 30, 2021, the related statement of operations for the year ended November 30, 2021, the statement of changes in net assets for each of the two years in the period ended November 30, 2021, including the related notes, and the financial highlights for each of the two years in the period ended November 30, 2021 (collectively referred to as the “financial statements”). In our opinion, the financial statements present fairly, in all material respects, the financial position of the Fund as of November 30, 2021, the results of its operations for the year then ended, the changes in its net assets and the financial highlights for each of the two years in the period ended November 30, 2021 in conformity with accounting principles generally accepted in the United States of America.
The financial statements of the Fund as of and for the year ended November 30, 2019 and the financial highlights for each of the periods ended on or prior to November 30, 2019 (not presented herein, other than the financial highlights) were audited by other auditors whose report dated January 15, 2020 expressed an unqualified opinion on those financial statements and financial highlights.
Basis for Opinion
These financial statements are the responsibility of the Fund’s management. Our responsibility is to express an opinion on the Fund’s financial statements based on our audits. We are a public accounting firm registered with the Public Company Accounting Oversight Board (United States) (PCAOB) and are required to be independent with respect to the Fund in accordance with the U.S. federal securities laws and the applicable rules and regulations of the Securities and Exchange Commission and the PCAOB.
We conducted our audits of these financial statements in accordance with the standards of the PCAOB. Those standards require that we plan and perform the audit to obtain reasonable assurance about whether the financial statements are free of material misstatement, whether due to error or fraud.
Our audits included performing procedures to assess the risks of material misstatement of the financial statements, whether due to error or fraud, and performing procedures that respond to those risks. Such procedures included examining, on a test basis, evidence regarding the amounts and disclosures in the financial statements. Our audits also included evaluating the accounting principles used and significant estimates made by management, as well as evaluating the overall presentation of the financial statements. Our procedures included confirmation of securities owned as of November 30, 2021 by correspondence with the custodian and transfer agent. We believe that our audits provide a reasonable basis for our opinion.
/s/ PricewaterhouseCoopers LLP
New York, New York
January 14, 2022
We have served as the auditor of one or more investment companies in the PGIM Retail Funds complex since 2020.
INFORMATION ABOUT BOARD MEMBERS AND OFFICERS (unaudited)
Information about Board Members and Officers of the Fund is set forth below. Board Members who are not deemed to be “interested persons” of the Fund, as defined in the 1940 Act, are referred to as “Independent Board Members.” Board Members who are deemed to be “interested persons” of the Fund are referred to as “Interested Board Members.” The Board Members are responsible for the overall supervision of the operations of the Fund and perform the various duties imposed on the directors of investment companies by the 1940 Act. The Board in turn elects the Officers, who are responsible for administering the day-to-day operations of the Fund.
| | | | | | |
| Independent Board Members | | | | |
| | | | |
Name
Year of Birth
Position(s)
Portfolios Overseen | | Principal Occupation(s)
During Past Five Years | | Other Directorships
Held During
Past Five Years | | Length of
Board Service |
| | | | |
Ellen S. Alberding
1958
Board Member
Portfolios Overseen: 95 | | President and Board Member, The Joyce Foundation (charitable foundation) (since 2002); formerly Vice Chair, City Colleges of Chicago (community college system) (2011-2015); Trustee, National Park Foundation (charitable foundation for national park system) (2009-2018); Trustee, Economic Club of Chicago (2009-2016); Trustee, Loyola University (since 2018). | | None. | | Since September 2013 |
| | | | |
Kevin J. Bannon
1952
Board Member
Portfolios Overseen: 95 | | Retired; formerly Managing Director (April 2008-May 2015) and Chief Investment Officer (October 2008-November 2013) of Highmount Capital LLC (registered investment adviser); formerly Executive Vice President and Chief Investment Officer (April 1993-August 2007) of Bank of New York Company; President (May 2003-May 2007) of BNY Hamilton Family of Mutual Funds. | | Director of Urstadt Biddle Properties (equity real estate investment trust) (since September 2008). | | Since July 2008 |
PGIM Jennison MLP Fund
| | | | | | |
| Independent Board Members | | | | |
| | | | |
Name
Year of Birth
Position(s)
Portfolios Overseen | | Principal Occupation(s)
During Past Five Years | | Other Directorships
Held During
Past Five Years | | Length of
Board Service |
| | | | |
Linda W. Bynoe
1952
Board Member
Portfolios Overseen: 92 | | President and Chief Executive Officer (since March 1995) and formerly Chief Operating Officer (December 1989-February 1995) of Telemat Limited LLC (formerly Telemat Ltd) (management consulting); formerly Vice President (January 1985-June 1989) at Morgan Stanley & Co. (broker-dealer). | | Trustee of Equity Residential (residential real estate) (since December 2009); Director of Northern Trust Corporation (financial services) (since April 2006); formerly Director of Anixter International, Inc. (communication products distributor) (January 2006-June 2020). | | Since March 2005 |
| | | | |
Barry H. Evans
1960
Board Member
Portfolios Overseen: 94 | | Retired; formerly President (2005-2016), Global Chief Operating Officer (2014-2016), Chief Investment Officer - Global Head of Fixed Income (1998-2014), and various portfolio manager roles (1986-2006), Manulife Asset Management (asset management). | | Formerly Director, Manulife Trust Company (2011-2018); formerly Director, Manulife Asset Management Limited (2015-2017); formerly Chairman of the Board of Directors of Manulife Asset Management U.S. (2005-2016); formerly Chairman of the Board, Declaration Investment Management and Research (2008-2016). | | Since September 2017 |
| | | | |
Keith F. Hartstein
1956
Board Member & Independent Chair Portfolios Overseen: 95 | | Retired; Executive Committee of the Independent Directors Council (IDC) Board of Governors (since October 2019); Member (since November 2014) of the Governing Council of the IDC (organization of independent mutual fund directors); formerly President and Chief Executive Officer (2005-2012), Senior Vice President (2004-2005), Senior Vice President of Sales and Marketing (1997-2004), and various executive management positions (1990-1997), John Hancock Funds, LLC (asset management); Chairman, Investment Company Institute’s Sales Force Marketing Committee (2003-2008). | | None. | | Since September 2013 |
Visit our website at pgim.com/investments
| | | | | | |
| Independent Board Members | | | | |
| | | | |
Name
Year of Birth
Position(s)
Portfolios Overseen | | Principal Occupation(s)
During Past Five Years | | Other Directorships
Held During
Past Five Years | | Length of
Board Service |
| | | | |
Laurie Simon Hodrick
1962
Board Member
Portfolios Overseen: 91 | | A. Barton Hepburn Professor Emerita of Economics in the Faculty of Business, Columbia Business School (since 2018); Visiting Fellow at the Hoover Institution, Stanford University (since 2015); Sole Member, ReidCourt LLC (since 2008) (a consulting firm); formerly Visiting Professor of Law, Stanford Law School (2015-2021); formerly A. Barton Hepburn Professor of Economics in the Faculty of Business, Columbia Business School (1996-2017); formerly Managing Director, Global Head of Alternative Investment Strategies, Deutsche Bank (2006-2008). | | Independent Director, Roku (since December 2020) (communication services); formerly Independent Director, Synnex Corporation (2019-2021) (information technology); formerly Independent Director, Kabbage, Inc. (2018-2020) (financial services); formerly Independent Director, Corporate Capital Trust (2017-2018) (a business development company). | | Since September 2017 |
| | | | |
Brian K. Reid
1961
Board Member
Portfolios Overseen: 94 | | Retired; formerly Chief Economist for the Investment Company Institute (ICI) (2005-2017); formerly Senior Economist and Director of Industry and Financial Analysis at the ICI (1998-2004); formerly Senior Economist, Industry and Financial Analysis at the ICI (1996-1998); formerly Staff Economist at the Federal Reserve Board (1989-1996); Director, ICI Mutual Insurance Company (2012-2017). | | None. | | Since March 2018 |
PGIM Jennison MLP Fund
| | | | | | |
| Independent Board Members | | | | |
| | | | |
Name
Year of Birth
Position(s)
Portfolios Overseen | | Principal Occupation(s)
During Past Five Years | | Other Directorships
Held During
Past Five Years | | Length of
Board Service |
| | | | |
Grace C. Torres
1959
Board Member
Portfolios Overseen: 94 | | Retired; formerly Treasurer and Principal Financial and Accounting Officer of the PGIM Funds, Target Funds, Advanced Series Trust, Prudential Variable Contract Accounts and The Prudential Series Fund (1998-June 2014); Assistant Treasurer (March 1999-June 2014) and Senior Vice President (September 1999-June 2014) of PGIM Investments LLC; Assistant Treasurer (May 2003-June 2014) and Vice President (June 2005-June 2014) of AST Investment Services, Inc.; Senior Vice President and Assistant Treasurer (May 2003-June 2014) of Prudential Annuities Advisory Services, Inc. | | Director (since January 2018) of OceanFirst Financial Corp. and OceanFirst Bank; formerly Director (July 2015-January 2018) of Sun Bancorp, Inc. N.A. and Sun National Bank. | | Since November 2014 |
| | | | | | |
| Interested Board Members | | | | |
| | | | |
Name
Year of Birth
Position(s)
Portfolios Overseen | | Principal Occupation(s)
During Past Five Years | | Other Directorships
Held During
Past Five Years | | Length of
Board Service |
| | | | |
Stuart S. Parker
1962
Board Member & President
Portfolios Overseen: 94 | | President, Chief Executive Officer, Chief Operating Officer and Officer in Charge of PGIM Investments LLC (formerly known as Prudential Investments LLC) (since January 2012); formerly Executive Vice President of Jennison Associates LLC and Head of Retail Distribution of PGIM Investments LLC (June 2005-December 2011); Investment Company Institute - Board of Governors (since May 2012). | | None. | | Since January 2012 |
Visit our website at pgim.com/investments
| | | | | | |
| Interested Board Members | | | | |
| | | | |
Name
Year of Birth
Position(s)
Portfolios Overseen | | Principal Occupation(s)
During Past Five Years | | Other Directorships
Held During
Past Five Years | | Length of
Board Service |
| | | | |
Scott E. Benjamin
1973
Board Member & Vice President
Portfolios Overseen: 95 | | Executive Vice President (since May 2009) of PGIM Investments LLC; Vice President (since June 2012) of Prudential Investment Management Services LLC; Executive Vice President (since September 2009) of AST Investment Services, Inc.; Senior Vice President of Product Development and Marketing, PGIM Investments (since February 2006); formerly Vice President of Product Development and Product Management, PGIM Investments LLC (2003-2006). | | None. | | Since March 2010 |
| (1) | The year that each Board Member joined the Board is as follows: |
Ellen S. Alberding, 2013; Kevin J. Bannon, 2008; Linda W. Bynoe, 2005; Barry H. Evans, 2017; Keith F. Hartstein, 2013; Laurie Simon Hodrick, 2017; Michael S. Hyland, 2008; Richard A. Redeker, 1993; Stephen G. Stoneburn, 2003; Stuart S. Parker, Board Member since 2012 and President since 2012; Scott E. Benjamin, Board Member since 2010 and Vice President since 2009; Grace C. Torres, 2014.
| | | | |
| Fund Officers(a) | | | | |
| | | |
Name
Year of Birth
Fund Position | | Principal Occupation(s) During Past Five Years | | Length of
Service as Fund
Officer |
| | | |
Claudia DiGiacomo
1974
Chief Legal Officer | | Chief Legal Officer, Executive Vice President and Secretary of PGIM Investments LLC (since August 2020); Chief Legal Officer of Prudential Mutual Fund Services LLC (since August 2020); Chief Legal Officer of PIFM Holdco, LLC (since August 2020); Vice President and Corporate Counsel (since January 2005) of Prudential; and Corporate Counsel of AST Investment Services, Inc. (since August 2020); formerly Vice President and Assistant Secretary of PGIM Investments LLC (2005-2020); formerly Associate at Sidley Austin Brown & Wood LLP (1999-2004). | | Since December 2005 |
PGIM Jennison MLP Fund
| | | | |
| Fund Officers(a) | | | | |
| | | |
Name
Year of Birth
Fund Position | | Principal Occupation(s) During Past Five Years | | Length of Service as Fund Officer |
| | | |
Dino Capasso
1974
Chief Compliance Officer | | Chief Compliance Officer (since July 2019) of PGIM Investments LLC; Chief Compliance Officer (since July 2019) of the PGIM Funds, Target Funds, Advanced Series Trust, The Prudential Series Fund, Prudential’s Gibraltar Fund, Inc., PGIM Global High Yield Fund, Inc., PGIM High Yield Bond Fund, Inc., and PGIM Short Duration High Yield Opportunities Fund; Vice President and Deputy Chief Compliance Officer (June 2017-2019) of PGIM Investments LLC; formerly Senior Vice President and Senior Counsel (January 2016-June 2017), and Vice President and Counsel (February 2012-December 2015) of Pacific Investment Management Company LLC. | | Since March 2018 |
| | | |
Andrew R. French
1962
Secretary | | Vice President (since December 2018) of PGIM Investments LLC; formerly Vice President and Corporate Counsel (2010-2018) of Prudential; formerly Director and Corporate Counsel (2006-2010) of Prudential; Vice President and Assistant Secretary (since January 2007) of PGIM Investments LLC; Vice President and Assistant Secretary (since January 2007) of Prudential Mutual Fund Services LLC. | | Since October 2006 |
| | | |
Diana N. Huffman
1982
Assistant Secretary | | Vice President and Corporate Counsel (since September 2015) of Prudential; Vice President and Assistant Secretary (since August 2020) of PGIM Investments LLC; formerly Associate at Willkie Farr & Gallagher LLP (2009-2015). | | Since March 2019 |
| | | |
Melissa Gonzalez
1980
Assistant Secretary | | Vice President and Corporate Counsel (since September 2018) of Prudential; Vice President and Assistant Secretary (since August 2020) of PGIM Investments LLC; formerly Director and Corporate Counsel (March 2014-September 2018) of Prudential. | | Since March 2020 |
| | | |
Patrick E. McGuinness
1986
Assistant Secretary | | Vice President and Assistant Secretary (since August 2020) of PGIM Investments LLC; Director and Corporate Counsel (since February 2017) of Prudential; and Corporate Counsel (2012-2017) of IIL, Inc. | | Since June 2020 |
| | | |
Debra Rubano
1975
Assistant Secretary | | Vice President and Corporate Counsel (since November 2020) of Prudential; formerly Director and Senior Counsel of Allianz Global Investors U.S. Holdings LLC (2010-2020) and Assistant Secretary of numerous funds in the Allianz fund complex (2015-2020). | | Since December 2020 |
| | | |
Kelly A. Coyne
1968
Assistant Secretary | | Director, Investment Operations of Prudential Mutual Fund Services LLC (since 2010). | | Since March 2015 |
Visit our website at pgim.com/investments
| | | | |
| Fund Officers(a) | | | | |
| | | |
Name
Year of Birth
Fund Position | | Principal Occupation(s) During Past Five Years | | Length of Service as Fund Officer |
| | | |
Christian J. Kelly
1975
Treasurer and Principal Financial
and Accounting Officer | | Vice President, Head of Fund Administration of PGIM Investments LLC (since November 2018); formerly Director of Fund Administration of Lord Abbett & Co. LLC (2009-2018), Treasurer and Principal Accounting Officer of the Lord Abbett Family of Funds (2017-2018); Director of Accounting, Avenue Capital Group (2008-2009); Senior Manager, Investment Management Practice of Deloitte & Touche LLP (1998-2007). | | Since January 2019 |
| | | |
Lana Lomuti
1967
Assistant Treasurer | | Vice President (since 2007) and Director (2005-2007), within PGIM Investments Fund Administration; formerly Assistant Treasurer (December 2007-February 2014) of The Greater China Fund, Inc. | | Since April 2014 |
| | | |
Russ Shupak
1973
Assistant Treasurer | | Vice President (since 2017) and Director (2013-2017), within PGIM Investments Fund Administration. | | Since October 2019 |
| | | |
Deborah Conway
1969
Assistant Treasurer | | Vice President (since 2017) and Director (2007-2017), within PGIM Investments Fund Administration. | | Since October 2019 |
| | | |
Elyse M. McLaughlin
1974
Assistant Treasurer | | Vice President (since 2017) and Director (2011-2017), within PGIM Investments Fund Administration. | | Since October 2019 |
| | | |
Jonathan Corbett
1983
Anti-Money Laundering Compliance Officer | | Vice President, Corporate Compliance, Global Compliance Programs and Compliance Risk Management (since August 2019) of Prudential; formerly Vice President and Head of Key Risk Areas Compliance (March 2016 to July 2019), Chief Privacy Officer (March 2016 to July 2019) and Head of Global Financial Crimes Unit (April 2014 to March 2016) at MetLife. | | Since October 2021 |
| (a) | Excludes Mr. Parker and Mr. Benjamin, interested Board Members who also serve as President and Vice President, respectively. |
Explanatory Notes to Tables:
| ∎ | | Board Members are deemed to be “Interested,” as defined in the 1940 Act, by reason of their affiliation with PGIM Investments LLC and/or an affiliate of PGIM Investments LLC. |
| ∎ | | Unless otherwise noted, the address of all Board Members and Officers is c/o PGIM Investments LLC, 655 Broad Street, Newark, New Jersey 07102-4410. |
| ∎ | | There is no set term of office for Board Members or Officers. The Board Members have adopted a retirement policy, which calls for the retirement of Board Members on December 31 of the year in which they reach the age of 75. |
| ∎ | | “Other Directorships Held” includes all directorships of companies required to register or file reports with the SEC under the 1934 Act (that is, “public companies”) or other investment companies registered under the 1940 Act. |
| ∎ | | “Portfolios Overseen” includes all investment companies managed by PGIM Investments LLC. The investment companies for which PGIM Investments LLC serves as manager include the PGIM Funds, Target Funds, The Prudential Variable Contract Accounts, PGIM ETF Trust, PGIM High Yield Bond Fund, Inc., PGIM Global High Yield Fund, Inc., PGIM Short Duration High Yield Opportunities Fund, The Prudential Series Fund, Prudential’s Gibraltar Fund, Inc. and the Advanced Series Trust. |
| ∎ | | As used in the Fund Officers table “Prudential” means The Prudential Insurance Company of America. |
PGIM Jennison MLP Fund
Approval of Advisory Agreements (unaudited)
The Fund’s Board of Trustees
The Board of Trustees (the “Board”) of PGIM Jennison MLP Fund (the “Fund”)1 consists of ten individuals, eight of whom are not “interested persons” of the Fund, as defined in the Investment Company Act of 1940, as amended (the “1940 Act”) (the “Independent Trustees”). The Board is responsible for the oversight of the Fund and its operations, and performs the various duties imposed on the directors of investment companies by the 1940 Act. The Independent Trustees have retained independent legal counsel to assist them in connection with their duties. The Chair of the Board is an Independent Trustee. The Board has established four standing committees: the Audit Committee, the Nominating and Governance Committee, and two Investment Committees. Each committee is chaired by, and composed of, Independent Trustees.
Annual Approval of the Fund’s Advisory Agreements
As required under the 1940 Act, the Board determines annually whether to renew the Fund’s management agreement with PGIM Investments LLC (“PGIM Investments”) and the Fund’s subadvisory agreement with Jennison Associates LLC (“Jennison”). In considering the renewal of the agreements, the Board, including all of the Independent Trustees, met on June 7-10, 2021 and approved the renewal of the agreements through July 31, 2022, after concluding that the renewal of the agreements was in the best interests of the Fund and its shareholders.
In advance of the meetings, the Board requested and received materials relating to the agreements, and had the opportunity to ask questions and request further information in connection with its consideration. Among other things, the Board considered comparative fee information from PGIM Investments and Jennison. Also, the Board considered comparisons with other mutual funds in relevant Peer Universes and Peer Groups, as is further discussed below.
In approving the agreements, the Board, including the Independent Trustees advised by independent legal counsel, considered the factors it deemed relevant, including the nature, quality and extent of services provided by PGIM Investments and the subadviser, the performance of the Fund, the profitability of PGIM Investments and its affiliates, expenses and fees, and the potential for economies of scale that may be shared with the Fund and its shareholders as the Fund’s assets grow. In their deliberations, the Trustees did not identify any single factor which alone was responsible for the Board’s decision to approve the agreements with respect to the Fund. In connection with its deliberations, the Board considered information provided by PGIM Investments throughout the year at regular Board meetings, presentations from portfolio managers and other information, as well as information furnished at or in advance of the meetings on June 7-10, 2021.
The Trustees determined that the overall arrangements between the Fund and PGIM Investments, which serves as the Fund’s investment manager pursuant to a management agreement, and between PGIM Investments and Jennison, which serves
1PGIM Jennison MLP Fund is a series of Prudential Investment Portfolios 18.
PGIM Jennison MLP Fund
Approval of Advisory Agreements (continued)
as the Fund’s subadviser pursuant to the terms of a subadvisory agreement with PGIM Investments, are in the best interests of the Fund and its shareholders in light of the services performed, fees charged and such other matters as the Trustees considered relevant in the exercise of their business judgment.
Several of the material factors and conclusions that formed the basis for the Trustees’ reaching their determinations to approve the renewal of the agreements are discussed separately below.
Nature, Quality and Extent of Services
The Board received and considered information regarding the nature, quality and extent of services provided to the Fund by PGIM Investments and Jennison. The Board noted that Jennison is affiliated with PGIM Investments. The Board considered the services provided by PGIM Investments, including but not limited to the oversight of the subadviser for the Fund, as well as the provision of fund recordkeeping, compliance and other services to the Fund, and PGIM Investments’ role as administrator for the Fund’s liquidity risk management program. With respect to PGIM Investments’ oversight of the subadviser, the Board noted that PGIM Investments’ Strategic Investment Research Group (“SIRG”), which is a business unit of PGIM Investments, is responsible for monitoring and reporting to PGIM Investments’ senior management on the performance and operations of the subadviser. The Board also considered that PGIM Investments pays the salaries of all of the officers and interested Trustees of the Fund who are part of Fund management. The Board also considered the investment subadvisory services provided by Jennison, including investment research and security selection, as well as compliance with the Fund’s investment restrictions, policies and procedures. The Board considered PGIM Investments’ evaluation of Jennison, as well as PGIM Investments’ recommendation, based on its review of Jennison, to renew the subadvisory agreement.
The Board considered the qualifications, backgrounds and responsibilities of PGIM Investments’ senior management responsible for the oversight of the Fund and Jennison, and also considered the qualifications, backgrounds and responsibilities of Jennison’s portfolio managers who are responsible for the day-to-day management of the Fund’s portfolio. The Board was provided with information pertaining to PGIM Investments’ and Jennison’s organizational structure, senior management, investment operations, and other relevant information pertaining to both PGIM Investments and Jennison. The Board also noted that it received favorable compliance reports from the Fund’s Chief Compliance Officer (“CCO”) as to both PGIM Investments and Jennison.
The Board concluded that it was satisfied with the nature, extent and quality of the investment management services provided by PGIM Investments and the subadvisory services provided to the Fund by Jennison, and that there was a reasonable basis on which to conclude that the Fund benefits from the services provided by PGIM Investments and Jennison under the management and subadvisory agreements.
Visit our website at pgim.com/investments
Costs of Services and Profits Realized by PGIM Investments
The Board was provided with information on the profitability of PGIM Investments and its affiliates in serving as the Fund’s investment manager. The Board discussed with PGIM Investments the methodology utilized in assembling the information regarding profitability and considered its reasonableness. The Board recognized that it is difficult to make comparisons of profitability from fund management contracts because comparative information is not generally publicly available and is affected by numerous factors, including the structure of the particular adviser, the types of funds it manages, its business mix, numerous assumptions regarding allocations and the adviser’s capital structure and cost of capital. Taking these factors into account, the Board concluded that the profitability of PGIM Investments and its affiliates in relation to the services rendered was not unreasonable.
Economies of Scale
The Board received and discussed information concerning economies of scale that PGIM Investments may realize as the Fund’s assets grow beyond current levels. The Board noted that the management fee schedule for the Fund includes breakpoints, which have the effect of decreasing the fee rate as assets increase. During the course of time, the Board has considered information regarding the launch date of the Fund, the management fees of the Fund compared to those of similarly managed funds and PGIM Investments’ investment in the Fund over time. The Board noted that economies of scale can be shared with the Fund in other ways, including low management fees from inception, additional technological and personnel investments to enhance shareholder services, and maintaining existing expense structures in the face of a rising cost environment. The Board also considered PGIM Investments’ assertion that it continually evaluates the management fee schedule of the Fund and the potential to share economies of scale through breakpoints or fee waivers as asset levels increase.
The Board recognized the inherent limitations of any analysis of economies of scale, stemming largely from the Board’s understanding that most of PGIM Investments’ costs are not specific to individual funds, but rather are incurred across a variety of products and services.
Other Benefits to PGIM Investments and Jennison
The Board considered potential ancillary benefits that might be received by PGIM Investments, Jennison and their affiliates as a result of their relationship with the Fund. The Board concluded that potential benefits to be derived by PGIM Investments included transfer agency fees received by the Fund’s transfer agent (which is affiliated with PGIM Investments), as well as benefits to its reputation or other intangible benefits resulting from PGIM Investments’ association with the Fund. The Board concluded that the potential benefits to be derived by Jennison included its ability to use soft dollar credits, as well as the potential benefits consistent with those generally resulting from an increase in assets under management, specifically, potential access to additional research resources and benefits to its reputation. The Board concluded that the benefits
Approval of Advisory Agreements (continued)
derived by PGIM Investments and Jennison were consistent with the types of benefits generally derived by investment managers and subadvisers to mutual funds.
Performance of the Fund / Fees and Expenses
The Board considered certain additional factors and made related conclusions relating to the historical performance of the Fund for the one-, three- and five-year periods ended December 31, 2020.
The Board also considered the Fund’s actual management fee, as well as the Fund’s net total expense ratio, for the fiscal year ended November 30, 2020. The Board considered the management fee for the Fund as compared to the management fee charged by PGIM Investments to other funds and the fee charged by other advisers to comparable mutual funds in a Peer Group. The actual management fee represents the fee rate actually paid by Fund shareholders and includes any fee waivers or reimbursements. The net total expense ratio for the Fund represents the actual expense ratio incurred by Fund shareholders.
The mutual funds included in the Peer Universe, which was used to consider performance, and the Peer Group, which was used to consider expenses and fees, were objectively determined by Broadridge, an independent provider of mutual fund data. In certain circumstances, PGIM Investments also provided supplemental Peer Universe or Peer Group information for reasons addressed with the Board. The comparisons placed the Fund in various quartiles over various periods, with the first quartile being the best 25% of the mutual funds (for performance, the best performing mutual funds and, for expenses, the lowest cost mutual funds).
The section below summarizes key factors considered by the Board and the Board’s conclusions regarding the Fund’s performance, fees and overall expenses. The table sets forth net performance comparisons (which reflect the impact on performance of fund expenses, or any subsidies, expense caps or waivers that may be applicable) with the Peer Universe, actual management fees with the Peer Group (which reflect the impact of any subsidies or fee waivers), and net total expenses with the Peer Group, each of which were key factors considered by the Board.
| | | | | | | | |
| Net Performance | | 1 Year | | 3 Years | | 5 Years | | 10 Years |
| | | 1st Quartile | | 1st Quartile | | 1st Quartile | | N/A |
| Actual Management Fees: 1st Quartile |
| Net Total Expenses: 1st Quartile |
| • | | The Board noted that the Fund outperformed its benchmark over all periods. |
| • | | The Board and PGIM Investments agreed to retain the Fund’s existing contractual expense cap, which (exclusive of certain fees and expenses) caps total annual operating expenses at 1.50% for Class A shares, 2.25% for Class C shares, 1.25% for Class Z shares, and 1.20% for Class R6 shares through March 31, 2022. |
Visit our website at pgim.com/investments
| • | | In addition, PGIM Investments will waive management fees or shared operating expenses on any share class to the same extent that it waives such expenses on any other share class, and has agreed that total annual fund operating expenses for Class R6 shares will not exceed total annual fund operating expenses for Class Z shares. |
| • | | The Board concluded that, in light of the above, it would be in the best interests of the Fund and its shareholders to renew the agreements. |
| • | | The Board concluded that the management fees (including subadvisory fees) and total expenses were reasonable in light of the services provided. |
* * *
After full consideration of these factors, the Board concluded that the approval of the agreements was in the best interests of the Fund and its shareholders.
PGIM Jennison MLP Fund
| | | | |
| | | |
| ∎ MAIL | | ∎ TELEPHONE | | ∎ WEBSITE |
655 Broad Street Newark, NJ 07102 | | (800) 225-1852 | | pgim.com/investments |
|
| PROXY VOTING |
| The Board of Trustees of the Fund has delegated to the Fund’s subadviser the responsibility for voting any proxies and maintaining proxy recordkeeping with respect to the Fund. A description of these proxy voting policies and procedures is available without charge, upon request, by calling (800) 225-1852 or by visiting the Securities and Exchange Commission’s website at sec.gov. Information regarding how the Fund voted proxies relating to portfolio securities during the most recent 12-month period ended June 30 is available on the Fund’s website and on the Securities and Exchange Commission’s website. |
|
| TRUSTEES |
| Ellen S. Alberding • Kevin J. Bannon • Scott E. Benjamin • Linda W. Bynoe • Barry H. Evans • Keith F. Hartstein • Laurie Simon Hodrick • Stuart S. Parker • Brian K. Reid • Grace C. Torres |
|
| OFFICERS |
Stuart S. Parker, President • Scott E. Benjamin, Vice President • Christian J. Kelly, Treasurer and Principal Financial and Accounting Officer • Claudia DiGiacomo, Chief Legal Officer • Dino Capasso, Chief Compliance Officer • Jonathan Corbett, Anti-Money Laundering Compliance Officer • Andrew R. French, Secretary • Melissa Gonzalez, Assistant Secretary • Diana N. Huffman, Assistant Secretary • Kelly A. Coyne, Assistant Secretary • Patrick E. McGuinness, Assistant Secretary • Debra Rubano, Assistant Secretary • Lana Lomuti, Assistant Treasurer • Russ Shupak, Assistant Treasurer • Elyse M. McLaughlin, Assistant Treasurer • Deborah Conway, Assistant Treasurer |
| | | | |
| MANAGER | | PGIM Investments LLC | | 655 Broad Street Newark, NJ 07102 |
|
| SUBADVISER | | Jennison Associates LLC | | 466 Lexington Avenue New York, NY 10017 |
|
| DISTRIBUTOR | | Prudential Investment
Management Services LLC | | 655 Broad Street Newark, NJ 07102 |
|
| CUSTODIAN | | The Bank of New York Mellon | | 240 Greenwich Street New York, NY 10286 |
|
| TRANSFER AGENT | | Prudential Mutual Fund Services LLC | | PO Box 9658 Providence, RI 02940 |
|
INDEPENDENT REGISTERED
PUBLIC ACCOUNTING FIRM | | PricewaterhouseCoopers LLP | | 300 Madison Avenue New York, NY 10017 |
|
| FUND COUNSEL | | Willkie Farr & Gallagher LLP | | 787 Seventh Avenue New York, NY 10019 |
|
|
| An investor should consider the investment objectives, risks, charges, and expenses of the Fund carefully before investing. The prospectus and summary prospectus contain this and other information about the Fund. An investor may obtain the prospectus and summary prospectus by visiting our website at pgim.com/investments or by calling (800) 225-1852. The prospectus and summary prospectus should be read carefully before investing. |
|
| E-DELIVERY |
| To receive your mutual fund documents online, go to pgim.com/investments/resource/edelivery and enroll. Instead of receiving printed documents by mail, you will receive notification via email when new materials are available. You can cancel your enrollment or change your email address at any time by visiting the website address above. |
|
| SHAREHOLDER COMMUNICATIONS WITH TRUSTEES |
| Shareholders can communicate directly with the Board of Trustees by writing to the Chair of the Board, PGIM Jennison MLP Fund, PGIM Investments, Attn: Board of Trustees, 655 Broad Street, Newark, NJ 07102. Shareholders can communicate directly with an individual Trustee by writing to that Trustee at the same address. Communications are not screened before being delivered to the addressee. |
|
| AVAILABILITY OF PORTFOLIO HOLDINGS |
| The Fund files its complete schedule of portfolio holdings with the Securities and Exchange Commission for the first and third quarters of each fiscal year as an exhibit to its reports on Form N-PORT. The Fund’s Form N-PORT filings are available on the Commission’s website at sec.gov. |
|
| The Fund’s Statement of Additional Information contains additional information about the Fund’s Trustees and is available without charge, upon request, by calling (800) 225-1852. |
Mutual Funds:
| | | | |
ARE NOT INSURED BY THE FDIC OR ANY FEDERAL GOVERNMENT AGENCY | | MAY LOSE VALUE | | ARE NOT A DEPOSIT OF OR GUARANTEED
BY ANY BANK OR ANY BANK AFFILIATE |
| | | | | | | | |
PGIM JENNISON MLP FUND |
| SHARE CLASS | | A | | C | | Z | | R6 |
| NASDAQ | | PRPAX | | PRPCX | | PRPZX | | PRPQX |
| CUSIP | | 74440G701 | | 74440G800 | | 74440G883 | | 74440G859 |
MF218E
Item 2 – Code of Ethics — See Exhibit (a)
As of the end of the period covered by this report, the registrant has adopted a code of ethics (the “Section 406 Standards for Investment Companies – Ethical Standards for Principal Executive and Financial Officers”) that applies to the registrant’s Principal Executive Officer and Principal Financial Officer; the registrant’s Principal Financial Officer also serves as the Principal Accounting Officer.
The registrant hereby undertakes to provide any person, without charge, upon request, a copy of the code of ethics. To request a copy of the code of ethics, contact the registrant 800-225-1852, and ask for a copy of the Section 406 Standards for Investment Companies - Ethical Standards for Principal Executive and Financial Officers.
Item 3 – Audit Committee Financial Expert –
The registrant’s Board has determined that Ms. Grace C. Torres, member of the Board’s Audit Committee is an “audit committee financial expert,” and that she is “independent,” for purposes of this item.
Item 4 – Principal Accountant Fees and Services –
For the fiscal year ended November 30, 2021 and November 30, 2020, PricewaterhouseCoopers LLP (“PwC”), the Registrant’s principal accountant, billed the Registrant $83,300 and $83,300 respectively, for professional services rendered for the audit of the Registrant’s annual financial statements or services that are normally provided in connection with statutory and regulatory filings.
For the fiscal years ended November 30, 2021 and November 30, 2020, PwC did not bill the Registrant for audit-related services.
For the fiscal year ended November 30, 2020, fees of $5,103 were billed to the Registrant for services rendered by KPMG LLP (the Registrant’s prior principal accountant) in connection with the auditor transition.
For the fiscal years ended November 30, 2021 and November 30, 2020: none.
For the fiscal years ended November 30, 2021 and November 30, 2020: none.
| | (e) (1) | Audit Committee Pre-Approval Policies and Procedures |
THE PGIM MUTUAL FUNDS
AUDIT COMMITTEE POLICY
on
Pre-Approval of Services Provided by the Independent
Accountants
The Audit Committee of each PGIM Mutual Fund is charged with the responsibility to monitor the independence of the Fund’s independent accountants. As part of this responsibility, the Audit Committee must pre-approve the independent accounting firm’s engagement to render audit and/or permissible non-audit services, as required by law. In evaluating a proposed engagement of the independent accountants, the Audit Committee will assess the effect that the engagement might reasonably be expected to have on the accountant’s independence. The Committee’s evaluation will be based on:
| | • | | a review of the nature of the professional services expected to be provided, |
| | • | | a review of the safeguards put into place by the accounting firm to safeguard independence, and |
| | • | | periodic meetings with the accounting firm. |
Policy for Audit and Non-Audit Services Provided to the Funds
On an annual basis, the scope of audits for each Fund, audit fees and expenses, and audit-related and non-audit services (and fees proposed in respect thereof) proposed to be performed by the Fund’s independent accountants will be presented by the Treasurer and the independent accountants to the Audit Committee for review and, as appropriate, approval prior to the initiation of such services.
Such presentation shall be accompanied by confirmation by both the Treasurer and the independent accountants that the proposed
non-audit services will not adversely affect the independence of the independent accountants. Such proposed non-audit services shall be described in sufficient detail to enable the Audit Committee to assess the appropriateness of such services and fees, and the compatibility of the provision of such services with the auditor’s independence. The Committee shall receive periodic reports on the progress of the audit and other services which are approved by the Committee or by the Committee Chair pursuant to authority delegated in this Policy.
The categories of services enumerated under “Audit Services”, “Audit-related Services”, and “Tax Services” are intended to provide guidance to the Treasurer and the independent accountants as to those categories of services which the Committee believes are generally consistent with the independence of the independent accountants and which the Committee (or the Committee Chair) would expect upon the presentation of specific proposals to pre-approve. The enumerated categories are not intended as an exclusive list of audit, audit-related or tax services, which the Committee (or the Committee Chair) would consider for pre-approval.
Audit Services
The following categories of audit services are considered to be consistent with the role of the Fund’s independent accountants:
| | • | | Annual Fund financial statement audits |
| | • | | Seed audits (related to new product filings, as required) |
| | • | | SEC and regulatory filings and consents |
Audit-related Services
The following categories of audit-related services are considered to be consistent with the role of the Fund’s independent accountants:
| | • | | Accounting consultations |
| | • | | Fund merger support services |
| | • | | Agreed Upon Procedure Reports |
| | • | | Other Internal Control Reports |
Individual audit-related services that fall within one of these categories (except for fund merger support services) and are not presented to the Audit Committee as part of the annual pre-approval process are subject to an authorized pre-approval by the
Audit Committee so long as the estimated fee for those services does not exceed $30,000. Any services provided under such pre-approval will be reported to the Audit Committee at its next regular meeting. Should the amount of such services exceed $30,000 any additional fees will be subject to pre-approval by the Committee Chair (or any other Committee member on whom this responsibility has been delegated). Fees related to fund merger support services are subject to a separate authorized pre-approval by the Audit Committee with fees determined on a per occurrence and merger complexity basis.
Tax Services
The following categories of tax services are considered to be consistent with the role of the Fund’s independent accountants:
| | • | | Tax compliance services related to the filing or amendment of the following: |
| | • | | Federal, state and local income tax compliance; and, |
| | • | | Sales and use tax compliance |
| | • | | Timely RIC qualification reviews |
| | • | | Tax distribution analysis and planning |
| | • | | Tax authority examination services |
| | • | | Tax appeals support services |
| | • | | Accounting methods studies |
| | • | | Fund merger support services |
| | • | | Tax consulting services and related projects |
Individual tax services that fall within one of these categories and are not presented to the Audit Committee as part of the annual pre-approval process are subject to an authorized pre-approval by the Audit Committee so long as the estimated fee for those services does not exceed $30,000. Any services provided under such pre-approval will be reported to the Audit Committee at its next regular meeting. Should the amount of such services exceed $30,000 any additional fees will be subject to pre-approval by the Committee Chair (or any other Committee member on whom this responsibility has been delegated).
Other Non-Audit Services
Certain non-audit services that the independent accountants are legally permitted to render will be subject to pre-approval by the Committee or by one or more Committee members to whom the Committee has delegated this authority and who will report to the full Committee any pre-approval decisions made pursuant to this Policy. Non-audit services presented for pre-approval pursuant to this paragraph will be accompanied by a confirmation from both the Treasurer and the independent accountants that the proposed services will not adversely affect the independence of the independent accountants.
Proscribed Services
The Fund’s independent accountants will not render services in the following categories of non-audit services:
| | • | | Bookkeeping or other services related to the accounting records or financial statements of the Fund |
| | • | | Financial information systems design and implementation |
| | • | | Appraisal or valuation services, fairness opinions, or contribution-in-kind reports |
| | • | | Internal audit outsourcing services |
| | • | | Management functions or human resources |
| | • | | Broker or dealer, investment adviser, or investment banking services |
| | • | | Legal services and expert services unrelated to the audit |
| | • | | Any other service that the Public Company Accounting Oversight Board determines, by regulation, is impermissible. |
Pre-approval of Non-Audit Services Provided to Other Entities Within the PGIM Fund Complex
Certain non-audit services provided to PGIM Investments LLC or any of its affiliates that also provide ongoing services to the PGIM Mutual Funds will be subject to pre-approval by the Audit Committee. The only non-audit services provided to these entities that will require pre-approval are those related directly to the operations and financial reporting of the Funds. Individual projects that are not presented to the Audit Committee as part of the annual pre-approval process will be subject to pre-approval by the Committee Chair (or any other Committee member on whom this responsibility has been delegated) so long as the estimated fee for those services does not exceed $30,000. Services presented for pre-approval pursuant to this paragraph will be accompanied by a confirmation from both the Treasurer and the independent accountants that the proposed services will not adversely affect the independence of the independent accountants.
Although the Audit Committee will not pre-approve all services provided to PGIM Investments LLC and its affiliates, the Committee will receive an annual report from the Fund’s independent accounting firm showing the aggregate fees for all services provided to PGIM Investments and its affiliates.
(e) (2) Percentage of services referred to in 4(b) – 4(d) that were approved by the audit committee –
For the fiscal years ended November 30, 2021 and November 30, 2020, 100% of the services referred to in Item 4(b) was approved by the audit committee.
(f) Percentage of hours expended attributable to work performed by other than full time employees of principal accountant if greater than 50%.
The percentage of hours expended on the principal accountant’s engagement to audit the registrant’s financial statements for the most recent fiscal year that were attributed to work performed by persons other than the principal accountant’s full-time, permanent employees was 0%.
(g) Non-Audit Fees
The aggregate non-audit fees billed by the Registrant’s principal accountant for services rendered to the registrant’s investment adviser and any entity controlling, controlled by, or under common control with the investment adviser that provides ongoing services to the registrant for the fiscal years ended November 30, 2021 and November 30, 2020 was $0 and $0, respectively.
(h) Principal Accountant’s Independence
Not applicable as the Registrant’s principal accountant has not provided non-audit services to the registrant’s investment adviser and any entity controlling, controlled by, or under common control with the investment adviser that provides ongoing services to the registrant that were not pre-approved pursuant to Rule 2-01(c)(7)(ii) of Regulation S-X.
| Item 5 – | Audit Committee of Listed Registrants – Not applicable. |
| Item 6 – | Schedule of Investments – The schedule is included as part of the report to shareholders filed under Item 1 of this Form. |
| Item 7 – | Disclosure of Proxy Voting Policies and Procedures for Closed-End Management Investment Companies – Not applicable. |
| Item 8 – | Portfolio Managers of Closed-End Management Investment Companies – Not applicable. |
| Item 9 – | Purchases of Equity Securities by Closed-End Management Investment Company and Affiliated Purchasers – Not applicable. |
| Item 10 – | Submission of Matters to a Vote of Security Holders – There have been no material changes to these procedures. |
| Item 11 – | Controls and Procedures |
| | (a) | It is the conclusion of the registrant’s principal executive officer and principal financial officer that the |
| | effectiveness of the registrant’s current disclosure controls and procedures (such disclosure controls and procedures having been evaluated within 90 days of the date of this filing) provide reasonable assurance that the information required to be disclosed by the registrant has been recorded, processed, summarized and reported within the time period specified in the Commission’s rules and forms and that the information required to be disclosed by the registrant has been accumulated and communicated to the registrant’s principal executive officer and principal financial officer in order to allow timely decisions regarding required disclosure. |
| | (b) | There has been no significant change in the registrant’s internal control over financial reporting that occurred during the registrant’s most recent fiscal quarter of the period covered by this report that has materially affected, or is likely to materially affect, the registrant’s internal control over financial reporting. |
Item 12 – Controls and Procedures - Disclosure of Securities Lending Activities for Closed-End Management Investment Companies – Not applicable.
Item 13 – Exhibits
(a) (1) Code of Ethics – Attached hereto as Exhibit EX-99.CODE-ETH.
(2) Certifications pursuant to Section 302 of the Sarbanes-Oxley Act – Attached hereto as Exhibit EX-99.CERT.
(3) Any written solicitation to purchase securities under Rule 23c-1 – Not applicable.
(b) Certifications pursuant to Section 906 of the Sarbanes-Oxley Act – Attached hereto as Exhibit EX-99.906CERT.
SIGNATURES
Pursuant to the requirements of the Securities Exchange Act of 1934 and the Investment Company Act of 1940, the registrant has duly caused this report to be signed on its behalf by the undersigned, thereunto duly authorized.
| | |
| Registrant: | | Prudential Investment Portfolios 18 |
| |
| By: | | /s/ Andrew R. French |
| | Andrew R. French |
| | Secretary |
| |
| Date: | | January 14, 2022 |
Pursuant to the requirements of the Securities Exchange Act of 1934 and the Investment Company Act of 1940, this report has been signed below by the following persons on behalf of the registrant and in the capacities and on the dates indicated.
| | |
| By: | | /s/ Stuart S. Parker |
| | Stuart S. Parker |
| | President and Principal Executive Officer |
| |
| Date: | | January 14, 2022 |
| |
| By: | | /s/ Christian J. Kelly |
| | Christian J. Kelly |
| | Treasurer and Principal Financial and Accounting Officer |
| |
| Date: | | January 14, 2022 |