UNITED STATES
SECURITIES AND EXCHANGE COMMISSION
Washington, D.C. 20549
FORM N-CSR
CERTIFIED SHAREHOLDER REPORT OF REGISTERED MANAGEMENT INVESTMENT COMPANIES
| Investment Company Act file number | | 811-09174 |
| |
| Aegis Value Fund, Inc. |
| (Exact name of Registrant as specified in charter) |
| 1100 N. Glebe Road, Suite 1040, Arlington, VA | | 22201 |
| (Address of principal executive offices) | | (Zip code) |
| |
| Scott L. Barbee, 1100 N. Glebe Road, Suite 1040, Arlington, VA 22201 |
| (Name and address of agent for service) |
| Registrant's telephone number, including area code: | | (703) 528-7788 |
| | | |
| Date of fiscal year end: | | 08/31 |
| | | |
| Date of reporting period: | | 08/31/09 |
Item 1. Reports to Stockholders
| | | | | |
| | | | | |
| | | | | |
| | | | | |
| | | | | |
| | | | | |
| | | | | |
| | | | | |
| | | | | |
| | | | | |
| | | | | |
| | | | | |
| | | | | |
| | | | | |
| | | | | |
| | | | | |
| | | | | |
| | | | | |
| | | | | |
| | | | | |
| | | | | |
| | | | | |
| | | | | |
| | | | | |
| | | | | |
| | | | | |
| | | | | |
| | | | | |
| | | | | |
| | | | | |
| | | | | |
| | | Annual Report | | |
| | | August 31, 2009 | | |
| | | | | |
| | | | | |
| | | | | |
| | | | | |
| | | | | |
| | | | | |
| | | | | |
| | | | | |
| | | | | |
| | | | | |
| | | | | |
| | | | | |
| | | | | |
| | | | | |
| | | | | |
| | | | | |
| | | | | |
| | | | | |
| | | | | |
| | | | | |
| | | | | |
| | | | | |
| | ANNUAL REPORT AUGUST 31, 2009 |
Shareholders’ Letter
October 20, 2009
To the shareholders of the Aegis Value Fund:
We are pleased to present the Aegis Value Fund’s annual report for the year ended August 31, 2009.
We take this opportunity to provide a brief overview of the objectives and strategy of the Fund.
The Aegis Value Fund seeks to achieve long-term, above market returns while minimizing risk of capital loss. Our strategy is to invest in a well-researched portfolio of small-cap equities trading at a fraction of their intrinsic worth. We believe the equity markets are often inefficient, and we employ a contrarian, company-focused approach, selecting each stock individually on its own merit. We purchase shares in companies when we judge share prices to be significantly undervalued relative to our assessment of fundamental value, focusing on stocks trading at low price-to-book or price-to-cash flow ratios, segments of the market where academic research shows historical returns have significantly outpaced the overall market. We often invest in companies when they are misunderstood, out of favor, or neglected, and generally hold these companies until share prices reach our estimate of intrinsic value.
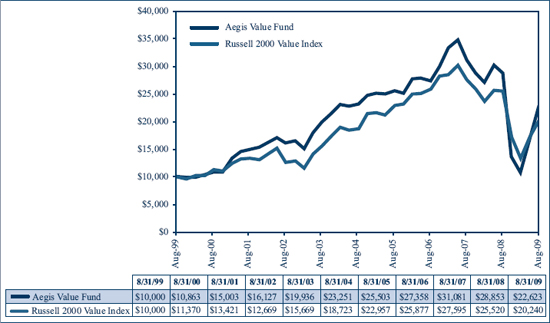
From inception of the Aegis Value Fund on May 15, 1998 through September 30, 2009, the Fund has posted a cumulative gain of 169.3%, compared to a cumulative gain of 83.4% in our primary small-cap benchmark, the Russell 2000 Value Index. During the same period, the Russell 2000 Index of small-cap stocks posted a cumulative gain of 48.4%, and the S&P 500 Index of large cap stocks posted a cumulative gain of 16.1%*
For the year ended August 31, 2009, the Fund declined 21.6%, slightly trailing the Russell 2000 Value Index, which dropped 20.7%. Poor investment performance by former Fund holdings Callon Petroleum and Meridian Resource Corporation in the second half of calendar 2008 were primarily responsible for the underperformance relative to the index. The Russell 2000 Index declined 21.3% while the S&P 500 declined 18.3%.
For the most recent performance information, please call us directly at 800-528-3780 or consult your financial advisor. We strongly recommend that you read our third quarter 2009 and other quarterly manager’s letters, which provide additional commentary. For those of you who do not automatically receive our manager’s letter in the mail from your broker, it is available on our website at www.aegisvaluefund.com or by calling us at 800-528-3780. Please be aware that the manager’s letter is not a part of the SEC-mandated Annual Report contained in this booklet.
Shareholders’ Letter – (continued)
We look forward to the opportunity to serve as your investment partner in the coming year.
Aegis Financial Corporation
Scott L. Barbee, CFA
Managing Director, Portfolio Manager
* Aegis Value Fund’s one-year, three-year, five-year, ten-year and since inception (5/15/1998) average annual returns for the period ending September 30, 2009 are -7.4%, -3.7%, 0.8%, 9.3%, and 9.1% respectively. Returns include reinvestment of dividends and capital gains. Russell 2000 Value Index one-year, three-year, five-year, ten-year, and since inception (AVALX-5/15/1998) average annual returns for the period ending September 30, 2009 are -12.6%, -6.7%, 1.8%, 8.1%, and 5.5%. All historical performance returns shown in this shareholders’ letter for the Aegis Value Fund Inc. are pre-tax returns. This report does not constitute an offer or solicitation of any transaction in any securities. The Aegis Value Fund is offered by prospectus only.
Investors are advised to consider the fund’s investment objectives, risks, charges and expenses carefully before investing. The prospectus contains this and other information about the Aegis Value Fund. For a prospectus and more complete information, including charges and expenses, please call 800-528-3780 or visit our website at www.aegisvaluefund.com, where an online prospectus is provided. The prospectus should be read carefully before investing.
Performance data quoted represents past performance. Past performance does not guarantee future results. Investment return and principal value of an investment will fluctuate so that an investor’s shares, when redeemed, may be worth more or less than their original cost. Current performance may be lower or higher than the performance data quoted. Please call 800-528-3780 to obtain performance data current to the most recent month-end.
| | ANNUAL REPORT AUGUST 31, 2009 |
Disclosure of Fund Expenses
August 31, 2009
(Unaudited)
As a shareholder of the Fund, you incur ongoing costs, including management fees and other Fund expenses. This example is intended to help you understand your ongoing costs (in dollars) of investing in the Fund and to compare these costs with ongoing costs of investing in other mutual funds. The example is based on an investment of $1,000 invested and held for the entire semi-annual period, March 1, 2009 – August 31, 2009.
Actual expenses
The table below provides information about actual account values and actual expenses.
| | | | | | | | | | | | | |
| Fund | | | Beginning Account Value 3/1/2009 | | | Ending Account Value 8/31/2009 | | | Annualized Expense Ratio | | | Expenses Paid During Period 3/1/09 – 8/31/09 | |
| Aegis Value Fund | | | | | | | | | | | | |
| | | | | | | | | | | | | |
| Actual | | $ | 1,000.00 | | | $ | 2,095.60 | | | | 1.50 | % | | $ | 11.70 | |
| | | | | | | | | | | | | | | | | |
| Hypothetical | | | 1,000.00 | | | | 1,017.44 | | | | 1.50 | % | | | 7.63 | |
| (1) | The actual ending account value is based on the actual total return of the Fund for the period March 1, 2009 to August 31, 2009 after actual expenses and will differ from the hypothetical ending account value which is based on the Fund’s actual expense ratio and a hypothetical annual return of 5% before expenses. The actual cumulative return at net asset value for the period March 1, 2009 to August 31, 2009 was 109.56%. |
| | |
| (2) | Expenses are equal to the Fund’s annualized expense ratio (1.50%) multiplied by the average account value over the period, multiplied by 184/365 (to reflect the period between 3/1/2009 and 8/31/2009) |
Please see performance data disclosure on pages 2.
You may use the information in this table, together with the amount you invested, to estimate the expenses that you paid over the period. Simply divide your account value by $1,000 (for example, an $8,600 account value divided by $1,000 = 8.6), then multiply the result by the number in the table under the heading entitled “Expenses Paid During Period” to estimate the expenses you paid on your account during this period.
Hypothetical example for comparison purposes
The table above also provides information about hypothetical account values and hypothetical expenses based on the Fund’s actual expense ratio and an assumed rate of return of 5% per year before expenses, which is not the Fund’s actual return. The hypothetical account values and expenses may not be used to estimate the actual ending account balance or expenses you paid for the period. You may use this information to compare the ongoing costs of investing in the Fund and other funds. To do so, compare this 5% hypothetical example with the 5% hypothetical examples that appear in the
shareholder reports of the other funds. Please note that the expenses shown in the table are meant to highlight your ongoing costs only. The Fund is a pure no-load fund and does not charge any sales charges (loads), distribution or service fees, or redemption fees.
Key statistics
Average Annual Total Returns (As of August 31, 2009)
| | | | | | | |
| | | AVALX | | Rus. 2000 Val. |
| Trailing 1 Year | | –21.6 | % | | –20.7 | % |
| | | | | | | |
| Trailing 3 Year | | –6.1 | % | | –7.9 | % |
| | | | | | | |
| Trailing 5 Year | | –0.6 | % | | –1.6 | % |
| | | | | | | |
| Trailing 10 Year | | 8.5 | % | | 7.3 | % |
See performance data disclosure on page 2.
Returns on both Aegis Value Fund and Russell 2000 Value Index assume reinvestment of all dividends and distributions. Fund returns are after all expenses. Past performance is not predictive of future results. The returns shown do not reflect the deduction of taxes a shareholder would pay on the redemption of Fund shares or Fund distributions. As of August 31, 2008 gross expenses for the Fund were 1.44%.
| | ANNUAL REPORT AUGUST 31, 2009 |
Industry Breakdown (Unaudited)
| | | | | | | |
| | | | | % of the Fund’s Net Assets |
| Common Stock | | | | | 95.2 | % |
| Aerospace/Defense | | 3.9 | % | | | |
| Airlines | | 0.0 | % | | | |
| Auto Components | | 10.8 | % | | | |
| Capital Markets | | 0.7 | % | | | |
| Chemicals | | 3.5 | % | | | |
| Commercial Banks | | 0.0 | % | | | |
| Containers & Packaging | | 0.3 | % | | | |
| Distributors | | 3.0 | % | | | |
| Diversified Financial Services | | 6.2 | % | | | |
| Diversified Telecommunication Services | | 0.0 | % | | | |
| Electronic Equipment, Instruments & Components | | 0.6 | % | | | |
| Energy Equipment & Services | | 1.1 | % | | | |
| Food Products | | 1.4 | % | | | |
| Hotels, Restaurants & Leisure | | 1.5 | % | | | |
| Household Durables | | 5.0 | % | | | |
| Insurance | | 6.8 | % | | | |
| Leisure Equipment & Products | | 0.9 | % | | | |
| Machinery | | 5.6 | % | | | |
| Marine | | 1.0 | % | | | |
| Media | | 0.8 | % | | | |
| Metals & Mining | | 5.8 | % | | | |
| Multiline Retail | | 4.6 | % | | | |
| Oil, Gas & Consumable Fuels | | 3.4 | % | | | |
| Paper & Forest Products | | 0.3 | % | | | |
| Professional Services | | 2.4 | % | | | |
| Real Estate Investment Trusts | | 9.7 | % | | | |
| Real Estate Management & Development | | 0.4 | % | | | |
| Road & Rail | | 0.9 | % | | | |
| Semiconductors & Semiconductor Equipment | | 0.4 | % | | | |
| Specialty Retail | | 1.8 | % | | | |
| Textiles, Apparel & Luxury Goods | | 4.7 | % | | | |
| Thrifts & Mortgage Finance | | 2.7 | % | | | |
| Tobacco | | 4.9 | % | | | |
| Trading Companies & Distributors | | 0.1 | % | | | |
| Investment Companies* | | | | | 0.2 | % |
| Short-Term Investments* | | | | | 4.3 | % |
| Other Assets and Liabilities | | | | | 0.3 | % |
| Total Net Assets | | | | | 100.0 | % |
| * | Please refer to page 10 for further details. |
Schedule of Portfolio Investments
August 31, 2009
| | | | | | | |
| | | Shares | | | Value | |
| Common Stock – 95.2% | | | | | | |
| | | | | | | |
| Consumer Discretionary – 33.1% | | | | | | |
| | | | | | | |
| Auto Components – 10.8% | | | | | | |
| Cooper Tire & Rubber Co. | | | 145,980 | | | $ | 2,084,595 | |
Dana Holding Corp.(1) | | | 1,805,445 | | | | 9,442,477 | |
| Superior Industries International, Inc. | | | 128,791 | | | | 1,831,408 | |
| | | | | | | | 13,358,480 | |
| | | | | | | | | |
| Distributors – 3.0% | | | | | | | | |
Audiovox Corp. Class A(1) | | | 526,248 | | | | 3,715,311 | |
Handleman Co.(1) | | | 386,500 | | | | 1,546 | |
| | | | | | | | 3,716,857 | |
| | | | | | | | | |
| Hotels, Restaurants & Leisure – 1.5% | | | | | | | | |
| Bowl America, Inc. Class A | | | 9,481 | | | | 123,348 | |
J. Alexander’s Corp.(1) | | | 120,010 | | | | 510,042 | |
Lodgian, Inc.(1) | | | 158,300 | | | | 220,037 | |
Luby’s, Inc.(1) | | | 230,603 | | | | 1,003,123 | |
| | | | | | | | 1,856,550 | |
| | | | | | | | | |
| Household Durables – 5.0% | | | | | | | | |
Bassett Furniture Industries, Inc.(2) | | | 1,043,731 | | | | 5,281,279 | |
Coachmen Industries, Inc.(1)(2) | | | 814,617 | | | | 977,540 | |
| | | | | | | | 6,258,819 | |
| | | | | | | | | |
| Leisure Equipment & Products – 0.9% | | | | | | | | |
Head N.V.(1)(3) | | | 1,776,700 | | | | 1,147,410 | |
| | | | | | | | | |
| Media – 0.8% | | | | | | | | |
Fisher Communications, Inc.(1) | | | 48,668 | | | | 1,004,021 | |
| | | | | | | | | |
| Multiline Retail – 4.6% | | | | | | | | |
| Dillard’s, Inc. Class A | | | 160,900 | | | | 1,835,869 | |
Duckwall-ALCO Stores, Inc.(1)(2) | | | 233,178 | | | | 3,887,077 | |
| | | | | | | | 5,722,946 | |
| | | | | | | | | |
| Specialty Retail – 1.8% | | | | | | | | |
| Books-A-Million, Inc. | | | 133,446 | | | | 1,812,197 | |
Hastings Entertainment, Inc.(1) | | | 71,556 | | | | 282,646 | |
| PEP Boys – Manny, Moe & Jack | | | 21,200 | | | | 189,316 | |
| | | | | | | | 2,284,159 | |
See Notes to the Financial Statements.
| | ANNUAL REPORT AUGUST 31, 2009 |
Schedule of Portfolio Investments – (continued)
August 31, 2009
| | | | | | | |
| | | Shares | | | Value | |
| Common Stock – Continued | | | | | | |
| | | | | | | |
| Consumer Discretionary – Continued | | | | | | |
| | | | | | | |
| Textiles, Apparel & Luxury Goods – 4.7% | | | | | | |
Delta Apparel, Inc.(1)(2) | | | 552,046 | | | $ | 4,576,461 | |
| Tandy Brands Accessories, Inc. | | | 345,391 | | | | 898,017 | |
Unifi, Inc.(1) | | | 128,671 | | | | 297,230 | |
| | | | | | | | 5,771,708 | |
| Total Consumer Discretionary | | | | | | | 41,120,950 | |
| | | | | | | | | |
| Consumer Staples – 6.3% | | | | | | | | |
| Food Products – 1.4% | | | | | | | | |
| Imperial Sugar Co. | | | 34,750 | | | | 484,415 | |
Omega Protein Corp.(1) | | | 283,206 | | | | 1,180,969 | |
| | | | | | | | 1,665,384 | |
| Tobacco – 4.9% | | | | | | | | |
Alliance One International, Inc.(1) | | | 1,598,797 | | | | 6,123,392 | |
| Total Consumer Staples | | | | | | | 7,788,776 | |
| | | | | | | | | |
| Energy – 4.5% | | | | | | | | |
| Energy Equipment & Services – 1.1% | | | | | | | | |
Leader Energy Services Ltd.(1)(3) | | | 175,433 | | | | 20,765 | |
| Patterson-UTI Energy, Inc. | | | 98,100 | | | | 1,303,749 | |
| | | | | | | | 1,324,514 | |
| Oil, Gas & Consumable Fuels – 3.4% | | | | | | | | |
Brigham Exploration Co.(1) | | | 475,500 | | | | 3,114,525 | |
| Tesoro Corp. | | | 81,087 | | | | 1,141,705 | |
| | | | | | | | 4,256,230 | |
| Total Energy | | | | | | | 5,580,744 | |
| | | | | | | | | |
| Financials – 26.5% | | | | | | | | |
| Capital Markets – 0.7% | | | | | | | | |
BKF Capital Group, Inc.(1) | | | 331,200 | | | | 347,760 | |
FBR Capital Markets Corp.(1) | | | 98,556 | | | | 533,188 | |
| | | | | | | | 880,948 | |
| Commercial Banks – 0.0% | | | | | | | | |
| Citizens Bancshares Corp. | | | 3,024 | | | | 17,388 | |
| | | | | | | | | |
| Diversified Financial Services – 6.2% | | | | | | | | |
| California First National Bancorp. | | | 375,975 | | | | 4,763,603 | |
See Notes to the Financial Statements.
Schedule of Portfolio Investments – (continued)
August 31, 2009
| | | | | | | |
| | | Shares | | | Value | |
| Common Stock – Continued | | | | | | |
| | | | | | | |
| Financials – Continued | | | | | | |
| | | | | | | |
| Diversified Financial Services – Continued | | | | | | |
Marlin Business Services Corp.(1) | | | 218,624 | | | $ | 1,639,680 | |
| Medallion Financial Corp. | | | 158,567 | | | | 1,324,035 | |
| | | | | | | | 7,727,318 | |
| Insurance – 6.8% | | | | | | | | |
| Old Republic International Corp. | | | 94,000 | | | | 1,119,540 | |
PMA Capital Corp. Class A(1) | | | 712,728 | | | | 3,927,132 | |
Specialty Underwriters’ Alliance, Inc.(1) | | | 522,276 | | | | 3,410,462 | |
| | | | | | | | 8,457,134 | |
| Real Estate Investment Trusts – 9.7% | | | | | | | | |
Arlington Asset Investment Corp. Class A(1) | | | 3,154,287 | | | | 1,640,229 | |
| Brandywine Realty Trust | | | 246,708 | | | | 2,617,572 | |
| BRT Realty Trust | | | 417,182 | | | | 2,190,206 | |
| Care Investment Trust, Inc. | | | 249,355 | | | | 1,752,966 | |
| HRPT Properties Trust | | | 473,251 | | | | 3,066,666 | |
| Post Properties, Inc. | | | 45,600 | | | | 777,024 | |
Vestin Realty Mortgage I, Inc.(1) | | | 26,809 | | | | 30,830 | |
| | | | | | | | 12,075,493 | |
| Real Estate Management & Development – 0.4% | | | | | | | | |
| Thomas Properties Group, Inc. | | | 235,237 | | | | 503,407 | |
| | | | | | | | | |
| Thrifts & Mortgage Finance – 2.7% | | | | | | | | |
B of I Holding, Inc.(1)(2) | | | 415,202 | | | | 3,197,055 | |
| First Federal of Northern Michigan Bancorp, Inc. | | | 35,640 | | | | 71,102 | |
| | | | | | | | 3,268,157 | |
| Total Financials | | | | | | | 32,929,845 | |
| | | | | | | | | |
| Industrials – 13.9% | | | | | | | | |
| Aerospace & Defense – 3.9% | | | | | | | | |
Allied Defense Group, Inc.(1)(2) | | | 766,997 | | | | 3,589,546 | |
Sparton Corp.(1) | | | 100,193 | | | | 328,633 | |
| Sypris Solutions, Inc. | | | 496,874 | | | | 939,092 | |
| | | | | | | | 4,857,271 | |
| Airlines – 0.0% | | | | | | | | |
MAIR Holdings, Inc.(1)(2)(4) | | | 1,360,922 | | | | — | |
See Notes to the Financial Statements.
| | ANNUAL REPORT AUGUST 31, 2009 |
Schedule of Portfolio Investments – (continued)
August 31, 2009
| | | | | | | |
| | | Shares | | | Value | |
| Common Stock – Continued | | | | | | |
| | | | | | | |
| Industrials – Continued | | | | | | |
| | | | | | | |
| Machinery – 5.6% | | | | | | |
| Hardinge, Inc. | | | 272,597 | | | $ | 1,654,664 | |
Tecumseh Products Co., Class A(1)(2) | | | 101,426 | | | | 917,905 | |
Tecumseh Products Co., Class B(1)(2) | | | 395,621 | | | | 4,407,218 | |
| | | | | | | | 6,979,787 | |
| | | | | | | | | |
| Marine – 1.0% | | | | | | | | |
| International Shipholding Corp. | | | 26,859 | | | | 805,233 | |
Ultrapetrol (Bahamas) Ltd.(1) | | | 100,000 | | | | 482,000 | |
| | | | | | | | 1,287,233 | |
| | | | | | | | | |
| Professional Services – 2.4% | | | | | | | | |
Spherion Corp.(1) | | | 544,772 | | | | 2,952,664 | |
| | | | | | | | | |
| Road & Rail – 0.9% | | | | | | | | |
Covenant Transportation Group, Inc. Class A(1) | | | 223,121 | | | | 1,086,599 | |
| | | | | | | | | |
| Trading Companies & Distributors – 0.1% | | | | | | | | |
Huttig Building Products, Inc.(1) | | | 90,033 | | | | 83,731 | |
| Total Industrials | | | | | | | 17,247,285 | |
| | | | | | | | | |
| Information Technology – 1.0% | | | | | | | | |
| Electronic Equipment, Instruments & | | | | | | | | |
| Components – 0.6% | | | | | | | | |
Frequency Electronics, Inc.(1) | | | 211,190 | | | | 739,165 | |
| | | | | | | | | |
| Semiconductors & Semiconductor Equipment – 0.4% | | | | | | | | |
ChipMOS TECHNOLOGIES (Bermuda) Ltd.(1) | | | 662,600 | | | | 503,576 | |
| Total Information Technology | | | | | | | 1,242,741 | |
| | | | | | | | | |
| Materials – 9.9% | | | | | | | | |
| Chemicals – 3.5% | | | | | | | | |
American Pacific Corp.(1)(2) | | | 534,150 | | | | 4,364,005 | |
| | | | | | | | | |
| Containers & Packaging – 0.3% | | | | | | | | |
Mod-Pac Corp.(1)(2) | | | 159,725 | | | | 394,521 | |
| | | | | | | | | |
| Metals & Mining – 5.8% | | | | | | | | |
Amerigo Resources Ltd.(1) | | | 1,682,600 | | | | 829,965 | |
Horsehead Holding Corp.(1) | | | 545,589 | | | | 6,110,596 | |
See Notes to the Financial Statements.
Schedule of Portfolio Investments – (continued)
August 31, 2009
| | | | | | | |
| | | Shares | | | Value | |
| Common Stock – Continued | | | | | | |
| | | | | | | |
| Materials – Continued | | | | | | |
| | | | | | | |
| Metals & Mining – Continued | | | | | | |
Mercator Minerals Ltd.(1) | | | 9,500 | | | $ | 20,740 | |
| Olympic Steel, Inc. | | | 5,000 | | | | 134,650 | |
| Yamana Gold, Inc. | | | 3,289 | | | | 30,259 | |
| | | | | | | | 7,126,210 | |
| Paper & Forest Products – 0.3% | | | | | | | | |
Canfor Corp.(1) | | | 70,100 | | | | 349,620 | |
| Total Materials | | | | | | | 12,234,356 | |
| | | | | | | | | |
| Telecommunication Services – 0.0% | | | | | | | | |
| Diversified Telecommunication Services – 0.0% | | | | | | | | |
Integrated Telecom Express, Inc.(1)(4) | | | 308,300 | | | | 3,083 | |
| | | | | | | | | |
| Total Common Stock | | | | | | | | |
| (Cost $156,890,299) | | | | | | | 118,147,780 | |
| | | | | | | | | |
| Investment Companies – 0.2% | | | | | | | | |
Canfor Pulp Income Fund(3) | | | 77,349 | | | | 289,451 | |
| | | | | | | | | |
| Total Investment Companies | | | | | | | | |
| (Cost $311,382) | | | | | | | 289,451 | |
| | | | | | | | | |
| Short-Term Investments – 4.3% | | | | | | | | |
UMB Bank Money Market Fiduciary, 0.049%(5) | | | 5,284,368 | | | | 5,284,368 | |
| | | | | | | | | |
| Total Short-Term Investments | | | | | | | | |
| (Cost $5,284,368) | | | | | | | 5,284,368 | |
| | | | | | | | | |
| Total Investments – 99.7% | | | | | | | | |
| (Cost $162,486,049) | | | | | | | 123,721,599 | |
| | | | | | | | | |
| Other Assets and Liabilities – 0.3% | | | | | | | 423,910 | |
| Net Assets – 100.0% | | | | | | $ | 124,145,509 | |
| (1) | Non-income producing securities. |
| | | |
| (2) | Affiliated Company – The fund is owner of more than 5% of the outstanding voting securities. See Notes to the Financial Statements for additional information on Investments in Affiliated Companies. |
| | | |
| (3) | Foreign security denominated in U.S. Dollars |
| | | |
| (4) | Company is in liquidation and security is being fair valued according to policies and procedures approved by the Aegis Value Fund board of directors. |
| | | |
| (5) | Variable rate security; the rate shown is the 7-day effective yield as of August 31, 2009. |
See Notes to the Financial Statements.
| | ANNUAL REPORT AUGUST 31, 2009 |
Statement of Assets and Liabilities
August 31, 2009
| | | | | |
| Assets | | | | |
| | | | | |
| Investments in unaffiliated companies/securities at value (cost $114,384,755) | | $ | 92,128,992 | |
| Investments in affiliated companies*/securities at value (cost $48,101,294) | | | 31,592,607 | |
| Total investments in securities at market value (cost $162,486,049) | | | 123,721,599 | |
| Receivable for fund shares sold | | | 48,500 | |
| Receivable for investment securities sold | | | 616,347 | |
| Interest and dividends receivable | | | 72,216 | |
| Prepaid assets | | | 35,899 | |
| Total assets | | | 124,494,561 | |
| | | | | |
| Liabilities | | | | |
| Payable for investment securities purchased | | | 117,803 | |
| Payable for fund shares redeemed | | | 14,898 | |
| Payable to Investment Advisor | | | 119,089 | |
| Other payables | | | 97,262 | |
| Total liabilities | | | 349,052 | |
| | | | | |
| Net assets | | $ | 124,145,509 | |
| | | | | |
| Net assets consist of: | | | | |
| Paid-in capital | | $ | 219,421,768 | |
| Undistributed net investment income | | | 19,840 | |
| Accumulated net realized loss | | | (56,531,649 | ) |
| Net unrealized depreciation | | | (38,764,450 | ) |
| | | | | |
| Net assets | | $ | 124,145,509 | |
| | | | | |
| Capital shares | | | | |
| Authorized (Par value $0.001 per share) | | | 100,000,000 | |
| | | | | |
| Outstanding | | | 13,806,546 | |
| | | | | |
| Net asset value per share | | $ | 8.99 | |
| * | Please refer to Note 6 for additional details. |
See Notes to the Financial Statements.
Statement of Operations
For the Year Ended August 31, 2009
| | | | | |
| Investment Income | | | | |
| Dividends from unaffiliated companies* | | $ | 1,666,142 | |
| Dividends from affiliated companies | | | 94,382 | |
| Interest income | | | 19,961 | |
| Total investment income | | | 1,780,485 | |
| Expenses | | | | |
| Investment advisory fees | | | 1,219,596 | |
| Fund servicing fees | | | 101,633 | |
| Printing and postage fees | | | 52,620 | |
| Transfer agent & custody fees | | | 51,412 | |
| Directors & chief compliance officer fees | | | 33,502 | |
| Registration fees | | | 27,460 | |
| Insurance fees | | | 23,511 | |
| Audit fees | | | 22,000 | |
| Legal fees | | | 13,832 | |
| Miscellaneous fees | | | 7,410 | |
| Gross expenses | | | 1,552,976 | |
| Waiver of fees and reimbursement of expenses | | | (28,090 | ) |
| Net expenses | | | 1,524,886 | |
| | | | | |
| Net investment income | | | 255,599 | |
| | | | | |
| Realized and unrealized gain/loss on investments | | | | |
| Capital gain distributions from other investment companies | | | 495,983 | |
| Net realized loss on investments - unaffiliated companies | | | (53,807,814 | ) |
| Net realized loss on investments - affiliated companies | | | (199,657 | ) |
| Change in unrealized depreciation of investments - unaffiliated companies | | | 3,061,214 | |
| Change in unrealized depreciation of investments - affiliated companies | | | (8,814,575 | ) |
| | | | | |
| Net realized and unrealized loss on investments | | | (59,264,849 | ) |
| | | | | |
| Net decrease in net assets resulting from operations | | | | |
| | | $ | (59,009,250 | ) |
| * | Net of foreign tax withholding of $15,726. |
See Notes to the Financial Statements.
| | ANNUAL REPORT AUGUST 31, 2009 |
Statements of Changes in Net Assets
For the Years Ended August 31st
| | | | | | | | |
| | | 2009 | | 2008 | |
| Decrease in net assets from operations | | | | | | | |
| Net investment income | | $ | 255,599 | | $ | 5,097,184 | |
| Net realized gain/loss from investments | | | (53,511,488 | ) | | 2,906,131 | |
| Change in unrealized depreciation | | | (5,753,361 | ) | | (32,738,535 | ) |
| Net decrease in net assets resulting from operations | | | (59,009,250 | ) | | (24,735,220 | ) |
| | | | | | | | |
| Distributions | | | | | | | |
| Net investment income | | | (5,116,766 | ) | | (2,390,647 | ) |
| Net realized capital gains | | | (2,318,651 | ) | | (16,834,300 | ) |
| Total distributions to shareholders | | | (7,435,417 | ) | | (19,224,947 | ) |
| | | | | | | | |
| Capital share transactions* | | | | | | | |
| Subscriptions | | | 10,170,076 | | | 20,220,648 | |
| Distributions reinvested | | | 7,131,129 | | | 18,417,352 | |
| Redemptions | | | (32,450,107 | ) | | (141,220,659 | ) |
| Total capital share transactions | | | (15,148,902 | ) | | (102,582,659 | ) |
| | | | | | | | |
| Net decrease in net assets | | | (81,593,569 | ) | | (146,542,826 | ) |
| | | | | | | | |
| Net assets at beginning of year | | | 205,739,078 | | | 352,281,904 | |
| | | | | | | | |
| Net assets at end of year | | $ | 124,145,509 | | $ | 205,739,078 | |
| | | | | | | | |
| Undistributed net investment income at end of year | | $ | 19,840 | | $ | 5,090,022 | |
| | | | | | | | |
| *Share information | | | | | | | |
| Subscriptions | | | 1,265,477 | | | 1,531,013 | |
| Distributions reinvested | | | 1,271,146 | | | 1,468,688 | |
| Redemptions | | | (5,196,892 | ) | | (10,770,992 | ) |
| | | | | | | | |
| Net decrease in shares | | | (2,660,269 | ) | | (7,771,291 | ) |
See Notes to the Financial Statements.
Financial Highlights
The table below sets forth financial data for a share outstanding in the Fund throughout each year presented:
| | | | | | | | | | | | | | | | | |
| | | For the Years Ended August 31st |
| | | 2009 | | 2008 | | 2007 | | 2006 | | 2005 | |
| Per share data: | | | | | | | | | | | | | | | | |
| Net asset value – beginning of year | | $ | 12.49 | | $ | 14.53 | | $ | 17.72 | | $ | 18.37 | | $ | 17.56 | |
| | | | | | | | | | | | | | | | | |
| Income from investment operations: | | | | | | | | | | | | | | | | |
| Net investment income | | | 0.05 | | | 0.33 | | | 0.16 | | | 0.19 | | | 0.08 | |
| Net realized and unrealized gains/(losses) on investments | | | (3.05 | ) | | (1.37 | ) | | 2.09 | | | 1.02 | | | 1.60 | |
| Total from investment operations | | | (3.00 | ) | | (1.04 | ) | | 2.25 | | | 1.21 | | | 1.68 | |
| | | | | | | | | | | | | | | | | |
| Less distributions to shareholders from: | | | | | | | | | | | | | | | | |
| Net investment income | | | (0.34 | ) | | (0.12 | ) | | (0.14 | ) | | (0.19 | ) | | 0.00 | |
| Net realized capital gains | | | (0.16 | ) | | (0.88 | ) | | (5.30 | ) | | (1.67 | ) | | (0.87 | ) |
| Total distributions | | | (0.50 | ) | | (1.00 | ) | | (5.44 | ) | | (1.86 | ) | | (0.87 | ) |
| Net asset value – end of year | | $ | 8.99 | | $ | 12.49 | | $ | 14.53 | | $ | 17.72 | | $ | 18.37 | |
| | | | | | | | | | | | | | | | | |
| Total investment return | | | (21.60 | )% | | (7.17 | )% | | 13.61 | % | | 7.27 | % | | 9.70 | % |
| | | | | | | | | | | | | | | | | |
| Ratios (to average net assets)/supplemental data: | | | | | | | | | | | | | | | | |
| Expenses after reimbursement/recapture and fees paid indirectly | | | 1.50 | % | | 1.43 | % | | 1.38 | % | | 1.41 | %(1) | | 1.41 | %(1) |
| Expenses before reimbursement/recapture and fees paid directly | | | 1.53 | % | | 1.43 | % | | 1.38 | % | | 1.42 | % | | 1.41 | % |
| Net investment income | | | 0.25 | % | | 2.10 | % | | 0.83 | % | | 0.83 | % | | 0.39 | % |
| Portfolio turnover | | | 31 | % | | 35 | % | | 56 | % | | 18 | % | | 29 | % |
| | | | | | | | | | | | | | | | | |
| Net assets at end of year (000’s) | | $ | 124,146 | | $ | 205,739 | | $ | 352,282 | | $ | 393,834 | | $ | 675,897 | |
| (1) | Ratio after expense reimbursements/recapture, before fees paid indirectly, is 1.42% in 2006 and 1.42% in 2005. |
See Notes to the Financial Statements.
| | ANNUAL REPORT AUGUST 31, 2009 |
Notes to Financial Statements
August 31, 2009
1. The Organization
Aegis Value Fund, Inc. (the “Fund”) is registered under the Investment Company Act of 1940 as a diversified open-end management company. The Fund was incorporated October 22, 1997 in the State of Maryland and commenced operations May 15, 1998. The Fund’s principal investment goal is to seek long-term capital appreciation by investing primarily in common stocks that are believed to be significantly undervalued relative to the market based on a company’s book value, revenues, or cash flow. Refer to a current Prospectus for additional information about the Fund.
2. Summary of Significant Accounting Policies
Security valuation. Investments in securities traded on a national securities exchange (or reported on the NASDAQ National Market) are stated at the last reported sales price or a market’s official close price on the day of valuation; other securities traded in the over-the-counter market and listed securities for which no sale was reported on that date are stated at the last close price, or the average of bid and ask price for NASDAQ National Market securities. Short-term notes are stated at amortized cost, which is equivalent to value. Restricted securities, securities for which market quotations are not readily available, and securities with market quotations the Advisor does not believe are reflective of market value are valued at fair value as determined by the Advisor under the supervision of the Board of Directors. The valuation assigned to fair valued securities for purposes of calculating the Fund’s net asset value (“NAV”) may differ from the security’s most recent closing market price and from the prices used by other mutual funds to calculate their NAVs.
Statement of Financial Accounting Standards No. 157 “Fair Value Measurements” (“FAS 157”) defines fair value, establishes a framework for measuring fair value in generally accepted accounting principles (GAAP), and expands disclosures about fair value measurements. The Fund adopted FAS 157 as of September 1, 2008. In addition, in April 2009, the Financial Accounting Standards Board (“FASB”) issued Staff Position No. 157-4, “Determining Fair Value When the Volume and Level of Activity for the Asset or Liability Have Significantly Decreased and Identifying Transactions That Are Not Orderly” (“FSP 157-4”). FSP 157-4 provides guidance to estimating fair value when market activity has decreased and on identifying transactions that are not orderly. Additionally, entities are required to disclose the inputs and valuation techniques used to measure fair value. The fund adopted FSP 157-4 as of August 31, 2009. In accordance with FSP 157-4, the fund has included disclosures on fair value measurements in the following paragraph of these financial statements. Under FAS 157, various inputs are used in determining the value of the Fund’s investments. These inputs are summarized into three broad levels and described below:
Notes to Financial Statements – (continued)
August 31, 2009
2. Summary of Significant Accounting Policies – (continued)
| | | |
| | • | Level 1 – quoted prices in active markets for identical securities. An active market for the security is a market in which transactions occur with sufficient frequency and volume to provide pricing information on an ongoing basis. A quoted price in an active market provides the most reliable evidence of fair value. |
| | | |
| | • | Level 2 – other significant observable inputs (including quoted prices for similar securities, interest rates, prepayment speeds, credit risk, etc.) Quoted prices for identical or similar assets in markets that are not active. Inputs that are derived principally from or corroborated by observable market data. An adjustment to any observable input that is significant to the fair value may render the measurement a Level 3 measurement. |
| | | |
| | • | Level 3 – significant unobservable inputs, including the Fund’s own assumptions in determining the fair value of investments. |
The inputs or methodology used for valuing securities are not necessarily an indication of the risk associated with investing in those securities. The following is a summary of the inputs used to value the Fund’s net assets as of August 31, 2009:
| | | | | | | | | | | | | |
| | | Level 1 – Quoted Prices | | | Level 2 – Other Significant Observable Inputs | | | Level 3 – Significant Unobservable Inputs | | | Total | |
| Common Stocks | | | | | | | | | | | | |
| | | | | | | | | | | | | |
| Consumer Discretionary | | $ | 41,120,950 | | | $ | — | | | $ | — | | | $ | 41,120,950 | |
| | | | | | | | | | | | | | | | | |
| Consumer Staples | | | 7,788,776 | | | | — | | | | — | | | | 7,788,776 | |
| | | | | | | | | | | | | | | | | |
| Energy | | | 5,580,744 | | | | — | | | | — | | | | 5,580,744 | |
| | | | | | | | | | | | | | | | | |
| Financials | | | 32,841,355 | | | | 88,490 | | | | — | | | | 32,929,845 | |
| | | | | | | | | | | | | | | | | |
| Industrials | | | 17,247,285 | | | | — | | | | — | | | | 17,247,285 | |
| | | | | | | | | | | | | | | | | |
| Information Technology | | | 1,242,741 | | | | — | | | | — | | | | 1,242,741 | |
| | | | | | | | | | | | | | | | | |
| Materials | | | 12,234,356 | | | | — | | | | — | | | | 12,234,356 | |
| | | | | | | | | | | | | | | | | |
| Telecommunication Services | | | — | | | | — | | | | 3,083 | | | | 3,083 | |
| | | | | | | | | | | | | | | | | |
| Investment Companies | | | 289,451 | | | | — | | | | — | | | | 289,451 | |
| | | | | | | | | | | | | | | | | |
| Short-Term Investments | | | — | | | | 5,284,368 | | | | — | | | | 5,284,368 | |
| | | | | | | | | | | | | | | | | |
| Total | | $ | 118,345,658 | | | $ | 5,372,858 | | | $ | 3,083 | | | $ | 123,721,599 | |
| | ANNUAL REPORT AUGUST 31, 2009 |
Notes to Financial Statements – (continued)
August 31, 2009
2. Summary of Significant Accounting Policies – (continued)
Following is a reconciliation of assets in which significant unobservable inputs (Level 3) were used in determining fair value:
| | | | | |
| | | Investment in Securities | |
| Beginning balance 9/1/08 | | | $ | 1,595,362 | | |
| | | | | | | |
| Realized gain/loss | | | | — | | |
| | | | | | | |
| Changes in unrealized appreciation (depreciation) | | | | — | | |
| | | | | | | |
| Net purchases (sales)* | | | $ | (1,592,279 | ) | |
| | | | | | | |
| Transfers in/out of Level 3 | | | | — | | |
| | | | | | | |
| Ending balance 8/31/09 | | | $ | 3,083 | | |
| * | Fair valuation of MAIR Holdings, Inc., at August 31, 2009 reflects a decrease in market value due to liquidation proceeds which were recognized as return-of-capital, decreasing the position’s cost basis. The simultaneous decrease in fair value and reduction in cost basis as a result of recognizing these liquidation proceeds had no effect on the net assets of the Fund. |
Recent Accounting Pronouncements. In May 2009, Statement of Financial Accounting Standards No. 165 (“SFAS 165”) regarding Subsequent Events was issued and is effective with interim or annual financial periods ending after June 15, 2009. SFAS 165 is intended to introduce the concept of the financial statements being available to be issued as a measurement date for evaluating subsequent events. In preparing these financial statements, management has evaluated events and transactions for potential recognition or disclosure through October 21, 2009, the date which the financial statements were available to be issued. No such events or transactions were noted.
Federal income and excise taxes. The Fund’s policy is to comply with the requirements of Subchapter M of the Internal Revenue Code that are applicable to regulated investment companies and to distribute substantially all investment company taxable income and net capital gain to shareholders in a manner which results in no tax cost to the Fund. Therefore, no federal income tax provision is required.
Distributions to shareholders. Distributions to Fund shareholders, which are determined in accordance with income tax regulations, are recorded on the ex-dividend date. Distributions of net investment income, if any, are made at least annually. Net realized gains from investment transactions, if any, will be distributed to shareholders at least annually. The character of distributions made during the year from net investment income or net realized gain may differ from the characterization for federal income tax purposes due to differences in the recognition of income, expense, and gain/(loss) items for financial statement and tax purposes. Where appropriate, reclassifications between net asset accounts are made for such differences that are permanent in nature.
Notes to Financial Statements – (continued)
August 31, 2009
2. Summary of Significant Accounting Policies – (continued)
Use of estimates. The preparation of financial statements in conformity with accounting principles generally accepted in the United States of America requires management to make estimates and assumptions that affect the reported amounts of assets and liabilities and disclosure of contingent assets and liabilities at the date of the financial statements and the reported amounts of revenues and expenses during the period. Actual results could differ from those estimates.
Other. The Fund records security transactions based on the trade date. Gains and losses on security transactions are determined on a specific identification basis. Dividend income is recognized on the ex-dividend date, and interest income is recognized on the accrual basis and includes accretion of discounts and amortization of premiums. Withholding taxes on foreign dividends have been provided for in accordance with the Fund’s understanding of the applicable country’s tax rules and rates.
The fund does not isolate that portion of the results of operations resulting from changes in foreign exchange rates on investments from the fluctuations arising from changes in market prices of securities held. Such fluctuations are included with the net realized and unrealized gain or loss from investments.
In the normal course of business, the Fund enters into contracts that contain a variety of representations, which provide general indemnifications. The Fund’s maximum exposure under these arrangements is unknown as this would involve future claims that may be made against the Fund that have not yet occurred. However, based on experience, the Fund expects the risk of loss to be remote.
3. Advisory Fees and Other Transactions with Affiliates
The Fund entered into an investment management and advisory services agreement (the “Agreement”) with Aegis Financial Corporation, (the “Advisor”) that provides for fees to be computed at an annual rate of 1.20% of the Fund’s average daily net assets. The Agreement provides for an expense reimbursement from the Advisor if the Fund’s expenses, exclusive of taxes, interest, fees incurred in acquiring or disposing of portfolio securities, and extraordinary expenses, exceed 1.50% of the Fund’s average daily net assets. The Agreement shall remain in force through December 31, 2009. Either party may terminate the Agreement anytime upon sixty (60) days written notice to the other party. During the year ended August 31, 2009, the Advisor reimbursed the Fund $28,090.
As part of the expense limitation agreement, the Fund has agreed to repay the Advisor for amounts waived or reimbursed by the Advisor provided that such repayment does not cause the Fund’s expenses, exclusive of taxes, interest, fees incurred in acquiring or disposing of portfolio securities, and extraordinary expenses, to exceed 1.50% and the repayment is made within three years after the year in which the Advisor incurred the
| | ANNUAL REPORT AUGUST 31, 2009 |
Notes to Financial Statements – (continued)
August 31, 2009
3. Advisory Fees and Other Transactions with Affiliates – (continued)
expense. As of August 31, 2009, there was $28,090 of fees available to be recovered no later than August 31, 2012.
Certain officers and directors of the Fund are also officers and directors of the Advisor. The Fund pays each director not affiliated with the Advisor fees in cash or Fund shares of $1,000 for each attended board meeting and $500 for each attended committee meeting.
4. Investment Transactions
Purchases and sales of long-term investment securities (excluding short-term investments) were $32,710,193 and $53,394,806, respectively, for the year ended August 31, 2009.
5. Distributions to Shareholders and Tax Components of Net Assets
At August 31, 2009, gross unrealized appreciation and depreciation of investments, based on cost for federal income tax purposes were as follows:
| | | | | |
| Cost of investments | | $ | 162,695,605 | |
| | | | | |
| Gross unrealized appreciation | | $ | 22,041,935 | |
| | | | | |
| Gross unrealized depreciation | | | (61,015,941 | ) |
| | | | | |
| Net unrealized depreciation | | $ | (38,974,006 | ) |
The difference between cost amounts for financial statement and federal income tax purposes is due primarily to timing differences in recognizing certain gains and losses in security transactions.
The tax character of distributions paid during the tax years ended August 31, 2009 and 2008 were as follows:
| | | | | | | |
| | | 2009 | | | 2008 | |
| | | | | | | |
| Distribution paid from: | | | | | | |
| | | | | | | |
| Ordinary income | | $ | 7,435,417 | | | $ | 10,558,373 | |
| | | | | | | | | |
| Long-term capital gains | | | — | | | | 8,666,574 | |
| Total distributions | | $ | 7,435,417 | | | $ | 19,224,947 | |
At August 31, 2009, the fund had net realized capital losses from transactions between November 1, 2008 and August 31, 2009 of $55,481,549 which for tax purposes are deferred and will be recognized in fiscal year 2010.
As of August 31, 2009, the Fund had a capital loss carryover of $840,544, which expires on August 31, 2017. To the extent that the Fund realizes future net capital gains, those gains will be offset by any unused capital loss carryforwards.
Notes to Financial Statements – (continued)
August 31, 2009
5. Distributions to Shareholders and Tax Components of Net Assets – (continued)
For the tax year ended August 31, 2009, the components of accumulated earnings (deficit) on a tax basis were as follows:
| | | | | | |
| | Undistributed ordinary income | | $ | 19,840 | |
| | Undistributed long-term gains | | | — | |
| | | | | | |
| | Tax accumulated earnings | | | 19,840 | |
| | Accumulated capital and other losses | | | (56,322,093 | ) |
| | Unrealized depreciation on investments | | | (38,974,006 | ) |
| | | | | | |
| | Total accumulated earnings (deficit) | | $ | (95,276,259 | ) |
Primarily as a result of an analysis of the distributions from Real Estate Investment Trusts (“REIT”) on August 31, 2009, accumulated net realized loss was decreased by $239,080, undistributed net investment income was decreased by $209,015, and additional paid-in capital was decreased by $30,065. This reclassification had no effect on the net assets of the Fund.
Effective February 29, 2008, the Fund adopted FASB Interpretation No. 48 (“FIN 48”) “Accounting for Uncertainty in Income Taxes”, a clarification of FASB Statement No. 109, “Accounting for Income Taxes”. FIN 48 establishes financial accounting and disclosure requirements for recognition and measurement of tax positions taken or expected to be taken on an income tax return. The adoption of FIN 48 had no impact on the Fund’s net assets or results of operations.
As of August 31, 2009, there are no uncertain tax positions that would require financial statement recognition, de-recognition, or disclosure. The Fund’s Federal tax returns filed in the three-year period ended August 31, 2009, remain subject to examination by the Internal Revenue Service.
6. Investments in Affiliated Companies
An affiliated company is a company in which the Fund has ownership of at least 5% of the voting securities. Companies which are affiliates of the Fund at year-end are noted in the Fund’s schedule of portfolio investments. Transactions during the period with companies which are or were affiliates are as follows:
| | ANNUAL REPORT AUGUST 31, 2009 |
Notes to Financial Statements – (continued)
August 31, 2009
6. Investments in Affiliated Companies – (continued)
| | | | | | | | | | | | | | | | | | | | | | | |
| | | Value Beginning of Period | | Purchases | | Sales Proceeds | | Realized Gain/Loss | | Unrealized Appreciation/ Depreciation | | Dividends Credited to Income | | Value End of Period | |
| Allied Defense Group, Inc. | | $ | 5,735,122 | | $ | 134,560 | | $ | 442,968 | | $ | (143,145 | ) | $ | (2,775,457 | ) | $ | — | | $ | 3,589,546 | |
| American Pacific Corp. | | | 9,624,086 | | | — | | | 176,286 | | | (41,218 | ) | | (57,508 | ) | | — | | | 4,364,005 | |
| B of I Holding, Inc. | | | 1,938,251 | | | 489,946 | | | — | | | — | | | 490,886 | | | — | | | 3,197,055 | |
| Bassett Furniture Industries, Inc. | | | 9,702,449 | | | 120,894 | | | 87,204 | | | (196,051 | ) | | (6,613,836 | ) | | 94,382 | | | 5,281,279 | |
| Coachmen Industries, Inc. | | | 1,097,758 | | | 317,661 | | | — | | | — | | | (3,595,208 | ) | | — | | | 977,540 | |
| Delta Apparel, Inc. | | | 2,994,380 | | | 363,119 | | | — | | | — | | | 1,318,493 | | | — | | | 4,576,461 | |
| Duckwall-ALCO Stores, Inc. | | | 2,359,428 | | | 696,821 | | | 305,532 | | | 182,114 | | | 1,763,933 | | | — | | | 3,887,077 | |
| Handleman Co.* | | | 2,666,295 | | | — | | | 1,890 | | | — | | | (1,977,958 | ) | | — | | | 1,546 | |
| Horsehead Holding Corp.* | | | 9,720,954 | | | 4,217,359 | | | 8,195,983 | | | — | | | 2,864,537 | | | — | | | 6,110,596 | |
| MAIR Holdings, Inc. | | | 1,592,279 | | | — | | | — | | | — | | | (4,540,578 | ) | | — | | | — | |
| Mod-Pac Corp. | | | 658,067 | | | — | | | — | | | — | | | (1,278,897 | ) | | — | | | 394,521 | |
| Specialty Underwriters’ Alliance, Inc.* | | | 4,795,676 | | | 221,434 | | | 3,076,304 | | | — | | | 213,074 | | | — | | | 3,410,462 | |
| Tecumseh Products Co., Class A** | | | 2,571,706 | | | 89,481 | | | 114,555 | | | (1,357 | ) | | (112,048 | ) | | — | | | 917,905 | |
| Tecumseh Products Co., Class B | | | 10,013,167 | | | — | | | — | | | — | | | (1,108,467 | ) | | — | | | 4,407,218 | |
| Total | | $ | 65,469,618 | | $ | 6,651,275 | | $ | 12,400,722 | | $ | (199,657 | ) | $ | (15,409,034 | ) | $ | 94,382 | | $ | 41,115,211 | |
| * | No longer affiliated as of August 31, 2009. |
| | |
| ** | Class A shares of Tecumseh Products Co. did not reflect affiliated status as of August 31, 2008 or August 31, 2009. Holdings in Class B shares represent more than 5% of the outstanding shares of that class, and more than 5% of the voting control of the company, therefore Tecumseh Products Co. remains an affiliated company of Aegis Value Fund. |
REPORT OF INDEPENDENT REGISTERED PUBLIC ACCOUNTING FIRM
To the Shareholders and Board of Directors
Aegis Value Fund, Inc.
We have audited the accompanying statement of assets and liabilities of Aegis Value Fund, Inc., including the schedule of portfolio investments, as of August 31, 2009, and the related statement of operations for the year then ended, the statements of changes in net assets for each of the two years in the period then ended, and the financial highlights for each of the five years in the period then ended. These financial statements and financial highlights are the responsibility of the Fund’s management. Our responsibility is to express an opinion on these financial statements and financial highlights based on our audits.
We conducted our audits in accordance with the standards of the Public Company Accounting Oversight Board (United States). Those standards require that we plan and perform the audits to obtain reasonable assurance about whether the financial statements and financial highlights are free of material misstatement. An audit includes examining, on a test basis, evidence supporting the amounts and disclosures in the financial statements. Our procedures included confirmation of securities owned as of August 31, 2009 by correspondence with the custodian and brokers. An audit also includes assessing the accounting principles used and significant estimates made by management, as well as evaluating the overall financial statement presentation. We believe that our audits provide a reasonable basis for our opinion.
In our opinion, the financial statements and financial highlights referred to above present fairly, in all material respects, the financial position of Aegis Value Fund, Inc. as of August 31, 2009, the results of its operations for the year then ended, the changes in its net assets for each of the two years in the period then ended, and its financial highlights for each of the five years in the period then ended, in conformity with accounting principles generally accepted in the United States of America.

BRIGGS, BUNTING & DOUGHERTY, LLP
Philadelphia, Pennsylvania
October 21, 2009
| | ANNUAL REPORT AUGUST 31, 2009 |
Directors and Officers
(Unaudited)
| | | | | |
| Name, Age, and Address | | Position | | Business Experience and Directorship During the Past 5 Years |
Scott L. Barbee* (38) 1100 North Glebe Road Suite 1040 Arlington, Virginia 22201 | | President, Director | | Treasurer and Managing Director of Aegis Financial Corporation since 1997; Secretary of Aegis Financial Corporation since 2007; Treasurer and Trustee of the Aegis Funds since 2003; Treasurer and Director of the Fund since 1997; Secretary of each Fund since 2006; President of Aegis Financial Corporation, the Aegis Funds, and the Fund since 2009. |
| | | | | |
David A. Giannini (56) 30 Rockefeller Plaza Suite 4250 New York, NY 10112 | | Director | | Institutional equity sales and research with Scarsdale Equities since 2006; Institutional equity sales and research with Sanders Morris Harris, 1997-2006; Trustee of the Aegis Funds since 2006; Director of the Fund since 2006. |
| | | | | |
Eskander Matta (39) Blue Shield of California 50 Beale Street San Francisco, California 94105 | | Director | | VP of eBusiness, Blue Shield of California since 2008; Senior VP of Enterprise Internet Services, Wells Fargo & Co. since 2002; Director of Strategic Consulting with Cordiant Communications, 2001-2002; Trustee of the Aegis Funds since 2003; Director of the Fund since 1997. |
| | | | | |
V. Scott Soler (40) Quantum Energy Partners 1401 McKinney Street Suite 2700 Houston, Texas 77010 | | Director | | Managing Director of Quantum Energy Partners since 2006; Research Analyst and Managing Director of Morgan Stanley 1996-2006; Trustee of the Aegis Funds since 2007; Director of the Fund since 2007. |
| * | Indicates persons who are affiliated with Aegis Financial Corporation, the Fund’s investment advisor, and are therefore considered to be “interested persons” under the Investment Company Act of 1940, Section (2)(a). |
The Fund’s Statement of Additional Information includes additional information about Fund directors and is available, without charge, by calling the Fund’s toll-fee phone number, (800) 528-3780.
Other Information
(Unaudited)
Shareholder Tax Information:
For the year ended August 31, 2009, 100% of dividends paid from net investment income including short-term capital gains, qualifies for the dividends received deduction available to corporate shareholders of the Fund.
For the year ended August 31, 2009, 100% of dividends paid from net investment income, including short-term capital gains from the Fund are designated as qualified dividend income.
Fund Holdings:
The complete schedules of Fund holdings for the second and fourth quarters of each fiscal year are contained in the Fund’s semi-annual and annual shareholder reports, respectively. The Fund files complete schedules of Fund holdings with the SEC for the first and third quarters of each fiscal year on Form N-Q within 60 days after the end of the period. Copies of the Fund’s Form N-Q are available without charge, upon request, by contacting the Fund at 1-800-528-3780 and on the SEC’s website at http://www.sec.gov. You may also review and copy Form N-Q at the SEC’s Public Reference Room in Washington, D.C. For more information about the operation of the Public Reference Room, please call the SEC at 1-800-SEC-0330.
Code of Ethics:
The Fund has adopted a code of ethics applicable to its principal executive officer and principal financial officer. A copy of this code is available without charge, by calling the Fund at 800-528-3780.
Proxy Voting:
A description of the policies and procedures that the Fund uses to determine how to vote proxies relating to portfolio securities is available without charge, by calling the Fund at 800-528-3780. Information regarding how the Fund voted proxies, if any, relating to portfolio securities during the most recent 12-month period ended June 30, 2009 is available upon request, without charge, by calling 800-528-3780. The Fund’s proxy voting policies and procedures and voting record are also available on the Commission’s website at http://www.sec.gov.
| | | |
| | | |
| | | |
| |
| |
|
| |
c/o UMB Fund Services, Inc. P.O. Box 2175 Milwaukee, Wisconsin 53201-2175 Phone: (800) 528-3780 www.aegisvaluefund.com |
| |
| Board of Directors |
Scott L. Barbee David A. Giannini Eskander Matta V. Scott Soler |
| |
| Officers |
Scott L. Barbee, President Sarah Q. Zhang, Treasurer/Secretary/ Chief Compliance Officer |
| |
| Investment Advisor |
Aegis Financial Corporation 1100 North Glebe Road, Suite 1040 Arlington, Virginia 22201 |
| |
| Custodian |
UMB Bank, n.a. 928 Grand Boulevard Kansas City, Missouri 64106 |
| |
Independent Registered Public Accounting Firm |
| Briggs, Bunting & Dougherty, LLP |
1835 Market Street, 26th Floor Philadelphia, Pennsylvania 19103 |
| |
| Counsel |
Seward & Kissel, LLP 1200 G Street, N.W., Suite 350 Washington, D.C. 20005 |
| |
| | | |
| | | |
| | | |
| | | |
Item 2. Code of Ethics
(a) The Registrant, as of the end of the period covered by this report, has adopted a code of ethics that applies to the Registrant's principal executive officer, principal financial officer, principal accounting officer or controller, or persons performing similar functions, regardless of whether these individuals are employed by the Registrant or a third party. A copy of the code is attached.
(b) There have been no amendments, during the period covered by this report, to a provision of the code of ethics that applies to the Registrants principal executive officer, principal financial officer, principal accounting officer or controller, or persons performing similar functions, regardless of whether these individuals are employed by the Registrant or a third party, and that relates to any element of the code of ethics description.
(c) The Registrant has not granted any waivers, including an implicit waiver, from a provision of the code of ethics that applies to the Registrants principal executive officer, principal financial officer, principal accounting officer or controller, or persons performing similar functions, regardless of whether these individuals are employed by the Registrant or a third party, that relates to one or more of the items set forth in paragraph (b) of this item's instructions.
Item 3. Audit Committee Financial Expert
(a)(1) The Registrant’s board of directors has determined that the Registrant does not have an audit committee financial expert serving on its audit committee.
(a)(2) Not applicable.
(a)(3) The Registrant’s board of directors has determined that an audit committee financial expert is unnecessary at this time. The Registrants Audit Committee has determined that it will retain
the services of an independent expert when and if such need arises.
Item 4. Principal Accountant Fees and Services
(a) AUDIT FEES: The aggregate fees billed for each of the last two fiscal years for professional services rendered by the principal accountant for the audit of the registrant annual financial statements or services that are normally provided by the accountant in connection with statutory and regulatory filings or engagements for those fiscal years are $20,000 in 2009 and $20,000 in 2008.
(b) AUDIT-RELATED FEES: The aggregate fees billed in each of the last two fiscal years for assurance and related services by the principal accountant that are reasonably related to the performance of the audit of the registrant financial statements and are not reported under paragraph (a) of this Item are NONE.
(c) TAX FEES: The aggregate fees billed in each of the last two fiscal years for professional services rendered by the principal accountant for tax compliance, tax advice, and tax planning are $2,000 in 2009 and $2,000 in 2008.
Tax Fees represent tax compliance services and tax consultation provided in connection with the preparation of the Registrants federal income tax and excise tax returns and compliance with IRS regulations.
(d) ALL OTHER FEES: The aggregate fees billed in each of the last two fiscal years for products and services provided by the principal accountant, other than the services reported in paragraphs (a) through (c) of this Item are NONE in 2009 and NONE in 2008.
(e)(1) Disclose the audit committee pre-approval policies and procedures described in paragraph (c)(7) of Rule 2-01 of Regulation S-X.
Audit Committee Pre-Approval Policy. The Audit Committee’s policies and procedures require the pre-approval of all audit and non-audit services provided to the Registrant by the independent registered public accounting firm. The Audit Committee’s policies and procedures also require pre-approval of all audit and non-audit services provided to the Registrant’s investment adviser and any entity affiliated with the adviser to the extent that these services are directly related to the operations or financial reporting of the Registrant. All services described in this Item 4 performed during 2008 and 2009 were pre-approved by the Audit Committee.
(e)(2) The percentage of services described in each of paragraphs (b) through (d) of this Item that were approved by the audit committee pursuant to paragraph (c)(7)(i)(C) of Rule 2-01 of Regulation S-X are as follows:
(b) Not applicable
(c) 100%
(d) Not applicable
(f) The percentage of hours expended on the principal accountant s engagement to audit the registrant s financial statements for the most recent fiscal year that were attributed to work performed by persons other than the principal accountant s full-time, permanent employees was NONE.
(g) The aggregate non-audit fees billed by the registrant s accountant for services rendered to the registrant, and rendered to the registrant s investment adviser (not including any sub-adviser whose role is primarily portfolio management and is subcontracted with or overseen by another investment adviser), and any entity controlling, controlled by, or under common control with the adviser that provides ongoing services to the registrant for each of the last two fiscal years of the registrant was NONE in 2009 and NONE in 2008.
(h) The registrant s audit committee of the board of directors has considered whether the provision of non-audit services that were rendered to the registrant s investment adviser (not including any sub-adviser whose role is primarily portfolio management and is subcontracted with or overseen by another investment adviser), and any entity controlling, controlled by, or under common control with the investment adviser that provides
ongoing services to the registrant that were not pre-approved pursuant to paragraph (c)(7)(ii) of Rule 2-01 of Regulation S-X is compatible with maintaining the principal accountant s independence.
Item 5. Audit Committee of Listed Registrants
Not applicable.
Item 6. Schedule of Investments
The schedule of investments in securities of unaffiliated issuers is included as part of the report to shareholders filed under Item 1.
Item 7. Disclosure of Proxy Voting Policies and Procedures for Closed-End Management Investment Companies
Not applicable.
Item 8. Portfolio Managers of Closed-End Management Investment Companies
Not applicable.
Item 9. Purchases of Equity Securities by Closed-End Management Investment Company and AffiliatedPurchasers
Not applicable.
Item 10. Submission of Matters to a Vote of Security Holders
Not applicable.
Item 11. Controls and Procedures.
(a) The registrant's principal executive officer and principal financial officer have concluded that the registrant's disclosure controls and procedures (as defined in Rule 30a-3(c) under the Investment Company Act of 1940, as amended) are effective based on their evaluation of these disclosure controls and procedures within 90 days of the filing date of this document.
(b) There were no changes in the registrant's internal controls over financial reporting (as defined in Rule 30a-3(d) under the Investment Company Act of 1940, as amended) that occurred during the last fiscal half-year (the registrant second fiscal half-year in the case of an annual report) that has materially affected, or is reasonably likely to materially affect, the registrant's internal control over financial reporting.
Item 12. Exhibits
(a)(1) Code of Ethics. Incorporated by reference to the Registrant’s Form N_CSR filed November 6, 2008.
(a)(2) Certification for each principal executive and principal financial officer of the registrant as required by Rule 30a-2(a) under the Act (17 CFR 270.30a-2(a)) (Exhibits (a) and (b)).
(a)(3) Any written solicitation to purchase securities under Rule 23c-1 under the Investment Company Act of 1940, as amended, that was sent or given during the period covered by the report by or on behalf of the registrant to 10 or more persons.
Not applicable.
(b) Certifications required by Rule 30a-2(b) under the Act (17 CFR 270.30a-2(b)), Rule 13a-14(b) or Rule 15d-14(b) under the Exchange Act (17 CFR 240.13a-14(b) or 240.15d-14(b)), and Section 1350 of Chapter 63 of Title 18 of the United States Code (18 U.S.C. 1350) – Filed as an attachment to this filing (Exhibits (c) and (d)).
SIGNATURES
Pursuant to the requirements of the Securities Exchange Act of 1934 and the Investment Company Act of 1940, the registrant has duly caused this report to be signed on its behalf by the undersigned, thereunto duly authorized.
| Aegis Value Fund, Inc. | |
| | | |
| By: | | |
| | Scott L. Barbee, President | |
| | | |
| Date: | October 30, 2009 | |
Pursuant to the requirements of the Securities Exchange Act of 1934 and the Investment Company Act of 1940, this report has been signed below by the following persons on behalf of the registrant and in the capacities and on the dates indicated.
| By: | | |
| | Scott L. Barbee, President | |
| | | |
| Date: | October 30, 2009 | |
| By: | | |
| | Sarah Q. Zhang, Treasurer | |
| | | |
| Date: | October 30, 2009 | |